
Document 271780
ON-LINE SAMPLE PRETREATMENT O F ENVIRONMENTAL SAMPLES FOR U S E
WITH ATOMIC S P E C T R O M E T R Y
BY
J A M E S R O B E R T MURPHY
A thesis submitted to the University of Plymouth in partial
fulfilment for the d e g r e e of
D O C T O R O F PHILOSOPHY
Department of Environmental Science
Faculty of Science
In collaboration with
B o d e n s e e w e r k Perkin Elmer G m b H
Oberlingen
Germany
M a r c h 1998
m ^ R Y STORE
itcmNe.
Soo 3 6 0 5 1 3
- ^ JUN 1998
Dato
Contl.No.
90 0360513 X
Abstract
"On-line sample pre-treatment of environmental samples for the use
with atomic spectrometry"
James Robert Murphy
T h e objective of this study w a s to d e v e l o p novel techniques for on-line
sample pre-treatment for use with atomic spectroscopy. Preconcentration of the
analytes using either complexation of the analyte(s) o n a n analytical c o l u m n or by
in-situ (in atomiser) trapping o n a pre-coated graphite tube has b e e n u s e d . T h e
s a m p l e s w e r e m a n i p u l a t e d using flow injection analysis a n d detection a c h i e v e d in
most c a s e s by E T A A S . All aspects of the study are s u p p o r t e d by reference to the
literature.
U s i n g the a b o v e a p p r o a c h , a new m e t h o d has b e e n d e v e l o p e d to
d e t e r m i n e m e r c u r y in environmental (sediment) a n d biological (tuna fish) samples.
This a p p r o a c h successfully a c h i e v e d a s a m p l e throughput of 2 0 - 3 0 s a m p l e per
hour, w i t h a m e t h o d detection limit of 0.2 ng g*^ (3a) a n d a precision of less than
1 0 % at the 0.1 \ig g"^ level. A n interference study w a s c o n d u c t e d a n d seven
e l e m e n t s ( A s \ C d " , C u " . Ni", Pb". Sb'' a n d Se"") s h o w n to give less than a 5 %
interference w h e n the interferent concentration w a s 2 orders of m a g n i t u d e greater
than the Hg. Silver s h o w e d a 9 % interference w h e n o n e order of m a g n i t u d e
greater than the Hg.
T h e t e c h n i q u e of "in atomiser trapping" w a s a p p l i e d to the d e t e r m i n a t i o n of
As, Bi, Sb a n d Se, in lake water samples. T h e hydrides w e r e s e q u e s t r a t e d u p o n
a n Ir c o a t e d graphite tube a n d the instrumental a n d chemical p a r a m e t e r s
o p t i m i s e d for multi-element determinations. Iridium has b e e n identified as the
best trapping material (coating) for multi-element determinations. T h e final method
g a v e d e t e c t i o n limits of 0.82, 0.04, 0,26 a n d 0.29 |ig 1'^ ( 5 0 0 |il s a m p l e loop) for
As, Bi, Sb a n d Se respectively. A characteristic mass of 177 pg for A s , 91 pg for
Bi, 107 pg for Sb a n d 9 0 pg for Se w a s a c h i e v e d . G o o d a g r e e m e n t w a s o b t a i n e d
with certified a n d standard reference materials a n d the m e t h o d w a s successfully
a p p l i e d to the determination of As, Bi, Sb a n d Se in lake water samples.
Six e l e m e n t s (Cd, C u , Fe, M n , Ni a n d Pb) w e r e selected for determination
in s e a w a t e r s a m p l e s by multi-element on-line c o l u m n preconcentration.
The
sample s t r e a m w a s mixed on-line with a buffered solution of d i e t h y l a m m o n i u m
d i t h i o c a r b a m a t e ( D D D C ) . a n d the m e t a l - D D C c o m p l e x retained u p o n a Cie RP
silica c o l u m n . Ethanol was then u s e d to elute the metals f r o m the c o l u m n directly
into the graphite tube. Disappointing results, w e r e o b t a i n e d due to interference
problems, a n d a l t h o u g h more w o r k is required before this a p p r o a c h may be
routinely u s e d , it is s h o w n to have potential for the future.
Overall, this study has s h o w n that novel methods e m p l o y i n g flow injection
m e t h o d o l o g i e s for separation a n d preconcentration are a viable w a y to prepare
e n v i r o n m e n t a l s a m p l e for analysis by E T A A S . Further it has d e m o n s t r a t e d that
multi-element analysis is possible for low levels of analyte despite the p r e s e n c e of
t r o u b l e s o m e matrices, although further w o r k is required to achieve the ultimate
goal of a universal m e t h o d suitable for all analytes irrespective of the sample
type.
Section
Contents
Page
Copyright Statement
Title Page
Abstract
List of Contents
IV
List of T a b l e s
XI
List of Figures
XV
Acknowledgements
XIX
A u t h o r s Declaration
XX
Chapter One
1.1 A n a l y s i s of e n v i r o n m e n t a l s a m p l e s
2
1.1.1 T r a c e a n d ultra trace element determination
1.2 S a m p l e pretreatment of environmental samples
1.2.1 S a m p l e pretreatment for solid s a m p l e s
3
4
5
1.2.1.1 W e t d e c o m p o s i t i o n for solid samples
6
1.2.1.2 M i c r o w a v e assisted digestion for solid samples
7
1.2.1.3 Dry ashing for solid s a m p l e s
8
1.2.1.4 C l o s e d system c o m b u s t i o n for solid s a m p l e s
8
1.2.1.5 Fusion for solid s a m p l e s
9
1.2.2 S a m p l e pretreatment t e c h n i q u e s for liquid s a m p l e s
9
1.2.2.1 Solvent extraction for liquid s a m p l e s
11
1.2.2.2 Ion e x c h a n g e t e c h n i q u e s for liquid s a m p l e s
14
1.2.2.3 Evaporation of solvent f r o m liquid s a m p l e s
15
1.2.2.4 R e m o v a l of volatile e l e m e n t s f r o m liquid samples
16
1.2.2.5 Precipitation of trace metals f r o m liquid samples
17
1.3 On-line versus Off-line sample pretreatment t e c h n i q u e s
17
1.3.1 Off-line (Batch) sample pretreatment t e c h n i q u e s
18
1.3.2 On-line sample pretreatment t e c h n i q u e s
19
IV
1.3.2.1 On-line microwave digestion
21
1.3.2.2 On-line liquid-liquid extractions
22
1.3.2.3 On-line c o l u m n preconcentration t e c h n i q u e s
23
1.3.2.4 On-line co-precipitation t e c h n i q u e s
26
1.3.2.5 On-line vapour g e n e r a t i o n t e c h n i q u e s
27
1.4 C o l d V a p o u r A t o m i c A b s o r p t i o n Spectrometry
29
1.5 Hydride G e n e r a t i o n A t o m i c A b s o r p t i o n Spectrometry
31
1.5.1 In atomiser trapping for hydride forming e l e m e n t s
33
1.6 C o l u m n preconcentration
1.6.1
35
D e v e l o p m e n t of flow injection on-line c o l u m n preconcentration
36
with flame atomic absorption spectrometry detection
1.6.2 D e v e l o p m e n t of flow injection on-line c o l u m n p r e c o n c e n t r a t i o n
37
with electrothermal atomic absorption spectrometry detection
1.6.3 A d v a n t a g e s of F I - E T A A S online preconcentration
38
1.6.3.1 C o u p l i n g of flow injection system with the E T A A S
39
1.6.3.2 S a m p l e introduction
39
1.6.3.3 Matrix removal a n d w a s h i n g p r o c e d u r e s
40
1.6.3.4 Improved detection limits
41
1.6.3.5 Signal m e a s u r e m e n t
41
1.6.3.6 T i m e b a s e d a n d V o l u m e b a s e d s a m p l e loading
42
1.7 A l m s of Study
43
Chapter Two
^5
2.1 Introduction
46
2.2 O v e r v i e w of the theory of atomic spectroscopy
46
2.2.1 Basic principles of atomic spectroscopy
48
2.3 C o m p o n e n t s of a m o d e r n atomic absorption spectrometry instrument
2.3.1
Single
and simultaneous
electrothermal
atomic
absorption
53
54
spectrometers
2.3.2 Light s o u r c e s u s e d in atomic absorption spectrometers
54
2.3.3 A t o m i s a t i o n cell
55
2.3.3.1 Electrothermal atomisers
58
V
2.3.3.2 T H G A versus H G A configurations
62
2.3.4 Optical systems
63
2.3.4.1 Single or d o u b l e b e a m optical layout
63
2.3.4.2 M o n o c h r o m a t o r s
64
2.3.4.3 Polychromators
65
2.3.5 Detectors
65
2.3.5.1 Photomultiplier tubes
66
2.3.5.2 Diode array detectors
66
2.3.6 D a t a h a n d l i n g a n d electronics
67
2.3.7 B a c k g r o u n d correction methods
67
2.3.7.1 C o n t i n u u m (Deuterium) b a c k g r o u n d correction
68
2.2.7.2 Smith-Hieftje b a c k g r o u n d correction
68
2.2.7.3 Z e e m a n Effect b a c k g r o u n d correction
69
2.4 S a m p l e manipulation using the a u t o m a t e d flow injection system
72
2.4.1 Flow injection analysis system
73
2.4.1.1 Furnace-flow injection system c o u p l i n g
74
2.4.2 Configuration of flow injection system a n d E T A A S for m e r c u r y
76
determination
2.4.2.1 Operating procedure for mercury determination
77
2.4.3 Configuration of flow injection system a n d E T A A S for multi-
79
element determinations
2.4.3.1 In atomiser t r a p p i n g determinations of hydride f o r m i n g
79
elements
2.4.3.2
Operating
procedure
for
multi-element
hydride
81
generation
2.4.3.3 Multi-element on-line c o l u m n p r e c o n c e n t r a t i o n
2.4.3.4
Operating
procedure
for
on-line
82
column
84
preconcentration
Chapter Three
3.1 Introduction
89
3.1.1 Introduction to the determination of mercury
VI
90
3.1.2 Problems a s s o c i a t e d with the determination of mercury
90
3.1.2.1 Detection limit
91
3.1.2.2 Analytical m e t h o d o l o g y
91
3.1.2.3 Digestion t e c h n i q u e s a n d mixtures
93
3.1.3 Experimental A l m s
95
3.2 Instrumentation
95
3.2.1 F u r n a c e a n d flow injection system configuration
95
3.2.2 M i c r o w a v e instrumentation
97
3.2.3 Quartz cell
98
3.2.4 A t o m i c f l u o r e s c e n c e instrumentation
98
3.2.4.1 P r o c e d u r e for the atomic f l u o r e s c e n c e m e a s u r e m e n t
99
3.2.5 R e a g e n t s
100
3.3 Optimising the System
102
3.3.1 Optimisation of flow rates
102
3.3.2 Determination of linearity for mercury by F I - C V A A S
103
3.3.3 A n a l y s i s of Certificated R e f e r e n c e Materials
104
3.3.3.1 First analysis of Certified R e f e r e n c e Materials
104
3.3.3.2 C o n c l u s i o n
107
3.3.4 A n a l y s i s of C R M s by standard addition
3.3.4.1 C o n c l u s i o n to standard addition experiments
3.3.5 Further analysis of Certified R e f e r e n c e Materials
108
109
112
3.3.5.1 A n a l y s i s of M E S S - 2 Certified R e f e r e n c e Material
112
3.3.5.2 A n a l y s i s of D O R M - 1 Certified R e f e r e n c e Material
113
3.3.6 Final Evaluation of D O R M - 1 digestion p r o c e d u r e
116
3.3.7 Interference study for mercury determination
117
3.4 A n a l y s i s of e n v i r o n m e n t a l a n d biological s a m p l e s
3.4.1 Analysis of sediment s a m p l e s
119
119
3.4.1.1 Digestion procedure
121
3.4.2 A n a l y s i s of biological samples
123
3.4.2.1 Biological sample pretreatment
3.5 C o n c l u s i o n to mercury investigation
123
124
VII
Chapter Four
4.1 Introduction
127
4.1.1 Multi-element analysis
128
4.1.2 C o n d i t i o n s for hydride formation
129
4.1.2.1 O p t i m u m oxidation states for hydride f o r m i n g elements
4.1.3 A i m s of Study
130
131
4.2 Instrumentation
4.3
^26
132
4.2.1 R e a g e n t s
135
Initial experimental w o r k into determining bismuth a n d selenium by in
138
atomiser trapping
4.3.1 Initial results f r o m Bi a n d Se analysis
138
4.3.2 First p r o b l e m : Se not returning to baseline
139
4.3.3 S e c o n d p r o b l e m : Se a n d Bi memory effect
139
4.3.4 T h i r d P r o b l e m : Irreproducibility of the first value
140
4.3.5 Results for Bi a n d Se analysis
141
4.3.6 C o n c l u s i o n to experiment o n e
142
4.4 Further investigations into "in atomiser" trapping
4.5
143
4.4.1 Introduction
143
4.4.2 Experimental conditions
144
4.4.3 Possible a n d optimum oxidation states
144
4.4.4 Results
145
4.4.4.1 Ideal trapping temperature
145
4.4.4.2 Position a n d length of reaction loop
146
4.4.4.3 Further studies o n S e l e n i u m
148
4.4.5 A r s e n i c a n d A n t i m o n y c o n t a m i n a t i o n
150
4.4.6 C o n c l u s i o n
150
S i m u l t a n e o u s determination of five hydride f o r m i n g elements by in
151
atomiser trapping
4.5.1 Blank contamination problem
152
4.5.2 Evaluation of different r e d u c i n g a g e n t s
155
4.5.3 T e l l u r i u m a n d S e l e n i u m
157
4.5.4 C o m p a r i s o n of Ir a n d Zr trapping materials
158
VIII
4.5.5 L o n g term stability tests
162
4.5.6 Interference studies
168
4.5.7 Results
172
4.5.7.1 A n a l y s i s of Certified a n d S t a n d a r d R e f e r e n c e Materials
172
4.5.7.2 A n a l y s i s of Lake C o n s t a n c e water s a m p l e s
173
4.5.7.3
175
Analytical
Figures
of
Meht
for
the
simultaneous
d e t e r m i n a t i o n of G r o u p A (As, Bi a n d Sb) a n d G r o u p B (Bi a n d
Se) by in atomiser trapping
4.5.8 C o n c l u s i o n
176
Chapter Five
5.1 Introduction
^79
180
5.1.1 On-line c o l u m n preconcentration
181
5.1.2 Experimental Aims
183
5.2 Instrumentation
183
5.2.1 R e a g e n t s
186
5.3 Initial results a n d p r o b l e m s e n c o u n t e r e d d u r i n g analysis
188
5.3.1 S o u r c e s of contamination
189
5.3.2 Multi-element calibration g r a p h s
191
5.3.3 Optimisation of the f u r n a c e parameters
193
5.3.4 Optimisation of the flow injection system p a r a m e t e r s
194
5.3.4.1 Pulsation in the flow injection system t u b i n g
194
5.3.4.2 Minimisation of tube lengths
196
5.3.5 First replicate p r o b l e m
197
5.4 R e c o n f i g u r e d flow injection system
198
5.4.1 C o m p a r i s o n of two different Cie support materials
201
5.4.2
203
A n a l y s i s of Certified R e f e r e n c e Materials N A S S - 1 / N A S S - 4
and CASS-3
5.4.2.1
S u m m a r y of w o r k potential with Certified Reference
205
Materials
5.4.3 Matrix interference experiment
205
5.4.3.1 S u m m a r y of results f r o m matrix experiment
IX
208
5.4.4 Stability of standard solutions
5.4.4.1 S u m m a r y of results o b t a i n e d for stability tests
5.5
Conclusion
Conclusion
211
212
Chapter Seven
7.1
210
210
Chapter Six
6.1
209
References
218
219
Epilogue
235
Abbreviations
236
Meetings attended
238
Lectures a n d A s s o c i a t e c o u r s e s
241
Papers published
242
Number
List of Tables
Page
Chapter One
1.1
E x a m p l e s of functional g r o u p s u s e d with ion e x c h a n g e resin
14
Chapter Two
2.1
Default flow injection system p r o g r a m for mercury determination
77
2.2
Default set up conditions for mercury determination
77
2.3
S e q u e n c e control p r o g r a m for hydride determination
79
2.4
Default f u r n a c e program for the determination of Bi a n d Se
80
2.5
Default flow injection system p r o g r a m for hydride g e n e r a t i o n
80
2.6
S e q u e n c e control program for on-line c o l u m n p r e c o n c e n t r a t i o n
83
2.7
Default
84
furnace
p r o g r a m for
the determination.
The
pyrolysis
t e m p e r a t u r e is determined by C d a n d the atomisation temperature
by Ni.
2.8
Default
flow
injection
system
program
for
on-line
column
84
microwave
94
preconcentration
Chapter Three
3.1
Combination
of
digestion
reagents
used
for
d e c o m p o s i t i o n of environmental a n d biological s a m p l e s
3.2
Instrumental
operating
conditions
for
electrothermal
atomic
96
a b s o r p t i o n spectrometer
3.3
F l o w injection system p r o g r a m for the determination of mercury
96
3.4
O p t i m i s e d p u m p tubing a n d flow rates for the flow injection s y s t e m
97
3.5
Optimised
99
conditions
for
the
hydride
generator
with
atomic
f l u o r e s c e n c e detection
3.6
Linear calibration data over the r a n g e 0-60 ^ g 1'^ for mercury by F l -
XI
103
CVAAS
3.7
Direct calibration results for mercury in N B S 1 6 4 6 a n d D O R M - 1
106
Certified Reference Materials
3.8
W e i g h t loss results for all the Certified Reference Materials
107
3.9
S t a n d a r d additions calibration g r a p h for mercury
108
3.10
S t a n d a r d addition analysis data obtained from N B S 1646 a n d
109
D O R M - 1 Certified R e f e r e n c e Materials
3.11
A c o m p a r i s o n of direct a n d standard addition results w i t h recovery
110
results for the standard additions experiment
3.12
Experimental
results
for
mercury
in
both
sediment
Certified
112
reference
115
Results o b t a i n e d for different microwave irradiation times for the
117
R e f e r e n c e Materials
3.13
Results
obtained
for
mercury
in
DORM-1
certified
material by atomic f l u o r e s c e n c e a n d F I - C V A A S
3.14
d i g e s t i o n of D O R M - 1 certified r e f e r e n c e material
3.15
S u m m a r y of conditions for the c l o s e d vessel m i c r o w a v e digestion
117
p r o c e d u r e of environmental a n d biological s a m p l e s
3.16
Results of interference study o n the determination of mercury by
118
FI-CVAAS
3.17
% W e i g h t loss results for all sediment s a m p l e s
120
3.18
Total mercury concentration in River Mersey sediments
122
3.19
Total mercury concentration in River A v o n s e d i m e n t s
122
3.20
% W e i g h t Loss for tuna fish samples
124
3.21
Total mercury concentration in tuna fish
125
Chapter Four
4.1
Instrumental parameters u s e d for the s i m u l t a n e o u s multi-element
133
electrothermal atomic absorption spectrometer
4.2
O p t i m i s e d T H G A temperature p r o g r a m m e for determining G r o u p A
133
(As, Bl a n d Sb) a n d G r o u p B (Bi a n d Se) hydride f o r m i n g e l e m e n t s
4.3
O p t i m i s e d p r o g r a m m e for d e t e r m i n i n g G r o u p A (As, Bi a n d S b )
a n d G r o u p B (Bi a n d Se) hydride f o r m i n g e l e m e n t s using the f l o w
XII
134
injection manifold with a n Ar gas flow of 150 ml min"^
4.4
Analytical parameters for the hydride forming e l e m e n t s
134
4.5
T h e r m a l pre-treatment p r o g r a m for Ir a n d Zr c o a t e d tubes
137
4.6
Analytical figures of merit for the simultaneous determination of Bi
142
a n d Se
4.7
Analytical figures of merit for the simultaneous d e t e r m i n a t i o n of
147
A s , Bi, H g , Sb a n d Se by in atomiser trapping
4.8
As
and
Sb
contamination
in
three
different
sodium
153
Results f r o m interference study : Level (in m g 1'^) at w h i c h the
170
tetrahydroborate solutions
4.9
interferent p r o d u c e s a deviation of 5 % or more f r o m the 5 n g 1'^
metal s t a n d a r d
4.10
Results for the analysis of H P S Drinking water C R M No 4 9 0 9 1 5
173
a n d S t a n d a r d R e f e r e n c e Material 1646c T r a c e e l e m e n t s in w a t e r
4.11
Lake C o n s t a n c e water analysis results
174
4.12
Analytical Figures of Merit for the simultaneous d e t e r m i n a t i o n of
176
G r o u p A (As, Bi a n d Sb) a n d G r o u p B (Bi a n d Se) by in atomiser
trapping
Chapter Five
5.1
O p t i m i s e d instrumental parameters
5.2
Optimised
THGA
temperature
184
programme
for
on-line
column
184
column
185
preconcentration
5.3
Flow
injection
optimised
program
for
on-line
preconcentration
5.4
T u b i n g a n d flow rates u s e d for flow injection system
5.5
Concentration
range
of w o r k i n g
standards
185
a n d original
stock
188
results s h o w i n g c o n t a m i n a t e d a n d clean ethanol
190
solution concentration of the multi-element standard
5.6
Experimental
(after sub boiling purification)
5.7
Calibration
data
obtained
from
using
multi-element
p r e p a r e d from single element stock solution
XIII
standard
192
5.8
Calibration
data
with
graphite
furnace
atomic
absorption
192
O p t i m i s e d flow injection p r o g r a m for re-configured on-line c o l u m n
200
spectrometry mixed multi-element standard
5.9
p r e c o c n e n t r a t i o n (36 |il eluent loop)
5.10
T u b i n g a n d flow rates u s e d for flow injection analysis system
201
configuration two
5.11
Analytical figures of merit for silica support material
202
5.12
Analytical figures of merit for polymeric support material
202
5.13
C o n c e n t r a t i o n of the five selected e l e m e n t s
in three certified
204
Experimental results for all three reference materials using a silica
204
reference materials, N A S S - 1 a n d -4 a n d C A S S - 3
5.14
support c o l u m n
5.15
Experimental
results for all three reference
materials using a
204
polymeric support c o l u m n
5.16
Stability test o n the low multi-element standard
209
5.17
Stability test on the high multi-element standard
209
XIV
Number
List of Figures
Page
Chapter One
1.1
C o m m o n metal ion chelating complex u s e d in solvent extraction
13
Chapter Two
2.1
Periodic table s h o w i n g elements d e t e r m i n e d by atomic absorption
47
spectrometry
2.2
S u m m a r y of radiative p r o c e s s e s for A E S , A A S a n d A F S
51
2.3
D i a g r a m of the various c o m p o n e n t s for a m o d e r n electrothermal
55
atomic absorption spectrometer ( M o d e l 4 1 0 0 Z L )
2.4
Optical a n d C o m p o n e n t d i a g r a m of a s i m u l t a n e o u s electrothermal
56
atomic absorption spectrometer s h o w i n g the light p a t h from s o u r c e
to detector ( S I M A A 6 0 0 0 )
2.5
A T H G A graphite tube plus contacts a n d s h o w i n g the t e m p e r a t u r e
59
profile of tube during heating
2.6
D i a g r a m of a T H G A graphite tube s h o w i n g integral L'vov platform
59
a n d position of inlet for inert g a s
2.7
D i a g r a m of a H G A ( M a s s m a n n ) graphite tube s h o w i n g integral
61
L'vov platform
2.8
A H G A graphite tube plus contacts a n d s h o w i n g the t e m p e r a t u r e
61
profile of tube d u r i n g heating
2.9
Z e e m a n d i a g r a m s s h o w i n g TI a n d a c o m p o n e n t s for T r a n s v e r s e
70
a n d Longitudinal Z e e m a n A r r a n g e m e n t s
2.10
Background
correction
with
longitudinal
Zeeman
effect
71
A schematic d i a g r a m of the five port valve s h o w i n g the Fill a n d
73
arrangement
2.11
Inject
positions
for
mercury
and
determination
XV
hydride
forming
element
2.12
FIAS 4 0 0 configuration for mercury determination by cold v a p o u r
76
a t o m i c a b s o r p t i o n spectrometry
2.13
Flow
injection
system
configuration
on-line
multi-element
85
preconcetration by electrothermal atomic a b s o r p t i o n spectometry
(Inject)
2.13
Flow
injection
system
configuration
on-line
multi-element
86
preconcetration by electrothermal atomic absorption spectometry
(Fill)
Chapter Three
3.1
Linear calibration r a n g e (0-60 \xg \'^) for mercury by F I - C V A A S
105
3.2
C o m p l e t e r a n g e (0-100 ^ g 1"^) for mercury by F I - C V A A S
105
3.3
Standard
addition
calibration
graph
for
NBS
1646
Certified
111
Certified
111
results f r o m the s e l e n i u m
149
R e f e r e n c e Material
3.4
Standard
addition
calibration
graph
for
DORM-1
R e f e r e n c e Material
Chapter Four
4.1
A g r a p h s h o w i n g the e x p e h m e n t a l
studies. S t a n d a r d O n e 5.0 n g 1'^ of Se'^ a n d S t a n d a r d T w o 5.0 lag
of S e ' " a n d 5 0 nl of KMn04. Blank solution 1 0 % (v/v) HCI
4.2a
S i m u l t a n e o u s atomic peak signals for G r o u p A elements, A s , Bi
159
a n d Sb, at the 5 ^ g 1'^ level, atomisation t e m p e r a t u r e 2200**C.
sample
volume
500
|il
on
a
Zr-coated
tube
with
trapping
t e m p e r a t u r e of 300*^0
4.2b
S i m u l t a n e o u s atomic p e a k signals for G r o u p A elements, As, Bi
159
a n d Sb. at the 5 ^ g 1'^ level, atomisation t e m p e r a t u r e 2200'*C,
sample
volume
500
jil
on
a
Zr-coated
tube
with
trapping
t e m p e r a t u r e of 600**C
4.2c
S i m u l t a n e o u s atomic peak signals for G r o u p A elements, As, Bi
a n d Sb. at the 5 ^ g 1'^ level, atomisation t e m p e r a t u r e 2200**C.
XVI
160
sample
volume
500
\i\ on a Zr-coated
tube
with
trapping
temperature of 800''C
4.2d
Simultaneous atomic peak signals for Group A elements, As, Bi
160
and Sb, at the 5 ^g 1"^ level, atomisation temperature 2200**C,
sample
volume
500
|il
on
a
Ir-coated
tube
with
trapping
temperature of SOO^'C
4.3a
Simultaneous peak signals for Group B elements, Bi and Se at the
5 |ig
161
level, atomisation temperature 2200'*C, sample volume 500
|il on a Zr coated tube trapping temperature 250^*0
4.3b
Simultaneous peak signals for Group B elements, Bi and Se at the
5 |ig
161
level, atomisation temperature 2200**C, sample volume 500
^il on a Ir coaled tube trapping temperature 250*^0
4.4a
Long term stability as indicated by the integrated absorbance and
163
precision (%RSD, n = 10). Concentration for As 5 jag \'\ sample
volume 500 [il, trapping time 60 seconds, trapping temperature
300*'C, atomisation temperature 2200**C
4.4b
Long term stability as indicated by the integrated absorbance and
164
precision (%RSD, n = 10). Concentration for Bi 5 jig \'\ sample
volume 500 |il, trapping time 60 seconds, trapping temperature
300''C, atomisation temperature 2200**C
4.4c
Long term stability as indicated by the integrated absorbance and
precision (%RSD, n = 10). Concentration for Sb 5 jig r\
165
sample
volume 500 |il, trapping time 60 seconds, trapping temperature
300'C. atomisation temperature 2200**C
4.4d
Long term stability as indicated by the integrated absorbance and
166
precision (%RSD, n = 10). Concentration for Bi 5 lag \'\ sample
volume 500 |il, trapping time 60 seconds, trapping temperature
250*'C, atomisation temperature 2200**C
4.4e
Long term stability as indicated by the integrated absorbance and
precision (%RSD, n = 10). Concentration for Se 5 |ig r\
sample
volume 500 |il, trapping time 60 seconds, trapping temperature
250**C, atomisation temperature 2200*'C
XVII
167
Chapter Five
5.1
Periodic table showing elements that can be complexed with
179
diethyldithiocarbamate
5.2
Reconfigured
flow
injection
system
on-line
multi-element
199
preconcentration by electrothermal atomic absorption spectrometry
5.3a
Results from matrix interference experiment for cadmium
206
5.3b
Results from matrix interference experiment for copper
206
5.3c
Results from matrix interference experiment for manganese
207
5.3d
Results from matrix interference experiment for nickel
207
5.3e
Results from matrix interference experiment for lead
208
Chapter Six
6.1
Diagram showing whether various different elements can be or
cannot be analysed together by simultaneous multi-element in
atomiser trapping
XVIII
215
Acknowledgements
First, I would like to thank my two supervisors, Professor Steve. J. Hill and
Dr Phil Jones for accompanying me on the roller coaster ride, through all the ups
and downs for the last three years.
I would also like to thank my industrial sponsors Bodenseewerk PerkinElmer GmbH, Uberlingen, Germany for their collaboration and support of my PhD
work.
I would also like to thank, my industrial supervisor Dr Ian. L. Shuttler, and
his family Judith and Julian for looking after me while I was over "holidaying" on
the Bodensee, and feeding me all those puddings. Thanks also to Michaela for
her help and Frank for his hindrance, and everybody else at Perkin-Elmer for
making my six months very enjoyable.
Last, but not least, everybody at the University of Plymouth for putting up
with me during my time in Plymouth.
And a special thanks to my parents for providing all the right things to say
when I most needed them.
XIX
Authors Declaration
At no time during the registration for the degree of Doctor of Philosophy has the
author been registered for any other university award.
This study was financed by the University of Plymouth and carried out in
collaboration with Bodenseewerk Perkin-Elmer GmbH, Uberlingen, Germany.
Relevant scientific seminars and conferences were regularly attended at which
work was often presented; external institutions were visited for consultation
purposes and several papers prepared for publication.
Signed
Date
.... J . . . . ! V ! ^ / - M | y V ^
^.^.^...'^^..^'^.^.S
XX
Chapter One : Introduction
Chapter One : Introduction
1.1 Analysis of environmental samples
Environmental science is concerned with chemical, physical and biological
changes in the environment and the effect of these changes as perceived by man.
Air, water, soil, food and waste are all affected by anthropogenic factors often as
a result of human activities. Many of these processes are essentially chemical in
nature and thus can be monitored to assess the environmental quality. Analytical
methods provide the basis for detailed study.^
It is the development of such
analytical methods that is the basis of this thesis.
The environmental sample to be analysed can be in one of three forms :gas, solid or liquid and include a multitude of matrices.
The possible matrices
include atmospheric aerosols and particulate matter, geological samples (e.g.
soils, rocks), biological samples (e.g. blood, tissue and plant foliage) and marine
samples (e.g. seawaters and sediments) all of which need different sample
preparation and pretreatment
methods.
There are 90 naturally
occurring
elements (66 being metals or metalloids) on the earth and the chemical form
(speciation) of which can vary widely between samples.^
All trace elements occur to a varying extent within all components of the
environment. The term pollution of the environment is often used to refer to an
increase of trace elements relative to the natural levels.
This is generally
associated with human activities, in particular industrial and agricultural practices
which result in widespread trace element contamination.^
1.1.1 Trace and ultra trace element determination
The determination of trace elements is necessitated by their importance in
the chemical industries and in the environment. While the specific needs of the
various areas may all be different, they all have in common the requirement to
quantify the presence of trace elements. Therefore the measurement of elements
(metals and metalloids) over a range of concentrations from percentage levels
through to trace (parts per million) and ultra-trace (parts per billion and below)
require the techniques that compromise atomic spectroscopy.^
There is some confusion when trying to define exactly what is regarded as
trace and ultra trace elements.
Howard and Statham,'* concluded that trying to
define in terms of concentration was doomed to failure and stated
"Trace Analysis
: An analytical procedure
requiring
special steps to be
taken because of the low concentration of the analyte which is present."
Vandecasteele
and
Block,^
define
trace
element
analysis
as
the
determination of concentrations below 100 ^ g g"^ and ultra trace analysis as the
determination of concentrations below 10 ng g \ while Fifield and Kealey,® define
the constituents of a sample as stated below :
Major
> 10%
Trace
1-100 ppm
Minor
0.01-10%
Ultra trace
<1 ppm
For this study, the Fifield and Kealey definition will be used. Quite often
the analyte or element of interest is present in the sample at a level which is
3
below or close to the limit of detection of the instrument being used.
In this
situation, unless an alternative more sensitive technique can be used, there is a
requirement to preconcentrate the analyte. This situation is most likely to occur
for aqueous based samples. In the case of solid samples, it may be possible to
digest more sample. Various approaches to trace element preconcentration are
available, and in addition to preconcentration, it may be necessary to carry out a
separation process to remove an interference or to distinguish between the
different chemical forms of an element e.g. oxidation states.^
1.2 Sample pretreatment of environmental samples
Sample preparation is probably the single most neglected area in analytical
chemistry. While the level of sophistication of the instrumentation for analysis has
increased significantly, a comparatively low technical base for sample pretreatment often remains.®
Although great progress has been made in the
development of highly selective and sensitive analytical methods, the analytical
chemist is increasingly called upon to deal with complex samples. Also lower and
lower detection limits are often required.
Preconcentration or separation steps
may therefore still be necessary even in combination with highly selective and
sensitive methods.
If It were possible to identify or quantitatively determine any element or
compound by simple measurement, no matter what its concentration or complexity
of the matrix, then sample pretreatment techniques would not be needed.^
However, as this "ideal" situation does not exist, usually because other sample
constituents hinder the measurement of the analyte, real world solutions are
required.
4
Since real environmental samples cover the whole range from relatively
simple matrixes e.g. determining alkali and alkaline earth metals in drinking water
to complex matrices e.g. determining rare earth elements in geological rock
samples, there must also be a range of sample pretreatment methods to assist the
analytical chemist.
It is normal in atomic spectrometry for the sample to found in one of two
forms i.e. solid or liquid. The latter case, would seem to be the easiest form in
which to handle the sample. However, the need to carry out the determinations at
lower and lower levels means that invariably some form of preconcentration is
required.
On the other hand, if the sample is in the solid form, the normal
requirement
is to convert
the solid material
(biological, environmental
or
geological) into solution. Conversion of a solid matrix into a liquid matrix involves
the decomposition and dissolution of the sample.
The major problem with
preparing samples for trace metal analysis is the risk of contamination.^
Where a homogenous sample already exists, it may be subdivided without
further treatment. With many solids such as ores, however, crushing and mixing
are usually a prior requirement before analysis.
In addition, the sample often
needs further preparation for analysis, such as drying, ignition and dissolution®
before the decomposition step.
1.2.1 Sample pretreatment for solid samples
Decomposition of solid samples is an important part of sample pretreatment
for atomic spectrometry. Thus a sample dissolution step must often be performed
before analysis
separation
steps
can take place.
may
also
be
Element
required
5
preconcentration and
to
improve
the
quality
chemical
of
the
measurement." The solid sample can be digested and brought into solution in a
number of ways, e.g. wet decomposition (open or closed systems), dry ashing
(open or closed) or fusion with a fused salt flux.
Wet decomposition in an open system is one of the oldest techniques
used, while wet decomposition in a closed vessel and with microwave heating has
become popular, due to the fact that this approach can be automated to handle a
large number of samples.
The fusion method is of limited use due to the high
blank values introduced from the reagents and vessels used, but for some
samples, it still is the best and only way.
1.2.1.1 Wet decomposition for solid samples
Wet decomposition methods involve the addition of mineral and or
oxidising
acid(s)^
to
acid
resistant
PTFE
(polytetrafluoroethylene),
(perfluoralkoxy vinyl ether) or quartz vessels, containing the sample.
PFA
Most
inorganic and some organic materials will dissolve in the acids, and often the
sample
matrix
is
destroyed,
which
reduces
or
eliminates
any
possible
interferences due to the matrix. The acids used in the digestion mixture have to
be of a sufficiently high purity to minimise the blank value. Sample dissolution by
concentrated acids results from a number of factors.
These include the high
proton concentration, the oxidising action of the acid (if any) and in some
instances specific reactions or strong complexation with the a c i d . "
For wet decomposition in open vessels, systematic errors can occur due to
the fact that some elements will volatilize
during the decomposition
and
contamination can occur due to the open vessel. This can be avoid by using a
pressure digestion system, i.e. a wet decomposition method but utilising closed
digestion vessels.^°
Compared with the open vessel system,^° the closed system has several
advantages :-
i) no volatilisation losses,
ii) no contamination from external sources,
iii) shorter reaction times and improved decomposition due to higher
temperatures, (above boiling point of digestion acid)
iv) reduced reagent consumption, and
v) nitric acid can be used as a general purpose digestion reagent. It is also
available in a high purity state, therefore reduced blank values are
obtained.
1.2.1.2 Microwave assisted digestion for solid samples
The microwave dissolution technique makes it possible to speed up the
acid dissolution process due to the rapid heating ability of microwave systems.
Microwaves can be applied to open systems, but it is more advantageous to use
closed microwave systems, which allow higher temperatures to be reached and
prevents the loss of the analyte during the dissolution process.'° Potentially, this
type of digestion system can be easily automated allowing for a higher throughput
of samples than for conventional hot plate based digestion methods. With certain
systems/ the pressure and temperature inside the digestion bomb can be
measured, helping to ensure the optimal digestion conditions are reached and
maintained.
1.2.1.3 Dry ashing for solid samples
Dry ashing in open vessels is the simplest digestion method, whereby the
sample is placed in a muffle furnace in the presence of air at 400-800**C to
remove the organic constituents.
This method can be subject to the loss of
certain elements e.g. As, B, Ca, Cd, Cr, Cu, Fe, Hg, In, Pb, Se, Te and Zn.^^
However, due to its rather limited applications, dry ashing has largely been
replaced by other methods.
Low temperature a s h i n g , c a n eliminate some of the problems associated
with normal dry ashing.
The decomposition is performed in the presence of
oxygen molecules at a low pressure (1-5 Torr). The excited singlet state oxygen,
which has a lifetime of about one second, is produced by a radio frequency field
(13.5 MHz). Once, produced, it is then rapidly passed over the sample, which is
surrounded by a cooling jacket to help retain any volatiles that may be formed.
The method has been successfully used for the hydride forming elements but Hg
is usually lost.
The method is free from contamination as the oxygen can be
cleaned before use, but the method can take days for a complete digestion of the
sample.
1.2.1.4 Closed system combustion for solid samples
When the determination of volatile elements is required, combustion with
oxygen in a closed system may be chosen, as the elements are absorbed in a
suitable solvent after combustion. ^°
The apparatus suggested by Schoniger^^ consisted of a glass flask with
ground glass stopper, which had attached to it, a Pt gauze basket which held the
8
sample.
Solid samples are wrapped in low ash filter paper.
A small volume of
absorbing solution is placed in the flask. During combustion the flask is inverted
to absorb the volatiles in the absorbing solution.
1.2.1.5 Fusion of solid samples
For certain substances, such as silicates and mineral oxides.^ liquid
decomposition methods attack the sample very slowly or not at all.
Therefore,
stronger and more potent methods are required which use fused salt media or
fluxes as the digestion agents. The fluxes will decompose most substances in the
high temperature range of 300-1000**C.
Using this approach, the sample is in the form of a very fine powder which
is then mixed with an excess of flux in a graphite or platinum crucible.
The
crucible is then placed in a hot muffle furnace until the "melt" is complete.
The
production of a clear melt signals a complete decomposition.
melt is dissolved.
After cooling the
Basic fluxes for attacking acidic material include carbonates,
hydroxides and borates, while acid fluxes such as pyrosulfates can be used. If an
oxidising flux is required, sodium peroxide is used. Acidic and basic fluxes are
dissolved in basic or acidic medium respectively.^^
However, the final aqueous
solution has the disadvantage of having a high salt concentration which may
affect the final measurement.
1.2.2 Sample pretreatment techniques for liquid samples
The formation of a precipitate or the chelation of a metal from an aqueous
solution can provide a simple means of isolating a selected analyte from the bulk
9
matrix of a sample.
analyte enrichment
These chemical techniques can in many cases provide
as well as isolation.
Extra advantages
such as the
minimisation or elimination of matrix effects and the lowering of detection limits
can allow the application of less complex instrumentation or methods in the final
measurement step and may allow for automated analysis.^° The most important
off-line preconcentration techniques for metal ions are liquid - liquid extraction
and ion exchange. Other techniques include chelation and co-precipitation of the
desired metal analyte.'°
Such preconcentration and separation techniques are
aimed at exploiting differences in physico-chemical properties between the
various compounds in the mixture / sample.^
Volatility, solubility, charge,
molecular size, shape and polarity are the most useful in this respect. A change
in phase, as occurs during distillation, or the formation of a new phase as in
precipitation, can provide a simple means of isolating a desired component.
Usually, however more complex separation procedures are required for multicomponent samples.
Most depend upon the selective transfer of materials
between two immisicble phases.^
Many analytical measurements are subject to interferences from other
constituents in the sample.
Newer methods increasingly employ instrumental
techniques to distinguish between analyte and interference signals.
However
such distinction is not always possible and sometimes a selective chemical
reaction can be used to mask the interference.
If this approach fails, the
separation of the analyte from the interfering component will become necessary.
Where
quantitative
measurements
are to be made,
separations
must
be
quantitative or give a known recovery of the analyte.®
A report by Leyden and Wegscheider,^*^ gives a good overview of some of
the many aspects of preconcentrating and determining trace elements in aqueous
10
solution, while an extensive review by Torre and M a r i n a , e x p l o r e s the state of
the
art
of
sample
pretreatment
with
ligand
loaded
complexing
resins,
characterising and studying the applications of such resins.
1.2.2.1 Solvent extraction for liquid samples
Solvent extraction is one of the most commonly used separation and
preconcentration techniques. The basic requirement for a solute to be extractable
from an aqueous solution is that it is uncharged or can form an uncharged ionic
compound.
A complex is formed with the element of interest, in the aqueous
solution, which will partition into an insoluble or sparingly soluble solvent."
Charge neutrality reduces the electrostatic interactions between the solute and
water, and hence lowers the solubility of the solute in water. Extraction into a less
polar organic solvent is facilitated if the species is not hydrated, or if the coordinated water is easily displaced by hydrophobic co-ordinating groups such as
bulky organic molecules.^°
The reason for the wide use of extraction in combination with flame atomic
absorption spectrometry (FAAS) is the improvement in sensitivity arising partly
from the increased element concentration, but partly because nebulization of
organic solvents can produce a more finely dispersed aerosol,^® and the solvent
acts as secondary fuel.
With electrothermal atomic absorption spectrometry
(ETAAS), however, the use of organic extracts instead of aqueous solutions does
not, as a rule, enhance the atomic absorption signal.
Nevertheless, the hybrid
method (ETAAS with solvent extraction) has the advantage of higher sensitivity
than that of the FAAS method.
The work of Volynsky et a/.^^ discusses the
11
problems of rational combination of the solvent extraction of trace metals with
determination by ETAAS.
The most important experimental variables in the extraction of metals are
the organic solvent, the pH of the aqueous solution, the chelating agent and the
use of masking agents. ^° When the substance of interest is extracted, a solvent
denser than water is often required.
However, when the interferences are
extracted and the substance of interest remains in the water, a solvent less dense
than water is preferable.
This then allows for easy removal of the phase
containing the analyte of interest from the separating funnel.
Sometimes the
metal ions are re-extracted from the organic phase into the aqueous phase at an
appropriate pH,^^ but it is often also possible to measure the metal concentration
directly in the organic phase.
There are three types of chemical compounds that fulfil one or more of the
requirements for efficient solvent extraction :-
i) Neutral molecules :- These are essentially neutral covalent molecules /
complexes and are found naturally in waters,^°
ii) Ion associated complexes
:- These complexes are only possible if the
charge is neutralised by chelation or by association with other ionic species
of opposite charge. A further requirement is that at least one of the ions
contains a large hydrophobic group,'° and
iii) Uncharged metal complexes
ligands
e.g.
:- Such as metal complexes with organic
8-hydroxyquinoline
(8-HOQ),
ammonium
pyrrolidinedithiocarbamate (APDC)^® and diethyldithiocarbamate (DDC).^^
Also a mixture of complexing agents (APDC and DDC)^°'^^ can be used to
improve the complex stability and broaden the effective working range.
12
The use of organic ligands which form uncharged metal complexes is the
most important route for obtaining chemical compounds which can be solvent
extracted from aqueous solutions. The element chelates formed must be apolar
to be efficiently transferred into the organic phase. If the chelating molecules fully
balance the charge of the ion then transfer to the organic phase should occur."
The
co-ordination
arrangements
of
several
of
the
most
commonly
used
complexing agents are shown in Figure 1.1. For clarity, only one of the chelating
groups are shown around the central metal.
8-Hydroxyquinoline
(oxine; S-quinolinol)
I
U
—C
V-n,
"^Q^
«
jf
11 ^ /
''5^2
Ammonium pyrrolidine
diihiocarbamate (APDC)
(ammonium ions displaced
by metal in figure)
Diethylammonium
diemyldiltiiocarbamale
(dielhylammonium group
displaced by meial
in figure)
S
Figure 1,1: Common metal ion chelating complex used In solvent extraction
13
1.2.2.2 Ion exchange techniques for liquid samples
Ion exchange techniques are well suited for both the separation of ions of
opposite charge (cation - anion separations^^) and for the separation of ions of
like charge (for matrix - trace metal separations" and mixtures of trace metals^").
In an ion exchanger, functional groups are immobilised on some type of solid
substrate, thus providing the potential for either batch extraction of ions from
solution or for using the ion exchange material in a packed column for off-line and
on-line applications.
frequently used.
Ion exchange resins based on organic polymers are also
These consist of a polystyrene polymer crosslinked with
divinylbenzene and treated to introduce the ionic functional groups.
The
functional group introduced on to the polymer, will determine which type of
exchanger is produced.^°
Examples are given in Table
1.1.
The general
properties and techniques, and some of the many applications of the ion
exchange resins are described in detail elsewhere.
Type of Exchanger
Functional group
Strong cation
sulfonic acid groups
-SO3H
Weak cation
carboxylic acid groups
-CO2H
Strong anion
quaternary ammonium groups
-N(NH3)3CI
Weak anion
amine groups
-NH2CI
Table 1.1: Examples of functional groups used with ion exchange resin
14
An ion exchange resin operates on an ion association basis, and selectivity
and partitioning are a frequent problem.
When the sample contains a large
excess of alkali metals ions, these ions could compete for the sites on the
exchanger material.
In situations were the alkali metals are not of interest, a
chelating ion exchange resin can be used.^"
These resins contain functional
groups which form chelates with the metal ions.
A commonly used material is
Chelex-100,^®'^^ which contains iminodiacetic acid functional groups with a
chemical behaviour very similar to ethylenediaminetetraacetic acid (EDTA). The
range of metals that can be complexed with this material is large and the complex
behaviour can be predicted by analogy with EDTA.^° Iminodiacetic acid groups
are not the only chelating materials attached to a solid support material. Another
commonly used material, is an organic chelating agent used in solvent extraction
system, namely 8-hydroxyquinoline which can be bonded onto a glass or silica
support.
1.2.2.3 Evaporation of solvent from liquid samples
The simplest method^° for preconcentrating a liquid sample is to evaporate
off the solvent leaving behind the analyte of interest which can be reconstituted in
a smaller volume of liquid.
This method was used by Thompson
a/.^^ to
preconcentrate a suite of 30 metals for simultaneous multi-element determination
by inductively coupled plasma-atomic emission spectrometry (ICP-AES), thus
facilitating the determination of a wider range of major and trace metals than
would have been possible by direct nebulization in the ICP-AES.
15
1.2.2.4 Removal of volatile elements from liquid samples
Where the sample is more volatile than the matrix, or where it can be
converted to be so, then this property can be used to good effect in a separation
procedure."
Elements which can be separated by this type of procedure are
mercury and the hydride forming elements (As, Bi. Ge, Pb. Sb, Se, Sn and Te).
Mercury is a special case in that it has a significant vapour pressure at
room temperature. Thus unlike other metals, when ionic mercury is reduced to its
metallic state, the mercury becomes a vapour which can be flushed from the
remaining sample matrix by a stream of inert gas.
The reductant used can be
either tin" chloride or sodium tetrahydroborate. The mercury vapour can then be
measured directly by cold vapour atomic absorption spectrometry (CVAAS) or
atomic fluorescence
spectrometry
(AFS) or
it can
be preconcentrated
or
amalgamated on a gold trap such as fine gold metal gauze, or as a gold coating
on a solid support material.
After preconcentration, the mercury can be
quantitatively removed from the gold by rapid and reproducible heating and the
resulting mercury pulse can be measured as before."
For the analysis of elements such as As, Bi, Ge, Pb, Sb, Se, Sn, and Te
which form volatile covalent hydrides," a similar procedure can be used.
First,
the element reacts with the sodium tetrahydroborate to produce the hydride, which
can then be flushed out of the sample matrix and measured by heated quartz tube
/ furnace hydride generation atomic absorption spectrometry (QF-HGAAS) or by
in situ trapping where the hydride is concentrated upon a precious metal coated
graphite
tube.
This
subject
of
hydride
generation
has
been
covered
comprehensively in a book by Dedina and Tsalev,^° and in situ trapping has been
reviewed by Matusiewicz and Sturgeon.
16
1.2.2.5 Precipitation of trace metals from liquid samples
Most precipitation methods will concentrate a group of metals and great
effort has been put into finding specific precipitation agents to remove single
metals from the matrix whilst leaving the others (i.e. to prevent co-precipitiation)
behind so as not to interfere with the measurement.
For
trace
metal
determinations/*^
the
solubility
of
many
common
precipitates is too high to allow quantitative precipitation of the ions of interest at
concentrations less than a few ng g"^ {i.e. down to trace and ultra trace levels).
For
example,
nickel
in this
concentration
quantitatively with dimethylglyoxime.""*
range,
However,
cannot
be
precipitated
it Is possible to
achieve
quantitative results at these low concentrations by adding a co-precipitant, which
will not only be precipitated itself but will aid the recovery of the ion of interest.
The co-precipitation agent is usually a metal sulphide or hydroxide.^^
1.3 On-line versus Off-line sample pretreatment techniques
Despite the progress made in analytical instrumentation in the past few
decades, the development
of basic analytical techniques
in the
chemical
laboratory has been rather slow and incompatible with requirements of the
computer age.
The sample pre-treatment stage, which often involves manual
separations such as extraction, sorption, precipitation and distillation, quite
frequently form the weakest link of the entire analytical procedure, not only in
terms of efficiency but also in reliability and sample / reagent consumption.
It is
therefore mandatory that more effort be directed towards the development of
efficient automated on-line sample pre-treatment techniques which could remove
17
the bottleneck. The flow injection technique has proved to be an effective tool for
achieving such goals.
Originally considered to be merely a technique for
automated serial assays, flow injection analysis has gradually evolved into a
powerful technique for substituting tedious manual separation procedures by
producing stronger contacts between chemistry and the analytical instrument.
In
fact, this has now become one of the most active fields in automated continuous
flow
analysis,
persistently
stimulating
further
interests
in
revolutionising
conventional operations in the analytical laboratory.^
In real analytical situations, the sample introduction is an extension of
sample preparation.
As a consequence, the selection of a suitable sample
introduction technique can depend heavily on available and effective sample
preparation procedures.^
1.3.1 Off-line (Batch) sample pretreatment techniques
The analytical techniques used for sample pretreatment are mainly off-line
or batch (as mentioned in Section 1.3) which have the disadvantage of being
laborious, time consuming, operator intensive and often prone to contamination
due to the many steps and the large amounts of reagents used.
Sample
preparation techniques where the sample has to be converted from a solid to a
liquid are mainly handled using off-line methods, although on-line microwave
digestion methods using open focused microwaves system may be used.
18
1.3.2 On-line sample pretreatment techniques
The traditional batchwise mode of sample pretreatment and handling of
solutions is being replaced by continuous flow operation on a microscale.
Flow
injection (Fl) methods of separation and preconcentration exhibit some extremely
favourable features over their batch or even continuous flow counterparts.
The
general features are summarised below
i) higher sample throughput,
ii) high enrichment efficiencies for preconcentration systems,
iii) low sample and reagent consumption,
iv) high reproducibility typically in the range 1-3% RSD,
v) simple automated operations allow implementation with
continuous
systems e.g. ICP-AES and FAAS, but also with discontinuous systems e.g.
ETAAS, but the coupling may be more complicated,
vi) improved control and data handling by computers, and
vii) less operator input.
But in the specific case of Fl methods with atomic spectrometry detection,
the primary advantages^^'^^ over a conventional system (i.e. direct nebulization)
are :-
i) only a relatively small volume of sample is needed to achieve a signal
comparable with continuous nebulization,
ii) because of the transient nature of the signal, exponential decay in the
wash out process starts much sooner than with continuous
19
sample
introduction.
Consequently, the signals decays to baseline more rapidly
than for the continuous sample introduction, and
iii) microsample
handling
combined
with
greatly
enhanced
sample
throughput.
A feature which is considered a drawback of Fl separations is the
incomplete
mass
transfer
between
phases,
unacceptable in batch separation methods.
which
is
usually
considered
However, the incompleteness in
physical and chemical processes is not a problem as flow injection analysis (FIA)
systems are basically a technique for reproducible monitoring analytical signals
under thermodynamically non-equilibrated conditions, and does not deteriorate
the precision or sensitivity of the proposed Fl techniques.
Originally.
FIA
systems
were
designed
for
sample
introduction
to
spectrochemical and electrochemical assays. However, due to its versatility, FIA
is finding many different application in the area of atomic spectrometry, as
highlighted by two books by Fang,^^*^' and reviews by many other workers.^^''^
The first important discovery in the automation of laboratory process was
made by Skeggs"^ in 1957, when for the first time the chemical reactions /
processes took place in conduits instead of the usual discrete vessels.
But the
reactions were performed under equilibrium conditions, as air bubbles separated
the flow to ensure homogenous mixing of the sample.
This segmented flow injection system was then superseded by a concept
introduced by Ruzicka and H a n s e n . u s i n g a non-segmented approach which
has become the cornerstone of FIA systems. This area includes on-line sample
pretreatment. which will be covered in more detail in the following section.
20
1.3.2.1 On-line microwave digestion
As mentioned in Section
1.2.1.2, microwave digestion techniques are
potentially faster than conventional pressure wet digestion methods, but there is
still a risk of contamination when transferring the digested sample from the
microwave bomb into another vessel prior to the measurement step. If an on-line
system could be used, then this risk would be negated and the whole process
would be speeded up.
Microwave heating would be expected to be ideal for such continuous flow
applications since it has the capability to rapidly heat liquids within a nonconductive tube e.g. PTFE."'* However, such applications are not straightforward
as indicated by Tsalev et a/.*^^ Work by Burguera and Burguera"® has produced
on-line microwave systems with FAAS and ETAAS.'*^ The samples were mixed
with the mineralization acids, before entering the PTFE reaction coil, which was
situated in a domestic oven. For the FAAS application, the digested mixture was
then sent directly to the nebuiiser for measurement, but for the ETAAS application
the mixture was sent through a gas diffusion cell to remove any gases produced
during the mineralization step.
The sample then passed through an ice trap to
cool the sample down and condense the reaction vapours before final injection of
a sample aliquot into the furnace.
21
1.3.2.2 On-line liquid-liquid extractions
Liquid-liquid extraction is one of the most frequently used separation
techniques in analytical chemistry.
Despite its indisputable effectiveness in the
removal of interfering matrices, and the preconcentration of trace analytes, its
popularity has been somewhat impaired under batch operation conditions due to
the tediousness of the operation, which may also induce complications in trace
analysis through contamination.
A further nuisance is the solvent vapours
released into the laboratory."®
The on-line extraction systems are readily automated, while the closed
system greatly minimises contamination risks as well as the release of solvent
vapours.
An additional advantage not normally gained with other FIA sample
pretreatment systems is that for solvent extraction, there is a much higher mass
transfer between the two phases. This leads to higher sensitivities, lower sample
consumption and better precision.''®
For an on-line system, the three most
important factors"® are the phase segmentation, extraction and phase separation.
Phase segmentation divides the stream into alternating different phases, the
extraction phase allows the two liquids to come together and allow the analyte to
reach a state of thermodynamic equilibrium (usually in an extraction coil) and then
finally the phase separation where the two phases are split, i.e. the organic phase
is used for the measurement while the aqueous phase goes to waste. This
process has been discussed in more detail by Fang."®
Backstrom and workers^^' use a two stage continuous flow extraction
system for sample work up before ETAAS determination of heavy metals.
The
metals were first extracted as APDC / DDC complexes into Freon 133. which was
then back extracted into a dilute Hg" aqueous solution where the Hg forms a
22
stronger complex with the complexing agents therefore removing the metals from
the organic phase and transferring them back to the aqueous phase.
1.3.2.3 On-line column preconcentration techniques
Non-chromatographic separations based on ion exchange and adsorption
have been used extensively for enhancing the selectivity and sensitivity of
analytical methods. Although most procedures involve some kind of continuous
flow operation, they are mostly off-line batch procedures. Automation of sorption
separation and preconcentration procedures is therefore a topic which has
received much interest.^^
The technique is inherently easier to operate than other
methods due to the overall simplicity of the equipment needed.
separation
An additional
benefit over other separation techniques is its versatility, due to the wide range of
different column materials, complexing agents and eluents that can be utilised.
However, there are some restrictive features^^ which are characteristic of such
techniques which have to be kept in mind when using the method :-
i) the packed on-line columns generate extra flow impedance, depending
upon the size of the column and the particle size of the packing material,
hence higher grade pumps are required when compared to other methods,
ii) preconditioning of the column is necessary after each elution, a
sequence which is not required in other separation methods.
In FIA, on-line separations by sorption has always been connected with
using columns containing the sorption material. The first attempt using a micro23
column and FAAS was made by Olsen et a / . " in 1983. who described a chelating
ion-exchange method to preconcentrate Cd. Cu, Pb and 2n on a Chelex-100
microcolumn.
This was then followed by Ruzicka and Arndal in 1989.^ who
developed an on-line sorbenl extraction preconcentration method using a Ci8
bonded silica column and diethyldilhiocarbamate as the chelating reagent.
The
first ETAAS on-line sorbent extraction preconcentration method, again using a
C I 8 bonded silica column and diethyldithiocarbamate as the chelating reagent
was published by Fang et al. in 1990.^^ This whole subject area is discussed in
more detail in Section 1.6.
There are many different packing materials that can be used, although they
can be sub-divided into six main groups :-
i) Chelating ion exchangers {Chelex-100, CPG-8Q)
ii) Reverse phase columns (Cie on silica support)
iii) Polymeric sorbents (Amberlite XAD)
iv) Anion Exchangers (Dowex1-X8)
v) Cation Exchangers (Bio-rad AG50W-X8)
vi) Others (Alumina)
Chelating ion exchange columns :
The most frequently used off-line packing materials for preconcentration
are chelating ion exchangers,^^ Chelex 100 being a typical material. Despite the
success
in batch preconcentration
methods, and favourable properties
in
complexing a large number of heavy metals, such materials do not fully meet the
requirements for an ideal packing material for on-line applications.
24
In a detailed
study of the swelling properties of the resin. Fang et a/.^® provide some guidelines
for its usage in on-line columns.
The most common material used for on-line ion exchange column is
quinolin-8-ol functional groups azo immobilised on controlled pore glass. (8-QCPG)."
This
material
has
excellent
mechanical
properties
due
to
the
immobilisation of the functional groups on an easily accessible porous glass
surface. However, the fine particles can cause some problems due to high back
pressures but this can be solved by using larger particle size packings.^^
Reversed Phase
Columns:
Non-polar or medium polar sorbents may be used to collect
metal
complexes of low polarity from aqueous solution by reversed phase adsorption.
The metal complexes are subsequently eluted by a suitable solvent such as
methanol or ethanol.
extraction,
has
been
The technique, termed sorbent extraction or solid phase
used
in
batch
mode
for
sample
cleaning
and
preconcentration purposes.
A number of well known chelating agents, in conjunction with non-polar or
medium polar sorbents have been used for sorbent extraction methods e.g.
sodium diethyldithiocarbamate (NaDDC),^^^^ diammonium diethyldithiocarbamate
(DDDC)^^ and ammonium pyrrolidinedithiocarbamate
(APDC),^^'®^ which form
stable complexes with important heavy metals. Common matrix elements e.g. Na,
Ca, Mg and K are not complexed with the chelating agents therefore they are not
retained and flow to waste with the rest of the bulk matrix.
25
Polymeric
Supports:
While these materials do not carry ion exchange groups, they are
nevertheless useful adjuncts or alternatives to ion exchange resins in certain
applications.
These polymer adsorbents are hard insoluble spheres of porous
polymer of high surface area, and are available in a variety of polarities and
surface characteristics.^^
1.3.2.4 On-line co-precipitation techniques
Precipitation is one of the oldest separation techniques used in classical
chemical analysis. However, its importance in modern methods has declined due
to the development of more versatile and efficient techniques, such as solvent
extraction and ion exchange which can be easily automated. Conventional batch
methods are time consuming, labour intensive and require great operator skill.
The manual procedures are usually long and involve many steps which introduce
a greater risk of contamination.^^
On-line systems have been developed but they had to overcome the
difficulties of continuous manipulation of a heterogeneous system which could
create blockages, a major problem in a FIA system.
Again the low levels of analyte may cause problems and so co-precipitation
systems have been introduced, where the precipitated is collected in a knotted
reactor (with or without a filter). As a result of this development, separation and
preconcentration
procedures
by precipitation,
originally
requiring
hours
of
operation and a few hundred millilitres of sample and reagent in the batch mode
may now be completed in less than a minute with an automated FIA system, while
consuming a few millilitres of sample and reagent.
26
The risk of contamination is
also drastically reduced when using the Fl system, which in turns improves the
reliability and the precision of the determinations.^
The technique
has
successfully been coupled to FAAS.^ and to ETAAS.®" The method was adapted
from a batch process,^ where the analyte(s) of interest were co-precipitated
quantitatively with iron" hexamethyleneammonium hexamethylenedithiocarbamate
(HMA-HMDTC) and the resulting complex was collected on the inside of a knotted
PTFE tube. The complex was then dissolved using isobutyl methyl ketone (IBMK)
and introduced directly into the flame atomic absorption spectrometer.
In the
ETAAS method.®" the precipitate was dissolved in 60 jil of IBMK, and stored in a
PTFE tube before being propelled into the graphite tube by a stream of HMAHMDTC.
1.3.2.5 On-line vapour generation techniques
As mentioned in Section 1.2.2.4, volatile elements e.g. hydride forming
elements can be removed from the aqueous sample matrix by reaction with
sodium tetrahydroborate. and then the gaseous hydrides can be transferred from
the aqueous sample into a gaseous acceptor stream via a gas-liquid separator.
These methods have the advantage of removing the potential interferences from
the analyte of interest, but can also preconcentrate the analyte, allowing lower
detection limits than for direct analysis of the sample.
Batch procedures are carried out in a reaction chamber, and then the
covalent hydrides once formed are swept out of the vessel by a stream of carrier
gas straight into the heated quartz furnace®® or graphite tube for in situ trapping.®^
High sensitivities for the batch methods have been obtained but at the expense of
large sample and reagent consumption.®^
27
Automated hydride generation methods have been developed which
generate the hydride by reaction of an acidic sample with a reductant solution of
sodium tetrahydroborate.
The hydride is removed via a gas liquid separator
(GLS) using a stream of inert gas usually Ar, and swept into the quartz furnace or
into a graphite tube for in situ trapping. These methods will be discussed in more
detail in Section 1.5, Reaction conditions for effecting the gas liquid separation
may be optimised separately and often greatly enhance the selectivity of the
determination.
The non equilibrium conditions of the FIA process can be
exploited to enhance favourably the selectivity of the hydrides through kinetic
discrimination in the formation of the interfering hydride.^^
The literature is full of on-line vapour generation papers where the workers
have used hydride generation but combined it with various different pretreatment
stages.
Nielsen et al^
preconcentrated As'" by co-precipitating it first with
La(0H)3, collecting the precipitate in a knotted reactor.
reactor with Imol
It was eluted from the
HCl and transported to a manifold where the hydride
generation reactor took place, and then on to quartz furnace atomic absorption
spectrometry (QF-AAS) at 900*^0 for the final measurement step.
Carrero and Tyson,®® simultaneously retained Se'^ and tetrahydroborate on
a strong anion exchange column and produced the hydrogen selenide by passing
a slug of HCl through the column with subsequent detection by QF-AAS.
This
method offers an improvement over conventional HGAAS techniques in terms of
sensitivity and the reduction / elimination of cation interferences.
28
1,4 Cold Vapour Atomic Absorption Spectrometry
The determination of mercury is possible by the cold vapour atomic
absorption (CVAAS) technique, since this technique is based upon the unique
properties of this element.
temperatures.
Mercury can exist in the atomic state at ambient
It also exhibits an appreciable vapour pressure (0.0016 mbar at
20*'C) and the mercury vapour is stable and monoatomic/° Hence when mercury
is produced in its elemental form by reduction of its compounds, the vapour can
be entrained in a stream of air or an inert gas and measured by the atomic
absorption of the cold vapour without the need for a flame atomiser.^^
The most successful procedure for the determination of trace levels of
mercury was first proposed by Poluektov
and co-workers^^
in
1964
who
discovered that when tin" chloride was added to a mercury sample before
aspiration into a flame, there was an increase in the signal of 1 or 2 orders of
magnitude compared to when no tin" chloride was added.
This method was
further investigated by Hatch and Ott/^ in 1968. The mercury was reduced to the
free metal in an acidic solution of tin" chloride. A stream of air or inert gas was
bubbled through the solution which then passed the atomic vapour to an
absorption
cell
mounted
in the
radiation
beam
of
an
atomic
absorption
spectrometer. The detection limit for this method was 0.02 \ig \'\ which was three
orders of magnitude lower than the flame method/^
Initially tin" chloride was the most widely used reductant^^ but some
workers have used sodium tetrahydroborate/"'^^ The major differences between
the two reductants is that sodium tetrahydroborate (NaBH4) is the stronger
reducing agent and a large quantity of hydrogen is produced, as a by-product of
the reaction. This hydrogen helps remove the mercury from the solution, whilst
29
when using the tin" chloride method, a constant stream of air must be bubbled
through the solution to liberate the mercury. A further advantage of using sodium
tetrahydroborate, is that the reduction reaction occurs quicker than with the tin"
chloride, which means that there is less contact time between the vapour and the
inner surfaces of the system.
This is important since the loss of mercury can
occur by adsorption, a major problem in mercury determinations.
sample throughput can be achieved.^'
achieved
using
AAS
are
required,
Also a larger
If lower detection limits than those
an
amalgamation
method
or
atomic
fluorescence (AF) detection can be used.
Several authors have described the collection of mercury vapour by
amalgamation on silver.^ gold,^'^* or a gold / platinum gauze/® This technique
eliminates kinetic interferences due to a different vaporisation rate or a different
distribution function of the mercury between the liquid and the vapour phases.
The sensitivity is also increased by more than an order of magnitude because the
collected mercury can be rapidly released into an absorption cell by heating the
collector/® The detection limits of this procedure are typically better than 0.1 ng
of H g / '
When using the cold vapour generation method with atomic fluorescence
spectrometry (AFS). there is minimal background interference and scatter, i.e. no
flame noise or absorption.
Argon must be used as the carrier gas since air
quenches the fluorescence of mercury,®° and for similar reasons, tin" chloride
must be used as the reducing agent, as hydrogen also produces a quenching
effect.^^ Thompson and Godden.®^ used a commercial AA instrument, but with the
mercury vapour contained within a transparent argon shield instead of a normal
fluorescence cell, and achieved a detection limit of 0.02 ng of Hg.
30
The batch method of cold vapour atomic absorption spectrometry has been
converted to an on-line method using Uow injection methodology by various
workers/^'®^"^
This methodology has the advantages of full automation, high
speed of analysis, minimum sample consumption and the ability to use exact
sample volumes.^
Also, the use of an on-line system allows the pretreatment
steps to be performed on the sample immediately before the measurement step,
e.g.
on-line oxidation of the organomercury in the sample,®^'^ and on-line
microwave digestion of samples.^
1.5 Hydride Generation Atomic Absorption Spectrometry
It has been known for over 100 years that As and other elements from
Groups IV, V and VI of the Periodic Table react with "nascent" hydrogen, to form
volatile, covalent hydrides (e.g. AsHs, SbHa, BiHa, H2Se, H2Te, GeH4, SnH^j and
PbH4).
This fact has been used to aid the separation and enrichment of such
analytes from the matrix with a reduction in interferences.^^
In 1969, Holak86 published the first paper determining As by hydride
generation atomic absorption spectrometry (HG-AAS).
The nascent hydrogen
was generated by adding Zn to the HCI acidified sample solution, and collecting
the arsine in a liquid nitrogen cooled trap.
After the reaction had gone to
completion, the arsine was released by warming the trap and passing a stream of
nitrogen through to sweep the arsine in to an argon / hydrogen diffusion flame to
measure the atomic absorption.
However the metal / acid reaction had a number of disadvantages which
hindered its use.
The metal was not available in a very pure form and hence
variable blank readings were obtained. Only a very small fraction of the hydride
31
was released from the reaction, (about 8%)®^ while 90% remained trapped in the
zinc precipitated sludge at the bottom of the vessel.
In addition, only a limited
number of elements could be analysed (e.g. Zn could only be used in the analysis
of As. S b a n d Se).''
The
applications
of
hydride
generation
increased
when
tetrahydroborate was used as the source of nascent hydrogen.
sodium
With sodium
tetrahydroborate (NaBH4), most of the hydride forming elements could be
determined.
Initially, the tetrahydroborate was added as pellets, in a similar
manner to the metal / acid reactions, but this produced poor results and the
reaction was difficult to control as an alkaline zone formed around the pellet,
causing poor reproducibility.
When the sodium tetrahydroborate was added in
solution f o r m , ^ ® the reaction was easier to control and more reproducible.
The
reductant was stabilised by making it in an alkaline (NaOH) solution.
Coupled with flow injection (Fl) technology, the whole process from sample
introduction, via hydride generation to the final measurement step, has been
automated.
Traditionally, HG-AAS has been performed by passing the volatile
hydrides into an atomiser cell, where decomposition of the hydride takes place.
The atomiser cell can either be a flame^° or more commonly a heated quartz
tube.^^ The quartz tube can be heated with a flame or electrically. Compared with
a flame, a quartz tube offers the advantage of higher sensitivity and for As and
Se, negligible spectral background and an improved signal to noise ratio.^^
Hydride generation AAS has been reviewed in detail by Dedina and Tsalev.^^
32
1.5.1 "In atomiser" trapping for hydride forming elements
The technique of "in atomiser trapping" utilises the graphite tube as both
the preconcentrating medium and the atomisation cell.
This technique has a
number of advantages for the atomisation of hydride forming elements over the
use of conventional heated quartz cells. The generated hydride is trapped within
the graphite atomiser, generally upon a coating of Zr,^^*®^ Ir,^" P d , ^ Ir-W^^ and IrZr^® or even on the untreated graphite tube surface.^^
The subject of in-situ
trapping of hydride forming elements within a graphite furnace has recently been
reviewed by Matusiewicz and Sturgeon.^'
The use of the graphite atomiser to trap the analyte species and then
decompose the hydride, provides two clear advantages :-
i) it ensures a clean and rapid separation from the matrix, prior to the
atomisation step, and
ii) allows far greater control over the atomisation conditions and thus
generating Improved peak shapes. This is due to the fact that in atomiser
trapping gives conventional ETAAS peaks, with the complete atomisation
taking place within 2-5 s instead of 10-15 s, typical for quartz cell atomisers
for a similar mass of analyte.
In addition, greater reproducibility is attained when compared to a quartz
cell. As the analyte is preconcentrated on the tube surface, less sample volume is
required compared to continuous hydride generation coupled with the quartz cell.
This results in higher sensitivities and lower detection limits.
33
However, larger
sample volumes can also be handled due to the clear separation between
trapping and atomisation intrinsic in the preconcentration process.
As the analyte is trapped within the atomiser, any kinetic effects affecting
the hydride generation and decomposition processes (within the quartz cell
atomiser leads to extended peak widths), can be minimised as the trapping time is
independent of the atomisation process.
Performing the atomisation within the
graphite atomiser means that careful control of the atomisation parameters is
possible leading to improved reproducibility of the atomisation process and
reduced interferences.®^
Hydride generation techniques are prone to two sources of interference,
firstly, those that occur during the hydride generation step and secondly,
atomisation interferences in the quartz cell.
Considerable work has been
expended in trying to understand and overcome these interferences.®®
However, in atomiser trapping can overcome such disadvantages as the
technique is less susceptible to the kinetics associated with hydride formation and
decomposition.
can interfere.
Only the species that are transported to the graphite furnace
In principle, there are two possible interference mechanisms ;
suppression of either the trapping stage or a reduction in the atomisation
efficiency of the analyte.®® Only the hydrides have been found to interfere in this
technique. Various workers,
have concluded that the mutual interference is
markedly lower than in an external heated quartz tube. It has been shown that the
interferences do not take place either in the liquid phase or during atomisation.
The interferences are due to competition for the deposition on the active sites,^°^
i.e. due to suppression of trapping efficiency.
Consequently this interference
should be expected to be depend on the total mass of interferent trapped in the
furnace rather than on the interferent concentration in the sample.
34
In atomiser
trapping could also be an effective tool for reducing interferences in the liquid
phase since trapping should allow sample dilution or the slower addition of the
reducing agent, both of which reduce matrix interferences, without reducing
sensitivity.^
1.6 Column preconcentration
The introduction of flow injection techniques for solution manipulation in
atomic spectrometry has greatly enhanced the performance of the latter.^*'''
The
principle drawback of conventional separation procedures is the fact that they are
often time consuming and frequently require large sample volumes.
implementation
of
on-line
flow
injection
techniques
for
With the
separation
and
preconcentration, such drawbacks are, however, no longer valid, while the
beneficial effects are further enhanced.
The improvements are such that the separation and preconcentration
operations for atomic spectrometry, once often the "bottleneck" of the entire
procedure, are now completely compatible with the efficient atomic spectrometric
measurement sequence.
Therefore, large enhancements in the performance of
atomic spectrometric techniques are possible at sample consumption levels and
sampling frequencies typical of conventional atomic spectrometric
without preconcentration treatments.^^'^
35
methods
1.6.1
Development of flow injection on-line column preconcentration
with flame atomic absorption spectrometry detection
In 1983, Olsen et a/.^ reported for the first time, the use of an on-line
column preconcentration system for the determination of trace amounts of heavy
metals in seawater by flame atomic absorption spectrometry (FAAS). The method
was originally proposed to enhance the sensitivity of the measurement of cationic
trace elements in very diluted aqueous samples. Each sampling cycle consists of
two separate operations, preconcentration and elution.
First, a large sample volume e.g. 5 ml was injected by the first valve into
the carrier stream and propelled through the cation exchange column (Chelex100).
Then a small volume of eluting reagent (e.g. 50 |il of 1M HNO3) was
injected by the second valve, liberating the preconcentrated analyte (x 100) into
the detector. This method allowed Pb to be determined down to 10 ppb and Cd
and Zn as low as 1 ppb with a sample throughput of 30 - 60 per hour.
The main advantage of using on-line preconcentration is that all samples
and standards are subjected to exactly the same treatment from injection to the
moment of detection, and the same ion exchange column is used for all samples
and standards. As the geometry of the flow and the ensuring chemical reactions
are strictly controlled and reproducibly maintained in the Fl system, it is not an
absolute prerequisite that quantitative adsorption of the analyte is achieved, but
the subsequent elution must be quantitative, otherwise carryover from one sample
to the next will occur.
This first paper was quickly followed with more advanced designs of
manifold which used different resins.^®'^°^'^°^ time based rather than volume based
injections/°^*^°® and most importantly, counter current o p e r a t i o n , o f
36
the
microcolumn.
This manifold design has two advantages^°^ over the original
design :-
i) the matrix material is flushed to waste, and does not to pass into the
detector.
Background correction is therefore not required and there is no
or little blocking of the instrument lines, and
ii) the
ion
exchange
column
is
regenerated
before
the
next
preconcentration step, and operated in the counter current mode.
The
chance of the column becoming blocked is thus effectively reduced. This
can be a problem with Chelex-100 which undergoes volume changes when
converted from the acidic to the alkaline form.
1.6.2 Development of flow injection on-line column preconcentration
with electrothermal atomic absorption spectrometry detection
Flow
injection
sample
introduction
for
ETAAS
systems
is
less
straightforward than for FAAS, owing to the discontinuous nature of ETAAS
operations, and this has caused the slower development of related techniques.
In 1989, a paper by Beinrohr et a/.^^° described a design for an on-line
microcolumn preconcentration technique for ETAAS, using a column packed with
an ion exchange material to determine Pb in a sodium chloride matrix.
The
method required manual manipulation of sample flows as well as sample
introduction. In 1990, a paper by Fang ef a/.^^ discussed the successful coupling
of a flow injection on-line column preconcentration system with electrothermal
atomic absorption spectrometry. The method developed used sorbent extraction
of the lead diethyldithiocarbamate on to a Cis column and elution by ethanol into a
37
collection tube for manual insertion into the furnace for measurement.
Full
automation of a flow injection on-line column preconcentration system was
developed in 1991, by two different groups^"^ using different approaches.
Porta et a/.^ used a miniature Cia column mounted at the tip of the
autosampler arm. A modification to the tubing line of the autosampler, by adding
an external pump, which allowed either the flow of the sample through the column
or the normal flow operation of the autosampler. Sperling et a/.^ integrated the Fl
preconcentration manifold system to the ETAAS autosampler arm.
The normal
autosampler tubing was disconnected, and the delivery tube from the manifold
was
attached
to
the
autosampler
arm.
This
assembly
allowed
the
preconcentration operation to occur in the manifold. With the arm in the injection
position permitted the eluent to be injected into the furnace, and with the arm in
the rinse position , permitted all excess solutions to flow to waste.
1.6.3 Advantages of FI-ETAAS online preconcentration
The advantages of Fl on-line preconcentration were first demonstrated
using FAAS to provide an increase in sensitivity at sampling rates comparable
with normal FAAS determinations.^^ The on-line sample pretreatment operations
with FAAS in terms of sample throughput and simplicity cannot be compared with
ETAAS due to the detector's discontinuous nature of operation, the coupling of Fl
with ETAAS does have some specific advantages."^
The specific features of ETAAS operation which pose special requirements
on the design and operation of the flow injection systems (different from those of
an FAAS system) are described below.
Also the differences between time and
volume loading of the sample are discussed.
38
1.6.3.1 Coupling of flow injection systems with ETAAS
As the normal operation of a graphite furnace atomiser is batch mode with
discrete sampling, it does not lend itself to coupling with continuous flow operation
such as flow injection."^ Therefore the preconcentration operations are carried
out in one of two ways :i) in parallel with the furnace operation /.e. one sample is processed in the
Fl system while the other sample is being atomised in the furnace, or
ii) sequentially i.e. the Fl system remains on standby while the sample is
atomised in the furnace.
A higher sample throughput is obtained with the parallel operation, but two
independent control systems are need for this mode of operation.
1.6.3.2 Sannple introduction
With normal ETAAS operations, the liquid sample is directly injected into
the furnace, and the maximum sample volume (typically 70-100 |il) depends upon
the tube design and the solvent being i n j e c t e d . W i t h ethanol as the solvent and
using a tube fitted with a L'vov platform, this maximum volume can decrease to
about 50 fil.^^
The volume of eluent used to totally desorb the analyte off the column is
usually greater than the total permissible volume that can be analysed by the
furnace.
Therefore in order to overcome this problem, special zone sampling
39
procedures,"^ have been developed to introduce the most concentrated fraction
of the elute in to the furnace. Such procedures include :-
i) multiple injections with intermediate drying,^
ii) heart cut or zone sampling which introduces the most concentrated
fraction of the elute into the furnace and discards the rest,^
iii) quantitative phase transfer of analyte within manageable volumes by
miniaturisation of separators and reduction of dispersion by air flow
transportation of concentrates,"^ and
iv) deposition of concentrated aerosol by high pressure nebulization.""*
As the measurement cycle of the FI-ETAAS method is significantly longer
than in a typical FI-FAAS method, this feature makes it easier to make the two
operations i.e. measurement and preconcentration steps, more compatible. Thus
sample loading and the elution rates are slower compared with flow rates in FIFAAS, therefore a better phase transfer can be achieved between the column and
the sample solution, which leads to overall improved performance of the coupled
system."^
1.6.3.3 Matrix removal and washing procedures
Since ETAAS is more sensitive to matrix interferences than FAAS, (even
with background correction), the introduction of even a small amount of matrix
cannot be tolerated."^ Therefore in ETAAS preconcentration methods, washing
steps become very important to remove any matrix from both the tubing and from
the column. This problem was highlighted by Fang et al.^^ who used the method
40
of analyte addition to correct for high background signals after the washing steps
(which occurred in the same direction as loading) had failed to remove the
interferents.
Sperling ef a/.^ found that these problems could be overcome by
washing the column with dilute nitric acid in the reverse direction to loading.
With on-line preconcentration system, some degree of matrix removal is
achieved and this allows for a simple measurement by ETAAS without the need
for chemical modification and sophisticated background corrections."^
1.6.3.4 Improved detection limits
Due to the closed reaction system and the possibility of on-line purification
of reagents,^^ " ^ the very low blank levels for ultra trace determination are more
advantageous with ETAAS than with FAAS. This leads to lower detection levels.
Since for many analytes the limiting factor in detection power lies in the
background level rather than the sensitivity, this advantage may be exploited to
achieve better detection limits than those obtainable under batch operation
conditions."^
1.6.3.5 Signal measurement
In FI-FAAS methods, the peak height measurements of the transient
signals are directly related to the dispersed concentrate zones.
In FI-ETAAS
methods, the whole concentrate zone used for the measurement is injected into
the atomiser and dried before atomisation. Therefore this method does not rely
upon the distribution of the analyte in the concentrate zone as long as the total
41
mass remains constant. This permits some degree of fluctuation in the sampling
position of the concentrate when zone sampling techniques are used.
1.6.3.6 Time based and Volume based sample loading
In Fl preconcentration systems, the sample volume being processed may
be determined either by fixing the time interval.^"® for sample introduction
(loading) into the preconcentration system, under a defined sample flow rate, or
by using a carrier stream to displace a fixed sample volume, defined by the
volume of the sample loop.^^'^^^ The former approach is referred to as time based
sampling and the latter, volume based sampling.
Time based sampling is more straightforward to operate, since there is no
need to prefill the sample loop before injection into the carrier stream.
The
amount of sample processed is determined by the sample flow rate and the time.
Consequently, time based method are more efficient than volume based methods,
but they are more dependant upon the stability of the of the pump system and
higher quality pumps are needed to maintain a constant and stable flow. This is
particularly true for systems which incorporate packed columns which can create
large flow impedances. Volume based sampling is much less dependant on flow
stability, providing that the sample loops are filled completely with sample before
injection into the carrier stream.^^'^^^
42
1.7 Aims of Study
The main objective of this study, as indicated by the thesis title, has been
to explore the possibilities of on-line sample pre-treatment of environmental
samples for subsequent analysis by atomic spectrometry and in particular
electrothermal atomic absorption spectrometry.
Sample pretreatment for atomic spectrometry covers a large number of
topics from simple dissolution methods to complicated extraction methods and online digestion techniques. Since the main thrust of this work was to look at on-line
sample pretreatment methods for ETAAS. the first major problem to be overcome
was the linking of a discontinuous detector to a continuous flow system.
To
overcome this problem, the conversion of commonly used off-line separation and
preconcentration methods to on-line methods such as solvent extraction, sorbent
extraction, microwave digestion, co-precipitation and vapour generation were to
be investigated.
The detection system to be used, i.e. ETAAS provides extremely low
detection limits for a wide range of metals. This study therefore also examined
methods of matrix removal and preconcentration.
If the matrix interference well
known to be a problem when using ETAAS could be eliminated, the full detection
capability of the ETAAS could be utilised for analysis of environmental samples
resulting in a selective and precise method with very low detection limits.
43
Thus three main aims may be identified for this study :-
i) to develop a simple and robust method to determine total mercury in
environmental and biological samples by cold vapour atomic absorption
spectrometry.
In addition, to consider the possibility of using both off and
on-line digestion procedures.
ii)
to
study
the
possibilities
for
the
multi-element
simultaneous
determinations of the hydride forming elements by in atomiser trapping.
Further to consider the oxidation states of the elements and determine the
best way to achieve maximum sensitivity.
iii) to study the possibilities of multi-element simultaneous determinations
of ultra trace metals in natural samples such as seawater by on-line column
preconcentration.
44
Chapter Two :
Instrumentation - Theory and
Applications
45
Chapter Two : Instrumentation - Theory and
Applications
2.1
Introduction
This chapter details the instrumentation used in the studies presented in
this thesis.
The first section contains a basic overview of the theory behind
atomic spectrometry, although the focus is on atomic absorption spectrometry and
how this is put into practice in modern instruments.
The following section describes in more detail the various components of a
modern
analytical
instrument,
with
particular
attention
being
paid
to
the
components of the electrothermal atomic absorption spectrometers used in this
work, i.e. the Perkin Elmer SIMAA 6000 and the Model 4100ZL.
These two
systems have various components in common, e.g. the transversely heated
graphite atomiser (THGA) furnace and the lamps used (single and multi-element)
hollow cathode lamps (HCL) and electrodeless discharge lamps (EDL), although
the optical design of the spectrometers and the detector systems are different.
These differences will be explained in more detail.
The final section of this
chapter describes the flow injection analysis system (FIAS 400) used for all the
sample introduction and manipulation procedures prior to the measurement step.
2.2 Overview of the theory of atomic spectroscopy
Atomic
spectroscopy
is
used
for
the
qualitative
and
quantitative
determination of up to 70 metals and metalloids from the Periodic Table."^ as
shown in Figure
2.1.
The term atomic spectroscopy covers three different
46
techniques, atomic emission, atomic absorption and atomic fluorescence.
The
work in this thesis utilises mostly atomic absorption, but the basics of all three
techniques are described below in Section 2.2.1.
Li
Na
K
Rb
Cs
Be
Mg
Ca
Sr
Ba
Sc
Y
La
Ti
Zr
Hf
V
Nb
Ta
Or
Mo
W
Ce
Pr
Nd
U
Th
Figure
2.1
Mn
Si
Ge
Sn
Pb
As
Sb
Bi
Se
Te
Hg
B
Al
Ga
In
Ti
Dy
Ho
Er
Tm
Yb
Lu
showing elements determined
by
Fe
Ru
Os
Co
Rh
Sm
: Periodic table
Ni
Cu
Ir
Pd
Pt
Ag
Au
Eu
Gd
Tb
Zn
Cd
atomic
absorption spectrometry"®
Most samples to be analysed by atomic spectroscopy come in one of two
forms, liquid or solid. The former is the more common and is relatively easy to
manipulate.
The liquid can easily be introduced via a nebuliser into a flame or
pipetted into the tube, in the case of electrothermal atomisers (ETA).
For solid
samples, a digestion step is usually required to get the analyte out of the solid
matrix and into a solution ready for analysis.
However, spectroscopic determinations have to be made on the atomic
species, and this can only be achieved on a gaseous medium in which the
individual atoms are well separated from one another.
47
2.2.1 Basic principles of atomic spectroscopy
When an atomic vapour containing free atoms of an element in the ground
state
is illuminated by a light source that radiates
light of a
frequency
characteristic of the element present in the vapour, radiation will be attenuated at
certain frequencies.®^
It was found that the amount of light passing through a layer of uniform
thickness of a homogenous medium is dependent upon the thickness (d) of this
layer and the ratio of the intensity of the transmitted light (I) to the intensity of the
incident light (lo) is independent of the radiant intensity.^^^
1 = lo exp (-X.d)
{Eqn2.1)
The proportionality factor (X) is a measure of the power of attenuation of
the layer and is termed the absorption coefficient, but if the irradiated medium is
not a single substance but a solution of an absorbing substance in a nonabsorbing medium, the absorption coefficient is proportional to the concentration
(C).
X = k.C
(Eqn 2.2)
For analytical purposes, this can be re-arranged in terms of absorbance
(A) and thus absorbance is proportional to concentration.
A = l o g ( I o / I ) = k.C.d
48
{Eqn 2.3)
one lower energy (or ground) state to a higher energy state.^^^'^^ More detailed
accounts are given elsewhere/^^-^^^"'^^ although the basic principles are described
below.
Atomic
Emission
Spectrometry
(AES)
:
This
term
applies
to
the
measurement of light emitted by an atom (as it returns directly to a lower or
ground energy state) after the absorption of energy.^^®
A source of energy i.e.
heat from a flame, promotes the outer electron of the atom from the ground state
into an excited state.
The excited atom then relaxes to the ground state and
releases its excess energy as a photon of visible or ultraviolet (UV) light.^^^
AES is a particularly sensitive technique for the determination of volatile
elements with low excitation energies such as the alkali and alkaline earth metals.
The technique's sensitivity is partly due to the relatively low degree of ionisation
induced by the cool flames.
Atomic Absorption
Spectrometry
(AAS) :
This term is applied to the
measurement of light absorbed by an atom in the ground state.
medium,
the
atoms
are
capable
of
absorbing
radiation
characteristic to the electronic transitions^^^ and. this
of
In a gaseous
wavelengths
radiation at
certain
frequencies is attenuated. The absorption of radiation excites an outer electron
from the ground state to the excited state, and the degree of absorption is a
quantitative measure of the concentration of ground state atoms in the vapour.'^®
After a few microseconds or less, the excited atoms relax to their ground state by
transferring their excess energy to the atoms or molecules in the m e d i u m . A s
only atoms in the ground state will respond in this way, the conditions used for
volatilisation and decomposition of the sample to produce an atomic vapour must
49
induce the minimum of ionisation. This can be achieved where the temperatures
remain below 3 0 0 0 K/^® i.e. in a flame or in an ETA.
Atomic Fluorescence
Spectrometry
( A F S ) : This is the term applied to the
measurement of radiation re-emitted from an excited atom as it returns to the
ground or lower energy state. In atomic fluorescence, radiation from a line source
is used to excite atoms to a higher electronic state. The fluorescence radiation is
emitted as the excited atoms return to the ground state.
This fluorescent radiation is characteristic of the atoms which have
absorbed the primary radiation and is emitted in all directions.
It may be
measured in any direction other than in a direct line with the radiation source,
which ensures that the detector will not respond to the unabsorbed radiation from
the source. The intensity of the fluorescent emission is directly proportional to the
concentration of the absorbing atoms but it is diminished by collisions between
excited atoms and other
species within the flame, a process
known
as
quenching.
There are six types of fluorescence, of which resonance fluorescence is the
most intense and is most often used for quantitative a n a l y s i s . T h e other types
of fluorescence are described elsewhere.
The three radiative process for atomic emission, atomic absorption and
atomic fluorescence are shown in Figure 2.2. The horizontal lines in Figure 2.2
represent the different energy levels in an atom. Eo is the term used for the lowest
energy level (ground state). At room temperature, all of the atoms of a sample are
In the ground state.
Ej and E] refer to higher energy levels which are both
higher in energy than Eo. A solid vertical line represents a transition involving an
50
absorption or. an emission of radiation. The wavy line refers to a non-radiative
transition.
Atomic
emission
spectroscopy
Atomic
absorption
spectroscopy
Atomic
fluorescence
spectroscopy
absorption
of heat or
chemical
energy
emission of
radiation
absorption of radiation
|0'
absorption of
radiation
emission of
radiation
Figure 2.2 ; Summary of radiative p r o c e s s e s for A E S , A A S and A F S
126
The energy of radiation absorbed or emitted is quantised according to
Planck's equation,
E = h.v
{Eqn 2.4)
The frequency of the light is related to its wavelength by
{Eqn 2.5)
therefore on re-arrangement of Eqn 2.4 and 2.5
51
E =h
(EQ/7 2.6)
(C/X)
where
E = energy difference between the two energy levels in the atom
h = Planck's constant (6.626 x 10^^ J s)
V = frequency of the radiation
X = wavelength of light
C = speed of light (2.998 x10® m s"')
The spectral line intensities depend upon the relative populations of the
ground or lower electronic state and the upper excited state.
The relative
populations of the atoms in the ground or excited state can be expressed in terms
of the Boltzmann distribution law.^^^
Ni / No = gi /go exp (-AE/KT)
(Eqn 2.7)
where
Ni = number of atoms In the excited state
No = number of atoms in the ground or lower state
9 i and go = the number of energy levels having the same energies as the
excited and ground energy levels respectively,
k = Boitzmann constant (8.314 J K"^ mol*^)
T = Temperature in Kelvin
Since the wavelength of the resonance line is inversely proportional to its
energy
of
excitation
(Eqn
2.6)
the
number
52
of
excited
atoms
increases
exponentially with increasing wavelength.
Also the exponent
is
inversely
proportional to the absolute temperature, which means that the increase in the
relative number ( N i / No) of excited atoms with increasing temperature is
exponential. It is found that N i is always small compared to No i.e. the number of
atoms in the excited state can be ignored relative to the number of atoms in the
ground state at temperatures below 3000 K and the wavelengths less than 500
nm.^^^
2.3
Components of a modern
atomic
absorption
spectrometry
Instrument
An
atomic absorption spectrometer
consists of a
number
of
basic
components as illustrated by the Model 4100ZL electrothermal atomic absorption
spectrometer, shown schematically in Figure 2.3.
Each instrument has a light
source, which directs the light of a specific wavelength to the atomisalion cell, in
this case an electrothermal atomiser (ETA), where the light is absorbed by the
gaseous atoms.
The light is then directed by a series of mirrors to the
monochromator, where the light of the correct wavelength is selected, and
directed onto the detector (PMT) for the measurements to be made.
53
2.3.1
Single and simultaneous electrothermal
atomic absorption
spectrometers
The Model 4100ZL instrument is a single element spectrometer, but the
SIMAA 6000 is a true multi-element i n s t r u m e n t . T h e differences between the
two systems are :-
i) in the detectors, the SIMAA uses diode arrays instead of a PMT, and
ii) the monochromator of the Model 4100ZL is replaced by a polychromator
to handle the extra resonance source lines.
Figure 2.4 shows the optical path and the various components of a SIMAA
6000 instrument. A paper by Radziuk
a/.^^^ gives a good overview of the design
and the implementation of the SIMAA 6000. and a review by Harnly^^ shows the
characteristics and the performance of the current simultaneous instruments and
looks forward to the future for such instruments.
2.3.2 Light s o u r c e s used in atomic absorption spectrometers
The light source used for AAS is required to provide the element specific
radiation, which is of a narrow resonance profile with little or no background light,
and the lamps should be stable and have a reproducible output with a sufficient
intensity to provide a high signal to noise ratio.^^^
Two different light sources were used during the work, i) single and multielement hollow cathode lamps were used for the majority of the elements
determined and ii) electrodeless
discharge lamps for the hydride
54
forming
elements, as .a more intense radiation line could be obtained than that from the
hollow cathode lamps. A more detailed account of the operation and construction
of HCLs and EDLs may be found in many standard texts
119-120. 125
Monocnromator
Pnotomultiplier
Gratin
Graphite Fumace
Source Lamp
Figure 2.3 : Diagram of the various components for a modern electrothermal
atomic absorption spectrometer (Model 4100ZL)
144
2.3.3 Atomisation cell
Although atomisation cells can be either a flame, a quartz cell or a plasma,
the discussion in this section will focus on the modern graphite tube used in the
electrothermal atomiser (ETA).
The
Stabilised
Temperature
Platform
Furnace
(STPF)
concept
was
developed to improve the precision and the accuracy of analysis by ETAAS. The
55
concept makes proper use of the existing equipment to maximise the analytical
signal and reduce any potential interferences during the measurement. It was first
proposed by Slavin et a / ^ ^ in 1981
An overview of the concept is given in two
papers by Carnnck and Slavin/^^"^^ where they discussed the modern graphite
furnace and included a discussion on the STPF concept
Figure
2.4
Optical
and
component
diagram
of
a
simultaneous
electrothermal atomic absorption spectrometer showing the light path from
source to detector (SIMAA 6000)^^®
56
There are seven main conditions, all of which must be implemented to
benefit from any improvements the concept can provide over conventional furnace
analysis.'^® The seven conditions (listed below) apply to either the spectrometer,
the atomiser or to its operation under optimised conditions, and will be discussed
under the relevant sections in this chapter.
Fast Instrument electronics
Signal Integration
Accurate background correction
Rapid furnace heating
L'vov platforms and pyrolytically coated graphite tubes
Gas stop during atomisation
Use of matrix modifiers
The experiments in this study were concerned with matrix
removal
therefore, matrix modifiers were not used, as only the analyte was injected into the
tube, but all the other conditions were used.
In the graphite tube, the sample (usually a liquid) is converted into the
atomic vapour needed for the measurement following a three or four step
temperature program. First, any liquid is removed in one or two drying steps by
slowly heating the tube to a temperature just above the boiling point of the liquid.
The next step is an ashing step where any matrix present (inorganic or
organic) is broken down and driven off by ramping the tube up to a temperature
high enough to remove the matrix (approx. 300-1200''C, depending upon the
57
analyte) but not high enough so that the analyte is also driven off. This ashing
process may be enhanced by the use of a matrix modifier.
Matrix modification is a procedure for reducing or eliminating volatilisation
and vapour phase interferences.
A reagent (e.g. NH4NO3, Mg(N03)2
and
(NH4)3P04)^''° is added to alter the physical and chemical properties of the injected
sample.
The matrix modifier serves to convert either the analyte into a less
volatile form or the concomitants into a more volatile form. Either measure serves
to bring about more effective separation of the analyte element from concomitants
during thermal pretreatment.'^^
Now, ideally only the analyte of interest is left within the tube which is then
rapidly heated in a maximum power atomisation step to the individual analytes
atomisation temperature.
The analyte is vapohsed and the atomic species are
formed above the tube surface and in the path of the light source where
absorption takes place.
2.3.3.1 Electrothermal atomisers
The graphite furnace used by both instruments is a transversely heated
graphite atomiser (THGA).^^® This type of furnace allows the tube to be heated
(electrically) along the full length of the tube i.e.
at right angles to the
measurement beam and not from each end. so there is no temperature gradient
along the length of the tube {Figure 2.5).
58
Figure
2.5
: A THGA graphite
tube
plus contacts
and showing the
temperature profile of tube during heating
Inlet for Inert Gas
L'vov Platform
Figure
2.6 : Diagram of a THGA graphite tube showing integral L'Vov
platform and the position of the inlet for inert gas
When graphite becomes very hot, it is permeable to metal atoms, and so to
prevent diffusion of the atoms during analysis, early workers covered the inner
59
surface of the tube with tantalum foil to stop the metal atoms diffusing into the
graphite. This metal coating was later replaced by a pyrolytic graphite layer. This
pyro-coating of the tube was performed by passing a stream of hydrocarbons
such as methane through the graphite tube at temperatures over 2000*'C.^'*^
A dense, non-permeable and oxidation resistant pyro-graphite layer was
deposited on the graphite tube,
deposited
carbon
gives
the
it now appears that a layer of pyrolytically
best
tube
characteristics,
including
improved
sensitivity and detection limits for refractory elements and improved tube lifetime
due to the greater resistance to oxidising agents and acids.^^
The graphite tubes used for all experiments in this study were made from
pyro-coated graphite which contained a pre-formed L'Vov platform (Figure
2.6).
The platform is required to delay the atomisation of the analyte as long as
possible.
During that delay, the graphite tube and the inert gas are directly
heated by conduction, while the L V o v platform is primarily heated indirectly by
radiation from the tube walls. This produces a time lag which allows the system to
approach thermal equilibrium before the analyte is atomised.
As a consequence of the delay in the L'vov platform reaching the correct
temperature, atomisation occurs in an environment in which the temperature is not
changing so rapidly and thus the peaks obtained are more reproducible.^"
During all but the atomisation step, there is a full Ar gas flow (250 ml min'^) into
the tube from the two inlets (Figure 2.6) helping to remove the waste products.^"
There is no gas flow during the atomisation step in order to increase the
length of time the atoms are present in the light path. These three factors of rapid
furnace heating, gas stop during atomisation and the L'Vov platform are all part of
the STPF concept.
60
Figure 2.7 ; Diagram of a HGA (Perkin Elmer design) graphite tube showing
integral L'vov platform
VcKiage
Figure 2.8 : A HGA graphite tube plus contacts and showing the temperature
profile of tube during heating
61
2.3.3.2 THGA versus HGA configurations
The original graphite tube furnace was developed by L'Vov. The furnace
tube was 10 cm long and internally lined with a tantalum foil.
The sample was
placed onto a graphite electrode, dried, and then introduced with the electrode
into the graphite tube. The tube was heated by resistance heating an the sample
was atomised by a direct current arc. The whole arrangement was mounted in a
sealed argon chamber with quartz windows to allow the radiation to pass through
the system.
Massmann^"^ simplified the whole furnace design, with a 5 cm long graphite
tube, but the tube was a heated by passing a high current (500 A) at a low voltage
(10 v) through the tube.
This arrangement permitted a very fine temperature
adjustments could be made which facilitated the selection of the optimum
temperature for each individual element.
The furnace had to be continuously
flushed with an inert gas stream to prevent the ingress of air.^^
Virtually all proprietary graphite furnaces are based upon the Massmann
design, i.e. they are tube furnaces heated by resistance heating. However, alt the
designs differ in the tube dimensions, in programmability, in flexibility and in
operating conveniences.^^ Figure 2.7 shows a Heated Graphite Atomiser (HGA)
Perkin Elmer design with an integrated LVov platform.
This original design was improved, but it was still known to have several
limitations in its design.
One of these limitations being the
temperature
distribution along the graphite tube {Figure 2.8) which was not uniform due to the
contact of the tube with the water cooled contact cylinders.
Even with using the L'Vov platform and a pre-atomisation cool down step,
the non-isothermal temperature distribution leads to memory effects for refractory
62
elements, gas phase interference, matrix and analyte condensation at the cooler
ends of the tube.'"^
To overcome these problems, the transversely heated graphite atomiser
(THGA) was developed.
This design evolved from the side heated constant
temperature furnace as described by Freeh et al.^^^ This new design provides a
uniform temperature distribution over the entire length of the tube i.e. the ends of
the tube are at the same temperature as the centre of the tube {Figure
2.5).
Under these conditions, the formation of free atoms is optimum and recombination
of atoms to molecules, the loss of atoms and condensation at cooler tube ends,
and memory effects are effectively avoided.^'*''
2.3.4 Optical Systems
2.3.4.1 Single or double beam optical layout
The layout of the optical system in a modern AA instrument, can be one of
two configurations :- either single or double beam.
In a single beam instrument, the light from the source passes through the
atomisation cell and then passes directly to the monochromator and hence onto
the detector. In the double beam instrument, the light from the source is split into
two by a rotating sectored mirror^"^ or a beam splitter.^^^
One beam then goes
through the atomisation cell, while the other beam is sent around the atomisation
cell. The beams of light are then recombined after the atomisation cell, and then
as in the single beam instrument pass into the monochromator and onto the
detector.
The ratio between the alternative beams is then compared and a
correction made for any fluctuations in the s i g n a l . T h e double beam instrument
63
has the advantage over the single beam instrument in that it allows for the
correction of any HCL fluctuations (warm-up, drift and signal noise) which leads to
Improved precision in the final meausrement.^''^
Both instruments used in this study have a single beam / single path optical
design, but the systems are described as having a double beam measurement
system'^^ ' ^ due to >
i) The AC modulated radiation source and magnetic field allow the
measurement of the background and analyte signals consecutively every
18 ms, and
ii) The background and analyte signals are measured at exactly the same
wavelength.
2.3.4.2 Monochromators
The device which isolates monochromatic light of a particular wavelength
from polychromatic light^"*® is known as a monochromator.
The function of the
monochromator is to isolate the resonance line of the light source from the nonabsorbing lines close to it, that may have been caused by the fill gas or by the
atomisation source.^"*^
Various monochromator designs exist such as Czerny-
Turner/"^ Ebert Mounting^^ and Llttrow.^^° The configuration used in the Model
4100ZL ETAAS instrument^"" is a Littrow monochromator with a reflecting grating
blazed at two wavelengths 236 nm and 597 nm for operation in the UV and visible
regions respectively. It is shown schematically in Figure 2.3.
64
2.3.4.3 Poiychromators
As the SIMAA 6000 is a multi-element instrument, a monochromator is of
no use as many different wavelengths have to be monitored during the
measurement cycle, therefore the monochromator is replaced by a polychromator.
A polychromator is basically a monochromator which has had the exit slit
removed so that the complete spectrum is focused in the image plane.
This
spectrally dispersed polychromatic radiation can then fall upon the detector (in
this case a diode array) which allows the measurement
over the
whole
s p e c t r u m . I n this instrument (SIMAA 6000), the light is reflected through the
entrance slit, off a collimating mirror and then through a quartz prism and onto an
echelle grating. The echelle grating disperses the parallel radiation of incidence
light into a greater number of interference orders. The light then comes off the
grating back through the prism and then reflects off a camera mirror and then
directly onto the solid state detector which is located on the focal plane.^^ This
optical pathway is shown clearly in Figure 2.4. The system can also be used as a
monochromator, with the camera mirror slewing until the light falls onto the correct
detector.
2.3.5 Detectors
The use of photographic plates and gas filled photocells as detectors has
become obsolete, ^'^^ since photomultiplier tubes^''®'^'*^"^^ have become almost
universal in atomic spectrometry instruments.
However, the newer instruments
are now starting to use charge transfer devices and diode array detectors which
potentially offer the ability to measure all the wavelengths simultaneously.^^^^^
65
2.3.5.1 Photomultiplier tubes
A photomultiplier tube (PMT) contains a photosensitive cathode, an anode
and a series of special emitting cathodes called dynodes.
The cathode and all
the anodes are sealed inside a vacuum tube, with a transparent window above the
photosensitive cathode to allow the radiation to enter the tube.^^®"^^^
The
wavelength
range
covered
by
each
PMT
depends
upon
the
composition of the photocathode.^^^ The most common material used is Ga-As
which covers almost all the range from As at 193.7 nm to Ca at 852 nm with
reasonable sensitivity.^^® The Model 4100ZL uses a broad band photomultiplier
with a UV transmitting window.^""
2.3.5.2 Diode array detectors
A photodiode allows the full spectral range to be measured, unlike the
PMTs which only have specific ranges. A photodiode is a single crystal silicon
chip.
When spectrally dispersed light falls on the diode, it produces a
photocurrent which is proportional to the intensity and duration of light. This then
discharges the connected capacitor^^ and hence the measurement can be made.
The detector used on the SIMAA 6000 is a specially designed cluster of 61
diodes spread over the focal plane, with 38 primary lines (and number of
important secondary lines) being c o v e r e d . A paper by Radziuk et a/.^^^ reviews
the design, the performance and the results for the diode array detector used in
the SIMAA 6000.
66
2.3.6 Data handling and electronics
Two of the requirements of the STPF concept are fast
instrument
electronics and signal integration. The fast electronics are needed to follow the
absorbance profile, which can last for 5 or 7 seconds, but to produce a smooth
profile, a background corrected signal is measured every 16 to 20 milliseconds.
Also, to ensure the profile is correctly measured, an accurate baseline must be
measured before the absorbance profile is measured.
Signal integration is needed to give better and more precise analytical
measurements of the analyte peaks. As the rate of vaporisation of the analyte
depends upon its matrix, if the standard and sample are in different matrixes then
peak height measurements are going to vary which will cause errors.
Integrated
absorbance values can correct for any variances in the rate of vaporisation. An
added benefit of this, is the freedom from matrix interferences which can mean
that a lower atomisation temperature is needed, and this can extend the linear
range of the calibration graph.
2.3.7 Background correction methods
The occurrence of absorbance and scatter from molecular species can be
overcome by the use of various background correction methods.
Three of the
most commonly used are described here,^''^ but the main emphasis is on Zeeman
effect background correction as this is the system used by both instruments used
in this study.
More detailed descriptions of background correction methods can
be found in a book by Welz.^"*^
67
2.3.7.1 Continuum (Deuterium) background correction
In the deuterium background correction system, a rotating mirror allows
only one beam, either from the HCL or the deuterium lamp, to pass through the
sample atomic vapour at any one time. The broad band non-specific background
absorption can then absorb radiation from both light beams.
The detector then
measures the background signal only (deuterium lamp) and subtracts this from
the analyte signal and background signal (element HCL) to give a corrected
absorbance signal due only to the element of interest.^'^^^
The three main problems with this approach are
i) the deuterium emission profile must be optically aligned with the element
specific emission line, i.e. they must have identical optical pathways, and
ii) the background absorption specific profile is considered uniform across
the monochromator slit, /.e. it has no structure, and
iii) when
the
level of background
absorption
increases
above
0.4
absorbance. then the electronic subtraction of the background signal
becomes less accurate.
2.3.7.2. Smith - HIeftje background correction
This method of background correction is of especial use when there Is a
strong molecular interference e.g. phosphate on Se at 196.0 nm.
If the hollow
cathode lamp is run at its normal operating current, then atomic and molecular
absorption by the analyte and interferents will occur in the atomiser.
68
If however.
the lamps is pulsed periodically at much higher currents, self absorption In the
lamp prevents virtually all the atomic absorption in the atomiser, but leaves the
molecular absorption.
The corrected atomic signal may therefore be gained by
subtraction. This method unfortunately leads to accelerated wear of the lamp.^ ' ^
2.3.7.3 Zeeman effect background correction
The splitting effect of a magnetic field on a spectral line was first
discovered by the Dutch physicist Zeeman in 1897.^"*^
The Zeeman effect
background correction is part of the STPF concept. When the Zeeman effect Is
used, it tends to make the furnace measurements more independent of the matrix
of the sample.
Zeeman
background
correction
can
be
divided
into
six
different
configurations. The configurations are determined :-
i) by the position of the magnet (Direct or Inverse).
In Direct Zeeman, the
magnet is placed around the light source and for Inverse Zeeman, the
magnet is placed around the atomisation cell,
ii) in which plane the magnet acts upon the excited atom (Transverse
Longitudinal).
or
When the magnetic field is applied perpendicular to the
radiation (Transverse Zeeman), when the magnetic field is parallel to the
radiation (Longitudinal Zeeman), and
iii) by the type of power supply (alternating
or direct current) which is
determined by the requirements of the instrument.
69
In the simplest case of the Zeeman effect, the single spectral line is split
into three components; a central n component whose energy and frequency is
unchanged with respect to the original level, and two a components of slightly
higher and lower energy respectively. These are called the a+ and a- and are to
the left and right of the original spectral line, /'e. at higher and lower frequencies
(Figure
density.
2.9).
The extent of the shift depends upon the applied magnetic flux
Simultaneous to this splitting of the spectral lines, the radiation is also
polarised depending upon the direction of the applied magnetic field.
Afom ctoud
'A--:
N
yifhout
IH
magnehc Fieid
Longitudinal
ZEEMAN effect
Transverse
ZEEMAN effect
I
•
I
Vo
Figure 2.9 : Zeeman diagrams showing n and a components for Transverse
and Longitudinal Zeeman arrangements^^^
If the radiation is observed in a direction perpendicular to the magnetic field
or if the magnetic field is applied at right angles to the radiation beam, the n
component is polarised in a direction parallel to the magnetic field, while the a
70
components are polarised in a plane perpendicular to the magnetic field. This is
the Transverse configuration (Figure 2.9).
Magnetic field ON
Magnetic field O F F
/
X
/
Absorption
Absorption
Absorption
profile
Absorption
profile
component
component
Source emission
line
Source
L
VQ - analytical wavelengtti
Figure
o
o
emission line
^0
2,10 : Background correction with the longitudinal Zeeman effect
arrangement
139
When the direction of observation is parallel to the magnetic field, or the
magnetic field is parallel to the
radiation
beam, this
is the
Longitudinal
configuration {Figure 2.9), and this has the effect of removing the K component
from the spectrum and only the circularly polarised a+ and a- components are
observed.
During each measurement cycle, there are two light phases, and the
magnetic field is on for one and off for the other. With the magnetic field on, the
analyte signal is split into the two shifted a components and the "unseen" K
component.
The two a components cannot absorb the energy at the analytical
71
wavelength, and the n component, not having an effect in the longitudinal
direction, also cannot absorb energy at the analytical wavelength (Figure
2.10).^^
Any attenuation of radiation at the analytical wavelength is thus due only to
the background (structured or continuous).
With the magnetic field off, any attenuation of the radiation at the analytical
wavelength is due to absorption by the single analyte signal in addition to any
attenuation due to the background (structured and / or continuous).
This
procedure of rapidly alternating measurements of [analyte and background] and
[background only), at exactly the same wavelength during the measurement cycle
is sufficient to minimise errors due to drift (Figure 2.10).^^^
A more detailed
description of the application of Zeeman background correction is given in a book
by Welz.'^'
2.4
Sample introduction and manipulation using automated flow
injection system
This section describes the automated flow injection system (FIAS 400)
system and the sample pretreatment stages performed in this study.
A general
description of the FIAS and the experimental procedures adopted will be given in
this section, while the specific information for each different experiment will be
given in the respective chapters.
element
determinations
(FIAS
Each of the two configurations i.e. single
with
Model
4100ZL)
and
multi
element
determinations (FIAS with SIMAA 6000) will be described, including basic default
conditions, diagrams of the configuration and the procedures used for the sample
manipulation.
72
2.4.1
Flow injection analysis system
All sample manipulations, from the pumping of the sample from the
autosampler to the injection of the sample into the graphite tube were handled by
the flow injection analysis system (FIAS 400), and the AS-90/91 autosamplers.
The FIAS 400 consists of two peristaltic pumps, one valve (either a five or
an eight port). When used for cold vapour / hydride analysis, a gas valve and
flow meter are also required. The FIAS unit for all the experiments in this study
was controlled by the computer attached to the spectrometer. The two pumps are
fully controllable from 20 to 120 rpm (in single steps), and can be used with a
wide range of different internal diameter tubing which gives rise to precise control
over the flow rates from 0.5 ml min'^ to 12 ml min'^ for typical applications.
INJECT
Waste
Detector
Carrier
Detector
Carrier
1?
Sample
Sample Loop
Figure 2.11 : A schematic diagram of the five port valve showing the "Fill"
and "Inject positions" when used for mercury and hydride forming element
determinations
73
The basic five port valve was used in the cold vapour / hydride forming
elements (CV / HFE) determinations, while the eight port valve was used for the
on-line
column
preconcentration
studies
when
more
control
and
flexible
manipulation was required for the on-line methodologies. Both valves have only
two positions, "Fill" and "Inject", as shown by the five port valve in Figure 2.11.
A flow of purge gas (argon) into the manifold is used to flush the mercury
vapour / hydride into the atomisation cell. The gas valve allows adjustment of the
gas flow from 0 to 250 ml min V
For cold vapour and hydride analysis, a manifold kit containing mixing
blocks and the gas liquid separator (GLS) was used, along with an electrically
heated mantle to hold the quartz cell. The two autosamplers, Perkin Elmer AS-90
and AS-91, were used with different trays, which allowed a variety of different
sample volumes (large 50 ml and small 15 ml) to be held ready for analysis.
2.4.1.1 Furnace flow injection system coupling
The physical connection between the furnace and the FIAS 400 depended
upon the analyte being analysed. The simplest coupling was that used for the
determination of mercury (Chapter 3).
The outlet of the gas liquid separator
(GLS) was simply connected to the inlet of the quartz tube with a piece of PTFE
tubing. Once the mercury vapour had been generated, the argon gas flushed the
mercury from the GLS, through the tubing into the quartz cell. The measurement
step started as soon as the valve has been switched to the "Inject" position.
74
For the in atomiser trapping of the hydride forming elements (HFE), the
coupling required the use of the sampler arm to move the delivery tube in and out
of the furnace. The PTFE capillary of the AS-72 autosampler was disconnected
from the autosampler arm and was replaced by a PTFE capillary with a quartz tip.
The quartz tip was connected to the sampler arm and the other end of the PTFE
tube was connected to the GLS.
The quartz tipped capillary was carefully
adjusted so as to inject the hydrides over the heated platform of the THGA without
touching the platform or the tube walls. The optimum distance between the quartz
tip and the heated platform surface was about 1.5 mm.
The coupling for the on-line preconcentration work was slightly more
difficult, as a defined volume of ethanol was to be injected into the tube. The set
up of the delivery tube was identical to that of the in atomiser trapping work except
that the delivery tube was connected to one of the valve ports and not to the GLS.
To prevent dispersion of the eluent slug, the distance between the graphite
tube and the eight port valve was kept to a minimum, which meant the FIAS 400
unit was elevated from its normal position, to a position were the top of the valve
was slightly below the graphite tube and so the eluent "slug" had a slight upward
slope to the tube.
The smallest possible diameter PTFE tubing was used, to
minimise the total internal volume of the delivery tube.
This
optimisation
procedure is discussed further in Section 5.3.4.2.
The eight port valve allowed the use of a defined sample loop, therefore all
of the eluent could be injected into the furnace^®'"^ and not just the most
concentrated sub sample as previously used by other workers.^^
75
2.4.2
Configuration of flow injection system and ETAAS for mercury
determination
In Chapter Three, the FIAS 400 was set up with the five port valve and the
manifold kit, where the gas liquid separator was attached directly to the quartz cell
as shown in Figure 2.12. The Model 4100ZL had the furnace head removed and
an electrically heated mantle containing the quartz cell, was placed in the light
path instead.
Quartz Cell
Pump 1
Ar
Waste
5 way
valve
Manifold
Carrier
Reductant
Waste
Pump 2
Gas-liquid separator
©©©©©©©©
©©©©©©©
Autosampler
Figure 2.12 : Flow injection system configuration for mercury determination
by cold vapour atomic absorption spectrometry
76
Both instruments were controlled via an Epson EL2 computer with the
Perkin Elmer FIAS-Furnace Version 7.21 software operated in the FIAS only
mode. This allowed the software to control the FIAS functions i.e. the speed of
the pumps and the switching of the valve.
The software also controlled the
temperature of the mantle and the quartz tube.
2.4.2.1 Operating procedure for mercury determination
The FIAS 400 uses a three step program in order to fulfil the two separate
operations of loading and then injecting the known sample volume into the carrier
stream. The default FIAS program is shown in Table 2.1.
Step No
Time
Pump 1
Pump 2
/ sees
/ rpm
/ rpm
Prefill
20
100
120
Fill
1
10
100
120
Fill
2
20
0
120
Inject
Valve
Read
Read
Tabie 2,1: Default flow injection system program for mercury determination
Solution
Pump Tubing
Pump Tubing
colour code
i.d. / mm
blue / yellow
1.52
red / red
1.14
Waste from G L S
white / black
3.18
Waste from valve
blue / yellow
1.52
Carrier
Reductant
Table 2.2 : Default set up conditions for mercury determination
77
In the prefill step, a time of 20 seconds was used to allow all the solution
present in the tubing to be flushed to waste by the new solution drawn in from the
reservoirs.
In Step 1, a sampling time of 10 seconds was used during which the
mercury sample / standard solution was drawn into the sample loop (500 ^1) with
the five way valve in the "Fill" position.
Meanwhile the carrier and reductant
solution were continuously passed through the manifold to the gas
liquid
separator.
In Step 2. an injection time of 20 seconds was employed to allow the
reaction to go to completion.
The five way valve was then switched into the
"Inject" position, pump No.1 stopped, leaving pump No 2 to pass the carrier
stream through the sample loop, which introduced the 500 |il volume of sample
and transported it to the first section of the manifold. At this convergence point,
the carrier stream and sample merged with the reductant.
The reaction mixture
then continues through the reaction coil together with the gaseous mercury
vapour and hydrogen gas produced as a by-product. The mixture then flowed into
the second section of the manifold where it meets the argon carrier gas prior to
entering the gas-liquid separator The mercury vapour was then transported with
the argon carrier gas to the top of the gas-liquid separator, through a 0.45 nm
PTFE membrane filter (Schleicher + Schuell, Dassel, Germany) and into the
quartz cell placed in line with the mercury hollow cathode lamp. The filter was
placed between the gas-liquid separator and the quartz cell to prevent any
aerosol droplets from reaching the cell which could decrease the precision of the
measurement.
78
Sequence
Operation
A
Run FIAS steps 1 to 1
B
Run furnace step1 with FIAS step 2
C
Move AS arm into furnace for FIAS steps 3 to 3
D
Move AS arm out of furnace
E
Stop FIAS pumps
F
Run furnace steps 2 to 4
Table 2.3 : Sequence control program for hydride determination
2.4.3 Configuration of flow injection system and ETAAS for multi
element determinations
The next two sections describe the two different configurations used with
the FiAS 400 and the SIMAA 6000 for in atomiser trapping and on-line column
preconcentration.
2.4.3.1 "In atomiser" trapping of hydride forming elements
For the study described in Chapter Four, the FIAS 400 was set up with a
five port valve and the manifold kit. However, one end of the delivery tube was
connected to the autosampler arm and the other end was attached to the top of
the gas liquid separator.
This coupling is described in more detail in Section
2.4.1.1.
Both instruments were controlled by a computer running Perkin Elmer AA
Winlab software, operating in the flow injection-furnace mode. The rotation speed
79
of the pumps, their stop / go intervals, the actuation of the injection valve and the
interaction of the autosampler arm were controlled by the sequence program
shown in Table 2.3. The program is made up of simple statements which issue a
command to the FIAS or the furnace, or in some cases, both. The default furnace
and FIAS programs are shown in Tables 2.4 and 2.5, respectively. The furnace
temperatures in steps 1-3 are chosen automatically by the software when the
elements to be determined are selected.
Step 4 is always 2300°C when Ir is
being used as the trapping agent.
Step
Temperature
Ramp Time
Hold Time
G a s Flow
rc
Is
Is
/ ml min"^
1
250
1
60
0
2
250
1
20
250
3
2000
0
5
0
4
2300
1
3
250
Table 2.4 : Default furnace program for the determination of Bi and Se
Step No
Time
Pump 1
Pump 2
Is
/ rpm
/ rpm
Prefill
20
100
0
Fill
1
10
100
0
Fill
2
5
100
80
Fill
3
20
0
80
Inject
Valve
Tab!e 2 . 5 ; Default flow injection system program for hydride generation
80
2.4.3.2 Operating procedure for multi-element hydride generation
The combined Fl procedure and synchronisation of the atomiser time /
temperature program was controlled by the sequence in Table 2.3.
The whole
preconcentration and furnace operation took 2 minutes and consisted of seven
individual steps.
The preconcentration process started with the sample loop
being filled with fresh sample, and ended with the sequestration of the hydride
upon the tube and finally the atomisation and measurement step in the graphite
tube.
The furnace operation started with the trapping step, followed by a
conventional furnace program of drying / ashing, atomisation and a clean out
step. The atomiser ran for 88 seconds which included a 60 second trapping time
and the FIAS ran for 55 seconds. Before the first replicate of any new sample, the
Prefill Step (Pump No 2) pumped fresh sample into the sample loop from the
sample reservoir expelling any previous sample left in the tubing to waste. This
prefill step was automatically omitted for replicate determinations on the same
sample.
The FIAS set up is identical to Figure 2.12 except the quartz cell is
replaced by a graphite tube.
Sequence A : Sample solution pumped (FIAS Step 1, pump No 1) from the
autosampler vessel to fill the 500 |il sample loop, excess sample to waste.
Sequence B : Furnace Step 1, the tube is preheated to 250 or 300 ''C, i.e.
the trapping temperature.
In parallel, FIAS Step 2 (pump No 2) pumped
fresh carrier and reductant solutions into the manifold, and the argon gas
swept the GLS clean, pump No 1, completed the sample loading.
81
Sequence C : The autosampler arm moved the quartz pipette tip from the
standby position into the graphite tube, (tip approximately 1.5 mm from the
platform surface).
FIAS Step 3 switched the valve from the "Fill" to the
"Inject" position, and the sample was mixed with the carrier stream followed
by the tetrahydroborate solution and argon gas and passed through a
reaction coil. The mixture entered the GLS where the hydride vapour was
swept into the graphite tube by the argon gas flow, and the waste was
pumped out.
Between the GLS and the delivery tube, was a PTFE
membrane filter to prevent excessive moisture from entering the graphite
tube.
Furnace Step 1 maintained the tube at the defined trapping
temperature.
Sequence D : The autosampler arm moved back to its standby position.
Sequence E : Both pumps on the FIAS were stopped to reduce reagent
and sample consumption.
Sequence F : The atomiser time / temperature program {i.e. Steps 2 to 4)
ran to completion. The second step was a drying step to remove excess
hydrogen and any water vapour before the atomisation step (Step 3). The
clean-out step (Step 4) cleaned the tube before the next sample was
trapped.
A maximum temperature of 2300''C was used to prevent the
iridium coating from being removed.
2.4.3.3 Multi-element on-line column preconcentration
For the study described in Chapter Five, the FIAS 400 was set up with the
eight port valve, but connected to the SIMAA 6000 as in Section 2.4.3.7, although
82
the delivery tube was connected directly to the eight port valve and not to the gasliquid separator.
Both instruments were controlled by a computer running Perkin Elmer AA
Winlab software, operating in the flow injection-furnace mode. The rotation speed
of the pumps, their stop / go intervals, the actuation of the injection valve and the
interaction of the autosampler arm was programmed and controlled by the
sequence program shown in Table 2.6.
Sequence
Operation
A
Run FIAS steps 1 to 4
B
Move AS arm into furnace for FIAS steps 5 to 5
C
Run FIAS steps 5 to 5
D
Move AS arm out of furnace
E
Stop FIAS pumps
F
Run furnace steps 1 to 5
Table 2.6 : Sequence control program for on-line column preconcentration
The program consisted of simple statements which issue a command to the
FIAS or the furnace or in some cases, both, which allows a greater control of the
whole preconcentration process.
The default furnace and FIAS programs are
shown in Tables 2.7 and 2.8 respectively.
The furnace temperatures in steps 3
and 4 were chosen automatically by the software when the elements to be
determined were selected.
83
step
Temperature
Ramp Time
Hold Time
G a s Flow
rc
/s
is
/ ml min*^
1
110
0
45
250
2
130
5
75
250
3
400
10
20
250
4
2300
0
5
0
5
2400
1
2
250
Tabie 2.7 : Default furnace program for the determination. The pyrolysis
temperature is determined by Cd and the atomisation temperature by Ni.
Step No
Time
Pump 1
Pump 2
Is
/ rpm
/ rpm
Prefill
60
0
20
Inject
1
60
0
20
Fill
2
20
0
20
Inject
3
40
60
0
Inject
4
10
10
0
Fill
5
90
20
0
Inject
Table 2.8 ;
Valve
Default flow injection system program for on-line column
preconcentration
2.4.3.4 Operating procedure for on-line column preconcentration
The combined Fl procedure and synchronisation of the atomiser time /
temperature program was controlled by the sequence in Tabie 2.6.
The whole
operation (seven individual steps) took 7 minutes, from the prefill step and
84
finished with the measurement step. The atomiser ran for 150 seconds with two
minutes drying time to remove the ethanol without spluttering, and the FIAS ran
for almost four minutes. Before the first replicate of any new sample, the Prefill
step (Pump No 2) pumped fresh sample / complexing agent and acid washing
solution from the reservoirs through the tubing, expelling any previous sample to
waste. This prefill step was automatically omitted for replicate determinations on
the same sample.
A schematic diagram of the FIAS set up is shown in Figure
2.13 a+b for the multi-element column preconcentration operation.
P u m p No 1
Air
Ethanol
Eluent Loop
Nitric Acid
W
Clean Up Column
DDDC
Sample
P u m p No 2
Eight port valve in Inject position
W = Waste. AC = Analytical Column, ET = To ETAAS
Figure
2.13a : Flow injection system configuration on-line multi-element
preconcentration by electrothermal atomic absorption spectrometry
85
P u m p No 1
Air
Ethanol
Nitric Acid
DDDC
Sample
P u m p No 2
Eight port valve in Fill position
W = Waste. AC = Analytical Column, ET = To ETAAS
Figure 2.13b : Flow injection system configuration on-line multi-element
preconcentration by electrothermal atomic absorption spectrometry
Sequence A : With the valve in the "Fill" position, the first four FIAS steps
were started.
In Step1, the preconcentration step, the sample and
complexing agent (Pump No 2) were pumped through the column while the
acid washing solution flowed to waste. After the preconcentration time, the
valve moved to the "Inject" position and the acid washing solution (Step 2)
was pumped through the column to remove any matrix that may have been
left on the column or in the tubing. In the third step. Pump No 1 stopped
and Pump No 2 propelled air across the column to dry it and expel any
solutions left in the delivery tube to waste.
86
The fourth step involved the
valve moving to the "Fill" position and the ethanol was pumped (Pump No
1) to fill the sample loop.
Sequence B : The autosampler arm moved the quartz pipette tip from the
standby position into the graphite tube.
Sequence C : FIAS Step 5 switched the valve to the "Inject" position. The
ethanol was propelled (Pump No 1) by a slow steady stream of air, from the
sample loop through the column desorbing the metal - DOC complex and
injecting it into the furnace.
Sequence D : The autosampler arm moved back to its standby position.
Sequence E : Both pumps on the FIAS were stopped to reduce reagent
and sample consumption.
Sequence
completion.
F :
The atomiser time / temperature (i.e. steps 1-5) ran to
Two drying steps were used to ensure that the ethanol was
evaporated off slowly without spluttering. The pyrolysis step was included
to remove the organic complexing agent before the atomisation and
measurement step.
87
Chapter Three :
Deternfiination of Mercury
88
Chapter Three : Determination of Mercury
3.1
Introduction
This chapter describes the development of an off-line microwave digestion
sample pre-treatment
procedure for the determination
of total mercury
in
environmental and biological samples by flow injection cold vapour atomic
absorption spectrometry (FI-CVAAS).
The chapter is split into four main sections. The introduction section gives
an overview of the background behind determining mercury in real samples and
looks at some of the problems that were identified and resolved before the work
was completed.
The second section is the experimental section detailing the
reagents, the instrumentation used, (if not already been discussed in Chapter
Two) and the operating parameters and reagents used.
The results section
details the many different stages used in optimising the system, and the validation
of the method using appropriate certified reference materials (CRMs).
It also
contains the various procedures used to analyse the real samples, and includes a
brief investigation into some of the known interferences when using sodium
tetrahydroborate as the reducing agent for this type of analysis. The final part of
the chapter is the conclusion section, which discusses the merits of the proposed
system and the conclusions for this stage of the work.
89
3.1.1 Introduction to the determination of mercury
The determination of mercury in the natural environment has long been
recognised as important when assessing environmental quality. The rapid growth
in agricultural and industrial activity has resulted in chemical pollution.
In this
context mercury is one of the most toxic elements and can produce serious and
irreversible d a m a g e . ' ^
However, the accurate determination of mercury in real
samples is not without its difficulties and precautions are required at all stages of
the analysis.
Relatively poor analytical sensitivity and contamination during the
analytical procedure combine to give unreliable mercury concentrations.'^^
As mentioned in Section 1.4, the analytical technique for determining
mercury is based upon its unique properties. Mercury can easily be reduced to
the metal from its compounds by SnCb or NaBH4.
The mercury vapour may be
entrained in a stream of inert gas or air and measured by atomic absorption of the
cold vapour without the need of an atomiser or a flame.^^^
3.1.2 Problems associated with the determination of mercury
When reviewing the current literature associated with the determination of
mercury, various problems were identified.
These problems included achieving
sufficiently low detection limits, choosing the best analytical methodology, and
digestion process to correctly analyse the environmental and biological samples
for total mercury content.
90
3.1.2.1 Detection limit
The direct determination of mercury by atomic spectrometry can be
problematic.
For example, the determination of mercury by flame atomic
absorption spectrometry (FAAS) is limited to high concentrations of mercury owing
to the poor detection limit offered by the technique (200 lag 1'^), whilst the use of
electrothermal atomic absorption spectrometry (ETAAS), although offering better
detection limits (2 |ag I'Y suffers from matrix interferences since the high volatility
of mercury restricts the ashing temperature.^^
One of the most common analytical approaches for the determination of
total
mercury
at
lower
concentrations
is
cold
vapour
spectrometry (CVAAS) as mentioned in Section 3.1.1.
atomic
absorption
This approach offers a
detection limit^^ in the order of 0.008 |jg 1'^ and is based upon the reduction of
inorganic mercury by tin" or tetrahydroborate.
Due to the low detection limit,
CVAAS was selected as the measurement technique for use in this study.
Flow
injection analysis (FIA) methodology was also employed to automate the sample
introduction to the CVAAS. thereby improving sample throughput as well as
accuracy and precision.
3.1.2.2 Analytical Methodology
Zhu et a//^ developed a method which could determine total mercury at
sub
ng
ml'^
levels
in environmental
tetrahydroborate as the reductant.
samples
by
CVAAS
using
sodium
The analysis of the samples was performed
on-line but the pre-digestion stage was performed off-line.
Other papers have
reported the determination of mercury by CVAAS in biological materials^^'^^ and
91
sediments^®^'^^ and give a valuable insight into the procedures used, highlighting
the pitfalls to avoid in the analytical method under investigation.
Three relevant papers to this study have been published by various
workers in Germany.
These concerned the use of automated flow injection
systems for the on-line decomposition of mercury in urine following the addition of
KMn04 and bromate / bromide reagent®^ and the on-line microwave digestion of
mercury by CVAAS in blood and urine samples.®^"^^^ These studies highlighted
several problems that might occur with the use of automated on-line flow injection
systems, such as evolution of gases during digestion, short reaction time and
incomplete digestion of organic matter. It was therefore decided to use an off-line
digestion technique instead of an on-line technique as this would simplify the
procedure.
Since CVAAS was chosen as the method of analysis, there are two primary
pre-requisites to be satisfied, if it is to be used successfully and volatilisation
losses are to be avoided. These are :-
i) sufficient oxidation of the organic matter present in the sample to
liberate the mercury from the matrix, and
ii) the quantitative production of a single labile mercury species (e.g. Hg")
which can afterwards be reduced quantitatively to Hg° for spectrometric
evaluation.
If
these
conditions
are
not
achieved,
serious
underestimation of the total mercury concentration may result.^^
It is generally agreed that oxidative conversion of all forms of mercury in
environmental and biological samples to Hg" is necessary prior to reduction to
elemental mercury.®^'^^^®"
Sodium tetrahydroborate is often preferred as the
92
reducing agent because it offers rapid liberation of the mercury vapour from the
liquid phase, and is effective with organic compounds that are not reduced to the
metal by tin" chloride/^
Therefore, sodium tetrahydroborate was used as the
reductant since it fulfilled the two primary requisites slightly better than the tin"
chloride.
3.1.2.3 Digestion techniques and mixtures
The direct determination of mercury in environmental and
biological
materials may be problematic as a result of the matrix effects encountered,
particularly with solid samples. The accurate determination of mercury in these
materials usually requires the decomposition of the matrix and the conversion of
mercury to the inorganic divalent form. Two types of decomposition method have
been employed for this purpose, i.e. wet digestion and dry
a s h i n g . D r y
ashing is not suitable for mercury determinations because of the low boiling point
of mercury and its associated compounds.
Consequently wet digestion using
either relatively low temperatures (<100''C) or higher temperatures (230*'C) with
an appropriate
successfully.
selection of oxidising acid mixtures
have
been
employed
However such methods can be quite lengthy because of the many
steps required and may be prone to contamination. Thus wet digestion methods
have increasingly been succeeded by microwave assisted digestion methods,
which offer rapid sample preparation, increased sample throughput, reduced risk
of contamination and reduced reagent consumption.
The microwave assisted
digestion methods have previously been employed for a number of environmental
and biological matrixes. ^^^'^^^
93
Various workers have used a bewildering combination of strong acids (HCI,
H2SO4, H N O 3 . H3PO4 and HCIO4), oxidants (H2O2. KMn04. KjCrzO?. and K z S z O s ) ,
as well as UV irradiation and elevated temperatures in order to ensure complete
digestion and separation of the analyte from the parent matrix.
The various
combinations favoured in the literature are stated in Table 3.1.
Reagents
HNO3
H N O 3 . H2SO4, H2O2
H N O 3 . H2O2
HNO3.HF. HCI
Table
Ref
160.167.169-171
167.171-172
172
Ref
167
HCI. H N O 3 . H2O2
H N O 3 . K2S2OB. H2O2
H N O 3 . H3PO4, H2O2
167
3,1 : Combination
Reagents
reagents
172
171)
H N O 3 H2SO4
of digestion
172
used
for
microwave
decomposition of environmental and biological samples
The most popular digestion reagent has been nitric acid but a mixture of
nitric acid, sulphuric acid and hydrogen peroxide is also favoured. A review by
Adeloju et a/.^^^ evaluated four commonly used wet digestion mixtures for the
determination of mercury in biological and environmental matrixes with analysis
by cold vapour atomic absorption spectrometry (CVAAS).
The four mixtures evaluated in this study were,
i) nitric acid and hydrogen peroxide,
ii) nitric acid only,
iii) nitric acid and perchloric acid, and
iv) nitric acid and sulphuric acid.
94
Adeloju ef a/.^^ indicated that a mixture of HNO3 and H2SO4 gave the most
accurate and reproducible analytical data when applied to a range of biological
and environmental CRMs.
The mixture was also suitable for the reliable
determination of mercury in soil samples.
The digestion was performed by an off-line microwave digestion technique
using the digestion mixtures chosen.
Clearly, as the method should ideally be
simple to operate, the digestion mixture chosen should be equally applicable to all
the samples being investigated.
3.1.3 Experimental Aims
The main aim of this study was to develop a simple method to determine
total mercury in environmental and biological samples.
The method had to
include a digestion procedure that ensured that all the mercury from the sample
was available for analysis.
The accuracy and precision of the method was
validated by analysing appropriate CRMs and by performing an interference study
as well as analysing real samples.
3.2
Instrumentation
3.2.1 Furnace and flow injection system configuration
A
Perkin-Elmer
Model
4100ZL
atomic
absorption
spectrometer
in
conjunction with a Perkin-Elmer FIAS 400 flow injection analysis system and an
AS-90 autosampler were used in this study. The system was operated through an
95
Epson EL2 computer and the associated Perkin-Elmer software, Version 7.21. An
Epson FX-850 printer was used to print the results and signal traces.
The
spectrometer was set up using the optimised operating conditions shown in Table
3.2. The FIAS program is stated in Table 3.3 and the optimised flow rates and
tubing are described in Table 3.4.
Lamp
Mercury Hollow Cathode Lamp
Lamp Current
6 mA
Spectral band pass
0.7 nm
Wavelength
253.7 nm
Cell Temperature
100X
Integration Time
20 seconds
Read Time Delay
none
Baseline Offset Correction
2 seconds
Table 3.2 : Instrumental operating conditions for electrothermal atomic
absorption spectrometer
Step No
Time
Pump 1
Pump 2
Is
/ rpm
/ rpm
Prefill
20
100
120
Fill
1
10
100
120
Fill
2
20
0
120
Inject
Table
3.3
:
Optimised
program
for
determination of mercury
96
the
Valve
flow
injection
Read
Read
system
for
Solution
Carrier
Reductant
Waste
from
gas
Pump Tubing
Pump Tubing
Flow Rate
colour code
i.d / mm
/ ml min*^
blue / yellow
1.52
11.5
red / red
1.14
6.4
white / black
3.18
18.8
blue / yellow
1.52
7.5
-
-
100
liquid separator
Waste from valve
Argon gas
Sample intake
8.1
Table 3.4 ; Optimised pump tubing and flow rates for the flow injection
system
3.2.2 Microwave instrumentation
All of the microwave digestions were performed with an unmodified 750W
domestic microwave oven (Tecnolec T200M). The oven power (0-100% power in
25% increments) and time range (0-30 minutes) were set manually.
The
microwave oven was placed in a laboratory fume cupboard whilst the digestion
stage was in progress.
Screw capped 60 ml PTFE digestion vessels (Saviller, Minnesota, USA)
were used. These were cleaned prior to use with concentrated nitric acid in the
microwave at full power for 60 seconds. The vessels were rinsed thoroughly with
distilled water and dried prior to use.
97
3.2.3 Quartz cell
The quartz cell (length 160 mm x i.d. 7.5 mm) was housed inside an
electrically heated mantle with the temperature set at 100**C to prevent any build
up of water vapour inside the cell which would interfere with the measurement of
the mercury signal.
3.2.4 Atomic Fluorescence instrumentation
In the comparison experiment described in Section 3.3.5.2, the system
used was a Merlin atomic fluorescence detector with a commercial hydride
generator, both supplied by P.S. Analytical, Orpington. Kent, The whole system
was controlled by a computer equipped with Touchstone software unit (P.S.
Analytical, Orpington, Kent).
The hydride generator consisted of a peristaltic
pump delivering three streams, (reductant, carrier and blank solutions) to a
switching valve and a type B gas liquid separator (GLS).
optimised conditions for the hydride generator.
Table 3.5 gives the
The detector consisted of a
boosted mercury hollow cathode lamp (wavelength 254.7 nm) and a non solar
blind (IP 28) photomultiplier tube with a 254 nm interference filter, which detected
the focused emission from the atomisation cell which consisted of a cylindrical
hydrogen argon flame with a sheath gas of argon.
98
3.2.4.1 Procedure for the atomic fluorescence measurement
The measurement procedure had four separate steps. The first step was
the delay time (25 seconds), where the reductant and the blank solution were
pumped through the system until they met at the gas - liquid separator (GLS) to
establish a baseline signal. The sample solution was pumped to waste during this
step.
The next step was the nse time (30 seconds) where the valve switched so
that the sample and reductant mixed in the GLS. The mercury vapour produced
was flushed from the GLS to the detector by a stream of argon gas. The blank
solution then flowed to waste. The analytical signal starts to rise to a maximum.
Solution
Reagent
Flow Rate
/ ml min*^
Blank solution
3% (v/v) Hydrochloric acid
3.0
Carrier solution
3% (v/v) Hydrochloric acid
7.0
Reductant solution
1 % (m/v) Sodium tetrahydroborate in 0.5%
3.0
(m/v) Sodium hydroxide
Sheath Gas
Argon gas
300
earner Gas
Argon gas
300
Table 3.5 ; Optimised conditions for the hydride generator with atomic
fluorescence detection
99
In the analysis step (30 seconds), the conditions were identical to the rise
time, and so a steady state signal was obtained. The next step was the memory
step (60 seconds) where the valve was switched back to its original positions i.e.
the blank solution and the reductant flowing to the GLS flushing the system and
allowing the signal to return to baseline.
Quantification of the analytical signal was calculated by the Touchstone
software by taking peak area measurements from the steady state signals
obtained.
3.2.5 Reagents
All reagents used were of analytical grade (BDH Laboratory Supplies.
Poole, Dorset, UK) unless othenA/ise stated.
Double distilled water was used
throughout.
Reductant solution : 0.2% (w/v) NaBH4 in 0.05% (w/v) NaOH
The solution was prepared by first dissolving 0.5 grams of sodium
hydroxide pellets and then 2.0 grams of sodium tetrahydroborate in 1000 ml of
distilled water.
The solution was stirred and then filtered before use.
This
solution was prepared daily.
Carrier Solution : 3% (v/v) HCI
The solution was prepared by adding 30 ml of concentrated hydrochloric
acid to a 1000 ml volumetric flask and making up to volume with doubly distilled
water.
100
Stabilising Solution : 5% (w/v) KMn04
A stock solution was prepared by dissolving 5.0 grams of potassium
permanganate (Speclrosol grade, BDH Ltd) in 100 ml of doubly distilled water.
Two drops of this stabilising solution was added to every 100 ml of standard
solution. This stock solution could be kept for 1 month in a dark glass bottle.
Standard Mercury Solutions :
The standard solutions of inorganic Hg" were prepared by stepwise dilution
from a stock standard solution containing 1001 ± 2 mg 1"^ Hg as Hg(N03)2.H20
(BDH Spectrosoi). Ail standards were freshly prepared prior to use.
Diluent Solution : 2% (v/v) HNO3 + 2% (v/v) H2SO4
This solution was prepared by slowly adding 20 ml of concentrated nitric
acid and 20 ml of concentrated sulphuric acid to approximately 900 ml of doubly
distilled water and then making up to 1000 ml, once the solution had cooled down.
All the sample and standard solutions were made up using this diluent
solution. To prevent any loss of mercury through adsorption onto the containers
walls, 1 ml of concentrated hydrochloric acid per 100 ml of sample solution was
added. The hydrochloric acid concentration was kept to a minimum to prevent the
premature reduction of the potassium permanganate.
Digestion Mixture Reagents :
The reagents used in the various digestion procedures were concentrated
sulphuric and nitric acids and 30% hydrogen peroxide.
Carrier G a s :
The carrier gas used in all experiments was argon gas with a purity of more
than 99.95% (Cryospeed. BOC Limited. Plymouth, UK.)
101
Certified Reference Materials :
The certified reference materials used in this study were DORM-1 dogfish
muscle reference material and MESS-2 estuarine sediment. Both of these CRMs
were purchased from National Research Council Canada, Ottawa, Canada.
3.3 Optimising the system
Once the furnace and the flow injection system (FIAS 400) were set up
using the default conditions stated in the Section 2.3.2.1, the coupled instrument
was optimised for the basic parameters, such as reductant / carrier flow rates,
sample loop volume and argon gas carrier flow to maximise the analyte signal.
Once the basic parameters had been optimised, the system could be evaluated
using mercury standard solutions to determine the linearity and the sensitivity of
the method for the determination of total mercury.
3.3.1 Optimisation of flow rates
The tubing was put under tension and when the reagents were flowing
smoothly through the tubing, the flow rates were determined by measuring the
uptake of water at the various pump speeds.
The recommended carrier to
reductant ratio as stated in the literature^" is 2 : 1, but the optimised flow rate for
this study was 1.8 : 1.
A high (100 ng 1'^) mercury standard was used (for maximum response) to
determine the optimum gas flow by ensuring that the full peak (signal) was within
the 20 second time window. The optimum flow rate was found to be 100 ml min"^
102
since this gave good symmetrical peak shapes and the tail of the peak returned to
the baseline within the time window.
3.3.2 Determination of linearity for mercury by FI-CVAAS
Using the 100 ng 1*^ mercury standard as an initial maximum, a range of
mercury standards (0-100 jig 1'^) were analysed to determine the linear range for
the method. Figure 3.1 depicts the calibration graph which shows that there is a
good correlation for the line of best fit over the 0-60 lag 1'^ range, but for standards
over 60 ^g 1'^ {Figure 3.2), the calibration is not linear and shows a tendency to
become parallel to the baseline.
Table 3.6 shows the calibration data over the
working linear range.
Standard
Mean Peak
Std Devn
RSD
Height
\ig r' of Hg
/A
0
0.005
1.00x10*^
20.0
5
0.041
1.53x10'^
3.7
10
0.091
1.53x10"^
1.7
20
0.182
5.00 xlO-'
2.7
40
0.336
3.79x10"^
1.1
50
0.415
8.02x10"^
1.9
60
n =5
0.480
6.11 xlO"^
1.3
1%
Table 3.6 : Linear calibration data over the range 0-60 jig 1'^ for mercury by
FI-CVAAS
103
3.3.3 Analysis of Certificated Reference Materials
In order to check that the proposed method was valid for real samples
appropriate Certificated Reference Materials (CRMs) as described in Section
3.2.4 were analysed.
These were chosen to reflect the matrix and mercury
concentration expected in the samples. The two reference materials chosen for
this purpose were :I) NBS 1646 Estuarine Sediment
Certified concentration of mercury
0.063 ± 0.012 mg kg"^
II) DORM-1 Dogfish Reference Muscle
Certified concentration of mercury
0.798 ± 0.074 mg kg"^
3.3.3.1 First analysis of Certified Reference Materials
The two CRMs (NBS 1646 and DORM-1) were first analysed by direct
calibration after the microwave digestion stage. Only two replicates were run in
the first experiment, and from these experiment results, a recovery could be
calculated from the known certified values.
Blank digested sample were also
determined using the same conditions and reagents but minus any CRM sample,
and a blank solution of 3% (v/v) HCL were run to check for any contamination in
the carrier solution.
104
Mercury Calibration Graph
(0 - 60 ng l ')
y = O.OOSx + 0.0092
R^ = 0.9981
^
Mean PH
Unear (Mean PH)
20
30
40
50
60
Cone (ng 1"^)
Figure 3.1: Linear calibration range (0-60 \ig V^) for mercury by FI-CVAAS
Mercury Calibration Graph
(0-100^gr^)
^tean PH
40
60
100
Cone (nQ 1"^)
Figure 3.2 ; Complete range (0-100 ng 1'^) for mercury by FI-CVAAS
105
Initially using the results from Section 3.1.2.3, three digestion mixtures
were used i.e. i) HNO3 only, ii) HNO3 and H2O2, and iii) HNO3, H2SO4 and H2O2.
Mixture iii) was rejected for operator safety reasons as when the digestion mixture
was added a violent reaction occurred causing loss of sample from the digestion
bomb. Mixtures i) and ii) gave reasonable results, but the combined mixture of
HNO3 and H202gave lower blank values than nitric acid only. Once, the digestion
mixture had been added, the lids were put on the bombs and they were left
overnight to allow any organic matter to oxidise before they were irradiated. The
results shown in Table 3.7 are for the digestion mixture of 3 ml cone nitric acid
and 1 ml of 30% hydrogen peroxide.
The next morning, the PTFE bombs were irradiated for a total of 4 minutes
in 1 minute bursts, with 2 minutes standing time between each bursts. After a two
hours cooling down time, the DORM-1 digested mixture was made up to 25 mi in a
calibrated flask with the diluent solution, while the NBS 1646 digestion mixture
was made up to 10 ml.
These volumes were chosen to ensure that the
concentration of mercury in the solution would fall within the calibration range.
Calculated Result
DORM-1
Recovery
Certified Value
mg kg*' of Hg
%
mg k g ' of Hg ^
0.699 ± 0 . 0 1 0
87.6
0.798 ±0.074
144.4
0.063 ±0.012
NBS 1646
0.091 +0.008
Mean and one standard deviation
* Mean and 95% confidence limits
Table 3.7 ; Direct calibration results for mercury in NBS 1646 and DORM-1
certified reference materials
106
3.3.3.2 Conclusion
From these results, it can be seen that both CRMs gave results outside the
certified ranges. This would indicate that either :-
i) there was a contamination problem,
ii) there was an Interference problem, or
iii) that the digestion process was not releasing all the mercury from the
sample matrix.
In order to overcome these problems, two different approaches were used.
The first approach was to analyse the CRMs by the method of standard additions.
The second approach was to try alternative digestion mixtures, previously
identified in Section 3.1.2.3.
The certified values are given for corrected mass,
therefore a weight loss experiment was conducted to find the weight loss for each
CRM, and therefore corrections could applied to the experimental values so the
two sets of values could be directly compared.
The % weight loss results are
given in Table 3.8.
Sample
% Weight L o s s
DORM-1
14.65
MESS-2
1.44
NBS 1646
2.54
Table 3.8 : Weight loss results for all the certified reference materials
107
3.3.4. Analysis of CRMs by Standard Addition
From each unspiked digestion. 4.0 ml of solution was transferred to a clean
sample vial and 4.0 ml of a standard solution (either 0, 1.0, 2.0, 10.0 lag 1'^) was
added. The mean peak height of each sample was then plotted against half the
added standard concentration (i.e. 0, 0.5, 1.0, 5.0 ^g 1'^). The direct and standard
addition calibration graphs are shown in Figure 3.3 for NBS 1646 and Figure 3.4
for DORM-1. A standard calibration graph (Table 3.9) was used in the range of 010 ^g
(n = 4 for each standard) for this experiment.
Standard
Mean Peak Height
n g 1 ' Hg
/ Abs
Blank
0.002
5.8
X
10"^
38.5
1
0.012
0.0
X
10"^
0.0
2
0.021
5.0x10-^
2.4
5
0.052
0.0
X
10'^
0.0
10
0.101
5.0
X
lO'"
0.5
Std Devn
RSD
/%
(n = 4)
Table 3,9 : Standard calibration graph for mercury
Due to the limited sample size, the samples were only analysed in
duplicate (n = 2).
Table 3.10 shows the standard addition data for both CRMs.
Table 3.11 shows the results for the standard addition method along with the
previously obtained direct calibration data for comparison
108
Addition of Hg
Mean Peak Height
Std Devn
/A
RSD
/%
DORM-1
0
0.030
7.0
X
10"*
2.4
1
0.033
1.4
X
10"^
4.3
2
0.037
0.0
X
10"*
0.0
10
0.070
7.0x10"*
1.0
0
0.007
0.0x10"*
0.0
1
0.012
7.0
X
10"*
6.2
2
0.016
7.0
X
10"*
4.6
7.0
X
10"*
2.7
NBS 1646
10
0.053
(n = 2)
Certified value for Hg
DORM-1 0.798 ± 0.074 mg kg*
NBS 1646 0.063 ± 0.012 mg kg'*
Table 3,10 : Standard addition analysis data obtained from NBS 1646 and
DORM-1 Certified Reference Materials
3.3.4.1 Conclusion to standard addition experiments
The recovery for NBS 1646 was reasonable (120.6 % ) . but the direct
calibration gave results greater than the certified value for mercury, while the
result by the standard addition method is only just outside the certified range
{Table 3,11).
In both cases, the gradients are similar indicating that there was no
(or a minor) interference present. It was possible that the elevated values may be
due to something present in the digested sample mixture enhancing the mercury
signal. It was unlikely to be due to the contamination of the vessels or reagents.
109
as the blank digested samples (HNO3 and H2O2) show little or no signals when
analysed.
DORM-1
Calibration
Standard
Std Add
Graph
Additions
Recovery
mg kg ^ of Hg **
mg kg'^ of Hg **
/%
mg kg"^ of Hg *
0.699 ± 0 . 0 1 0
0.418 ±0.015
84.0
0.798 ±0.074
102.3
0.063 ±0.012
NBS 1646
0.091 ±0.008
0.076 ± 0 . 0 1 0
Mean and one standard deviation
* Mean and 95% confidence limits
Certified Value
Table 3,11 : A comparison of direct and standard addition results with
recovery results for the standard additions experiment
The recovery for DORM-1 was poor (52.3 % ) . The direct calibration gave a
low result which was about 0.1 mg kg*^ lower than the certified result of 0.798 mg
kg"\ and the standard addition method showed about half the expected certified
value (Table 3.11).
Again, the gradients of the mercury calibration lines are
similar, Indicating a minor or no interference present. These results indicated that
for the DORM-1 analysis, not all the mercury was being released from the matrix.
110
NBS 1646 Standard Addition
Experiment
y = 0.0092X + 0.0071
= 0.9999
-, • J^^V^^
y = 0.01x +0.0018
= 0.9995
•
•
Cone(ng r )
Mean PH
NBS 1646
Unear (Mean PH)
NBS 1646
Figure 3.3 : Standard addition calibration graph for NBS 1646 Certified
Reference Material
DORM-1 Standard Addition
Experiment
0.07
0.06
0.05
y =0.0081 X +0.0293
= 0.9992
0.04
CO
03
0.03
-cr
0.02
y =0.01 X +0.0018
R 2 = 0.9995
0.01
0
1
2
Conc{pg r^) '
Figure
«
O
MeanFH
DORM-1
Linear (Mean PH)
DORM-1
3.4 ; Standard addition calibration graph for DORM-1 Certified
Reference Material
111
3.3.5 Further analysis of Certified Reference Materials
3.3.5.1 Analysis of MESS-2 Certified Reference Material
The sediment certified reference material NBS 1646 used in the first part of
this study (Section 3.3.3), once exhausted was no longer available from NIST.
Unfortunately the replacement CRM, NBS 1646a is not certified for mercury.
Therefore an alternative sediment CRM, MESS-2 was acquired.
This has a
certified total mercury value of 0.092 ± 0.009 mg k g ' \
Practical Result
Certified Value
mg kg*^ of Hg
mg kg"^ of Hg *
0.077 + 0.016
0.063 ±0.012
MESS-2
0.085 ±0.015
Mean and one standard deviation
* Mean and 95% confidence limits
0.092 ±0.009
NBS 1646
Table 3.12 : Experimental results for mercury in both sediment certified
reference materials
The previous results obtained using NBS 1646 sediment were very close to
but outside the certified range (Table 3.12).
It was felt that a different digestion
mixture would improve the accuracy of the analysis. The new digestion mixture
used was 2.5 ml concentrated H2SO4, 2.5 ml concentrated HNO3 and 1.0 ml of
30% H2O2 and the irradiation time was 4 minutes.
The total volume of the
digestion mixture was increased from 4 ml to 6 ml to ensure that all the sample /
CRM was covered by the acid mixture. Before the analysis, the sample solutions
112
were de-gassed (See Section 3.3.5.2).
With these new conditions, a result (Table
3.12) was obtained which was within the certified range.
3.3.5.2 Analysis of DORM-1 Certified Reference Material
It was noted (Section 3.3.3.1) that poor results were obtained following
microwave digestion of DORM-1. The problem was thought to originate in one of
three areas :-
i) an interference in the quartz cell,
ii) incomplete conversion of Hg" to Hg° in the reaction manifold, or
iii) incomplete digestion of the sample in the closed vessel.
With a closed vessel digestion stage, any gases (e.g. nitrogen oxides)
produced during the procedure are kept within the vessel and become redissolved when the mixture cools down.
Since the Model 4100ZL graphite
furnace when used with the quartz cell, does not have the background correction
facility available, the dissolved gases may cause interference and nitrogen oxides
will scavenge the reductant preventing complete reduction of the mercury.^^"* To
remove this, the digestion mixtures should be de-gassed before analysis in an
ultra-sonic bath.^^^ This procedure was introduced at the start of this experimental
stage.
The incomplete conversion of Hg" to Hg° was thought to be very unlikely
since sodium tetrahydroborate is a very effective reductant. and has been used
successfully by many other workers.^^"®^'^^^'^
Also when the FIAS system was
optimised initially, the calculated characteristic mass (mo) values for the standards
113
were in good agreement with the published characteristic
mass values,^"
indicating that full conversion of Hg" to Hg° was achieved in the manifold.
The remaining possibility was therefore incomplete digestion within the
digestion vessel. To investigate this, the digested mixtures were first analysed by
an alternative analytical technique under similar conditions.
This was done in
order to ensure that the effect was not specific to the instrument used rather than
the microwave digestion procedure.
Atomic fluorescence spectrometry (AFS), was selected for this purpose.
However, careful consideration was given to the other techniques available,
before AFS was chosen.
The five options considered were :-
i) atomic fluorescence spectrometry (APS).
ii) inductively coupled plasma-mass spectrometry (ICP-MS).
iii) inductively coupled plasma-atomic emission spectrometry (ICP-AES).
iv) electrothermal atomic absorption spectrometry (ETAAS).
v) flame atomic absorption spectrometry (FAAS).
The latter three techniques (iii, iv and v) did not offer the required detection
limit to handle the very low mercury concentration in the sample.
ICP-MS has a
suitable detection limit, but the instrumentation is complex and requires the
addition of an on-line scrubber in the gas-line to achieve the required detection
limits. This left AFS. which provides suitable detection limits and the advantage of
being simple to use.
The mercury vapour is produced on-line with sodium
114
tetrahydroborate as the reductant and hydrochloric acid as the carrier, so the
basic chemistry of the AFS system is identical to that of the proposed method.
The instrumentation used for this study is described in Section 3.2.4.
The
system was optimised with a 1 ng 1'^ mercury standard. Due to the larger sample
size required for each determination, the samples could only be run in duplicate
and not triplicate as for the FIA system.
The results of the comparison test between analytical techniques (Table
3.13), indicated that the problem originated from the digestion of the sample
within the digestion vessel, since both analytical experiments produced similar
results. Thus the microwave was not breaking down all the mercury containing
compounds to a form that could be analysed by the FI-CVAAS system. To solve
this problem the digestion mixture and the irradiation time were re-evaluated to
see if a more effective combination could be found.
FIAS Result
mg kg-^ of Hg *'
DORM-1
A F S Result
Certified Value
mg kg'^ of Hg
mg kg"^ of Hg *
0.660 ± 0.042
0.512 ± 0 . 0 8 9
0.798 ± 0.074
* Mean and 95% confidence limits
Table 3.13 : Results obtained for mercury in DORM-1 certified reference
material by atomic fluorescence and FI-CVAAS
115
3.3.6 Final evaluation of DORM-1 digestion procedure
Following the comparison tests, the digestion procedure for the DORM-1
CRM was re-evaluated.
Previously the digestion mixture used consisted of
concentrated nitric acid and 30% hydrogen peroxide.
However, in
Section
3.7.2.3, concentrated nitric and sulphuric acid with hydrogen peroxide was
identified as a suitable digestion mixture, and the results in Section 3.3.5.1, prove
that it works well.
However this digestion mixture proved problematic (i.e.
excessive and rapid effervescence) when adding the concentrated sulphuric acid
to the DORM-1 and sample.
For the digestion of biological samples, a mixture of HNO3 and H2O2 is
commonly used by many w o r k e r s . T h i s
mixture had been thed in an
earlier study but was rejected due to a interference problem which affected only
the digested samples. However, following the introduction of a de-gassing stage
at the end of the digestion procedure, this problem could potentially be overcome.
The analysis was repeated with the digestion mixture of 5 ml concentrated
nithc acid and 1 ml of 30 % hydrogen peroxide.
The total volume of digestion
mixture was again increased from 4 ml to 6 ml to immerse all of the sample. The
first variable to be examined was the length of time the sample was irradiated by
the microwave. At first, 4 minutes was used and the results obtained were lower
than the certified values. This was increased to 5 minutes and results within the
certified range were obtained. The sample was irradiated in 30 second bursts
instead of the original 60 second bursts, to allow the bomb to be heated gently
and to stabilise between irradiation bursts.
116
The results obtained using this
procedure can be seen in Table 3.14 and the conditions used are summarised in
Table 3.15.
Irradiation Time
4 minutes
Practical Value
Certified Value
mg kg'^ of Hg **
mg kg'^ of Hg *
0.646 ± 0 . 0 1 0
0.798 ±0.074
5 minutes
0.771 ±0.028
Mean and one standard deviation
* Mean and 95% confidence limits
Table 3.14 : Results obtained for different microwave irradiation times for
the digestion of DORM-1 certified reference material
Environmental
Biological
/.e. sediment
/.e. fish tissue
Nitric acid
2.5 ml
5 ml
Sulphuric acid
2.5 ml
None
1 ml
1 ml
4 mins
5 mins
Hydrogen peroxide
Irradiation Time
Table 3.15
: Summary of conditions for the closed vessel microwave
digestion procedure of environmental and biological samples
3.3.7 Interference study for mercury determinations
The last stage of this study examined the effect of a number of potential
interferences on the method described above.
117
It is known that the transition
metals and the hydride-forming elements may interfere with the determination of
mercury.^^^"^^ The selectivity of the proposed method was therefore investigated
by use of a mercury standard (10 |ig 1'') in the presence of the various interferents
(Ag. As. Cd, Cu. Ni, Pb. Sb and Se).
The results of the study are shown in Table 3.16. It can be seen that silver
and selenium had a suppression effect, whilst all the other interferences had a
small enhancement effect.
However, the levels at which the interference was
noted (with the exception of silver) was at least 2 orders of magnitude greater
than that of mercury and not considered to be a major problem when determining
mercury in environmental and biological samples.
Added
Hg cone
interferent
found
/ mg 1'
/ ng I'
/ ng I"'
Ag(l)
1.0
9.02
-0.98
Suppression
As(v)
2.0
10.02
+ 0.02
Enhancement
Cd(ll)
5.0
10.44
+ 0.44
Enhancement
Cu(ll)
2.0
10.32
+ 0.32
Enhancement
Ni(ll)
10.0
10.35
+ 0.35
Enhancement
Pb(")
Sb{V)
5.0
10.44
+ 0.44
Enhancement
2.0
10.44
+ 0.44
Enhancement
Se(VI)
1.0
9.77
-0.23
Suppression
Error
Interference
effect
Table 3.16 : Results of interference study on the determination of mercury by
FI-CVAAS
118
3.4 Analysis of environmental and biological samples
The analysis of two different types of samples were evaluated by the
method, environmental (sediments) and biological (tuna fish) samples.
As
indicated by the analysis of the appropriate CRMs, each type of sample required
a different digestion mixture as well as a different sample pre-treatment strategy
to ensure that any mercury present in the sample remained in the sample and was
not lost during the pre-treatment stage.
3.4.1 Analysis of sediment samples
The method previously validated using the certified reference materials,
was evaluated for real samples. It was decided to analyse sediment samples with
a low mercury content (0.1 mg kg'^) and a high mercury content (2-3 mg kg"^).
The low mercury content sediment samples were collected from the River
Avon, Devon at the Saltham estuary.
Three different sampling positions were
chosen from the estuary. These were :-
i) estuarine river bed within the main flow of the river,
ii) inlet river bank 20 cm above the waterline and
iii) inlet river bed.
The high level mercury content sediment samples were collected from the
River Mersey, Liverpool. Again three different sampling sites were chosen and
these were :-
119
i) up river from the power station
ii) directly opposite the power station
iii) down river from the power station
To prevent any contamination, all the high density plastic bottles (Nalgene,
Rochester NY, USA.) used for the sample collection were cleaned with 1 mol 1*^
nitric acid before use and then rinsed three times with double distilled water and
dried at room temperature.
Once collected and back in the laboratory, the samples were air dried at
30''C to prevent any mercury escaping from the sample matrix during the drying
stage. The sample was then placed in a two tower sieve system consisting of a
top sieve of 2.00 mm and a bottom sieve of 710 jam. The top sieve removed any
large stones, foreign matter and vegetation. The sample that passed through this
first sieve was ground up using mortar and pestle, and placed into the bottom
sieve to provide a fine homogenous sample of the river sediment, which could be
used for the analysis. Also, before drying, a portion was taken from each sample
to perform a weight loss experiment, so that the values obtained could be
corrected for moisture loss. The results obtained are given in Table 3.17.
Sediment sample
% Weight L o s s
Mersey A
53.20
Mersey B
48.93
Mersey C
25.63
Avon A
50.39
Avon B
49.71
Avon C
48.38
Table 3.17: % Weight loss results for all sediment samples
120
The samples were left to digest slowly overnight in the hydrogen peroxide
acid mixture and then analysed immediately after they were irradiated. A recovery
experiment was run on all three of the samples, 1 ml of 100 ng 1"^ Hg being added
to each sample (spike = 4 |ig 1"^) and left to soak for 2 hours before the digestion
stage.
% Recovery = 100 x ((Spiked Sample - Unspiked) / Spiking level]
3.4.1.1 Digestion procedure
The environmental samples (ca. 0.25 grams) were weighed directly into the
digestion vessel and then the digestion mixture was carefully added to the vessel.
The digestion mixture used for the environmental samples was 2.5 ml of
concentrated nitric acid. 2.5 ml of concentrated sulphuric acid and 1.0 ml of
hydrogen peroxide.
The hydrogen peroxide was added last and very slowly to
prevent the initial reaction from occurring too vigorously.
The vessel was left
loosely capped overnight to ensure that excessive pressure did not build up when
placed in the microwave oven due to the oxidation of any organic matter in the
sediment.
The following morning the lid of the bomb was tightened and the bomb
placed in the microwave oven for 2 x 30 seconds at medium power. After this time
the bomb was inspected to make sure that the seal was still intact. If the seal was
damaged the entire digestion procedure was repeated, but if the seal was intact
the bomb was irradiated in 30 seconds bursts for a total of 4 minutes. The bomb
was then left to cool for approximately 1-2 hours.
121
The digestion mixture was then carefully transferred to a 25 ml volumetric
flask, together with washings from the bomb (2% nitric acid / 2 % sulphuric acid
solution). Once the solutions had been made up to volume, the volumetric flasks
were placed in an ultrasonic bath and left for 30 minutes to de-gas. The samples
were then transferred into the autosampler vials ready for analysis. The results
obtained from this study are shown in Tables 3.18 and 3.19.
Sample
Result ^
RSD
Spiked Result
Spiked
Recovery
mg k g ' of Hg"
%
mg kg'^ of Hg **
%
Mersey 1
2.99 + 0.05
1.2
6.92 ± 0 . 0 3
98.3
Mersey II
2.36 + 0.04
1.4
6.01 ± 0 . 0 2
91.3
Mersey III
2.02 ± 0 . 0 3
1.2
5.81 ± 0 . 0 3
Mean and one standard deviation (n = 6)
Spiking level 4 yig 1'^
94.7
Table 3.18 : Total mercury concentration in River Mersey sediments
Sample
Result ^
RSD
Spiked Result
Spiked
Recovery
mg kg"^ of Hg "
%
mg kg'^ of Hg **
%
Avon 1
0.19 ± 0 . 0 5
6.1
3.91 ± 0 . 0 4
93.5
Avon II
0.12 ± 0 . 0 5
9.1
3.98 ± 0 . 0 3
96.5
Avon III
0.10 ± 0 . 0 5
8.4
4.38 ± 0 . 0 3
Mean and one standard deviation (n = 6)
Spiking level 4 lag 1'^
Table 3.19 : Total mercury concentration in River Avon sediments
122
107.8
3.4.2 Analysis of biological samples
The biological samples analysed were canned tuna fish.
The tuna fish
samples required a different pre-treatment procedure to that for the sediment
samples in order to prevent the mercury escaping from the matrix during the
drying stage. This pre-treatment stage is detailed in Section 3.4.2.1.
Once this
stage had been completed, the biological samples were subjected to the same
digestion procedure as that used for the sediment samples (Section
3.4.1.1)
although a different digestion mixture was used as detailed in Table 3.15.
3.4.2.1 Biological sample pre-treatment
The tuna fish were first drained to remove the brine solution. The sample
was then pre-trealed by freezing in a domestic freezer at -10*'C for 6 hours. After
this time, it was transferred to a freezer dryer (Edward's Supermodulyo Model
12K, West Sussex, UK ).
The sample was placed in the vacuum chamber,
(evacuated to 0.8 x 10'^ millibar) and left there for 48 hours. The condensation
trap was set at -50**C.
The sample was then finely ground using a mortar and pestle and stored in
a pre-cleaned screw capped plastic bottle (Nalgene, Rochester NY, USA.). Some
of the original sample was retained in its original form to allow mass loss
experiments to be performed in order to quote the results on a dry mass basis.
The results from the weight loss experiments {Table 3.20) give a correction factor
to take into account any moisture present in the original sample when it was
123
weighted out for analysis.
The biological results obtained are shown in Table
3.21.
3.5 Conclusion
The objective of this investigation was to develop a sensitive and accurate
analytical method for the determination of total mercury in environmental and
biological samples by flow injection cold vapour atomic absorption spectrometry.
Cold vapour atomic absorption spectrometry (CVAAS) was used because
of its ease of operation, its low detection limits compared with other techniques,
and its suitability for use on-line with a flow injection analysis system. The use of
flow injection in conjunction with the CVAAS technique enables the rapid analysis
of between 20 and 30 samples per hour. The results of the interference study,
although not exhaustive, show that the method is relatively robust with regard to
the selected elements, and in most cases gave less than 5% error when their
concentration was at least 2 orders of magnitude greater than that of mercury.
The method offers a detection limit of 0.2 ng g'^ (3x SD of baseline (blank) signal),
a relative standard deviation for real samples of less than 10%, and has been
validated using two certified reference materials (DORM-1 Dogfish and MESS-2
Estuarine Sediment) with the results agreeing well with the certified values.
Fish sample
% Weight L o s s
Tuna 1
66.41
Tuna 2
66.36
Table 3.20: % Weight L o s s for tuna fish samples
124
Sample
Result ^
RSD
Spiked Result
Spiked
Recovery
mg kg ^ of Hg"
%
mg kg'^ of Hg
%
1.00±0.16
1.6
4.72 ± 0 . 1 2
93.0
Fish 2
0.92 ± 0 . 1 7
3.4
4.56 + 0.14
Mean and one standard deviation (n = )
Spiking level 4 ng 1'^
91.0
Fish 1
Table 3.21: Total mercury concentration in tuna fish
Fundamental to this study was the choice of the best digestion technique.
The use of microwave digestion had several advantages over conventional
digestion techniques.
The digestion stage was completed in under 5 minutes
following a pre-digestion stage, where the digest was left to stand overnight to
facilitate the breakdown of any organic matter present prior to irradiating the
sample. The pre-digestion stage, clearly lengthens the sample preparation step,
however the microwave technique is comparable to the conventional wet digestion
techniques in terms of time, and is quicker than conventional cold digestion
techniques which can take up to a week. The microwave technique is also less
demanding upon human resources since it requires less supervision of the
digestion process
By coupling the sensitivity of CVAAS to the automated flow injection
system, this method offers considerable savings in both time and labour over
conventional batch analysis. Although the coupling of CVAAS and Fl is not totally
novel, most of the previous reports in the literature are for clinical applications
involving the measurement of total mercury in liquid samples e.g. blood and urine,
and not for the analysis of complex matrix environmental samples as reported
here.
125
Chapter Four : Multi element
determination of Hydride
Forming Elements
126
Chapter Four : Multi element determination of
Hydride Forming Elements
4.1
Introduction
This chapter describes the investigations of multi-element "in atomiser"
trapping of hydride forming elements. The chapter is split into four sections. The
first section is an introduction to the subject of multi-element analysis techniques
and briefly looks at the optimum conditions for hydride generation. The second
section is the expehmental section detailing the reagents, the instruments used (if
not already discussed in Chapter 2) and the operating parameters and reagents
used.
The results section contains the results for each of the three linked
investigations performed in this study.
The three experiments are summarised
below.
Experiment
1 :
Initial investigations into multi-element "in atomiser"
trapping on an iridium coated graphite tube.
Only two elements were tested,
bismuth and selenium.
Experiment
2 :
Following the success of the first experiment, the next
experiment was to see how many and which elements could be analysed together.
Three more elements were added, mercury, arsenic and antimony.
Experiment 3 : This final experiment drew together the knowledge from the
first two experiments, and applied this to practical applications using lake water
samples.
The method was validated
by analysing appropriate
127
reference
materials. The long term stability of the method, interferences and the choice of
trapping material were also investigated.
Finally, the conclusion summarises the results obtained and discusses the
advantages and disadvantages of the developed application.
4.1.1 Multi-element analysis
Traditionally, the technique of "in atomiser" trapping with atomic absorption
spectrometry detection has been a single element technique due to the nature of
the element specific hydride generation chemistry, and methods have been
reported for all the hydride forming elements.
However,
there
are
reports
of
simultaneous
multi-element
generation determinations with ICP-AES/''®"'^® and ICP-MS.'®^''®'
hydride
Sturgeon and
Gregoire^^^ discussed the use of collection of hydrides on a graphite surface
followed by electrothermal vaporisation coupled with ICP-MS.
Even with direct
introduction of the hydrides into a FI-ICP-AES or FI-ICP-MS system, compromises
are required as these systems are based upon measuring the hydrides as they
are passed directly into the plasma, and consequently fast transient signals are
obtained.
Two applications have been described with AA techniques.
Garbos et a/.
A paper by
described the determination of two elements (As and Se) together
on a Zr coated graphite tube and Kraus^^ described some preliminary research
into the determination of A s \ S e ' \ Sb^ and Hg" in lake water.
For sequential single element determination of the hydride
forming
elements, the instrumental and hydride forming conditions can be fully optimised
for each individual element.^^ But no individual set of optimised conditions can
128
be used for the simultaneously multi-element determinations, therefore a key
requirement is achieving compromise conditions.
The selection of instrumental
parameters is relatively easily achieved by taking the lowest trapping temperature
and the highest atomisation temperature from the optimum instrumental conditions
for the group of elements to be determined.
The hydride generation conditions
are very similar for each element, v^^ith NaBH4 being used as a common reducing
agent and HCL being used as the carrier solution.
The chemistry behind the
hydride generation is discussed in more detail in Section 4.1.2.
4.1.2 Conditions for hydride formation
The issue of the hydride forming chemistries is more difficult and there are
{\f\/o critical areas that have to be considered; reduction of the analytes to the most
sensitive oxidation state and the hydride generation chemistry.
The latter of
these, generating the hydrides, is somewhat easier to control.
The preferred
reductant is usually sodium tetrahydroborate because it has a fast reaction time
(10-30 s), it can be used for all eight of the HFEs and in addition, it can be added
in solution form.^^^ As long as there is a sufficient excess of tetrahydroborate
available to the analyte in the manifold, and the reductant solution remains stable,
there
are
usually few
problems.
The
only
problem
with
using
sodium
tetrahydroborate as the reductant, is that it is hydrolysed in aqueous solution, so
to prevent this hydrolysis, the reagent is stabilised in a solution of sodium
hydroxide. The normal acidic carrier stream is hydrochloric acid.
It is well known that the optimum sensitivity in hydride generation is
obtained when the analyte is in a low oxidation state.
The problem in analysis
arises because the analytes to be determined may be present in various oxidation
129
states (e.g. As'" + A s \ Sb'" + Sb"". Se"" + Se""). The reduction of the analyte to the
hydride can occur at different rates depending upon the original oxidation state of
the analyte prior to reduction (e.g. As^ has about 70-80% of the sensitivity of As'",
while Sb^ is about 50% of the sensitivity of Sb'"
hydride while Se'^ does).^®®
and S e ^ does not form the
Therefore the sensitivity of the element being
determined will depend upon the oxidation state of the analyte in the sample.
Kraus^^ studied the simultaneous determination of As, Sb, Se and Hg by inatomiser trapping ETAAS using by careful adjustment of the various chemistries.
In the experimental work described here in this thesis. As and Sb were in the
higher oxidation states and Hg and Se in the lower oxidation states.
The
objectives of the work presented in this chapter were to build on this previously
unpublished work and assess the performance of the multi-element approach
when all the elements were present in their most lowest oxidation states.
4.1.2.1 Optimum oxidation states for hydride forming elements
In the past, workers have used either potassium iodide'®^ or a mixture of
potassium iodide and ascorbic acid^^ to reduce As^ to As'", but more recently, Lcysteine has been favoured^®^^®^ as it is compatible with flow injection systems
and is used with lower reagent (0.5-2.0% (m/v)) and acid concentrations.
The
advantages of L-cysteine^^^ over the other reductants used previously are :-
i) the reduction of As / Sb^ to the trivalent oxidation state is faster and
more efficient.'^^'^^^
ii) L-cysteine helps to stabilise the analyte solutions,^®®-^^^
130
lii) L-cysteine is used in low (< 1 mol 1'^ HCI) acid conditions which leads to
milder hydride generation conditions resulting in less hydrogen being
produced in the manifold/®^"^^^and
iv) there is a higher tolerance to interferences
192
These seemed to be clear advantages which were felt to be worth
examining in this study.
For selenium and tellurium, the highest oxidation state is hardly reduced at
all by tetrahydroborate, owing to the extremely slow kinetics of the reduction,
therefore if the total Se and Te concentrations are required, a reduction step
before the analytical step must be implemented to reduce the hexavalent state to
the tetravalent state. For the reduction of Se^' to S e ' \ the use of concentrated
hydrochloric acid is considered an efficient and successful method,
with
the chloride ion being the reductant.
For an ideal multi-element analysis, only one reductant solution would be
required. L-cysteine will reduce the As / Sb^ to the lower trivalent oxidation state,
but it will also reduce Se^' or Se'^ to the elemental state,^^ while concentrated
hydrochloric acid will reduce Se / Te^' to the tetravalent state, but it has no effect
on reducing the As / Sb^ to the trivalent state.^^^ Clearly an optimum reductant
that will meet all the criteria discussed above and reduce the HFEs to their most
sensitive oxidation state has yet to be identified.
4.1.3 Aims of the study
Based on a consideration of the chemistry and due to the fact that there
appears to be no 'ideal' reductant, a different strategy to that adopted by Kraus^^
131
was chosen to investigate simultaneous multi-element determinations.
crucial factor was the choice of reducing agent.
The
To enable optimum reducing
conditions to be used, the elements were split into groups according to which
reducing agent they required.
Group A contained As, Sb and Bi which used L-cysteine as the reducing
agent and Group B contained Bi. Se and Te which used elevated temperatures
with concentrated HCI as the reducing agent. Bi was kept with As and Sb due to it
also being a Group Vb element.
4.2 Instrumentation
A
Perkin-Elmer
electrothermal
atomic
Model
absorption
SIMAA
6000
spectrometer
simultaneous
with
multi-element
a transversely
heated
graphite atomiser (THGA) with longitudinal Zeeman effect background correction
and an AS-72 autosampler were employed for this study.
Standard THGA
graphite tubes with integrated platforms and Perkin-Elmer EDL 'System 2'
electrodeless
discharge
lamps
were
used.
The
optimised
instrumental
parameters are shown in Table 4.1 and the optimised THGA program in Table 4.2.
The temperatures in Steps 2 and 3, depended upon the elements being
determined.
Flow injection (Fl) hydride generation was performed with a Perkin-Elmer
FIAS 400 flow injection system equipped with an AS-91 autosampler.
optimised FIAS 400 program is shown in Table 4.3.
132
The
Parameter
As
Bi
Hg
Sb
Se
Te
193.7
223.1
253.7
217.6
196.0
214.3
Read Time / s
5
5
5
5
5
5
Read Delay / s
0
0
0
0
0
0
Wavelength / nm
Signal
Peak area
Measurement
Signal Type
Background correction AA
Table 4.1 : Instrumental parameters used for simultaneous multi-element
electrothermal atomic absorption spectrometer^.141
Step
Temp
Ramp Time
rc
1
2
Group A
300
Group B
250
Group A
300
Group B
250
Hold Time
Gas Flow
Is
Is
/ ml min"^
1
60
50
1
20
250
3
2200
0
5
0
4
2300
1
3
250
Table 4.2 : Optimised THGA temperature program for determining Group A
(As, Bi and Sb) and Group B (Bi and Se) hydride forming elements
133
Time
Pump 1
Pump 2
Is
/ rpm
/ rpm
Prefill
20
100
0
Fill
1
10
100
0
Fill
2
5
100
80
Fill
3
20
0
80
Inject
Valve Position
Table 4.3 : Optimised program for determining Group A (As, Bi and Sb) and
Group B (Bi and Se) hydride forming elements using the flow injection
manifold with an Ar gas flow of 150 ml min'^
Parameter
Sample
Trapping
Temp
As
Bi
A s ^ in
Bi^in
10%
10%
3%
10%
10-50%
10%
HCI
HCI
HCI
HCI
HCI
HCI
400
300
130
400
250
300
2100
1800
1300
2000
2000
2000
0.140
0.160
0.090
0.180
0.150
0.350
Sb
Hg
Hg
in
Sb
Se
in
Se
Te
in
Te
in
rc
Atomisation
Temp / "^C
Sensitivity
/ Int Abs
( C o n c / ^ i g 1"*)
3 ng
5 ng
20 ^g
5 Mg
4 ng
10 ^ig
Characteristic
50
70
500
60
60
60
Mass / pg
Carrier
Reductant
10% (v/v) Hydrochloric acid
0.2% (m/v) NaBH^ in 0.05% (m/v) NaOH
Table 4.4 : Analytical parameters for the hydride forming elements^ 95
134
4.2.1 Reagents
All reagents were of pro analysi grade (Merck, Darmstadt, Germany) unless
otherwise stated.
Dilutions were made using deionised water
(Nanopure,
Barnstead, USA).
Carrier solution : 10% (v/v) HCI
This solution was prepared by diluting 100 ml of concentrated hydrochloric
acid (Suprapur, Merck, Darmstadt, Germany) to 1000 ml.
This solution was
prepared fresh when needed.
Carrier solution : 1 % (v/v) HCI
This solution was prepared by diluting 10 ml of concentrated hydrochloric
acid (Suprapur, Merck, Darmstadt, Germany) to 1000 ml. This solution was also
prepared fresh when needed.
Reductant solution : 0.2% (m/v) NaBH4in 0.05% (m/v) NaOH
This solution was prepared by first dissolving 0.5 grams of sodium
hydroxide pellets followed by 2.0 grams of sodium tetrahydroborate (95% assay,
Riedel-de Haen, Seeize, Germany) and diluting to 1000 ml with deionised water.
This solution was prepared daily and stored in a plastic Nalgene bottle.
Reductant solution : 0.5% (m/v) NaBH4in 0.5% (m/v) NaOH
This solution was prepared by first dissolving 5.0 grams of sodium
hydroxide pellets followed by 5.0 grams of sodium tetrahydroborate (95% assay
Riedel-de Haan, Seeize, Germany) and diluting to 1000 ml with deionised water.
This solution was prepared daily and stored in a plastic Nalgene bottle.
135
Argon G a s :
Research grade argon was used for both the flow injection system and the
internal and external gas streams for the THGA atomiser system.
Stabilising Solution : 5% (w/v) KMnOd
A stock solution was prepared by dissolving 5.0 grams of potassium
permanganate (low in mercury, Merck, Darmstadt, Germany) in 100ml of
deionised water. Approximately one or two drops of this solution were added to
every 100 ml of sample or standard solution. This solution was kept for up to 1
month in a dark glass bottle.
Metals Standards :
The working calibration standards in the range (0-5.0 ng 1"^) were made
from stepwise dilution's from the original stock solutions as supplied by the
manufacturer. The standards were made up in the appropriate hydrochloric acid
carrier solution.
Selenium
1000 mg 1'^ as Se02 in 0.5 mol 1'^ HNO3
Mercury
1000 i^g ml'^ in 10% HNO3(Inorganic Ventures Inc., USA)
Antimony
1000 mg 1"^ as SbCb in 5 mol 1"^ HCI
Arsenic
1.342 g of AS2O3 and 0.5 g NaOH in 1000 ml
(Fixanal, Germany)
Tellurium
1000 mg
as HeTeOe in 0.5 mol I"' HNO3
Bismuth
1000 mg 1*^ as Bi(N03)3.5H20 in 0.5 mol 1"' HNO3
Reducing a g e n t : 1 % (m/v) L-cysteine
The reducing agent for Group A elements (As, Bi and Sb) was L-cysteine.
A stock solution of 10% L-cysteine in 0.5 mol 1'^ HCI was made up by adding 10 g
136
of
L-cysteine
(Biochemistry,
Merck,
Darmstadt,
Germany)
to
4.5
ml
of
concentrated HCI (Suprapur, Merck, Darmstadt. Germany) and diluting to 100 ml.
This solution was kept for 1 week.
From this solution, enough L-cysteine was
added to make the final concentration in the standard or sample 1 % (m/v).
Iridium Trapping Solution : 1000 mg 1'^ IrCb
From an original stock solution of 1000 mg 1'^ lrCl3(PlasmaChem. USA), 50
jil was injected onto the graphite platform and the furnace program (Table 4.5)
was started.
This procedure was repeated twice.
The pre-treatment was
sufficient to last the lifetime of the tube, providing that the clean-out temperature
did not exceed 2300X.'®^
Zirconium Trapping Solution : 0.02 mol 1'^ ZrOCl2.8H20
A 0.02 mol 1"^ solution of ZrOCl2.8H20 was prepared by dissolving 0.06445
g of the salt in 10 ml of water. A total of 100 |il was injected onto the platform in
two aliquots of 50 ^1 followed by the temperature program shown in Table 4.5.
The coating lasted for the lifetime of the tube.®^
Step
Temp
Ramp Time
Hold Time
rc
Is
Is
/ ml min'^
1
110
10
60
250
2
130
30
50
250
3
1200
30
20
250
4
Ir 2000
1
3
Read
Yes
G a s Flow
250
Zr 2600
Table 4,5 : Thermal pre-treatment program for Ir and Zr coated tubes
137
4.3 Initial experimental work into determining Bismuth and Selenium
by in atomiser trapping
This section describes the first investigations into the applic^ation of 'in
atomiser trapping' for the simultaneous measurement of Bi and Se.
From the
literature^^ it is clear that the individual optimised conditions {Table 4.4), for the
trapping and atomisation temperatures are very different for each element.
Therefore
to
allovi/
the
simultaneous
determination,
the
lov\/est
trapping
temperature was selected along with the highest atomisation temperature.
The
carrier solution and reductant solution are identical and the sample solutions were
similar, with Bi requiring 10% (v/v) HCI and Se requiring 10-50% (v/v) HCI. From
the sensitivity data^®^ {Table 4.4), it was thought that a calibration graph in the
range 0-5.0 |ig 1'^ could be obtained for both elements. This would then allow the
experimental characteristic
mass (mo), sensitivity data and detection
limits
(instrumental and method) to be compared with the literature values and a
judgement could then be made on the validity of the method.
4.3.1 Initial results from Bi and Se analysis
After the initial trials, three main problems were identified which would have
to be eradicated before any further optimisation and analytical work could take
place.
The first problem, was that the Se peak did not return to the baseline
within the default time.
A second problem was a memory effect which was
observed mainly for Se but also to a lesser extent for Bi. The third problem was
138
the irreproducibility of the three replicates, with the first value always being
greater than the other two values.
4.3.2 First problem : Se not returning to baseline
After the read time of 5 seconds, the signal for Se had not returned to the
baseline. The first attempt to cure this was to increase the read time from 5 to 6
and then to 7 seconds. Only a slight improvement was seen in the longest read
time. The next attempt was to increase the atomisation temperature from 2000''C
in steps of 100**C until the maximum clean-out temperature of 2300''C was
reached.
At 2100''C, the Se signal almost attained the baseline within the 5
seconds read time with a good symmetrical peak shape but this change caused
the Bi signal to become slightly more narrow.
At 2200*'C. there was an
improvement, in that the Se signal returned to the baseline, retaining a good peak
shape, but still a much narrower Bi signal.
Overall, the higher atomisation temperature of 2200°C, reduced the
baseline problem to a minimum, and a compromise was obtained between the
best peak shapes for both of the elements.
This was possibly to be expected,
because Bi has a lower atomisation temperature than Se as indicated in Table 4.4
of the optimum individual parameters.
4.3.3 Second problem : Se and Bi memory effect
The memory effect was due to Se becoming trapped upon the iridium in the
tube but not on the LVov platform. During the coating step, some iridium can be
139
lost from the solution on the platform and become trapped upon one of the other
internal surfaces of the THGA, i.e. the front and back end contacts. The contacts
were taken out and cleaned, but this only reduced the effect slightly indicating that
there was possibly another Ir coated internal surface in the HGA. This problem of
memory effect could be solved, if the Se could be stopped from leaving the
internal confines of the L'Vov platform and the graphite tube. The solution was to
have a mini-internal gas flow of 50 ml m i n ' \ to increase the pressure around the
tube, leaving only the small inlet hole for the gas to escape. This solution did not
totally eliminate the problem, but it was considered to have reduced it sufficiently,
so as not to be a problem.
4.3.4 Third Problem : Irreproducibility of the first value
The main cause of the irreproducibility was determined to be the first value,
as it was always significantly different to the other two replicate values.
A
washing step was introduced in order to remove the previous sample from the
tubing and wash the tubing before the next sample was introduced. A 15 second
wash step was introduced before the prefill step for each sample.
Initially,
deionised water was used as the wash solution, then 10% (v/v) hydrochloric acid.
This did not appear to make any difference in the reproducibility of the samples /
blank but with the deionised water, the blank increased slightly. Therefore 10%
(v/v) HCI was used in all further experiments as the wash solution.
Finally the prefill step was increased from 15 seconds to 20 seconds, all
the flow injection tubing was replaced, and the quartz pipette tip was removed,
placed in 50% (v/v) hydrochloric acid, washed with deionised water and then
140
returned to the mount, where it was rinsed with acetone and then blown dry by
passing the argon gas through the delivery tube. A combination of these actions,
resolved the reproducibility problem.
4.3.5 Results for 6i and Se analysis
Once, the problems identified above had been resolved or minimised, and
using the operating conditions slated in Tables 2.3 - 2.5, a calibration graph in the
range 0 -5 lag 1'^ was constructed. From this graph the Instrumental and Method
detection limits could be calculated. The method detection limit (MDL) (Eqn 4.1)
gives a measure of how sensitive the method is for each experiment, as the
calculation takes into account the intercept and the slope from the best line of fit
of the calibration g r a p h , w h i l e the instrumental detection limit (IDL) (Eqn 4.2)
enables the instrument to be optimised to maximise the instruments response and
hence its sensitivity.
MDL = {[Blank + (3 x Std Devn of Blank)] - Intercept} / Slope
IDL (pg) = (3 X Std Devn of Blank x m ^ ) / 0.0044
(Eqn 4.1)
(Eqn 4.2)
The experimental calculated data e.g. sensitivity, characteristic mass (mo)
and detection limits can then be compared against existing data, to assess the
potential of the developed method. A blank solution was also run in replicate (n =
10) to provide adequate statistical data for the standard deviation and mean of the
141
blank solution, used for the detection limit calculations. The results obtained are
summarised in Table 4.6.
Parameter
Bismuth
Selenium
Gradient
0.04096
0.05603
Intercept
0.0008
-0.0002
r^
0.99980
0.99992
S D o f Blank (n=10)
0.0008
0.0015
Blank
0.0036
0.0057
55.3
40.9
Calculated m^/ pg
(3.0 ng
(Std used)
Literature mo / pg
(3.0 n9 r^)
70
60
0.189
0.232
(4.0^9 \-')
(4.0 n9 \-')
0.160
0.150
(4.0^9 r^)
(4.0^9 r^)
IDL / pg
30.16
41.83
MDL/ng I '
0.13
0.19
Observed Sensitivity / Int Abs
(Std used)
Literature Sensitivity / Int Abs
(Std used)
Table 4.6 ; Analytical figures of merit for the simultaneous determination of
Bi and Se'®'
4.3.6 Conclusion to experiment one
The
initial
study
presented
here
showed
that
the
simultaneous
determination of Bi and Se by hydride generation in atomiser trapping is possible,
and the data obtained indicates little degradation of the analytical figures of merit,
142
compared with those established for optimised single element hydride generation
in atomiser trapping.
The developed method for the simultaneous determination of selenium and
bismuth is sensitive and the calibration graph is linear within the working range of
0 - 5.0 ^g \'\ with good correlation (Bi r^ = 0.99980 and Se r^ = 0.99992) of the
best straight lines through the six data points (i.e. one blank and five standards.)
Both analytes have sub jig 1'^ detection limits (Bi 0.13 ng 1"^ and Se 0.19 pg 1'^) and
absolute limits (Bi 30.2 pg and Se 41.8 pg) in the picogram range.
From the experimental results, the proposed method is slightly more
sensitive than expected, with the calculated characteristic mass values being
lower than the literature values and this is verified by the higher sensitivity
readings for a given standard.
4.4 Further investigations into "in atomiser" trapping
4.4.1
Introduction
Following the promising results described in Section 4.3, it was decided to
try and extend the method to include two other hydride forming elements (As and
Sb) and also
Hg, to evaluate
if all five elements
simultaneously.
This study also considered the different oxidation states of the
various elements found in the sample.
143
could
be
determined
4.4.2 Experimental conditions
The instrumental conditions, as stated previously In Section 4.1.3,
are
determined by the lowest trapping temperature and the highest atomisation
temperature of the elements in the group. From Table 4.4, it can be seen that the
default trapping temperature would be 130'*C and the atomisalion temperature
would b e 2 1 0 0 X .
From the sensitivity data (Table 4.4), the calibration range for As. Bl, Sb
and Se would be 0-5.0 [ig
and for mercury the range would be 0-50 \XQ \'\ The
same carrier solution was to be used for this experiment, but in order to
accommodate
the five elements, the overall concentration
of the
sodium
tetrahydroborate was increased to 0.5% (m/v) with a similar increase in the
sodium hydroxide concentration to keep the tetrahydroborate stable.
The
reductant used was therefore 0.5% (m/v) NaBH4 in 0.5% (m/v) NaOH.
4.4.3 Possible and optimum oxidation states
Each of the five elements to be determined can exist in two different
oxidation states e.g. As'" and A s \ Sb'" and S b \ Se"" and Se"", Bi"' and Bi"". Hg is
a special case since it mainly exists as Hg", however it can also exist as Hg' in
organomercury compounds.
All these oxidation states can readily be found in
natural samples, with the exception of Bi^ which is very rare in the environment. It
is also advisable to have a stabilising agent in the mercury solution to prevent the
Hg from adsorbing onto the walls of the container.
KMn04 was added to each standard.
144
Thus approx. 50 |il of 5%
Selenium needs to be heated with concentrated HOI to be reduced from
Se^' to Se'^, since Se^' will not be reduced by the sodium tetrahydroborate in the
reaction manifold. Bismuth only needs acidified conditions to prevent oxidation.
This then leaves As and Sb which in both oxidation states will yield hydrides
although at different rates and hence different sensitivities. Therefore to make the
reaction as sensitive as possible, the As and Sb should be in the trivalent state,
which required the addition of L-cysteine.
This is now favoured over Kl and
ascorbic acid, due to the advantages as stated by Tsalev
a/.^^^
It was noted that if L-cysteine was added to a selenium solution, the
selenium was reduced to Se°, which could then not form the hydride.
Thus in
order to determine Se and As in the same solution a new procedure had to be
developed.
4.4.4 Results
4.4.4.1 IdealTrapping Temperature
Using an initial trapping temperature of 130'*C, no peaks were observed
above the background noise. The trapping temperature was increased to 150**C
and small signals were observed for all five elements. At this stage, the gas flow
during the trapping step was eliminated from the flow injection program as it was
thought that the gas flow was preventing the hydrides from being correctly
sequestrated in the tube. The trapping temperature was increased to 170^0, and
an increase in signals for four out of the five elements could be clearly seen. A
145
decrease in the Se signal was observed, and it could only just be seen above the
background noise.
To see if a further increase in trapping temperature would increase the
peak area, a trapping temperature of 200^*0 was chosen.
This increase in
trapping temperature did not give the expected results, i.e. another increase in
peak areas. Therefore it was decided to lower the trapping temperature back to
170°C for the further work.
In order to try and improve the peak areas, a more concentrated standard
(10 ^g
for As, Bi. Sb and Se and 100 [ig 1"' for Hg) was used in the optimisation
stages. In this experiment, no selenium peak was observed and the Hg peak was
thin and sharp in shape, but this is understandable as the pyrolysis and
atomisation temperatures were much greater than its optimised temperatures.
Good symmetrically shaped peaks were observed for As, Bi and Sb. It was clear
from these results that it was possible to determine As, Bi and Sb together, but the
characteristic mass values were low.
4.4.4.2 Position and length of reaction coil
Following the initial work, the internal gas flow of 50 ml min"^ was restored
and kept constant through the rest of the experiments, as it was previously shown
to reduce the memory effect for some of the analytes. However, it was clear from
the results, that the system was not operating well. At first, it was assumed that
the reaction time was insufficient for the hydrides to be formed. To solve this, a
longer reaction loop (length 300 mm, i d. 1.0 mm) instead of the normal reaction
coil (length 110 mm, i.d. 1.0mm) was introduced between the reductant/carrier
146
mixing point and the inlet for the argon gas flow. With this new reaction coil, As,
Bi and Sb peaks were detected with a thin Hg peak although there was no peak
for Se.
A much longer reaction coil was then used to see if the hydrides required a
still longer reaction time. This coil was 1000 mm long with an i.d. of 1.0 mm and
proved to be much better. Better shaped peaks were detected with larger areas
and hence better sensitivities than seen previously.
When the characteristic
mass (mo) values were calculated and compared with the literature values (Table
4.4) that for Bi was within 20% of the literature value, while these for As and Sb
were a factor of 3 higher than the literature values. Se was still not detected, and
the Hg peak was poor for the reasons stated previously.
Slope
Intercept
mo/pg
Sensitivity / Int Abs
(Std used)
Bi
Se
Hg
Sb
As
0.0196
n.d.
0.0023
0.0051
0.0069
0.9998
n.d.
0.9979
0.9668
0.9932
0.0001
n.d.
0.0160
-0.0015
0.0003
114
n.d.
976
556
322
0.0972
n.d.
0.0467
0.0192
0.0202
(20 ^g r^)
(5ng r^)
(5 ng r^)
(5 yig \'')
Blank (n=10)
0.0012
0.0009
0.0004
0.0003
0.0175
SO of Blank (n=10)
0.0005
0.0005
0.0127
0.004
0.0005
IDL / pg
39
n.d.
200
1818
110
MDL / \ig
0.13
n.d.
0.13
5.64
2.72
Tabic 4.7 ; Analytical figures of merit for the simultaneous determination of
A s , Bi, Hg, S b and S e by "in atomiser" trapping
147
A longer reaction coil was tried (length 2000 mm, i.d. 1.0mm), and there
was no improvement in the results, therefore this reaction coil was rejected, as the
same results could be obtained within a shorter time period using the previous coil
(1000 mm, i.d. 1.0 mm). This was used in all further experiments. The reaction
coil had two possible positions to occupy in the manifold, i) between the carrier /
reductant inlet and the Ar gas inlet and ii) between the Ar gas inlet and the gasliquid separator (GLS).
The optimum signal for any given standard was
maximised when the reaction coil was placed between the Ar gas inlet and the
GLS. The reaction coil remained in this position for all further work.
The next stage was to obtain a calibration graph for each of the elements
using the following experimental conditions; trapping temperature of 170°C,
atomisation temperature of 2100**C. reaction coil (length 1000 mm, i.d. 1.0 mm)
and an internal gas flow of 50 ml min \
The analytical figures of merit for each
analyte were calculated in order to determine how the method was developing.
The results are shown in Table 4.7.
4.4.4.3 Further studies on Selenium
In order to find out why no Se peaks were observed, fresh Se standards
were analysed using the new default conditions stated in Section 4.4.4.2.
peak was detected and a linear calibration graph was constructed.
indicate that the Se in the five element standard was either being
I) oxidised to Se^' and hence not being detected, or
II) it is being reduced to Se° and again is not being detected.
148
A Se
This would
Both of these oxidation states will not produce H2Se from the reaction with
sodium tetrahydroborate.
To prove this theory, two identical 5 ^g 1'* selenium
standards (Std 1 and Std 2) were made up. To Std 2. 50 ^xl of 5% KMn04 was
added.
A blank solution was also made up as a reference solution.
Each
standard was analysed at three different time intervals, straight away, after 60
minutes and after 180 minutes. The results are shown in Figure 4.1. Initially, the
Se was present in both standards, but after 60 minutes, there was decrease in
signal for the standard with KMn04. and by 180 minutes, the signal was down to
almost background levels.
Selenium Experiment
0.18
0.16
™ 014
5
0.12
•S
0.10
• Mean Peak Area
0.08
S
^
0.06
0.04
0.02
0.00
J£
S
m
T-
2
w
f.^
^
«
m
2
S
^
C-i
CO
CO
2
2
Figure 4.1 : A graph showing the experimental results from the selenium
studies at time intervals of 0, 60 and 180 minutes. Standard One 5.0 ^g I ^ of
Se'^ and Standard Two 5.0 ^g 1'^ of Se'^ and 50 ^1 of KMn04, Blank solution
10%(v/v) HC
149
Half reactions and potentials
196
MnO^" + 8H* + 5e' ^
Mn'* + 4H2O
E" + 1.507
(Eqn 4.3)
Se04'' + 4H* +2e* ^
HjSeOa + H2O
E" + 1.151
(Eqn 4.4)
From the half reaction potentials, it can be seen that Eqn 4.3 has the more
positive value of the two, therefore Eqn 4.3 is the reduction reaction and Eqn 4.4
is the oxidation reaction. This means the full reaction is Mn^" is reduced to Mn"
and to balance the complete reaction, the Se'^ must be oxidised to Se^'.
This explains the reason for the small Se peak initially being observed but
eventually disappearing as the Se'^ was being oxidised to Se^' over a period of
time and hence not forming the hydride when the NaBH4 was added.
4.4.5 Arsenic and Antimony contamination
The blank values for As and Sb, showed an increasingly higher signal as
the experiment proceeded.
It was assumed that there was a contamination
problem from one of the reagents, possibly the sodium tetrahydroborate.
This
was investigated in the next round of experimental work.
4.4.6 Conclusion
It was concluded from this trial that the five selected elements, As, Bi, Hg,
Sb and Se could not be determined together using the same experimental
150
conditions.
The first problem encountered was the fact that Hg needed a
stabilising agent, and the one chosen KMnO^, had a detrimental effect on Se i.e.
oxidising the Se'^ to Se^'. The second problem caused by Hg was the severe
compromises
need in the furnace temperatures to enable the
simultaneous determinations.
successful
If Hg was excluded, then the analysis could have
worked well with the elements in their current oxidation states. As'", Bi'", Sb"' and
Se'^.
Further experimental work showed that the potassium permanganate was
slowly oxidising the Se'^ to Se^' in the solution which explained why a small Se
peaks was first observed but after a few hours, the Se peak had completely
disappeared.
It was also concluded that for the remaining four elements, there was no
single reductant which would enable all the elements to be determined in the most
sensitive oxidation states.
4.5
Simultaneous determination of five hydride forming elements by
"in atomiser" trapping
This experiment was designed to bring together all the important facts
learnt from the previous work, and apply them to a method to determine five
hydride forming elements in lake water samples. Various other parameters such
as the potential interferences, long term stability of the method and the various
possible tube coatings available were also examined.
In this work, As, Bi, Sb, and Se were again determined together with Te,
which is in the same group as Se and therefore would be expected to have the
151
same reducing characteristics.
The experimental conditions were derived from
the single element conditions.
The problem of the elevated blank levels for As
and Sb was investigated first, in order to minimise this problem in later studies.
4.5.1 Blank Contamination Problem
During the initial experiments, elevated blank values for As and to a lesser
extent for Sb were observed. It was thought that this contamination could be due
to the sodium tetrahydroborate as noted by Haug and Liao.^^ Different batches of
sodium tetrahydroborate were assessed, but even the 'purest' batch still gave
unacceptable blank values which seriously affected the detection limits.
It was considered that the possibilities of 'cleaning up' the
tetrahydroborate
previously
to
should be explored.
preconcentrate
Activated
oxyanions^^^
and
alumina
it was
has
sodium
been
assumed
that
used
the
contamination was in the alkaline sodium tetrahydroborate. If this were the case,
then the most likely form of the contamination would be the oxyanions of As and
Sb.
Initially, an on-line column approach appeared to be the best option as no
special treatment would then be needed and the reductant would be cleaned up
immediately prior to use, which would keep the method as simple as possible.
A small column containing activated alumina was made from a 1 ml
Eppendorf pipette tip, with the activated alumina being held in place by glass wool
plugs at either end of the column. The column was inserted between the pump
and the manifold in the Fl system, and activated by passing 1 % (v/v) HCI through
it for 5 minutes followed by distilled water for 5 minutes and finally the alkaline
152
reductant for a further 5 minutes or until the waste solution was alkaline.
The
column was then ready for use.
Sample (NaBH4)
Arsenic
(n = 10)
/ Int Abs
SD
Antimony
SD
/ Int Abs
Contaminated Solution
0.0397
5.5 X 10"'
0.0036
2.2x10'^
Fresh Solution
0.0085
1.8 X 10"^
0.0027
3.6 X 10'^
Fresh Solution (After on-
0.0051
9.0 X 10"^
0.0026
2.8 X 10'^
line clean up)
Table
4,8
As
and
Sb
contamination
in
three
different
sodium
tetrahydroborate solutions
To test the efficiency of the column, blank measurements were made with
and without the clean-up column in the Fl system.
The integrated absorbance
results for As and Sb blank solutions (n = 10) are shown in Table 4.8.
The lowest integrated absorbance values were gained with a fresh sodium
tetrahydroborate solution made from a new unopened bottle and the column inline. With the same solution but no column, the results were only slightly greater
but expehence showed that this value would gradually increase as the stock
reagents age increased.
The worst values came from an open reagent bottle
(approx. 2 months old) stock of sodium tetrahydroborate.
To test the lifetime of the column, continuous blank replicates were run.
The capacity of the column was eventually exceeded after 30 replicates, which
was long enough to perform a calibration but not long enough to permit the actual
153
analysis of samples, without re-activating the column. While it was clear that the
on-line
procedure
with
activated
alumina
was
effective
in
reducing
the
contamination levels, the limited column capacity was a serious disadvantage.
Consideration was given to increasing the size of the column, but when the online column was used, the reductant flow was reduced from 4.6 to 4.0 ml min"\
and it was deduced that a larger column would reduce the flow even more, which
would upset the optimised hydride generation conditions.
As it seemed unlikely that an effective on-line procedure with sufficient
analytically useful lifetime would be developed, therefore it was decided to
perform the procedure off-line. The contaminated tetrahydroborate was passed
through an activated alumina column and collected in a fluorinated ethylene
propylene (FEP) bottle prior to the start of analysis. A large column (150 mm x 10
mm i.d.) was made from plastic drain tubing normally supplied with flame AA
instruments from Perkin-Elmer.
This material was selected as il has a PTFE
coating on the internal wall. A plastic restrictor was placed in one end of the tube,
with a glass wool plug. Approximately 2 grams of activated alumina was slurried
with a small volume of water and carefully poured into the column, ensuring there
was no voids or air gaps. The alumina was allowed to settle and once the column
was correctly packed, a glass wool plug was inserted above the alumina.
The
column was pre-treated in an identical way to the small on-line column and was
left in alkaline solution when not in use.
The off-line cleaned reductant solution gave similar values for the blank as
the on-line cleaned solution, re. system blank values of 0.005 for As, 0.003 for
Sb, but the analytically useful lifetime of the procedure was greatly increased. A
volume of 500 ml of 'contaminated' reductant could be cleaned up in two hours by
154
passing the solution slowly through the column using a pump rate of 5 ml min*\
This volume of reductant was sufficient for 160 analytical cycles and a fresh batch
of reductant was prepared daily following re-activation of the column as previously
described.
4.5.2 Evaluation of different reducing agents
Technically, from the point of view of the instrumentation used in this study,
it is possible to determine As. Bi, Sb, Se and Te simultaneously.
However, to
have all the elements in their most sensitive oxidation state requires that a single
reducing agent should be used to reduce all the higher oxidation state elements
down to their lower and more sensitive oxidation states.
As yet, no suitable
reducing agent has been identified. When the standard electrode potentials of
the half reactions of As, Sb, Se and Te were examined, it became clear that no
reductant was going to reduce As, Sb, Se and Te simultaneously from their higher
oxidation state to the lower oxidation state while not reducing Se or Te to the
elemental state.
Two sets of workers have tried to solve this problem by using two stage
reduction procedures.
Uggerud and Lund^^^used thiourea in combination with
concentrated HCI as a multi-element reducing agent.
The samples were first
heated with 5 mol 1"^ HCI for 4 hours at 70*C, to reduce the Se and Te to the lower
oxidation state, and then the thiourea was added to reduce the As and Sb to their
lower oxidation state. This combination appears to work well, but eventually the
thiourea also slowly reduced the Se'^ and Te'^ to their elemental state. Therefore,
once the thiourea had been added the analysis had to be completed within 60
155
minutes.
In developing routine, reliable procedures, maximum time constraints
are a serious disadvantage and are to be avoided.
Morrow et ai^^^ attempted to solve the problem by generating the hydrides
of the elements which did not require Kl as the reducing agent (e.g. As, Bi, Se, Ge
and Te) and then adding the potassium iodide reductant after the original mixing
coil and so generating SbHs.
The sediment samples used were previously
digested in an acid mixture, (nitric and hydrochloric acid) which presumably was
sufficient to reduce any Se / Te^' to the Se / Te'^ oxidation states before hydride
generation.
The main disadvantage of this system was that to perform it
efficiently, all the hydride forming elements must be in their most favourable
oxidation states to produce the most sensitive results possible.
In the experiments described here, after an initial examination of the results
obtained for As, Bi, Sb, Se and Te, the analytes were split into two groups, the
criteria being to select those analytes which could be determined with the same
reducing agent and conditions. Therefore one group consisted of As, Bi and Sb
(Group A), which used L-cysteine as the reducing agent, and the other group was
Bi, Se and Te (Group B), where concentrated HCI at an elevated temperature was
used for reduction. While not an ideal solution, by grouping the elements into two
distinct sets, this ensured that the elements would be in their most favourable
states before the hydride generation reaction.
Bismuth was included in both
groups since it was already in the correct oxidation state i.e. Bi'" and therefore did
not require any reducing agent.
156
4.5.3 Tellurium and Selenium
Initially, Te was included in Group B along with Bi and Se.
Tellurium
requires the same reducing agent as Se, i.e. 50% (v/v) HCI. but the optimum
temperature for reduction is 100°C for 20 minutes.'^
This temperature is 20°C
higher than the optimum Se temperature.^^ It is has been proposed that Se can
be lost from solution as the c h l o r i d e / ^ and hence the temperature of the
reduction vessel should be kept as low as possible in order to eliminate any loss.
In the literature, there is disagreement as to the time and temperature
required to affect the quantitative reduction of the S e ^ to Se'^.
Pitts ef a/.^^®
claimed that 75°C for 30 minutes in 5-6 mol 1'^ HCI was sufficient, but Bye and
Lund^®^ state that using 10 mol 1'^ HCI, complete reduction can be accomplished in
15 minutes at 60**C. However, Hill ef a/, investigated the kinetics of the reaction^^^
and found that with 6 mol 1'^ HCI at a temperature of yO'^C, complete reduction of
Se^' to Se'^ was achieved in 6 minutes.
The experimental results obtained in this study showed that for an off-line
reduction, if the temperature was increased to lOO'^C for 3 hours to facilitate the
reduction of Te, significant losses of Se were observed.
time was required to produce the best results for Te.
The 3 hour reduction
If the temperature was
reduced to 80*C, optimum for the selenium reduction, then the results for Te were
irreproducible indicating incomplete reduction.
Based on these results, it became clear that finding a set of conditions that
would reduce Te and Se completely, but without losses of either Se or Bi would
be difficult and that these three elements were incompatible in terms of the
proposed simultaneous determination procedure.
157
Consequently, It was decided
to remove Te from Group B. During the course of these experiments, Bi was also
monitored, and it was found that with prolonged heating times, the accuracy and
reproducibility of the results decreased.
Overall, the final optimised conditions for the Se reduction step were found
to be ZO^'C for 120 minutes in 50% (v/v) HCI and under these conditions
reproducible results were obtained for Bi.
4,5.4 Comparison of Ir and Zr trapping materials
Whilst many different trapping coatings have been proposed,^^'^'^'^^^°^ it
seems that Ir and Zr are the most favoured, because these coatings only need to
be applied once before the measurements start and the coating lasts for the
lifetime of the tube.
Both of these materials have been applied successfully to
single element a n a l y s i s , W o r k by Haug and Liao,^^ indicated that Zr may
also be a possible candidate for a trapping agent for simultaneous multi - element
hydride trapping. In this study, a comparison was made to assess the suitability
of both materials for simultaneous multi - element analysis.
The results are
shown in Figure 4.2.
Using the Zr-coated tube, at a low trapping temperature of 300°C {Figure
4.2a), only Bi could be trapped successfully, with no As but some Sb. At a
trapping temperature of 600'*C (Figure 4.2b), a good Sb peak was observed along
with a small Bi peak and a very poor, distorted As peak.
temperature only Sb can be trapped successfully.
158
Therefore at this
Absorbance
0.2
Bi Peak
0.1
Time / s
Figure 4.2a : Simultaneous atomic peak signals for Group A elements, A s , Bi
and Sb, at the 5 ng 1^ level, atomisation temperature 2200**C, sample volume
500 [i\ on a Zr-coated tube with trapping temperature of 300**C.
Absorbance
As Peak
0.4
S b Peak
0.2
Bi Peak
0
K
1
2
3
4
T i m e Is
Figure 4.2b : Simultaneous atomic peak signals for Group A elements. A s , Bi
and Sb, at the 5 ^g I ^ level, atomisation temperature 2200*'C, sample volume
500 ^1. Zr- coated tube with trapping temperature of SOO'^C;
159
Absorbance
As Peak
Sb Peak
Bi Peak
T i m e Is
Figure 4.2c : Simultaneous atomic peak signals for Group A elements, As, Bi
and Sb, at the 5
1^ level, atomisation temperature 2200**C, sample volume
500 |il on a Zr-coated tube with trapping temperature of 800**C.
Absorbance
0.3
As Peak
0.2
Sb Peak
0.1
T i m e Is
Figure 4.2d : Simultaneous atomic peak signals for Group A elements. A s , Bi
and Sb, at the 5 ^g I ^ level, atomisation temperature 2200''C, sample volume
500 \i\ on an Ir-coated tube with trapping temperature of 300**C.
160
Absorbance
0.2
Bi Peak
0.1
Se
Peak
Time / s
Figure 4.3a : Simultaneous peak signals for Group B elements, Bi and Se at
the 5 ^g 1^ level, atomisation temperature 2200**C, sample volume 500 ^il on a
Zr coated tube trapping temperature 250**C.
Absorbance
0.1
Se Peak
1
2
3
4
Time Is
Figure 4.3b : Simultaneous peak signals for Group B elements, Bi and Se at
the 5 ^ig 1^ level, atomisation temperature 2 2 0 0 X , sample volume 500 nl. Ir
coated tube trapping temperature 250^*0.
161
At a high trapping temperature of SOO^C (Figure 4.2c), a good Sb peak was
obtained along with a reasonable As peak, but no Bi peak was seen. It was not
possible to find a temperature where As, Bi and Sb could be trapped together.
Similar results were found for Bi and Se whereby Se could not be trapped using
the temperature conditions for Bi (Figure 4.3d).
The results presented here were reinforced by the
single
element
optimised conditions found by Haug and Liao,^^ where with a 2r-coating, As has
an optimum trapping temperature range of 750-850'*C, Bi has a range of 100500**C and Sb has a range of 500-750**C, with a common atomisation temperature
of 2200*'C. These are all mutually exclusive. It was concluded that Zr could not
be used as an effective trapping material for multi-element analysis for As, Bi, Sb
and Se. With an Ir-coating, As, Bl and Sb could be trapped successfully at 300'*C
(Figure 4.2d) while Se and Bi required a trapping temperature of 250''C (Figure
4.3b). To the best of the author's knowledge, this is the first reported compahson
of the applicability of Ir- and Zr-coated graphite tubes for simultaneous multielement hydride trapping.
Clearly, it can be concluded that Ir is the coating of
choice for all elements, both for single and multi-element determinations.
The
coating procedure is simple, the material (Ir solution) readily available and similar
trapping temperatures can be used for all elements, making method development
and optimization considerably easier.
4.5.5 Long term Stability tests
In the development of any analytical procedure, it is important to establish
the lifetime or the stability of the procedure. It is known that the Ir coating has a
162
finite lifetime, based upon the previous single element work.®'' it was considered
essential to demonstrate the long term stability of the proposed method.
0.20
0.18
30
ht Abs
RSD
25
0.16
0.14
20
0.12
0.10
15
g
0.08
10
0.06
0.04
0.02
0.00
g § S
No of comprete cylces
Figure 4.4a : Long term stability a s indicated by the integrated absorbance
and precision (%RSD, n = 10). Concentration for A s 5 ^g r \ sample volume
500 nl, trapping time 60 s e c o n d s , trapping temperature 300'C, atomisation
temperature 2200*^0.
Lifetime tests were run overnight to check on the stability of the analyte
signal in terms of integrated absorbance and the precision of the signal (RSD %)
for 10 replicates. A solution of 5 iig 1"^ of As, Bi and Sb, (Group A), and Bi and Se,
(Group B). was used and all other instrumental parameters were as stated in
Tables 4.1 - 4.3. The results are shown in Figure 4.4.
163
0.20
0.18
0.16 +
30
tit Abs
• RSD
25
*7 0.14
y 0.12 +
o
0.10
•a
0.08
?> 0.06
lllllll
No or complete cycles
Figure 4.4b : Long term stability a s indicated by the integrated absorbance
and precision (%RSD, n = 10). Concentration for Bi 5 ^ig l \ sample volume
500 nl, trapping time 60 seconds, trapping temperature 3 0 0 X , atomisation
temperature 2200**C.
For Group A, initially for all three elements {Figures
4.4a - 4.4c), the
integrated absorbance was high with good precision, but the mean peak
absorbance then dropped down to a constant level for the next 120+ samples.
This is expected as the instrument will be the most sensitive just after the graphite
tube has been freshly treated with the trapping material for 30 cycles and this
"conditioning" effect has been observed before.^°^
164
0.20
30
Int Abs
0.18
3RSD
25
0.16
^
0.14
y
0.12
5
0.10
Ti
0.08
10
g' 0.06 i
0.04
0.02 4^^
0.00
l.n.O.f^.fl.finlJJmnn]
.ill
^toof complete cycles
Figure 4.4c ; Long term stability a s indicated by the integrated absorbance
and precision {%RSD, n = 10). Concentration for S b 5 jig \ \ sample volume
500 ^il, trapping time 60 seconds, trapping temperature 300*C. atomisation
temperature 2 2 0 0 X .
For the first 5 hours i.e.
150 cycles, the results are steady
and
reproducible, but then for As and Sb but not for Bi, the precision deteriorates and
the average RSD exceeds 5%.
This is thought to be because both As and Sb
require L-cysteine as the reducing agent but L-cysteine also acts as a complexing
agent^®^ for these two analytes. However, under the operating conditions of 1 %
(v/v) HCI carrier solution, the L-cysteine is not stable for long periods of time, as
lower acid carrier concentrations i.e. below 0.1 mol 1'^ HCI are recommended^®^
with 1 % (m/v) L-cysteine.
165
30
\n[ Abs
25
T
0.14
c
0-12
20
o 0.10
15 o
CO
Ti
0.08
D>
0.06
10
ilJ.n.i.n.nlj
ftoof complete cycles
Figure 4.4d : Long term stability a s indicated by the integrated absorbance
and precision (%RSD. n = 10). Concentration for Bi 5 jig \'\ sample volume
500 ^ l , trapping time 60 seconds, trapping temperature 250''C, atomisation
temperature 2200*'C.
It was found in these studies, that Sb was more stable {i.e. gave more
reproducible results) in 10% (v/v) HCI carrier solution, than in 1 % (v/v) HCI carrier
solution.
This result was confirmed by Welz and Sucmanova^^^ who found that
there was no significant difference in absorbance and integrated absorbance
values for Sb'" using 0.1 or 1 mol 1'^ HCI carrier, but the stability of the signals was
better with the higher acid concentration.
166
30
bit Abs
RSD
T
25
0.14
20
15g
10
0.06
Li
No of complete cycles
Figure 4Ae : Long term stability as indicated by the integrated absorbance
and precision (%RSD, n = 10). Concentration for Se 5 ng \ \ sample volume
500
trapping time 60 seconds, trapping temperature 250*C, atomisation
temperature 2200**C.
Arsenic '"could not be determined satisfactorily with a 10% (v/v) HCI carrier
solution, therefore to allow the simultaneous determinations of As'" and Sb'", a
compromise was reached which used a carrier solution of 1 % (v/v) HCI. These
issues with respect to the HCI acid carrier concentration and the stability of Lcysteine in the solutions, explain the worsening precision found after 5 hours of
operation.
It was originally observed by Welz and Sucmanova^®^ that the
integrated absorbance of an As'" standard (10 ^ig 1'^) in 1 mol 1'^ HCI with no
reductant, decreased almost linearly with time to 50% of its original value within 3
167
to 6 hours. This highlights the Instability of the As'" standard (which is oxidised to
As^) which must be correctly stabilised to prevent poor precision. Bismuth does
not appear to be affected by the acid concentration or the L-cysteine and both the
precision and the integrated absorbance values remain steady during the full nine
hours of the experiment.
For the Group B elements (Figures 4.4d - 4.4e). Bi shows a slight increase
of integrated absorbance over the nine hours (i.e. 270 runs) while the precision Is
approximately 2% for the whole run. The high RSD values at 260 cycles is due to
the reagents running out.
absorbance.
This is also indicated by the reduced integrated
Selenium showed a slight decrease in integrated absorbance over
time.
Overall, these results Indicated that iridium as the trapping reagent for
simultaneous multi-element analysis is reliable, facilitates good precision and is
stable for a reasonable working period i.e. five hours for As and Sb while for Bi
and Se the method is stable for up to nine hours. The reduced analysis time for
As and Sb is due to the chemistry of the system rather than the trapping material
used. However, the reduced stability / lifetime of the chemistry of the As and Sb
situation raises the question as to whether the use of L-cysteine is the optimum
reductant for this procedure.
4.5.6 Interference Studies
It is well known that conventional hydride generation suffers from various
interferences i.e. kinetic, chemical and gas phase effects.
Kinetic interferences
are due to the different rates at which the hydrides are formed and released from
the reaction mixture.
These interferences do not occur when the hydride is
168
collected upon the graphite tube,^^^ since the generation of the hydride and
subsequent atomisation are separated into discrete stages.
The gas phase
interferences are caused by other hydride forming elements. The interference is
due to the interferent removing the hydrogen radicals required by the hydride for
atomisation. This process happens in conventional hydride generation within the
quartz
ceW,^^ but
since
with
"in
atomiser"
trapping,
higher
atomisation
temperatures are possible and the atomisation mechanism is different to that in a
quartz tube atomiser, this type of interference should be eliminated.
This has
been confirmed by the work of Schlemmer and Feuerstein.^°^ Alkali and alkaline
earth metals along with Al, Ti, V. Cr" and Mn" do not interfere in the determination
of hydride forming elements. The major chemical interferences are caused by the
elements in Groups 8, 9, 10 and 11 of the Periodic Table,^^^ so only these
elements were considered in this study. To confirm this, a study was initiated to
see what effect various known interferents would have when the analyte hydrides
were measured simultaneously by 'in atomiser trapping'.
A transition metal cation can cause an interference in one of two ways. In
the hydride generator, the metal cation will be reduced by the tetrahydroborate
and be precipitated as a fine metallic powder^°^ therefore using up
tetrahydroborate before the hydride forming element can use it.
the
Alternatively,
nickel and metals of the platinum group are hydrogenation catalysts and can
therefore absorb large amounts of hydrogen, hence removing the hydrogen from
the reaction vessel. These metals can also capture and decompose the formed
hydrides. ^^'-^^^
Based
on
a review
of the
literature'^^''®°''®''°°'^°^^°'
and
previous
experience, eight metals were identified as being major interferents and/or could
be present in sample matrixes. The eight metals were Ag', Cd", Co", Cu", Fe'",
169
Ni", Pb" and Z n " . A 5 ng 1'^ multi-element standard was analysed {n = 3) in the
absence of interferent to give a base response and then increasing amounts of
the interferent (0.01, 0.1. 1.0, 10, 100 mg 1'^) were added and the new response (n
= 3) was normalised with respect to the base response.
An interference was
defined as any signal which gave a deviation of ± 5% from the standard only
response. The levels at which such deviations were observed are shown in Table
4.9.
Group A
As
Group B
Bi •"
Sb"'
Bi"'
Se
Cu "
10
1
10
1
0.01
Zn"
0.01
0.1
0.01
1
0.01
Fe '"
0.1
0.01
100
0.01
0.1
Co"
10
>100
10
0.1
0.01
Cd "
0.01
1
0.1
0.01
0.01
Ni"
0.01
10
10
0.1
0.1
Ag'
0.1
0.1
0.1
0.01
0.01
Pb"
0.01
0.1
0.1
10
0.01
Table 4,9 : Results from interference study : Level (in mg 1^) at which the
interferent produces a deviation of 5% or more from the 5 ^g 1"^ metal
standard
Out of the four analytes, Se'^ was the most affected by the transition metals
interferences with 6 out of 8 metals giving an interference at 0.01 mg 1"^ level, i.e.
only a 2-fold increase above the original Se concentration.
170
The other two
interferents, Fe"' and Nl" gave an interference at the 0.1 mg 1'^ level, i.e., a 20-fold
increase. The interference on As"' was from four elements at the 0.01 mg l ' level,
Zn", Cd", Ni" and Pb". with Fe"' and Ag' at the 0.1 mg r' level. Arsenic could be
determined free of Interference In the presence of 10 mg 1'^ of Co" and Cu". The
least affected analyte was Sb'". with only Zn" interfering at the 0.01 mg 1"^ level
and Cd". Ag', Pb" at the 1.0 mg 1"^ level. Sb'" could tolerate up to 10 mg l ' of Cu".
Co" and Ni", and 100 mg 1"^ of Fe'" were required to give a - 5 % deviation.
The tolerance of Bi to interference depends upon the group with which Bi is
determined.
In both Group A and B. exactly the same interference level was
obtained for Fe'" at 0.01 mg 1"^ and Cu" at 1 mg i V However for Bi in Group A.
there is no interference from Co" up to 100 mg 1"^ but under Group B conditions,
Co" interferes at the 0.1 mg 1'^ level.
The results show that there are many possible interferences for each group
of elements, but the major sources are Fe, Cd and Zn, which are often present in
natural waters at concentrations greater than the 2-fold increase of concentration
need to cause the stated ± 5% deviation from the base response.
Therefore,
when analysing samples, care must be taken to either reduce the potential
interferences whenever possible, or confirm the absence of any interferences.
Overall, Group A elements, are more resistant to interfering elements than Group
B. This is probably due to the presence of the reductant, L-cysteine, which has
been shown to increase the tolerance of As and Sb to interferences during the
hydride generation step.^®^
171
4.5.7 Results
4.5.7.1 Analysis of Certified and Standard Reference Materials
One certified reference material (CRM), High Purity Standard (HPS) CRM
No 490915 Trace metals in Drinking water and one Standard Reference Material
(SRM), National Institute of Standards and Technology (NIST) SRM 1643c Trace
elements in water, were found to contain the analytes of interest.
As the concentrations of the reference materials were outside
the
calibration range for all the analytes of interest, appropriate dilutions were made,
and these were incorporated into the off-line reduction procedure.
As both
reference materials had similar concentrations, identical dilution factors could be
used. For Group A, two separate dilutions had to be made. The As required a 20
times dilution (5 ml of sample to 100 ml) to bring it within range, while Sb and Bi
only required a 2.5 times dilution (40 ml of sample to 100 ml). During the dilution
step, the appropriate amount (1 ml per 10 ml) of 10% (m/v) L-cysteine was added
to each volumetric flask.
performed.
After the 30 minute reaction period, the analysis was
For Group B, 25 ml of sample was added to 25 ml of concentrated
HCI, hence a 2-fold dilution. The solution was heated for 120 minutes at 70**C,
and once cool, used for analysis.
All solutions were analysed under the
conditions stated above and the instrumental parameters stated in Tables 4.1 4.3. The results are shown in Table 4.10.
The drinking water CRM was certified for all four elements, and good
agreement was achieved with the certified values. The NIST SRM was certified
for As and Se, with a recommended but not certified value for Bi and no value was
172
provided for Sb. Again good agreement between the found and certified values
was achieved, with all results falling within the certified range of two standard
deviations.
HPS Drinking water
SRM 1646c Trace elements
CRM No 490915
in water
Certified
Found**
Value *
/ ng I'
Certified
Found
Value *
/
I"'
1 ^g
/ ng I'
As
80.00 ± 0 . 4 0
80.8 ± 2 . 1
82.1 ± 1.2
80.9 ± 0.5
Bi
10.00 ± 0 . 0 5
9.7 ± 0 . 4
12
12.6 ± 0 . 2
Sb
10.00 ± 0 . 0 5
11.1 ± 1 . 2
n.d.
n.d.
Bi
10.00 ± 0 . 0 5
9.2 ± 0 . 0
12
11.7±0.0
Se
10.00 ± 0 . 0 5
9.7 ± 0 . 0
12.7 ± 0 . 7
12.1 ± 0 . 0
U r n .
* Mean and 95% confidence limits
Table 4.10
: Results for the analysis of HPS Drinking water
Certified
Reference Material No 490915 and Standard Reference Material 1646c Trace
elements in water
4.5.7.2 Analysis of Lake Constance water samples
Two different water samples were taken from the northern shore of the
Bodensee (Lake Constance), and analysed for all four elements. The results are
shown in Table 4.11.
Only results for As were obtained as the other three
elements were below the method detection limit.
173
These results were compared
with those obtained for samples previously analysed by the Bodensee Water
Works, Sipplingen, Germany, (typical values In Table 4.11),
using a single
element continuous flow procedure.^^ The total As values show good agreement,
with the total Sb and Se concentrations being below the detection limits of this
procedure.
Lake
Spiked
Spiked
Lake
Spiked
Spiked
Water 1
Result
Recovery
Water 2
Result
Recovery
/ \ig \ '
%
/ ng I'
/
I*'
/
I'
%
/ ^xg
Typical
values
As
0.97
1.86
89.0
1.40
2.46
106.5
1.28
Bi
<0.12
0.81
81.2
<0.12
1.10
109.7
-
Sb
<0.26
0.89
88.5
<0.26
0.95
95.3
0.118
Bi
< 0.04
0.96
96.0
<0.04
1.03
102.5
_
83.4
0.161
Se
<0.29
0.79
79.0
<0.29
0.83
'srrrr
*
Values obtained from a single element instrument.^*^
Table 4,11: Lake Constance water analysis results
The recoveries are good (all within ± 10 %) with the exception of Se which
was low, presumably caused by the interferences noted in Section 4.5.6.
No
comparison values were available for Bi for these lake water samples.
The
samples were also spiked with a known multi-element standard so a % recovery
could be calculated. The spiking level was 1 ^g 1"^ for all elements (As. Bi, Sb and
Se)
% Recovery = 100 x [(Spiked Sample - Unspiked) / Spiking level]
174
4.5.7.3 Analytical Figures of Merit for the simultaneous determination
of Group A (As, Bi and Sb) and Group B (Bi and Se) by in atomiser trapping
The characteristic mass and instrument and method detection limits along
with the typical calibration data are shown in Table 4.12.
The instrumental
detection limits are based upon the lUPAC recommended definilion^°®
and the
method detection limits are based upon the method described by Miller and
Miller.^'° The detection limit for As was dependant upon the purity of the sodium
tetrahydroborate.
Consequently, the detection limit for As could be decreased
further if the source of contamination were to be eliminated.
When the absolute detection limits from this procedure are compared
against either single element or simultaneous FI-HG-ETAAS methods already in
the literature, as expected the single element detection limits are lower by factor
of 2-6 depending upon the element.^^'^°^'^°°'^^^'^^^
However, when the detection
limits are compared with the simultaneous method/®^ the absolute detection limits
are approximately equivalent.
The advantage that a simultaneous multi-element analysis has over a
comparable single element analysis is that it is quicker with respect to the overall
analysis time, and that the time reduction is proportional to the number of
elements run together.
There is also reduced consumption of reagents per
sample. The disadvantage of the approach is shown in the analysis of the lake
water samples, whereby the multi-element analysis tends to have higher detection
limits than the single element analysis because compromise, rather
optimised conditions for each analyte are used.
175
than
Group A
As
Group B
Bi
Sb"'
Bi
Se
Gradient
0.01242
0.01464
0.01904
0.02410
0.02532
Intercept
0.0024
0.0021
0.0028
0.0003
-0.0017
r^
0.99736
0.99367
0.99612
0.99984
0.99938
mo/pg
175
136
107
91
90
IDL/pg
107
28
27
43
73
MDL / lag
0.82
0.04
0.26
0.12
0.29
Table 4.12 : Analytical Figures of Merit for the simultaneous determination of
Group A (As, Bi and Sb) and Group B (Bi and Se) by "in atomiser" trapping
However, a decision as to which approach is most appropriate depends
upon the demands of the particular type of analysis, especially with respect to the
detection limit level required. It should not be forgotten that the instrumentation
used In this study also allows single element determination and therefore either
multi or single element mode can be selected depending upon the requirement of
the analysis. Similarly, while a Fl approach with 500 |il volumes was examined in
this study, improvements in the detection limit have been obtained by applying
continuous flow sampling.
4.5.8 Conclusion
This
study
has
demonstrated
that
the
simultaneous
multi-element
determination of combinations of hydride forming elements by "in atomiser"
trapping
electrothermal
atomic
absorption
spectrometry
conditions derived from single element determinations.
176
is
possible
using
The optimised reducing conditions for Group B (Bi and Se) elements are
dependant on the fact that Se must be in the tetravalent state for the hydrides to
be formed, but for the Group A elements (As and Sb), the hydrides can be formed
from either the trivalent or the pentavalent state.
This work describes one
possible way of determining the hydride forming elements in the lowest oxidation
state by using L-cysteine as the reducing agent.
The use of L-cysteine also
appears to have the advantage of easing the interferences upon the analytes of
interest, though with the disadvantage that the stability of the chemical system is
limited. The alternative approach as used by Kraus^®^ is to oxidise the As and Sb
to the higher oxidation state.
This entailed using a similar instrumental set up
except that a longer reaction coil (1m instead of 60cm) was need to give the
hydrides a longer reaction time with the tetrahydroborate.
Clearly there are two
possible approaches to the simultaneous multi-element determination of hydride
forming elements with "in-atomiser" trapping. The hydrides may be formed either
from the most sensitive oxidation states, which requires grouping of compatible
elements due to the different reductants required, or by determining the elements
As and Sb from the pentavalenl oxidation state, as examined by Kraus^^
This
latter approach does allow elements such as As, Sb, Bi and Se to be determined
together.
The "in atomiser" trapping technique can easily be expanded from single
element analysis to multi-element analysis providing that an iridium-coated tube is
used. The analysis can be set up and left with only occasional re-sloping of the
calibration graph to allow for unattended long term analysis for up to five hours
with the same precision and accuracy associated with short term analysis. Iridium
was the only coating material found to be applicable to this multi-element
177
procedure, as a universal trapping temperature could not be found for a Zr-coated
tube. The conditions developed were shown to produce acceptable results for the
analysis of the reference materials.
When real samples were analysed, results
with acceptable recoveries were obtained, and these results were comparable to
values from a dedicated single element hydride generation atomic absorption
spectrometry method.
178
Chapter Five : Multi element
determination of metals in
seawater
179
Chapter Five : Multi-element determination of metals
in seawater
5.1
Introduction
This chapter describes work performed on developing a simultaneous
multi-element method to determine six metals (Cd, Cu, Fe, Mn, Ni and Pb) in
seawater with detection by electrothermal atomic absorption spectrometry.
The chapter is split into four sections.
overview
to
the
methodology
of
on-line
The introduction section gives an
column
preconcentration.
The
experimental section describes the instrumentation used if not already discussed
in Chapter Two. This section also details the optimised operating parameters and
the reagents used in this study. The following results section is split into three
parts. The first part describes the results obtained and highlights the problems
encountered in the initial trials and how these difficulties were overcome.
The
next part details the analysis of various certified reference materials (CRMs) used
to validate the method, and the final part looks at a further problem caused by a
potential chemical interference and the initial attempts made to solve this
problem. Finally, the conclusion section discusses the optimisation and validation
of the proposed method.
This section will also highlight the problems and the
interferences encountered during the method development.
180
5.1.1 On-line Column Preconcentration
There have been many successful single element methods for determining
trace metals In seawater by on-line preconcentration with various
spectrometry detection systems, including ETAAS.
atomic
Review articles by Fang
a/.'°^ Ebdon et al.^'^ and Carbonell et al.^'^ highlight the diversity of the many
methods as well as the different detection systems used e.g. FAAS, ETAAS, ICPAES / MS.
There are two main types of columns (ion exchange and sorbent extraction)
used in the on-line systems as described in Section 13.2.3. The majority of the
preconcentration methods are not element specific, i.e. the ion exchange or the
chelating resin materials will react with a range of metals.
However, only ICP-
AES / MS offers a multi element detection and so some of the overall efficiency of
the method is lost by using a single element detection technique e.g. FAAS or
ETAAS.
Materials such as Chelex-100 or Dowex A-1 will react with many transition
elements, rare earth elements and some alkali and alkaline earth m e t a l s . I f the
sample contains a large excess of metals, then competition for the chelation sites
occurs between the various metals, causing loss of selectivity and sensitivity for
the weakly chelated metals, which are removed from the column by the more
strongly chelated metals. Better selectivity and a wider scope of applications are
achieved
by
sorbent
extraction^'^^
wherein
the
metal
chelates
(e.g.
dithiocarbamates) formed in solution are retained upon a column filled with a nonpolar modified silica with Ci8 groups bonded to the silica support, and the
subsequent
elution with the aid of an
spectrometer.
181
organic
solvent
directly
into
the
Dithiocarbamate reagents are commonly used as the chelating agent in
most published Fl sorbent extraction systems, however they are unstable in acidic
media and are unselective towards heavy m e t a l s . T h e
complexation of
dithiocarbamates with large number of metals {Figure 5.1) limits their application
to the separation of heavy metals from matrixes where coexisting heavy metals
are at low concentrations^^^ e.g. seawater matrices.
V
Nb
Or
Mo
W
Mn
Fe
Co
Ni
Cu
Ag
Re
U
Zn
Cd
Hg
Ga
In
Ti
Sn
Pb
Se
Te
Bi
Pu
Figure 5.1 : Periodic table showing elements that can be complexed with
diethyldithiocarbamate^^®
Diethylammonium N, N, diethyldithiocarbamate (DDDC) was chosen as the
complexing agent instead of sodium diethyldithiocarbamate (NaDDC) as it is
slightly more stable in acidic media.^^®
When using DDDC as the complexing
agent, the eluting solution would be ethanol rather than methanol due to safety
reasons.
The
complexation
reactions
and
mechanisms
diethyldithiocarbamates are fully explained by Hulanicki.^^°
182
of
the
5.1.2 Aims of Study
The aim of this study was to see if a simultaneous method for determining
trace metals in seawater by on-line column preconcentration with detection by
ETAAS could be developed from the successful single element methods already
developed. Initially seven elements were identified, Cd, Co, Cu, Fe. Mn, Ni and
Pb, although Co was discarded in early work, as it interfere with the Fe and Ni
lines.
5.2
Instrumentation
A Perkin Elmer SIMAA 6000 simultaneous multi-element electrothermal
atomic absorption spectrometer with a transversely heated graphite atomiser
(THGA) and longitudinal Zeeman effect background correction and an AS-72
autosampler were employed for this study.
Standard THGA graphite tubes with
integrated platforms were used. Multi element hollow cathode lamps and PerkinElmer
EDL
'System
2' electrodeless
discharge
lamps were
used for
all
experiments. The final optimised instrumental parameters are shown in Table 5.1
and THGA program in Table 5.2.
Flow injection (Fl) on-line column preconcentration was performed with a
Perkin-Elmer
FIAS
400
flow
injection
autosampler.
The optimised FIAS 400 program and flow rates are shown in
Tables 5.3 and 5.4.
183
system
equipped
with
an
AS-91
Parameter
Cd
Cu
Fe
Mn
Ni
Pb
228.8
324.8
248.3
279.5
232.0
283.3
Read Time / s
5
5
5
5
5
5
Read Delay / s
0
0
0
0
0
0
Type of Lamp
EDL
HCL
HCL
HCL
HCL
HCL
Wavelength / nm
Signal
Peak area
Measurement
Signal Type
Background correction AA
Table 5,1: Opfimised ETAAS instrumental parameters
Step
Temp
Ramp Time
Hold Time
G a s Flow
C
Is
Is
/ ml min ^
1
110
1
45
250
2
130
5
75
250
3
280
10
30
250
4
2400
0
5
0
5
2500
1
2
250
Table 5.2 ; Optimised THGA temperature programme for on-line column
preconcentrafion experiments
184
Time
Pump 1
Pump 2
Is
/rpm
/ rpm
Prefill
40
0
40
Inject
1
60
0
40
Fill
2
10
0
20
Inject
3
60
40
0
Inject
4
20
10
0
Fill
5
60
20
0
Inject
Table
5.3
; Optimised flow
injection
programme
Valve Position
for
on-line
column
preconcentration (36 ^il eluent loop)
Solution
Tubing
i.d
Flow rate
Flow rate
/ mm
/ ml min'^
/ rpm
Sample
blue / yellow
1.52
3.0
40
DDDC
blue / yellow
1.52
3.0
40
Ethanol
solvent
1.02
0.5
10
resistant
Acid wash
red / red
1.14
0.8
20
Air
red / red
1.14
2.4
40
Air
red / red
1.14
1.2
20
Table 5.4 : Tubing and flow rates used for original flow injection system
configuration
185
5.2.1 Reagents
All reagents used were of pro analysi grade (Merck, Darmstadt, Germany)
unless otherwise stated. Dilutions were made using deionised water (Nanopure,
Barnstead, USA).
Buffer Solution pH 9.0 : 0.03 mol l ' CH3COOH and 0.06 mol 1*' NH3
The acetic acid solution was prepared by diluting 1 ml of concentrated
acetic acid (Merck, Darmstadt, Germany) to 500 ml with deionised water. The
ammonia solution (Merck, Darmstadt, Germany) was prepared by diluting 1 ml of
concentrated ammonia solution to 1000 ml with deionised water. These solutions
were made when needed.
The buffer solution was prepared by adding the ammonia solution to the
acetic acid solution, and balancing the pH with appropriate volumes of either
solution until the desired pH value of 9.0 was obtained.
This solution was
prepared in 300 ml volumes and stored in a Nalgene bottle until used.
Complexing R e a g e n t : 0.05 % (m/v) DDDC In pH 9.0 buffer
This reagent was prepared by dissolving 0.05 grams of diethylammonium
N, N, diethyldithiocarbamate (DDDC) (Merck, Darmstadt, Germany) in 100 ml of
pH 9.0 buffer. This solution was prepared fresh daily.
Washing Solution : 0.02% HNO3
The concentrated nitric acid (Suprapur, Merck, Darmstadt. Germany) was
first distilled in a sub boiling quartz distillation apparatus as described by
M i t c h e l l . T h e final solution was prepared by diluting 20 |il of the distilled nitric
acid to 100 ml with deionised water. This solution was prepared dally.
186
Eluting Solution : Ethanol
The ethanol (Merck. Darmstadt, Germany) was first distilled in a sub boiling
quartz distillation apparatus as described by M i t c h e l l . O n c e
purified, the
ethanol was used as stated.
Analytical Columns :
The column materials used were :-
i) polygosil silica bonded reversed phase sorbent with octadecyl functional
groups (RP-Cie) 40-63 urn and
ii) octadecyl functional groups (RP-Cis) 40-63 lam bonded onto a polymeric
support material.
Two different column sizes were used.
The smallest column was the
analytical preconcentration column supplied by Perkin Elmer, in which the Ci6
material was pre-packed. The column was connected between two ports on the
FIAS valve by small lengths of 0.35 mm i.d. PTFE tubing.
The larger column was the on-line purification column for the complexing
agent.
This column was a 4.3 mm i.d. x 10 mm C270 cartridge guard column
(Upchurch Scientific, USA), which was manually packed with the required Cie
material.
The column was placed in-line between the eight port valve and the
convergence point for the sample and complexing reagent.
Each day, the
columns were flushed in both directions with ethanol to rejuvenated the columns
before use.^^^
187
Metal Standards :
The first set of working metal calibration standards were in the range 0-2.0
[iQ
and were made by stepwise dilutions from the original single element stock
standards (1000 mg 1'^ of the metal as nitrate in 0.5 mol 1'^ HNOa). The standards
were made up in 0.02 % HNO3 solution.
The second set of working metal calibration standards were made from the
stock GFAAS mixed element standard in 5% HNO3 (Perkin Elmer). The working
metal calibration standards were in the range as stated in Table 5.5.
The
calibration standards were made by stepwise dilutions from the original stock
standard and made up to volume with 0.02% HNO3.
Metal
Cone in stock std
mg
Standard range
r
Cd
5
Cu
50
0.01 -0.1
0.1 - 1.0
Fe
20
0.04 - 0.4
Mn
20
0.04 - 0.4
Ni
50
100
0.1 - 1.0
Pb
0.2-2.0
Table 5.5 : Concentration range of working standards and original stock
solution concentration of the multi element standard
5.3 Initial results and problems encountered during analysis
Calibration was first attempted with the instrument set up using the default
conditions as stated in Sec//on 2.4.3.3 and using the first mixed standard in the
188
range 0-2
\'\
A 36 ^1 eluent loop was chosen as this was the maximum
amount of ethanol that could be injected into the furnace by the FIAS without the
ethanol "creeping" off the tube platform. The initial results were encouraging in
that the preconcentration method was working for all six metals, but the blank
results were very high.
Large peaks were observed for all the standards, but
those for Fe and Cu showed signs of roll-over.
The
conclusion
from
this
study
was
that
a
serious
source(s)
of
contamination was present and which would have to be eliminated or reduced to a
minimum before the method development could proceed.
5.3.1 Sources of Contamination
Various potential sources of contamination exist originating from the
glassware used, the tubing in the FIAS and the reagents used in all the reactions.
All the glassware used was washed with 10% HNO3 and rinsed three times
with delonised water. When not in use the volumetric flasks and PFA bottles were
filled with deionised water and sealed to prevent atmospheric contamination.
Before use, the bottles were rinsed three times with deionised water.
All new
FIAS tubing was flushed with 10% HNO3 and then finally with deionised water
before use
The reagents however, remained a potential source of contamination.
A
large column {Section 5.2.1) containing Cie material and placed in-line was used
to clean up the complexing reagent. This remedy immediately reduced the blank
levels by half. The nitric acid originally used was pro analysi grade, but when this
was replaced by purified nitric acid (sub boiled) grade, the blank levels again
189
were reduced, but only slightly.
This left the ethanol as the last identified
contamination source.
To prove that the ethanol was indeed the source of contamination, a sub
boiling still was set up to purify the ethanol. This procedure was partly successful
as shown by the results in Table 5.6. The blank values were reduced for five out
of the six elements, but Fe still showed elevated levels.
The experiment was
performed by directly injecting 40 ^1 of the ethanol into the furnace and running
the default THGA program. Five replicates were run for both ethanol batches. It
has been suggested^^" that the Fe is organically bound to the ethanol, hence why
it is transferred from the contaminated to the clean ethanol in the distillation
process.
Thus since the contamination problem with the Fe was proving
problematic, it was removed from the list of metals to be determined.
Ethanol
Contaminated
Mean
Cleaned
SD
/ Int Abs
Mean
SD
/ Int Abs
Cd
0.0062
3.4
X
10'^
0.0006
3.0
X
10"^
Cu
0.0255
1.7
X
10"^
0.0133
9.6
X
10'^
Fe
1.3152
0.1200
8.3
X
10'^
Mn
0.0649
5.5
X
10"^
0.0052
1.0
X
10*^
Ni
0.0753
6.2
X
10'^
0.0043
2.4
X
10*^
X
10"^
0.0018
7.0x10*'
Pb
0.4013
0.0030
1.0
(n = 5) for both experiments
Table 5.6 ; Experimental results for both contaminated and clean ethanol
(after sub boiling purification)
190
Another possible contamination source was atmospheric contamination. It
was assumed that since all of the reactions took place in the closed system of the
FIAS tubing, atmospheric contamination should not affect the system.
5.3.2 Multi-element calibration graphs
Once the sources of contamination had been reduced to a minimum, a new
set of calibration graphs were prepared based on measurement of multi-element
standard prepared from the single stock solutions.
During the initial experiment
stages, all standards were analysed with five replicates, to provide sufficient data
for statistical analysis.
However, the resulting graphs were of poor quality with
inferior correlation coefficients, with no calibration possible for Ni due to uneven
peak signals. The statistical data for these first calibration graphs are shown in
Table 5.7.
The reason for these poor results was determined to be co-
contaminants present in the single element standards which had been used to
make the multi element s t a n d a r d . T h e contamination present in the single
element standards are at low levels but due to the sensitivity of the instrument and
the preconcentration factor applied by the method, these low concentrations were
multiplied and caused the errors noted in the calibration graphs.
The next set of calibrations used the GFAAS mixed standard. This original
stock standard contained Pb at 1000 |ig mr\ Cu and Ni at 50 ^g mr\ Mn and Fe
at 20 |ig ml'^ and Cd at 5 |ig \'\
These values reflect the relative sensitivities of
the metals in the ETAAS. With these new working standards (calibration range
stated in Table 5.5) made by dilution of the original stock standard, very much
191
better calibration graphs were obtained, and the statistical data are shown in
Table 5.8.
Cd
Cu
Mn
Ni
Pb
Slope
0.2937
0.0069
0.0913
-
0.0211
Intercept
-0.0079
-0.0004
-0.0033
-
-0.0010
0.9739
0.8922
0.9539
-
0.9297
Blank/A
0.0033
0.0033
0.0044
0.0045
0.0016
SD
0.0010
0.0020
0.0014
0.0031
0.0006
IDL/pg
1.4
26.7
9.55
-
4.05
MDL / ng 1'^
50
1410
130
-
210
Cone range
0.2 -0.6 uq
Table 5.7 ; Calibration data obtained from using multi-element standards
prepared from single element stock solutions
Cd
Cu
Mn
Ni
Pb
Slope
3.3678
0.0170
0.0755
0.0165
0.0116
Intercept
0.0019
0.0008
-0.0003
-0.0002
0.0001
r'
0.9925
0.9954
0.9971
0.9982
0.9986
Blank/A
0.0035
0.0043
0.0014
0.0019
0.0014
SD
0.0026
0.0050
0.0011
0.0026
0.0011
IDL / pg
6.7
25.6
1.1
14.2
8.5
MDL / ng l '
3
1086
66
60
40
Cone range
See Table 5.6
Table 5.8 ; Calibration data with G F A A S mixed multi element standard
192
5.3,3 Optimisation of the furnace parameters
When consistent atomisation signals were being attained from the metal
standards solutions, the peak shapes were observed more closely. The default
furnace
parameters
were
determined
by
choosing
the
lowest
pyrolysis
temperature (Cd at 400"C) and the highest atomisation temperature (Ni at
2300°C), and these conditions potentially needed further optimisation.
Two problems regarding the peak shapes were observed. The nickel peak
showed signs of tailing and did not return to the baseline within the read time
period of five seconds. The cadmium peak, showed a negative baseline before
the start of the peak. For nickel, the problem was eventually removed, by raising
the alomisation temperature.
At 2350°C there was a slight improvement, but a
much better peak shape with baseline resolution was attained at 2400"'C.
The
clean-out temperature was 2500'*C. The increase in atomisation temperature also
had two other effects on the analysis, in that the other peaks shapes became
slightly sharper and with the increased clean-out temperature, the tube lifetime
decreased.
Solving the problem of a negative baseline for cadmium was slightly more
difficult.
The pyrolysis temperature was decreased in steps of 50**C to a final
temperature of 200*0 when poor peak shapes were seen for the other elements.
The final solution was achieved by decreasing the pyrolysis temperature slightly
to 280'*C and increasing the hold time from 20 to 30 seconds for the pyrolysis
step.
193
5.3.4 Optimisation of the flow injection system parameters
The next stage for the optimisation was the flow injection parameters to be
investigated i.e. length of each step, flow rates, tube lengths, and in the case of
the delivery tube, the length and the internal diameter of the tube.
The two most important steps to optimise were the prefill step and the
sample introduction step. The FIAS prefill step had to be long enough to ensure
that fresh sample was reaching the valve before the new preconcentration step
was started. The sample introduction step was optimised by watching the eluent
slug reach the furnace.
5.3.4.1 Pulsation in the flow injection system
During the analysis of the standards, pulsation was observed in the sample
and reagent line around the convergence point.
In one extreme case, the
complexing reagent flow was observed to be flowing backwards towards the
reagent reservoir.
It was assumed that this pulsation was the cause of the
imprecision observed for the standard replicates (i.e. RSD values greater than
10%).
The original FIAS configuration used 1.52 mm i.d. pump tubing for both
sample and complexing reagent lines {Table 5.4). Various combinations of this
and 1.14 mm i.d. tubing were tried to reduce the pulsation.
In order to. help
observe the pulsation, an air bubble was introduced into the line and its passage
was noted, i.e. if the pulsation did not occur then the air bubble would have a
smooth passage through the tubing.
194
Fang^^^ has suggested three ways to minimise pump pulsation :
i) use sufficiently high rotation speeds, with the rollers pressing the pump
tubing no less than 200 times per minute,
ii) use short pump tubes on the downstream to minimise the "bellows
effect",
iii) lubricate pump tubes with silicon oil.
In order to make the optimisation process easier, the flow rates were kept
as close as possible to the original slated flows of 3.0 ml m i n ' \ as higher flows
resulted in too much back pressure and caused the tubes to rupture (at approx. 5
ml min"^).
In addition, if the flow rates were reduced too much, longer
preconcentration times would be required to produce the same response, hence
increasing the overall time for the analysis.
Taking into account the suggestions of Fang^^® and recognising the flow
rate limitations, the answer to the problem was to use a smaller internal diameter
tubing (1.14 mm i.d.) rather than the previous larger diameter (1.52 mm i.d.)
tubing for both reagent and sample lines. No pulsation was observed as the air
bubble had a smooth passage through the tubing.
A calibration graph was
attempted with this new tubing configuration, but unfortunately the calibration
failed since no signals were recorded. It was concluded that for complexation to
occur between the metal and the DDDC, some mixing in the tubes was required.
The original calibration graphs were re-produced when the original (1.52 mm i.d.)
tubing was re-installed and the old flow rates used, but of course, the poor
precision remained.
195
5.3.4.2 Minimisation of Tube Lengths
The most important tube length to be kept to a minimum is the tube
between the convergence point and the column, because as soon as the DDDC
mixes with the sample, the metal-DDC complexes are formed. If the tube is not
kept to a minimum, some complex could be retained and not eluted with the
ethanol as it does not flow through this piece of tubing.^
When the first experiments were run, the FIAS unit was placed on a table
about 50 cm below the level of the furnace. This meant that the sample in the
delivery tube, had to flow uphill from the valve to the autosampler arm and then to
the furnace. This operation required a substantial pressure in the air flow line.
The original delivery tube was PTFE tubing with a 0.7 mm internal diameter and a
length of approx. 70 cms. It was observed that the ethanol when flowing up the
tube would start off in one single slug but by the time it reached the furnace head,
it had become fragmented and it seemed as though some liquid was flowing back
down the tube under gravity rather than being pumped out of the tube. Hence not
all the ethanol plus desorbed analyte were being transported to the furnace for
the measurement step.
The problem was solved in two stages.
The first stage was to raise the
FIAS unit to a level where the top of the valve was just below the furnace head so
the ethanol then only had a slight incline to flow up under air flow. If the FIAS was
raised above the furnace head, there was less control on the eluent delivery step
due to gravity forcing the ethanol down the tube.
The second stage involved using a smaller
internal diameter tube;
eventually 0.3 mm was chosen and used for all future experiments. The greatly
196
reduced internal volume of the delivery tube allowed the front end of the sample
slug to be entering the furnace while the tail would still be in the column. In this
way, the slug tended to remain in one piece and not become fragmented, which
helped to improve precision.
5.3.5 First injection problem
It was hoped that after optimising the furnace / flow injection parameters
and
solving
the three
previous
problems,
(contamination,
calibration
and
pulsation) that the method could be validated.
However, it was noted that there was a problem with the first sample run in
any batch, i.e. the first run was always significantly higher than replicate
injections. This was thought to be due to the fact that before the first injection, the
column was washed with acid during the prefill step.
In order to investigate this further, an experiment was conducted, where an
extra step (identical to the prefill step) was added to the end of the FIAS program.
Thus after every measurement step, the column was washed with the acid
washing solution before the next preconcentration step.
The results obtained
showed a high result for the first injection, and then poor and imprecise results for
the replicates.
Different configurations of flow rates and pump speeds were evaluated to
solve this problem, including halving the flow rate of the acid washing solution and
reducing the time for the step. A detrimental effect was seen on the precision of
the standards and samples, as a result of these different configurations.
197
This
effect was due to the same pump controlling all three reagent lines, i.e. sample,
acid washing solution and complexing reagent.
A potential solution to this problem would, therefore, have been to remove
the prefill step or stop the acidic washing solution from flowing through the column
during this stage. However, this was not possible since :-
i) the prefill step was required to ensure that only the new sample is
present during the preconcentration step and
ii) due to the way the FIAS is configured, the acid is always being pumped
at the same time as the reagent / sample.
5.4 Reconfigured flow injection system
As suggested in Section 5.3.5, a potential way to remove the first injection
problem was to re-configure the flow injection system so that the acid sample was
not being pumped duhng the prefill step prior to the next analysis, since no
alternative could be provided for flushing the old sample from the tubing and
replacing it with new sample.
To achieve the new configuration (Figure 5.2), the addition of a third pump
to control the flow of the acid washing solution was required. This arrangement
also had the advantage of allowing for more control over the manipulation of
solutions during the preconcentration operation (Table 5.9).
The new configuration, contained the eight port value and the two original
pumps.
However, now Pump No 2 only controlled the pumping of the sample
solution and the DDDC reagent.
Pump No 1 controlled the air and the ethanol
198
desorbing solution.
The third auxiliary pump controlled only the acidic wash
solution and was under control of the FIAS system.
Pump No 3
Nitric Acid
Pump No 1
Eluent Loop
Ethanol
Clean Up Column
DDDC
Sample
Pump No 2
Eight port valve in Inject position
W = Waste, AC = Analytical Column. ET = To ETAAS
Figure
5.2 ; Reconfigured flow injection system on-line
multi-element
preconcentration by electrothermal atomic absorption spectrometry
In the original system the acid wash solution was controlled by Pump No 2,
so when the prefill operation was initiated, the sample and DDDC solution filled
the tubing and then flowed to waste.
At the same time, the acid wash solution
flowed through the silica column. It is this acid washing step that was believed to
199
have caused the activation of complexation sites upon the silica support material
which contributed to the poor precision problem with the first injection.
Time
Pump 1
Pump 2
Pump 3
Is
/ rpm
/ rpm
/ rpm
Prefill
40
0
100
0
Inject
1
60
0
100
0
Fill
2
10
0
0
10
Inject
3
60
40
0
0
Inject
4
20
10
0
0
Fill
5
60
20
0
0
Inject
Valve Position
Table 5.9 ; Optimised flow injection program for re-configured on-line
column preconcentration (36 ^i eluent loop)
By removing the acid solution from this pump, this solution only flowed
through the column during the acid washing step, and for a shorter length of time.
This step only occurred after the preconcentration operation, when the previously
activated silica sites had been complexed with excess DDDC reagent.
A number of other advantages were also been noticed when using the new
configuration. These included less reagent consumption per sample, and more
control over the flow rates.
The pump tubing (Table 5.10) for the sample and
DDDC reagent lines (0.76 mm i.d.) required high pump rates to achieve the
previous flow rates (approx. 3 ml min'^).
These high pump rates would have
caused the acid line to rupture using the old configuration. They also improved
the precision of the method. During this re-configuration, a fume extraction hood
200
was fitted over the FIAS 400 and the furnace
to remove any
possible
contamination from the atmosphere.
Solution
Tubing
i.d
Flow rate
Flow rate
/ mm
/ ml min'^
/ rpm
Sample
black / black
0.76
2.4
100
DDDC
black / black
0.76
2.4
100
Ethanol
Solvent
1.02
0.75
10
resistant
Acid wash
red / red
1.14
5
50
Air
red / red
1.14
2
40
Air
red / red
1.14
1
20
Table 5.10 : Tubing and flow rates used for re-configured flow injection
system
5.4.1 Comparison of two different Ci8 support materials.
Two different support materials (the original silica support and a new
polymeric
support
material)
were
compared
configuration set up described in Section 5.4.
using
the
new
instrumental
The silica support is a rough
irregular shaped support to which the Cis is bonded, while the polymeric material
is a regular shaped spherical support, smaller in size than the silica support
material. At present this is all that is known about these two materials.^^^
Tables
5.11 and 5.12 show the analytical figures of merit used to compare and contrast
the two support materials.
201
Both columns show similar figures of merit for most of the metals, with the
exception of Mn on the polymeric support column, which exhibits very much lower
absorbance values for the top standard than were obtained with the silica column.
The polymeric material shows better blank levels for all but Cd.
Cd
Cu
Mn
Ni
Pb
Slope
0.5260
0.0527
0.0807
0.0406
0.0325
Intercept
0.0001
-0.0059
0.0004
0.001
-0.0009
0.9988
0.8994
0.9967
0.9903
0.9980
Blank / Int Abs
0.0054
0.0215
0.0010
-0.0013
0.0025
Std Devn (n = 3)
0.0008
0.003
0.0006
0.0011
0.0005
Top Std / Int Abs
0.0394
0.0191
0.0245
0.0349
0.0465
0.075
0.75
0.3
0.75
1.5
Method DL / ng 1*'
15
690
30
25
151
Instrumental DL / pg
1.6
14.1
0.8
3.0
1.6
Cone of Std / ng 1 ^
Table 5.11: Analytical figures of merit for silica support material
Cd
Cu
Mn
Ni
Pb
Slope
0.5139
0.0269
0.0142
0.0290
0.0312
Intercept
0.0011
-0.0047
-0.0007
-0.0011
-0.0002
0.9980
0.9994
0.9993
0.9981
0.9998
B l a n k / I n t Abs
0.0065
0.0066
0.0000
-0.0002
0.0017
Std Devn (n = 3)
0.0004
0.0004
0.0002
0.0014
0.0002
Top Std / Int Abs
0.0383
0.0200
0.0042
0.0213
0.0464
Cone of Std / ng 1'^
0.075
0.075
0.3
0.75
1.5
Method DL / ng 1'^
13
464
92
175
79
Instrumental DL / pg
0.1
2.2
1.5
5.9
0.7
Table 5.12 : Analytical figures of merit for polymeric support material
202
In this work, there appeared to be a contamination problem for Cu with the
silica material.
Efforts were made to reduce this value but these were
unsuccessful. The polymeric material gave better precision for all the standards
than the silica material, and also gave better correlation data but this is probably
due to the precision for this material being better than the silica.
The polymeric material gave lower detection limits for three of the five
metals (Cd. Cu and Ni) and a high result for Mn (157 ng
the silica material).
contamination
c.f. 25 ng 1'^ for Mn with
Both materials showed high Cu results (due to the Cu
in the silica column material), which were reflected in the
corresponding poor detection limits for both columns, Polymeric 464 ng 1"^ and
690 ng 1"^ for Cu on the silica material.
5.4.2
Analysis of Certified Reference Materials NASS-1. NASS-4 and
CASS-3.
Using the reconfigured flow injection system, it was decided to validate the
proposed method by the direct analysis of three appropriate CRMs. The CRMs
chosen were two open ocean waters NASS-1 and NASS-4 and one coastal water
CASS-3. The concentrations of the five elements in the CRMs are shown in Table
5.13. With the exception of Mn in the CASS-3 CRM, all the analytes fall within the
calibration range but Pb is at an extremely low level in all three reference
materials.
203
NASS-1
NASS-4
HQ r'
ng I'
Cd
0.029 ±0.004
0.016 ± 0 . 0 0 3
0.030 ± 0 . 0 0 5
Cu
0.099 ±0.010
0.228 ±0.011
0.517 ±0.062
Mn
0.022 ±0.007
0.380 ±0.023
2.510 ± 0 . 3 6 0
Ni
0.257 ±0.027
0.228 ± 0 . 0 0 9
0.386 ±0.062
Pb
0.039 ± 0.006
0.013 ± 0 . 0 0 5
0.012 ±0.004
CASS-3
Table 5,13 : Concentration of the five selected elements in three Certified
Reference Materials, NASS-1 and NASS-4 and C A S S - 3 .
NASS-1
NASS-4
HQ I '
CASS-3
ng
Cd
0.047 ±0.006
0.009 ± 0 . 0 0 3
0.030 ±0.013
Cu
0.072 ±0.062
-0.169 ±0.012
-0.022 ±0.035
Mn
0.025 ± 0 . 0 0 6
0.113±0.018
0.974 ±0.118
Ni
0.353 ± 0 . 0 9 5
0.008 ± 0.003
0.127 ±0.051
Pb
3.178 ±0.494
0.369 ± 0 . 0 9 8
0.564 ± 0 . 2 8 0
Table 5.14 : Experimental results for all three reference materials using a
silica support column
NASS-1
NASS-4
CASS-3
Mg I'
ng r'
HQ I '
Cd
0.083 ± 0.032
0.047 ± 0 . 0 1 5
0.051 ±0.005
Cu
0.175 ± 0 . 0 2 6
0.123 ± 0 . 0 0 3
0.374 ±0.053
Mn
0.065 ±0.017
0.211 ±0.012
1.195 ±0.037
Ni
1.126 ± 0 . 5 6 4
0.464 ± 0 . 1 2 5
0.610 ±0.051
Pb
4.650 ±0.801
1.125 ± 0 . 0 4 9
2.108±0.119
Table 5.15 : Experimental results for all three reference materials using a
polymeric support column
204
Table 5.14 and 5.75 shows the results for each of the three RMs with the
silica and polymeric column support materials respectively.
Before analysis, the
reference materials were adjusted to pH 2.5 with concentrated ammonia solution,
since when analysed without buffering, no peak signals were observed.
5.4.2.1 Summary of work potential with Certified Reference Materials
Overall, the results obtained for the analysis of the CRMs with both
columns were not good and with all results outside the certified ranges. Clearly,
other factors such as matrix interference and standard stability were affecting the
analysis of these materials.
Further trials were therefore conducted to investigate these factors and in
particular to investigate the effect of the matrix (NaCI) upon the analysis of the five
metals and the stability of the calibration standards.
5.4.3 Matrix interference experiment
In this experiment, with a silica column, the top metal standard (Cd 0.1, Cu,
Ni 1.0. Mn 0.4 and Pb 2.0 \IQ 1'^) was analysed in increasing amount of simulated
sea water i.e. sodium chloride solution to determine the effect of the matrix on the
analysis. In theory, this should not have been a problem since the matrix should
have been washed straight through the column so that only the metals were
retained upon the column.
The results for each metal in this experiment are
shown graphically in Figure 5.3a~e.
205
Matrix Interference Experiment (Cd)
0.06
• Mean Int Abs
0.04
S
0-02
0.3
0.5
1
1.5
Cone of NaCI (%)
Figure 5.3a : Results for matrix interference experiment for cadmium
Matrix Interference Experiment (Cu)
0.07
• Mean Int Abs
0.06
(A
^
<
0.05
^
0.04
C
0.03
^
0.02
0.01
0
0.3
0.5
1
1.5
Cone of NaCI {%)
Figure 5,3b : Results for matrix interference experiment for copper
206
Matrix Interference Experiment (Mn)
0.007
I • Mean Int Abs
0.008
'4'
0.005
0.004
c
S
0.003
'J' >
0.002
MM
0.001
0
0.3
0.5
1
1.5
Cone of NaCI (%)
Figure 5.3c : Results for matrix interference experiment for manganese
Matrix Interference Experiment (Ni)
0.03
• Mean Int Abs |
n
<
0.02
c
S
0.01
• • •
0.3
0.5
1
1.5
3
Cone of NaCI (%)
Figure 5,3d: Results for matrix interference experiment for nickel
207
Matrix Interference Experiment (Pb)
^
0.06
• Mean Int Abs
crt
t/i 0.04
n
<
c
c
n
0.02
o
im
0
0.3
0.5
1
1
•
P
1.5
3
Cone of NaCI (%)
Figure 5.3 e ; Results for matrix interference experiment for lead
5.4.3.1 Summary of results from matrix experiments
All five elements showed an interference i.e. a suppression of the standard
signal in the presence of 0.3-3.0% sodium chloride. This was not expected since
the matrix should have been washed straight through the column and not
retained.
Two possible explanations are that :i) the acid wash step was not flushing the column of remaining matrix and
ii) the silica sites which are activated by the acidic solution are retaining
some matrix which is being elated to the furnace along with the metalDDC complex.
208
5.4.4 Stability of standard solutions
The stability of the standard solutions was tested by running a calibration
graph (blank and four standards) after new stock standards had been made. A
time delay of 90 mins was then introduced before the next calibration graph was
produced. This procedure was then repeated to obtain a total of four calibration
graphs.
The results for the low standard and a higher standard are shown in
Tables 5.16 and 5.17 respectively.
Cd
Cu
Mn
Ni
Pb
0.01
0.1
0.04
0.1
0.2
/ Int Abs
/ Int Abs
/ Int Abs
/ Int Abs
/ Int Abs
0 mins
0.0260
0.0145
0.0080
0.0122
0.0287
90 mins
0.0256
0.0144
0.0080
0.0121
0.0287
180 mins
0.0250
0.0096
0.0071
0.0102
0.0259
270 mins
0.0031
0.0108
0.0325
0.0006
0.0086
Cone / ng 1'^
Table 5.16 : Stability test on the low concentration multl element standard
Cd
Cu
Mn
Ni
Pb
0.05
0.5
0.2
0.5
1.0
/ Int Abs
/ Int Abs
/ Int Abs
/ Int Abs
/ Int Abs
0 mins
0.1061
0.0479
0.0323
0.0645
0.1199
90 mins
0.1056
0.0475
0.0318
0.0637
0.1182
180 mins
0.0889
0.0371
0.0261
0.0442
0.1078
270 mins
0.0053
0.0303
0.1218
0.0030
0.0234
Cone l[ig
Table 5.17 : Stability test on the high concentration multi element standard
209
5.4.4.1 Summary of results obtained for the stability tests
Both the high and low standards are stable for up to 90 mins. with
significant loss of absorbance being reported after 180 mins i.e. Cu (0.1 |ig 1'^)
standard dropping to 2/3 of original absorbance.
This would indicate that fresh
standards have to be made every two to three hours to ensure good reliability in
the analytical results. As each sample takes 20 mins for three replicates, only 9
samples can be analysed before re-calibration with fresh standards is required.
5.5 Conclusion
Once the initial contamination problems been minimised, and the system
parameters
optimised
to
produce
reproducible
signals,
there
was
every
expectation that the method would work on real samples and successfully
validated. There would appear to be no problem using the compromise furnace
conditions as good peak shapes and reasonable calibration graphs
were
obtained. There has been one reported paper"^ in the literature, of the use of the
eight port valve for an on-line sorbent preconcentration experiment using Cia on a
silica support.
Welz and co-workers observed different sensitivities depending
upon the wash solution used. They attributed the change in sensitivities to the
dual retention behaviour of the Cie material.
Clearly the most frustrating problem is the poor results obtained for the
CRMs.
The matrix interference experiment indicated some interference by the
matrix. The stability of the standards has been shown to be reasonable as long
as fresh standards are made approximately every three hours.
210
Chapter Six : Conclusion,
Discussion and Future Work
211
Chapter Six : Conclusion, Discussion and Future
Work
6.1 Conclusion
As stated in Section 1.7, the fundamental aim of this study, was to
investigate the possibilities for the determination of trace elements
in
environmental samples following separation / preconcentration of the sample
on-line where possible prior to detection by ETAAS.
A major study was undertaken on the determination of mercury. This
work used the technique of cold vapour generation to remove the analyte
(mercury) from the environmental matrix (tuna fish and sediment samples).
Since the mercury was bound to the matrix, an off line digestion method was
employed to release the mercury from the matrix and present it in a form
suitable for analysis. The use a microwave assisted digestion method was
evaluated due to its ease of operation and short reaction time i.e. five mins
per digestion.
The method resulting from this study was able to achieve a sample
throughput of 20-30 samples per hour, and offered a detection limit of 0.2 ng
g"^ (3s) with a precision of less than 10% at the 0.1 ^g g'^ level for sediment
samples.
An interference study was conducted and although not totally
exhaustive indicated that seven important elements ( A s \ Cd", Cu", Ni", Pb".
212
Sb^ and Se^') gave a less than 5% interference when the interferent
concentration was at least 2 orders of magnitude greater than the Hg.
In
addition, Ag' showed 9% interference at just one order of magnitude greater
than Hg.
Thus the determination of Hg in environmental and biological
samples has been successfully achieved.
The hydride forming elements were also studied with a view to
developing a method for the simultaneous determination of four hydride
forming elements in water samples. Initial experiments showed the potential
for simultaneous trapping Bi and Se on an Ir coated graphite tube after
hydride generation in a flow injection system. This approach allowed for the
high sample throughput (30-40 per hour) and high precision (less than 2% at
3.0 |ig
level) with little operator assistance.
Further
experiments
characterised the limitations of the method, and revealed that only certain
elements in particular oxidation states could be analysed together.
Arsenic
and Sb can be determined in either oxidation state but are more sensitive in
oxidation state III, while Se and Te must be in oxidation state IV.
Careful
selection of elements and oxidation states was therefore required along with
careful choice of reducing
or oxidising
agents to facilitate
maximum
sensitivity. This study also revealed that Hg severely influenced the optimal
instrumental parameters (pyrolysis and atomisation temperature) and should
therefore be determined by an alternative method e.g. CVAAS.
In the final stage of this investigation two groups of elements Group A
(As, Bi and Sb) and Group B (Bi and Se) were identified and used
213
successfully in the analysis of lake water samples.
Key to defining these
groups was the nature of the reducing agent used to reduce all the elements
to the lowest oxidation state, i.e. Group A used L-cysteine while Group B
used concentrated HCI and an elevated temperature.
The method gave
detection limits of 0.82, 0.04. 0.26 and 0.29 ng 1'^ (500 ^\ sample loop) for As,
Bi, Sb and Se respectively. The characteristic masses recorded were 177 pg
for As, 91 pg for Bi. 107 pg for Sb and 90 pg for Se upon an Ir coated tube.
During validation of the method good agreement was obtained with certified
and standard reference materials and the method was successfully applied to
the determination of As, B i , Sb and Se in lake water samples.
A comparison of Ir- and Zr- tube coatings was also undertaken and
clearly showed that Ir was the material better suited for simultaneous multielement hydride trapping.
A number of areas can be identified from this study for future work.
Extending the range of hydride forming elements which can be determined
simultaneously would clearly be advantageous.
This would require a more
in-depth study of appropriate oxidation states. The identification of a "magic
bullet" reducing agent which will reduce all the elements to the most sensitive
states, but without reducing them to the ground state e.g. L-cysteine will
reduce Se^' to Se'^ and then to Se*' would obviously be the ultimate aim. The
present range of elements which can be analysed together is shown in Table
6.1.
214
A variety of alternative environmental matrices could also be examined
to evaluate the method, either directly or in a slightly modified form for other
applications.
The results from this current work are only the first of what
could be a very interesting and promising area of analysis, allowing multi
element
determinations
after
separation
from
the
matrix
and
a
preconcentration of the sample in the graphite tube.
Can be analysed together
Cannot be analysed together
Figure 6.1:
Diagram showing whether various different elements can be
or cannot be analysed together by simultaneous multi element in
atomizer trapping
215
In latter
stages
of
this work,
the
simultaneous
multi
element
determination of trace metals in seawater was evaluated, but was not found
to work well. The majority of the contamination problems from the reagents,
tubing, containers and from the atmosphere were successfully eliminated or
reduced to a minimum. However, the largest contamination problem, caused
by Fe present in the ethanol, (even after sub boiling distillation) prevented
sensitive calibration.
This is due to the Fe being organically bound in the
ethanol and hence transported with the ethanol.
removed from the study.
For this reason, Fe was
Once the contamination problems had been
resolved, an interference problem was noted during the analysis of reference
materials. There are two potential causes for this >
i) competition between the various metal DDC complexes for binding
sites on the column, i.e. quantitative retention was not occurring or
ii) an interference was being retained upon the column which eluted
with the complexes into the furnace causing poor precision and
reproducibility.
Further work must therefore address this interference problem to aid
validation of the proposed method. Lancaster et a/."® have suggested that
when using a silica column material there is competition between the
chelating agent and the silanol groups for binding the metal. The metal that
binds to the silanol group can be removed by a pH change across the
column, while the metal-chelate can only be removed by a change in polarity,
216
therefore no one solution can remove all the metals in one pass through the
column. This interaction could be responsible for the poor results obtained in
this study.
This may prove a useful starting point in characterising this problem,
which when better understood may be resolved by using a different sorbent
material and possibly a polymeric support instead of a silica column material
(e.g. fullerene^^^). The use of a more selective complexing agent may also be
used to retain only selected metals allowing the rest to flow to waste with the
matrix.
Overall, this study has shown that novel methods employing flow
injection methodologies for separation and preconcentration are a viable way
to prepare environmental samples for analysis by ETAAS.
Further it has
demonstrated that multi-element analysis is possible for low levels of analyte
despite the presence of troublesome matrices, although further work is
required to achieve the ultimate goal of a universal method suitable for all
analytes irrespective of the sample type.
217
Chapter Seven : References
218
Chapter Seven : References
7.1 References
1)
Pietrzyk, D.J., and Frank. C.W., "Analytical
Chemistry", Academic Press.
New York. Second Edition. 1979, ch. 1. pp. 1-9.
2)
Fifield, F.W., and Haines, P.J., "Environmental
Analytical
Chemistry",
Blackie, London, 1995. ch. 15, pp. 320-351.
3)
Dean. J.R.. "Atomic Absorption and Plasma Spectroscopy",
ACOL, Wiley,
Chichester, Second Edition, 1997, ch. 1, pp. 1-20.
4)
Howard. A., and Statham, P., "Inorganic
Trace Analysis
Philosophy
and
Practice", Wiley. Chichester. 1993. ch. 1. pp. 1-12.
5)
6)
Vandecasteele. C , and Block, C.B., "Modern Methods for Trace Element
Determination",
Wiley, Chichester. 1993, ch. 1, pp. 1-8.
Fifield, F.W.,
and Keaiey, D.,
"Principles
and
Practice
of
Analytical
Chemistry", Blackie, London, Fourth Edition, 1995, ch. 1, pp. 1-13.
7)
Dean, J.R., 'Atomic Absorption and Plasma Spectroscopy",
ACOL, Wiley,
Chichester, Second Edition, 1997, ch. 2, pp. 21-31.
8)
Browner, R.F., and Boorn, A.W.. Anal. Chem., 1984, 57(7), 786A.
9)
Fifield, F.W..
and Keaiey,
D.,
"Principles
and
Practice
of
Analytical
Chemistry", Blackie. London. Fourth Edition, 1995, ch. 4, pp. 55-183.
10)
Vandecasteele. C , and Block, C.B.. "Modern Methods for Trace
Determination",
11)
Element
Wiley, Chichester. 1993, ch. 2, pp. 10-53.
Howard, A.G., and Statham, P. J., "Inorganic Trace Analysis Philosophy and
Practice". Wiley, Chichester. 1993. ch. 7. pp. 113-160.
219
12)
Tolg, G., Talanta, 1972, 19, 1489.
13)
Tsai, W.C., and Shiau, L.J., Anal. Chem., 1977, 49, 1641.
14)
Leyden, D.E., and Wegscheider, W., Anal. Chem., 1981, 53, 1059A.
15)
Torre, M., and Marina, M.L., Critical Reviews in Analytical Chemistry, 1994,
24(5&6), 327.
16)
Volynsky, A.B., Spivakov, B.Y., and Zolotov, Y.A., Talanta, 1984, 31(6),
449.
17)
Shabani, M.B., Akagi, T., Shimizu, H., and Masuda, A., Anal. Chem., 1990,
62, 2709.
18)
Filippelli, M., Analyst, 1984, 109, 515.
19)
Danielsson, L-G., Magnusson, B., Westerlund, S., and Zhang, K., Anal.
Chim. Acta, 1982, 144, 183.
20)
Batterham, G.J., and Parry, D.L., Marine Chemistry, 1996, 55, 381.
21)
Kinrade, J.D., and Van Loon, J.C., Anal. Chem., 1974, 46(13), 1894.
22)
Johnson, C.A., Anal. Chim. Acta, 1990, 238, 273.
23)
Baffi, F., and Cardinals, A., Intern. J. Environ. Anal. Chem., 1990, 41, 15.
24)
Pyrzynska, K., Analyst, 1995, 120, 1933.
25)
Ion Exchange Resins, Sixth Edition, Product No 57020 4G, BDH Limited,
Poole, UK.
26)
Kingston, H.M., Barnes, I.L., Brady, T.J., Rains, T.C., and Champ, M.A.,
Anal. Chem., 1978, 50(14), 2064.
27)
Pai, S - C , Anal. Chim. Acta, 1988, 211, 271.
28)
Sturgeon, R.E., Berman, S.S., Willie, S.N., and Desaulniers, J.A.H., Anal.
Chem., 1981, 53, 2337.
220
29)
Thompson, M.. Ramsey. M.H., and Pahiavanpour, B.. Analyst, 1982, 107,
1330.
30)
Dedina, J., and Tsalev. D.L., "Hydride
Generation
Atomic
Absorption
Spectrometry", Wiley, Chichester. 1995.
31)
Matuslewicz. H.. and Sturgeon, R.E., Spectrochim. Acta, 1996, 51B, 377.
32)
Nakamura. T., Oka. H., Ishii, M., and Sato. J.. Analyst, 1994,119. 1397.
33)
Fang, Z., "Flow Injection Separation and Preconcentration",
VCH, Germany,
1993, ch.1. pp.1-19.
34)
Browner, R.F., and Boorn. A.W., Anal. Chem., 1984. 57(7). 875A.
35)
Jacintho. A.O., Zagatto. E.A.G., Bergamin, F.H.. Krug, F.J., Reis, B.F.,
Bruns, R.E.. and Kowalski, B.R., Anal. Chim. Acta, 1981, 130, 243.
36)
Fang, Z., Tlow Injection Separation and Preconcentration",
VCH, Germany,
1993.
37)
Fang,
Z,
"Flow
Injection
Atomic
Absorption
Spectrometry",
Wiley,
Chichester, 1995.
38)
Gallego, M., Luque de Castro, M.D., and Valcarcel. M., At.
Spectrosc,
1985, 6(1). 16.
39)
Tyson. J.F., Spectrochim. Acta. Rev., 1991, 14(3), 169.
40)
Burguera, J.L., and Burguera. M., J. Anal. At. Spectrom., 1997, 12, 643.
41)
Skeggs, L. Am. J. Clin. Path., 1957. 28, 311.
42)
Ruzicka, J. and Hansen, E.H., "Flow Injection Analysis", Wiley, New York,
First Edition, 1981.
43)
Ruzicka, J. and Hansen, E.H., "Flow Injection Analysis", Wiley, New York,
Second Edition, 1988.
221
44)
Fang,
Z,
"Flow
Injection
Atomic
Absorption
Spectrometry",
Wiley.
Chichester. 1995, ch. 11, pp. 218-228.
45)
Tsalev, D.L.. Sperling, M. and Welz, B.. Analyst, 1992. 117, 1729.
46)
Burguera. M., and Burguera. J.L., Anal. Chim. Acta, 1986, 179. 351.
47)
Burguera. J.L., and Burguera, M., J. Anal. At. Spectrom., 1993, 8. 235.
48)
Fang, Z., "Flow Injection Separation and Preconcentration",
VCH, Germany.
1993. ch. 3. pp. 47-83.
49)
Luque de Castro. M.D.. J. Auto. Chem., 1986, 8(2). 56.
50)
Backstrom, K., Danielsson, L-G.. and Nord. L.. Analyst, 1984. 109, 323.
51)
Backstrom, K.. and Danielsson, L-G., Anal. Chim. Acta, 1990, 232, 301.
52)
Fang. Z., "Flow Injection Separation and Preconcentration",
VCH, Germany,
1993. ch. 4. pp. 85-128.
53)
Olsen, S.. Pessenda. L.C.R., Ruzicka, J., and Hansen, E.H., Analyst, 1983,
108, 905
54)
Ruzicka. J., and Arndal, A.. Anal. Chim. Acta, 1989, 216. 243.
55)
Fang, Z., Sperling, M., and Welz. B.. J. Anal. At. Spectrom., 1990, 5, 639.
56)
Fang, Z. Ruzicka, J., and Hansen, E.H., Anal. Chim. Acta, 1984. 164, 23.
57)
Mohammad. B.. Ure, A.M.. and Littlejohn. D., J. Anal. At. Spectrom., 1993,
8. 325.
58)
Sperling, M.. Yin, X.. and Welz, B., J. Anal. At. Spectrom., 1991, 6, 295.
59)
Sperling, M., Yin, X., and Welz. B., Spectrochim.
Acta, 1991, 46B(14),
1789.
60)
Porta, V., Aboiiino, 0., Mentasti. E.. and Sarzanini, C , J. Anal.
Spectrom., 1991, 6, 119.
61)
Liu, Z-S., and Huang, S-D.. Anal. Chim. Acta, 1992, 267, 3 1 .
222
At.
62)
Fang. Z., "F/ow Injection Separation and Preconcentration",
VCH, Germany,
1993, ch. 7. pp. 169-195.
63)
Fang, Z., Sperling, M., and Welz, B., J. Anal. At. Spectrom., 1991, 6, 301.
64)
Fang, Z., and Dong, L.. J. Anal. At. Spectrom., 1992, 7, 439.
65)
Fang, Z., Tlow Injection Separation and Preconcentration",
VCH, Germany,
1993. ch. 5, pp. 129-157.
66)
Dedina, J., and Welz, B.. Spectrochim. Acta, 1993. 48B(3), 301.
67)
Sturgeon, R.E., Willie. S.N.. and Berman. S.S.. J. Anal. At.
Spectrom.,
1986, 1, 115.
68)
Nielsen, S.. Sloth. J.J., and Hansen. E.H., Talanta, 1996, 43, 867.
69)
Carrero, P.E., and Tyson, J.F., Analyst, 1997, 122. 915.
70)
Price, W.J.. "Spectrochemical
Analysis
by Atomic
Absorption",
Heyden,
London, 1979. ch. 3, pp. 27-69.
71)
Welz,
B.,
"Atomic
Absorption
Spectrometry",
Second
Edition, VCH,
Germany, 1985, ch. 3, pp. 31-82.
72)
Hatch, W.R., and Ott, W.L.. Anal. Chem., 1968. 40(14), 2085.
73)
Ebdon. L.. "An Introduction
to Atomic Absorption
Spectroscopy",
Heyden,
London, 1982, ch. 9. pp. 86-89.
74)
Rooney, R.C., Analyst, 1976, 101, 678.
75)
Colina de Vargas, M., and Romero, R.A., At. Spectrosc,
76)
Zhu, L Z . , Lu, J., and Le, X.. Mikrochim. Acta, 1993. 111. 207.
77)
Kaiser, G., Gotz, D., Schoch, P., and Tolg, G.. Talanta, 1975. 22, 889.
78)
Matsunaga, K., and Takahashi, S., Anal. Chim. Acta, 1976, 87, 487.
79)
Welz. B., Melcher, M.. Sinemus. H.W., and Maier, D., At. Spectrosc., 1984,
5(2). 37.
223
1989, 10(5), 160.
80)
Price. W.J., "Spectrochemical
Analysis
by Atomic Absorption",
Heyden,
London. 1979, ch. 8, pp. 191-286.
81)
Thompson. K.C., and Godden, R.G., Analyst, 1975, 100, 544.
82)
Guo. T., and Bassner. J.. Anal. Chim. Acta, 1993, 278, 189.
83)
Welz. B., Tsalev. D.L.. and Sperling, M., Anal. Chim. Acta, 1992. 261, 9 1 .
84)
Hanna. C P . , Tyson, J.F., and Mcintosh. S., Anal. Chem., 1993. 65, 653.
85)
Vandecasteele, C , and Block, C.B., "Modern Methods of Trace
Determination",
Element
Wiley, Chichester, 1993, ch. 5, pp. 93-137.
86)
Holak. W.. Anal. Chem., 1969. 41, 1712.
87)
McDaniel, M.. Shendrikar, A.D., Reiszner, K.D., and West, P.W., Anal.
C/?em.. 1976, 48. 2240.
88)
Siemer, D.D.. Koteel. P.. and Jariwala, V., Anal. Chem., 1976. 48. 836.
89)
Smith. R.G., Van Loon. J.C., Knechtel, J.R., Fraser. J . L . Pitts. A.E.. and
Hodges. A.E., Anal. Chim. Acta, 1977. 93. 6 1 .
90)
Dedina. J., and Rubeska. L. Spectrochim. Acta, 1980. 35B. 119.
91)
Siemer. D.D.. and Koteel. Anal. Chem., 1977. 49(8). 1096.
92)
Haug. H.O.. and Liao, Y-P., Fresenius J, Anal. Chem., 1996. 356. 435.
93)
Xiu-ping. Y.. and Zhe-ming, N., J. Anal. At. Spectrom., 1991, 6. 483.
94)
Shuttler. I.L., Feuerstein. M., and Schlemmer. G., J. Anal. At.
Spectrom.,
1992, 7, 1299.
95)
Bulska, E., and Jedral. W.. J. Anal. At. Spectrom., 1995. 10. 49.
96)
Tsalev. D.L., D'Ulivo, A., Lampugnani. L. Di Marco. M, and Zamboni. R., J.
Anal. At. Spectrom., 1996. 11. 979.
97)
Sturgeon, R.E.. Willie. S.N.. Irwin Sproule. G., and Berman, S.S., J. Anal.
At. Spectrom., 1987. 2. 719.
224
98)
Schelmmer,
G.,
and
Gasphaseninterferenzen
Graphitrofenkopplung.,
99)
Feuerstein,
in
der
M.,
"Verminderung
Hydrid-AA S
durich
von
FIA-
Colloquium Analytische Atomspectroscopie", 1993.
Dedina, J., and Tsalev, D.L.,
"Hydride
generation
atomic
absorption
spectrometry", Wiley, Chichester. 1995, ch. 4. pp. 91-117.
100)
Tsalev, D.L., D'Ulivo, A.. Lampugnani, L., Di Marco. M., and Zamboni. R.,
J. Anal. At. Spectrom., 1995, 10, 1003.
101)
Zhang, L., Ni, Z., and Shan, X., Spectrochim. Acta, 1989, 448, 339.
102)
Barth, B.. Krivan. V., and Hausbeck. H.. Anal. Chim. Acta, 1992, 263. 111.
103)
An. Y., Willie, S.N., and Sturgeon, R.E.. Spectrochim. Acta, 1992, 47B(12).
1403.
104)
Fang, Z, Spectrochim. Acta Rev., 1991, 14(3), 235.
105)
Ruzicka. J., and Hansen, E.H., "Flow Injection Analysis", Second Edition,
Wiley, New York. 1988. ch. 4. pp. 139-256.
106)
Malamas, F., Bengtsson. M., and Johansson, G., Anal. Chim. Acta, 1984,
160. 1.
107)
Fang, Z., Xu, S-K., and Zhang. S-C. Anal. Chim. Acta, 1984. 164. 4 1 .
108)
Hartenstein, S.D., Ruzicka, J., and Christian, G.D., Anal. Chem., 1985, 57,
21.
109)
Fang. Z.. Xu. S-K., and Tao, G., J. Anal. At. Spectrom.,
1996,11.1.
110)
Beinrohr, E., Cakrt, M., Rapta. M, and Tarapci, P.. Fresenius
J. Anal.
Chem., 1989, 335, 1005.
111)
Fang, Z.. Tao. G., Fresenius J. Anal. Chem., 1996, 355, 576.
112)
Fang.
Z.,
Tlow
Injection
Atomic
Chichester, 1995. ch. 9. pp. 175-202.
225
Absorption
Spectrometry",
Wiley,
113)
Welz, B., Sperling. M., and Sun, S-J., Fresenius J. Anal. Chem., 1993, 346,
550.
114)
Berndt. H.. and Schaldach, G.. J. Anal. At. Spectrom., 1994. 9, 39.
115)
Ma, R., van Mol, W., and Adams, F.. At. Spectrosc,
116)
Fang, Z.. Xu. S-K., and Zhang. S - C , Anal. Chim. Acta, 1987, 200, 35.
117)
Fang. Z., Xu. S-K., and Zhang, S - C , Anal. Chim. Acta, 1984,164, 4 1 .
118)
Fang.
Z.,
"Flow
Injection
Atomic
Absorption
1996, 17(4). 176.
Spectrometry",
Wiley,
Chichester. 1995, ch. 8. pp. 143-174.
119)
Willard. H.H.. Merritt. Jr., L.L., Dean, J.A.. and Settle. Jr.. F.A..
"Instrumental Methods of Analysis", Wadsworth Publishing Company, USA.
Seventh Edition, 1988. ch. 9. pp. 224-259.
120)
Skoog. D.A.. West, D.M., and Holler, F.J., "Fundamentals
of Analytical
Chemistry", Saunders College Publishing, USA, International Sixth Edition,
1992, ch. 24, pp. 615-651.
121)
Welz, B., "Atomic Absorption Spectrometry", VCH, Germany, Second
Edition, 1985, ch. 1, pp. 1-17.
122)
Willard. H.H., Merritt, Jr.. L.L.. Dean, J.A., and Settle, Jr., F.A.,
Instrumental
Methods of Analysis, Wadsworth Publishing Company. USA, Seventh
Edition, 1988. ch. 5, pp. 97-117.
123)
Tyson. J.F., Atomic Absorption Spectrometry;
Applications,
Theory, Design and
Editor Haswell, S.J.. Elsevier. Netherlands. Volume 5. 1991,
ch. 1, pp. 1-20.
124)
Fifield, F.W., and Kealy, D.. Principles and Practice of Analytical
Blackie, London. 1995. Fourth Edition. 1995. ch. 7. pp. 267-281.
226
Chemistry,
125)
Skoog. D.A., and Leary, J.J., Principles of Instrumental Analysis, Saunders
College Publishing. USA. Fourth Edition. 1992. ch. 10, pp. 196-232.
126)
Ebdon, L., "An Introduction to Atomic Absorption Spectroscopy",
Heyden,
London, 1982, ch. 1. pp. 1-10.
127)
Skoog. D.A., West, D.M.. and Holler, F.J., "Analytical Chemistry:
An
Introduction", Saunders College Publishing, USA. International Sixth
Edition, 1990. ch. 24, pp. 453-480.
128)
Fifield, F.W., and Kealy. D., "Principles and Practice of Analytical
Chemistry", Blackie. London. Fourth Edition. 1995, ch. 8. pp. 282-350.
129)
Vandecasteele, C , and Block. C.B., "Modern Methods for Trace Element
Determination",
130)
Wiley, Chichester. 1993, ch. 7, pp. 159-167.
Ebdon. L., "An Introduction to Atomic Absorption Spectroscopy",
Heyden,
London, 1982, ch. 5. pp. 58-62.
131)
Dean, J.R., "Atomic Absorption and Plasma Spectroscopy",
Wiley.
Chichester. 1997. ch. 3, pp. 33-45.
132)
Shuttler, I.L.. and Schulze, H.. Analysis Europa, 1994. 1. 44.
133)
Radziuk. B., Rodel, G., Stenz. H., Becker-Ross. H., and Florek, S., J. Anal.
At. Spectrom., 1995, 10. 127.
134)
Harnly, J., Fresenius J. Anal. Chem., 1996, 355. 501.
135)
Ebdon. L.. "An Introduction to Atomic Absorption Spectroscopy",
Heyden,
London, 1982, ch. 4, pp. 42-57.
136)
Slavin. W.. Manning, D.C., and Carnrick, G.R., At. Spectrosc, 1981, 2(5),
137.
137)
Carnrick, G.R.. and Slavin. W.. Am. Lab., October 1988. 21(2), 90.
138)
Carnrick, G.R., and Siavin, W.. Am. Lab., February 1989, 20(10). 88.
227
139)
Simultaneous Mulli element Atomic Absorption 6000 Spectrometer,
Installation, Maintenance and System description, B3119.10, Release 1.3,
Bodenseewerk. Perkin-Elmer GmbH, Uberlingen, 1995.
140)
Blankley, M., Henson, A., and Thompson, K.C., "Atomic
Spectrometry:
Absorption
Theory, Design and Applications", Editor Haswell, S.J.,
Elsevier, Netherlands, Volume 5, 1991. ch. 4, pp. 79-123.
141)
Welz, B., "Atomic Absorption Spectrometry", VCH, Germany, Second
Edition, 1985. ch. 7. pp. 129-164.
142)
Clyburn, S.A., Kantor, T.. and Veillon. C , Anal. Chem., 1974, 46, 2214.
143)
Massmann, H., Spectrochim. Acta, 1968, 23B. 215.
144)
Model 4100ZL Atomic Absorption Spectrometer, Installation,
Maintenance
and System Description, B3121.10. Release 1.0, Bodenseewerk, Perkin
Elmer GmbH, Uberlingen, 1995.
145)
Freeh, W.. Baxter, D.C., and Hutsch, B., Anal. Chem., 1986. 58, 1973.
146)
Price, W.J., "Spectrochemical
Analysis by Atomic Absorption", Heyden,
London. 1979, ch. 4, pp. 70-94.
147)
Dean, J.R., "Atomic Absorption and Plasma Spectroscopy",
Wiley.
Chichester, 1997. Second Edition, ch. 4, pp. 47-77.
148)
Perkampus, H-H., "Encyclopaedia of Spectroscopy", VCH, Germany, 1995,
pp. 368-369.
149)
Skoog, D.A., West, D.M., and Holler. F.J., "Fundamentals
of Analytical
Chemistry", Saunders College Publishing, USA, International Sixth Edition.
1992. ch. 2 1 . pp. 535-560.
228
150)
Willard, H.H.. Merritt, Jr.. L.L.. Dean, J.A., and Settle, Jr., F.A., Instrumental
Methods of Analysis, Wadsworth Publishing Company, USA, Seventh
Edition, 1988, ch. 6, pp. 118-158.
151)
Perkampus, H-H.. "Encyclopaedia of Spectroscopy", VCH, Germany, 1995,
pp. 479-480.
152)
Welz, B., "Atomic Absorption Spectrometry". VCH, Germany, Second
Edition, 1985, ch. 5, pp. 95-106.
153)
Perkampus, H-H.. "Encyclopaedia of Spectroscopy", VCH. Germany. 1995,
pp. 455-456.
154)
Perkampus. H-H., "Encyclopaedia of Spectroscopy", VCH, Germany, 1995,
pp. 445.
155)
Radziuk, B., Rodel, G., Zeiher, M., Mizuno, S.. and Yamamoto, K., J. Anal.
At. Spectrom., 1995, 10.' 415.
156)
Haswell, S.J., "Atomic Absorption Spectrometry:
Theory, Design and
Applications", Editor Haswell. S.J., Elsevier, Netherlands, Volume 5, 1991,
ch. 2. pp. 21-49.
157)
Dulude. G., "Advances in Atomic Spectroscopy",
Editor Sneddon, J., Jai
Press, London, 1992, Volume 1. ch. 4, pp. 125-161.
158)
Moraies-Rubio, A.. Mena, M.L.. and McLeod. C.W.. Anal. Chim. Acta, 1995,
308, 364.
159)
Lajunen, L.H.J., "Spectrochemical
Analysis
by Atomic
Absorption
and
Emission", RSC. Cambridge, 1992. ch. 6, pp. 117-131.
160)
Tahan, J., Granadiilo, V., Sanchez, J.. Cubiilan, H., and Romero.R., J. At.
Anal. Spectrom., 1993. 8, 1005.
161)
Colina de Vargas. M.. and Romero, R., Analyst, 1992, 117. 645.
229
162)
Colina de Vargas, M.. Ledo de Medina, H., and Araujo, K., Analyst, 1994.
119, 623.
163)
Guo, T.. and Baasner, J.. Talanta, 1993. 40(12). 1927.
164)
Baxter. D.C., and Freeh. W., Anal. Chim. Acta, 1990. 236, 377.
165)
Adeloju, S.B., Dhindsa, H.S., and Tandon, R.T., Ana/. Chim. Acta, 1994,
285, 359
166)
Adeloju, S B., Analyst, 1989, 114, 455.
167)
Quevauviller. P., Imbert, J-L., and Olle, M., Mikrochim. Acta, 1993, 112,
147.
168)
Nieuv^enhuize. J., and Poley-Vos. C.H.. At. Spectrosc., 1989. 5(10). 148.
169)
Vermeir, G., Vandercasteele, C , and Dams, R., Anal. Chim. Acta, 1989.
220. 257
170)
Navarro, M., Lopez, M.C.. Lopes. H., and Sanchez, M.. Anal. Chim. Acta,
1992. 257. 155.
171)
Schnitzer, M.G., Pellerin, C , and Clouet, C . Appendix 1., Pittsburgh
Conference 1988, Ministry of Agriculture Direction of the Quality.. CNEVAParis.
172)
Lan. W.G., Wong, M.K., and Sin, Y.M.. 7a/an/a. 1994. 41(2). 195.
173)
Flow Injection Mercury/Hydride Analyses., Recommended Analytical
Conditions and General Information Documentation, B050-1820 (B3505),
Release 3 . 0 / Feb 94. Bodenseewerk Perkin-Elmer. Uberlingen, 1994.
174)
Rokkjaer, I.. Hoyer. B.. and Jensen. N.. Talanta, 1993. 40(5), 729.
175)
Personnel Communication, I.L. Shuttler. September 1995.
176)
Madrid. Y., Gutierrez, J.M., and Camara, C , Spectrochim.
49B.163.
230
Acta, 1994,
177)
Bernth. N.. and Vendelbo. K. Analyst, 1984, 109. 309.
178)
Uggerud. H.. and Lund, W., J. Anal. At. Spectrom., 1995, 10, 405.
179)
Morrow, A.. Wiltshire, G., and Hursthouse, A.. At. Spectrosc., 1997, 18. 23.
180)
Bowman, J.. Fairman. B.. and Catterick, T., J. Anal. At. Spectrom.,
1997,
12. 313.
181)
Stroh. A., and Vollkopf, U.. J. Anal. At. Spectrom., 1993, 8, 35.
182)
Sturgeon, R.E., and Gregoire, D.C., Spectrochim.
Acta, 1994, 49B(12),
1335.
183)
Garbos, S., Walcerz, M., Bulska, E., and Hulanicki, A.. Spectrochim.
Acta,
1995. SOB, 1669.
184)
Kraus,
B.,
Diplomarbeit
Multielementbestimmung
Utersuchungen
hydridbildender
Elemente
mit der Graphitrohr-Atomabsorptionsspektromethe.,
zur
simultanen
und von
Quecksilber
Fachhochschule
Aalen,
Germany, 1996.
185)
The FIAS Furnace Technique. Setting up and Performing
9907,
Release
1.0
July
1993,
Bodenseewerk
Analysis, B050-
Perkin-Elmer
GmbH,
Uberlingen. 1993.
186)
Bye. R., and Lund, W.. Fresenius Z. Anal. Chem., 1988. 332, 242.
187)
Tyson. J.F.. Offley, S.G.. Seare. N.J.. Kibble. H.A.B., and Fellows. C . J.
Anal. At. Spectrom., 1992. 7, 315.
188)
Dedina, J., and Welz. B., J. Anal. At. Spectrom., 1992, 7. 307.
189)
Welz, B.. and Sucmanova, M., Analyst, 1993,118. 1417.
190)
D'Ulivo, A., Lampugnani, L., Pellegrini, G., and Zamboni, R., J. Anal. At.
Spectrom., 1995, 10, 969.
231
191)
Tsalev, D.L. D'Ulivo. A., Lampugnani. L , Pellegrini, G., and Zamboni, R..
J. Anal. At. Spectrom., 1996. 11. 989.
192)
Welz. B., and Sucmanova, M., Analyst, 1993.118. 1425.
193)
Bye. R., ^a/an^a.1990, 37(10), 1029.
194)
Bye. R.. Talanta, 1983, 30(12), 993.
195)
The FIAS Furnace technique. Recommended
General
Information,
Publication
Analytical
B3212.20.
Part
Conditions
No
and
0993-5204
Bodenseewerk Perkin Elmer Uberlingen 1993.
196)
Lide, D.R., Editor in Chief, "Handbook of Chemistry and Physics",
75th
Edition, CRC Press. USA. 1995. ch. 8. pp. 21-31.
197)
Sperling, M.. Xu. S.. and Welz. B., Anal. Chem., 1992, 64, 3101.
198)
Pitts. L , Worsfold. P.J.. and Hill. S.J.. Analyst, 1994, 119. 2785.
199)
Hill, S.J.. Pitts. L., and Worsfold. P.J.. J. Anal. At. Spectrom.,
1995, 10,
409.
200)
Xiu-ping. Y.. and Zhe-ming. N., J. Anal. At. Spectrom., 1991. 6, 483.
201)
Tsalev, D.L.. and Slaveykova, V.I., Spectroscopy Letters . 1992. 25(2). 221.
202)
Personal Communication. M. Feuerstein, June 1997.
203)
Welz, B.. and Strauss, P., Spectrochim. Acta, 1993, 48B(8). 951.
204)
Schlemmer, G., and Feuerstein, M., CANAS '93, Colloquium Analytische
Atomspektroskopie, Ed Welz, B., Bodenseewerk Perkin-Elmer GmbH,
Uberlingen. Germany, 1994, 431-441.
205)
Wickstrom. T.. and Lund. W.. and Bye. R.. Analyst, 1996. 121, 2 0 1 .
206)
Welz, B.. and Schubert-Jacobs, M.. J. Anal. At. Spectrom., 1986, 1. 23.
207)
Sinemus. H-W., Kleiner. J., Stabel. H-H., and Radziuk. B.. J. Anal. At.
Spectrom.,^992,
7, 433.
232
208)
Personal Communication, Bodensee Water Works. July 1997.
209)
lUPAC Analytical Chemistry Division, Commission on Spectrochemicai and
other optical procedures for analysis, Spectrochim. Acta., 1978, 33, 2 4 1 .
210)
Miller. J.C., and Miller. J.N.. "Statistics for Analytical
Chemistry",
Second
Edition, Wiley, Chichester, 1988, ch. 5, pp.115-117.
211)
Zhe-ming, N., Bin. H.. and Heng-bin, H., J. Anal. At. Spectrom., 1993, 8,
995.
212)
Sturgeon, R.E., Willie, S.N.. and Berman, S.S., Fresenius J. Anal.
Chem.,
1986, 323. 788.
213)
Ebdon, L., Fisher, A S., Hill, S.J.. and Worsfold, P.J., J. Auto. Chem., 1991,
13(6). 281
214)
Carbonell, V., Salvador, A., and de la Guardia, M., Fresenius
J. Anal.
Chem., 1992, 324, 529.
215)
Myasoedova.
G.V.,
and Savvin, S B . ,
Chtical
Reviews
in
Analytical
Chemistry, 7(1), 1.
216)
Ma, R., Van Mol. W., and Adams, F., Anal. Chim. Acta, 1993, 285, 33.
217)
Ma. R., and Adams, F., Spectrochim. Acta, 1996, 51(14). 1917.
218)
Freiser. H., and Morrison, G., Annual Review of Nuclear Science, 1959, 9.
221.
219)
De. A.K., Khopkar, S.M.. and Chalmers, R.A.,
"Solvent
extraction
metals", Van Nostrand Reinhoid, London, 1970, ch. 8, pp. 141-157.
220)
Huianicki, A.. Talanta, 1967, 14.1371.
221)
Mitchell, J.W.. Talanta, 1982. 29, 993.
222)
Ma, R., Van Mol. W., and Adams. F.. Anal. Chim. Acta, 1994. 293. 2 5 1 .
223)
Personal Communication. D. Bradshaw July 1997.
233
of
224)
Personal Communication, M. Sperling. July 1997.
225)
Personal Communication. I.L. Shuttler, July 1997.
226)
Fang,
2.,
"Flow
Injection
Atomic
Absorption
Spectrometry",
Wiley,
Chichester, 1995. ch. 2. pp. 14-44.
227)
Personal Communication. M. Sperling, September 1997.
228)
Lancaster. H.L., Marshall, G.D., Gonzalo, E.R., Ruzicka, J., and Christian,
G.D.. Analyst, 1994, 119. 1459.
229)
Gallego, M.. Petit de Pena. Y.. and Varcarcel, M., Anal. Chem., 1994. 66,
4074.
234
Epilogue
235
Abbreviations
8-HOQ
8 hydroxyquinoline
A or abs
Absorbance
AAS
Atomic Absorption Spectrometry
AES
Atomic Emission Spectrometry
AFS
Atomic Fluorescence Spectrometry
APDC
Ammonium pyrrolidinedithiocarbamate
BOC
Baseline Offset Correction
CPG
Controlled Pore Glass
CRMs
Certified References Materials
CVAAS
Cold Vapour Atomic Absorption Spectrometry
DDC
Diethyldithiocarbamate
DDDC
Diethylammonium diethyldithiocarbamate
EDL
Electrodeless Discharge Lamp
EDTA
Ethylenediaminetetraacetic acid
ETA
Electrothermal Atomiser
ETAAS
Electrothermal Atomic Absorption Spectrometry
FAAS
Flame Atomic Absorption Spectrometry
Fl
Flow Injection
FIA
Flow Injection Analysis
FIAS
Flow Injection Analysis System
FIAS 400
Flow Injection Analysis System 400
FIAS-MHS
Flow Injection Analysis System Mercury / Hydride system
FI-CVAAS
Flow Injection Cold Vapour Atomic Absorption Spectrometry
GFAAS
Graphite Furnace Atomic Absorption Spectrometry
GLS
Gas-Liquid Separator
HCL
Hollow Cathode Lamp
HFE
Hydride Forming Element
HGA
Heated Graphite Atomiser
HG-AAS
Hydride Generation Atomic Absorption Spectrometry
HMA-HMDTC
Hexamethyleneammonium hexamethylenedithiocarbamate
IBMK
Iso-butyl methyl ketone
236
ICP-AES
Inductively Coupled Plasma-Atomic Emission Spectrometry
ICP-MS
Inductively Coupled Plasma-Mass Spectrometry
IDL
Instrument Detection Limit
rrio
characteristic mass
mA
milliamp
MDL
Method Detection Limit
MHz
Megahertz
NaDDC
Sodium Diethyldithiocarbamate
ng
nanograms per gram
ng ml*^
nanograms per millilitre
nm
nanometre
PA
Peak Area
PFA
Perfluoralkoxyvinyl ether
PH
Peak Height
PMT
Photomultiplier Tube
PTFE
Polytetrafiuoroethene
QF-AAS
Quartz Furnace Atomic Absorption Spectrometry
QF-HG-AAS
Quartz
Furnace
Hydride
Generation
Spectrometry
r'
Correlation Co-efficient Squared
RSD
Relative Standard Deviation
SRM
Standard Reference Material
Std Devn
Standard Deviation
STPF
Stabilised Temperature Platform Furnace
THGA
Transversely Heated Graphite Atomiser
Mg
micrograms per gram
ng
uv
I'
micrograms per litre
Ultra-Violet
237
Atomic
Absorption
Meetings attended
Application of Atomic Spectroscopy in Trace metal speciation.
Atomic Spectrometry Updates / Atomic Spectroscopy Group.
Royal Society of Chemistry, Analytical Division.
30 March 1995. Bristol University.
Research and Developments Topics in Analytical Chemistry Meetings.
Royal Society of Chemistry, Analytical Division.
10- 11 July 1995, University of Hull.
SAC 95 : An International Symposium on Analytical Chemistry.
Royal Society of Chemistry, Analytical Division.
11- 15 July 1995. University of Hull.
Young Environmental Chemists Meeting.
Royal Society of Chemistry, Industrial Division.
5 March 1996. De Montfort University.
Spectroscopic Techniques for in situ Water Monitoring.
Western Region, Analytical division and Molecular Spectroscopy Group.
11 July 1996, University of Plymouth.
238
Eighth Biennial National Atomic Spectroscopy Symposium.
Royal Society of Chemistry, Analytical Division.
17-19 July 1996, University of East Anglia.
Poster Presented:
"Determination
of Total Mercury in Environmental
by Flow Injection Cold Vapour Atomic Absorption
and Biological
Samples
Spectroscopy."
Research and Developments Topics in Analytical Chemistry Meetings.
Royal Society of Chemistry, Analytical Division.
22-23 July 1996, Nottingham Trent University.
Poster Presented:
"The Application
Spectroscopy
Biological
of Flow Injection
for the Determination
with Cold Vapour Atomic
Absorption
of Total Mercury in Environmental
and
Samples."
Second Young Environmental Chemists Meeting.
Royal Society of Chemistry, Industrial Division.
18 March 1997, De Montfort University.
Speech Given :
"The determination of total mercury in environmental
by flow injection cold vapour atomic absorption
239
and biological
spectrometry".
samples
Towards 2000 ; Challenges for Atomic Spectrometry.
Atomic Spectrometry Updates / Atomic Spectroscopy Group.
Royal Society of Chemistry, Analytical Division.
25 March 1997, University of Edinburgh.
Research and Developments Topics in Analytical Chemistry Meetings.
Royal Society of Chemistry, Analytical Division.
2-3 July 1997, University of Northumbria in Newcastle
Poster Presented :
"Investigations
Selenium
into
the
Simultaneous
By 'In Atomizer
Trapping'
Determination
Electrothermal
of Bismuth
Atomic
And
Absorption
Spectrometry."
XXX Colloquium Spectroscopicum Internationale
21-25 September 1997, Melbourne World Congress Centre, Australia
Posters Presented
"Investigations
Selenium
into the
Simultaneous
By 'In Atomizer
Trapping'
Determination
Electrothermal
of Bismuth
Atomic
And
Absorption
Spectrometry."
and
"The possibilities
Elements
for Simultaneous
by "In Atomizer
Trapping"
Spectrometry."
240
Determination
Electrothermal
of Hydride
Atomic
Forming
Absorption
Speech given by M. Sperling
"Simultaneous
multi element
matrices by electrothermal
determination
of ultra trace
atomic absorption with on-line
in
complex
preconcentration
using flow injection."
Research Meeting, Perkin Elmer Bodenseev^erk GmbH
14 November 1997, Uberlingen, Germany
Speech given
"On-line sample pretreatment
of environmental
samples for use with Atomic
Spectroscopy."
Lectures and associated courses attended
Erasmus Eurocourse, "Frontiers in Analytical Chemistry :
Trace Environmental Analysis"
10-14 September 1995, University of Plymouth 1995.
MSc credited short course in Analytical Atomic Spectrometry,
9-13 September 1996, University of Plymouth 1996.
241
Papers published
"The Determination of Total Mercury in Environmental and Biological samples by
Flow Injection Cold Vapour Atomic Absorption Spectrometry".
J. Murphy. P. Jones, S.J. Hill.
Spectrochimica Acta Part B Special FIov/ Injection issue Vol. 51 No 14 1867-1873
"Investigations into the Simultaneous Determination Of Bismuth And Selenium by
'In Atomizer Trapping' Electrothermal Atomic Absorption Spectrometry".
J. Murphy, G. Schlemmer, I.L. Shuttler, P. Jones, S.J. Hill.
Analytical Communications,
November 1997, Vol 34, 359-362.
"Simultaneous Multi Element Determination of Hydride Forming Elements by 'In
Atomizer Trapping' Electrothermal Atomic Absorption Spectrometry on an Iridium coated graphite tube."
J. Murphy, G. Schlemmer, I.L. Shuttler, P. Jones, S.J. Hill.
Journal of Analytical Atomic Spectrometry, Submitted for publication.
242


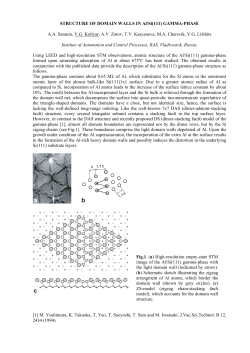


© Copyright 2026