
Correspondence of two procedures to measure
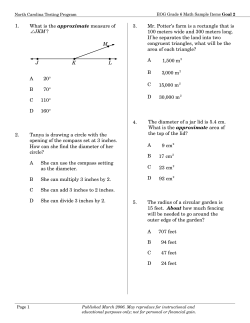
Asia Pac J Clin Nutr 2010;19 (1):14-21
14
Short Communication
Correspondence of two procedures to measure
abdominal circumference in a convenience sample of
urban, middle-class schoolchildren in Guatemala City
Virginia J Alvarado BS1, Evelyn Mayorga BS1, Susana Molina MD2,
Noel W Solomons MD1
1
2
Centre for Studies of Sensory Impairment, Aging and Metabolism (CeSSIAM), Guatemala City, Guatemala
School of Nutrition, Universidad Francisco Marroquín, Guatemala City, Guatemala
Background: Given an emerging concern for juvenile overweight and obesity, even in populations of developing
countries, techniques to assess central obesity, such as abdominal circumference (AC), are of increasing interest.
Objective: To compare two procedures for measuring AC in schoolchildren from a convenience sample of middle-class, urban children aged 72 to 131 months in Guatemala City. Methods: We conducted a cross-sectional
study (August 2004- April 2005) in 363 schoolchildren; 190 boys and 173 girls. The AC was recorded using
both the conventional natural waist circumference (NWC) and the umbilical-level abdominal circumference
(UAC) methods; each of which was measured over a thin T-shirt. Height and weight were also measured. The
NWC and UAC methods were compared between genders and age groups. In addition, correlation coefficients
and Bland-Altman regression were performed. A reproducibility study was performed on a subsample of 50
children. Results: Mean NWC was 63.2±10.0 cm for boys and 60.2±7.7 cm for girls (p=0.001), and mean UAC
was 65.9±11.0 cm for boys and 63.2±8.8 cm for girls (p=0.008). Both measures of AC generally increased with
age. The UAC - NWC difference increased with abdominal girth. The Pearson correlation coefficient of BMI vs.
NWC and BMI vs. UAC was r=0.92, CV=0.46±0.27%. A high test-retest reproducibility (r > 0.98, CV=
0.50±0.24%) of the NWC and UAC measurements was found. Conclusion: Reliable NWC and UAC measurements may be obtained by applying a correction term to account for light clothing. Both measurements are applicable methodologies for the collection of data in populations with cultural limitations.
Key Words: juvenile central obesity, natural waist circumference, umbilical abdominal circumference, body mass
index, Guatemala
INTRODUCTION
Overweight in children has become a matter of growing
concern. A review article by Amigo, published in 20031
illustrates the point that overweight and obesity are becoming widespread, although in an uneven fashion across
countries, in the Latin American region. He is able to
project this conclusion applying variants of WHO classification features for children to a wealth of data. Information analysed from national surveys in Honduras, El Salvador, Guatemala, Colombia, Nicaragua, Brazil, Dominica Republic, Mexico, Paraguay, Chile, Bolivia and Peru,
previously assembled by other authors in the region,2-7
were included.
Researchers have raised questions not simply about the
amount of weight gain and adiposity, but also about the
role of fat distribution. Recent metabolic studies have
shown that the specific location of fat on the body can
affect health.8-10 Visceral fat is associated with glucose
intolerance, an increased risk of diabetes type 2 and coronary heart disease.11 In adults and children, as well, there
is mounting evidence linking central obesity and health
related risks such as cardiovascular disease, the metabolic
syndrome, serum lipoprotein concentrations and blood
pressure.11-17
Research has suggested that the circumference of the
abdomen can serve as a useful indicator of central obesity,
to the degree that it reflects the deposition of visceral fat
within the abdominal cavity.8,19 Studies of adult populations have shown that waist-to-hip ratios 20 and absolute
circumference of the abdomen,21 have predictive validity
for metabolic diseases. A variety of different methods and
conventions have been reported in literature for measuring abdominal circumference (AC). The most conventional AC method is that using anatomical landmarks for
positioning the measuring tape, as described by McCarthy
and colleagues: “the waist circumference measurement
was taken midway between the tenth rib and the iliac
crest”.22 Another method is the so-called “natural waist circumference (NWC)” which measures the minimal distance
Corresponding Author: Ms Virginia Alvarado, Center for Studies
of Sensory Impairment, Aging and Metabolism (CeSSIAM), 17a
Avenida 16-89, Zona 11 Guatemala City, Guatemala 01011.
Tel/Fax: +502-2473-3942
Email: [email protected]; [email protected]
Manuscript received 2 June 2009. Initial review completed 26
August 2009. Revision accepted 23 November 2009.
VJ Alvarado, E Mayorga, S Molina and NW Solomons
around the abdomen.23 Yet a third, introduced by Norris
and Wilson,24 in the context of a British anthropometric
survey, is the umbilical abdominal circumference (UAC),
measured at the level of the umbilicus.
To the extent that Guatemala was a traditionally agrarian society in Central America, now transitioning toward
an increasing urbanization with a growing middle-class,
we might anticipate the emergence of excess weight conditions in childhood. In a cross-sectional anthropometric
study among middle-class children in private schools and
vacation camps of Guatemala City, aimed primarily at
assessing the body mass index (BMI), Alvarado and colleagues25 took the opportunity to measure AC’s using two
distinct measurement approaches. The aim of the current
study was to compare NWC measurements, considered as
the gold standard, with UAC measurements in the same
individuals.
MATERIALS AND METHODS
Subjects
The general aspects of this study’s design and features have
been presented earlier.25 Seven schools in Guatemala City
located in the same area (Zone 11) and serving families of
the urban middle-class, as well as five urban vacation
camps, serving the same constituency, were invited to
participate in our survey. Of these, we obtained the collaboration of four schools and four vacation camps, with
the remaining citing incompatibility of our measurement
agenda with the institutions’ schedules and activities. We
visited each location in advance to arrange for a proper
physical setting to collect anthropometric measurements.
The protocol had been previously approved by the Human Subject Committee of Centre for Studies of Sensory
Impairment, Aging and Metabolism (CeSSIAM).
The teachers presented the general purposes of the
study to the children and distributed informational sheets
and informed consent forms to be considered by their
families. Children with physical impairments, outside of
the specified age range (no younger than 72 mo, and no
older than 131 mo based on parental reporting of birth
dates), or with irregular class attendance were excluded.
Measurements were only obtained from students who
assented orally to participate in the study and had parental
or guardian signatures on the informed consent forms. We
enrolled and measured a total of 443 children at the sites.
A total of 80 children were excluded from the final
analysis for the reasons mentioned above or abnormal
abdominal distension on the day of measurement. The
final sample comprised of 363 schoolchildren; 173 boys
and 190 girls.
Data collection
Data were collected from August 2004 to April 2005. All
measurements were preformed by one researcher, therefore
standardization was not necessary.
Height was measured to the nearest 0.1 cm using a
centimeter tape vertically affixed to a wall for the
measurement. Children were measured barefoot and
asked to stand on a firm, flat horizontal surface with their
heels, buttocks, scapulae and head against the wall and
their arms hanging loose at their sides. A carpenter’s
15
square was lowered onto the crown of the head, with the
child’s gaze in the Frankfort horizontal plane.23
Weight was measured to the nearest ounce using a
calibrated, digital; electronic scale read in pounds (Detecto,
Model CN2OL, Webb City, MO, USA), with a capacity
of 130 lb x 0.1 lb; this was calibrated on each day of the
study with a 5-lb reference weight. For weighing, children
were asked to take off their shoes, sweaters or jackets,
and to take out heavy objects out of their pockets.
NWC was measured in the standing position during
normal respiration. This measurement was taken with the
children dressed in their recreational clothing (T-shirt,
shorts). Out of respect for cultural norms of modesty for
young children in a congregate setting, children were not
asked to expose their skin of their abdomen for the
measurement. Rather the tape extended around the child
while wearing the T-shirt of the recreation class. The
narrowest point of the trunk was encountered by applying
constant tension tape obtaining the minimal reading. We
recorded our measurements to the nearest 0.1 cm.23 For
UAC measurement, the same posture and respiration
conditions were applied. To locate the umbilical level, we
asked the children to place their index finger to indent
their T-shirt and indicate the location of their “belly
button”. Applying a constant tension to the tape measure,
we made the UAC to the nearest 0.1 cm.
Test-retest reproducibility sub-study
In a sub-group of 50 children, 25 boys and 25 girls from
one of the participating schools, we tested the reproducibility of each method for evaluating waist circumference
by repeatedly measuring individuals within our sample
population. The subjects involved in our cross-sectional
study were measured an additional two times under identical conditions on consecutive days.
Data analysis
Body weight measurements in pounds were converted
into metric expressions of kilograms, using a 2.2-to-1
conversion factor. A BMI was calculated for each participant by dividing weight in kilograms by height in meters
squared. Children were classified as underweight (<5th
percentile), risk of overweight (85th to <95th percentile) or
overweight (>95th percentile) based on CDC cut-off
points26 using EPI Info (Center for Disease Control and
Prevention, Atlanta, GA, USA).
Difference of two feasible measurements to assess abdominal circumference
Since, by definition the, NWC represents the abdomen’s
minimal measurable circumference, the UAC will necessarily be equal to or greater than the corresponding NWC.
Therefore, the difference between the two AC measurements was computed as UAC-NWC.
Correction for presence of light clothing
In order to correct for AC measurements in children
wearing a thin t-shirt, a correction term was calculated. In
a subsample of 40 children, 20 from each gender and four
from each age-group, measurement were taken twice:
once over the T-shirt, and once directly in contact with
the skin. Adjustments were applied individually to each
Waist circumference of Guatemalan children
16
subject’s data in order to harmonize our data with finding
from the published literature.
Statistical analyses
Data were analyzed using SPSS version 16.0 (SPSS Inc.,
Chicago, IL, USA). Descriptive statistics for age, weight,
height, BMI are presented by gender and for NWC and
UAC by gender and age group. Student t-test was used to
assess differences between genders. ANOVA was used to
assess differences in UAC and NWC between age groups
within each gender. Least significant difference (LSD)
post hoc tests were performed to examine which differences between age groups were significant. The mean
differences between UAC and NWC were compared between genders using Student t-test. In addition, one-way
ANOVA followed by LSD post hoc tests were performed
to examine differences between age groups.
Bland-Altman27 plots were used to examine if there
was an increase in the difference between UAC and NWC
with increasing mean. Since much current discussion revolves around independent effects of total body size and
the central intra-abdominal location of metabolicallyactive adipose tissue, we examined the association of our
two AC measurements with the individual values for BMI
using Pearson’s correlation coefficient. MANOVA was
used to compare the three repeated measurements within
the same subjects. In addition, CV was used to determine
the reproducibility of NWC and UAC measurements.
RESULTS
Descriptive statistics of demographic and anthropometric variables
Descriptive statistics for the total sample, and by gender,
are presented for age, weight, height, BMI, NWC and
UAC in Table 1. All measurements are numerically
greater for boys than girls, but Student t-test showed that
the differences were significant only for NWC and UAC
(p<0.05).
Description of natural waist circumference values by
age and gender
There was a progressive increase in the NWC and UAC
value with age for the combined sample of Guatemalan
middle-class school children enrolled in the study. The
numerical values for NWC by age-groups for both genders are presented in (Table 2 upper panel). Differences
with increasing age were statically significant by
ANOVA (p<0.05). Similarly, as show in the same table
(Table 2, lower panel), UAC rose with age in both genders.
Table 1. Demographic and anthropometric characteristics of the entire sample, and by gender
Demographic Characteristic
Age (mo)
Weigh (kg)
Height (cm)
BMI (kg/m2)
Natural Waist Circumference (cm)
Umbilical Abdominal Circumference (cm)
Pooled sample
(n=363)
102.9 ± 16.7
31.1 ± 8.8
129.5 ± 9.3
18.3 ± 3.4
61.6 ± 9.0
64.5 ± 10.0
Boys
( n=173 )
104.3 ± 16.9
32.1 ± 9.0
130.0 ± 8.8
18.7 ± 3.6
63.2 ±10.0
65.9 ±11.0
Girls
(n=190 )
101.7 ± 16.5
30.3 ± 8.6
129.0 ± 9.7
17.9 ± 3.1
60.2 ± 7.7
63.2 ± 8.8
p-value*
0.131
0.050
0.299
0.021
0.001
0.008
Values are mean±SD; *p-value for differences between genders using independent Student t-test.
Table 2. Natural waist circumference and umbilical abdominal circumference by age groups and gender
Age (mo)
Natural waist circumference (NWC)
72 – 83
84 – 95
96 – 107
108 – 119
120 –131
Umbilical Abdominal
Circumference (UAC)
72 – 83
84 – 95
96 – 107
108 – 119
120 – 131
n
Boys
Waist circumference (cm)
Confidence
Mean± SD
Median
Interval
5th
95th
n
Girls
Waist circumference (cm)
Confidence
Mean± SD
Median
Interval
5th
95th
27
32
30
46
38
58.6±10.0 a
61.3±10.0 a
62.1±10.2 a,b
63.9±8.0 b
68.1±10.3 c
54.0
58.7
58.5
63.5
66.5
46.7
44.7
51.8
52.9
53.9
78.0
81.1
88.4
76.6
89.0
36
33
45
42
34
55.0±4.6 a
57.5±6.9 a,b
60.1±7.1 b
63.8±8.0 c
63.8±7.8 c
54.3
56.0
58.5
62.9
62.5
48.6
48.6
50.3
52.5
53.0
66.1
72.0
75.1
77.4
78.0
27
32
30
46
38
60.9±10.7 a
64.0±11.3 a
64.7±11.4 a,b
66.7±9.0 b
71.3±11.0 c
56.7
61.4
60.9
64.9
70.2
47.9
47.7
53.0
54.2
55.2
81.9
87.8
93.9
80.1
92.1
36
33
45
42
34
57.2±5.4 a
60.1±8.2 a,b
63.1±8.5 b
67.0±8.8 c
67.7±8.5 c
56.9
57.9
60.9
66.3
65.5
48.3
49.7
51.2
54.9
56.6
68.3
75.7
82.0
83.5
83.4
Significant differences between age groups in natural waist circumference (NWC) and umbilical abdominal circumference (UAC) were
found for both genders using ANOVA (p<0.05); Within each row, mean values bearing different superscript letters are significantly different according to LSD test at p<0.05.
VJ Alvarado, E Mayorga, S Molina and NW Solomons
17
Table 3. Difference between umbilical abdominal circumference and natural waist circumference by age groups and
gender
Boys
UAC-NWC (cm)*
All
Age (mo)
72 – 83
84 – 95
96 – 107
108 – 119
120 –131
p-value‡
Girls
UAC-NWC (cm)1
n
Mean± SD
Median
173
2.8±1.7
2.4
Confidence Interval
95th
5th
0.5
6.0
27
32
30
46
38
2.3±1.1
2.7±1.9
2.6±1.5
2.9±1.8
3.2±1.8
1.9
2.4
2.2
2.8
2.9
0.7
0.0
0.2
0.1
0.9
4.4
6.7
5.7
6.2
6.1
0.296
n
Mean± SD
Median
190
3.0±1.8
2.4
Confidence
Interval
5th
95th
0.9
6.7
36
33
45
42
34
2.3±1.4 a
2.7±1.7 a,b
3.0±1.9 b
3.2±1.7 b
3.9±1.9 c
2.0
2.3
2.5
2.7
3.5
0.0
0.8
0.9
1.4
1.8
5.1
6.4
7.0
7.3
7.8
p-value†
0.187
0.998
0.838
0.348
0.388
0.080
0.002
*
The difference was computed as umbilical abdominal circumference (UAC) – natural waist circumference (NWC); †P-value for difference
between genders using Student t-test; ‡p-value for difference between age groups in UAC-NWC in each genders using ANOVA. Within
each row, mean values bearing different superscript letters are significantly different according to LSD test at p<0.05.
A.
B.
Figure 1. Altman-Bland plots for mean abdominal circumference composed of UAC and NWC pairs in cm, for the 173 boys (Panel A)
and, for the 190 girls measured (Panel B) in the sample.
Application of the correction term for measurement over
clothing
Based on the comparative measurements of AC over Tshirts and with direct skin contact in a sub-group of 40
children, a correction subtraction of 1.0 cm was established for NWC and 1.1 cm for UAC, for both genders.
Magnitude and consistency of the umbilical abdominal
circumference minus natural waist circumference differences
As shown in Table 3, which presents mean UAC-NWC
measurements by age groups and gender; our study
documents consistency of the umbilical-natural waist
circumference differences in boys, but not in girls. In girls,
the mean difference ranged from 2.2 cm in 72-83 mo old
girls to 3.9 cm in 120-131 mo old girls.
Bland-Altman plots shown in Figure 1, present a progressive increase in the within-individual difference in the
circumference measurements with increasing overall AC
in both sexes. The absolute difference (y axis) of UAC
minus NWC was 2.8±1.7 cm for boys and 3.0±1.8 cm for
girls, whilst the mean of both methods (x axis), was
64.6±10.5 cm for boys and 61.7±8.2 cm for girls.
18
Waist circumference of Guatemalan children
Association of abdominal circumference measurements
with body mass index
The prevalence of overweight was 20.1% for boys and
15.8% for girls. The Pearson’s correlation coefficient of
NWC versus BMI was 0.92 for the entire sample, 0.93 for
boys and 0.91 for girls. The same values were found for
the correlation between UAC and BMI.
Reproducibility of repeated measures of NWC and UAC
The mean values for the NWC for the 50 children measured three times in the reproducibility study were
61.0±8.9 cm, 61.1±8.9 cm, and 61.0±9.0 cm, for the respective measurements. MANOVA showed no difference
the serial measurements. The overall mean coefficient of
variation (CV) for the three measurements was 0.50±
0.24%. The Pearson correlation coefficient for the first
versus third NWC measurement was 0.999. The corresponding inter-measurement correlation coefficient for
the other five bivariate combinations were equally strong
(data not shown) (first and second UAC measurement,
second and third UAC measurement, first and third NWC
measurement, first and second UAC measurement, as
well as second and third UAC measurement).
The corresponding repeated means for the UAC measurements were 64.1±10.3 cm, 64.2±10.3 cm, and 64.3±
10.3 cm; again not significantly different by MANOVA.
The overall mean CV for the three UAC measurements
was 0.46±0.27%. The first versus third measurement, “r”
was 0.999. All of the statistical and numerical relationships reported for the NWC repetitions were also seen for
UAC (data not shown).
DISCUSSION
The AC variable has a close correspondence with body
mass index. Our inter-variable correlation coefficient of
0.92 (for BMI versus each of our two AC measurement
procedures) is numerically identical to the 0.92 found by
Groeneveld, Solomons and Doak in Guatemalan children.28
Flores-Huerta et al,29 and Hassan and co-workers,30 also
found a strong correlation between BMI and AC in Mexican and Egyptian children; aged 5 to 17 years old and 6 to
11 respectively. Our correlation between AC and BMI
was superior to the 0.87 observed by Soar and colleagues32 in southern Brazilian schoolchildren aged 7 to 9
years. Moreover, Gomez and colleagues33 also found a
less strong correlation (r=0.84) in their study with children aged between 6 and 10 years in Mexico City. On the
other hand, Hirschler and collaborators32 found a higher
correlation, r=0.96 between BMI and UAC in a studied
sample with an age range from 6 to 13 years.
McCarthy, Jarrett and Crawley,22 who illustrated the
alternative measurement approaches compared here, did
not actually use either one in their serial surveys of British children. Rather, they used the circumferential level
determined by the mid-point between the lowest rib and
the iliac crest in the saggital plane for their measurements.
They suggested, however, that NWC is effectively similar
to the more conventional and laborious measure use in
their surveys.22 The average NWC observed in our sample of middle-class school children in Guatemala City, in
2004-2005 (boys=63.2 cm and girls=60.2 cm), far exceeds the age- and gender-corresponding values of their
British sample enrolled in 1988 (boys=56.1 cm,
girls=55.3 cm).22 These same investigators34 found a major secular trend toward higher AC’s through the period
of 1988 to 1997, with 6.9 and 6.2 cm increases in males
and females, respectively.
The other measurement approach, umbilical level
(UAC), has been used only sparingly in the literature.5,24
In an Australian survey, Eisenmann35 measured at the
umbilical level and found circumference in Australian
children of European descent in both genders to be similar prior age 11 years. We can draw on an increasing number of reports on AC in juvenile populations for comparative insights. In our study, there were no significant differences in either measurement of waist circumference
between boys and girls of the same age groups. This
agrees with the findings of Maffeis and co-workers,36 and
Ayasama and colleagues.37 Children ranging from 3 to 11
years and 6 to 15 years were included in these surveys,
respectively. There were no significant sex-related differences in age. Einsenmann35 measured umbilical AC of
8439 Australians participants of 7-to-15 years and mean
UAC increased in both genders with similar values.
Meanwhile, Fernández, Reeden, Pietrobelli and Allison,38
Soar and co-workers31 and Fredriks and colleagues39
found differences by sex with in their children. After
evaluating 9713 subjects from 2 to 18 years of age; Fernandéz and his research team38 concluded that “waist
circumference increases in a monotonic fashion across
ages but at non-constant rates and in a matter that varied
across age and sex”. Soar and his research group,31 found
in Brazilian children from 7 to 9 years old that there are
statistically differences in waist circumference for boys
and girls. On the other hand, Fredriks and collegues,39
found the statistically differences for Dutch boys and girls
start from 11 years of age.
In this study, a general and gradual increment in AC in
children across ages from 7 to 11 years was found; this is
confirmed by the findings reported by McCarthy and coworkers.22 They conducted a cross-sectional study with
8355 British children, between 5 and 16.9 years were AC
was measured and it increased with age. Fernández and
his research group38 found increase of AC as children
became older in both sexes in three ethnic groups
(American, European-American and Mexican-American)
in a study with 913 children.
We acknowledge a series of methodological limitations in our study. These include the selection of a convenient sample, and cultural issues that arose in taking the
waist circumference measurements. By relying on the
voluntary participation of a select group of urban middle
and upper class children in Guatemala City, we are only
able to represent a segment of Guatemala’s metropolitan
population. A cultural limitation relates to the reason for
measuring children over their T-shirts. In an environment
lacking of the amenities of individual privacy, direct exposure of skin was proscribed. However, what we gain
from this cultural peculiarity, now allows a less invasive
technique for taking adequate measurement and can be
applied by cultures in which undressing children is not
permitted. Natural waist circumference can be measured
at the narrowest point of the trunk over the clothing, and
UAC can measured by asking the subject to indicate were
VJ Alvarado, E Mayorga, S Molina and NW Solomons
their umbilicus is located. Neither measurements, NWC
nor UAC, require palpation or visual locations of anatomical landmarks; each provides a useful technique
where cultural limitations interfere with removal of subjects clothing, as in middle class Guatemalan schools.
The nutritional transition40,41 has been defined as a
situation in a country or region in which the nutritional
and dietary factors promoting chronic disease begin to coexist with the persistence of traditional problems of underweight and nutrient deficiencies. Although this convenience sample is far from representative of its national
peer-group at large, and perhaps only partially representative of middle-class school children in private institutions
in the Guatemala City, the predominance of high waist
circumferences in a sub-segment of the metropolitan
population provides testimony for at least the advent of
nutrition transition and metabolic risk having been established in this Central American capital. Longitudinal observation studies with a more comprehensive set of variables are necessary for monitoring these changes, but our
present data provide a basis and rationale for the inclusion
of AC as an essential component of such an examination.
CONCLUSIONS
The use of AC as a tool in the clinical and epidemiological disciplines to screen for overweight and obesity has
grown in importance, also in children. The measurement
of AC is simple and practical. The two sites, natural waist
and umbilical level, which can be measured over light
clothing, provide an advantage over techniques for measuring body-fat that require privacy and precision equipment. The fact that UAC shows a disproportionate increase with abdominal girth illustrates the influence of
subcutaneous abdominal fat in the measurement at the
umbilical level. This may be useful for some diagnostic
purposes. In accordance with the conjecture by McCarthy
and colleagues,22 our study suggests that the NWC is a
reasonable surrogate for the conventional position for the
measurement tape in the majority of juvenile surveys, and
can be used as a procedure of choice were direct skin contact is inconvenient or culturally unacceptable.
4.
5.
6.
7.
8.
9.
10.
11.
12.
13.
14.
15.
16.
17.
ACKNOWLEDGMENTS
We wish to thank Sra Doris Elvira Chacon Sandoval head master of School Eloy Surez Cobian, children from School Eloy
Surez Cobian, School Manos a la Obra and Vacations Camps:
Monte María, La Auroa y EcoAventura and all the parents who
made this project possible by enrolling their children in it. We
are grateful to Emily Yates-Doerr and Marieke Vossenaar for
editing the manuscript.
18.
19.
AUTHOR DISCLOSURES
None of the authors have conflicts of interest.
20.
REFERENCES
1. Amigo H. Obesity in Latin American children: situation,
diagnostic criteria and challenges. Cad Saude Publica. 2003;
1:S163-70.
2. Martorell R, Khan LK, Hughes ML, Grummer-Strawn LM.
Obesity in Latin American women and children. J Nutr.
1998;128:1464-73.
3. Martorell R, Kettel Khan L, Hughes ML, Grummer-Strawn
LM. Overweight and obesity in preschool children from de-
21.
22.
19
veloping countries. Int J Obes Relat Metab Disord. 2000;
24:959-67.
de Onis M, Blosnner M. Prevalence and trends of overweight among preschool children in developing countries.
Am J Clin Nutr. 2000;72:1032-9.
Kain J. Obesity trends and determinant factors in Latin
America. Cad Saude Publica. 2003;19:S77-S86.
Monteiro CA, D'A Benicio MH, Conde WL, Popkin BM.
Shifting obesity trends in Brazil. Eur J Clin Nutr. 2000;54:
342-6.
Rivera-Dommarco J, Shamah-Levy T, VillalpandoHernandez S, Gonzalez-de Cossio T, Hernández-Prado B,
Sepulveda I. Encuesta Nacional de Nutrición 1999: Estado
Nutricional de Niños y Mujeres en México. Instituto Nacional de Salud Pública, México: DF; 2001.
Pi- Sunyer FX. The Epidemiology of Central Fat Distribution in Relation to Disease. Nutr Rev. 2004;62:S120-S6.
Miles JM, Jensen MD. Counterpoint: visceral adiposity is
not causally related to insulin resistance. Diabetes Care.
2005;28:2326-38.
Jensen MD. Is visceral fat involved in the pathogenesis of
the metabolic syndrome? Human Model Obesesity. 2006;14:
20S-24S.
Deprés JP. Health consequences of visceral obesity. Ann
Med. 2001;33:534-41.
Goran MI, Gower B. Relation between visceral fat and disease risk in children and adolescents. Am J Clin Nutr.
1999;70:149S-56S.
Moreno LA, Pineda I, Rodríguez G, Fleta J, Sarría A, Bueno
M. Waist circumference for the screening of the metabolic
syndrome in children. Acta Paediatr. 2002;91:1307-12.
Katzmarzyk PT, Srinivasan SR, Chen W, Malina RM, Bouchard C, Berenson GS. Body mass index, waist circumference, and clustering of cardiovascular disease risk factors in
a biracial sample of children and adolescents. Pediatrics.
2004;114:e198-e205.
Janssen I, Katzmarzyk PT, Srinivasan SR, Chen W, Malina
RM, Bouchard C, Berenson GS. Combined influence of
body mass index and waist circumference on coronary artery disease risk factors among children and adolescents.
Pediatrics. 2005;115:1623-30.
Barba G, Troiano E, Russo P, Strazzullo P, Siani A. Body
mass, fat distribution and blood pressure in Southern Italian
children: Results of the ARCA project. Nutr Metab Cardiovasc Dis. 2006;16:239-48.
Taylor RW, Jones IE, Williams SM, Goulding A. Evaluation of waist circumference, waist-to-hip ratio, and the
conicity index as screening tools for high trunk fat mass, as
measured by dual-energy X-ray absorptiometry, in children
aged 3–19 y. Am J Clin Nutr. 2000;72:490-5.
Cena H, Lingua S, Caccialanza R, Roggi C. Epidemiology
of obesity. Minerva Gastroenterol Dietol. 2001;47:209-21.
Garnett SP, Cowell CT, Baur LA, Shrewsbury VA, Chan A,
Crawford D, Salmon J, Campbell K, Boulton TJ. Increasing
central adiposity: the Nepean longitudinal study of young
people aged 7-8 to 12-13 y. Int J Obes (Lond). 2005;29:
1353-60.
Neovius M, Linne Y, Rossner S. BMI, waist-circumference
and waist-hip-ratio as diagnostic tests for fatness in adolescents. Int J Obes (Lond). 2005;29:163-9.
Tytmonas G. The influence of increased body mass index
and abdominal obesity on the development of metabolic
syndrome. Medicina (Kaunas). 2006;42:123-9.
McCarthy HD, Jarrett KV, Crawley HF. The development
of waist circumference percentiles in British children aged
5.0-16.9 y. Eur J Clin Nutr. 2001;5:902-7.
20
Waist circumference of Guatemalan children
23. Lohman TG, Roche AF, Martorell R. Anthropometric standardization reference manual. Human Kinetics Books.
Champaign, IL, 1988;55-70.
24. Norris B, Wilson JR. Child data. London: Department of
Trade and Industry, 1994.
25. Alvarado VJ, Mayorga E, Molina S, Solomons NW. Nutritional status of an economically-privileged convenience
sample of urban children in Guatemala City. Int J Food Sci
Nutr. 2009;22:1-11.
26. Ogden CL, Kuczmarski RJ, Flegal KM, Mei Z, Guo S, Wei
R, Grummer-Strawn LM, Curtin LR, Roche AF, Johnson
CL. Centers for Disease Control and Prevention 2000
growth charts for the United States: improvements to the
1977 National Center for Health Statistics version. Pediatrics. 2002;109:45-60.
27. Bland JM, Altman DG. Statistical method for assessing
agreement between two methods of clinical measurement.
Lancet. 1986;1:307-10.
28. Groeneveld IF, Solomons NW, Doak CM. Determination of
central body fat by measuring natural waist and umbilical
abdominal circumference in Guatemalan schoolchildren. Int
J Pediatr Obes. 2007;2:114-21.
29. Flores-Huerta S, Klünder-Klünder M, Reyes de la Cruz L,
Santos JI. Increase in body mass index and waist circumference is associated with high blood pressure in children and
adolescents in Mexico city. Arch Med Res. 2009;40:208-15.
30. Hassan NE, El-Masry SA, El-Sawaf AE. Waist circumference and central fatness of Egyptian primary-school children. East Mediterr Health J. 2008;14:916-25.
31. Soar C, Vasconcelos Fde A, Assis MA. Waist-hip ratio and
waist circumference associated with body mass index in a
study with schoolchildren. Cad Saude Publica. 2004;6:160916.
32. Gómez-Díaz RA, Martínez-Hernández AJ, Aguilar-Salinas
CA, Violante R, Alarcón ML, Villarruel MJ, Rodarte NW,
33.
34.
35.
36.
37.
38.
39.
40.
41.
Solórzano-Santos F. Percentile distribution of the waist circumference among Mexican pre-adolescents of a primary
school in Mexico City. Diabetes Obes Metab. 2005;7:71621.
Hirschler V, Aranda C, Calcagno Mde L, Maccalini G,
Jadzinsky M. Can waist circumference identify children
with the metabolic syndrome? Arch Pediatr Adolesc Med.
2005;159:740-4.
McCarthy HD, Jarrett KV, Emmett PM, Rogers I. Trends in
waist circumferences in young British children: a comparative study. Int J Obes (Lond). 2005;29:157-62.
Eisenmann JC. Waist circumference percentiles for 7- to 15year-old Australian children. Acta Paediatr. 2005;94:1182-5.
Maffeis C, Pietrobelli A, Grezzani A, Provera S, Tato L.
Waist Circumference and Cardiovascular Risk Factors in
Prepubertal Children. Obes Res. 2003;9:179-87.
Asayama K, Ozeki T, Sugihara S, Ito K, Okada T, Tamai H,
Takaya R, Hanaki K, Murata M. Criteria for medical intervention in obese children: a new definition of 'obesity disease' in Japanese children. Pediatr Int. 2003;45:642-6.
Fernández JR, Reeden DT, Pietrobelli A, Allison DB. Waist
circumference percentiles in nationally representative simples of African-Americans, European-American, and Mexican-America children and adolescents. J Pediatr. 2004;145:
439-44.
Fredriks MA, van Buuren S, Fekkes M, VerlooneVanhornick PS, Wit JM. Are age references for waist circumference, hip circumference and waist-hip ratio Dutch
children useful in clinical practice. Eur J Pediar. 2005;164:
216-22.
Popkin BM. The nutrition transition in low-income countries: an emerging crisis. Nutr Rev. 1994;52:285-98.
Popkin BM. The nutrition transition and its health implications in lower-income countries. Pub Health Nutr. 1998;1:521.
VJ Alvarado, E Mayorga, S Molina and NW Solomons
21
Short Communication
Correspondence of two procedures to measure
abdominal circumference in a convenience sample of
urban, middle-class schoolchildren in Guatemala City
Virginia J Alvarado BS1, Evelyn Mayorga BS1, Susana Molina MD2,
Noel W Solomons MD1
1
2
Centre for Studies of Sensory Impairment, Aging and Metabolism (CeSSIAM), Guatemala City, Guatemala
School of Nutrition, Universidad Francisco Marroquín, Guatemala City, Guatemala
以瓜地馬拉市的中產階級學童為樣本來看兩種測量腹
圍方法的一致性
背景:即使在發展中國家,青少年的過重及肥胖也日益受關注。評估中央肥胖
(例如:腹圍)的方法正逐漸受重視。目的:以居住在瓜地馬拉市,年齡為 72
至 131 個月的中產階級學童為樣本,比較兩種測量腹圍的方法。方法:在
2004 年 8 月至 2005 年 4 月,以 363 位學童(190 位男孩與 173 位女孩)為樣本的
橫斷性研究。使用傳統的自然腰圍測量法(NWC)以及以肚臍為基準的腹圍測量
法(UAC)來記錄腹圍,而測量時須穿著薄質的圓領汗衫。同時測量身高和體
重。將這兩種方法測量值以性別及年齡做比較。另外,使用相關係數及 BlandAltman 迴歸方法進行分析。並且以其中 50 位孩童為次樣本,進行再現性分
析。結果:男童的平均自然腰圍為 63.2±10.0 公分,女童的平均自然腰圍為
60.2±7.7 公分(p 值為 0.001);男童以肚臍為基準的平均腹圍為 65.9±11.0 公
分,女童為 63.2±8.8 公分(p 值為 0.008)。腹圍的大小大致隨著年齡的增加而增
加。自然腰圍測量值及以肚臍為基準的腹圍測量值之間的差異隨著腹圍的增加
而增加。BMI 對自然腰圍與 BMI 對腹圍的皮爾森相關係數為 0.92,變異係數
為 0.46±0.27%。自然腰圍測量法以及以肚臍為基準的腹圍測量法的再測量的
再現性都高(相關係數大於 0.98,變異係數為 0.50±0.24%)。結論:藉由對於薄
質衣料的校正可獲得可信的自然腰圍測量值及以肚臍為基準的腹圍測量值。這
兩種測量方法都適合用以蒐集有文化背景限制的族群的體組成資料。
關鍵字:青少年中央肥胖、自然腰圍、以臍帶為基準的腹圍、身體質量指
數,瓜地馬拉


© Copyright 2026