
Denervated and degenerated muscle stimulation: advanced image process-
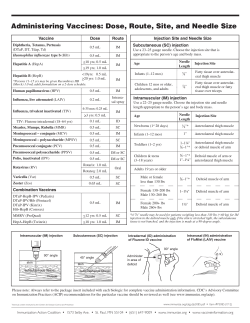
Denervated and degenerated muscle stimulation: advanced image processing techniques and 3-dimensional rendering to monitor muscles restoration
Paolo Gargiulo, Brynjar Vatnsdal, Pall Ingvarsson, Stefan Yngvason, Vilborg Gudmundsdottir, Sigrun Knutsdottir, Thordur Helgason, Landspitali - University Hospital, Iceland
Abstract
A novel methods, based on medical images and special processing tools, is developed to monitor growth in
denervated and degenerated muscles (DDM). In this paper is demonstrated how DDM restore volume and shape
due a special pattern of electrical stimulation.
A novel clinical rehabilitation method for patients who have permanent and non recoverable muscle denervation
in the legs was developed in the frame of European Project RISE. The technique is based on FES and the project
results shows, in these severely disabled patients, restoration of muscle tissue and muscle function.
Spiral CT scans and segmentation techniques are used to quantify the effects produced by the stimulation
treatment, on quadriceps muscle.
The results shows Rectus Femoris to be the most sensible muscle to the induced stimulation, in compliant
patient, Rectus Femoris doubled his volume during the treatment period while in other muscle bellies changes
were minimal.
The 3-dimensional approach proposed in this work also allows to evaluate changes in muscle shape. Geometrical
changes in the muscle are measured and compared with a normal muscle and the differences quantified. The
results show a correlation in between restoration of shape and muscle growth.
1
Introduction
Muscles became denervated as consequences of severe Spinal Cord Injuries, when this occurs bidirectional communication between muscle fibers and motor neurons is interrupt irreversibly. In humans,
chronic denervation of muscles can be the result of
injuries to spinal roots, plexuses, or peripheral nerves.
Muscles in patients with flaccid paraplegia are denervated and fibers degenerating with time; these patients
have no hope of regaining their muscle function with
traditional treatment.
The consequences of denervation in muscle are severe
and with multiple effects; the denervated muscle rapidly lose mass and force-generating capacity increasing connective tissue. The consequences of 3 years of
denervation are showed in fig 1.
From the muscular structure point of view, the lack of
innervation causes severe alterations of fiber properties: general disarrangement of internal structure accompanied by functional impairment and followed by
complete degeneration.
No efficient way of alleviating or preventing the muscular atrophy that results from long- standing denervation was available until with the use of an intensive
regime of direct stimulation, delivered through largearea electrodes placed over the skin of the anterior
thigh showed remarkable clinical results. [1]
In November 2001 the European funded project RISE
started with the aim of establishing a novel clinical
rehabilitation method for patients who have permanent and non recoverable muscle denervation in the
legs. The technique based on Functional Electrical
Stimulation (FES) aim to restore muscle tissue, muscle function and the ability to rise in these severely
disabled patients. [2]
This paper shows the restoration process occurred to
one Icelandic patient from the macroscopic point of
view using advanced image processing techniques. [3]
Fig.1 Innervated muscle (A) vs. Degenerated (B)
2
Method
2.1 Spiral CT scanning
To enable monitoring of the whole stimulated muscles, spiral CT scans of the RISE Study’s Icelandic
subgroup are taken every 4–6 months. The scan starts
above the head of the femur and continues down to
the knee joint, both legs being covered by one scan.
They are taken with a distance of 0.625 mm between
slices, resulting in a total of about 750–900 CT slices,
depending on the patient’s size. This data set gives a
complete three-dimensional description of the tissue,
including the muscles and bones in both upper legs.
Thresholding and Segmentation
In order to isolate the single muscle bellies and measure the growth, CT scan data are imported into a special image processing and editing computer program
called MIMICS [4]. In this software environment, the
3-dimensional form of the muscle is reconstructed and
certain regions of interest is extracted and isolated.
To achieve the segmentation and then the isolation of
the Rectus Femoris from the surrounding, the first
step is to discriminate amongst the different tissues in
the thigh using the Hounsfield (HU) scale. The spatial
distribution of CT Hounsfield unit (HU) values must
be coupled with knowledge on the normal and denervated muscle anatomy. A threshold based on HU values is defined, maximum and minimum value is established, and individual pixels are selected if their
value falls in between the threshold values.
The interval chosen to visualise the denervated degenerate muscle tissue is [-25, 129] HU, while normal
musculature has Hounsfield values between 40 ± 20
HU. The reason to use such a wide interval is to monitor the restoration process and the changes of muscle
density, since during the stimulation therapy, muscle
fibre is assumed to be regenerated, replacing the excessive connective tissue and fat. The segmentation
process isn’t automatic but based on the direct reorganisation of the muscle bellies on the CT-Scan slide.
An initial cross-section is selected from the data set. A
contour is designed manually around the muscle belly
cross-section in order to isolate the selected region
from the surrounding area. The shape created is projected to the next cross-section and adjusted to fit the
new muscle belly cross-sectional area. The process
continues until all cross-sections which build up the
muscle are covered.
Rectus Femoris Volume and Shape Measurements
Special attention was paid to segmenting of the Rectus Femoris muscle. There are two main reasons for
the special interest in the segmentation and monitoring of the rectus femoris:
1. The Rectus Femoris is closer to the electrodes during stimulation and therefore the most stimulated
muscle.
2. The Rectus Femoris musculature, because of morphology, can be segmented and isolated better from
other muscles and tissue.
Rectus Femoris from different points of time are
compared, and muscle growth monitored very accurately. The Rectus Femoris’ evolution is represented
in Figure 2.
Fig.2. Muscle growth represented in 3-d, volumes are
measured in cubic mm.
In order to quantify the changes in muscle shape, twodimensional figures of the muscle were examined.
The patella was used as an indication of the figure
view being identical. Through morphological operations, the muscle edges were highlighted and used to
determine a mean line throughout the length of the
muscle (Fig.3). This mean line was then compared for
the same patient at various stages in the therapy period and furthermore compared to data from a healthy
subject. The comparison was done with root mean
square error calculations of 100 samples along the
length of the muscles:
RMSE =
1 n
(l (n) healthy − l (n) patient ) 2
∑
n 1
Fig. 3. Comparison of the shape of the rectus femoris
muscle as treatment progresses.
This is used to indicate a possibly diminishing error
compared to a healthy subject, as the therapy progresses. Further calculations were made at the muscle
region where the largest changes in shape were observed.
3
Results
4
The methodology developed in this work demonstrates to be a powerful tool for muscle monitoring as
well as allowing a better understanding of restoration
mechanisms induced by electrical stimulation. Moreover, the results permit quantitative and qualitative
measurement on the degenerate muscle otherwise
hidden [5].
The following are the quantitative results from a patient (labeled as Pt. 2) where the effect of the stimulation therapy is most apparent – a 29-year-old man,
injured in 1999, started the stimulation program at the
end of 2003.
The muscle growth in the rectus femoris is reasonable
after four years of electrical stimulation with variable
therapy compliance: from a volume of 88504 mm3 in
December 2003 to a volume of 132630 mm3 measured in November 2007 (Fig. 2), a volume increase of
50%. Muscle density is also growing remarkably during the 4 years of stimulation, in the Fig, 4 the density
distribution shift is shows the improved density in the
stimulated muscle.
Clinical evidence shows that electrical stimulation can
not only stop muscle degeneration, but allows them to
grow again. The results of this work clearly demonstrate and quantify changes induced in muscle through
the stimulation treatment. Further work should be
done to study the correlation between the different
restorations processes involved in muscle growth. For
instance, important issues underlined in this work
which deserve more attention are the density inhomogeneity and the changes of morphology characterizing long-term denervated muscle.
A further indication of muscle regeneration is the
muscle shape. The results of this study indicate that
the changes in muscle shape occur primarily at the
lower part of the rectus femoris muscle and that this
change is gradually being reversed with the stimulation therapy. However, as the quantitative measures of
shape changes in this study are performed only on the
frontal plane of the rectus femoris, it is possible that
further changes in other planes occur. In future work,
this should be addressed by multi-plane studies and
preferably a three-dimensional study of the muscle
shape.
5
Fig.4. Rectus Femoris density distribution; in 2003
(yellow line) and 2008 (red line).
3-D reconstruction of the Rectus Femoris shows certain changes in muscle shape which we have been localising and quantifying. These changes are local and
occur mostly in the lower part of the Rectus Femoris
closer to the patella (Fig. 3). Along the medial and
upper part of the muscle, changes of shape are negligible, though the volume growth is mostly in the central area of the rectus femoris.
The difference in shape between the normal subject
and the patient is largest in 2004, after just a short period of stimulation therapy, and thereinafter the difference gradually decreases (Table 2, upper row). Comparison at the region of the most change (Figure 3)
further emphasises this trend, but with a clearer indication (Table 2, lower row).
RMS
Whole
muscle
Selected
area
2003
2004
2005
2006
2007
9.2400
13.0200
11.9850
11.2167
10.1450
15.4268
25.0122
19.7683
19.2439
15.4146
Table 1. The results from the root mean square error
calculations. RMS-error was
Discussion
Conclusion
Improved monitoring techniques and muscle modeling can also contribute to the development of new
technique and technologies optimize stimulation protocol and electrode position and, furthermore, be used
as a base for new development designs such as stimulators, electrodes and implantable devices.
Finally, the segmentation process and monitoring
methodology developed in this work is not only an
accurate method to validate the restoration process,
but it is also a promising tool to improve understanding of denervated muscle.
Reference
1. Kern H, Hofer, Mödlin M, Forstner C, Mayr W,
Richter W. FES of long-term denervated muscles in
humans: clinical observations and laboratory findings.
Basic Appl Myol 2002; 12: 291–9.
2. Mayr W, Hofer C, Bijak M, et al. FES of denervated muscles: existing and prospective technological
solutions. Basic Appl Myol 2002; 12: 287–90.
3. Helgason T, Gargiulo P, Jóhannesdóttir F, Ingvarsson P, Knútsdóttir S, Gudmundsdóttir V, Yngvason S.
Monitoring Muscle Growth and Tissue Changes Induced by ES of DDM with CT and Stereolithographic
3D Modeling. Artificial Organs 29(6) 2005:440–443
4. Web site: www.materialise.com
5. Gargiulo P, Helgason T, Ingvarsson P, Knútsdóttir
S, Gudmundsdóttir V, Yngvason S. Morphological
changes in denervated muscle treated with FES. Basic
Appl Myol 17 (3&4): 133–136, 2007


© Copyright 2026