
Metabolite profiling of small cerebrospinal fluid sample volumes
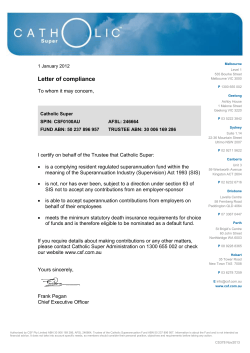
Metabolomics
DOI 10.1007/s11306-012-0428-2
ORIGINAL ARTICLE
Metabolite profiling of small cerebrospinal fluid sample volumes
with gas chromatography–mass spectrometry: application to a rat
model of multiple sclerosis
Leon Coulier • Bas Muilwijk • Sabina Bijlsma • Marek Noga • Marc Tienstra
Amos Attali • Hans van Aken • Ernst Suidgeest • Tinka Tuinstra •
Theo M. Luider • Thomas Hankemeier • Ivana Bobeldijk
•
Received: 14 February 2012 / Accepted: 17 April 2012
Ó Springer Science+Business Media, LLC 2012
Abstract Analysis of metabolites in biofluids by gas
chromatography–mass spectrometry (GC–MS) after oximation and silylation is a key method in metabolomics. The
GC–MS method was modified by a modified vial design and
sample work-up procedure in order to make the method
applicable to small volumes of cerebrospinal fluid (CSF), i.e.
10 lL, with similar coverage compared to the standard
procedure using C100 lL of CSF. The data quality of the
modified GC–MS method was assessed by analyzing a study
sample set in an animal model for multiple sclerosis,
including repetitively analysed quality control rat CSF samples. Automated normalization and intra- and inter-batch
correction significantly improved the data quality with the
majority of metabolites showing a relative standard deviation
\20 %. The modified GC–MS method was successfully
Electronic supplementary material The online version of this
article (doi:10.1007/s11306-012-0428-2) contains supplementary
material, which is available to authorized users.
L. Coulier (&) S. Bijlsma I. Bobeldijk
TNO, Utrechtseweg 48, 3704 HE Zeist, The Netherlands
e-mail: [email protected]
B. Muilwijk M. Tienstra
TNO Triskelion BV, Zeist, The Netherlands
M. Noga T. Hankemeier
Leiden/Amsterdam Center for Drug Research, Leiden,
The Netherlands
A. Attali H. van Aken E. Suidgeest T. Tuinstra
Abbott Healthcare Products B.V., Weesp, The Netherlands
T. M. Luider
Erasmus Medical Center, Rotterdam, The Netherlands
T. Hankemeier
Netherlands Metabolomics Centre, Leiden, The Netherlands
applied in rat model of multiple sclerosis where statistical
analysis of 93 metabolites, of which 73 were (tentatively)
identified, in 10 lL of rat CSF showed statistically significant
differences in metabolite profiles of rats at the onset and peak
of experimental autoimmune encephalomyelitis compared to
rats in the control group. The modified GC–MS method
presented proved to be a valid and valuable metabolomics
method when only limited sample volumes are available.
Keywords Metabolomics GC–MS Cerebrospinal fluid Multiple sclerosis Animal model EAE model
1 Introduction
Cerebrospinal fluid (CSF) is an important biomarker
compartment, especially for diseases related to the central
nervous system. Although the sampling of CSF is much
more invasive compared to other biofluids, such as plasma
and urine, it is thought that due to its close contact with the
extracellular fluid of the brain, the composition of CSF
gives a good reflection of the biological process in the brain
(Romeo et al. 2005).
Analysis of metabolites in CSF has been common practice
in clinical chemistry for many years, especially for the
diagnosis of inborn errors of metabolism (Moolenaar et al.
2002) Analysis of CSF is mainly done in an untargeted mode
using NMR (Moolenaar et al. 2002) or in targeted mode by
MS-based or enzymatic methods (Baran et al. 2009).
Recently, there has been an increasing attention for the
analysis of metabolites in CSF by MS-based methods
(Wikoff et al. 2008; Wishart et al. 2008; Carrasco-Pancorbo
et al. 2009; Myint et al. 2009; Crews et al. 2009; Kosicek
et al. 2010; Koek et al. 2010; Woulikainen et al. 2009;
Noga et al. 2011; Locasale et al. 2012) but only very few
123
L. Coulier et al.
publications exist in which MS-based methods are applied in
metabolomics studies using CSF as a biomarker compartment (Wikoff et al. 2008; Myint et al. 2009; Noga et al. 2011;
Wuolikainen et al. 2011; Locasale et al. 2012).
Gas chromatography–mass spectrometry (GC–MS)
analysis of oximated and silylated metabolites is an excellent
example of a broad profiling method that is commonly used
for metabolomics purposes as was recently reviewed by
Koek et al. (2011). This method is usually applied to plasma
and urine and only a few examples exist where GC–MS was
applied to CSF (Wishart et al. 2008; Carrasco-Pancorbo et al.
2009; Koek et al. 2010; Woulikainen et al. 2009; Noga et al.
2011; Wuolikainen et al. 2011; Stoop et al. 2010). The
advantage of the GC–MS method is its broad coverage of
classes of metabolites that can be detected (Wishart et al.
2008; Koek et al. 2010; Stoop et al. 2010). One of the
drawbacks of the GC–MS method is that relatively large
sample volumes are needed, i.e. 100–250 lL (Wishart et al.
2008; Carrasco-Pancorbo et al. 2009; Stoop et al. 2010).
However, this is less than often used for NMR and for human
studies sufficient CSF is normally available to provide for
these volumes. For animal studies, especially rodents, the
large CSF volume required is problematic and pooling of
study samples, in order to reach sufficient volumes, is the
only option for analysis. This, however, inevitably leads to
reduction of the statistical power (Noga et al. 2011). The
reason for the relatively large sample volumes used, is the
sample work-up which includes different (derivatization)
steps resulting in a relatively large end volume necessary to
do all these steps in a robust way. As a result, a larger sample
volume is necessary at the start in order to detect sufficient
metabolites. Recently, Koek et al. (2010) described an elegant way of analyzing very small CSF volumes, i.e. 1 lL,
with GC–MS. Although the results are promising, this
approach does not seem to be suitable yet for large scale
metabolomics studies.
Here we report an analytical method that can be used for
metabolomics studies when only a limited amount of sample
volume is available. The performance of the modified
GC–MS method will be shown using rat CSF samples, i.e.
10 lL, in an acute experimental autoimmune encephalomyelitis (EAE) rat model which is a standard model for
studying processes related to neuroinflammation and blood–
brain-barrier disruptions used to investigate mechanisms
potentially involved in multiple sclerosis (MScl).
2 Materials and methods
Smolinska et al. (2011). In brief, Male Lewis rats (Harlan
Laboratories B.V., the Netherlands) were inoculated on day
0 by injection of a 100 lL saline based emulsion containing 50 lL complete Freund’s adjuvant H37 RA (CFA,
Difco Laboratories, Detroit, MI), 500 lL Mycobacterium
tuberculosis type H37RA (Difco) and 20 lg guinea pig
myelin basic protein (MBP) in the pad of the left hind paw
of isoflurane anaesthetized animals. Next to these MBP
challenged rats (EAE group), one control group was
included: a group of rats receiving the same emulsion
without MBP (CFA group). Each group consisted of 30
animals. Disease symptoms and weights of all animals
were recorded daily. Of each group half of the animals was
sacrificed to collect CSF on day 10 (day of onset of disease
in EAE group) and the other half on day 14 (peak of disease in EAE group). Due to the disturbed physiological
state of the animals of the EAE group at day 14, the success
rate of CSF sampling for these animals was significantly
lower. Table 1 shows the final number of CSF samples of
each group that was used for statistical analysis (total
number of CSF samples analyzed in the complete rat EAE
study was 90).
The animal experiments described were approved by the
local Ethical Committee for Animal Experiments Solvay
Pharmaceuticals, Weesp, the Netherlands (study number
S0900.5.0012).
2.2 GC–MS
For small CSF volumes (10 lL) custom made 12 9
32 mm Teflon vials (200 lL, concical) produced by Savillex (Eden Prairie, MN, USA) and distributed by Grace
(Breda, the Netherlands). Small volumes of rat CSF
(10 lL) were deproteinized by adding 40 lL methanol and
subsequently centrifuged for 10 min at 11,800 g. The
supernatant was dried under N2 followed by derivatization
with 10 lL ethoxyamine.HCl (c = 56 mg/mL (0.58 M) in
pyridine) for 90 min at 40 °C and 20 lL methyl-N-(trimethylsilyl)-trifluoroacetamide (MSTFA) for 50 min at
40 °C. During the different steps in the sample work-up,
i.e. before deproteinization, derivatization and injection,
different (deuterated) internal standards (dicyclohexylphthalate (38 lM), alanine-d4 (135 lM), leucine-d3 (97 lM),
succinic acid-d4 (95 lM), phenylalanine-d5 (76 lM),
Table 1 Experimental design of the rat EAE study and the final
number of CSF samples of each group used for statistical analysis
Treatment groups
Day 10
Onset disease
Day 14
Peak disease
CFA
14
11
EAE
13
6
2.1 Rat EAE study
Rat CSF study and CSF sampling was carried out using
procedures as previously described Noga et al. (2011) and
123
Multiple sclerosis
glutamic acid-d3 (87 lM), ribose-13C5 (79 lM), citric
acid-d4 (63 lM), cholic acid-d4 (31 lM)) were added. The
final volume was 50 lL.
1 lL of the derivatized samples was injected in splitless
mode on a HP5-MS 30 m 9 0.25 mm 9 0.25 lm capillary column (Agilent Technologies, Palo Alto, CA) using a
temperature gradient from 70 to 320 °C at a rate of
5 °C/min. GC–MS analysis was performed using an Agilent 6890 gas chromatograph coupled to an Agilent 5973
mass selective detector. MS detection was used in electron
impact mode and full scan monitoring mode (m/z 15–800).
The electron impact for the generation of ions was 70 eV.
A total of 90 rat CSF samples from the EAE study
described above were analyzed by GC–MS. The samples
were randomly distributed over three batches, i.e. three
batches of 30 samples. One larger volume of rat CSF
(80 lL) obtained from one rat in the same experiment was
used as quality control (QC) sample and was analyzed in
sextuplicate (two QC samples analyzed in triplicate) in all
three batches, similar to the procedure described by van der
Greef et al. (2007).
2.3 Data pre-processing
Data pre-processing was performed by composing target
lists of peaks detected in the samples based on retention
time and mass spectra. These peaks were integrated for all
samples. The peak areas were subsequently normalized
using internal standards and corrected for intra- and interbatch effects using the QC samples according to the procedure described by van der Kloet et al. (2009). Finally the
corrected data were autoscaled and the 10 % rule was
applied, which removes all metabolites with non-zero
values for less than 10 % of the sample, prior to statistical
analysis.
2.4 Statistical analysis
2.4.1 Univariate data-analysis
An ANOVA model was built including group as factor.
Data were log-transformed and statistical outliers (defined
as an observation for which the absolute residual was three
times higher than the square root of the model error) were
removed. In all statistical tests performed, the null
hypothesis (no group difference) was rejected at the 0.05
level of probability. For each variable, partial tests between
group levels were performed using multiple comparison
correction (Tukey–Kramer). Since many variables were
tested, the Benjamini-Hochberg procedure was used to
control the false discovery rate (FDR). Statistical analyses
were performed using the SAS statistical software package
(SAS version 9.1.3, SAS Institute, Cary, NC, USA).
2.4.2 Multivariate data-analysis
All multivariate analyses were performed in the Matlab
environment (R2008b, 1984–2008, The Mathworks Inc.)
and the PLS toolbox for Matlab (version 5.0.3 (r6466),
1995–2008 Eigenvector Research Inc.). Principal component analysis (PCA) (Jolliffe 1986) was used to screen the
metabolomics data sets in order to detect outliers or certain
patterns present in the data (time patterns, similarity
between samples etc.). Partial least squares discriminant
analysis (PLS-DA) (Stahle and Wold 1987) was applied to
correlate metabolomics data to class assignments. For good
PLS-DA models, the top metabolites with the difference
between the two groups were ranked based on the absolute
value of their regression coefficient. The validity of the
PLS-DA model was tested using a 10-fold double cross
validation (DCV) procedure (Smit et al. 2007). In a PLS-DA
model the double cross error multiplied by 100 percent
indicates the percentage of misclassification. Besides the
DCV, a permutation test was performed to test the predictivity of the model. In the permutation test the class
assignments were re-ordered 250 times and every time a
new model was built. If the model was predictive, the DCV
error of the models after permutation of the class assignments was higher than the original model.
3 Results and discussion
3.1 GC–MS modification method
Typical sample volumes used for GC–MS are 100 lL or
more for e.g. CSF (Wishart et al. 2008; Wuolikainen et al.
2011; Stoop et al. 2010). As a result of the different sample
work-up steps, especially the derivatization steps, i.e. oximation and silylation, the final volume is *150 lL. This
volume is necessary to have an excess of derivatization
reagents, sufficient homogenization in the vial and sufficient volume height in the vial for injection. When less
sample volume is available the same procedure can be used
but this will result in significant dilution of the sample,
leading to a strong decrease in sensitivity and thus low
coverage. Therefore a new vial design was developed in
which the depth of the insert of the vial as well as the
diameter was reduced leading to a reduction of the total
volume of the insert, i.e. from 500 to 200 lL (see Fig. 1).
In addition, the volume of the derivatization reagents was
reduced resulting to a final volume of 50 lL instead of
150 lL. It should be noted that using 50 lL as final volume
in the standard vial design lead to significant heterogeneity
in the derivatization reaction as well as irreproducible
injection due to bad homogenization and low volume
heights. Therefore, the combination of the improved vial
123
L. Coulier et al.
Fig. 1 Schematic
representation of standard PTFE
vials and optimized PTFE vial
for small sample volumes
“standard” 500µL vial
optimized 200µL vial
5.4 mm
7,5 mm
5.4 mm
17 mm
4 mm
ca 31 mm
50µL
endvolume
20µL for
oximation
ca 45°
150µL
endvolume
40µL for
oximation
ca 45°
design and modified sample work-up procedure is essential
to obtain reliable results for small volumes of CSF. Comparison of TIC GC–MS chromatogram and detected
metabolites obtained for 100 lL human CSF with the
procedure for large sample volumes (Stoop et al. 2010) and
10 lL rat CSF with the modified method shows that
although the dilution factor, respectively 1.35 and 5, is still
higher for small volumes, the coverage of metabolites is
very similar (see Fig. 2 and Table S1 in supplementary
material). This demonstrates that with the modified
GC–MS method a broad range of metabolite classes can be
detected in only 10 lL of CSF, the majority being identified. The number of metabolites detected is similar or even
higher than reported for large volumes of human CSF by
others (Wishart et al. 2008; Stoop et al. 2010; Wuolikainen
et al. 2011) which shows that the modified GC–MS has
similar or even better metabolite coverage for only 10 lL
of CSF compared to other GC–MS methods in literature
that use sample volumes C100 lL. Furthermore it can be
seen that there is quite some overlap between metabolites
detected in rat and human CSF by GC–MS. More than
85 % of the metabolites detected by the modified GC–MS
in 10 lL of rat CSF were also detected in 100 lL of human
CSF (Stoop et al. 2010) as can be seen in Table S1 in
123
supplementary material. In addition, comparison with the
coverage of metabolites detected from 2 lL human CSF
using the in-liner derivatization approach as published by
Koek et al. (2010) shows clearly that the latter approach
has significantly less metabolite coverage (see Table S1 in
supplementary material). It should be stressed that the work
by Koek et al. (2010) was a proof-of-principle and did not
include only limited optimization, validation and confirmation of metabolite identities by analyzing reference
compounds.
3.2 Data quality
Besides good sensitivity and coverage, the quality of the
data obtained with the modified GC–MS method is
essential in order to apply the method in metabolomics
studies. To this purpose the modified GC–MS method was
applied to a series of 90 rat CSF samples (10 lL) analyzed
in three batches of 30 samples. One rat CSF sample was
used as QC sample, aliquoted and analyzed repeatedly in
all three batches covering the complete analysis sequence.
With this procedure the relative standard deviation of the
raw area of all metabolites detected in all QC samples was
calculated (see Fig. 3) (van der Greef et al. 2007). It can be
Multiple sclerosis
C
A *10
7
0
DCHP (IS)
pyroglutamic acid
leucine
serine
0
10.00
B
alanine
2.1
myo-inositol
glutamine
urea
lactic acid
galactose
glucose
3.2
1.6
*107
4.2
15.00
20.00
25.00
30.00
35.00
40.00
10.00
D
*107
15.00
20.00
25.00
30.00
35.00
40.00
15.00
20.00
25.00
30.00
35.00
40.00
*107
1.2
0.6
0.6
0.3
0
10.00
15.00
20.00
25.00
30.00
35.00
40.00
0
10.00
Fig. 2 a TIC GC–MS chromatogram and b zoom of a obtained with 10 lL rat CSF using the modified GC–MS method, c TIC GC–MS
chromatogram and d zoom of c obtained with 100 ll human CSF using the standard GC–MS method
seen that the RSD is in general high, i.e. [10 %. Next, the
raw peak areas were normalized using the most suitable
internal standard for each metabolite, selected and applied
by an automated procedure (van der Kloet et al. 2009). This
procedure already leads to a significant improvement of the
RSDs as can be seen in Fig. 3. The final step in the procedure is the intra- and inter-batch correction, a calibration
method that takes into account offsets between batches due
to small changes in the instrumental set-up, i.e. column and
liner, as well as changes within a batch due to e.g. instability of derivatives (van der Kloet et al. 2009). After the
batch correction, the RSDs are even further improved (see
Fig. 3). Almost 75 % of the metabolites have an RSD
\20 % (see also Table S2 in supplementary material for
the RSDs of the individual metabolites). In general, the low
abundant metabolites show a higher RSD. Note that the
metabolites with extremely high RSDs often show missing
values in the QC samples and are generally very low
abundant in QC samples. However, these metabolites can
be of relevance in the study sample when they are significantly up-regulated in specific groups. It can be concluded
that the quality of the GC–MS data after correction is good
and comparable to when 100 lL is used (see Table S2 in
Supplementary material and Stoop et al. 2010). The modified GC–MS method for small CSF volumes seems
therefore suitable for use in metabolomics studies.
3.3 EAE study
Rat CSF samples from a rat EAE study were analyzed by
the improved GC–MS method. The rat study was described
earlier by Smolinska et al. (2011) and was a repetition of
that reported recently by Noga et al. (2011). CSF samples
were taken from rats from the EAE group (=rats challenged
by myelin based protein) and the CFA group (=control
group) at day 10 and 14. Due to the severe symptoms at
day 14, the number of CSF samples for the EAE group at
day 14 is significantly less than 15, i.e. 6, but large enough
for further statistical analysis although the statistical power
is less for this group compared to the other groups (see
Table 1).
After data-preprocessing 93 peaks were used for statistical analysis of which 73 could be identified or characterized and 20 were unknown (see Table S2 in Supplementary
material).
Principal component analysis (PCA) was applied for
visual inspection of the CSF metabolite profiles of the four
animal groups (see Fig. 4). No batch effects or outliers
could be observed. The EAE day 14 group, i.e. peak of
disease, is clearly separated from the other groups. The
same seems partially true for the EAE day 10 samples, i.e.
early onset of the disease. The two control groups, i.e. CFA
day 10 and day 14, are not separated from each other.
123
L. Coulier et al.
IS corrected
Raw area
< 10%
<10%
<
>30%
10-20%
>30%
20-30%
10-20%
20-30%
QC corrected
>30%
< 10%
<10%
20-30%
10-20%
20-30%
>30%
10-20%
Fig. 3 RSD (%) of metabolites in QC samples before and after data preprocessing and batch correction
Various metabolites contribute to the separation of the full
stage EAE animals and part of the early onset EAE animals
from the other animals along PC1 (see Fig. S1 in supplementary material). Higher principal components did not
show any additional separations (see Fig. S2 in supplementary material).
PLS-DA models of the GC–MS data were calculated to
verify whether correct classification of CSF samples for
different treatment groups could be obtained. A good
PLS-DA model could be obtained for EAE day 14 versus
CFA day 14, i.e. peak of the disease versus control, with an
overall correct classification of 94 %. Similar results were
obtained for EAE day 14 versus EAE day 10, i.e. peak
versus early onset of the disease, with an overall correct
123
classification of 89 %. Not surprisingly, the metabolites
that contributed significantly to these models were very
similar (see Table S3 in supplementary information). For
EAE day 10 versus CFA day 10, i.e. onset of disease versus
control, a PLS-DA model was obtained with an overall
correct classification of 75 %. There is little or no overlap
between the list of metabolites contributing to the classification in this model and the first two models, which imply
that different biological processes are playing a role in the
onset and the peak of the disease.
Table 2 summarizes statistically significant increases
and decreases of metabolites based on univariate statistics.
Most of these metabolites also contribute to the PLS-DA
models (see Table S3 in supplementary information).
Multiple sclerosis
Scores on PC# 2 (explained variance 17.48 %)
Scores for PC# 1 versus PC# 2
6
+ CFA day 10
o EAE day 10
4
+x CFA day 14
X EAE day 14
2
0
-2
-4
-6
-8
-5
0
5
10
Scores on PC# 1 (explained variance 20.18 %)
Fig. 4 PCA scores plot of GC–MS metabolomics data showing the
separation of EAE day 14 samples (X) and partial separation of EAE
day 10 samples (o) from the control samples (CFA)
The amino acids listed in Table 2 confirm some of the
results found earlier (Noga et al. 2011; Smolinska et al.
2011). The observed effect, i.e. up- or down-regulation, of
the amino acids is also similar between the two studies.
Smolinska et al. (2011) found lysine to be up-regulated in
the EAE day 14 group, similar to this study (see Table 2).
Comparison of Table 2 and the results found by Noga et al.
(2011) shows that both studies see the up-regulation of isoleucine, leucine, lysine, phenylalanine, threonine, valine,
O-phosphorylethanolamine and taurine for rats in the EAE
day 14 group, i.e. full stage EAE and/or peak of the disease. The other amino acids reported by Noga et al. (2011)
are mainly low abundant compounds for which the GC–MS
method lacks sensitivity. It should be noted that the method
used by Noga et al. (2011) is specifically developed for the
analysis of (low abundant) amino acids but it does not
cover other classes of metabolites. With PLS-DA more
amino acids were found relevant, like asparagine and alanine (see Table S3 in supplementary information). Interestingly, only alanine shows down-regulation at both the
onset of the disease as well as at the peak of the disease.
Down-regulation of alanine was also reported in a rat EAE
model (Noga et al. 2011, Smolinska et al. 2011) as well as
in MScl (Sinclair et al. 2010).
The only major difference between this study and that of
Noga et al. (2011) was glutamic acid which shows an
increase in this study for the diseased animals but a
decrease in the study by Noga et al. (2011). This observation contributes to the controversy on glutamic acid as
biomarker in CSF. It is reported that glutamic acid in CSF
is highly susceptible to sampling variables and in particular
to storage temperature (Woulikainen et al. 2009).
Although biological interpretation of the results
obtained in this study was not the primary goal, it is
interesting to see what the added value of the modified
GC–MS method is with respect to metabolite coverage.
Some metabolites that were only detected by GC–MS
support the findings of Noga et al. (2011), like glycerol
(lipid metabolism) and uric acid (oxidative stress). Many
other classes of metabolites are listed in Table 2, including
carbohydrates, organic acids, polyols and purine/pyrimidine bases, demonstrating the complementary metabolite
coverage of the GC–MS method. Typical patterns can be
observed in Fig. 5 where uric acid and mannose already
show an increase for EAE day 10 indicative for an early
marker for disease while fructose and myo-inositol show a
significant decrease for EAE day 14, i.e. markers for the
peak of the disease. The rats of the EAE group start to
loose weight and start to develop disease symptoms around
day 10, while at day 14 the peak of the disease is observed
generally resulting in a minimal weight and a maximum
score on disease symptoms (Noga et al. 2011; Smolinska
et al. 2011). The up-regulation of ketone bodies, like acetoacetic acid and 3-hydroxybutyric acid, can be related to
the decreasing physical state of the rats during the progression of the disease including loss of weight, lower food
intake and increasing illness (Laffel 1999).
Interestingly, some metabolites, like citric acid, glyceric
acid, fructose and myo-inositol showed down-regulation
(see Table 2 and Fig. 5). For example, citric acid shows a
strong decrease for the progression of the disease although
at the onset of the disease a significant increase of citric
acid is observed. Reduced citric acid levels were also
reported by Smolinska et al. (2011) in a similar rat EAE
study and by Sinclair et al. (2010) for MScl. The sugars and
polyols are especially an interesting group of metabolites
while glucose, mannose and fucose or 6-deoxyglucose
show a clear up-regulation while fructose and myo-inositol
show down-regulation for disease progression and at the
peak of the disease. Glucose concentrations in CSF are
generally determined by blood glucose levels. Higher
glucose concentrations in CSF are attributed to increased
permeability of the blood–brain barrier (BBB) (Fishman
1993). Fructose and myo-inositol levels are considerably
higher in CSF than in plasma, hence down-regulation of
fructose and myo-inositol as observed in this study indicates increased permeability of the BBB leading to an
outflow of these metabolites from CSF to blood (Fishman
1993). The up- and down-regulation of other sugars and
polyols in Table S3 support this observation. These findings also correspond with the increase in BBB permeability
that was reported by Rosenling et al. (2012) based on
proteome analysis of rat CSF in a similar rat EAE study.
Decreasing myo-inositol levels were also reported in CSF
of persons with gliomas (Locasale et al. 2012).
123
L. Coulier et al.
Table 2 Metabolites detected by GC–MS that changed statistically significant, single and double symbols denote respectively 95 and 99 %
significance levels of the observed EAE effect (- = decrease, ? = increase)
EAE day 10 versus CFA day 10
Early
onset
EAE day 14 versus EAE day 10
Progression
EAE day 14 versus CFA day 14
Full
stage
Citric acid
??
4-Hydroxyglutamate
semialdehyde
??
49CSF
??
Glycerol-3-phosphate
??
Pyroglutamic acid
??
Valine
??
50CSF
??
49CSF
??
Glutamic acid
??
Mannose
?
Fucose or 6-deoxyglucose
??
Glycerol
??
Taurine
?
Pseudouridine
??
Pseudouridine
??
Glycerol
?
Leucine
??
02CSF
??
Cholesterol
?
Threonine
??
Threonine
??
Tryptophan
-
Glucose
??
??
Mannose
??
3-Methyl-2-hydroxybutanoic
acid
Uric acid
Citric acid
--
18CSF
?
3-Hydroxybutanoic acid
??
4-Hydroxyglutamate
semialdehyd
?
Glutamic acid
??
Glyceric acid
--
Phosphate
?
Acetoacetic acid
?
18CSF
?
2,3-Dihydroxybutanoic acid
?
Myo-inositol
-
Phenylalanine
?
Valine
?
28CSF
-
Acetoacetic acid
?
Fructose
-
02CSF
?
Isoleucine
?
2-Hydroxybutanoic acid
?
20CSF
2-hydroxybutanoic acid
??
??
3-hydroxybutanoic acid
??
Cholesterol
??
Glucose
??
Pyroglutamic acid
??
Leucine
??
Lysine
??
Phosphorylethanolamine
??
Phosphate
??
Mannose
??
Fucose or 6-deoxyglucose
??
Uracil
??
Taurine
??
Other possible interesting metabolites in Table 2 and
Table S3 that are up-regulated in CSF at the peak of the
disease are uracil, pseudouridine and dihydrouracil that can
be related to pyrimidine metabolism and cholesterol that is
also up-regulated at the early onset of the disease. Biological interpretation of these finding was hampered due to
lack of data in literature. Interestingly, several unknown
peaks were observed that showed significant up-regulation
both with univariate and multivariate statistics (see Table 2
and Table S3). Identification of these unknown metabolites
can lead to new biomarkers and improved biological
interpretation.
123
??
4 Conclusion
A modified vial design and sample preparation made it
possible to analyse small sample volumes of CSF, i.e.
10 lL, by GC–MS without losing sensitivity compared to
the volumes usually used for GC–MS, i.e. C100 lL. The
improved GC–MS method was applied to a rat model of
MScl showing good data quality as determined from the
relative standard deviation of metabolites in QC samples
after internal standard and QC correction. Changes in CNS
metabolism could successfully detected by the modified
GC–MS method. Compared to earlier work on similar
Multiple sclerosis
-3
x 10
0.16
5
Uric acid
Mannose
0.15
0.14
0.13
0.12
Values
Values
4
3
2
0.11
0.1
0.09
0.08
1
0.07
0
0.06
CFA day 10
EAE day 10
CFA day 14
EAE day 14
CFA day 10
EAE day 10
Fructose
0.05
CFA day 14
EAE day 14
Myo-inositol
3
0.045
2.5
Values
Values
0.04
0.035
0.03
2
0.025
1.5
0.02
0.015
1
CFA day 10
EAE day 10
CFA day 14
EAE day 14
CFA day 10
EAE day 10
CFA day 14
EAE day 14
Fig. 5 Box plots showing the relative peak areas of uric acid, mannose, fructose and myo-inositol in all experimental groups. Note the different
trends observed for these metabolites between experimental groups
studies, the application of GC–MS to CSF shows strong
potential with respect to the biological interpretation due to
its coverage of different classes of metabolites, like amino
acids, sugars, polyols, organic acids.
Acknowledgments This study was financially supported by Top
Institute Pharma project D4-102.
References
Baran, R., Reindl, W., & Northen, T. R. (2009). Mass spectrometry
based metabolomics and enzymatic assays for functional
genomics. Current Opinion in Microbiology, 12, 547–552.
Carrasco-Pancorbo, A., Nevedomskaya, E., Arthen-Engeland, Th.,
Zey, Th., Zurek, G., Baessmann, C., et al. (2009). Gas
chromatography/atmospheric pressure chemical ionization-time
of flight mass spectrometry: Analytical validation and applicability to metabolic profiling. Analytical Chemistry, 81, 10071–
10079.
Crews, B., Wikoff, W. R., Patti, G. J., Woo, H.-K., Kalisiak, E.,
Heideker, J., et al. (2009). Variability analysis of human plasma
and cerebral spinal fluid reveals statistical significance of
changes in mass spectrometry-based metabolomics data. Analytical Chemistry, 81, 8538–8544.
Fishman, R. A. (1993). Cerebrospinal fluid in diseases of the nervous
system (2nd ed.). Philadelphia: W.B. Saunders.
Jolliffe, I. T. (1986). Principal component analysis. New York:
Springer.
Koek, M. M., Bakels, F., Engel, W., van den Maagdenberg, A.,
Ferrari, M. D., Coulier, L., et al. (2010). Metabolic profiling of
ultrasmall sample volumes with GC/MS: From microliter to
nanoliter samples. Analytical Chemistry, 82, 156–162.
Koek, M. M., Jellema, R. H., van der Greef, J., Tas, A. C., &
Hankemeier, Th. (2011). Quantitative metabolomics based on
gas chromatography mass spectrometry: Status and perspectives.
Metabolomics, 7, 307–328.
Kosicek, M., Kirsch, S., Bene, R., Trkanjec, Z., Titlic, M., Bindila, L.,
et al. (2010). Nano-HPLC-MS analysis of phospholipids in
cerebrospinal fluid of Alzheimer’s disease patients—A pilot
study. Analytical and Bioanalytical Chemistry, 398, 2929–2937.
Laffel, L. (1999). Ketone bodies: A review of physiology, pathophysiology and application of monitoring to diabetes. Diabetes/
Metabolism Research Reviews, 15, 412–426.
Locasale, J. W., Melman, T., Song, S., Yang, X., Swanson, K. D.,
Cantley, L. C., et al. (2012). Metabolomics of human
123
L. Coulier et al.
cerebrospinal fluid identifies signatures of malignant glioma.
Molecular and Cellular Proteomics. doi:10.1074/mcp.M111.
014688.
Moolenaar, S., von Engelke, U., Morava, E., van der Graaf, M., &
Wevers, R. (2002). Handbook of 1H-NMR spectroscopy in
inborn errors of metabolism. Heilbronn: SPS publications.
Myint, K. T., Aoshima, K., Tanaka, S., Nakamura, T., & Oda, Y.
(2009). Quantitative profiling of polar cationic metabolites
in human cerebrospinal fluid by reversed-phase nanoliquid
chromatography/mass spectrometry. Analytical Chemistry, 81,
1121–1129.
Noga, M., Dane, A., Shi, S., Attali, A., van Aken, H., Suidgeest, E.,
et al. (2011). Metabolomics of cerebrospinal fluid reveals
changes in the central nervous system metabolism in a rat
model of multiple sclerosis. Metabolomics, 8, 253–263.
Romeo, M. J., Espina, V., Lowenthal, M., Espina, B. H., Petricoin, E.
F., & Liotta, L. A. (2005). CSF proteome: A protein repository
for potential biomarker identification. Expert Review in Proteomics, 2, 57–70.
Rosenling, Th, Stoop, M. P., Attali, A., van Aken, H., Suidgeest, E.,
Christin, C., et al. (2012). Profiling and identification of
cerebrospinal fluid proteins in a rat EAE model of multiple
sclerosis. Journal of Proteome Research, 11(4), 2048–2060. doi:
10.1021/pr201244t.
Sinclair, A. J., Viant, M. R., Ball, A. K., Burdon, M. A., Walker, E.
A., Stewart, P. M., et al. (2010). NMR-based metabolomics
analysis of cerebrospinal fluid and serum in neurological
diseases—a diagnostic tool? NMR Biomedicine, 23, 123–132.
Smit, S., van Bremmen, M. J., Hoefsloot, H. C. J., Smilde, A. K.,
Aerts, J. M. F. G., & de Koster, C. G. (2007). Assessing the
statistical validity of proteomics based biomarkers. Analytica
Chimica Acta, 592, 210–217.
Smolinska, A., Attali, A., Blanchet, L., Ampt, K., Tuinstra, T., van
Aken, H., et al. (2011). NMR and pattern recognition can
123
distinguish neuroinflammation and peripheral inflammation.
Journal of Proteome Research, 10, 4428–4438.
Stahle, L., & Wold, S. (1987). Partial least squares analysis with
cross-validation for the two-class problem. Journal of Chemometrics, 1, 185–196.
Stoop, M. P., Coulier, L., Rosenling, Th, Shi, S., Smolinska, A. M.,
Buydens, L., et al. (2010). Quantitative proteomics and metabolomics analysis of normal human cerebrospinal fluid samples.
Molecular and Cellular Proteomics, 9, 2063–2075.
van der Greef, J., Martin, S., Juhasz, P., Adourian, A., Plasterer, T.,
Verheij, E. R., et al. (2007). The art and practice of systems
biology in medicine: Mapping patterns of relationships. Journal
of Proteome Research, 6, 1540–1559.
van der Kloet, F. M., Bobeldijk, I., Verheij, E. R., & Jellema, R. H.
(2009). Analytical error reduction using single point calibration
for accurate and precise metabolomics phenotyping. Journal of
Proteome Research, 8, 5132–5141.
Wikoff, W. R., Pendyala, G., Siuzdak, G., & Fox, H. W. (2008).
Metabolomic analysis of the cerebrospinal fluid reveals changes
in phospholipase expression in the CNS of SIV-infected
macaques. Journal of Clinical Investigation, 118, 2661–2669.
Wishart, D. S., Lewis, M. J., Morrisey, J. A., Flegel, M. D., Jeroncic,
K., Xiong, Y., et al. (2008). The human cerebrospinal fluid
metabolome. Journal of Chromatography B, 871, 164–173.
Woulikainen, A., Hedenstrom, M., Moritz, Th, Marklund, S. L., Antti,
H., & Andersen, P. M. (2009). Optimization of procedures for
collecting and storing of CSF for studying the metabolome in
ALS. Amyotrophic Lateral Sclerosis, 10, 229–236.
Wuolikainen, A., Moritz, T., Marklund, S. L., Antti, H., & Andersen,
P. M. (2011). Disease-related changes in the cerebrospinal fluid
metabolome in amyotrophic lateral sclerosis detected by GC/
TOFMS. PLoS ONE, 6, e17947.


© Copyright 2026