
integrated and repeat testing by the method. We gratefully acknowledge the ex-
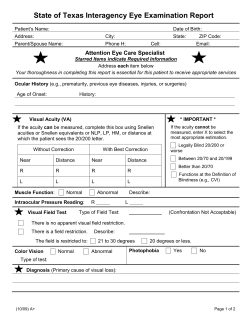
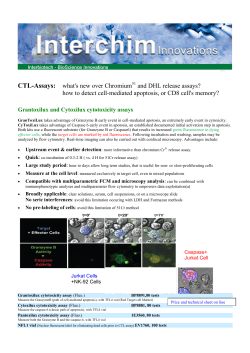
143 Clinical Chemistry 53, No. 1, 2007 integrated and repeat testing by the same or a different glycated Hb method. Fig. 1. Boronate affinity chromatograms. The x axis is time in min and the y axis is relative absorbance at 413 nm. Nonglycated Hb elutes at 0.47 to 0.49 min and glycated Hb elutes at 1.05 to 1.06 min (A), index case, HbA1c 5.9%. (B), index case, HbA1c 9.4%. (C), nondiabetic sample heterozygous for HbE. (D), nondiabetic sample heterozygous for HbCS. The HbCS peaks were 2.4% of the total Hb in the -Thal short program. (E), nondiabetic sample heterozygous for HbCS. The HbCS peaks were 2.7% of the total Hb in the -Thal short program. We gratefully acknowledge the excellent technical support provided by the staff of the Automated Endocrinology Laboratory and the Hemoglobin Identification section of the Special Genetics Laboratory at ARUP Laboratories. References 1. Tangvarasittichai O, Jeenapongsa R, Sitthiworanan C, Sanguansermsri T. Laboratory investigations of Hb Constant Spring. Clin Lab Haematol 2005;27:47–9. 2. Laig M, Pape M, Hundreiser J, Flatz G, Sanguansermsri T, Das BM, et al. The distribution of the Hb constant spring gene in Southeast Asian populations. Hum Genet 1990;84:188 –90. 3. Hsia YE, Ford CA, Shapiro LJ, Hunt JA, Ching NS. Molecular screening for haemoglobin constant spring. Lancet 1989;1:988 –91.. 4. Derry S, Wood WG, Pippard M, Clegg JB, Weatherall DJ, Wickramasinghe SN, et al. Hematologic and biosynthetic studies in homozygous hemoglobin Constant Spring. J Clin Invest 1984;73:1673– 82. 5. Bry L, Chen PC, Sacks DB. Effects of hemoglobin variants and chemically modified derivatives on assays for glycohemoglobin. Clin Chem 2001; 47:153– 63. 6. Little RR, Vesper H, Rohlfing CL, Ospina, M, Safar-Pour S, Roberts WL. Validation of the use of boronate affinity chromatography to measure glycated hemoglobin in the presence of HbS and HbC traits using a mass spectrometry reference method. Clin Chem 2005;51:264 –5. William L. Roberts results gave a CV of 3.4%. A patient sample homozygous for HbA with an HbA1c of 8.2% was analyzed 10 times in 1 assay and gave a CV of 1.1%. The fructosamine concentration of a plasma sample from the index patient was 384 mol/L (normal ⬍285 mol/L), consistent with an HbA1c result of ⬃9%. Phenotype analysis (HPLC, Variant analyzer, Bio-Rad Laboratories, beta-Thal short program) indicated 1.7% HbF, 4.6% P2 (HbA1c), 4.1% P3, 62% HbA0, 23% HbE, and 4.3% HbCS. HbCS eluted in 4 distinct peaks with retention times from 4.7– 5.2 min. When we analyzed nondiabetic samples heterozygous for HbE (Fig. 1C) or containing HbCS (Fig. 1D & E), the sizes of the peaks eluting between nonglycated and glycated Hb were consistent with the concentration of HbCS in the samples. The presence of HbE did not produce such a peak. The boronate affinity column that we used had a history of ⬃3500 injections. Analysis of the sample from the index patients and other samples heterozygous for HbE and HbCS on a column from a different lot with ⬍700 injections demonstrated no peak between nonglycated and glycated Hb. Additional testing of samples heterozygous for HbE and HbCS on this column after 3300 and 4400 injections failed to demonstrate a shoulder on the glycated Hb peak, suggesting that this interference from HbCS is specific to one lot of columns and mobile phase. In conclusion, the presence of HbCS in samples for glycohemoglobin analysis by boronate affinity chromatography has the potential to interfere with accurate measurement of glycated Hb. Any boronate affinity chromatogram with a shoulder on the glycated Hb peak should lead to careful review of how the peaks were Department of Pathology University of Utah Health Sciences Center Salt Lake City, UT and ARUP Institute for Clinical & Experimental Pathology 500 Chipeta Way Salt Lake City, UT 84108 Fax 801-584-5207 e-mail [email protected]. DOI: 10.1373/clinchem.2007.078824 To Mix with Pooled Normal Plasma or Not to Mix: A Comparative Study of 2 Approaches for Assessing Lupus Anticoagulant Inhibitory Activity in the Dilute Russell Viper Venom Method To the Editor: The recommended (1 ) step-wise approach to the study of lupus anticoag- 144 Letters ulant (LA) begins with a prolonged clotting time in a phospholipid-dependent clotting assay (screen), a noncorrection in a mix with pooled normal plasma (PNP), and then a correction in the presence of increased phospholipid (confirm). Laboratories differ in their application of these recommendations. Jacobsen et al. (2 ) integrate screen, mix, and confirm into a single assay and analyze the data as a lupus ratio (LR). Tripodi et al. (3 ) propose no prior mix with PNP even for patients on oral anticoagulant (OAC) and analyze their data as a percentage correction. We wished to compare these 2 approaches by using the common (4 ) dilute Russell viper venom test (dRVVT) as the clotting assay. Samples were collected from 500 consecutive patients (291 women, median age 56 years) for whom LA tests were requested during a 5-month period. Repeat tests (n ⫽ 19) were excluded on patients as were 9 samples that contained unfractionated heparin. Of the remaining 491 patients, 85 were on OAC with international normalized ratios ranging from 1.7 to 3.5. Plasma from 70 healthy volunteers (30 men and 40 women, median age 48 years) were used to establish the cutoff values. We used PNP from a pool of 30 similar healthy volunteers. Blood from controls and patients was collected and stored as described (5 ). The LR of Jacobsen et al. (2 ) is the ratio of 2 clotting times for 1:1 mixes of patient’s plasma and PNP, one using a dilute phospholipid (screen) assay and the other using a phospholipid-rich reagent (confirm) assay. This ratio is normal- ized by dividing by the corresponding ratio for PNP performed in the same assay. The percentage correction based on the study of Tripodi et al. (3 ) is the difference between the test plasma screen normalized by PNP screen and test plasma confirm also normalized by PNP confirm. This difference is expressed as a percentage of the normalized screen clotting time. Clotting times for the same batch of PNP provided data for betweenassay imprecision for over 20 assays (screen, 0.91%; confirm, 0.88%). The between-assay imprecision over 10 assays for LA-positive patient plasma was 1.4% for screen and 1.3% for confirm. The within-assay imprecision for PNP was 0.34% for screen and 0.27% for confirm (n ⫽ 12), and for the LA-positive patient plasma was 0.61% for screen and 0.59% for confirm. For the dRVVT-based assays we used the La Screen and La Confirm reagents from Life Therapeutics. All tests were performed on an STA-R coagulation analyzer from Diagnostica Stago. We used the 2 test to compare the LA positive pick-up rate in the LR and percentage correction assays. We constructed 2 ⫻ 2 tables to compare results derived from the LR and from the percentage correction. Both LR and percentage correction for 70 individual normal individuals were normally distributed. The cutoff values (2 SD above the mean) for 70 normal individuals were LR ⫽ 1.08 and percentage correction ⫽ 13.5%. For all patients, including the subset on OAC, the overall agreement of the 2 methods (LR and percentage correction) was 462/491 ⫽ 94%. The increased positive test rate for percentage correction (96/491 ⫽ 19.5%) compared with the LR (73/491 ⫽ 14.9%) was statistically significant at P ⫽ 0.05 (Table 1). We subdivided the patient population into those on OAC (n ⫽ 85) and those not on OAC (n ⫽ 406). For patients on OAC, the concordance between the 2 methods was 74/85 ⫽ 87%. The increased positive test rate for percentage correction (23/85 ⫽ 27%) and LR (14/85 ⫽ 16.9%) did not differ significantly. Samples from 26 patients (16 women, ages 19 –76 years, median age 47 years) were LA positive by percentage correction and LA negative by LR (Table 1). The incidence of thrombotic disease (17 venous thromboembolic and 2 arterial thromboembolic) was high (73%) in this group. Six of these patients, all of whom were diagnosed with venous thromboembolic disease, were clearly positive with a percentage correction ⬎3 SD (⬎18.1%) above the mean. It has been reported (6, 7 ) that 1:1 mixes of test plasma and PNP may dilute a weak, yet potentially pathogenic LA, yielding a false-negative result. The high incidence of thrombotic disease in the 26 patients (9 of whom were on OAC) poses the question of whether LA activity was diluted by the 1:1 mix in these patients. The increased sensitivity of the percentage correction to the presence of a potential LA compared with the LR may well be of clinical value, warranting further studies to clearly characterize the presence of an antiphospholipid antibody in these patients. Table 1. Results of all 491 patients comparing the 2 methods of data analysis, dRVVT and percentage correction. Negative test, ⬍1.07 Positive test, ⬎1.07 Total Negative Test (<13.53) Positive Test (>13.53) Total 392 3 395 26 70 96 418 73 491 A direct comparison of the dRVVT LR and percentage correction shows an agreement of 462/491 (94.1%). Of the discrepant results (n ⫽ 29), 26 patients, 19 with clearly established thrombotic disease, were positive for LA by the percentage correction method only, and the remaining 3 patients with no evidence of thrombotic disease were positive by the LR method only. The percentage correction is significantly more sensitive to the presence of LA in the overall patient population (P ⫽ 0.05). References 1. Brandt JT, Triplett DA, Alving B, Scharrer I. Criteria for the diagnosis of lupus anticoagulants: an update. On behalf of the Subcommittee on Lupus Anticoagulant/Antiphospholipid Antibody of the Scientific and Standardisation Committee of the ISTH. Thromb Haemost 1995;74: 1185–90. 2. Jacobsen EM, Barna-Cler L, Taylor JM, Triplett DA, Wisløff F. The lupus ratio test. An interlaboratory study on the detection of lupus anticoagulants by an APTT-based, integrated and semi- Clinical Chemistry 53, No. 1, 2007 3. 4. 5. 6. 7. quantitative test. Thromb Haemost 2000;83: 704 – 8. Tripodi A, Chantarangkul V, Clerici M, Mannucci PM. Laboratory diagnosis of Lupus Anticoagulants for patients on oral anticoagulant treatment. Thromb Haemost 2002;88:583– 6. Jennings I, Greaves M, Mackie IJ, Kitchen S, Woods TAL, Preston FE. Lupus anticoagulant testing: improvements in performance in a UK NEQAS proficiency testing exercise after dissemination of national guidelines on laboratory methods. Br J Haematol 2002;119:364 –9. Aboud MR, Ma DDF. A comparison between two activated protein C resistance methods as routine diagnostic tests for factor V Leiden mutation. Br J Haematol 1997;97:798 – 801. Thom J, Ivey L, Eikelboom J. Normal plasma mixing studies in the laboratory diagnosis of lupus anticoagulant. J Thromb Haemost 2003; 1:2689 –91. Jennings I, Woods TAL, Kitchen S, Preston E, Hughes GRV. Potentially clinically important inaccuracies in testing for the lupus anticoagulant: an analysis of the results from the surveys of the UK National External Quality Assurance Scheme (NEQAS) for blood coagulation. Thromb Haemost 1997;77:934 –7. Margaret Aboud1,2,3* Clair Roddie1,2 Christopher Ward1,2,3 Luke Coyle1,2,3 1 2 Department of Haematology and Transfusion Medicine, Royal North Shore Hospital Sydney, 2065, Australi Northern Blood Research Centre University of Sydney RNSH campus Sydney, Australia 3 Pacific Laboratory Medicine Services Royal North Shore Hospital Sydney, Australia * Address correspondence to this author at: PaLMS Haematology, Royal North Shore Hospital, St. Leonards, NSW, 2065, Australia. Fax 612-9926-6066; e-mail [email protected]. au. DOI: 10.1373/clinchem.2006.078683 Upconversion Fluorescence Enables Homogeneous Immunoassay in Whole Blood To the Editor: Many medical conditions are related to alterations in protein or hormone con- 145 Fig. 1. Principle (A) and standard curves (B) of the upconversion FRET-based competitive homogeneous E2 immunoassay. (A), the anti-E2-Fab-coated FCD-546 –1 UCP (donor) can bind E2 (analyte) and E2-AF680 conjugate (acceptor). Phosphor emission at 650 – 670 nm excites bound acceptors by FRET under the infrared excitation at 980 nm and sensitized acceptor emission can be measured at 740 nm. (B), standard curves in buffer (F, wide solid line), whole blood (f, dashed line) and plasma (Œ, narrow solid line) were obtained after 45 min of incubation using 15 mg/L UCP donor and 4 nmol/L acceptor conjugate. IC50 values (concentration that inhibited 50% of the maximum signal) of the assay were 0.72 nmol/L, 1.25 nmol/L, and 1.35 nmol/L, respectively. Standard curves were fitted to the data based on means of 4 replicates using the program Origin 6.0 (OriginLab Corporation) and the logistic function y ⫽ (A1 ⫺ A2)/[1 ⫹ (x/x0)p)] ⫹ A2, where A1 and A2 correspond to maximum and minimum values of the response, respectively, p is the slope and x0 is the IC50 value. The error bars indicate the SD of the value. cts, counts. centrations in blood. These changes are commonly detected with heterogeneous immunoassays that require a separation step before signal measurement. A simple homogeneous assay performable directly in whole blood would be useful in clinical diagnostics, but the performance of homogeneous fluorescence-based immunoassays has been severely limited by autofluorescence and strong absorption of ultraviolet and visible light in whole blood. These problems might be avoided by the use of near-infrared excited upconversion fluorescence. We recently described a novel homogeneous assay method based on upconversion fluorescence resonance energy transfer (FRET). In this method an upconverting phosphor (UCP) is used as a donor and a fluorescent protein or a small-molecular fluorescent dye is used as an acceptor (1, 2 ). We report here the use of a competitive homogeneous immunoassay for 17-estradiol (E2) in whole blood as a model to demonstrate the application of upconversion FRET using a near-infrared fluorescent acceptor dye (Fig. 1A; and see Fig. 1 in the Data Supplement that accompanies the online version of this Letter at http://www. clinchem.org/content/vol53/issue1). A UCP (Luminophor SPF) with a structural composition of La2O2S: Yb3⫹,Er3⫹ was coated as described earlier (1–3 ) with an E2-specific recombinant antibody Fab fragment with a known cross-reactivity profile (4, 5 ). A Fab fragment was used to provide more favorable donor–acceptor distances for resonance energy transfer (5 ). The average size of the UCP donor particle was ⬃390 nm, determined with a Coulter N4 Plus submicron particle size analyzer (Beckman Coulter). A succinimidyl ester of a small-molecular acceptor dye, Alexa Fluor 680 (AF680) (Molecular Probes, Invitrogen Corp.), was coupled with a 2.5-fold molar excess of the amino-derivative of E2 (6-oxoestradiol 6-[O-(6-aminohexyl)oxime]) as described (2 ). Whole blood was collected in lithium heparin anticoagulated tubes (Venoject; Terumo Europe) from male volunteers at the Department of Biotechnology, University of Turku, and used in the assay with their informed consent. The E2 immunoassay was carried out in buffer, plasma, and blood according to an assay principle previously described (2 ). Blood and plasma samples were diluted in buffer to comprise 20% of the total 45-L reaction volume. The reactions were


© Copyright 2026