
Document 279136
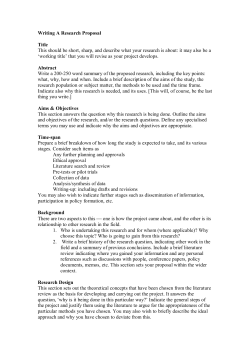
10.1177/0163278703255242 Evaluation & the Health Professions / September 2003 Kelley et al. / METHODS OF SAMPLE-SIZE PLANNING ARTICLE Sample-size planning historically has been approached from a power analytic perspective in order to have some reasonable probability of correctly rejecting the null hypothesis. Another approach that is not as wellknown is one that emphasizes accuracy in parameter estimation (AIPE). From the AIPE perspective, sample size is chosen such that the expected width of a confidence interval will be sufficiently narrow. The rationales of both approaches are delineated and two procedures are given for estimating the sample size from the AIPE perspective for a twogroup mean comparison. One method yields the required sample size, such that the expected width of the computed confidence interval will be the value specified. A modification allows for a defined degree of probabilistic assurance that the width of the computed confidence interval will be no larger than specified. The authors emphasize that the correct conceptualization of sample-size planning depends on the research questions and particular goals of the study. Keywords: experimental design; sample-size planning; statistical power; statistical precision; accuracy in parameter estimation OBTAINING POWER OR OBTAINING PRECISION Delineating Methods of Sample-Size Planning KEN KELLEY SCOTT E. MAXWELL JOSEPH R. RAUSCH University of Notre Dame AUTHORS’ NOTE: The authors would like to thank Stacey S. Poponak, University of Notre Dame, for her helpful comments to previous versions of this article. Correspondence concerning this article can be addressed to any of the authors, Department of Psychology, University of Notre Dame, Notre Dame, IN 46556. E-mail may be sent to KKelley@ ND.edu, [email protected], or JRausch@ ND.edu. EVALUATION & THE HEALTH PROFESSIONS, Vol. 26 No. 3, September 2003 258-287 DOI: 10.1177/0163278703255242 © 2003 Sage Publications 258 Kelley et al. / METHODS OF SAMPLE-SIZE PLANNING 259 uppose a mindful researcher performs a power analysis prior to data collection in order to have an 80% chance of rejecting the null hypothesis of no treatment effect in a two-group study. The researcher assumes there is a “medium” effect (Cohen, 1988) in the population, δ = .5, for the standardized difference between group means. A power analysis reveals a necessary sample size of 64 participants per group. The researcher dutifully conducts the study with this suggested sample size. At the completion of the study, the researcher discovered that the data allowed for the rejection of the null hypothesis, with a p value of .007. Instead of stopping at this point, the researcher followed recent suggestions (Wilkinson & American Psychological Association Task Force on Statistical Inference, 1999) to consider effect size measures. In particular, Cohen’s d in the sample was .4838, showing support for the researcher’s expectations that the treatment effect is indeed medium in the population. However, suppose this researcher goes at least one step further in following recent recommendations by forming a confidence interval around δ (Cumming & Finch, 2001; Steiger & Fouladi, 1997; Thompson, 2002). Given the sample size of 128, a sample d of .4838 yields a 95% confidence interval ranging from .1313 to .8345. Notice that this interval does not contain 0 and thus is consistent with the hypothesis test. However, the interval is wide relative to the effect size and does not offer strong support that the population effect size is necessarily medium. Instead, the width of the interval suggests that the true population effect size could plausibly be smaller than “small” (δ = .2) or larger than “large” (δ = .8). Even though sample size was adequate in this study to detect a nonzero δ, it was not sufficiently large to bound precisely the population parameter. The appropriate method for sample-size planning, and thus the appropriate sample size itself, depends on the desired goals of an investigation. Methodologists have long emphasized sample-size planning for empirical research to obtain useful information from experimental and observational studies. Throughout this time, the majority of emphasis has been placed on sample-size planning from a purely “power analytic” perspective. Although the power analytic framework has dominated the way researchers conceptualize samplesize planning, it is neither the only approach nor always the best approach that can be taken to estimate an appropriate number of participants to include in a study. Although statistical power is undeniably important for a given domain of research, simply obtaining S 260 Evaluation & the Health Professions / September 2003 adequate power may not always provide meaningful answers to certain research questions. Rather than or in addition to obtaining statistical significance, another goal that may be as important and potentially more meaningful is obtaining parameter estimates that are accurate. An alternative approach to the power analytic framework of sample-size planning is one that emphasizes accuracy in parameter estimation (AIPE) (Kelley & Maxwell, in press). The goal of AIPE is to obtain parameter estimates that accurately correspond to the population value they represent. Conceptually, accuracy can be defined as the extent that an estimate conforms to the true population value, that is, the correctness of the estimate. Precision, however, is the reproducibility of the estimate and is defined as the variability of the estimate. Bias is also an important concept in the context of accuracy and precision. Holding precision constant, estimates that systematically err generally lead to larger discrepancies between the estimates and the population value than do unbiased estimates. The formal definition of accuracy is given by the square root of the mean square error and can be expressed as follows: ( ) RMSE = E θ$ − θ 2 ( [ ]) +(E[θ$ − θ]) , = E θ$ − Ε θ$ 2 2 (1) where θ$ is the estimate of the true population value, θ (Hellmann & Fowler, 1999; Rozeboom, 1966, p. 500). Notice that the square root of the mean square error can be decomposed into two components: the variance, which is the measure of precision, and the square of the bias. Thus, when the bias is zero (E[θ$ – θ] = 0), precision and accuracy are equivalent and can be used interchangeably. In practice, the precision of parameter estimates is often gauged in terms of the width of the corresponding confidence interval, which can be expressed as a proportion of the standard deviation or in the metric of the dependent variable. All other things being equal, the narrower the width of a confidence interval the less uncertainty exists about the plausible values of the population parameter. In general, the narrower the confidence interval the more likely the obtained point estimate will accurately represent the true population value. Given that the two main sources of uncertainty scientists should seek to banish are randomness and imprecision (Casti, 1990, pp. 23-24), the AIPE approach to sample-size estimation may well facilitate the Kelley et al. / METHODS OF SAMPLE-SIZE PLANNING 261 accumulation of scientific knowledge better than a dichotomous reject–fail-to-reject decision. Planning sample size can be accomplished through (at least) two conceptually different methods, one designed to obtain statistical power and the other designed to obtain statistical precision. Depending on the particular theoretical question of interest and the desired goals of a study, sample-size planning should be approached from the power analytic approach, the AIPE approach, or a combination of the two. It is important to realize that planning sample size from one of the approaches is a fundamentally different task than planning from the other. The distinction between the two approaches is more than conceptual, as the differences in estimated sample sizes can be substantial depending on the desired level of power and the desired width of the confidence interval. It is unfortunate that some researchers have seemingly ignored the planning of appropriate sample size for empirical investigations. Ignoring sample-size planning altogether can have serious consequences for a given domain of research. In fact, when a body of research is based on studies where statistical power is low, the probability of rejecting a true null hypothesis (Type I error) could be only slightly smaller than the probability of correctly rejecting the null hypothesis (power). Thus, a substantial proportion of significant findings in the published literature may be Type I errors (Bakan, 1966; Rossi, 1990). When inferential statistics are used to answer research questions, researchers are encouraged to plan not only the substantive and theoretical aspects of the experimental design but also to plan carefully the appropriate statistical analyses. When planning the appropriate statistical analyses, it is pertinent to include sample-size planning in order to likely accomplish the goals of the study from the power analytic approach, the AIPE approach, or a combination of the two. Our purpose in this article is not to denigrate either of the two approaches for sample-size planning, but rather it is to illustrate the benefits that both power analysis and AIPE can offer in certain situations depending on the research question(s) and to show some differences that exist between the two methods. It is clear that both of the approaches are important, and in many circumstances they can be used in conjunction with one another to help produce quality studies. We will use an illustrative example to better show the differences 262 Evaluation & the Health Professions / September 2003 between the power analytic and AIPE approaches to sample-size planning. Although the appropriate method for sample-size planning clearly depends on the particular goals and questions a researcher has for a given study, it is likely that the most scientifically desirable scenario is to obtain sufficient statistical power, such that a true effect can be differentiated from a null value, and to obtain precise estimates for parameters that are of theoretical and/or substantive interest. When domains of research consistently produce low-powered studies that are accompanied by imprecise estimates, a question should be raised about the scientific merit of the theoretical and substantive conclusions based on statistical methods from such an area of inquiry. RATIONALE OF POWER ANALYSIS AND NULL HYPOTHESIS SIGNIFICANCE TESTING Statistical power is defined as the probability of correctly rejecting the null hypothesis and is the complement to the probability of a Type II error.1 Another way of conceptualizing statistical power is the probability that the 100(1 – α) percent confidence interval correctly excludes the value of the null hypothesis, where α is the probability of a Type I error. Statistical power is a function of four independent factors: (a) Type I error rate, (b) the population effect size, (c) the population model error variance, and (d) sample size.2 Given a desired value of statistical power, the appropriate sample size can be determined by specifying α, the population effect size, and the population model error variance. A large body of literature exists on power analytic techniques, which we do not attempt to duplicate. Rather, we provide a conceptual overview of power analysis, and we will later refer the reader elsewhere for methods of sample-size selection from the power analytic perspective. Although it may be the case that null hypotheses of exact point estimates are rarely exactly true in nature (Cohen, 1990, 1994; Meehl, 1978; cf. Hagen, 1997), the directionality of the effect in question is often of utmost importance. Given that an effect exists, regardless of its magnitude, directionality pertains to whether the true effect in question is positive or negative.3 For example, suppose that a two-group study is to be conducted and interest lies in determining whether a mean difference exists. Although learning that an effect is statistically significant may provide valuable insight into the Kelley et al. / METHODS OF SAMPLE-SIZE PLANNING 263 particular research question, learning its direction (i.e., which mean is larger) will likely provide even more meaningful information about the underlying process(es) of the system. Directionality, however, generally makes sense for single degree of freedom effects only. Thus, not every statistically significant effect will have a meaningful directionality associated with it. For example, suppose a three-group study was conducted, where interest was in determining whether any group differences existed. Further suppose that an analysis of variance (ANOVA) yielded a significant F statistic, implying that there are indeed differences among the population group means. However, because there are multiple degrees of freedom associated with the effect, attempting to interpret directionality is rather difficult, if not impossible.4 Because confidence intervals generally make sense only when directionality makes sense, a direct comparison of power and precision can generally be made for statistical tests only when directionality is meaningful. Some effect size proponents suggest that the reporting of confidence intervals, effect sizes, and confidence intervals around effect sizes is the “future” of quantitative research (Thompson, 2002). On the basis of the effect size alone, effects that truly exist but do not seem substantial may be considered unnecessarily trivial.5 Rather than criticizing significance testing in general as some have done or taking an extreme view stating that “we must abandon the statistical significance test” (Schmidt, 1996, p. 116), it is important to realize that different questions are appropriately answered by different methods. For example, it may make little sense to interpret measures of effect size or confidence limits for purely theoretical questions, as these questions are frequently answered appropriately by null hypothesis significance tests. This is often the case when interest lies only in evaluating whether any group differences exist or when the direction of the effect is of sole interest to the researcher. Although significance testing alone may be appropriate in certain situations, in many situations (especially those where the research addresses practical or applied questions), an estimate of the parameter of interest is desired as well as confidence bounds around the population value. Although effect sizes, confidence intervals, and confidence intervals around effect sizes can often provide information beyond that of the corresponding significance test, for some questions confidence intervals and effect sizes either do not exist or provide nothing more 264 Evaluation & the Health Professions / September 2003 than the corresponding significance test. For example, suppose a researcher performs an ANOVA and tests all the pairwise group mean comparisons. Although it may be the case that pairwise effect sizes provide meaningful information, the overall ANOVA effect size is generally less directly interpretable. When the ANOVA effect size is not 0, it illustrates that there are some mean differences between groups within the sample. However, a statistical significance test is needed to infer whether this value is likely to have occurred by chance alone. The effect size for the ANOVA omnibus null hypothesis test offers little intuitive value in the absence of a significance test, as it is not discernable where group differences persist.6 In the context of multivariate statistics, there exist few measures of effect that provide information above that of the significance test(s). Wainer (1999) illustrates other situations where significance testing provides valuable insight into a variety of problems. It is important to realize that null hypothesis significance testing has its place in scientific inquiry and such inferential techniques can be valuable for the information they provide. Whenever null hypothesis significance testing is determined to be appropriate and valuable, it is imperative that statistical power be a top priority. Performing a power analysis is thus strongly recommended in these situations, and the power analysis should ideally consist of determining sample size for a range of probable effect sizes in a type of sensitivity analysis.7 That is, researchers should perform power analyses for a range of effect sizes in order to understand the nonlinear relationship that exists between the effect size and required sample size. This is useful because the effect size itself is generally unknown and sometimes difficult to estimate. Because of this difficulty in estimation, the effect size has been referred to as the “problematic parameter” (Lipsey, 1990, chap. 3). Nevertheless, the difficulty in hypothesizing the population effect size should not prevent researchers from performing a power analysis, if in fact significant results are desired. When treatment effects exist in the population, it is best to find those differences and document the direction (if it makes sense to do so) of the effect. By carefully planning the research design, the odds can be in favor of finding true treatment effects. Although null hypothesis significance testing has long been criticized, “There is no sign that 75 years of criticism of significance testing has had a significant impact on its prevalence and use” (Murphy, Kelley et al. / METHODS OF SAMPLE-SIZE PLANNING 265 2002, p. 120). Given that researchers continue to rely on inferential statistics with the desire to achieve statistically significant parameter estimates, it is clear that researchers who currently ignore power should begin to consider seriously the issue of statistical power and the effect that Type II errors have on a given domain of research. If conclusions are to be drawn from the results of significance tests, statistical power should be a major concern. When a particular study has implications for health, education, or social and public policies, knowingly ignoring issues of statistical power can be considered unprofessional and can potentially be quite costly. When Type II errors persist in a given domain of research, confusion often follows because of the inconsistencies in the literature. Furthermore, the cumulative knowledge in a particular area can suffer dramatically if low-powered studies are continually conducted. When low-powered studies dominate the scientific landscape of a particular area, the results of similar research will likely be different from study to study and scientific growth can falter because of these inconsistencies (Hunter & Schmidt, 1990, chap. 1; Kraemer, Gardner, Brooks, & Yesavage, 1998; Rosenthal, 1993; Schmidt, 1996). RATIONALE OF THE AIPE APPROACH AND THE IMPORTANCE OF PRECISE ESTIMATES Although power analysis has dominated the realm of sample-size planning, another alternative that may be better suited to the needs of some researchers is AIPE. The goal of AIPE is not necessarily to obtain statistically significant parameter estimates; it is to obtain estimates that accurately estimate the corresponding population parameter. In the AIPE framework, accuracy is relative and refers to the correspondence between the population value and its estimate. The precision and thus accuracy of an estimate in this context refers to the width of the confidence interval formed around the parameter, and selecting a sample size such that this interval is narrow leads to estimates that are more accurate. Probabilistically, by planning sample size such that the computed confidence interval width is narrow, parameter estimates will better correspond to their population value, as less uncertainty will exist for the obtained point estimates. Oftentimes, obtaining parameter estimates that are accurate leads to a better 266 Evaluation & the Health Professions / September 2003 understanding of the phenomenon under study than does the dichotomous reject–fail-to-reject decision provided by null hypothesis significance testing. In the realm of scientific inquiry, imprecision is one characteristic of a parameter estimate (or theory) that should be eliminated as much as possible. Because “prediction and explanation are the twin pillars upon which the goals of the scientific enterprise rest” (Casti, 1990, p. 28), achieving accurate parameter estimates will not only facilitate the future prediction of the parameter of interest but also may help when forming explanations about why and how independent variable(s) and dependent variable(s) are (or are not) related to one another. When accurate predictions and viable explanations are available for some phenomenon, the verisimilitude of knowledge can be greatly enhanced in a particular area, which can have far-reaching consequences, as stronger more precise theories can be developed and subsequently tested. Even when sample size is large enough to provide adequate power, a confidence interval based on this sample size may be too wide to obtain useful information about the parameter of interest, as a wide confidence interval suggests that the obtained parameter estimate may not closely approximate the population value. Cohen has stated that the reason confidence intervals have seldom been reported in behavioral research is because the widths of the confidence intervals are often “embarrassingly large” (Cohen, 1994, p. 1002). Methodologists generally agree with one another in strongly encouraging the use of confidence intervals. In fact, the most recent edition of the American Psychological Association’s (2001) publication manual states that confidence intervals are “in general, the best reporting strategy. The use of confidence intervals is therefore strongly recommended” (p. 22). As Thompson (1999, p. 162) has pointed out, however, “encouragement” in the absence of strict standards may send a mixed message regarding the importance of (in this case) confidence intervals, whereas other, perhaps less pressing matters (page numbering, appropriate abbreviations, the font and typeface of headings, etc.) are literally required. An argument can be set forth that obtaining an accurate parameter estimate facilitates a better understanding of the effect in question and is more important for discovery in a productive science than is simply rejecting or failing to reject some null hypothesis. Oftentimes a rejection of a null hypothesis provides an area of research with little new Kelley et al. / METHODS OF SAMPLE-SIZE PLANNING 267 knowledge of the system under study. Sufficiently narrow confidence intervals, however, can help lead to a knowledge base that is much more valuable to other researchers, and equally to oneself, when the desire is to understand the process(es) of the system under study. Given the fact that confidence intervals convey such useful information for scientific inquiry, coupled with the fact that a narrow confidence interval illustrates a parameter that is probabilistically estimated accurately, sample-size planning from the AIPE perspective should be seriously considered by researchers in the design phase of studies. Rather than solving for sample size by specifying a desired power, within the AIPE framework sample size is determined by specifying the desired width of the confidence interval. For example, suppose there is a desire to compare the means between two groups on some dependent variable. In the introductory example, rather than simply performing a t test with the goal of claiming that the mean difference significantly differs from 0, the ideal scenario following the AIPE approach would be to obtain a narrow confidence interval for the difference in means where the width of the confidence interval was specified in advance.8 The expected precision of the estimate (width of the confidence interval) is a value specified by the researcher in the design phase. When scientists can accurately estimate the population parameter of interest and accompany the point estimate with a narrow confidence interval, more information about the parameter and the underlying process(es) can be learned. Recall that the AIPE approach need not concern itself with whether the confidence interval does or does not contain the null value. However, we will momentarily revisit the possibility of combining AIPE and power analysis in what may be the best overall research strategy for many situations. In light of the recent emphasis on confidence intervals and effect size estimation in the methodological literature (Algina & Olejnik, 2000; Steiger & Fouladi, 1997; Thompson, 2002; Wilkinson & American Psychological Association Task Force on Statistical Inference, 1999), it is important for researchers to understand that the AIPE approach to sample-size planning allows for the expected widths of confidence intervals to be set a priori. Not only do confidence intervals provide the same information as null hypothesis significance tests, they also illustrate the (im)precision of the estimated parameter. As Gardner and Altman (1986, p. 746) state, “the purpose of most research investigations in medicine [and indeed most research in 268 Evaluation & the Health Professions / September 2003 general] is to determine the magnitude of some factor(s) of interest.” Anytime a meaningful parameter estimate is reported, it ideally should be accompanied with a confidence interval, and preferably one that is not “embarrassingly large.” Because confidence intervals can oftentimes be more useful than null hypothesis significance testing, coupled with the fact that confidence intervals generally yield information above and beyond that of significance tests, it seems reasonable that researchers would plan studies such that the obtained confidence intervals would be sufficiently narrow. However, sample-size planning for purposes of accuracy often has not been considered. This is in no small part due to methodologists who have long hailed power analyses rather than the obtainment of estimates that closely correspond to their population value. However, the tide may be turning with regard to sample-size planning from a solely power analytic perspective. With a great deal of emphasis currently being placed on confidence intervals, the AIPE perspective should become more salient as a methodological technique. ILLUSTRATIVE EXAMPLE To demonstrate the similarities and differences between the power analytic and AIPE approaches to sample-size planning, an illustrative example is provided. Suppose a researcher is interested in the effects of a new medication on weight loss. The researcher randomly assigns overweight participants to either a treatment group or a control group. Participants in the treatment group receive the medication of interest and follow an exercise routine, while the control group participants receive a placebo in place of the active medication and follow the same exercise routine. From previous investigations, the researcher estimates the population within-group standard deviation (assumed to be equal for both groups) to be 20 pounds. The Type I error rate will be .05 throughout this section, with a corresponding confidence level of 95% for interval estimation. SAMPLE SIZE FOR POWER Suppose that the researcher is interested in detecting a statistically significant difference in the mean amount of weight lost during the Kelley et al. / METHODS OF SAMPLE-SIZE PLANNING 269 experiment but is unsure of the number of participants that will be available or necessary for a specified level of statistical power. Rather than doing a traditional power analysis by specifying the effect size and solving for sample size, the researcher first examines the relationship between sample size and power given three different effect sizes. The population effect sizes chosen for the group mean difference (∆ = 16, 10, and 4 pounds) correspond to Cohen’s definition of a large (δ = .8), medium (δ = .5), and small (δ = .2) standardized effect sizes, respectively. Figure 1 illustrates the power of the statistical test given the total sample size and small, medium, and large standardized effect sizes, assuming equal sample size per group. Notice the nonlinearity in Figure 1 between sample size and the power of the statistical test. As can be seen, sometimes a minimal increase in sample size can have a dramatic effect on power, while other times a substantial increase in sample size yields only a negligible increase in statistical power. Suppose that the effect size considered to be minimally important for the medication to be practically beneficial is determined to be 10 pounds. Thus, the power analysis will proceed using an estimated effect size of 10 pounds. The researcher performs sample-size planning for statistical power .5, .8, and .95 in a sensitivity analysis (conceptualization one from note 7). For the hypothesized minimally important effect size of 10 pounds, the total sample sizes required (which are implicit in the middle curve of Figure 1) for statistical power of .5, .8, and .95 are 64, 128, and 210, respectively. Thus, assuming that the parameter values are correct, if the researcher used 64 total participants (32 per group), he or she would have the same probability of rejecting the null hypothesis as heads on a coin flip.9 Statistical power of .5 should usually be considered inappropriate, as one should generally not leave obtaining correct results to such a substantial amount of chance. Furthermore, notice that a total sample size of 210 is necessary if one is interested in giving the probability of a Type II error the same weight as a Type I error. This oftentimes seems reasonable, because Type II errors can often be as serious or even more detrimental than a Type I error.10 Notice that a total of 128 participants are necessary for a level of power of .8, which is generally regarded as a lower bound on acceptable statistical power. 270 Evaluation & the Health Professions / September 2003 Figure 1: Power as a Function of Total Sample Size for the Population Group Mean Difference (∆) on Weight Loss for Effect Sizes of 16, 10, and 4 (population standard deviation equals 20). NOTE: These ∆ values correspond with Cohen’s definition of large (δ = .8), medium (δ = .5), and small (δ = .2) standardized mean differences respectively. SAMPLE SIZE FOR PRECISION Another possible scenario is that the researcher conducting the hypothetical weight loss study is interested in a precise estimate of the true treatment effect. Thus, the researcher decides to plan sample size within the AIPE framework in order to bound precisely the population difference between the means for the treatment and control groups, such that the obtained point estimate accurately represents the population value. In the case of AIPE, the required values are the (a) confidence level (e.g., 95% or 99%), (b) the desired confidence interval width or half width, and (c) the population model error variance. It is important to realize the only value required that is not at the discretion of the researcher is the population model error variance. Recall that under the power analytic scenario, the researcher is not only required to estimate the population model error variance but also the population effect size, both of which are generally unknown. In this regard, AIPE requires less prior knowledge on the part of the researcher than does the power analytic approach. Kelley et al. / METHODS OF SAMPLE-SIZE PLANNING 271 Suppose the researcher is interested in the relationship between the confidence interval half width and the required sample size. Figure 2 illustrates the total sample size necessary for precision as a function of the desired half width of the confidence interval. Although at first Figure 2 may look as though it is a traditional power curve, careful examination shows that it is (what we call) a precision curve, where sample size is not a function of the effect size, as in a traditional power curve, but a function of the desired confidence interval half width. Implicit in Figure 2 is the fact that halving the width of a confidence interval essentially requires a fourfold increase in sample size. For example, had the half width been specified as 10, required sample size would be 100, and it would be 388 if the specified half width were halved to 5. As was true with Figure 1 depending on the particular location on the curve, a minimal change in an input value can have a dramatic effect on required sample size or a substantial change in the input parameter can have a small effect on sample size. COMPARING SAMPLE SIZE FROM THE POWER ANALYTIC AND AIPE APPROACHES Rather than approaching sample-size planning from either a strictly power analytic approach or a strictly AIPE approach, another plausible scenario, and the strategy we generally recommend, is that sample size be planned from a combination of the two approaches. Combining the power analytic and the AIPE approach can allow one to have reasonable precision when power is the primary concern, as well as to have reasonable power when precision is the primary concern. Suppose that the researcher in the hypothetical weight loss study wanted to compare the required sample sizes for a variety of levels of statistical power and statistical precision. Given different estimates of the input parameters, Figure 3 shows the relationship of necessary sample size for power of .5, .8, and .95, to the necessary sample size for confidence interval half widths of 5, 7.5, and 10. Figure 3 shows that necessary sample size does not depend on the anticipated (or minimally important) group mean difference in the AIPE approach. This is contrary to the power analytic approach, where there is a nonlinear relationship between the group mean difference and necessary sample size. When striving to maintain both a specified level of power as well as a specified precision, the sample 272 Evaluation & the Health Professions / September 2003 600 550 Total Sample Size Required 500 450 400 350 300 250 200 150 100 50 0 0 2 4 6 8 10 12 14 16 18 20 Interval Half-Width Figure 2: Precision Curve Where the Total Sample Size Is a Function of the Expected HalfWidth of the Confidence Interval (population standard deviation equals 20). size selected should be the one that is derived from the approach that yields the greatest estimate of necessary sample size. Figure 3 demonstrates that planning sample size for power is indeed a fundamentally different task than planning sample size for precise estimates, and it also shows that the approach that necessitates the larger sample size depends on the particular situation. PLANNING SAMPLE SIZE FOR CONFIDENCE INTERVALS FROM THE AIPE PERSPECTIVE IN TWO-GROUP SITUATIONS Previously, we illustrated the relationship between the interval half width and sample size in Figure 2 and a comparison between sample size necessary for the power analytic and AIPE approaches in Figure 3. We did not show how to derive such sample-size estimates, as the discussion was conceptual at that point. For the power analytic approach to sample-size planning, Cohen (1988, chap. 3) gives extensive tables for the necessary sample size to achieve desired power in a two group situation. Hahn and Meeker (1991) show the necessary steps for calculating sample size for a desired half width in a single- Kelley et al. / METHODS OF SAMPLE-SIZE PLANNING 600 273 Power = .5 Power = .8 Power = .95 550 Total Sample Size Required 500 450 400 350 300 250 Half Width = 5 200 150 Half Width = 7.5 100 Half Width = 10 50 0 0 2 4 6 8 10 12 14 16 18 20 Population Mean Difference on Weight Loss Figure 3: Total Sample Size Necessary for Selected Values of Power and Precision as a Function of the Population Group Mean Difference (population standard deviation equals 20). group design; we generalize their results for the AIPE approach in the context of a two-group mean comparison. In an attempt at a precision analysis, Cobb (1984) showed a method for comparisons and contrasts within an ANOVA context, where a simple but approximate method was used for sample-size planning for desired precision of a 95% confidence interval. The method given below, like the Hahn and Meeker approach, is a general and exact procedure. The following subsection describes the computations necessary for estimating sample size from the AIPE perspective when a specified width around the observed effect size is desired and provides an illustration of its usage. COMPUTATIONS AND PROCEDURES The 100(1 – α) percent confidence interval for the difference between two independent group means can be written as follows: Conf . X 1 − X 2 ± t (1 − α ( ) 2 ; N −2 ) s n1 + n 2 n1 n 2 = 100(1 − α ), (2) 274 Evaluation & the Health Professions / September 2003 where X 1 − X 2 is the observed effect size (the difference between sample means), n1 and n2 are the sample sizes for Groups 1 and 2 respectively, t(1 – α/2; N – 2) is the critical value at the 1 – α/2 quantile of a t distribution with N-2 degrees of freedom (N = n1 + n2), and s is the pooled within-group standard deviation. The quantity added and subtracted to the observed effect size in equation 2 is defined as w. The upper and lower confidence bounds are determined by w, the half width of the confidence interval (2w is the full width of the confidence interval). The degree of precision of the confidence interval, which can be conceptualized as w or 2w, is the value of most interest within the AIPE framework. As will be shown, the value of w (or 2w) can be set a priori by the researcher in accord with the desired precision of the estimated parameter. Assuming equal sample sizes per group (n1 = n2 = n), the half width can be expressed from equation 2 as the following: 2 t (1 − α n w=s 2; 2n − 2) . (3) To estimate the necessary sample size for an expected half width of w, n must be solved for in equation 3 and the pooled sample variance, s2, must be replaced by the population value, σ2, which yields the following formulation: 2 t (1 − α 2 ; 2 n − 2 ) . n = 2σ w 2 (4) Notice that n is necessarily involved on the right side of equation 4 in determining the appropriate critical value, and because no tractable closed form solution exists, solving equation 3 requires an iterative procedure.11 The procedure begins by substituting the critical value from the standard normal distribution for the critical t value in order to obtain a starting value for n. When performing the procedure by hand, n should be rounded up to the next largest integer after each iteration until the difference between n from the ith iteration and the (i + 1)th iteration does not change. That is, when performing the procedure by hand, the procedure converges when the computed group sample size does not change after consecutive iterations. When performing the procedure on a computer, the iterative procedure stops when the Kelley et al. / METHODS OF SAMPLE-SIZE PLANNING 275 difference between estimated sample sizes is less than some arbitrarily small value (we use 1e – 6) set by the researcher. The final sample size is rounded up to the next largest integer. It is important to realize this procedure assumes equal sample size per group and estimates the per group sample size. The total sample size is thus 2n. In any given sample, the obtained s will not equal σ, even if the true value of σ is known. Approximately half of the time the sample s will be larger than σ, and the other half of the time s will be smaller than σ. Because the computation of n is based on σ, whereas the sample w depends on s, the obtained sample w will be larger than the specified w about half of the time and smaller the other half of the time. The expected value, however, of the computed w is the value specified, provided the correct value of σ was used. Therefore, use of equation 4 will ensure that the desired width for the confidence interval will be obtained about 50% of the time. However, a modified per group sample size, nM, can be found such that a researcher can be a desired percent confident that the observed w will be less than or equal to the value specified. The uncertainty specified by the researcher of obtaining an observed w less than or equal to the specified w will be denoted as γ. Thus, 1 – γ is the confidence level of obtaining a w that is less than or equal to the specified value. A modification of equation 4 uses the 1 – γ quantile from a χ2 distribution with 2nM – 2 degrees of freedom (Hays, 1994, pp. 355-358), such that the variance used in equation 4 is the value that is expected to be exceeded only γ percent of the time. Thus, the obtained w in any given sample will be less than or equal to the specified w with 1 – γ percent confidence.12 The modified sample size, nM is given as follows: nM t (1 − α 2 ; 2 n M − 2 ) = 2σ w 2 2 χ (21 − γ ; 2 n − 2 ) M . 2n M − 2 (5) Like equation 4, equation 5 also must be solved iteratively. The computations for equations 4 and 5 can be solved by hand with the tabled values from t and χ2 distributions or by an iterative computer routine. Appendix A shows detailed calculations of solving equations 4 and 5 by hand. Appendix B gives S-Plus and R code for solving equations 4 and 5, the preferred method. 276 Evaluation & the Health Professions / September 2003 THE PERSISTENCE OF SMALL-SAMPLE RESEARCH More than 40 years after the publication of Jacob Cohen’s (1962) survey documenting underpowered studies in psychological research and the publication of his book Statistical Power Analysis for the Behavioral Sciences (1969), the issue of statistical power continues to be largely ignored by many researchers in the behavioral sciences. Although there has been a great deal of improvement in the planning of sample size for studies, work still remains. Generally speaking, the prerequisite for publication consideration in substantive and applied journals is the obtainment of statistical significance. Whether this practice is truly in the best interest for scientific progress and the accumulation of knowledge is an issue in itself, but given that this is the case, it seems such a universal “editorial policy” would force researchers to design studies with adequate power (Maxwell, 2000, p. 452). However, it does not generally seem to do so. Presumably most researchers know and appreciate the benefits power analysis provides. The conundrum that remains is the reason why power analyses are not routinely carried out by applied researchers. Although methodologists have worked hard to promote the widespread use of power analysis, perhaps their good intentions have led to the widespread lack of use. In any given study, there is typically a collection of significance tests that are conducted. Even if power is low throughout the study for any given test, there is often a much higher probability that at least one statistical test is significant, thus yielding a “publishable” study. For example, suppose that a researcher conducts five orthogonal comparisons from a six-group study. Further suppose that the powers of the tests are .5, .4, .3, .2, and .1, for tests one through five, respectively. The probability that at least one of the tests will result in significance is .85.13 Due to publication practices in the behavioral sciences, the researcher conducting this study would have an 85% chance at having a “publishable” study. Even though power for any one of the statistical tests was quite poor, overall there was a high probability of achieving statistical significance for at least one of the tests. Thus, a likely reason why some researchers have continually ignored power analysis in the design phase of studies is that they know they can often get away with it (Murphy, 2002), in the sense that statistical significance is achieved Kelley et al. / METHODS OF SAMPLE-SIZE PLANNING 277 somewhere in the collection of tests, even though for any one of the tests statistical power may be low. The power of statistical tests often becomes a moot point if and when significance is found. Thus, given statistical significance is achieved, statistical power is often irrelevant from the standpoint of the researcher and many editors who essentially require significance before publication. This is generally not a good idea nor is it one that adds lasting contributions to science. If several low-powered studies of the same phenomenon are reported, it is likely that the significant effect(s) will not be consistent from one study to the other and confusion persists for readers (and the researchers themselves) about the “conflicting” results. One alternative when multiple low-powered studies exist is to perform a meta-analysis by combining the results of several studies (Hedges & Olkin, 1985; Hunter & Schmidt, 1990; cf. Kraemer et al., 1998). However, this is not always practical if few or no studies have been conducted on a particular phenomenon. Caution is also warranted when choosing metaanalysis as a research synthesis option, in the sense that if the studies are not truly examining the same phenomenon, the results of the metaanalysis may be misleading. Instead of rejecting or failing to reject the null hypothesis, presumably many researchers would rather obtain accurate estimates of the parameter(s) of interest. Achieving accuracy requires approaching sample size from an AIPE perspective, where the computed confidence intervals have expected widths, optionally with a degree of assurance, set a priori by the researcher. When the goal is to achieve accurate parameter estimates bounded by narrow confidence intervals, it is often more difficult to satisfy the goal of AIPE across a collection of parameter estimates in a study than it is achieving statistical significance somewhere among the parameter estimates. Although researchers have been able to avoid sample-size planning under the power analytic framework because multiple statistical tests are likely to turn up statistical significance somewhere, it is much harder to avoid sample-size planning when the width of confidence intervals is the major concern. In general, without the proper samplesize planning, it is more difficult to obtain a confidence interval with a narrow width than it is to find a p value less than α somewhere across multiple tests. With such an interest (sometimes requirement) in confidence interval reporting, at some point researchers will have to ask themselves if wide confidence intervals are satisfactory to their 278 Evaluation & the Health Professions / September 2003 research. If they are, then perhaps no changes in the design phase of their studies need to occur. If, however, they are not pleased with wide confidence intervals and would like to curtail the likelihood of an “embarrassingly large” interval, they will have to think seriously about planning sample size from the AIPE perspective. If and when there is a mandate to provide narrow confidence intervals, continually avoiding sample-size planning will be more difficult. If editors and the scientific community in general demand that point estimates be accompanied by narrow (relatively speaking) confidence intervals, such that the point estimate is likely a reasonable representation of the population parameter it represents, the design phase of research would likely include sample-size planning. Perhaps if more methodologists begin to emphasize AIPE rather than statistical power alone, researchers would better appreciate the importance of samplesize planning and thus be more willing to plan the appropriate sample size such that embarrassingly large confidence intervals are not often obtained. Because AIPE seems to be a method better suited for learning about the population parameter(s) of interest, choosing sample size with the AIPE approach may well help promote better scientific practice. DISCUSSION The AIPE approach to sample-size planning is not as well developed at this time as the power analytic approach. Some methodological works focusing on precise estimates can be found in Table 1. There is, however, a vast amount of methodological work that has focused on sample-size planning from the power analytic perspective. Booklength treatments of statistical power and related topics covering a wider variety of effects than Table 1 can be found in the following sources: Cohen (1988), Bausell and Li (2002), Kraemer and Thiemann (1987), Murphy and Myors (1998), and Lipsey (1990). A benefit that is not well-known of the AIPE approach to samplesize planning is that it is generally easier than sample-size planning for statistical power. Generally speaking, the only unknown value required to plan sample size from the AIPE perspective is the population model error variance, although the population effect size also is required for the power analytic approach.14 Because the AIPE approach is not Kelley et al. / METHODS OF SAMPLE-SIZE PLANNING 279 TABLE 1 Table of Selected Methodological Works That Propose Procedures for Estimating Sample Size for a Desired Confidence Interval Width Work Algina and Olejnik (2000) Bonett and Wright (2000) Darlington (1990) Hahn and Meeker (1991, chap. 8) Kelley and Maxwell (in press) Kelley, Maxwell, and Rausch (this article) Effect Squared multiple correlation coefficients Pearson, Kendall, and Spearman correlation coefficients Lower bound of the multiple correlation coefficient Mean, variance, binomial proportion, Poisson occurrence rate Regression coefficients Difference between a two-group mean comparison explicitly concerned with the center of the confidence interval, just its width, knowing the effect size is not an issue. Thus, this “problematic parameter” (Lipsey, 1990) can generally be avoided in the AIPE framework. Sample-size planning for empirical research is very important to help ensure that a study is worthwhile and that it will meaningfully contribute to the cumulative knowledge of the scientific enterprise. As has been illustrated, in the realm of sample-size planning there are essentially two paradigms at work, the predominant one that emphasizes statistical power and another that emphasizes the accuracy of parameter estimates. Ideally the two approaches should not be thought of as independent of one another. We believe that in general the ideal research scenario is one in which a researcher carefully plans his or her study, and in this planning stage, a power analysis and AIPE analysis are conducted in accord with the researcher’s questions and goals. If the AIPE approach dictates a larger sample size than the power analytic approach, the sample size for precise estimates should be used. Conversely, if the power analytic approach reveals that the appropriate sample size is larger than that obtained from the AIPE approach, then the estimate from the power analytic approach should be used. Of course, as Figure 3 shows, it may be the case that the two methods require dramatically different sample sizes. In such a case, a researcher must decide which method yields the most appropriate sample size given the goals and resources available. In these situations, by performing sample-size planning from both methods, the researcher will have an a priori idea of what to expect at the completion of the study. In 280 Evaluation & the Health Professions / September 2003 this sense, the obtained level of statistical significance and the likely precision of the estimate should not come as a surprise. APPENDIX A Illustrations of “Hand” Calculations for n and nM Iterative Procedure for n The following calculations illustrate the calculation of n “by hand” using the tabled values of a t distribution. Continuing in the spirit of the Illustrative Example section, we will suppose that a researcher would like to calculate a 95% confidence interval for the difference between two-group means, where σ is presumed to equal 20. The desired half width of the confidence interval is 10. The procedure begins by calculating an initial sample size starting with the critical value from the standard normal distribution. After the initial sample size has been obtained, each successive iteration uses the n from the previous iteration for the critical value of a t distribution. The iterations continue until there are two consecutive iterations that yield the same value of n. Starting Sample Size 2(202)(1.959964/10)2 = 30.73167, rounded = 31 (Uses critical z value.) Iteration 1 2(202)(2.000298/10)2 = 32.00953, rounded = 33 (Uses critical t value based on 2 * 31 – 2 = 60 degrees of freedom.) Iteration 2 2(202)(1.99773/10)2 = 31.92739, rounded = 32 (Uses critical t value based on 2 * 33 – 2 = 64 degrees of freedom.) Iteration 3 2(202)(1.998972/10)2 = 31.9671, rounded = 32 (Uses critical t value based on 2 * 32 – 2 = 62 degrees of freedom.) Kelley et al. / METHODS OF SAMPLE-SIZE PLANNING 281 Thus, the estimated per group sample size such that the expected value of w is 10 (given σ of 20), is 32 (N = 64). Iterative Procedure for nM As with n, the procedure for nM begins with use of the critical value from the standard normal distribution. The only change in planning nM rather than n is that the critical value from a χ2 distribution is used (and divided by its degrees of freedom in order for there to be a .80 probability of obtaining a confidence interval no larger than 10), starting at the second step of the procedure. The following “hand” calculations illustrate an application of equation 5. Starting Sample Size 2(202)(1.959964/10)2 = 30.73167, rounded = 31 (Critical z value.) Iteration 1 2(202)(2.000298/10)2(68.97207)/(62 – 2) = 36.79606, rounded = 37 (Critical values based on 2 * 31 – 2 = 60 degrees of freedom.) Iteration 2 2(202)(1.993464/10)2(81.85659)/(74 – 2) = 36.14329, rounded = 37 (Critical values based on 2 * 37 – 2 = 72 degrees of freedom.) Thus, the estimated per group sample size such that there is there 80% confidence that the obtained w will be less than 10 (given σ of 20), is 37 (N = 74). APPENDIX B Computational Procedure for Finding n and nM Iteratively The following code can be used in the computer programs S-Plus and R. The user must specify the population standard deviation (sigma), the desired confidence interval half width (w), Type I error rate (alpha; 1 – confidence 282 Evaluation & the Health Professions / September 2003 level), and, for nM, the probability of not obtaining a w less than or equal to the specified value (gamma; 1 – degree of assurance) for the particular problem. Specification Values sigma <- 20 # Population standard deviation w <- 10 # Desired half width alpha <- .05 # Type I error rate gamma <- .2 # Degree of uncertainty for modified n Iterative Procedure for n n <- 2*((qnorm(1-alpha/2)*sigma)/w)^2 # Starting value for n (Uses z instead of t). tol <- .0000001 # Convergence Criteria dif <- tol + 1 while (dif > tol) # The while loop stops when the diff is less than tol. { previous.n <- n # Redefines current n as the previous n for the next iteration. n <- 2*((qt(1-alpha/2, 2*n-2)*sigma)/w)^2 # Equation for n dif <- abs(n - previous.n) } Per.Group.n <- ceiling(n) Per.Group.n Iterative Procedure for nM n <- 2*((qnorm(1-alpha/2)*sigma)/w)^2 # Starting value for n (Uses z instead of t). tol <- .0000001 # Convergence Criteria dif <- tol + 1 while (dif < tol) # The while loop stops when the diff is less than tol. { previous.n <- n # Redefines current n as the previous n for the next iteration. Kelley et al. / METHODS OF SAMPLE-SIZE PLANNING 283 n <- 2*((qt(1-alpha/2, 2*n-2)*sigma)/w)^2*(qchisq(1-gamma, 2*n-2)/ (2*n-2)) # Equation for modified n dif <- abs(n -previous.n) } Per.Group.Modified.n <- ceiling(n) Per.Group.Modified.n NOTES 1. Power = 1 – β, where β is the probability of failing to reject an incorrect null hypothesis. A Type II error is sometimes referred to as a beta error or as an error of the second kind. 2. Often it is said that power is made up of three factors rather than the four we have stated. The reason for this apparent inconsistency is because many authors define “effect size” as the population standardized effect size. The population standardized effect size is a function of both the population effect size as well as the population model error variance. In either case, both the size of the population effect and the population model error variance of the effect are required. Throughout the article, the effect size referred to will be the unstandardized (raw score) effect size. 3. Directionality in this sense is typically of interest not just with a directional significance test or a one-sided confidence interval but also a nondirectional test of a two-sided confidence interval. 4. There are some exceptions to interpreting directionality in statistical tests where there are multiple degrees of freedom. One such exception is when a ratio of two independent variances is formed. In the case of such an F ratio, the test statistic will be greater or less than 1 depending on whether the larger variance is in the numerator or denominator of the ratio. Directionality in this sense can be conceptualized as the comparison of the variances in order to detect if one is significantly larger (or smaller) than the other. 5. It is not always clear what constitutes a “trivial” effect size. For example, the 1988 Physician’s Aspirin Study, a study where approximately 22,000 physicians were randomly assigned to group in double-blind fashion, was cut short because it was determined to be unethical to “withhold” treatment (aspirin) from those in the control group who were taking a placebo. The ethical problems arose because aspirin was shown to reduce heart attacks and thus death (Steering Committee of the Physician’s Health Study Research Group, 1988). The effect size in this situation 2 was not large by typical standards. In fact, the effect size in this study (r = .0011) was approximately 10 times smaller than Cohen’s definition of a small correlation squared (Cohen, 1988, section 3.2). The importance of the effect to society, however, was quite large; 1.71% of those in the placebo group had heart attacks, whereas only 0.94% had heart attacks in the aspirin group (Rosenthal, 1990). Thus, approximately 82% more heart attacks occurred in the group not receiving aspirin. 6. Generally speaking, when methodologists argue for the reporting of effect sizes and their corresponding confidence intervals, they typically use a two-group mean comparison as an example. In this case, it is hard to argue against the use of Cohen’s d and a confidence interval around the population value (but see Lenth, 2001, for an exception). However, most research questions involve more than two groups, oftentimes with multiple degrees of freedom in the 284 Evaluation & the Health Professions / September 2003 numerator of the corresponding F test. Although it is often for pedagogical reasons that authors illustrate the importance of effect size measures and their confidence intervals for two-group problems, beyond the two-group case effect sizes often lose their appeal because many times they fail to provide useful information in the absence of significance tests. However, it is typically a good idea to examine subsets of the overall omnibus test, and in so doing, effect sizes often provide valuable information, as do confidence intervals around them. 7. We recommended a sensitivity analysis whenever planning sample size, as it is generally unreasonable to assume the population parameters are known exactly. A sensitivity analysis examines the relationship between required sample size and the input population effect size and the model error variance (holding the Type I error rate constant). We believe, however, that a sensitivity analysis can be conceptualized in two different ways. The first conceptualization examines the required sample size given a range of input population parameters. The second conceptualization holds constant the planned sample size (obtained from the assumed effect size and model error variance for a desired degree of power and/or precision) and then examines the actual power and/or the expected precision given that the true population effect size and/or variance deviates from the input values. 8. Although the introductory example reported a confidence interval around the population standardized effect size, the procedures that follow for sample-size calculation are developed for unstandardized effect sizes. Standardized effect sizes present computational difficulties because such confidence intervals require the use of noncentral distributions (Hedges & Olkin, 1985; Steiger & Fouladi, 1997). 9. Comparing statistical power of .50 and heads on a coin flip is actually an unfair comparison. Statistical power should always be compared when the Type I error rate is held constant. For example, if the null hypothesis were really true, the Type I error rate for the hypothesis test would be α, while it would be .50 for the coin flip. 10. Although many behavioral scientists regard Type I errors as more serious than Type II errors, a toxicologist or bioscientist working with substances that are potentially harmful may argue that a Type II error can be worse, because concluding that there is “no effect” on a noxious substance could be a harmful or even fatal mistake under certain situations. 11. A reviewer pointed out that although the procedure we present for estimating n yields an exact solution, sample size for n can be found using a simple approximation that yields results generally consistent with the exact method. Solving for n from the approximate critical value discussed in Schouten (1999, p. 89; see also, Guenther, 1981) for t(1 – α/2; 2n – 2) yields the following formulation for an effective approximation of planned sample size for AIPE, 2 2 z 1 −α 2) z( 1 − α 2 ) σ , + ( n~ = 2 2 w where z(1 – α/2) is the critical value from the standard normal distribution at the 1 – α/2 level. Unfortunately such a simple approximation does not extend to nM, which we discuss later. 12. Note that implicit in equation 4 is a γ of approximately .5. Because the distribution of the sample variance is positively skewed, the γ implicit in equation 4 is not literally .5. 13. The probability of .85 (actually .848) is obtained by following the probabilistic rules governing the union of a set of events. Because the five tests are orthogonal, they are independent by definition. The probability of one of the five tests being significant is carried out in the present situation by adding all of the individual probabilities, subtracting out the product of the individual probabilities for all two-way combinations, adding the product of the individual probabilities for all three-way combinations, subtracting the product of the individual probabilities for all four-way combinations, and by adding the product of the individual probability for the five-way combinations (Ross, 2002, p. 34). Kelley et al. / METHODS OF SAMPLE-SIZE PLANNING 285 14. This statement is correct only when the variance of the effect and the effect size itself are independent. For the majority of cases this is true, however, when the variance is a function of the effect size, knowing the variance implies the effect size is itself known and vice versa. For example, the asymptotic variance of the correlation coefficient is ( 1 1 − ρ2 N ), 2 where ρ is the population correlation coefficient and N is the total number of pairs of observations (Stuart & Ord, 1994). This illustrates a case where the effect and the variance are not independent. In these cases, only one of the two parameters is required and both the power analytic and AIPE approach require only one unknown population parameter. REFERENCES Algina, J., & Olejnik, S. (2000). Determining sample size for accurate estimation of the squared multiple correlation coefficient. Multivariate Behavioral Research, 35(1), 119-136. American Psychological Association. (2001). Publication manual of the American Psychological Association (5th ed.). Washington, DC: Author. Bakan, D. (1966). The test of significance in psychological research. Psychological Bulletin, 66, 423-437. Bausell, R. B., & Li, Y. F. (2002). Power analysis for experimental research: A practical guide for the biological, medical and social sciences. New York: Cambridge University Press. Bonett, D. G., & Wright, T. A. (2000). Sample size requirements for estimating Pearson, Kendall and Spearman correlations. Psychometrika, 65(1), 23-28. Casti, J. L. (1990). Searching for certainty: What scientists can known about the future. New York: William Morror. Cobb, E. B. (1984). Planning research studies: An alternative to power analysis. Nursing Research, 34(6), 386-388. Cohen, J. (1962). The statistical power of abnormal-social psychological research: A review. Journal of Abnormal and Social Psychology, 65, 145-153. Cohen, J. (1969). Statistical power analysis for the behavioral sciences (1st ed.). New York: Academic Press. Cohen, J. (1988). Statistical power analysis for the behavioral sciences (2nd ed.). Hillsdale, NY: Lawrence Erlbaum. Cohen, J. (1990). Things I have learned (so far). American Psychologist, 45(12), 1304-1312. Cohen, J. (1994). The earth is round (p < .05). American Psychologist, 49(12), 997-1003. Cumming, G., & Finch, S. (2001). A primer on the understanding, use, and calculation of confidence intervals that are based on central and noncentral distributions. Educational and Psychological Measurement, 61(4), 532-574. Darlington, R. B. (1990). Regression and linear models. New York: McGraw-Hill. Gardner, M. J., & Altman, D. G. (1986). Confidence intervals rather than P values: Estimation rather than hypothesis testing. British Medical Journal, 292, 746-750. Guenther, W. C. (1981). Sample size formulas for normal theory t-tests, The American Statistician, 35, 243-244. Hagen, R. L. (1997). In praise of the null hypothesis statistical test. American Psychologist, 52(1), 15-24. 286 Evaluation & the Health Professions / September 2003 Hahn, G., & Meeker, W. (1991). Statistical intervals: A guide for practitioners. New York: John Wiley. Hays, W. L. (1994). Statistics (5th ed.) New York: Harcourt Brace College. Hedges, L., & Olkin, I. (1985). Statistical methods for meta-analysis. Orlando, FL: Academic Press. Hellmann, J. J., & Fowler, G. W. (1999). Bias, precision, and accuracy of four measures of species richness. Ecological Applications, 9(3), 824-834. Hunter, J. E., & Schmidt, F. L. (1990). Methods of meta-analysis: Correcting error and bias in research findings. Newbury Park, CA: Sage. Kelley, K., & Maxwell, S. E. (2003). Sample size for multiple regression: Obtaining regression coefficients that are accurate, not simple significant. Psychological Methods, 8(3). Kraemer, H. C., Gardner, C., Brooks, J. O., & Yesavage, J. A. (1998). Advantages of excluding underpowered studies in meta-analysis: Inclusionist versus exclusionist viewpoints. Psychological Methods, 3, 23-31. Kraemer, H. C., & Thiemann, S. (1987). How many subjects? Beverly Hills, CA: Sage. Lenth, R. V. (2001). Some practical guidelines for effective sample size determination. The American Statistician, 55, 187-193. Lipsey, M. (1990). Design sensitivity: Statistical power for experimental research. Newbury Park, CA: Sage. Maxwell, S. E. (2000). Sample size and multiple regression analysis. Psychological Methods, 5(4), 434-458. Meehl, P. E. (1978). Theoretical risks and tabular asterisks: Sir Karl, Sir Ronald, and the slow progress in soft psychology. Journal of Counseling and Clinical Psychology, 46(4), 806834. Murphy, K. (2002). Using power analysis to evaluate and improve research. In S. G. Rogelberg (Ed.), Handbook of research in industrial and organizational psychology (pp. 119-137). Malden, MA: Blackwell. Murphy, K. R., & Myors, B. (1998). Statistical power analysis: A simple and general model for traditional and modern hypothesis tests. Mahwah, NJ: Lawrence Erlbaum. Rosenthal, R. (1990). How are we doing in soft psychology? American Psychologist, 45, 775777. Rosenthal, R. (1993). Cumulative evidence. In G. Keren & C. Lewis (Eds.), A handbook for data analysis in the behavioral sciences: Methodological issues (pp. 519-559). Hillsdale, NJ: Lawrence Erlbaum. Ross, S. (2002). A first course in probability (6th ed.). Upper Saddle River, NJ: Prentice Hall. Rossi, J. S. (1990). Statistical power of psychological research: What have we gained in 20 years? Journal of Consulting and Clinical Psychology, 58(5), 646-656. Rozeboom, W. W. (1966). Foundations of the theory of prediction. Homewood, IL: Dorsey. Schmidt, F. L. (1996). Statistical significance testing and cumulative knowledge in psychology: Implications for training of researchers. Psychological Methods, 1(2), 115-129. Schouten, H.J.A. (1999). Sample size formula with a continuous outcome for unequal group sizes and unequal variances. Statistics in Medicine, 18, 87-91. Steering Committee of the Physician’s Health Study Research Group. (1988). Preliminary report: Findings from the aspirin component of the ongoing physicians’ health study. The New England Journal of Medicine, 318, 262-264. Steiger, J. H., & Fouladi, R. T. (1997). Noncentrality interval estimation and the evaluation of statistical methods. In L. L. Harlow, S. A. Mulaik, & J. H. Steiger (Eds.), What if there were no significance tests? (pp. 221-257). Mahwah, NJ: Lawrence Erlbaum. Stuart, A., & Ord, J. K. (1994). Kendall’s advanced theory of statistics: Distribution theory (Vol. 1, 6th ed.). New York: John Wiley. Kelley et al. / METHODS OF SAMPLE-SIZE PLANNING 287 Thompson, B. (1999). Journal editorial polices regarding statistical significance tests: Heat is to fire as p is to importance. Educational Psychology Review, 11, 157-169. Thompson, B. (2002). What future quantitative social science research could look like: Confidence intervals for effect sizes. Educational Researcher, 31(3), 25-32. Wainer, H. (1999). One cheer for null hypothesis significance testing. Psychological Methods, 4(2), 212-213. Wilkinson, L., & American Psychological Association Task Force on Statistical Inference. (1999). Statistical methods in psychology journals: Guidelines and explanations. American Psychologist, 54(8), 594-604.


© Copyright 2026