
Sample Handling and Chemical Kinetics in an Acoustically Levitated Drop Microreactor
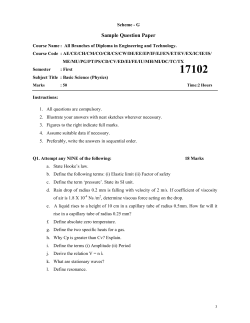
Anal. Chem. 2009, 81, 8496–8502 Sample Handling and Chemical Kinetics in an Acoustically Levitated Drop Microreactor Zakiah N. Pierre, Christopher R. Field, and Alexander Scheeline* Department of Chemistry, University of Illinois at Urbana-Champaign, 600 South Mathews Avenue, Urbana, Illinois 61801 Accurate measurement of enzyme kinetics is an essential part of understanding the mechanisms of biochemical reactions. The typical means of studying such systems use stirred cuvettes, stopped-flow apparatus, microfluidic systems, or other small sample containers. These methods may prove to be problematic if reactants or products adsorb to or react with the container’s surface. As an alternative approach, we have developed an acousticallylevitated drop reactor eventually intended to study enzymecatalyzed reaction kinetics related to free radical and oxidative stress chemistry. Microliter-scale droplet generation, reactant introduction, maintenance, and fluid removal are all important aspects in conducting reactions in a levitated drop. A three capillary bundle system has been developed to address these needs. We report kinetic measurements for both luminol chemiluminescence and the reaction of pyruvate with nicotinamide adenine dinucleotide, catalyzed by lactate dehydrogenase, to demonstrate the feasibility of using a levitated drop in conjunction with the developed capillary sample handling system as a microreactor. In an effort to thoroughly understand the mechanisms of biochemical reactions, accurate measurement of enzyme kinetics is essential. Typical methods used to study reaction systems employ stirred cuvettes, stopped-flow systems, lab-on-a chip/ microfluidic flow channels, or some other sample container together with an appropriate monitoring system.1-3 With many of the standard reaction rate methods, adsorption of reactants and products to the walls of the reaction vessel proves problematic. Reaction rates may be altered by biofilm buildup on reactor walls.4 In an effort to avoid such problems, we report the use of an acoustically levitated drop reactor (LDR).5 Precedent measurements of kinetics in levitated drops include work by David Weis and others.6-8 Acoustic levitation is not a new concept.9,10 The theory is largely understood.11,12 Acoustic levitation offers the advantages * To whom correspondence should be addressed. E-mail: [email protected]. (1) Friaa, O.; Chaleix, V.; Lecouvey, M.; Brault, D. Free Radical Biol. Med. 2008, 45, 1011–1018. (2) Caulum, M. M.; Henry, C. S. Lab Chip 2008, 8, 865–867. (3) Wilson, D. J.; Konermann, L. Anal. Chem. 2004, 76, 2537–2543. (4) Lewis, D. D.; Ruane, M. L.; Scheeline, A. J. Phys. Chem. B 2006, 110, 8100– 8104. (5) Field, C. R.; Scheeline, A. Rev. Sci. Instrum. 2007, 78, 125102-1–125102-8. (6) Weis, D. D.; Nardozzi, J. D. Anal. Chem. 2005, 77, 2558–2563. 8496 Analytical Chemistry, Vol. 81, No. 20, October 15, 2009 of small sample volume (and mass), the prevention of chemical contamination between drops and external objects, and increased analytical sensitivity, since no walls disturb detection.13,14 This technique, first described in 1933,15 and its applications in chemical analysis has been reviewed by Santesson et al.16 Recently, there has been an increase in the use of levitators for studying biochemical reactions.6,17 The development of various sample handling, mixing, and detection techniques for use in levitation potentially allows for the use of drops as microreactors for the study of biochemical kinetics. Droplet generation and sample delivery is an important aspect of an operational levitator. Most research employing levitators uses syringes, pipettes, or picoliter (pL) drop-on-demand ballistic injection,18-20 wherein a piezoelectrically driven microdispenser is used to pulse, on demand, picoliter-sized droplets into the levitation cavity. In the present study, sample introduction, mixing, volume maintenance, and fluid removal were performed using Poiseuille flow through a capillary bundle system. Kinetics measurements for both luminol chemiluminescence and lactate dehydrogenase (LDH) catalyzed reaction of NADH with pyruvate were conducted. These reactions have been studied previously and are well understood.21-23 Using these reactions, we were able to characterize performance of an LDR as a batch reactor for study of the kinetics. We address the degree of mixing (7) Groenewold, C.; Mo ¨ser, M.; Groenewold, H.; Tsotsas, E. Chem. Eng. J. 2002, 86, 217–222. (8) Leiterer, J.; Delissen, F.; Emmerling, F.; Thunemann, A. F.; Panne, U. Anal. Bioanal. Chem. 2008, 391, 1221–1228. (9) Kaduchak, G.; Sinha, D. N.; Lizon, D. C. Rev. Sci. Instrum. 2002, 73, 1332– 1336. (10) Stephens, T. L.; Budwig, R. S. Rev. Sci. Instrum. 2007, 78, 014901-1014901-8. (11) Trinh, E. H. Rev. Sci. Instrum. 1985, 56, 2059–2065. (12) Brandt, E. H. Science 1989, 243, 349–355. (13) Vandaele, V.; Lambert, P.; Delchambre, A. Precis. Eng. 2005, 29, 491– 505. (14) Priego-Capote, F.; de Castro, L. TrAC, Trends Anal. Chem. 2006, 25, 856– 867. (15) Bu ¨ cks, K.; Mu ¨ ller, H. Z. Phys. 1933, 84, 75–86. (16) Santesson, S.; Nilsson, S. Anal. Bioanal. Chem. 2004, 378, 1704–1709. (17) Westphall, M. S.; Jorabchi, K.; Smith, L. M. Anal. Chem. 2008, 80, 5847– 5853. (18) Petersson, M.; Nilsson, J.; Wallman, L.; Laurell, T.; Johansson, J.; Nilsson, S. J. Chromatogr., B 1998, 714, 39–46. (19) Miliotis, T.; Kjellstro ¨m, S.; Nilsson, J.; Laurell, T.; Edholm, L. E.; MarkoVarga, G. J. Mass Spectrom. 2000, 35, 369–377. (20) Lo´pez-Pastor, M.; Domı´nguez-Vidal, A.; Ayora-Can ˜ada, M. J.; Laurell, T.; Valca´rcel, M.; Lendl, B. Lab Chip 2007, 7, 126–132. (21) Su ¨ di, J. Biochem. J. 1974, 139, 251–259. (22) Trinchant, J.-C.; Rigaud, J. Physiol. Plant 1974, 32, 394–499. (23) Amrehn, J.; Resch, P.; Schneider, F. W. J. Phys. Chem. 1988, 92, 3318– 3320. 10.1021/ac901400y CCC: $40.75 2009 American Chemical Society Published on Web 09/21/2009 in the drop and compare to the luminescence in a 5 µL capillaryfed drop to that seen in larger reactors. MATERIALS AND METHODS Materials. All reagents were purchased from either SigmaAldrich (St. Louis, MO) or Fisher Scientific (Fair Lawn, NJ), unless otherwise noted. For chemiluminescence experiments, solutions of 0.07 M luminol (CAS 521-31-3), 3.0 M sodium bicarbonate (NaHCO3, CAS 144-55-8), 0.5 M sodium carbonate (Na2CO3, CAS 497-19-8), 0.05 M ammonium carbonate ((NH4)2CO3, CAS 506-87-6), 0.015 M copper II sulfate (CuSO4, CAS 7758-98-7), and 0.10% hydrogen peroxide (H2O2, CAS 14455-8) were prepared using 18 MΩ ultrapure water purified using a Q-POD ultrapure water filtration system (ZMQSP0D02, Millipore, Billerica, MA). Reagents were both prepared and stored at room temperature. Literature concentrations and procedures were modified so that reaction would occur at a measurable rate in a 5 µL drop.24 When experiments were run, 0.2 mL each of luminol, NaHCO3, Na2CO3, (NH4)2CO3, and CuSO4 solutions were added to one sample injection vial, while 1 mL of H2O2 solution was added to a second. For each run, 2.5 µL of the luminol mixture was injected into the LDR followed by 2.5 µL of H2O2. For the enzyme-catalyzed fluorescence experiments, solutions of 1 mM sodium pyruvate (CAS 113-24-06), 0.15 mM nicotinamide adenine dinucleotide, reduced form (NADH, CAS 606-68-8), 0.25 units/mL of L-lactate dehydrogenase (LDH, CAS 9001-60-9), 0.1% w/v poly-L-lysine, MW 150 000-300 000 (CAS 25988-63-0), and 0.25 mM bovine serum albumin (BSA, CAS 9048-46-8) were prepared, separately, in 0.1 M 1×-phosphate buffer solution (PBS, CAS 7558-79-4) (HyClone, Logan, UT). All reagents, except LDH, were refrigerated (10 °C) when not in use. LDH was frozen (-20 °C). Solution preparation and reaction procedures were detailed previously.25 When running experiments, 0.75 mL each of sodium pyruvate and NADH were added to one injection vial and 1.5 mL of LDH to the second. For each run, a 4 µL drop was generated for reaction; 3.5 µL of the NADH mixture was injected into the LDR followed by 0.5 µL of LDH solution. To prevent LDH from adhering to the walls of the of the pipet tips, in transferring it from stock solution to LDR sample vials, transfer pipet tips were coated with BSA before each transfer. CYTOP (ASAHI Glass Company. Maiden, MA), a fluorinated-polymer, with a contact angle of greater than 110°, was applied to the outer surface of the capillaries to provide a superhydrophobic outer-coating so that the drops do not wick to the sides of the capillaries. Walls of capillaries used to convey LDH were coated with poly-L-lysine26 by pumping a 0.01% solution through capillaries following cleaning with piranha solution (3 parts concentrated H2SO4, 1 part H2O2. Warning: piranha solution is a strong oxidant, must be kept away from significant quantities of oxidizable organic compounds, and must be disposed of by careful neutralization.) LDR Setup and Capillary Positioning. Before drops are introduced into the LDR5 via the capillary system, the capillaries must be positioned within 1 mm of the LDR pressure node. This (24) Orosz, G.; Givens, R. S.; Schowen, R. L. Crit. Rev. Anal. Chem. 1996, 26, 1–27. (25) Buhl, S. N.; Jackson, K. Y. Clin. Chem. 1978, 24, 828–831. (26) Kamande, M. W.; Fletcher, K. A.; Lowry, M.; Warner, I. M. J. Sep. Sci. 2005, 28, 710–718. is achieved by first tuning the system to levitate free-floating drops while maintaining close to spherical drop shape, localizing the drop on the apparatus cylindrical axis, and avoiding shape fluctuations. Control is then transferred to a LabView 8.0 module (see the Supporting Information). Temperature, pressure and relative humidity, in the space surrounding the drop, are recorded, using a portable sensor (Omega Engineering, Inc. iBTHX-W), and reflector height computed and adjusted as previously described.5 A syringe is used to introduce a 5 µL drop into the LDR. This drop is used as a guide for the tip of the capillary system to indicate the optimal position for delivering reactants. This procedure only has to be completed once daily. Sample Introduction. Sample introduction was achieved using a Poiseuille flow capillary system developed in-house (Figure 1D). The setup consists of a polyamide adhered, poly-L-lysine (PLL) flushed, CYTOP-coated, capillary bundle to deliver the initial drop to the levitator, add reactants, and remove the droplet once reacted. The capillary bundle is made of three 1 m long, 363 µm o.d., 180 µm i.d., flexible fused silica capillaries from Polymicro Technologies (Phoenix, AZ). They are adhered to one another using a polyimide resin (CAS 68410-23-1). Each capillary is connected to a 2 mL vial using a series of PEEK fittings, ferrules, unions, and tubing sleeves (Upchurch Scientific, model numbers F33NX, P-702, P-440, and F-238X), in which reagents can be placed for delivery to the LDR or from which waste can be collected. PLL (0.01% w/v) in 0.1 M phosphate buffer is flushed through the capillaries to coat the inner walls of the capillaries to eliminate cationic enzyme adsorption or build-up on the walls. The coated capillaries are used for up to 60 reaction runs before recoating with PLL. The capillary bundle is positioned using an XYZ stage (TSX-1A, Newport, Irvine, CA). Fluids are fed into the levitator through two of the capillaries using pressurized argon (40 psi). The inlet flow rate is 2.3 µL/s. A belt driven, HYVAC vacuum pump (-12 psi, 600 rpm, CENCO, New Brighton, MN) is connected to the third capillary. A 1 mL vial, used to collect the sample waste as drops are removed, is positioned between the capillary and the pump. To control fluid flow, a series of two-way, 5 V solenoid valves (Precision Dynamics, Inc. New Britain, CT) are used on each capillary line. This stopped flow system is controlled using a LabVIEW 8.0 program. Solenoid drivers are connected directly to the digital outputs on a multifunction analog-to-digital (ADC) card (PCI-DAS6014, Measurement Computing Inc., Norton, MA). The program allows for sequential fluid injection from the sample vials within seconds with the click of one LabVIEW module button. Drops are removed in the same way. Without using the vacuum to remove the drop, a 5 µL levitated drop will evaporate completely from the tip of the capillaries within 6 min in a dry atmosphere close to room temperature, 23 °C. For the experiments conducted in this article, all reactions were complete in less than 1 min, sufficiently less than 6 min to avoid a significant concentration change due to water evaporation. The LDR and capillary bundle system are currently used as a two channel stopped flow reactor. Modified flow control would turn the system into either a continuously stirred tank reactor or continuous flow analyzer. Kinetics Measurements. Besides adding the capillary system, the LDR previously described5 was modified by addition of Analytical Chemistry, Vol. 81, No. 20, October 15, 2009 8497 Figure 1. Acoustic levitation: (A) schematic of the entire acoustic levitation drop reactor (LDR) system; (B) levitation cavity setup of the LDR. The sample vials with connections to the silica fused capillary bundles system, the continuous wave argon laser, drop, and optical detection system are also shown. (C) Three-capillary bundle system: three 1 m, 180 mm i.d. fused silica capillaries bonded with polyamide resin. Orientation with two capillaries coplanar on the top and one capillary on the bottom is needed for successful experiments. (inset: actual capillary bundle). (D) Levitated drops, before the introduction of the capillary bundle (top) and capillary bundle in the levitated drop (bottom). foot switches (model FTSW-SM, MicroRidge, Sunriver, OR) to allow hands-free, fine-tuning adjustments (0.01 mm increments, axial) of the reflector height for optimum levitation. A high speed CMOS camera (Stingray IEEE1394 C-Mount Camera, Allied Vision Technologies GmbH, Stadtroda/Germany), coupled with a 0.63× magnification telecentric lens (Invarigon 59 LGU 042 with 59 LGZ 415 teleconverter, CVI/Melles Griot, Covina, CA) was used to view the levitation cavity during experiments in real time. Temperature (near-ambient), pressure, humidity, levitation bimorph drive voltage, and reflector height were recorded before each run. For the chemiluminescence experiments, the time course of the luminol reaction with H2O2 was detected using a 910 µm core diameter fiber optic (BFH22-910, ThorLabs, Newton, NJ) coupled to a photomultiplier tube (PMT) (R928, Hamamatsu. Bridgewater, NJ) with a variable high voltage supply (model 205A-01R, Bertan Associates), set to 375 V (Figure 1). The output current from the PMT was sensed through a 1 V/µA linear amplifier. The signal output from the amplifier was T-ed to an oscilloscope (7603, Tektronix, 7A14 plug-in) through a 1 MΩ signal input and to the same multifunction ADC used for the solenoid valve control mentioned earlier. The ADC was configured with 16 analog single ended inputs. A LabView 8.0 program using the Measurement Computing Universal Library for LabVIEW 8498 Analytical Chemistry, Vol. 81, No. 20, October 15, 2009 collected, saved, and displayed the PMT signal. The time course of the intensity change was fit to a second order rate law. For the NADH fluorescence, either a 200 mW 357 nm argon ion laser (Innova 90, Coherent Inc. Santa Clara, CA) or a 16 mW, 372 nm wavelength diode laser (1Q micro 1A, model LDCU8/ 8940, Power Technologies Inc. Alexander, AR) was used for excitation (see the Supporting Information). Detection used the same fiber optic setup as for chemiluminescence. Reaction concentrations, sampling rate (1 kHz), total sampling time (30 s), and the fiber optic detection system were the same for both sets of experiments. RESULTS AND DISCUSSION Microfluidic Setup. The LDR functions as a stirred batch microreactor with convection induced by the ultrasound.14 In order for this system to function properly, correct orientation of the capillary system is vital. Two feed capillaries must be coplanar on the top, while the drain capillary is centered below (Figure 1C). Improper orientation results in wicking of the drop to the side of the capillary bundle. Even with proper orientation, it is essential to coat the capillary tip with CYTOP to prevent drop adhesion. Chemiluminescence Experiments. Typical chemiluminescence data are shown in Figure 2. The reactions are Cu2+ + luminol a Cu2+luminol (1) Cu2+luminol + H2O2 f Cu2+ + 4-aminophthalate* (2) 4-aminophthalate* f 4-aminophthalate + hν (3) The primary reasons for performing these experiments were to demonstrate that reactions initiated by reactant flow from capillaries could be observed in the drop and that reactant mixing in the LDR from diffusion, flow-induced convection, and ultrasound-induced circulation was sufficiently rapid to be useful for study on a second or faster time scale. Data seen in Figure 2 and the still images extracted from one of the runs (Figure 3) show that mixing is essentially complete within 1 s after reactant influx is stopped. Figure 2A shows a single transient of a total of six chemiluminescence experiments (Figure 2B). The reaction is nearly complete within 15 s. As the H2O2 is introduced at ∼t ) 3 s, the drop begins to luminesce, causing a sharp increase in photocurrent. While valve switching is precise to better than 0.1 s, mixing time varies over a 1.5 s range. The inset of part B of Figure 2 shows the traces offset to a common baseline, with transients shifted in time so that all decays go through 0.5 µA simultaneously. Averaging all the traces in part B, one obtains the inset in part C. Figure 2D shows the misfitting of the data at later times in the reaction as a result of inhomogeneity in the drop. If the decay were a pure second-order reaction between luminol and H2O2 with the effect of Cu2+ limited to increasing the pseudosecond order rate constant k2, the fluorescence intensity would follow a time course, I) FkB(B - A)2e(B-A)kt B (B-A)kt e -1 A ( ) (4) where A ) [luminol]0, B ) [H2O2]0, F is an arbitrary scale factor dependent on observation system and reaction quantum yield, and k is an effective rate constant, dependent at least on pH, ionic strength, and [Cu2+]. By design, B > A. As expressed here, (B - A) can either be computed from the initial values of A and B or used as a separate fitting parameter. When it is separately optimized, one obtains the best possible fits. Obviously, an alternative interpretation is that the rate law governing chemiluminescence is more complicated than a pure second order. Yu et al. postulate a mechanism that would be at least third order or involve a pre-equilibrium.27 The point here is not to elucidate the mechanistic details but rather to demonstrate that such elucidation is plausible with this apparatus. Figure 3 shows individual frames from a video recording of a luminescence transient. Between 3 and 4.5 s there is heterogeneity within the drop. As the H2O2 is introduced, beginning at 2.97 s, the drop begins to gradually illuminate in a nonuniform manner. Circulation from solution introduction causes the drop to precess in a circular motion which ultimately results in a well mixed drop that reaches maximum intensity at 3.7 s and only 0.7 s after completion of H2O2 introduction. At 3.7 s there is a noticeable decrease in intensity which rebounds at both 4.0 and 4.1 s, neither reaching the intensity observed at 3.7 s. After 4.2 s, the drop luminescence intensity steadily decreases. Between 7.34 and 10.23 s, a great difference in drop intensity can be seen. In addition to the intensity changes, inhomogeneity can be seen over time. At 3.13 s (Figure 3, inset), the ripples seen in the drop are evidence of mixing. For each time noted on the plot beyond 3.13 s, small drop modulations are observed. The inset in Figure 2D shows that some small signal modulation inconsistent with a pure mass-action, monotonic approach to equilibrium is observed. Whether this is due entirely to drop inhomogeneity or if dust or some other source causes this modulation has not been determined. LDH Experiments. NADH/LDH/pyruvate kinetic data can be seen in Figures 4 and 5. The reaction is LDH NADH + pyruvate + H+ 98 NAD+ + lactate Figure 2. Chemiluminescence kinetics in levitated drops: (A) single chemiluminescence transient. Introduction of copper/luminol and H2O2 solutions at times shown. (B) Six raw chemiluminescence transients, baseline, and time-offset that show the system reproducibility. (C) Average of data in part B. Fit to second-order rate law is “consistent fit.” Allowing [luminol]/[H2O2] to be fit independently from [luminol] [H2O2] gives “independent fit.” (D) Scale expansion of fits in the inset in part C. A nonmonotonic decrease in luminescence data is evidence of dynamics other than simply mass-action kinetics. (5) where LDH catalyzes the reduction of pyruvate to lactate by NADH in the LDR. Attempts to study this well-known reaction presented several difficulties. Although a difference is observed between the transients of reacted samples and that of water or unreacted NADH, reproducibility between runs was difficult to obtain. When a run was successful, it followed MichaelisMenten28 kinetics remarkably well, as detailed below. Figures 4 and 5 show LDH experiments from two series of drops formed at 1 min intervals without changing levitation parameters (see the Supporting Information). Data presented represent 15% of the total from the two series. Figure 4A shows fluorescence from a blank, a 4 µL drop of 18 MΩ deionized water. Figure 4B shows the transient for a newly formed drop that contains only NADH. Besides the intensity increase as a result of the NADH fluorescence, the drop is relatively stable and exhibits (27) Yu, Y.; Yan, F.; Wang, X. J. Luminesc. 1988, 40-41, 842–843. (28) Garrett, R. H.; Grisham, C. M. Principles of Biochemistry with a Human Focus; Brooks/Cole, Thompson Learning: Belmont, CA, 2002. Analytical Chemistry, Vol. 81, No. 20, October 15, 2009 8499 Figure 3. Chemiluminescence kinetics in levitated drops: A single chemiluminescence transient with individual frames of a video recording of a luminescence experiment. Changes in the drop color intensity, size, and shape can be seen over time. Inset: Magnification of 3.13 s levitated drop. Shows ripples in the drop from adding H2O2 and the initiating reaction. little change over the 30 s observation period. This demonstrates that NADH fluorescence is steady when laser-excited but when no pyruvate or enzyme is present. Parts C and D of Figure 4 show data from successful LDH runs. Within the first 4 s, the NADH/pyruvate mixture and LDH have formed a levitating drop and have begun reacting. As the NADH and pyruvate are consumed, the signal decays. Each transient reaches a steady state as all of the pyruvate and approximately 10% of the NADH is consumed. If all of the NADH had been consumed, the signal intensity would have eventually dropped to zero; instead the intensity drops by about 20% in each case. Parts A-C and E of Figure 4 exhibit the same highfrequency fluctuations. We attribute the majority of the fluctuations to shot noise. The Savitzky-Golay29 algorithm was used to filter the data. While we attempted to derive a rate law and integrated rate expression based on an extensive set of fundamental reactions in this system, the number of fitting parameters exceeded what could be statistically justified from the noisy data. This is hardly a novel problem.30 We thus approximated the reaction model as pure Michaelis-Menten, with pyruvate as the kinetically limiting substrate, Vmax[pyruvate] d[lactate] ) dt KM + [pyruvate] (6) where KM and Vmax have the usual meanings of substrate binding constant and maximum reaction rate, ignoring product inhibition. d[NAD+] d[lactate] d[pyruvate] ) )dt dt dt (7) (29) Savitsky, A.; Golay, M. J. E. Anal. Chem. 1964, 36, 1627–1639. (30) Frazer, J. W.; Balaban, D. J.; Wang, J. L. Anal. Chem. 1983, 55, 904–910. 8500 Analytical Chemistry, Vol. 81, No. 20, October 15, 2009 Since detection was via NADH fluorescence, [NADH] ) [NADH]0 - [lactate] (8) Integration of eq 6 gives T) ( KM [lactate] [lactate] ln 1 Vmax Vmax [pyruvate]0 ) (9) This is conveniently rewritten in terms of the fraction of reaction completed, f. T) [pyruvate]0f KM ln(1 - f) Vmax Vmax (10) Vmax is known from the assay of enzyme used in the reaction, so KM is the free fitting parameter. Equations 8 and 10 were used iteratively to fit the data in Figure 4C,D. Data in Figure 4C was offset to a zero baseline. The experimental substrate, enzyme concentration, and time were used to generate the fitted decay of Figure 4C,D, as shown in Figure 4E,F. The fitted KM, 0.2 µM,31 matched literature values under the conditions used, offering validation that the LDR could serve, at least in this case, as a useful microreactor for studying biochemical reactions. The reaction in the 5 µL drop in the LDR, in a volume comparable to other microfluidic systems and orders of magnitude smaller than conventional systems, provides data comparable to a macroscopic system.31 It is important to note that the reactions were conducted without active environmental controls (temperature, pressure, humidity, etc.) other than the approximate regulation provided by building heating systems. Nevertheless, results were reproducible. (31) Kolb, E.; Fleisher, G. A.; Larner, J. Biochemistry 1970, 9, 4372–4380. Figure 4. Lactate dehydrogenase catalyzed reduction of pyruvate to lactate in the LDR: (A) transient of 18 MΩ deionized water, (B) transient in the absence of pyruvate (NADH only), and (C, D) two 30 s transients from runs in the LDR on two different dates. Each transient relaxes to a steady state with consumption of all pyruvate and ∼10% of NADH. (E, F) Represents the Michaelis-Menton fit for parts C and D, respectively. (Data smoothed using a 21 point Savitzky-Golay algorithm (parts A and B) and 51 points (part C). Parts D-F data are not smoothed.) The data in Figure 4 demonstrate the potential for LDRs to be used as microreactors. Figure 5, on the other hand, presents several nonidealities of the LDR system that must be understood and rectified, before the system will offer the reproducibility expected in a routinely useful instrumental system. Contributions to these nonidealities in drop signal in addition to the obvious shot noise include rapid spinning of the drop, translational and shape oscillations of the drop32,33 (referred to as “breathing modes” throughout the remainder of this article), bubble formation, and dissipation and scattering from debris present in the drop. Examples of these phenomena have been previously reported34,35 and are classified in Figure 5 using images obtained from the CMOS camera. (32) (33) (34) (35) Trinh, E. H.; Holt, R. G.; Thiessen, D. B. Phys. Fluids 1996, 8, 43–61. Feng, Z. C.; Su, Y. H. Phys. Fluids 1997, 9, 519–529. Anilkumar, A. V.; Lee, C. P.; Wang, T. G. Phys. Fluids 1993, 5, 2763–2774. Yarin, A. L.; Weiss, D. A.; Brenn, G.; Rensink, D. Int. J. Multiphase Flow 2002, 28, 887–910. In all insets in Figure 5, each drop exhibited bubbles forming as the drop was being generated; these eventually dissipated. For droplets that have bubbles present, whether large or small, stationary or in-motion, random increases in intensity and large frequency fluctuations in the samples are observed (Figure 5A,D). When a droplet is breathing, dips and valleys are present as seen in parts B and E of Figure 5. Although the signal is compromised as a result of the breathing motions of the drop, convection is necessary to mix the reactants and burst the bubbles to form a homogeneous drop. Spinning of the drop also aids in the mixing of the drops contents; spinning rapidly correlates with noisy signals from the drop. When a drop is spinning, evenly spaced sharp increases in intensity appear as in parts B and E in Figure 5. Limitations and Improvements. A number of changes to the LDR system are required to make it useful for its design purpose of studying the kinetics of enzyme reactions involving Analytical Chemistry, Vol. 81, No. 20, October 15, 2009 8501 Figure 5. Drop pathological phenomena: (A-F) transients of lactate dehydrogenase catalyzed reduction of pyruvate to lactate in the LDR. Drop breathing (A and C), bubble formation and dissipation (B and E), and spinning (C and F). Bubbles formed during drop generation; most have dissipated within 15 s of drop formation. reactive oxygen species. Active temperature and humidity controls are being added. Improvements in sample introduction using ballistic injection of “drops on demand” are also in process. Understanding and optimizing mixing of separate reactant streams (whether continuous from capillaries or discrete from droplet injection36,37) is critical. While mixing times ∼0.5 s are useful for some experiments, times below 0.1 s are necessary for the study of many free radical systems and times below 0.01 s are necessary to be competitive with, e.g., stopped flow systems. CONCLUSIONS The purpose of this article was to demonstrate that an LDR can be used to obtain enzyme and other reaction kinetics data in a system free of solid-liquid interfaces. Success at such measurements has been shown for LDH. Also noted were drop stability, mixing, and instrument limitations, most of which can be remedied (36) Yang, J. C.; Chien, W.; King, M.; Grosshandler, W. L. Exp. Fluids 1997, 23, 445–447. (37) Sauter, A. D. U.S. Patent 6,149,815, November 21, 2000. 8502 Analytical Chemistry, Vol. 81, No. 20, October 15, 2009 with engineering improvements, in progress. The development of electrochemical and additional optical diagnostics is proceeding. ACKNOWLEDGMENT This investigation was supported primarily by the National Institutes of Health under the Ruth L. Kirschstein National Research Service Award 5 R01 GM067193-06 from the National Institute of General Medical Sciences. It was also supported in part by the Engineering Research and Development Command, U.S. Army, under Contract No. W9132T-08-2-0009, and by Grant RA0333 from Research Corporation. The manuscript preparation was completed with partial support of National Science Foundation Grant 08-52383 ARRA. SUPPORTING INFORMATION AVAILABLE Additional information as noted in text. This material is available free of charge via the Internet at http://pubs.acs.org. Received for review June 26, 2009. Accepted September 10, 2009. AC901400Y


© Copyright 2026