
Sample Earth Science Projects TWIN RIVERS UNIFIED SCHOOL DISTRICT
Sample Earth
Science Projects
TWIN RIVERS UNIFIED SCHOOL DISTRICT
Earth Science:
Sample Projects and Activities
Qtr
Unit Topic
Projects
Description
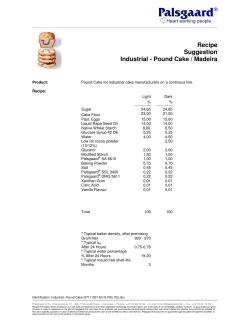
In these projects, students
create paper models of the
different kinds of faults,
stratovolcanoes, and other
landforms. These models are
from the USGS website.
In these projects, students build
(and use) two weather
instruments. Students will
compare their instruments with
actual weather forecasts and
make associations with general
weather conditions.
This project requires adult help,
as students need to nail pieces
of wood together. The students
follow an engineering process
to create an effective model of
a seismograph.
These projects are three
variations of the same theme.
Students use straw to collect
core samples and predict the
interior organization of layers
of cake or clay.
Students create topographic
maps and learn about sonar
technology.
2
Paper Models
-Volcanoes
-Faults
-Landforms (Ocean Trench, Earth)
3
Weather and Climate
-How to Build a Barometer
-How to Build an Anemometer
2
Earthquakes
-How to Build a Seismograph
2
Geology
-Cupcake Geology
-Layers of Cake Geology
-Clay Layers
2
Oceanography
-Mapping the Ocean Floor
-A Watered-Down Topographic
Map
3
Atmosphere
-Layers of the Atmosphere Foldable describes each layer of the
Students create a foldable that
atmosphere.
―Tell me and I'll forget; show me and I may remember; involve me
and I'll understand.‖
CONSTRUCTING PAPER
MODELS
OF VOLCANOES
Introduction:
Model volcanoes replicate the shape and structure of a volcano on a small scale. Students
can create model volcanoes for science projects, or teachers can create volcanoes for
demonstration purposes. You can make model volcanoes to erupt through chemical
reactions so that they replicate the eruption of an actual volcano.
To get you prepared for this project, review the different kinds of volcanoes:
Cinder cones are the smallest and are formed largely by the piling up of ash, cinders, and
rocks, all of which are called pyroclastic ("fire-broken") material, that have been explosively
erupted from the vent of the volcano. As the material falls back to the ground, it generally
piles up to form a symmetrical, steep-sided cone around the vent. Sunset Crater in Arizona
and Paricutin in Mexico are well-known examples of cinder cones.
Shield volcanoes are generally not explosive and are built by the accumulation of very fluid
lava flows that spread out to produce a mountain with broad, gentle slopes. Shield volcanoes
are the largest of all volcanoes, up to tens of kilometers across and thousands of meters high.
Kilauea and Mauna Loa Volcanoes in Hawaii are classic examples of active shield volcanoes.
Stratovolcanoes are built up of lava flows interlayered with pyroclastic material; scientists
believe that the layering represents a history of alternating explosive and quiet eruptions.
Young stratovolcanoes are typically steep sided and symmetrically cone shaped. There are
several active stratovolcanoes in North America. since 1980 Mount Saint Helens in
Washington has become the most familiar. Other well known stratovolcanoes in the Unites
States include Mount Rainier, Mount Shasta, Mr. Mazama (Crater Lake), and Redoubt
Volcano in Alaska. Mount Fuji in Japan and Mount Vesuvius in Italy are other famous
stratovolcanoes.
Materials:
Volcano Pattern
Cardstock or heavy paper
Felt tip pens, acrylic paints, etc.
Scissors
Procedure:
1. Download the volcano pattern and print it onto cardstock or heavy paper.
2. Identify and color the features represented on the model.
3. Cut and fold the model as indicated on the pattern.
4. Relate the internal structures represented by the model with the exterior shape and
features of the volcano.
From: http://teams.lacoe.edu/documentation/classrooms/gary/earth/activities/volcano/pattern.html
Iceland Volcano Paper Model
Instructions:
1. Cut around the 3 parts of the model:
A. Ash plume
B. Base
C. Summit and crater
2. Ash plume: fold and glue the two halves together.
3. Base: cut out the hole in the middle of the base.
4. Base: fold along the thick black lines and glue tabs to make-up the model like a box lid.
Allow to dry.
5. Summit and crater: fold as shown in the images on page ____. Half the ’cone’ points
downwards.
6. Glue the summit and crater to the base as shown in the image on page ____.
7. Glue the ash plume to the summit and crater
Assembly Photos:
Transform Fault Paper Models
Introduction:
Transform Plate Boundaries are locations where two plates slide past one another. The
fracture zone that forms a transform plate boundary is known as a transform fault. Most
transform faults are found in the ocean basin and connect offsets in the mid-ocean ridges. A
smaller number connect mid-ocean ridges and subduction zones.
(From: http://geology.com/nsta/transform-plate-boundaries.shtml )
Materials:
Templates for transform fault 1 and transform fault 2 (see next two pages)
Scissors
Blade (Have an adult make the cuts for you).
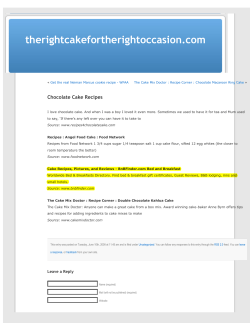
Instructions:
To prepare the model cut along the fracture zone from point a to point b with a razor blade.
Fold the paper on either side of the fracture zone as indicated. Make 90º downward folds at
the four locations marked Fold down, and 180º upward folds at the two locations marked
Pinch together. The resulting model will now be about one-half as long as the original, and
will have two folds of paper (the soon to be created sea floor) projecting down from the
surface. Students must work in pairs to operate the model. One holds the ridge segments
together by gently pinching each of the downward folds just below the surface. The other
holds the paper at either end (adjacent to points A and B) and slowly pulls the new sea floor
out of the ridge crests. See photos below.
Folded transform fault paper model
Transform fault paper model being pulled apart
From: http://web.viu.ca/earle/transform-model/
From: http://www.fault-analysis-group.ucd.ie/papermodels/models/normal_fault.html
From: http://www.fault-analysis-group.ucd.ie/papermodels/models/reverse_fault.html
From: http://www.fault-analysis-group.ucd.ie/papermodels/models/strike_slip_fault.html
Creating a Paper Model of an Ocean
Trench
Introduction:
A deep-sea trench is a narrow, elongate, v-shaped depression in the ocean floor. Trenches are
the deepest parts of the ocean, and the lowest points on Earth, reaching depths of nearly 7 mi
(10 km) below sea level. These long, narrow, curving depressions can be thousands of miles in
length, yet as little as 5 mi (8 km) in width. Deep-sea trenches are part of a system of tectonic
processes termed subduction. Subduction zones are one type of convergent plate boundary
where either an oceanic or a continental plate overrides an oceanic plate. A trench is formed
where the oceanic plate dives below (is subducted by) the (less dense) overriding plate. They
are associated with a certain type of volcanic chain called an island arc and with zones of high
earthquake activity. The trenches can extend for thousands of kilometers parallel to the
volcanoes of the island arcs located on the overriding plate. Examples include the Aleutian
Islands, an arc bordered to the south by the Aleutian trench, and the Marianas, bordered by
the Mariana trench, the deepest in the world. Along the western coast of South America, the
Peru-Chile trench marks where the Nazca plate is being subducted beneath the South
American plate. The volcanic activity and uplift of the Andes Mountains are a result of the
subduction process.
Materials:
Crayons
Heavy Stock Paper
2 Print outs (Top and Bottom Parts of Trench)
Paper Glue
Scissors
Instructions:
Glue both print outs of heavy stock paper. Cut along the indicated lines.
Assemble by following instructions on the print out.
From: http://www.jclahr.com/alaska/aeic/taurho/trench%20final.pdf
Constructing a Model of the Globe
Introduction:
The science of geology, or study of the Earth, depends on the use of maps. Accurate
topographic maps that show the relief of a region, and geologic maps which show the kinds of
rocks and land features present in an area, are the creation of skilled surveyors and navigators.
Although the oldest maps date back to the Babylonians in 2300 BC, the art and science of
mapmaking began to flourish in 15th century Europe. Exploration of the New World
demanded better navigational tools and skilled draftsmen such as Netherlands cartographers
Gerhard Kremer Mercator (b. 1512; d. 1594) and Abraham Ortelius (b. 1527; d. 1598) who
published the first modern atlas. The invention of the compass for determining direction , the
sextant for determining latitude, and the marine chronometer for determining longitude on
long sea voyages greatly improved the art of navigation in the 16th and 17th centuries. Today,
maps are largely transformations of aerial and satellite photography. Can you imagine a world
without maps?
From: Ready-to-Use Earth and Astronomical Science Activities (5-12)
Materials:
●Old tennis ball
●Colored print out of the globe
●Glue
●Hard stock paper
Steps:
1. Cut the map projection out in four sections, marking each section number on the back.
2. Glue sections in correct order onto the tennis ball.
3. Cut out the base pattern, paste it on hard stock paper, and glue its ends together to form the
base.
From: USGS, http://volcanoes.usgs.gov/about/edu/dynamicplanet/ballglobe/index.php
Build a Home Made Barometer
Introduction:
Air pressure and differences in pressure are among the most important weather makers. For
example, the centers of storms are areas of relatively low air pressure, compared to pressures
around the storm. High air pressure generally brings good weather. Keeping track of how the
pressure is changing is important for forecasting the weather.
Another importance of measuring air pressure is that differences in air pressure between
places cause the winds to blow (air moves from high toward low pressure).
The instruments that measure air pressure are called barometers, from Greek words for weight
and measure. Evangelista Torricelli invented the mercury barometer in 1643 and today's
mercury barometers are much like those of the 17th century.
In this project, we will build a simple barometer that will allow us to detect changes in air
pressure.
From: http://www.usatoday.com/weather/wbaromtr.htm
Materials:
An empty coffee can
A large balloon
A large rubber band, one that will fit snugly around the coffee can
A pin
Glue
Straw
Paper
Procedure:
1. Cut a large piece of the balloon and stretch it over the coffee can.
2. Hold the balloon in place with a rubber band stretched around the can, over the balloon.
Make sure there is a tight seal around the rubber band.
3. Use a little glue (not hot melt) and attach the straw to the piece of balloon over the can.
Then use a little more glue and attach the pin to the other end of the straw (see diagram
below.)
4. Take a piece of paper and place some regularly spaced lines on it.
5. Set up the can and paper as shown in the diagram.
6. Make several daily recordings of pressure for about a week. Make notes about the weather
when you take the readings.
7. Compare the readings of a real, commercially-available barometer outside with those of a
barometer inside. (Alternatively, use the newspaper or web-based weather forecasts to obtain
true pressure readings).
DATA TABLE:
Home Made Barometer
Day
Reading
1
2
3
Actual Barometer
Reading
Description of Day’s
Weather
4
5
Questions:
1. Explain how this barometer works:
2. Why is it important to make sure that the balloon is affixed tightly (no air leaks) to the
coffee can?
3. Study the data you have collected. What is the relationship between the…
a. your barometer readings and actual barometer readings?
b. current weather conditions and your barometer readings?
4. If you were to redesign the barometer, what improvements would you make and why?
How to Make a Homemade Anemometer
Introduction: An anemometer is a device that measures wind speed. There is a variety of
specific types of anemometers, with the simplest being a cup anemometer. This type of
anemometer consists of cups on horizontal axes that the wind pushes around a single vertical
axis. A cup anemometer was first made in 1846 and is the easiest anemometer to make at
home.
Materials:
●Scissors
●5 small paper cups
●Ruler
●2 straight plastic straws
●Sharpened pencil
●Push pin
●Stapler
●Timer
●Calculator
Procedure:
1. Take four of the paper cups. Using the hole punch, punch one hole in each, about 1.5 cm
below the rim.
2. Take the fifth cup. Punch four equally spaced holes about 1cm below the rim. Then punch a
hole in the centre of the bottom of the cup.
3. Take one of the four cups and push a straw through the hole. Fold the end of the straw, and
staple it to the side of the cup across from the hole. Repeat this procedure for another onehole cup and the second straw.
4. Now slide one cup and straw assembly through two opposite holes in the cup with four
holes. Push another one-hole cup onto the end of the straw just pushed through the four-hole
cup. Bend the straw and staple it to the one-hole cup, making certain that the cup faces in the
opposite direction from the first cup. Repeat this procedure using the other cup and straw
assembly and the remaining one-hole cup.
5. Align the four cups so that their open ends face in the same direction (clockwise or
anticlockwise) around the centre cup. Push the straight pin through the two straws where they
intersect. Push the eraser end of the pencil through the bottom hole in the centre cup. Push
the pin into the end of the pencil eraser as far as it will go. Your anemometer is ready to use.
NOTE: Your anemometer is useful because it rotates at the same speed as the wind. This
instrument is quite helpful in accurately determining wind speeds because it gives a direct
measure of the speed of the wind. To find the wind speed, determine the number of
revolutions per minute. Next calculate the circumference of the circle (in meters) made by the
rotating paper cups. Multiply the revolutions per minute by the circumference of the circle (in
meters per revolution), and you will have the velocity of the wind in meters per minute.
The anemometer is an example of a vertical-axis wind collector. It need not be pointed into
the wind to spin.
Test your anemometer by collecting wind speeds at different times of the day throughout the
week. Watch or research actual wind speeds for your area from weather forecasts.
Data Table:
Day and
Time
Revolutions per
Minute
Calculated Wind
Speed
Actual Wind Speed
1
2
3
4
5
6
Questions:
1. Did wind speeds change according to time of day?
2. How did your measurements compare with the actual wind speeds from weather forecasts?
3. How is wind speed related to weather?
4. If you could redesign your anemometer, what improvements will you make? Identify at least
three.
Extension: Create a Beaufort Wind Scale Measuring Device
Glue both circles on
hard stock paper, and
then cut the circles
out.
1. Connect the
two circles
together using a
one-hole
fastener. Make
sure the first
circle can
rotate.
2. Use the
Beaufort Scale
Measuring
Device and the
table below to
determine the
force of the
wind speeds
you recorded in
your data table.
The Beaufort Scale
In the Beaufort Scale, wind strengths are divided into 12 forces:
Force
Symbol
Name
Approximate
Description
Speed
(mph)
Force 0
Complete
calm
No motion.
Smoke rises
straight up
<1
Force 1
Light air
Smoke drifts
1-3
Force 2
Force 3
Force 4
Force 5
Force 6
Wind felt on
face. Leaves
Light breeze
rustle.
Weather is
usually clear
Leaves and
Gentle
twigs move.
breeze
Light flags
flap
Small
Moderate
branches
breeze
move
Bushes and
small trees
sway. Crests
are common
Fresh breeze
on sea and
known as
"white
horses"
Wind
whistles in
Strong
electricity
breeze
and
telephone
wires. Hard
4-7
8-12
13-18
19-24
25-31
Image
Force 7
Force 8
Force 9
Force 10
Force 11
Force 12
to use
umbrellas
Whole trees
sway and it
becomes
hard to walk
Near gale
in the wind.
Sky may be
dark and
stormy
Now very
difficult to
walk and
Gale
tree twigs
start to
break
Tiles and
chimneys
blown from
roofs and
Strong gale branches
may snap.
Sky may be
covered in
thick cloud
Trees are
uprooted
and severe
Storm
damage is
caused to
buildings
Widespread
Violent
damage is
storm
caused to
buildings
Severe
Hurricane devastation
is caused
32-38
39-46
47-54
55-63
64-72
73+
From: http://www.rcn27.dial.pipex.com/cloudsrus/beaufort.html
http://www.rcn27.dial.pipex.com/cloudsrus/makeanemom.html
http://www.ehow.com/how_5412635_make-homemade-anemometers.html
BUILD YOUR OWN SEISMOGRAPH
Introduction:
A seismograph is an instrument that detects and records ground motion. Ground motion can be caused by
something man-made, such as a mine blast or a nuclear explosion; or by natural events, such as landslides,
volcanic activity, or most often, earthquakes. Whenever any of these events occur, seismic waves are created, and
it is these waves that a seismograph picks up.
There are two main types of seismic waves: body waves, which can travel through the inner layers of the earth,
and surface waves, which can only travel on the surface. Body waves are the fastest and have the highest
frequency. The first type of body wave is called the primary or P-wave. It pushes and pulls the solid rock or liquid
matter that it is moving through, and people feel it as back-and-forth or side-to-side motion. The second type of
body wave that you feel in an earthquake is called the secondary or S-wave. S-waves cannot move through liquids,
only through solid rock. They move rock particles perpendicular to the direction the wave is traveling in.
This project requires adult help, so please have them around when you work on your project!
Materials and Equipment
Wood base, 10" x 24" x 0.5"
Wood stand, 2" x 4" x 12"
Wood support blocks, approximately 2" x 4" x 8" (2)
Wood beam, 1" x 1" x 20"
Wood dowels, diameter = 0.25", length = 10"; one dowel must slide through center of adding machine
paper roll (2)
Brick or other compact heavy weight
Strong wire or non-elastic thick rope or twine (7 feet total)
Roll of adding machine paper, width >= 2"
Smooth-sided can with lid and base (similar dimensions as paper roll)
Round-headed screw, or bolt or nail; 1" long
Pen
Various sizes of nails
Strong tape (masking, strapping, or duct) for attaching weight
Lab notebook
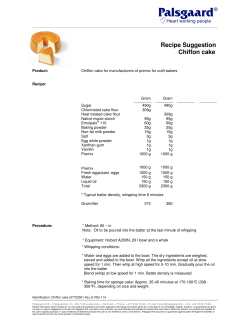
Experimental Procedure
A. Building the Seismograph
Build the seismograph according to the diagram below.
B. Here are some important steps and/or modifications you may need to consider:
1. If you have a drill, you can mount the two wood dowels in holes drilled through the two
wood support blocks. If you do not have a drill, saw two slots into the upper edge of each
wood support block and then drop the dowel into these slots.
2. The pen must write easily when pulled down onto the paper roll by the brick. Cap it when
not in use. You may try substituting a soft lead pencil, a charcoal pencil, a crayon, etc.
Fasten the wood stand securely to the wood base by nailing upward from underneath the
wood base. The wire (or cord) attached to the back and side of the wood stand will help to
keep it stable.
3. Fasten the screw securely into one end of the wood beam. This screw will rest against the
wood stand so that the wood beam hangs level over the base. To help the screw stay in place
and not slip off of the wood stand, drill or carve a small hole 1/4-inch deep out of the stand
and slightly larger in diameter than the screw head. The head of the screw can sit in this hole
and press against the wood stand.
4. Both the adding machine paper roll and the smooth can should be able to rotate. The
smooth can rotates when you crank the nail at one end of its wood dowel; the paper roll can
turn either with its wood dowel or separately from the dowel. Tape down the end of the paper
roll onto the can so that when you crank the can, the paper should wind up around the can
and cause the paper roll to rotate as it feeds paper to the can.
5. If you want to be creative, see if you can devise a way to make the paper roll feed onto the
smooth can automatically so that you do not have to crank the can by hand. You might try
buying a miniature battery-operated motor that can turn the wood dowel of the can.
C. Testing the Seismograph
Here are some ideas for testing the seismograph. You can probably think of other ideas on
your own. Have a helper jump up and down on the floor near the seismograph.
a. How does the seismogram change as the jumping person moves farther away?
Make measurements with the person at a distance of 0.5, 1, 2, 4, 8, and 16
meters away from the seismograph. Make a graph of seismogram peak height
(in cm, y-axis) vs. distance of your helper from the seismograph (in m, xaxis). You could also use the seismograms themselves on your display board.
b. How does the seismogram change if the person jumping is heavier or lighter?
Pick a distance from your first experiment where the pen moved noticeably,
but did not cover its full range of motion on the paper. Make a series of
seismograms with helpers of different weights jumping up and down at that
fixed distance from the seismograph.
c. How does the seismogram change when you vary the substrate on which it is
standing? For example, compare placing the seismogram on a wooden floor
vs. a concrete slab (like your garage floor), or on a table vs. directly on the
floor, or on your lawn vs. a hard-surfaced playground.
Variations
What do you think will happen if you use a lighter weight on the horizontal rod of
your seismograph? If you use a heavier weight?
Another way to test the seismograph would be to drop a box containing objects with
increasing mass at different distances from the seismograph. For example, you could
use 20-pound sacks of dry rice, or an increasing number of books. Use a bathroom
scale to measure the weight of the box. You can also try this test on different
substrates (wood floor vs. concrete slab).
Advanced: Can you think of ways to improve the seismograph? Or can you think of
different way to measure seismic waves? Draw a clear diagram that shows and labels
all parts. Then write a paragraph explaining how your design works. Here are some
important considerations as you are coming up with your design:
o
Is it made of common inexpensive materials found in a local store?
o
Will it be able to determine the relative magnitude (size) of each vibration it
measures?
o
Will it be able to measure vibrations continuously for at least 1 minute?
o
Will it be able to measure even slight vibrations (such as a person jumping up
and down next to your seismograph)?
Gather the materials you need and build the seismograph you designed. Be prepared
to show other students how your device works (UC Regents, 1995).
From: http://www.sciencebuddies.org/science-fair-projects/project_ideas/Geo_p017.shtml
CUPCAKE GEOLOGY- SIMULATING CORE SAMPLE DRILLING
Background:
Geologists take core samples of the earth to find out what is beneath the
surface. By examining the soil profiles, geologists can interpret what a cross
section probably looks like based on the information obtained from the
samples. Sampling is an important method used to gather data.
Question:
How can soil profiles be used to show the interior of the earth?
Materials:
Cupcakes, paper plates, clear plastic straws, plastic knives
Procedure:
1. Inspect your cupcake. Do not touch, peel, or eat! Draw a picture of the
outside of the cupcake.
2. Draw a cross section of what you think the interior of the cupcake looks
like.
3. Using the straw, collect 5 core samples from different locations on top of
your cupcake. Remove each sample from the straw by placing a finger
and thumb above the sample, squeeze the straw, and then pull down. The
sample will easily come out. Place the samples side by side on the plate
and number them one through five.
Gather data:
Sample 1
Sample 2
Sample 3
Sample 4
Sample 5
Analyze data:
4. Using the information from the soil profiles above, draw a cross section of
what you now think the interior looks like.
5. Peel the cupcake and cut in half using the plastic knife. Draw and color
an accurate cross section of your cupcake.
DRAWINGS:
1. Cupcake Exterior
2. Prediction: Cupcake Interior
3. Interior of Cupcake according to
Core Samples
4. Accurate Cross-Section
Questions:
1. How did using core samples help to get a more accurate
picture of the interior?
2. How is this lab similar to what geologists do in their work?
Teacher Notes:
For added complexity, you may inject different colored
frosting inside the cupcake before giving it to students.
You may also prepare different layered cakes and give
students cut servings (cover the sides with wax paper).
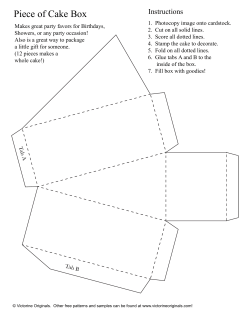
Layers of Cake Geology: An Exercise to Simulate
Core Sample Drilling
Introduction:
In this activity, a layered cake with the top decorated to resemble a grid is
created. The class is assigned a section of the grid to “sample” and at the
end the whole class comes together with a representation of interior layers
of the cake.
Anticipated Learning Outcome: Students will interpret "core samples" to
determine rock structures beneath the land surface.
Teacher Preparations (See last page for a more detailed description):
Multiple-layer cake prepared according to the following instructions:
Use moist pound cake (or other dense, coherent cake) mix. (One mix is
sufficient for whole class activity if layers are made thin enough.)
Bake four to six thin cakes, (each between 0.5 and 2.0 cm thick), each a
different color (mix in food coloring before baking). Use square or
rectangular pans.
Stack the cakes in any order. Apply icing (of any kind) between the
layers but not on the top or sides of the cake. You may decide to introduce
variations such as almond pieces, marshmallows, etc. Check for any
student allergic to nuts.
Decorate the top by drawing lines until a grid is formed. Use toothpicks
to identify corners of the grid.
Knife for cutting cake
Three transparent plastic tubes (diameter between 1 and 2 centimeters)
at least as long as the cake is high. Clear drinking straws could be used,
but tubes of wider diameter (those used for tapioca drinks or milk
shakes) produce better results.
Decorate the top with a grid.
Name:____________________________
Date:________________
Period Number: _______________
Layers of Cake Geology: An Exercise to Simulate
Core Sample Drilling
Introduction: In this activity, a layered cake, heavily frosted top and sides,
will be used to simulate a series of rock layers. As a geologist, you will
„sample‟ a section of the cake by using thick plastic straws. Based on the
core samples your group collects, you should be able to predict what the
interior of the cake looks like. At the end, the whole class will compare data
to determine whole cake layer structure.
Instructions:
1. You or your group should be supplied with a straw, journal pages, colored
pencils, and a ruler. (Straws can be cut to a length slightly higher than the
cake.)
2. Look at the layer cake (provided by your teacher). How can you learn
more information about the cake without peeling the foil back or cutting
the cake open? Draw what you think the inside of the cake looks like in
your journal. What type of cake is under the icing? Is there a filling inside?
Make your best hypothesis.
3. The surface of the cake should have a grid outlined on it with toothpicks
(your teacher should have it prepared this way). Notice where “North” is
located on the cake. You or one person from your group should use the
straw to "drill" into the cake. Hold the straw vertically (up and down), and
push it straight down into the cake. By placing your thumb or finger on the
top of the straw as you pull it out, you should get a "core sample" with your
straw. Your sample will show the different layers inside of the cake. Be sure
to record where on the cake you have drawn your sample (using the grid).
4. On your journal page, draw the core sample. What kinds of layers are in
the cake? Describe the composition of your layers. Was your hypothesis
correct?
5. Compare your core sample with others in the class. Is the cake the same
throughout? Once each student or group is finished analyzing their core
samples, cut the cake and see how it compares to the samples. Did the
core samples adequately represent the composition of the whole cake?
(The teacher may decide whether students may eat the cake after this
activity.)
NAME: ___________________________
PERIOD NO. ___ DATE: ____________
Layers of Cake Geology
1. HYPOTHESIS:
Draw what you expect to see (remember to label important information):
2. Written description of your hypothesis:
______________________________________________
______________________________________________
______________________________________________
______________________________________________
__________________________________________________________________
__________________________________________________________________
________________________________________________________
Reasons for this prediction:
__________________________________________________________________
__________________________________________________________________
____________________________________________________________
2. ANALYSIS
Where is your sample from? (coordinates of
“core sample”)
__________________________________________
__________________________________________
__________________________________________
__________________________________
Draw your “core sample,” labeling different layers:
Describe the layers in your “core sample.” How are the layers similar? How
are they different?
__________________________________________________________________
__________________________________________________________________
__________________________________________________________________
__________________________________________________________________
________________________________________________________
Was your hypothesis correct? Why or why not?
__________________________________________________________________
__________________________________________________________________
__________________________________________________________________
___________________________________________________
How do you think this is like collecting core samples of sediment from the
ocean floor? How is it different?
__________________________________________________________________
__________________________________________________________________
__________________________________________________________________
__________________________________________________________________
__________________________________________________________________
__________________________________________________________________
____________________________________________________
From:
http://oceandrilling.coe.tamu.edu/curriculum/Sediments/activity2.htm
Teacher Pages…
Preparation Instructions
Materials:
-2 pkgs White Cake Mixes
-1 pkg Chocolate Frosting
-1 Rectangular Foil Baking Pan
-Food Coloring
-Toothpick (or Tube Icing)
Directions:
Make a layer cake with at least three layers of colored batter. Mix 2 cake
mixes together. Take approximately 1/3 of the batter and set aside. Take
the remaining 2/3 of the batter and divide in 3 or 4 (depending on number
of colors used) small bowls to color. Add a different food coloring to each
bowl so that the color will show up in the batter. Layer all of the colors of
batter together in a baking pan. Use different patterns and thickness for
different layers. Also, leave some parts colorless.
Baking time and temperature will have to be estimated depending on
cake mixes used. Temperature should be 25 degrees lower than directions
on the mixes and time will probably be 10-20 minutes longer since you are
using two mixes. Check the center of the cake with a toothpick for
doneness to be sure. Toothpick should be clean and the cake should have
its sides just pulling away from the pan. Once the cake is cooled, frost the
cake in the pan to make sure all of the cake and colors are covered by the
icing.
With a toothpick or with the tube icing, make a grid on the cake and
indicate which direction is north. This can be done immediately before the
activity is started in the classroom. Students will know where their sample is
from by referring to the grid on the cake.
From: http://oceandrilling.coe.tamu.edu/curriculum/Sediments/activity2.htm
Layer upon Layer: Simulation of Core Drilling
(Clay Activity)
Teacher Preparation Instructions:
Materials:
-clay or Playdoh® in several colors
- large spices (not powdery- for example: parsley, course pepper,
whole cloves)
-a thick tray or container for the layers
Directions:
Using the Playdoh® or clay of several colors, make a series of different
colored layers. Within some of the layers, mix small spices such as course
pepper, dried parsley, and/or sesame seeds. These small items will simulate
different textures found in different layers of real-world sediments and fossils.
Have some layers not cover the entire container. You can fold or indent
the clay layers as needed to simulate faults or other conditions in the
sediment layers.
Description of Activity (Student set of Instructions):
1. Each group or student should have a plastic straw (with a large
diameter) and a single edge razor (or exact-o knife or small, sharp scissors).
2. Make a hypothesis about the different layers of clay. What will the layers
look like? What do you think you will find? You may draw your hypothesis on
a journal page.
3. Each student or one person from each group should take a core sample
of the clay layers with the straw. (Stick the straw straight down into the clay
layers and pull up. The clay layers should be captured by the tube, giving
you a core sample.) Using the razor or knife, carefully cut away the straw
from the clay. You will be left with a long, round core sample of the
different layers.
4. Draw the layers that you see. What is different about the layers? Which
one was laid down first? Which one is newest?
5. The student or groups may compare samples from different parts of the
clay layers. Is the clay the same throughout? Have students share what
they see/found in their core samples.
Layer upon Layer: Simulation of Core
Sample Drilling
Name:______________________
1. HYPOTHESIS:
Date:_______________________
Period Number: _____________________
Draw what you expect to see (remember to label important information):
Written description of your hypothesis:
__________________________________________________________________
__________________________________________________________________
__________________________________________________________________
__________________________________________________________________
__________________________________________________________________
______________________________________________________
Reasons for this prediction:
____________________________________
____________________________________
____________________________________
____________________________________
____________________________________
____________________________________
____________________________________
2. ANALYSIS
Draw your “core sample,” labeling different layers:
Describe the layers in your “core sample.” How are the layers similar? How
are they different? Which one was laid down first? Last?
__________________________________________________________________
__________________________________________________________________
__________________________________________________________________
__________________________________________________________________
__________________________________________________________________
__________________________________________________________________
____________________________________________________
Was your hypothesis correct? Why or why not?
__________________________________________________________________
__________________________________________________________________
__________________________________________________________________
___________________________________________________
How do you think this is like collecting core samples of sediment from the
ocean floor? How is it different?
_________________________________________________________________________
_________________________________________________________________________
_________________________________________________________________________
_________________________________________________________________________
_________________________________________________________________________
______________________
From: http://oceandrilling.coe.tamu.edu/curriculum/Sediments/mudex2.doc
MAPPING THE OCEAN FLOOR
I. Background Information:
The ocean floor can be mapped by sounding: sound is sent from a ship’s transmitter to the
ocean bottom at an angle. The sound bounces back to the ship at the same angle and is picked
up by a receiver. The speed of sound in sea water is about 1,507 meters per second. By using
this information and applying a formula, ocean depth can be measured and mapped. In this
activity your students will use data to map a section of the ocean floor. In this activity, you
will use a formula to solve a problem. Then, you will use a two-dimensional coordinate
grid to represent data points and to graph a simple figure that communicates the concept of
ocean depth. Have fun plotting!
II. Materials:
copies of Mapping the Ocean data sheet on page 20 and Mapping the
Ocean funsheet
pencil and paper
calculators
III. Teacher Instructions:
1. Describe the process of how the ocean
floor can be mapped using sounding. Write
the formula for measuring ocean depth on
the board.
2. Distribute Mapping the Ocean data
sheet and funsheet to each student.
Explain that they are looking at data that
was gathered from a ship that was moving
straight out from shore.
Every 10 km the ship stopped to collect
sounding data.
3. Students use the sounding formula and
the time information given to determine
the depth of the ocean at each data point.
They record these depths on the data
sheet. (Suggestion:
ask students to round their calculations to
the nearest 100 meters.)
4. Next, students map the ocean floor on
the Mapping the Ocean funsheet. They
locate the distance from shore across the x
axis, and then plot the correct depth
(rounded to the nearest 100 meters) on the
y axis.
A Watered-Down Topographic Map
FOCUS
Bathymetric and topographic contour mapping
FOCUS QUESTIONS
How can a two-dimensional map be created showing the three-dimensional nature of a
landform?
What are topographic maps and bathymetric charts?
LEARNING OBJECTIVES
Students will create a bathymetric map of a model underwater feature.
Students will interpret a simple topographic or bathymetric map.
Students will explain the difference between topographic and bathymetric
maps.
Students will create models of some of the undersea geologic features studied
in ocean explorations.
MATERIALS PER GROUP OF FOUR STUDENTS
_ A square quart plastic food storage container at least 7 cm deep
_ 500-700 ml of water in measuring cup or bottle
_ Small plastic funnel
_ 10 cm plastic ruler (can be made by photocopying a ruler repeatedly on an overhead acetate)
_ Overhead projector acetate cut to fit food container top
_ Felt tip waterproof marker
_ 12 inches of masking tape
_ Scissors
_ Two sticks of modeling clay – two colors
_ Student Handouts
AUDIO/VISUAL MATERIALS
_ Overhead projector
TEACHING TIME
Two 45-minute periods
SEATING ARRANGEMENT
Cooperative groups of up to four students
KEY WORDS
Topographic
Contour interval
Depth
Ridge/bank
Bathymetric
Relief
Submarine canyon
Rift/mid-ocean ridge
Contour line
Elevation
Seamount
Continental shelf
Background Information for the Teacher:
This activity serves two purposes: it introduces your students to contour maps—both
bathymetric and topographic—and it introduces them to the geologic features that many
explorers study. Bathymetric mapping is a major part of many of the OE expeditions since our
understanding of the ocean floor starts with knowing what it looks like. We do not know
much at this point.
Topographic maps are tools used by anyone in need of knowing his/her position on Earth in
relation to surrounding surface features. A topographic map is a two-dimensional map
portraying three-dimensional landforms. Geologists, field biologists, and hikers are just a few
who routinely use topographic maps.
Bathymetric maps (also called charts) are topographic maps of the bottom features of a lake,
bay or ocean. They are very similar to topographic maps in their terminology and
interpretation. The primary difference is that bathymetric maps show depth below sea level
while topographic maps show elevation above sea level. Another difference is the limited data
available to create a bathymetric map when compared to a topographic map. The skill needed
to see two dimensions on a map and visualize three dimensions can be a difficult for students.
Interpreting familiar topographic maps provides practice in this skill. This exercise will build
an understanding of the relationship between a two-dimensional representation and a threedimensional landform. Both topographic and bathymetric maps use contour lines to show
elevation or depth. Contour lines are imaginary lines connecting points of the same elevation
or depth. A contour interval is the predetermined difference between any two contour lines.
A contour interval of 100 feet means that the slope of the land or sea bottom has risen or
declined by 100 feet between two contour lines. A map that shows very close contour lines
means the land is very steep. A map that has wide spacing between contour lines has a gentle
slope. The smaller the contour interval, the more capable a map is of depicting finer features
and details of the land. A contour interval of 100 feet will only pick up details of features larger
than 100 feet. It also means that a seamount could be 99 feet higher in elevation than the map
depicts.
Because one cannot usually easily see beneath the water, the difference between what is
mapped and the reality of what actually exists is greater on bathymetric maps. With the advent
of new, more sophisticated ocean floor sensing technology, bathymetric maps are becoming
much more detailed, revealing new information about ocean geology.
Teacher Instructions:
1. Distribute the plastic food storage containers and sticks of clay to each group, along with a
card describing an underwater feature (these same features also occur on dry land). Each
group should read the card and build a clay model to match the description written on the
card. The model may not extend above the top of the container. For ease of construction, they
may assemble them on the desk and then install them in the container. Allow them to consult
the OE web site or CD or oceanography texts if they need help visualizing the descriptions.
2. Challenge the students to create a two-dimensional map of their three-dimensional
underwater feature that would visually interpret it for other groups of students.
3. Help them think this through as a group. Draw a large circular shape on the board. Ask the
students what they think the drawing represents. Guide the answers, if necessary, toward maps
of landforms, such as a pond, an island, a race track circuit, and so on. Could it be the base of
an underwater mountain? Draw a side view of an undulating mountain directly below and
matching the horizontal margins of the circle. Tell the students the two drawings represent the
same thing, but from a different perspective. Ask the students again what they think the
circular shape and the new side view of the circular shape represents. A mountain should be
one of the obvious answers. How can we combine the two dimensions of the circle with the
third dimension—height—in the second drawing on a flat map?
4. Hand out the Student Handouts and ask them to follow the instructions. When the
equipment is ready, have the students check with you to make sure they set up correctly.
Depending on your students’ abilities you may have all setups complete and proceed as a class
through drawing of the contour line. Some classes will take off and do this very well on their
own. Having completed the first contour line, have the class add water to the first centimeter
mark on the ruler, reminding them to take care when pouring the water into the funnel.
Remind them about accuracy in measurement also. Once they draw the second contour line
they may work at their own speed.
5. When the ―maps‖ are completed, introduce the terms topographic and bathymetric maps
and discuss contour lines to make sure the concept is clear.
6. Have the students remove the water from their models and display the models with the
maps.
Pass around a model and challenge the students to pick the map that represents it from the
maps displayed on the overhead projector.
7. During this oral assessment of understanding, show an overhead projection which is 180
degrees opposite in perspective to the view the students have of the respective feature. This
not only tests the students understanding of topography with respect to the orientation but
also reinforces the value of compass directions on maps.
8. Have students use the Ocean Exploration CD or web site to find and list the expeditions
that explore each of the geologic features listed here: ridge/bank, submarine canyon, seamount
or mid-ocean ridge/rift. Have them finds maps and/or illustrations of the features in this
exercise, print them out, label them and put them up in the bulletin board. Also look for
bathymetric maps that show the same features.
Layers of the Atmosphere
Foldable
Introduction:
The atmosphere is divided into five layers. It is thickest near the surface and thins out with
height until it eventually merges with space. Here’s a brief description of each of the layers:
1) The troposphere is the first layer above the surface and contains half of the Earth's
atmosphere. Weather occurs in this layer.
2) Many jet aircrafts fly in the stratosphere because it is very stable. Also, the ozone layer
absorbs harmful rays from the Sun.
3) Meteors or rock fragments burn up in the mesosphere.
4) The thermosphere is a layer with auroras. It is also where the space shuttle orbits.
5) The atmosphere merges into space in the extremely thin exosphere. This is the upper limit
of our atmosphere.
(From: http://www.windows2universe.org/earth/Atmosphere/layers.html)
Instructions:
1. Fold a piece of light blue paper in half hamburger bun-style.
2. Open flat and then fold each side toward the center fold - shutter-style.
3, Color the long dark lines that represent temperatures changes: from the
bottom -- blue, red, blue, red, representing decreasing, increasing,
decreasing, increasing temperatures.
4. Carefully cut out the diagram of the atmosphere. Fold in half
lengthwise and cut apart. Paste each half onto the front shutters of the
light blue paper. Paste toward the bottom so you have room for a title at
the top.
5. Cut the two parts of the title out and paste on the top of the shutters.
6. Cut out the boxes that contain the characteristics of each of the eight layers of the
atmosphere. Paste inside the foldable under the correct layer. Be sure to put the main layers on
the inside left and the minor layers on the inside right.
7. Cut flaps for each of the layers on the front shutters.
8. Carefully cut out the small sketches ONE AT A TIME. Read the words that tell you where
to paste the sketch and paste to the front of the foldable on the diagram of the atmosphere.
Do NOT cut out the words that tell you where to paste each sketch!
9. Fill in the Name Tag and paste on the back.
Questions:
1. List the four main layers.
2. List the four minor layers.
3. Which two minor layers of parts of a main layer?
4. Which layer is the most important to you and why?
5. What two layers protect you?
6. Which layer acts like a giant magnet? What does it attract?
7. What does the air in the troposphere do as it heats up from the sun?
8. What cloud indicates the top of the troposphere?
9. What runs along the top of the troposphere?
10. What attaches itself to this jet stream and, in a sense, tells you where the stratosphere
begins?

© Copyright 2026