
“LED BLU/BLU Large-size” SAMPLE 2011년 6월
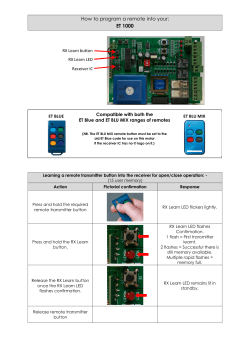
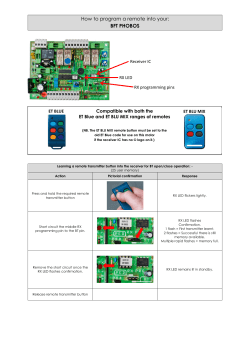
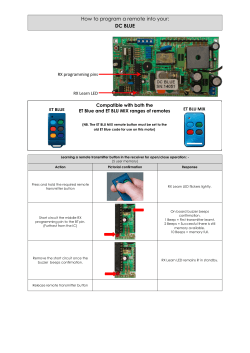
“LED BLU/BLU Large-size” 산업 동향 및 분석 SAMPLE www.Displaybank.com [email protected] 2011년 6월 This sample is designed to help understand the composition of the report and the type of description. http://www.displaybank.com 장/단기 대형 BLU 시장 전망 LED BLU 진입률 전망 주요 제품 원가 분석 LED BLU 개발 동향 가격 동향 및 산업 이슈 브리핑 Copyright© Displaybank. Do not copy or distribute. Contents remain the property of Displaybank. Displaybank Co., Ltd., Confidential Copyright© Displaybank. Do Copyright© not copy or distribute. Contents remain the property of Displaybank. Page : 1/100 Contents Chapter 1. Introduction Chapter 2. Long-term Market Forecast (2008~2014) Chapter 3. Overseas LCM & BLU Trend Chapter 4. Short-term Market Forecast (8Q) Chapter 5. LED BLU Development Trend Chapter 6. Large-size BLU Cost Analysis Chapter 7. Large-size BLU Supply Chain Chapter 8. Industry Issues Briefing Appendix 1. BLU Industry Infrastructure Appendix 2. TFT-LCD Line Status by Maker Copyright© Displaybank. Do not copy or distribute. Contents remain the property of Displaybank. Copyright© Displaybank Co., Ltd., Confidential Page : 2/161 2/100 1. Introduction 1.1. Outline and Composition 이 리포트는 통상 10” 이상급의 대형 LCD 모듈에 쓰이는 BLU에 한정하여 분석하고 전망하는 것을 목적으로 한다. 대형 BLU의 용도는 모니 터용, 노트북용, TV용, 태블릿PC 그리고 산업용 등에 쓰이는 기타 용도로 구분하여 분석하고 있다. 따라서 해당 리포트에서 이후 언급되 는 'BLU'라는 용어는 모두 이러한 용도로 쓰이는 BLU를 지칭하고 있다. 태블릿PC용 BLU의 경우 기존까지는 대형 BLU로 포함하지 않았으나, 태블릿PC가 7”, 8”, 8.9”는 물론 9.7”, 10.1” 등 10” 이상까지 확장하는 추세라서 포함시키게 되었다. 2장에서는 BLU 시장에 대해 2008년부터 2014년까지의 시장 규모에 대해 수량과 금액으로 분석하고 전망한다. 용도별 시장 및 가격의 변화 동향 전망을 통해 향후 시장의 성장성을 볼 수 있다. 더불어 국가별로 시장을 전망하고 있다. 또한 어플리케이션별 LED 타입별 LED BLU의 시장 침투에 대해 예측하고 있다. 3장에서는 패널 제조사들의 LCD 모듈(LCM) 공장들이 중국 및 동유럽 등 해외로 이전함에 따라 대다수 BLU 기업들이 중국 등에 생산 기지 를 구축하고 있다. 해외에서의 BLU 생산을 분석하고 전망하여 산업의 패러다임 이동을 수치적으로 살펴 보고 있다. 또한 최근 LCD 기업들 의 유럽 및 아시아 지역 LCM 공장 진출에 대해서도 다루었다. 4장에서는 시장에 대한 단기 전망을 다루고 있다. 2010년 3분기부터 2012년 2분기까지의 시장을 분기별로 전망하고 있다. 각 용도 및 대표 인치에 대한 가격 전망과 시장 규모를 분기별로 면밀하게 전망하고 있다. 5장에서는 LED BLU의 개발 동향을 어플리케이션별로 다루고 있다. 주요 기업들의 개발 동향 및 제품 출시/개발 동향과 예상 라인업 등을 살펴볼 수 있다. 6장에서는 용도별 대표 인치 CCFL 및 LED BLU 제품에 대한 원가분석을 다루고 있다. 모니터용으로는 22" CCFL, 22" 백색 LED BLU 제품을 분석하고 있으며, 노트북용으로는 15.4“W CCFL 및 LED BLU, 그리고 12.1"W LED BLU 제품을 다루고 있다. TV용 BLU에 대해서는 32“W와 40“W, 55”W 세 개 인치 제품을 분석하고 있다. 40“W, 55”W에 대해서는 백색LED를 채용한 LED BLU와 CCFL를 채용한 제품에 대한 원가를 분석하고 있다. 백색LED 채용 제품에 대해서는 직하형 타입과 에지형 타입을 구분해서 분석했다. 7장에서는 공급사슬과 시장점유율 현황을 다루었다. 특히 LED BLU 부문을 따로 다루었다. 8장에서는 산업의 이슈를 정리하고 분석하여 보여주고 있다. 현재 산업에서 중요하게 다루어지는 이슈 부문에 대한 분석을 보여준다. 마지막으로 BLU의 각종 부품에 대한 재료와 각각의 부품 및 소재를 공급하는 기업들을 참고할 수 있도록 Appendix 1에서 다루었으며, 패 널 기업들의 캐파 증강 현황을 Appendix 2에서 다루었다. Copyright© Displaybank. Do not copy or distribute. Contents remain the property of Displaybank. Copyright© Displaybank Co., Ltd., Confidential Page : 3/161 3/100 2. Long-term Market Forecast 2.1. Unit 2.1.2. By Application [Fig.] Large-size BLU Market Forecast by Appl. (Unit, %) [Fig.] Large-size BLU Market Forecast by Application (Unit) 100% 1,200 90% 1,000 23% 80% 800 Mil. Unit 3% 0% 28% 2% 3% Tablet PC TV 60% 31% 33% SAMPLE 200 - 1% 1% 15% 16% 32% 31% 31% Others Tablet PC 32% TV 30% 29% 29% 30% 26% 24% 23% 2011 2012 2013 (Mil. Unit) 2014 CAGR 227.6 3.8% 289.4 13.6% 299.4 20.0% 152.7 7.1 -7.5% 976.1 14.7% 2014 40% Monitor www.Displaybank.com 30% [email protected] 20% 43% 36% 31% This sample is designed to help understand the composition of the report 28% 10% and the type of description. 400 1% 13% 31% 50% Notebook 1% 10% 32% 70% Others 600 2% 0% Notebook Monitor 0% 2008 2009 2010 2011 Monitor Notebook TV Tablet PC Others Total • • • 2012 2013 2008 182.3 134.9 100.2 0.0 11.3 428.7 2014 2009 189.0 174.2 149.5 0.0 12.3 524.8 2008 2010 202.6 212.8 210.5 19.7 10.7 656.3 2011 204.8 226.4 233.4 72.0 8.0 744.6 2012 213.4 239.9 260.1 104.2 7.9 825.5 2009 2010 2013 219.5 261.2 282.0 Sample 133.6 7.2 903.4 모니터용, 노트북용, TV용의 CAGR은 각각 4.7%, 13.6%, 20.4% 2010년부터 수요가 시작된 태블릿PC용 BLU는 2012년에는 1억 개를 넘어설 것으로 예상 모니터용 BLU의 비중이 지속적으로 감소하여 2014년에는 23%까지 줄어들 것으로 보임 Copyright© Displaybank. Do not copy or distribute. Contents remain the property of Displaybank. Copyright© Displaybank Co., Ltd., Confidential Page : 4/161 4/100 2. Long-term Market Forecast 2.4. LED BLU Penetration Forecast (Unit base) 2.4.1. LED Penetration Forecast by Application [Fig.] LED BLU Penetration Forecast by Appl. (Unit base) 100% 90% 80% 70% Monitor LED 60% Notebook LED 50% SAMPLE 40% www.Displaybank.com [email protected] 30% TV LED Tablet LED Total LED 20% This sample is designed to help understand the composition of the report 10% and the type of description. 0% 2008 2009 2010 2011 2012 2013 2014 Monitor Notebook TV Tablet PC Total • • LED LED LED LED LED 2008 0.3% 10.4% 0.2% 2009 1.4% 63.6% 3.0% 3.5% 22.5% 2010 13.1% 86.2% 18.1% 100.0% 40.9% 2011 41.9% 98.1% 39.5% 100.0% 63.6% 2012 2013 65.2% 83.4% 100.0% 100.0% Sample 74.5% 59.1% 100.0% 100.0% 77.5% 87.7% 2014 97.5% 100.0% 85.8% 100.0% 94.9% 노트북용 LED BLU의 진입률은 2008년에 10%였으며, 2010년에는 86.2%로 크게 증가하였음 TV용 LED BLU의 진입률은 2009년에 3.0%, 그리고 2014년에는 85.8%까지 성장할 것으로 전망 Copyright© Displaybank. Do not copy or distribute. Contents remain the property of Displaybank. Copyright© Displaybank Co., Ltd., Confidential Page : 5/161 5/100 2. Long-term Market Forecast 2.4. LED BLU Penetration Forecast (Unit base) 2.4.3. Notebook BLU Market Forecast by BLU Type (Edge/Direct LED, LED, CCFL) [Fig.] Notebook BLU Demand Forecast by BLU Type (Unit, %) [Fig.] Notebook BLU Demand Forecast by BLU Type (Unit) 100% 350 90% 300 80% Mil. Unit 250 70% LED Others 200 WLED Direct 64% 60% SAMPLE WLED Edge 150 LED Others 86% 98% 50% 100% 100% 100% 40% CCFL www.Displaybank.com [email protected] 30% 100 50 0 2009 2010 2011 k CCFL WLED Edge WLED Direct LED Others Total • 2010 29.4 183.3 0.0 212.8 2011 4.2 222.2 0.0 226.4 2012 239.7 0.2 239.9 WLED Edge CCFL This sample is designed to help understand composition of the report 20% the36% and the type of description. 10% 14% 2% 0% 0% 2012 2013 2014 2009 2010 2011 2012 2009 63.3 110.8 0.0 174.2 WLED Direct 2013 260.9 Sample 0.3 261.2 2014 289.0 0.4 289.4 0% 2013 (Mil. Unit) CAGR -100.0% 21.1% 95.5% 10.7% 0% 2014 * LED Others: RGB, Hybrid, etc 노트북에서는 늦어도 2012년에는 100% LED BLU를 채용할 것으로 보임 Copyright© Displaybank. Do not copy or distribute. Contents remain the property of Displaybank. Copyright© Displaybank Co., Ltd., Confidential Page : 6/161 6/100 2. Long-term Market Forecast 2.6. Demand Forecast by Nationality 2.6.2. Monitor [Fig.] Monitor BLU Demand Forecast by Nationality [Fig.] Monitor BLU Demand Forecast by Nationality 100% 120 90% 100 10% 0% 13% 0% 15% 15% 16% 17% 0% 0% 0% 0% 43% 42% 42% 41% 40% 80% 70% 80 Mil. Unit 10% 0% Korea 60% 54% 45% SAMPLE Taiwan 60 Japan Japan 50% Taiwan 40% China www.Displaybank.com [email protected] 30% 40 Korea This sample is designed to help understand the composition of the report 45% 44% 43% 20% and the type of description.35% 20 China 43% 43% 43% 2012 2013 2014 10% 0 0% 2008 2009 2010 2011 Korea Taiwan Japan China Total 2012 2008 64.4 98.7 0.1 19.0 182.3 2013 2014 2009 84.7 85.4 18.9 189.0 2008 2010 89.2 87.9 25.5 202.6 2011 88.1 86.0 30.7 204.8 2012 91.6 89.6 32.2 213.4 2009 2013 93.9 90.0 Sample 35.6 219.5 2010 2011 (Mil. Unit) 2014 CAGR 97.9 7.2% 91.0 -1.3% - -100.0% 38.7 12.5% 227.6 3.8% Copyright© Displaybank. Do not copy or distribute. Contents remain the property of Displaybank. Copyright© Displaybank Co., Ltd., Confidential Page : 7/161 7/100 3. Overseas LCM & BLU Production 3.1. Overseas LCM Status 3.1.2. In China (Panel Makers) [Table] TFT-LCD Makers’ Independent LCM Lines in China Company AUO Nationality Operation Province Taiwan LG Display Korea Samsung Korea CMI (Innolux) Taiwan CMI (CMO) CMI (TPO) CPT HannStar • • • • • • City Beginning Q2'02 Jiangsu Suzhou Q3'07 Q3'04 Fujian Shanghai Xiamen Songjiang Capa. Product Remark (Mil./Month) 4.5 MNT, NB, TV 0.5 TV 1.9 MNT, NB Q2'03 Q1’08 Q3'03 Jiangsu Nanjing Guangdong Guangzhou Jiangsu Suzhou 4.5 MNT, NB, TV 1.3 TV, MNT 5.5 MNT, NB, TV Q2'03 Q2'09 Guangdong Shenzhen Fujian Xiamen 2.5 MNT 0.5 MNT, TV Q4'05 Q3'07 Q2'03 Zhejiang Ningbo Guangdong Foshan www.Displaybank.com [email protected] Nanjing 6.0 MNT, NB, TV 1.3 TV 0.6 MNT, NB, Tablet PC SAMPLE Taiwan Q2'03 Jiangsu Wujiang 1.7 MNT, NB, TV This sample is designed to helpFuzhou understand the composition the report Q4'04 Fujian 1.0 MNT,ofNB and the type of description. Q3'06 Guangdong Shenzhen 0.3 MNT, TV Taiwan Q3'02 Jiangsu Nanjing 1.2 MNT, NB TMD Sharp Hitachi Japan Japan Japan E Ink Holdings Taiwan Q1'04 Q2'03 Q1'02 Zhejiang Jiangsu Jiangsu Hangzhou Nanjing Suzhou 0.5 NB 0.5 TV 0.3 TV Jiangsu Yangzhou 0.5 Tablet PC Transcend Optronics * 대형 패널에 대한 캐파 대만과 한국의 주요 패널 제조사들은 모두 중국에 LCM을 가동 중 2002년 AUO를 시작으로 중국 본토에 LCM 공장을 세우기 시작하여, 2008년 초까지 독자적인 중국 LCM 진출이 이루어졌음 초기 중국으로의 LCM 진출은 중국의 값싼 노동력을 활용하여 LCM 제조 비용을 줄이기 위한 목적이 컸음 초기 수저우, 난징, 상해 인근 위주였던 것이 광저우나 후지안 지역으로 이동했음 (중국 로컬 제조사와 가까이 위치하기 위해) 최근에는 독자적으로 해외에 LCM을 진출하는 사례는 없어졌으며, 리스크 최소화를 위해 세트 고객과 JV를 통해 LCM 진출 중 패널 제조사들은 기존 LCM에 대한 캐파 증강은 BLU 제조사와 협업하는 것이 일반화되고 있음 (주요 BLU 제조사들은 이미 LCM 사 업을 OEM으로 영위) Copyright© Displaybank. Do not copy or distribute. Contents remain the property of Displaybank. Copyright© Displaybank Co., Ltd., Confidential Page : 8/161 8/100 4. Short-term Market Forecast (8Q) 4.3. Notebook 4.3.1. NotebookNotebook-use BLU by Size [Figure] Short-term Notebook-use BLU Market Forecast by Size (Q3’10~Q2’12) 70 60 50 SAMPLE www.Displaybank.com [email protected] Mil. Unit 40 30 This sample is designed to help understand the composition of the report and the type of description. 20 10 0 Q3'10 • Q4'10 Q1'11 Q2'11 Q3'11 Q4'11 Q1'12 Q2'12 20"W< 19"W 18.4"W 17.3"W 17"W 16.4"W 16"W 15.6"W 15.4"W 15" 14.5"W 14.1"W 14.1" 14"W 13.4"W 13.3"W 13.3" 13.1"W 12.5"W 12.1"W 12.1" 11.6"W 11.1"W 11"W 10.4" 10.2"W 10.1"W 노트북 역시 11.6”W, 14”W, 15’6”W, 17.3”W 등 신규 사이즈 진입으로 인치가 다양해지고 있으며, 와이드화 경향이 뚜렷 Copyright© Displaybank. Do not copy or distribute. Contents remain the property of Displaybank. Copyright© Displaybank Co., Ltd., Confidential Page : 9/161 9/100 5. LED BLU Development Trend 5.1. LCD TV 5.1.3. Development Trend by Maker – TV Panel [Figure] LCD TV Module Launching Plan with LED BLU in 2011 2011 Period 32 Size Direct Edge Direct 47 50 55 58 55 60 40 46 55 60 42 60/120Hz 32 37 240/480Hz 32 37 47 55 42 47 www.Displaybank.com [email protected] 42 47 55 50 55 65 70 70 60 60/120Hz 58 This sample is designed to help understand the composition of the report and the type of description. 240/480Hz 32 37 42 46 46 50 55 58 70 65 55 60/120Hz 240/480Hz 65 32 37 40 42 46 55 240/480Hz Direct 60 46 SAMPLE 240/480Hz 60/120Hz Edge 46 40 240/480Hz Direct Edge 32 60/120Hz 60/120Hz Edge 42 240/480Hz 240/480Hz Direct 40 60/120Hz 60/120Hz Edge 37 65 60/120Hz White LED - Edge 240/480Hz 60/120Hz 240/480Hz White LED - Direct 32 37 46 55 46 55 RGB LED - Direct * 2011년 패널 제조사들의 계획 및 양산을 기초로 한 예상 라인업이 포함 되었음 Copyright© Displaybank. Do not copy or distribute. Contents remain the property of Displaybank. Copyright© Displaybank Co., Ltd., Confidential Page : 10/161 10/100 6. Large-size BLU Cost Analysis 6.3. TV 6.3.2. 40” 40”W by CCFL Lamp [Table] 40”W TV-use CCFL BLU Cost Analysis Q2'11 No. CCFL 16.5% 15.2% 13.6% Diffusion Plate 1 3.1 7.0% 6.4% 5.7% DBEF Sheet 1 11.5 25.5% 23.4% 21.0% 1 2.3 5.2% 4.7% 4.2% 1 1.2 2.6% 2.4% 2.1% 4.4% 4.1% 3.7% 12.5% 11.4% Sample Mold Frame 5.0% 4.6% Inverter Circuit 4 7.2 16.0% 14.7% This sample is designed to help understand the composition of the report Others 2.4 5.3% 4.9% and the type of description. 10.2% Material Reflection Sheet Chassis Total Indirect Total Price (ASP) • • % in Cost % in Price 7.4 Diffusion Sheet Profit % in Material 12 Micro Lens Sheet Total Cost US$ SAMPLE 1 2.0 www.Displaybank.com 1 5.6 [email protected] 1 2.2 45.0 100.0% 4.1% 13.2% 4.4% 91.8% 82.3% 4.0 8.2% 7.3% 49.0 100.0% 89.6% 5.7 10.4% 54.7 100.0% 2011년 2분기 TV용 40”W CCFL BLU의 평균가는 54.7달러이며, 재료비 비중은 45.0달러 수준으로 분석 판가 대비 재료비 비중은 82.3% Copyright© Displaybank. Do not copy or distribute. Contents remain the property of Displaybank. Copyright© Displaybank Co., Ltd., Confidential Page : 11/161 11/100 6. Large-size BLU Cost Analysis 6.3. TV 6.3.3. 40” 40”W by White LED Lamp (Edge Type) [Figure] 40”W TV-use White LED BLU (Edge Type) BOM Chassis, 12.3% Mold Frame, 1.9% LED (bar), 31.3% Reflection Sheet, 2.6% SAMPLE Diffusion Sheet, 1.2% Prism Sheet, 3.0% DBEF Sheet Micro Lens Sheet Micro Lens Sheet LED & LGP Reflection Sheet Others, 8.5% www.Displaybank.com [email protected] This sample is designed to help understand the composition of the report and the type of description. DBEF Sheet, 12.0% LGP LED Driver, 12.2% Light Guide Plate, 14.9% … 52 LEDs (Mid-power LED) • • 재료비 중 LED bar의 비중이 31.3%, 도광판이 14.9%로 높은 비중을 차지 직하형 타입에 비해 LED 비용 및 LED 구동회로 비용이 적으나, 방열 및 도광판 비용 증가 Copyright© Displaybank. Do not copy or distribute. Contents remain the property of Displaybank. Copyright© Displaybank Co., Ltd., Confidential Page : 12/161 12/100 8. Issues Briefing 8.9. BLU for Tablet PC (Xoom, iPad 1, Galaxy Tab 1) BLU Film Stack Comparison Motorola Xoom MZ600 Apple iPad 1 6 Films SAMPLE 6 Films Samsung Galaxy Tab 1 5 Films www.Displaybank.com [email protected] This sample is designed to help understand the composition of the report and the type of description. • • • • • • Upper Diffusion Film Prism Film Prism Film Diffusion Film LGP : Molding LGP White PET Reflection Film • • • • • • Upper Diffusion Film Prism Film 1 Prism Film 1 Lower Diffusion Film LGP : Extrusion Printing LGP White PET Reflection Film • • • • • Prism Film Prism Film Diffusion Film LGP : Molding LGP Reflection : Ag Reflection Film (Source : Displaybank Reverse Engineering Report, ‘Motorola Xoom’) • • 모두 Reflection Film, LGP, Diffusion Film, Prism Film을 적용 Xoom의 경우 Diffusion Film을 2개 적용하면서 총 6장의 Film을 적용 Copyright© Displaybank. Do not copy or distribute. Contents remain the property of Displaybank. Copyright© Displaybank Co., Ltd., Confidential Page : 13/161 13/100


© Copyright 2026