
GLUCOSE AND CELLOBIOSE ADSORPTION ONTO ACTIVATED CARBON A Thesis
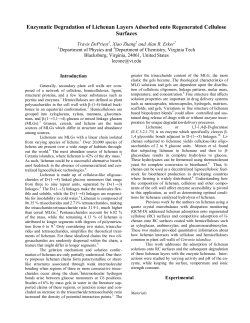
GLUCOSE AND CELLOBIOSE ADSORPTION ONTO ACTIVATED CARBON A Thesis Submitted to the School of Graduate Studies and Research in Partial Fulfillment of the Requirements for the Degree Master of Science Yu Sun Indiana University of Pennsylvania August 2013 Indiana University of Pennsylvania School of Graduate Studies and Research Department of Chemistry We hereby approve the thesis of Yu Sun Candidate for the degree of Master of Science August 28, 2013 Signature on File_____________________ John C. Ford, Ph.D. Associate Professor of Chemistry, Advisor August 28, 2013 Signature on File_____________________ Jaeju Ko, Ph.D. Associate Professor of Chemistry August 28, 2013 Signature on File_____________________ Nathan R. McElroy, Ph.D. Associate Professor of Chemistry August 28, 2013 Signature on File_____________________ Keith Kyler, Ph.D. Assistant Professor of Chemistry ACCEPTED ___________________________________ Timothy P. Mack, Ph.D. Dean School of Graduate Studies and Research ______________ ii _____________________ Title: Glucose and Cellobiose Adsorption onto Activated Carbon Author: Yu Sun Thesis Advisor: Dr. John C. Ford Thesis Committee Members: Dr. Jaeju Ko Dr. Keith Kyler Dr. Nathan R. McElroy Glucose and cellobiose are the simplest model compounds for cellulose. Glucose is itself a valuable commodity. It is a food as well as a biorenewable starting material for a variety of other materials. However, certain fundamental data for this common material are scarce or unavailable. For example, although activated carbon has long been used to purify carbohydrates, published adsorption isotherms for glucose on carbon are rare. We are unaware of any published adsorption isotherm for cellobiose on carbon. In this research, adsorption isotherms for glucose and cellobiose on activated carbon were determined. The experiment was carried out using HPLC and a derivatization method to quantify the saccharide concentrations before and after adsorption. The Brauner-Emmet-Teller equation best fit the isotherm data. For glucose, over the temperature range of 20-35°C, the adsorption equilibrium constants gave a nonlinear van't Hoff plot, which can be rationalized by consideration of the conformational equilbria involved. iii ACKNOWLEDGMENTS The author wishes to express his gratitude to Dr. Ford for his patience, guidance, support and encouragement. He would also like to thank his parents for their financial support and encouragement. iv TABLE OF CONTENTS Chapter Page 1 INTRODUCTION ....................................................................................... 1 2 EXPERIMENTAL ....................................................................................... 8 2.1 Chemicals..................................................................................... 8 2.2 Preparation of Activated Carbon ................................................. 10 2.3 HPLC System ............................................................................. 10 2.4 Other Equipment ........................................................................ 12 2.5 Procedure ................................................................................... 12 2.5.1 Preparing saccharide samples ........................................ 12 2.5.2 Derivatization procedure ................................................. 13 3 RESULTS AND DISCUSSION ................................................................. 15 3.1 Equilibration Time ........................................................................ 16 3.2 Preparation of Carbon ................................................................. 17 3.3 Isotherms of glucose and cellobiose ........................................... 20 3.3.1 Best-fit model ................................................................... 21 3.3.2 Comparison of fitted model parameters ........................... 28 3.4 Effect of temperature and thermodynamics of adsorption ........... 31 4 SUMMARY AND CONCLUSION ............................................................. 35 REFERENCES ................................................................................................... 37 APPENDICES .................................................................................................... 41 Appendix A - Langmuir parameters for glucose and cellobiose adsorbed to washed Darco G-60 activated carbon. ............. 41 Appendix B - BET parameters for glucose and cellobiose adsorbed to washed Darco G-60 activated carbon. ............. 41 Appendix C - Freundlich parameters for glucose and cellobiose adsorbed to washed Darco G-60 activated carbon. ............. 41 v LIST OF TABLES Table Page 1 Characterizations of Darco G-60 Activated Carbon. ................................... 9 2 The Suppliers and Grades of all the Chemicals Used in This Research .......................................................................................... 10 3 The HPLC working conditions ...................................................................11 4 All Equipment Used In This Research .......................................................11 5 Langmuir parameters for glucose and cellobiose adsorbed to unwashed and washed Darco G-60 activated carbon .......................... 20 6 Statistical results for fitting model equations to adsorption isotherm data .......................................................................... 27 7 Brauner-Emmet-Teller parameters for glucose and cellobiose adsorbed to washed Darco G-60 activated carbon................................... 29 vi LIST OF FIGURES Figure Page 1 Structure of glucose .................................................................................. 1 2 Structure of cellobiose. ............................................................................. 1 3 Solution concentrations of glucose and cellobiose in equilbrium with Norit SX carbon as a function of time............................. 17 4 Absorbance of MilliQ water, water from unwashed carbon, and water from washed carbon.................................................. 18 5 Adsorption isotherms of glucose on washed and unwashed Darco G-60 activated carbon at 20°C, 25°C and 30°C. .......................... 19 6 Adsorption isotherm of glucose on Darco G-60 activated carbon at 20°C. ....................................................................... 23 7 Adsorption isotherm of glucose on Darco G-60 activated carbon at 25°C ........................................................................ 23 8 Adsorption isotherm of glucose on Darco G-60 activated carbon at 30°C. ....................................................................... 24 9 Adsorption isotherm of glucose on Darco G-60 activated carbon at 35°C. ....................................................................... 24 10 Adsorption isotherm of cellobiose on Darco G-60 activated carbon at 20°C. ....................................................................... 25 11 Adsorption isotherm of cellobiose on Darco G-60 activated carbon at 25°C. ....................................................................... 25 12 Adsorption isotherm of cellobiose on Darco G-60 activated carbon at 30°C ........................................................................ 26 13 Two possible ways of sugar molecules staying on the surface of activated carbon. (a) Sugar molecules sidewards lying on the surface of carbon. (b). Sugar molecules end-on, sticking up on the surface of carbon .......................................... 30 14 Adsorption isotherms of glucose on Darco G-60 activated carbon at 20°C, 25°C, ,30°C and 35°C. .................................. 32 15 Adsorption isotherms of cellobiose on Darco G-60 activated carbon at 20°C, 25°C, and 30°C. ............................................ 32 vii 16 Plot of lnKa1 and 1/T for glucose and cellobiose adsorption on G-60 activated carbon. ..................................................... 34 viii CHAPTER 1 INTRODUCTION Glucose (C6H12O6) is a simple monosaccharide which is also called Dglucose (the other stereoisomer, L-glucose is almost nonexistent in nature), dextrose, blood sugar, corn sugar or grape sugar. Glucose, fructose and galactose are three dietary monosaccharides, i.e., they can be absorbed directly into the blood and metabolized. Glucose is the primary source of energy for cells (1). Cellobiose ((HOCH2CHO(CHOH)3)2O) is a disaccharide which is consisted of two glucose units linked by a β bond. Cellobiose can be hydrolyzed to glucose with specific enzyme or acid (2). The structures of glucose and cellobiose are given below in Figure1 and Figure2. Figure 1. Structure of glucose. The structure shown is β-D-glucose in the pyranose form. This is the preferred form in aqueous solution at 25°C. Figure 2. Structure of cellobiose. Because of the flexibility of the structure, cellobiose has many possible configurations. The structure shown here is one possible configuration: α-D-glucopyranosyl β-D-glucopyranoside. 1 Cellulose is the most abundant, renewable biopolymer (3). In industry, it is an important raw material. It plays a central role in the global carbon cycle and has the potential to be more widely used as a source of fuels and commodity chemicals in the future. Insoluble cellulose is a linear polymer of anhydroglucose units joined by β(1-4) linkages, with degrees of polymerization (DP, the number of repeating units) from 100 to 20000. While cellulose is frequently called a polymer of glucose, cellobiose is the actual monomeric unit of cellulose (4). The DP of a cellulosic material is an important measurement for functionally based models of enzymatic cellulose hydrolysis as well as for paper-making and other applications (5). Short fragments of cellulose whose DP are from 2 to 12 are termed cellodextrins. The cellodextrins are soluble when DP≤6 and slightly soluble when 6 < DP <12. The most common cellodextrins are cellobiose (DP=2), cellotriose (DP=3), cellotetraose (DP=4), cellopentaose (DP=5), and cellohexaose (DP=6). (6) These oligosaccharides have special properties which include solubility in nonaqueous or partially aqueous solvents and a melting point which increases with increasing molecular weight (8). Cellodextrins are intermediates in the production of glucose from cellulose. Cellulose has the potential to serve as a renewable carbon or energy resource for the microbial production of fuels and chemical feedstocks in the future but it is hard to utilize cellulose directly in many industrial processes. As one of the United States' most abundant renewable resources, about one billion tons of cellulose-containing residues are generated annually (7) and glucose can 2 be produced from cellulose (8). If these residues could be utilized well, there is a potential for yielding over 6×10¹¹ pounds of a valuable chemical feedstock, glucose, from which fuel alcohol and other fermentation derived chemicals can be made (7). Over 109 tons of “waste” cellulose is generated annually in the United States, which is a huge waste. The cellulose has the potential to be reused but much of it is discarded directly (9). Activated carbon is a form of carbon which has been processed, usually with oxygen or steam, to create many small pores of low pore volume and thus produce a very large surface area available for adsorption or chemical reactions (1). “The use of special manufacturing techniques results in highly porous carbon that has surface areas of 300-2,000 square meters per gram.” (10) Activated carbon is a widely used adsorbent for the removal of a wide range of contaminants from liquids and gases. It is also used to adsorb a product to purify it. For example, the activated carbon can be used to adsorb a solvent from a process stream, and the adsorbed product can be subsequently desorbed on-site for reuse (2). The meaning of “adsorb” is: when an adsorbent adsorbs an adsorbate, the adsorbate attaches to the adsorbent by chemical attraction. The surface area is an important factor for an adsorbent. Activated carbon is a good adsorbent because of its huge surface area which gives it many bonding sites. When certain chemicals pass next to the carbon surface, they attach to the surface and are trapped (11). Activated carbon is good at adsorbing organic chemicals. Many other chemicals can not be adsorbed by activated carbon. In other words, under 3 appropriate conditions, an activated carbon filter can adsorb target chemicals and ignore others. It also means that, if all of the bonding sites are filled, an activated carbon filter doesn’t work anymore. At that point the filter must be replaced (6). Activated carbon is commonly used for purification of sugar liquors. Sugar liquors include solutions of starch hydrolyzate which contains a mixture of mono-, di-, oligo- and higher polysaccharides, as well as sugar solutions derived from cane, beet and corn sources. The term, oligosaccharide, refers to a carbohydrate containing from 2 to 8 simple sugars linked together, while the term, “polysaccharide,” refers to a carbohydrate containing more that 8 simple sugars. A starch hydrolyzate is an aqueous mixture of sugar components derived from acid, enzyme or other treatment of starchy materials (6). The purification of sugar liquors including corn syrup, cane sugar and relatively impure solutions of dextrose is one of the oldest established industrial chemical procedures. Aqueous solutions of certain sugars such as glucose are produced industrially in the hydrolysis of amylaceous or cellulosic materials. For example, large amount of glucose solutions are producing by the hydrolysis of starch in the manufacture of corn syrup, corn sugar and dextrose. These solutions contain minor but significant amounts of other sugars which can’t be removed by conventional refining procedures. One use of activated carbon is for the decolorization of sugar liquors. Typically the powdered activated carbon is slurried with the impure liquor one or more times followed by filtration of the decolorized liquor. Decolorization is also accomplished by passing the liquors 4 through a column of granular activated carbon. By these procedures, colorcausing impurities can be removed, which are small amounts of oligosaccharides present in the liquor (6). In addition to its industrial uses, activated carbon has been important in laboratory purification for many years. It is frequently used to remove impurities from synthetic products, and is known as “decolorizing carbon.” It has been an important adsorbent in chromatography as well (12), and is frequently used in carbohydrate and oligosaccharide purification (6). In adsorbent-adsorbate interaction research, the ability to predict the “absorbability” for a given adsorbent from a specific adsorbate is an important objective (13). Isotherm data is important for a better understanding of the purification process of glucose as well as improving preparative separations of cellodextrins using activated carbon. Isotherm data can reflect the adsorption ability well. The adsorption isotherm is a curve giving the functional relationship between adsorbate and adsorbent in a constant-temperature adsorption process. Isotherm data of cellodextrins adsorption onto carbon is important because it can give a better understanding of the purification process of cellodextrins solution, which may help people to make a better industrial purification plan. Although the purification of sugar liquors is one of the oldest established industrial chemical procedures (11), very little relative isotherm data is published. Relative isotherm data is useful in understanding the process more exactly and may help to increase the working efficiency. The adsorption of cellodextrins onto carbon may also be a good method to produce cellodextrins from cellulosic waste. Isotherm 5 data would be useful in modeling such a method. For example, studies of the competitive adsorption of cellodextrins onto carbon need the individual isotherms of each component as basic supporting information. And isotherm data are invaluable for studies of adsorption energetics. Activated carbon is extensively used in the purification of sugars, both industrially and in the laboratory. Little or no published information is available concerning the thermodynamics of the interaction between the carbon surface and simple carbohydrates. Here, the isotherms of glucose and cellobiose adsorption onto activated carbon under different temperatures are presented and the adsorption of the simplest cellodextrin is studied. The important part of this research is how to quantify the concentration of sugar before and after adsorption. A derivatization method was used for the determination of the concentration of sugar. The reducing ends of glucose and cellobiose can react with 4-aminobenzoic acid ethyl ester. The amount of product can be used to determine the original concentration of sugar. The concentration of product is determined by a HPLC system. The method is available for oligosaccharides. Brauner-Emmet-Teller (BET) isotherm equation was fit to the data. The BET equation can be mathematically represented by: Here, Γmono is the surface concentration of the sugar that corresponds to monolayer coverage of the interface.Ka1 is the equilibrium constant for adsorption of the sugar on the solid, and Ka2 is the equilibrium constant for adsorption on sites that are already occupied by adsorbed molecules (14). 6 The adsorption process is temperature sensitive. Isotherms of glucose and cellobiose were obtained under 20°C, 25°C and 30°C respectively. There is obvious difference between the isotherms under different temperature. The influence of temperature was studied. Basically the adsorption ability increased with the increasing of temperature in this temperature range. And the isotherms of glucose were compared with the isotherms of cellobiose. While the molecule size of cellobiose is larger than that of glucose, approximately equal numbers of molecules are adsorbed at monolayer coverage. 7 CHAPTER 2 EXPERIMENTAL Isotherms were determined using the static method (15). Basically a known mass of adsorbent was equilibrated with a known volume of adsorbate solution of known concentration. After equilibration, the concentration of adsorbate remaining was measured, and the amount adsorbed calculated from the difference in the initial and final concentrations. Glucose or cellobiose is not readily detected by the UV absorbance detector of the HPLC. Two detection methods were employed: early work was performed using a pulsed-amperometric detector (PAD). PAD is a well-known method of detecting carbohydrates;(16) the carbohydrates are chromatographed in a strongly basic mobile phase, rendering them anions. They are detected by oxidization at a gold electrode. Unfortunately, an instrumental failure caused us to adopt an alternative quantitation method. Subsequently, a derivatization method was used. This method employed for derivatization of glucose and cellobiose at their reducing end with paminobenzoic ethyl ester (ABEE). (17) The details of the method are given below. All work on washed carbon was performed using this derivatization method. 2.1 Chemicals The adsorbents used were Norit SX and Darco G-60 activated carbons (both Norit Company). All reported isotherms were measured using the Darco G-60 activated carbon, as that material is frequently used in saccharide purification 8 and analysis (6). The manufacturer's characterization of Darco G-60 is provided in Table 1, taken from the Norit data sheet. The water used in this research was obtained from a Millipore Direct-Q® 8 UV-R (EMD Millipore, Billerica, MA). The grades and suppliers of the other chemicals used are listed in Table 2. Table 1. Characterizations of Darco G-60 Activated Carbon. This is the carbon most commonly used for cellodextrin purification. These data are from the data sheet supplied by Norit America, the manufacturer Characterization Tests Results of Tests Methylene blue adsorption, g/100 g 15 min Iron, Zacher method, ppm as Fe 200 max Moisture, % as packed 12max Water solubles, % 0.50 max Acid soluble ash, % 0.7 pH, water extract 6 Ash, % 4 Bulk density, tamped, g/mL 0.40 3 Bulk density, tamped, ib/ft 25 Particle size, laser, d5, um 5.5 Particle size, laser, d50, um 34 Particle size, laser, d95, um 125 Food Chemical Codex Passes 9 Table 2. The Suppliers and Grades of all the Chemicals Used in This Research Compound Grade Supplier Acetonitrile HPLC Fisher Scientific Methanol Laboratory Fisher Scientific Acetic Acid Glacial Laboratory Emdchemicals ABEE Laboratory Fisher Scientific Sodium Laboratory MP Biomedicals Cyanoborohydride Cellobiose Chemical Purpose Eastman Organic Chemicals Glucose Reagent Fisher 2.2 Preparation of Activated Carbon Prior to use, 4 g of activated carbon powder was stirrred 1000ml MillliQ water for 4 hours, and the water exchanged three times. The carbon was then collected by filtration and dried prior to use. Several batches of washed carbon were combined to provide the material used for isotherm determinations. 2.3 HPLC System Initially, the carbohydrate concentrations were determined by high performance anion exchange (HPAE) liquid chromatography with A Shimadzu LC-20, consisting of a LC-20AT pump, a SIL-20ADvp auto-sampler, and a CTO20Acvp column oven, will provide the basic chromatography. A Bioanalytical Systems Model SPD-10A(V)vp was used as a pulsed-amperometric detector (PAD). The quadrupole-potential waveform recommended by Rocklin et al (18). was used. 10 As mentioned above, an equipment problem caused us to change to a derivatization-based determination, using reductive amidation to form UVfluorescent derivatives according to the reaction scheme show in Figure 4. This aminobenzoic acid ethyl ester (ABEE) derivatization is common in carbohydrate analysis (19). The derivatized products are separated from one another and the unreacted ABEE by reversed-phase liquid chromatography using the HPLC working conditions given in Table 3. For this work, a RF-20A Fluorescence Detector (Shimadzu) was used. Table 3. The HPLC working conditions Mobile phase 70% of MilliQ water mixing with 30% of ACN. Flow rate 1.0mL/min Column 40°C Injection volume 5μl Table 4. All Equipment Used In This Research Equipment Supplier Dry Bath Fisher Brand Centrifuge Micro Centrifuge Model 235B Balance Lab companion SI-300R Lab companion RF-20A Fluorescence Detector Shimadzu Pulsed Amperometric Detector Bioanalytical Systems, Inc, West Lafayette, IN USA LC-20AT pump SIL-20 ACHT Auto Sampler CTO-20A Column Oven Shimadzu Shimadzu Inc, Rescek Corporation, IN USA 11 2.4 Other Equipment Other equipment included a dry bath instrument, a thermostatted shaker, a centrifuge, and an analytical balance, also listed in Table 4. 2.5 Procedure Initial experiments with the PAD showed us that the linear range of the detector allowed concentrations at least as high as 10 mM but that the lower limit of quantitation (LOQ) was affected by the choice of high concentration. This is because the PAD detector signal is sent to an analog-to-digital converter (ACD) in the Shimadzu system and the resolution of the ADC determines the LOQ. Adjusting the amplification to allow a smaller LOQ reduces the maximum concentration represented without clipping. Consequently, the upper limit of concentration used to some extent affected the lowest concentration used in a given experiment. 2.5.1 Preparing saccharide samples Saccharide solutions were prepared with concentrations ranging from 0.0 to the 5.0mM, with. 11 different concentrations used for each trial: 0.0mM, 0.5mM, 1.0mM 1.5, 2.0mM, 2.5mM, 3.0mM, 3.5mM, 4.0mM, 4.5mM, 5.0mM. The isotherms were measured as follows: (i) 0.1 gram of activated carbon were placed in stoppered glass tubes. (ii) 8mL of each saccharide solution was added to each tube. 12 (iii) The tubes were incubated with shaking at a fixed temperature for at least 8 hours to make sure the saccharide has enough time to adsorb carbon. (Preliminary experiments indicated that the adsorption of glucose is essentially complete in 1 hour at room temperature.) (iv) The carbon was allowed to settle, and an aliquot taken for analysis. 2.5.2 Derivatization procedure The derivatization reagent was prepared by mixing 7.0mL methanol and 820μL of glacial acetic acid, then adding 3.30 gram of ABEE and, 0.7 gram of sodium cyanoborohydride were added. The ABEE did not dissolve well at room temperature, so water bath was used to make solvent warm (around 50°C). After the adsorption process was finished, the 10μL aliquot of each saccharide solution before adsorption (11 samples) and after adsorption (11 samples) was put in separated 6×50mm tube. Next, 40μL of ABEE reagent ( the method of making it was described before) was added to each tube, and the tubes were placed in a dry bath instrument for 1 hour at 80°C. After 1 hour, the reaction mixtures were cooled to room temperature, 200 μL of MillliQ water and 200 μL of chloroform were added to each tube, the tubes vortexed for 5 seconds, and allowed to stand for 1 minute. The mixture separated into two layers—an upper clear aqueous layer and a lower muddy layer. Fifty μL of the clear upper aqueous layer was put in a HPLC vial and 400 μL of MilliQ water was added. The saccharide concentrations before and after adsorption were then measured by 13 HPLC. The only change to collect data at different temperatures was to change the incubation temperature. The concentration of each saccharide solution before adsorption was known, so a linear relationship between saccharide solution concentration and the HPLC peak area could be determined, which was used to calculate the final concentration of each saccharide solution after adsorption. Because the volume of each solution and the weight of carbon were known, the amount of saccharide adsorbed per gram of carbon (in units of μg/g) could be calculated. Thus, a series of adsorption data points were determined. Langmuir, Freundlich and BET equations were fit to the data by nonlinear least squares regression using the Solver tool in Microsoft Excel. 14 CHAPTER 3 RESULTS AND DISCUSSION For each experiment, a calibration curve relating the HPLC-determined peak areas to the prepared saccharide prior to exposure to carbon was prepared. These calibration curves were described by linear equations. Next, the saccharide concentration of each solution following adsorption was determined using the calibration curve. Because the volume of each solution and the weight of carbon powder were also known, the adsorption capacity of carbon (CS) could be calculated and expressed in μmol/g . Then, the isotherm could be determined with CS as the dependent variable and CM (equilibrium solution concentration) as the independent variable. However, fitting of adsorption isotherm equations to experimental data is an important aspect of data analysis. An adsorption isotherm gives the functional relationship between adsorbate and adsorbent in a constant-temperature adsorption process (20). A large number of such functional relationships have been applied (14). One of the more widely used models is the Langmuir model. This model is based on a simple statistical consideration involving adsorption onto a surface with a finite number of equivalent sites (21). The Langmuir model has been applied extensively, even in situations where non-equivalent populations of adsorption sites are clearly evident (22). While it is highly unlikely that activated carbon contains a homogeneous population of adsorption sites, the Langmuir model is so appeallingly simple that it is included here. 15 In contrast, the Freundlich isotherm model is usual considered as empirical, although it can be derived from an adsorption model where the adsorption energy decreases exponentially as the number of adsorbed molecules increases. The Freundlich model has found widespread use and has previously been applied to mono- and oligosaccharides adsorbed onto activated carbons (23). Adsorption is also frequently described by the Brauner-Emmet-Teller (BET) isotherms model. The BET model allows multi-layer adsorption, with each layer following Langmuir-like behavior (24). 3.1 Equilibration Time Adsorption isotherms require that the solution concentration of the adsorbate comes to equilibrium with the adsorbed concentration. Thus, it is necessary to first determine the length of time required for the establishment of that equilibrium. Figure 3 shows the solution concentrations of glucose and cellobiose in equilbrium with Norit SX carbon as a function of time. In each case, 1.00 mL of 10 mM sugar was mixed with 10.0 mg of the carbon and shaken for the indicated period of time at rom temperature. Following centrifugation and HPLC-PAD analysis, the remaining solution concentrations were determined. The figure shows that equilbrium was reached quickly, and that two-hour equilibration times were adequate. To ensure equilibrium, all isotherm measurements were performed using overnight (8-12 hours) equilibration times. 16 Figure 3. Solution concentrations of glucose and cellobiose in equilbrium with Norit SX carbon as a function of time. Ten mL of 10.0 mM aqueous solute was mixed with 100 mg of carbon, and samples withdrawn at the indicated times. Analysis with performance by high-performance anion exchange chromatography using pulsed-amperometric detection. 3.2 Preparation of Carbon Initial studies were performed using Norit SX carbon, and quantifying the adsorbed sugar by HPLC. For the temperature studies, the carbon was changed to Darco G-60 which the carbon most often recommended for the separation of sugars (25). Both these carbons were used as supplied. However, an instrumental issue caused us to attempt to perform some work using absorbance at 191 nm to quantify the amount of sugar adsorbed. Figure 4 shows the absorbance spectrum of the carbon blank, i.e., 100 mg of carbon were shaken in MilliQ purified water for 12 hours and centrifuged. Figure 4 also shows the absorbance spectrum of the water itself, the absorbance spectrum obtained when the carbon was first washed with water and dried before weighing. 17 Figure 4. Absorbance of MilliQ water, water from unwashed carbon, and water from washed carbon. The absorbance of the MilliQ water was recorded directly, without contact with carbon. The other two curves represent the absorbances of water which had been in contact with unwashed or washed Darco G-60 activated carbon for 8 hours, then recovered by filtration. While the washing procedure did not remove all water-soluble material, washing reduced it considerably, as revealed by the difference in the spectra of water from unwashed carbon and water from washed carbon. More extensive washing did not significantly reduce the absorbance from this unknown watersoluble material, nor did washing with glacial acetic acid prior to washing with water (data not shown). Washing with boiling water was also effective at reducing the amount of water soluble material, but did not eliminate the absorbance observed in subsequent washes (data not shown). 18 Figure 5. Adsorption isotherms of glucose on washed and unwashed Darco G-60 activated carbon at 20 °C, 25°C and 30°C. Data fit with Langmuir equations. Figure 5 shows adsorption isotherms obtained on washed and unwashed Darco G-60 activated carbon at several temperatures. Each data set is fit to the Langmuir Equation: qm QK 1 QKC Where K is the equilibrium constant, Q is surface concentration of the adsorbate on the carbon, C is final concentration. The resultant best-fit parameters are given in Table 5. As received, the Darco G-60 activated carbon had a watersoluble, UV-active substance adsorbed to the surface. This material increased the affinity of the surface for glucose, and significantly decreased the saturation capacity of the surface for glucose, as calculated by the Langmuir equation. These results strongly suggest that work performed on unwashed adsorbent does not necessarily reflect the adsorption properties of that adsorbent. And it 19 must be noted that, while the washing employed here reduced the amount of water-soluble substance, it was not eliminated. Hence, these isotherms, while likely more correct than those obtained on unwashed activated carbon, may not completely reflect adsorption to the carbon surface. All subsequent work was done using Darco G-60 carbon which had been washed extensively with MilliQ-purified water, dried at 60C, and stored in a sealed container. Table 5. Langmuir parameters for glucose and cellobiose adsorbed to unwashed and washed Darco G-60 activated carbon Solute Adsorbent Temp K Q (μg/g) Glucose Unwashed carbon 20 0.30 207.64 Glucose Unwashed carbon 25 0.40 172.22 Glucose Unwashed carbon 30 0.32 218.17 Glucose Washed carbon 20 0.03 1028.27 Glucose Washed carbon 25 0.01 2818.68 Glucose Washed carbon 30 0.03 920.59 Glucose Washed carbon 35 0.06 478.46 Cellobiose Washed carbon 20 0.98 210.02 Cellobiose Washed carbon 25 0.52 333.77 Cellobiose Washed carbon 30 0.85 279.31 3.3 Isotherms of glucose and cellobiose Figures 6-9 show the adsorption isotherm data for glucose adsorbed to Darco G-60 carbon at 20, 25, 30 and 35°C, respectively. In each case, the experimental data is shown as points, while lines corresponding to best-fit BET, Freundlich, and Langmuir equations are also shown. Figures 10-12 show similar 20 adsorption isotherm data for cellobiose,also adsorbed to Darco G-60, at 20, 25, and 30°C, respectively. 3.3.1 Best-fit model To select the model in best agreement with the experimental data, the reduced sum of squared residuals (RSSν), Akaike’s information criterion(AIC) (26), and the mean absolute percentage error (MAPE) are shown in Table 6. The RSSν is approximately the reduced chi-squared of the fit, that is, it is the sum of the square of the distances of each point from the fitted line, divided by the degrees of freedom of the fit: N (y fit RSSv - yi) 2 i 1 N np 1 Where yi is experimental amount adsorbed, yfit is calculated amount adsorbed, N is the number of data, and np is the number of parameters in model. It is widely used in fitting; the smaller the RSSν,the better the fit. The AIC is a similar statistic, but derived from information theory. It is given by: SS AIC N ln 2K N Where N is the number of data points, K is the number of parameters fit by the regression plus one, and SS is the sum of the square of the vertical distances of the points from the curve. Again, the smaller value of the AIC corresponds to the better fit. The advantage of using the AIC is that it allows direct comparison of different models, while, strictly speaking, the RSSν should only be used to 21 compare nested models, such as the Langmuir and BET models. MAPE is commonly used in quantitative forecasting methods because it produces a measure of relative overall fit. The absolute values of all the percentage errors are summed up and the average is computed (27). It is given by: MAPE 1 n At Ft n t 1 At Where At is experimental amount adsorbed, Ft is calculated amount adsorbed, n is the number of data. Comparing the RSSν values, the fit of the BET equation model has given the smallest values in 6 of 7 isotherms; for the AIC model statistic, the fit of the BET equation has gave smaller values in 6 of 7 isotherms. In the case of cellobiose at 20°C, the Freundlich equation fits the data slightly better than the BET equation. In comparing the MAPE values, the fit of the BET equation model gave the smallest values in all of 7 isotherms.The BET and the Freundlich equations both fit the data better than the Langmuir equation. So the BET model is generally the best-fit model. However, in the present work, the BET equation is used sole due to it providing the best fit of the data points, not for any implied mechanistic information. 22 Figure 6. Adsorption isotherm of glucose on Darco G-60 activated carbon at 20°C. Data fit with Langmuir, Freundlich and BET equations. Figure 7. Adsorption isotherm of glucose on Darco G-60 activated carbon at 25°C. Data fit with Langmuir, Freundlich and BET equations. 23 Figure 8. Adsorption isotherm of glucose on Darco G-60 activated carbon at 30°C. Data fit with Langmuir, Freundlich and BET equations. Figure 9. Adsorption isotherm of glucose on Darco G-60 activated carbon at 35°C. Data fit with Langmuir, Freundlich and BET equations. 24 Figure 10. Adsorption isotherm of cellobiose on Darco G-60 activated carbon at 20°C. Data fit with Langmuir, Freundlich and BET equations. Figure 11. Adsorption isotherm of cellobiose on Darco G-60 activated carbon at 25°C. Data fit with Langmuir, Freundlich and BET equations. 25 Figure 12. Adsorption isotherm of cellobiose on Darco G-60 activated carbon at 30°C. Data fit with Langmuir, Freundlich and BET equations. 26 Table 6. Statistical results for fitting model equations to adsorption Solute Model Temp (C) RSS1 AIC2 Glucose Langmuir 20 22.60 32.95 BET 20 8.78 22.15 Freundlich 20 16.50 29.80 Langmuir 25 48.38 121.09 BET 25 14.53 82.68 Freundlich 25 41.54 116.37 Langmuir 30 57.49 85.85 BET 30 36.22 76.94 Freundlich 30 54.19 84.61 Langmuir 35 41.59 79.05 BET 35 36.65 77.19 Freundlich 35 38.48 77.42 Cellobiose Langmuir 20 129.46 50.40 BET 20 99.43 48.43 Freundlich 20 98.58 47.68 Langmuir 25 100.36 97.55 BET 25 14.09 57.12 Freundlich 25 29.18 71.61 Langmuir 30 223.29 114.34 BET 30 104.11 99.12 Freundlich 30 158.42 107.13 N (y fit 1. RSSv - yi) 2 i 1 N np 1 , reduced sum of squared residuals. SS 2. AIC N ln 2K , Akaike’s information criterion. N 3. MAPE 1 n At Ft , mean absolute percentage error. n t 1 At 27 isotherm data MAPE3 6.64% 5.13% 7.41% 11.35% 6.33% 13.54% 10.89% 9.35% 9.95% 11.00% 10.97% 11.17% 8.52% 5.46% 8.28% 11.03% 2.42% 4.38% 9.71% 7.51% 8.65% 3.3.2 Comparison of fitted model parameters Although the BET equation accounts for multi-layer adsorption and contains a parameter which characterizes the attractive interaction between the adsorbed solution and the free solute in solution (24), we do not propose that the adsorption of glucose or cellobiose is mechanistically explained by the BET model. Nonetheless, the Ka1 term in the BET model represents the affinity of the adsorbent for the adsorbate, and is in the limit of infinite dilution, the Henry's Law constant for that system. Thus, the fitted Ka1 values should be, if not identical to, proportional to the true equilibrium constants of interest. The values of the best-fit BET equations are shown in Table 6. Comparing the Ka1 values for glucose at different temperatures, there is not a obvious tendency regarding to the increasing of temperature from 20 to 35°C. On the other hand, with the increasing of temperature, the K a1 values of cellobiose increase, and the Γmono values decreases. This implied that with the increasing of temperature, the affinity of the carbon for the cellobiose is increasing and the adsorption capacity is decreasing. Comparing the Ka1 and Γmono values of glucose with those of cellobiose, we can see, the Ka1 and Γmono values of cellobiose are significant larger than those of glucose, which can indicate that the affinity of activated carbon for cellobiose is much stronger than that for glucose. And the adsorption capacity of activated carbon for cellobiose is also larger than that of glucose, when expressed in μg/g. However, when the adsorption capacity is expressed in μmol/g, it is nearly identical for the two sugars. 28 Table 7. Brauner-Emmet-Teller parameters for glucose and cellobiose adsorbed to washed Darco G-60 activated carbon 1 Adsorbate Temperature Ka11 Ka21 Γmono1 (μg/g) Γmono (μmol/g) 0.75 0.16 47.98 0.27 Glucose 20 1.34 0.19 38.26 0.21 Glucose 25 1.36 0.17 44.79 0.25 Glucose 30 0.84 0.13 55.39 0.31 Glucose 35 2.55 0.12 118.89 0.35 Cellobiose 20 3.03 0.19 112.11 0.33 Cellobiose 25 4.27 0.21 108.97 0.32 Cellobiose 30 The average Ka2 value of glucose (excepting 35C) is 0.17 +/- 0.02 while the average Ka2 value of cellobiose is0.17 +/- 0.05. Ka2 is the equilibrium constant for adsorption on the second layer of carbon. The Ka2 values of glucose seem to be the same as the Ka2 values of cellobiose. Of course this does not prove that the adsorption equilibrium of glucose and cellobiose on the second layer are identical, but does suggest that behavior. However, in the concentration range of these experiments, an entire curve for the second layer of any isotherm was not measured, and the existence of a second layer is not firmly established, so the similarity comparation of Ka2 values is suggestive but not conclusive. As we can see in Table 7, the Γmono values of cellobiose with unit μg/g are almost twice of glucose. However, in units of μmol/g, the Γmono values are almost constant. This implies similarity in the conformation of sugar molecules on the surface of carbon. In general, one can imagine two ways for the sugar molecules 29 to adsorb the carbon surface, either sidewards lying on the surface or end-on, sticking up on the surface. (a) (b) Figure 13. Two possible ways of sugar molecules staying on the surface of activated carbon. (a) Sugar molecules sidewards lying on the surface of carbon. (b). Sugar molecules end-on, sticking up on the surface of carbon. Γmono represents the surface concentration of the adsorbate on the carbon which corresponds to a monolayer - full coverage of the interface. If the glucose and cellobiose are sidewards lying on the surface when adsorbed (Figure 13a), the Γmono values (in molar terms) of glucose would be expected to be different 30 from those of cellobiose because the length and surface area of glucose are different from cellobiose. Similarly, if glucose is adsorbed flat while cellobiose is adsorbed sticking up, the Γmono values would likely be different as well. However, if glucose and cellobiose are both sticking up on the surface of carbon (Figure 13b), the interface area of each sugar molecule occupying should be the same, and the Γmono values of glucose and cellobiose would be the same in terms of moles adsorbed per unit area. The Γmono values of glucose and cellobiose in Table 6 are almost constant, consistant with the analysis above that both glucose and cellobiose are adsorbed end-on, sticking up from the surface of activated carbon. 3.4 Effect of temperature and thermodynamics of adsorption Figure 14 shows the isotherms of glucose at 20°C, 25°C, and 30°C. The amount adsorbed increased with increased temperature in this temperature range. Interestingly, the isotherm of glucose at 35°C showed less adsorption than the lower temperatures. The 35°C isotherm shown represents two independent sets of data, acquired on different days using the same reagents and techniques as were used for the data acquired at lower temperatures. (Actually, each isotherm in Figures 14 and 15 represent two independent experiments.) Hence, this decrease in adsorption is most likely real, not some odd experimental error. A possible explanation for this oddity will be presented below. For cellobiose, the isotherms were similar in that the amount adsorbed increased with the increasing of temperature. The isotherms of cellobiose are 31 shown in Figure15. Figure 14. Adsorption isotherms of glucose on Darco G-60 activated carbon at 20°C, 25°C, 30°C and 35°C. Original data points are omitted to make the curves clear. Figure 15. Adsorption isotherms of cellobiose on Darco G-60 activated carbon at 20°C, 25°C, and 30°C. Original data points are omitted to make the curves clear. According to van 't Hoff equation: , where K is the equilibrium constant, ΔHo is standard enthalpy change, T is temperature, ΔSo is 32 standard entropy change. Thus, -lnK should have linear relationship with 1/T if ΔHo keeps constant. Figure 16 shows ln Ka1 vs 1/T for the BET parameters fit to the adsorption data of glucose and cellobiose. While three data is hardly definitive, the plot for adsorption of cellobiose onto carbon does appear reasonably linear. But the adsorption data for glucose onto carbon does not show a linear relationship. The limited number of data do allow for experimental error as being the originating factor of this curvature in the van't Hoff plot, but it is also possible that ΔHo is temperature sensitive in this regime. Again, the isotherm at each temperature represents two entirely independent experiments. Thus it seems most likely that -lnK and 1/T don’t have a linear relationship because ΔHo is changing with temperature. One possible explanation for this nonlinearity is the temperature-dependence of the structure of glucose. While we refer to the adsorbate as “glucose,” it is in fact an equilibrium mixture of α-glucopyranose, βglucopyranose, the corresponding glucofuranoses, and the open-chain form (1). The equilibria among these forms are temperature dependent (28). Thus, the adsorption being modeled as a single component system is actually a complex, competitive adsorption system, which may account for the van't Hoff nonlinearity as well as, e.g., the decreased adsorption of glucose at 35°C. 33 Figure 16. Plot of lnKa1 and 1/T for glucose and cellobiose adsorption on G-60 activated carbon. The upper tendency line is for three cellobiose data points at 20°C, 25°C and 30°C. The other tendency with the same length and similar slop is for glucose data points at 20°C, 25°C and 30°C. The longest tendency line is for all the four glucose data points at 20°C, 25°C, 30°C and 35°C. The data for glucose in Figure 16 show a strong deviation from linearity, if taken as a whole. Over the 20-35°C range, the least-squares best straight line is y = -760x + 2.6, corresponding to a weakly endothermic adsorption process. However, if we consider Figure 16 to represent two distinct adsorption processes for glucose, then the adsorption processes for glucose and cellobiose are both endothermic from 20°C to30°C, and they have very similar ΔHo values, while for glucose, it is exothermic from30°C to 35 . This interpretation also implies a significant change for glucose in the entropy associated with the adsorption process, i.e., significantly different mechanisms above and below 30°C. Given the energetics associated with hydrogen bonding, and the large numbers of possible hydrogen bonds, this is not impossible. However, additional data should be gathered to substantiate the behavior before making any such interpretation. 34 CHAPTER 4 SUMMARY AND CONCLUSION In this research, the adsorption behaviors of glucose and cellobiose on activated carbon was examined. The experiment was carried out using HPLC to measure the concentrations of solutions after adsorption using a derivatization method for the detection of glucose and cellobiose by HPLC. Langmuir, Freundlich, and BET equations were fit to the adsorption data; the BET equation gave the best fit by a number of statistical criteria. From the isotherms, the amount of cellobiose adsorbed increases with increasing temperature in the temperature range examined. The amount of glucose adsorbed onto carbon is almost the same as the amount of cellobiose adsorbed, when measured in moles per gram, which means they are apparently adsorbed to the surface in the same way, standing on the surface of carbon with the same cross-sectional area. The thermodynamic analysis shows the adsorption process for glucose from 20°C to 30°C is exothermic and from 30°C to 35°C is endothermic; for cellobiose from 20°C to 30°C the process is exothermic. The adsorption behavior is likely complicated by the conformational equilibria for these species. This study indicates areas for further research: (a) Additional measurements of glucose isotherms in the 10-30°C region, to better refine the thermodynamic parameters associated with this adsorption. (b) Additional measurements of these isotherms beyond 30°C, which appear to be controlled by different thermodynamic parameters. Of course, the temperature sensitive conformational 35 equilibria for glucose must be considered. (c) Isotherm determinations for additional cellodextrins, e.g., cellotriose, cellotetraose, etc. (d) Competitive adsorption isotherms. This last is particularly interesting as providing insight into the chromatographic conditions best suited for preparative isolation of individual cellodextrins. 36 REFERENCES 1. Activated Carbon. Wikipedia [Online]; Wikipedia, Posted Jul 30, 2013. http://en.wikipedia.org/wiki/Activated_carbon (accessed Aug 7, 2013). 2. Cellobiose. Wikipedia [Online]; Wikipedia, Posted Aug 2, 2013. http://en.wikipedia.org/wiki/Cellobiose (accessed Aug 7, 2013). 3. Gilbert, R. D.; Kadla, J. E. Biopolymers from Renewable Resources; David L. Kaplan, Eds.; VCH: New York, 1998; p 47. 4. Cellulose. Wikipedia [Online]; Wikipedia, Posted Aug 3, 2013. http://en.wikipedia.org/wiki/Cellulose (accessed Aug 7, 2013). 5. Zhang, Y. H. P; Lynd, L. R. Determination of the Number Average Degree of Polymerization of Cellodextrins and Cellulose with Application to Enzymatic Hydrolysis. Biomacromolecules. 2005, 1510-1515. 6. Urbanic, J. E. Purification of Sugar Liquors with Activated Carbon. U. S. Patent 4,502,890, March 5, 1985. 7. Huebner, A.; Ladisch, M. R.; Tsao, G. T. Preparation of Cellodextrins: An Engineering Approach. Biotechnology and Bioengineering. 1978, 1669-1677. 8. Muhammad, I. A.; Ghufrana, S. Applied and Environmental Microbiology. 1991, 655-659. 9. Dorsey, J. G.; Fanali, S.; Giese, R. W.; Haddad, P. R.; Lee, H. K.; Poole, C. F.; Riekkola, M. L.; Schoenmakers, P. J.; Tanaka, N. Journal of Chromatography. 1978, 147, 185-193. 10. Shahaf, D. Respiratory Hoods. U.S. Patent 20,030,075,173, May 1, 2003. 37 11. Holly, A. C.; Scott, H. M.; Sallavanti, R. A. Multi-functional Protective Materials and Methods for Use. U.S. Patent 0,161,631, July 3, 2008. 12. Cassidy, H. G.; Weissberger, A. Techniques of Organic Chemistry volume V—adsorption and chromatography; Cassidy, H. G, Eds.; VCH: New York, 1951; pp 190-192. 13. Vander, K. A.; Qiang, D.; Aburub, A.; Wurster, D. E. Modified Langmuir-like Model for Modeling the Adsorption from Aqueous Solutions by Activated Carbons. Langmuir. 2005, 21, 217-224. 14. Park, H. M.; Moon, D. J. Adsorption Equilibria of CFC-115 on Activated Charcoal. J. Chem. Eng. 2003, 48, 908–910. 15. Falade, K. O.; Adetunji, A. I.; Aworh, O. C. Adsorption isotherm and heat of sorption of fresh- and osmo-oven dried plantain slices. European Food Research and Technology. 2003, 217, 230-234. 16. Zook, C. M.; LaCourse W. R. Pulsed Amperometric Detection of Carbohydrates in Fruit Juices Following High Performance Anion Exchange Chromatography. Current Separations. 1995,14, 2. 17. Momenbeik, F.; Khorasani, J. H. Analysis of Sugars by Micellar Liquid Chromatography with UV Detection. Acta Chromatographica. 2006, 16. 18. Rocklin, R. D.; Clarke, A. P.; Weitzhandler, M. Improved Long-Term Reproducibility for Pulsed Amperometric Detection of Carbohydrates Via a New Quadrupole-Potential Waveform. Anal Chem. 1998, 70, 1496-1501. 19. Kwon, H.; Kim, J. Determination of Mono-and Oligosaccharides 38 Derivatized with p-Aminobenzoic Ethyl Ester by Reverse Phase HPLC. Analytical Science and Technology. 1995, 8, 4. 20. Isotherm. Wikipedia [Online]; Wikipedia, Posted Aug 1, 30, 2013. http://en.wikipedia.org/wiki/Isotherm (accessed Aug 7, 2013). 21. Langmuir Equation. Wikipedia [Online]; Aug 5, 2013. Wikipedia, Posted Jul 30, 2013. http://en.wikipedia.org/wiki/Langmuir_equation (accessed Aug 7, 2013). 22. Murilo, F.; Luna, T.; Antonio, A.; Eduardo, D. Trindade; Silva, I. J. Removal of Aromatic Compounds from Mineral Naphthenic Oil by Adsorption. Ind. Eng. Chem. 2008, 47, 3207-3212. 23. Lee, J. W.; Kwon, T. O.; Moon, S. Adsorption of Monosaccharides, Disaccharides, and Maltooligosaccharides on Activated Carbon for Separation of Maltopentaose. Carbon. 2004, 42, 371–380. 24. BET theory. Wikipedia [Online]; Aug 5, 2013. Wikipedia, Posted Jul 30, 2013. http://en.wikipedia.org/wiki/BET_theory (accessed Aug 7, 2013). 25. Ikan, R. Natural Product-A Laboratory Guide. Kaplan, D. L., Eds.; Academic Press: New York, 2007; pp 84-86. 26. Motulsky, H.; Christopoulos, A. Fitting Models to Biological Data Using Linear and Nonlinear Regression. Oxford University Press: Oxford, U.K., 2003; pp143-144. 27. Mean Absolute Percentage Error. John Galt. http://www.johngalt.com/galt_university/mape.shtml. 39 28. Los, J. M.; Simpson, L. B. The Mutarotation and Ionization of d-glucose in Alkaline Solution. Wiley Online Library. 1954, 73, 941–958. 40 APPENDIX Table A, B, C give the least-squares, best-fit parameters for Langmuir, BET and Freundlich isotherm equations for each set of adsorption data. Each set of adsorption data represents two separate trials, performed on different days. Appendix A. Langmuir parameters for glucose and cellobiose adsorbed to washed Darco G-60 activated carbon. Glucose onto washed carbon Cellobiose onto washed carbon Temp K Q K Q 20 0.026 1028.30 0.98 210.02 25 0.010 2818.69 0.52 333.77 30 0.033 920.59 0.85 279.31 35 0.064 478.46 Appendix B. BET parameters for glucose and cellobiose adsorbed to washed Darco G-60 activated carbon. Glucose onto washed carbon Cellobiose onto washed carbon Temp Ka1 Ka2 Γmono Ka1 Ka2 Γmono 20 0.75 0.16 47.98 2.55 0.12 118.89 25 1.34 0.19 38.26 3.03 0.19 112.11 30 1.36 0.17 44.80 4.27 0.21 108.97 35 0.84 0.13 55.39 Appendix C. Freundlich parameters for glucose and cellobiose adsorbed to washed Darco G-60 activated carbon. Glucose onto washed carbon Cellobiose onto washed carbon Temp K 1/n K 1/n 20 24.09 0.96 97.51 2.06 25 24.658 0.90 111.16 1.65 30 30.57 1.09 120.85 1.83 35 29.90 1.17 41


© Copyright 2026