
MT RUSHMORE SECURITIES, LLC SAMPLE HISTORICALLY
MT RUSHMORE SECURITIES, LLC
SAMPLE
HISTORICALLY
LOWER VOLITIILITY
PROGRAMS
DISCLOSURE STATEMENT
The enclosed materials relate to the portfolio funds in which an investor may initially choose to invest in .
Mt. Rushmore Securities LLC assume no responsibility for the Portfolio Funds’ offering materials or reports and
have no ability to verify the disclosures made by or about any of the Portfolio Managers. Mt. Rushmore Securities
LLC will have no control over any of the Portfolio Funds or Portfolio Managers. The risk as well as the performance
volatility of each Investor's interest in the Fund may increase as the number of Portfolio Funds selected, especially
if there is excessive concentration and or leverage is increased. No Investor should consider investing in a Fund
who is not, irrespective of any materials furnished herewith, fully capable of evaluating the risks of such
investment. Alternative investment strategies are subject to a “risk of ruin” not typical of traditional investment
strategies, and the returns on alternative investment strategies have generally declined in recent years due to a
number of factors.
THESE MATERIALS ARE NOT AN OFFER TO SELL OR A SOLICITATION OF AN OFFER TO
BUY ANY SECURITY. THE INTERESTS IN A FUND CAN ONLY BE OFFERED BY THE FUND’S
CONFIDENTIAL PRIVATE PLACEMENT MEMORANDUM. PROSPECTIVE INVESTORS WHO
ARE INTERESTED IN FURTHER INFORMATION CONCERNING THE FUND SHOULD
REQUEST THE CONFIDENTIAL PRIVATE PLACEMENT MEMORANDUM FROM A MA NAGING
MEMBER, AS WELL AS CONSULT WITH THEIR FINANCI AL AND TAX ADVISERS
CONCERNING THE IMPLICATIONS TO SUCH INVESTORS OF AN INVESTMENT IN THE
FUND.
NO ONE SHOULD INVEST IN A FUND MORE THAN THEY CAN AFFORD TO LOSE.
INVESTORS MAY LOSE ALL OR SUBSTANTI ALLY A LL OF THEIR INVESTMENT IN THE
FUND. INVESTORS MUST CAREFULLY REVIEW THE APPROPRIATE CONFIDENTIAL
PRIVATE PLACEMENT MEMORANDUM, INCLUDING THE “RISK FACTORS,” “BROKERAGE
ARRANGEMENTS” AND “CONFLICTS OF INTEREST” SECTIONS THEREOF BEFORE
D E TE R MI NI NG WHE THE R TO I NV E ST I N THE FUND .
The following information was provided to the Manager by the respective Portfolio Managers of each
Underlying Fund and is believed to be accurate. However the Manager has not independently verified this
information. Hypothetical results have certain limited including but not limited to the fact that such portfolios
are constructed with the benefit of hindsight. Please read the following.
HYPOTHETICAL PERFORMANCE RESULTS HAVE MANY INHERENT LIMITATIONS, SOME OF WHICH ARE DESCRIBED
BELOW. LIMITATIONS INCLUDE BUT ARE NOT LIMITED TO THE FACT THAT THESE RESULTS DO NOT REFLECT
ACTUAL FUNDS, HEDGE GATEWAY FUND'S FEES OR ACTUAL TRADING IN YOUR PORTFOLIO AND THEREFORE DO
NOT REFLECT THE IMPACT THAT ECONOMIC AND MARKET FACTORS MAY HAVE HAD ON THE COMPOSITION OF
YOUR ACTUAL PORTFOLIO. IN FACT, THERE ARE FREQUENTLY SHARP DIFFERENCES BETWEEN HYPOTHETICAL
RESULTS AND THE ACTUAL RECORD SUBSEQUENTLY ACHIEVED. ANOTHER LIMITATION OF HYPOTHETICAL
PERFORMANCE RESULTS IS THAT THEY ARE GENERALLY PREPARED WITH THE BENEFIT OF HINDSIGHT. IN
ADDITION, HYPOTHETICAL TRADING DOES NOT INVOLVE FINANCIAL RISK, AND NO HYPOTHETICAL TRADING
RECORD CAN COMPLETELY ACCOUNT FOR THE IMPACT OF FINANCIAL RISK IN ACTUAL TRADING. FOR EXAMPLE,
THE ABILITY TO WITHSTAND LOSSES OR TO ADHERE TO A PARTICULAR ASSET ALLOCATION PORTFOLIO
COMPOSITION OR TRADING PROGRAM IN SPITE OF TRADING LOSSES ARE MATERIAL POINTS WHICH CAN ALSO
ADVERSELY AFFECT ACTUAL TRADING RESULTS. THERE ARE NUMEROUS OTHER FACTORS RELATED TO THE
MARKETS IN GENERAL OR TO THE IMPLEMENTATION OF ANY SPECIFIC PORTFOLIO, ASSET ALLOCATION OR
TRADING PROGRAM WHICH CANNOT BE FULLY ACCOUNTED FOR IN THE PREPARATION OF HYPOTHETICAL
PERFORMANCE RESULTS AND ALL OF WHICH CAN ADVERSELY AFFECT ACTUAL TRADING RESULTS.
NO REPRESENTATION IS MADE THAT ANY PORTFOLIO OR FUND WILL OR IS LIKELY TO ACHIEVE ITS OBJECTIVES OR
THAT ANY INVESTOR WILL OR IS LIKELY TO ACHIEVE RESULTS COMPARABLE TO THOSE SHOWN OR WILL MAKE ANY
PROFIT AT ALL OR WILL BE ABLE TO AVOID INCURRING SUBSTANTIAL LOSSES. RESULTS DO NOT REFLECT HEDGE
GATEWAY FUND'S FEES. PAST PERFORMANCE IS NO GUARANTEE OF FUTURE RESULTS.
Cambridge Strategy (Emerging Mkts)
Consistency Index & Recovery Profile
Overview
Avg Return (CROR):
Max Drawdown:
1,500
1,400
15.20%
3.03%
2.23
SharpeRatio:
1,300
Cur% of Avg-Low 12 mo Spread:
Cur %of Best-Avg 12 mo Spread:
1,200
1,100
Months Trading:
1,000
Mininum:
Feb-10
Feb-09
Feb-08
Lev Avail:
29
Adv Notice:
50,000
AUM:
900
59%
0%
Pd Red:
90,000,000
7
Monthly
12 Month Time Window:
Last
14.0%
Avg
19.8%
Worst
9.9%
Best
26.9%
Lows & Recoveries
After Max Draw, Peak Returns within:
Cur.
Draw
3.0%
Prior
Wrst
Draw
Prior
Wrst
Date
12 Mos
24 Mos
1.2%
May-08
20.5%
43.6%
36 Mos
After 12 Mo Lows, Peak Returns within:
48 Mos
Last
12
Mos
Prior
Wrst
12 Mos
14.0%
9.9%
50.0%
25.0%
40.0%
20.0%
30.0%
15.0%
20.0%
10.0%
10.0%
5.0%
Prior
Wrst
Date
12 Mos
Jan-09
23.0%
24 Mos
36 Mos 48 Mos
0.0%
0.0%
12Mos
24Mos
36Mos
12Mos
48Mos
24Mos
36Mos
48Mos
Monthly Returns
Jan
Feb
Mar
Apr
May
Jun
2010
0.97%
0.88%
6.41%
-0.12%
-0.67%
-2.26%
2009
2008
4.12%
1.34%
1.09%
3.94%
0.41%
3.72%
0.81%
1.44%
-1.24%
1.36%
0.22%
Jul
Aug
Sep
Oct
Nov
Dec
1.01%
1.54%
-0.21%
-0.39%
-0.16%
0.15%
2.64%
2.01%
4.81%
0.80%
0.18%
0.08%
YTDtxtCounter
MaxDD
5.1%
-3.0%
26.9%
5.6%
-0.4%
-1.2%
Past performance is not necessarily indicative of future results. Futures trading and hedge fund investing involves risk of loss and is not suitable for
everyone.
Mt Rushmore Securities LLC, 1703 Padmavani Lane Ste A, Fairfield, IA 52556
Tel. 641-472-7373 Ext 112, [email protected]
2
Cambridge Strategy (Emerging Mkts)
Consistency Index & Recovery Profile
Manager Background
EDWARD BAKER (Executive Chairman) Ed joined the Cambridge Strategy in April 2007 and is the firm's Executive Chairman. Until April of 2007
Ed was the Chief Investment Officer of Emerging Markets Growth Equities at AllianceBernstein. Ed joined Alliance Capital in 1995 and served in
various roles during his tenure, including CEO of Alliance Capital Limited, Alliance's London based subsidiary. Ed assumed responsibility for the
Emerging Markets Growth business in early 1998 and built this into a $10 billion AUM business before his departure. Prior to joining Alliance in
1995, Mr. Baker worked for Barra, Inc., an investment technology firm which he joined in 1978. He is currently Editor-in-Chief of the Journal of
Investment Consulting, a publication of The Investment Management Consultant's Association. He is also the Chairman of the Equity Advisory
Group of the Institute of International Finance, and a Trustee for the Mathematical Sciences Research Institute. Mr. Baker earned a B.A. from
the University of South Florida; and both an M.A. and ABD in Mathematics from the University of California at Berkeley, where he was a
Regents Fellow. PETER HENRICKS (CEO) Peter co-founded the Cambridge Strategy and is the firm's Chief Executive Officer. Between 1993 and
2003 Peter worked for Alliance Capital as CEO of various subsidiaries throughout Asia. During this period, Peter founded offices for Alliance in
Australia, Hong Kong, Taiwan and negotiated the J.V. in China with Ping-An. He began his career at Shearson Lehman where he was responsible
for trading short dated treasury instruments and rose to senior dealer in Hong Kong. He was subsequently promoted to merchant banking head
in Australia with responsibility for treasury, stock broking, foreign exchange and fixed income. Peter currently works with the Bank of
International Settlements on financial stability in developing markets. Peter holds a BA from Flinders University of South Australia and a
Masters of Project Management from the University of Technology, Australia and is a doctoral candidate at the ISM in Paris. RUSSELL
THOMPSON (CIO) Russell co-founded the Cambridge Strategy and is the firm's Chief Investment Officer. Prior to establishing the firm, Russell
was a consultant at RPMH LLP, which he joined in 2003, and developed a foreign exchange platform which began trading in 2004. In 1998
Russell joined AIG Trading as a senior Trader, and was quickly promoted to Head of Trading for Asia. This included responsibility for all aspects
of Currency and Interest Rate Trading in AIG Inc. HK, including Trading, Risk Management, Personnel, and Compliance. AIG Trading Inc HK was a
1st Tier Market Maker in Asia, and was focused primarily on Asian Emerging markets business. Russell was also responsible for trading and
managing the successful AIG Proprietary Asian Currency Fund. In 2001 Russell resigned from AIG and moved to North America and co-founded
two Companies. In 1995 Russell joined HSBC Markets in Hong Kong as a Forward/Proprietary trader and running the short dated HKD Arbitrage
book and a proprietary trading book. He progressed to Senior Derivatives Trader, successfully creating and running the Non Deliverable
Forwards desk through the Asian Crisis. Russell began his career at Midland Montagu in 1989. Russell has a BSc(Hons) in Economics, and is a
member of the Association of Corporate Treasurers, having passed his ACT exams with distinction.
Balyasny Asset Management (BAM) is a globally diversified, Multi-Strategy Hedge Fund Manager focused on combining
high quality, proprietary, fundamental research with top investment talent, a dynamic capital allocation process and
professional business management.
Institutional multi-strategy investment firm founded in 2001.
latform of over 60 investment professionals across multiple investment disciplines.
Global reach with offices in Chicago, NY, Greenwich, CT, London & Mumbai.
Unique culture retains and attracts top talent.
Senior management team has been with BAM since inception.
Atlas Global, BAM’s flagship multi-strategy fund, focuses on delivering high, risk-adjusted returns across all market
cycles. It’s key attributes include:
Diversified equity & macro multi-strategy fund.
Low correlation to the market and amongst strategies and teams.
Positive every year since inception (Jan 2002).
Alpha not Beta – maximizes probability of solid returns every year.
Dynamic capital allocation process.
Dperience during difficult times-result is a disciplined & structured approach. Distinct risk limits for every team.
Diversification through distinct strategies, portfolio managers & over 1000 positions.
See Biography and Strategy Addendum for a complete Extended Biographies and Strategy description.
Past performance is not necessarily indicative of future results. Futures trading and hedge fund investing involves risk of loss and is not suitable for
everyone.
Mt Rushmore Securities LLC, 1703 Padmavani Lane Ste A, Fairfield, IA 52556
Tel. 641-472-7373 Ext 112, [email protected]
3
DKR Fusion (Quant)
Consistency Index & Recovery Profile
Overview
Avg Return (CROR):
Max Drawdown:
2,700
2,500
2,300
2,100
1,900
1,700
1,500
1,300
1,100
900
SharpeRatio:
9.36%
9.78%
0.70
Cur% of Avg-Low 12 mo Spread:
Cur %of Best-Avg 12 mo Spread:
112%
0%
Months Trading:
Sep-09
Sep-08
Sep-07
Sep-06
Sep-05
Sep-04
Sep-03
Sep-02
Sep-01
Adv Notice:
50,000
AUM:
Sep-00
Lev Avail:
117
Mininum:
Pd Red:
285,510,000
7
Monthly
12 Month Time Window:
Last
-3.8%
Avg
9.8%
Worst
-3.8%
Best
44.4%
Lows & Recoveries
After Max Draw, Peak Returns within:
Cur.
Draw
6.4%
Prior
Wrst
Draw
Prior
Wrst
Date
12 Mos
9.8%
Sep-08
12.9%
24 Mos
36 Mos
After 12 Mo Lows, Peak Returns within:
48 Mos
Last
12
Mos
Prior
Wrst
12 Mos
-3.8%
-2.4%
Prior
Wrst
Date
12 Mos
24 Mos
Mar-02
42.2%
54.2%
36 Mos 48 Mos
57.8%
68.4%
70.0%
60.0%
50.0%
40.0%
30.0%
20.0%
10.0%
0.0%
15.0%
10.0%
5.0%
0.0%
12Mos
24Mos
36Mos
12Mos
48Mos
24Mos
36Mos
48Mos
Monthly Returns
Jan
Feb
Mar
Apr
May
Jun
2010
-1.72%
0.66%
2.85%
0.93%
-6.40%
-0.59%
2009
2008
-2.91%
5.10%
0.13%
7.94%
-0.91%
-3.10%
-0.15%
0.90%
5.55%
3.91%
-2.91%
1.97%
1.49%
-3.21%
0.19%
-6.69%
0.01%
-0.10%
0.32%
3.73%
3.39%
5.31%
-2.32%
1.84%
2007
1.10%
-2.47%
-3.01%
1.47%
2.81%
3.22%
-4.58%
-4.03%
-0.46%
3.78%
-0.87%
2006
0.13%
-1.69%
-0.12%
2.67%
1.21%
-2.38%
-0.91%
4.30%
1.59%
0.85%
0.91%
2005
-3.03%
1.94%
2.16%
-1.37%
1.76%
0.82%
-0.83%
1.50%
0.72%
0.46%
2004
0.48%
4.23%
-1.58%
-2.50%
-0.13%
-1.23%
-0.05%
-1.84%
3.75%
2003
6.01%
3.99%
-4.49%
1.90%
6.37%
-1.75%
-2.04%
-2.09%
2002
-2.88%
-1.37%
1.57%
2.42%
4.74%
8.02%
1.52%
2001
0.99%
-0.01%
6.36%
-0.20%
0.06%
-0.20%
-0.45%
2000
Jul
Aug
Sep
Oct
Nov
Dec
YTDtxtCounter
MaxDD
-4.4%
-7.0%
1.6%
18.0%
-3.8%
-9.8%
2.48%
-1.0%
-8.8%
3.18%
10.0%
-3.3%
3.56%
-1.33%
6.3%
-3.0%
-0.82%
6.16%
-0.12%
6.1%
-7.1%
-0.28%
2.99%
0.25%
3.07%
14.1%
-6.0%
1.85%
4.36%
-0.22%
-0.61%
4.03%
25.5%
-4.2%
3.39%
-0.51%
2.22%
-4.00%
0.21%
7.8%
-4.0%
0.81%
1.57%
3.58%
4.75%
11.1%
0.0%
Past performance is not necessarily indicative of future results. Futures trading and hedge fund investing involves risk of loss and is not suitable for
everyone.
Mt Rushmore Securities LLC, 1703 Padmavani Lane Ste A, Fairfield, IA 52556
Tel. 641-472-7373 Ext 112, [email protected]
4
DKR Fusion (Quant)
Consistency Index & Recovery Profile
Manager Background
Daniel G. Rizzuto is the President of DKR Fusion Management L.P
The DKR QUANTITATIVE STRATEGIES Program is a multi-strategy, statistical model driven investment program. This
diversified Program is designed to combine a variety of models that have low correlations to produce consistent returns
over time. The Program monitors a wide variety of markets for potential investment including commodity futures,
financial futures and foreign exchange interbank contracts. Assets reported are strategy assets.
Past performance is not necessarily indicative of future results. Futures trading and hedge fund investing involves risk of loss and is not suitable for
everyone.
Mt Rushmore Securities LLC, 1703 Padmavani Lane Ste A, Fairfield, IA 52556
Tel. 641-472-7373 Ext 112, [email protected]
5
Dominion Capital Mgmt. (Sapphire)
Consistency Index & Recovery Profile
Overview
Avg Return (CROR):
Max Drawdown:
1,600
1,500
7.44%
8.70%
0.70
SharpeRatio:
1,400
Cur% of Avg-Low 12 mo Spread:
Cur %of Best-Avg 12 mo Spread:
1,300
43%
0%
1,200
1,100
Months Trading:
1,000
Mininum:
AUM:
May-10
May-09
May-08
May-07
May-06
May-05
900
Lev Avail:
62
Adv Notice:
50,000
Pd Red:
70,000,000
7
Monthly
12 Month Time Window:
Last
3.5%
Avg
7.7%
Worst
-2.3%
Best
27.5%
Lows & Recoveries
After Max Draw, Peak Returns within:
Cur.
Draw
3.3%
Prior
Wrst
Draw
Prior
Wrst
Date
12 Mos
8.7%
Apr-09
11.7%
24 Mos
36 Mos
After 12 Mo Lows, Peak Returns within:
48 Mos
Last
12
Mos
Prior
Wrst
12 Mos
3.5%
-2.1%
Prior
Wrst
Date
12 Mos
24 Mos
May-07
19.0%
36.6%
36 Mos 48 Mos
39.3%
40.0%
12.0%
10.0%
30.0%
8.0%
20.0%
6.0%
4.0%
10.0%
2.0%
0.0%
0.0%
12Mos
24Mos
36Mos
12Mos
48Mos
24Mos
36Mos
48Mos
Monthly Returns
Jan
Feb
Mar
Apr
May
Jun
2010
-2.56%
2.91%
1.42%
-1.74%
0.94%
-2.50%
2009
2008
4.85%
-1.99%
-4.00%
-0.81%
-0.40%
-0.17%
-4.51%
4.03%
3.16%
7.80%
1.11%
2.13%
2007
-0.34%
-0.97%
0.46%
0.02%
-2.14%
2.12%
2006
1.46%
-0.91%
0.96%
-0.24%
-1.62%
-0.31%
1.06%
2.86%
0.36%
2005
Jul
-0.47%
1.79%
Aug
Sep
Oct
Nov
Dec
YTDtxtCounter
MaxDD
-1.7%
-3.3%
1.21%
2.34%
5.1%
19.2%
-8.7%
-2.9%
1.20%
0.25%
1.16%
2.51%
2.02%
1.02%
0.06%
-0.83%
1.28%
0.35%
-0.56%
2.66%
1.19%
1.96%
6.1%
-3.0%
-0.26%
-1.24%
-0.28%
1.06%
2.48%
-0.55%
0.5%
-3.9%
1.59%
1.00%
1.03%
0.89%
1.07%
10.3%
0.0%
Past performance is not necessarily indicative of future results. Futures trading and hedge fund investing involves risk of loss and is not suitable for
everyone.
Mt Rushmore Securities LLC, 1703 Padmavani Lane Ste A, Fairfield, IA 52556
Tel. 641-472-7373 Ext 112, [email protected]
6
Dominion Capital Mgmt. (Sapphire)
Consistency Index & Recovery Profile
Manager Background
SCOTT A. FOSTER is the President, Chief Executive Officer, majority shareholder and the sole director of Dominion and has acted in such
capacity since its inception in May 1994. Mr. Foster has also been registered as a principal and associated person of Dominion since July 1994.
Mr. Foster is responsible for all investment decisions made by Dominion, including the development of all trading models, money and risk
management strategies, portfolio selection and ongoing research and product development. Prior to forming Dominion, Mr. Foster was Senior
Trader and an associated person for A.O. Management Corporation, a registered commodity trading advisor, from June 1991 through February
1994. His responsibilities there included research and development of technical and fundamental trading models, product development, and
the overseeing of execution and all trading desk activities. From October 1988 through June 1991 Mr. Foster was President of The Dominion
Financial Group, Ltd., a private trading company specializing in spread and arbitrage trading. It is through his research and trading experience
with the Dominion Financial Group Ltd. that his current approach evolved. JOSEPH VANDERBOSCH is the Executive Vice President of Dominion.
Mr. Vanderbosch has been a registered principal and associated person of Dominion since March 2003. His responsibilities include overseeing
operations, maintaining client relationships and new business development. Prior to joining Dominion, Mr. Vanderbosch worked at Wintrust
Financial Corporation, a bank and financial services holding company, in their trust and investment subsidiary from January 2001 to December
2002. His responsibilities there included marketing trust and investment services to the holding company's Chicago based banking facilities and
clients. From 1995 to 2000 he served as Director of Marketing and Client Services for Telesis Management, Inc., a registered commodity trading
advisor and commodity pool operator located in Santa Barbara, California, where he designed and implemented a global marketing and equity
raising campaign. Mr. Vanderbosch was registered as an associated person of Telesis until July 2001. Gregory J. Donahue, Esq. is Vice President,
General Counsel, Corporate Secretary and a registered principal of Dominion. Mr. Donahue joined Dominion in July 2000 and is responsible for
providing the firm with guidance on all legal issues including corporate operation/governance, contract development/review and regulatory
compliance, as well as serving as Dominion's liaison to outside counsel on issues of specialized concern. Prior to joining Dominion, Mr. Donahue
was associated with the law firm of Brandt, Fisher, Alward & Roy, P.C. from September 1997 to July 2000, where he practiced in the areas of
corporate law, transactional law, mergers and acquisitions and commercial finance. Before joining Brandt, Fisher, Alward & Roy, P.C., he was
associated with the law firm of Stark, Reagan & Finnerty, P.C. from February 1994 to August 1997, where he concentrated his practice in
corporate law, transactional law and alternative financing. Mr. Donahue was admitted to the Michigan Bar in November 1996. Mr. Donahue
obtained his Juris Doctor degree from Wayne State University and his Bachelor of Science degree from the University of Michigan.
The Investment strategies of the Dominion Sapphire Program are unique in their time orientation, market exposure,
and in the underlying principles that drive the approach. Day to day trading is governed by proprietary trading models
that seek to capture short-term price momentum that is either directional or mean reverting. The short term time
horizon allows us to: react nimbly to changing market conditions and volatility; maintain a relatively low open trade
exposure( both in margin and leverage); enter and exit the market at consistently different times than our peer group;
and find opportunity during market conditions that hurt other strategies ( major trend reversals, sudden changes in
interest rate policy, and downside volatility in global equity markets). The program currently trades a globally
diversified portfolio of stock index, currency, interest rate, and commodity markets. This report is directed to and
intended exclusively for "Qualified Eligible Persons" as defined under CFTC Regulation 4.7 and does not attempt to
disclose risk.
Past performance is not necessarily indicative of future results. Futures trading and hedge fund investing involves risk of loss and is not suitable for
everyone.
Mt Rushmore Securities LLC, 1703 Padmavani Lane Ste A, Fairfield, IA 52556
Tel. 641-472-7373 Ext 112, [email protected]
7
Global Advisors (Gl. Comm. Systematic)
Consistency Index & Recovery Profile
Overview
Avg Return (CROR):
Max Drawdown:
2,100
1,900
11.42%
10.57%
0.79
SharpeRatio:
1,700
1,500
Cur% of Avg-Low 12 mo Spread:
Cur %of Best-Avg 12 mo Spread:
1,300
Months Trading:
1,100
Mininum:
Jul-09
Jul-08
Jul-07
Jul-06
Jul-05
Lev Avail:
60
Adv Notice:
50,000
AUM:
900
210%
0%
Pd Red:
345,000,000
7
Monthly
12 Month Time Window:
Last
-8.8%
Avg
13.5%
Worst
-8.8%
Best
34.4%
Lows & Recoveries
After Max Draw, Peak Returns within:
Cur.
Draw
10.6%
Prior
Wrst
Draw
Prior
Wrst
Date
12 Mos
5.5%
Aug-08
9.5%
24 Mos
36 Mos
After 12 Mo Lows, Peak Returns within:
48 Mos
Last
12
Mos
Prior
Wrst
12 Mos
-8.8%
2.9%
10.0%
2.0%
8.0%
1.5%
Prior
Wrst
Date
12 Mos
Jun-09
24 Mos
36 Mos 48 Mos
2.0%
6.0%
1.0%
4.0%
0.5%
2.0%
0.0%
0.0%
12Mos
24Mos
36Mos
12Mos
48Mos
24Mos
36Mos
48Mos
Monthly Returns
Jan
Feb
Mar
Apr
May
Jun
2010
-2.53%
-2.18%
3.41%
0.07%
-6.42%
-2.30%
2009
2008
-0.13%
3.09%
0.38%
10.47%
-1.32%
-3.74%
-0.12%
1.46%
1.25%
2.60%
-0.45%
2.12%
2007
0.13%
2.54%
-0.57%
1.93%
-1.33%
2006
6.18%
-1.12%
2.64%
10.10%
1.15%
2005
Jul
Aug
Sep
Oct
Nov
Dec
YTDtxtCounter
MaxDD
-9.8%
-9.8%
-0.86%
0.60%
0.7%
20.4%
-1.4%
-5.5%
-0.69%
-3.68%
1.37%
-1.84%
-0.84%
2.35%
-0.41%
5.23%
2.56%
0.84%
0.63%
2.31%
-4.65%
9.40%
2.83%
-1.40%
2.75%
14.9%
-4.7%
-0.18%
-1.51%
-0.17%
2.59%
2.10%
0.45%
-0.96%
22.7%
-1.9%
-2.21%
7.09%
0.17%
0.77%
4.65%
0.72%
11.4%
-2.2%
Past performance is not necessarily indicative of future results. Futures trading and hedge fund investing involves risk of loss and is not suitable for
everyone.
Mt Rushmore Securities LLC, 1703 Padmavani Lane Ste A, Fairfield, IA 52556
Tel. 641-472-7373 Ext 112, [email protected]
8
Global Advisors (Gl. Comm. Systematic)
Consistency Index & Recovery Profile
Manager Background
RUSSELL NEWTON is a Principal Partner and responsible for Risk Measurement and Research. From July 1994 to February 1999, Mr. Newton was
employed by the Morgan Guaranty Trust Company (MGT) in London. His most recent position, held since mid 1997, was global commodities
strategist. This post covered base and precious metals as well as energy, and included development and execution of new derivative trade
structures, market analysis (economic, fundamental, statistical and technical), market modelling and technical trading system design. Prior to
this, Mr. Newton was head of European Energy Trading at MGT, whilst also trading a forward, futures, physical and swaps speculative book,
focusing on Brent and Dubai crude oils. From 1987 to 1994 Mr. Newton traded North Sea and Middle Eastern crude oil markets for Shell
International Trading Company from September 1986 to November 1992,
Phibro from December 1992 to January 1994 and finally RheinOel Limited from January 1994 to July 1994, all in London. In the late 1980s, whilst
head of futures and forwards trading at Shell International Trading Company, he was amongst those responsible for developing pricing models
of the Brent CFD market. Mr. Newton has extensive experience of computer systems analysis, design and programming. He is skilled in several
computer languages including Visual Basic. Mr. Newton received a Bachelor of Arts (Honours) in Natural Sciences (Experimental Psychology)
from Cambridge University, UK, in 1986. DANNY MASTERS is a Principal Partner and Portfolio Manager of the discretionary program and is
based in New York. From July 1994 to February 1999, Mr. Newton was employed by the Morgan Guaranty Trust Company (MGT) in London. His
most recent position, held since mid 1997, was global commodities strategist.
This post covered base and precious metals as well as energy, and included development and execution of new derivative trade structures,
market analysis (economic, fundamental, statistical and technical), market modelling and technical trading system design. Prior to this, Mr.
Newton was head of European Energy Trading at MGT, whilst also trading a forward, futures, physical and swaps speculative book, focusing on
Brent and Dubai crude oils. From 1987 to 1994 Mr. Newton traded North Sea and Middle Eastern crude oil markets for Shell International
Trading Company from September 1986 to November 1992, Phibro from December 1992 to January 1994 and finally RheinOel Limited from
January 1994 to July 1994, all in London.
In the late 1980s, whilst head of futures and forwards trading at Shell International Trading Company, he was amongst those responsible for
developing pricing models of the Brent CFD market. Mr. Newton has extensive experience of computer systems analysis, design and
programming. He is skilled in several computer languages including Visual Basic. Mr. Newton received a Bachelor of Arts (Honours) in Natural
Sciences (Experimental Psychology) from Cambridge University, UK, in 1986
GLOBAL ADVISORS operates a systematic quantitative trade and portfolio management tool that has been developed
specifically for the commodities futures markets. This tool has been designed to offer diversification within the
commodity niche by trading inter and intra-commodity spreads as well as outright commodities. Trades are structured
to minimize the effects of transactions costs and to increase capacity within its markets.
Past performance is not necessarily indicative of future results. Futures trading and hedge fund investing involves risk of loss and is not suitable for
everyone.
Mt Rushmore Securities LLC, 1703 Padmavani Lane Ste A, Fairfield, IA 52556
Tel. 641-472-7373 Ext 112, [email protected]
9
J E Moody & Company (CRV)
Consistency Index & Recovery Profile
Overview
Avg Return (CROR):
Max Drawdown:
1,700
1,600
1,500
1,400
12.03%
2.44%
1.90
SharpeRatio:
Cur% of Avg-Low 12 mo Spread:
Cur %of Best-Avg 12 mo Spread:
1,300
1,200
1,100
155%
0%
Months Trading:
1,000
900
May-10
May-09
May-08
May-07
Adv Notice:
50,000
AUM:
May-06
Lev Avail:
50
Mininum:
Pd Red:
173,500,000
7
Monthly
12 Month Time Window:
Last
0.5%
Avg
11.4%
Worst
-0.7%
Best
27.4%
Lows & Recoveries
After Max Draw, Peak Returns within:
Cur.
Draw
0.6%
Prior
Wrst
Draw
Prior
Wrst
Date
12 Mos
1.4%
Sep-08
5.7%
24 Mos
36 Mos
After 12 Mo Lows, Peak Returns within:
48 Mos
Last
12
Mos
Prior
Wrst
12 Mos
0.5%
4.4%
6.0%
1.2%
5.0%
1.0%
4.0%
0.8%
3.0%
0.6%
2.0%
0.4%
1.0%
0.2%
Prior
Wrst
Date
12 Mos
Jun-09
24 Mos
36 Mos 48 Mos
1.1%
0.0%
0.0%
12Mos
24Mos
36Mos
12Mos
48Mos
24Mos
36Mos
48Mos
Monthly Returns
Jan
Feb
Mar
Apr
May
Jun
2010
0.19%
0.26%
1.52%
0.07%
-0.02%
-0.57%
2009
2008
0.90%
3.08%
-0.85%
-0.59%
0.88%
2.61%
0.19%
-0.01%
0.40%
2.29%
-0.61%
0.87%
2007
-0.71%
2.40%
2.29%
-1.11%
-0.19%
1.43%
2006
Jul
Aug
Sep
Oct
Nov
Dec
YTDtxtCounter
MaxDD
1.4%
-0.6%
-0.12%
0.79%
0.15%
-1.22%
-1.87%
-0.20%
0.49%
0.82%
0.01%
1.18%
0.46%
2.06%
0.0%
12.2%
-2.4%
-1.4%
0.88%
1.22%
1.58%
0.03%
2.80%
2.33%
1.61%
13.8%
-1.3%
0.40%
4.30%
1.98%
1.84%
5.23%
2.26%
4.37%
23.9%
0.0%
Past performance is not necessarily indicative of future results. Futures trading and hedge fund investing involves risk of loss and is not suitable for
everyone.
Mt Rushmore Securities LLC, 1703 Padmavani Lane Ste A, Fairfield, IA 52556
Tel. 641-472-7373 Ext 112, [email protected]
10
J E Moody & Company (CRV)
Consistency Index & Recovery Profile
Manager Background
JOHN MOODY - Professor Moody serves as President and Director of Research of the General Partner and its research affiliate Nonlinear
Prediction Systems. He is also a Principal Investigator at Berkeley's International Computer Science Institute and directs ICSI's Portland Office.
Dr. Moody took leave from full-time academia on September 1, 2003 to devote his efforts to researching the firms' trading strategies and the
building of its business. He is now full-time at the company, and limits his academic activities to less than one day per week. Dr. Moody's
principal areas of research are in computational finance, data mining, time series analysis, machine learning, pattern recognition, and
nonparametric statistics. He is a member of the Editorial Board for Quantitative Finance, served as Program Co-Chair of the May 2000 London
conference "Computational Finance 2000", served as Program Co-Chair of IEEE's "Computational Intelligence in Financial Engineering 2003" in
Hong Kong and recently served as Chair of the NIPS 2005 "Machine Learning in Finance" workshop in Whistler, BC. Dr. Moody has authored 65
scientific papers, and holds one U.S. patent. He has given numerous invited lectures throughout the world. Dr. Moody was previously a
Professor in Computer Science at the Oregon Graduate Institute (OGI, 1992- 2003), where he was the Founder and Director of OGI's
Computational Finance Program from 1996 to 2002. His teaching included graduate courses in Financial Markets & Trading, Options & Futures,
Financial Time Series, Time Series Analysis, Machine Learning, Statistical Learning Theory, Neural Computation and Pattern Recognition. Prior to
OGI, Dr. Moody was a faculty member at Yale University, where he was a Research Scientist in the Department of Computer Science and a
member of the Neuroscience Program (1987-1992). He was a Postdoctoral Research Fellow at the Institute for Theoretical Physics in Santa
Barbara (1984-1987). Dr. Moody received his Ph.D. (1984) and M.A. (1981) in Theoretical Physics from Princeton University, where he was a
Fannie and John Hertz Foundation Fellow and studied under Nobel laureate Frank Wilczek. Moody graduated summa cum laude with a B.A. in
Physics from the University of Chicago (1979).
JEM COMMODITY RELATIVE VALUE PROGRAM trades a diversified portfolio of commodity markets on a purely nondirectional basis. Sector coverage includes energy, metals, grains, livestock, foods and fibers. Systematic models detect
and exploit mispricings between related instruments, while maintaining approximate market or sector neutrality. The
CRV program seeks to capture profit (pure alpha) with very low index correlation (beta). All trades are hedged with
offsetting long and short positions, thus reducing the impact of sudden market movements. Exposure to each sector is
limited, and risk is continuously monitored.
For more information on this manager and before investing, view the information available through the Alphametrix
Mosaic Software and the Alphamosaic Fund offering memorandum. The Hedge Gateway Funds offers Alphamosaic's
maximum leverage version of this manager. However to calculate a proforma of historical gains and losses at the
maximum leveraged level see "Make Portfolio" within the Alphametrix Mosaic software. Also please note that the
Alphamosaic Fund is a fund of managed accounts. The live managed account performance of a manager can vary from
a manager's composite performance shown above and shown in the "Portfolio Collection" of the Alphametrix Mosaic
Software for various reasons including various legacy positions and fees of older accounts.
The Alphametrix Mosaic software enables an investor to compare composite returns of the manager (shown in the
"Portfolio Collection" of the Alphametrix Mosaic Software) with the live performance of the managed accounts within
the Alphamosaic Fund (available through Historical Performance Grid/ Historical Analysis within the Alphametrix
Mosaic Software). It provides monthly returns (in manager collection) that are reported by the individual managers as
well as the daily returns since a manager began trading on the Alphamosaic platform (available through Historical
Performance Grid/ Historical Analysis within the Alphametrix Mosaic Software).It also provides the current returns for
the week, month, and year.
Past performance is not necessarily indicative of future results. Futures trading and hedge fund investing involves risk of loss and is not suitable for
everyone.
Mt Rushmore Securities LLC, 1703 Padmavani Lane Ste A, Fairfield, IA 52556
Tel. 641-472-7373 Ext 112, [email protected]
11
Jaguar Investments (Commodity)
Consistency Index & Recovery Profile
Overview
Avg Return (CROR):
Max Drawdown:
1,400
1,350
1,300
1,250
1,200
1,150
1,100
1,050
1,000
950
900
2.77%
13.75%
0.02
SharpeRatio:
Cur% of Avg-Low 12 mo Spread:
Cur %of Best-Avg 12 mo Spread:
153%
0%
Months Trading:
Nov-09
Nov-08
Nov-07
Nov-06
Nov-05
Adv Notice:
50,000
AUM:
Nov-04
Lev Avail:
68
Mininum:
Pd Red:
56,000,000
7
Monthly
12 Month Time Window:
Last
-7.5%
Avg
3.5%
Worst
-10.3%
Best
20.6%
Lows & Recoveries
After Max Draw, Peak Returns within:
Cur.
Draw
13.8%
Prior
Wrst
Draw
Prior
Wrst
Date
12 Mos
24 Mos
36 Mos
4.9%
Jun-07
8.2%
8.5%
8.5%
After 12 Mo Lows, Peak Returns within:
48 Mos
Last
12
Mos
Prior
Wrst
12 Mos
-7.5%
-3.7%
10.0%
100.0%
8.0%
80.0%
6.0%
60.0%
4.0%
40.0%
2.0%
20.0%
Prior
Wrst
Date
12 Mos
May-09
24 Mos
36 Mos 48 Mos
0.0%
0.0%
0.0%
12Mos
24Mos
36Mos
12Mos
48Mos
24Mos
36Mos
48Mos
Monthly Returns
Jan
Feb
Mar
Apr
May
Jun
2010
0.56%
-0.15%
-0.88%
-1.36%
-0.72%
-1.35%
2009
2008
-1.14%
0.10%
-1.81%
-0.99%
0.95%
0.14%
-2.62%
1.08%
-1.65%
-1.47%
-0.63%
-1.29%
-0.40%
0.86%
2007
-1.54%
1.31%
-0.28%
0.34%
-0.10%
-2.90%
2006
0.54%
3.36%
-1.86%
2.58%
9.58%
-0.86%
2005
-1.79%
-0.25%
4.20%
-0.33%
0.82%
3.11%
2004
Jul
Aug
Sep
Oct
0.21%
1.28%
-1.28%
-1.03%
-1.00%
1.73%
0.93%
1.77%
3.62%
0.17%
-0.37%
4.14%
2.05%
2.64%
-2.39%
Nov
Dec
YTDtxtCounter
MaxDD
-3.9%
-4.4%
-10.3%
1.4%
-10.3%
-2.7%
-1.12%
0.53%
-0.28%
0.53%
-0.09%
1.77%
-1.11%
3.6%
-3.2%
0.32%
-1.54%
-0.27%
16.4%
-1.9%
-0.50%
2.74%
-2.38%
7.9%
-2.9%
-1.18%
3.82%
2.6%
-1.2%
Past performance is not necessarily indicative of future results. Futures trading and hedge fund investing involves risk of loss and is not suitable for
everyone.
Mt Rushmore Securities LLC, 1703 Padmavani Lane Ste A, Fairfield, IA 52556
Tel. 641-472-7373 Ext 112, [email protected]
12
Jaguar Investments (Commodity)
Consistency Index & Recovery Profile
Manager Background
COLIN O'NEILL: April 2002 through Present - Jaguar Investments Ltd, Director; February 2001 through March 2002 - Gollyhott Trading Ltd,
Investment Manager; 2000 through January 2001 - Koch Industries Inc, Head of Global Metals Trading; October 1996 through June 2000 Standard Bank London Ltd, Head of Metals Trading; May 1993 through September 1996 - JP Morgan, Vice President, Head of Base Metals
Trading; September 1986 through April 1993 - N.M Rothschild And Sons Ltd, Assistant Manager/Bullion Trader. ANTHONY COOTE: April 2002
through Present -Jaguar Investments Ltd, Director; October 2000 through March 2002 - Gollyhott Trading Ltd, Investment Manager; October
1996 - September 2000 - Standard Bank London Ltd, Head of Aluminum and Nickel Trading, and subsequently Head of Metals Trading; April
1995 - September 1996 - JP Morgan, Vice President, Aluminum; May 1987 through April 1995 - N.M. Rothschild And Sons Ltd, Manager of
Bullion Trading; March 1979 - through April 1987 - Johnson Matthey Bankers & Johnson Matthey Commodities, Operations Clerk/Junior
Jaguar Investments Limited is a UK based investment manager offering access to liquid, exchange-traded commodity
futures and options through two investment programs. Both programs focus on both fundamental and technical inputs.
Typically the philosophy is to capture both short-term price fluctuations and longer term trends to generate solid capital
growth over the medium term. The portfolio utilises a disciplined and robust risk management system which aims to
maintain monthly return volatility at less than 10%, with maximum drawdown contained to less than 15%.
Past performance is not necessarily indicative of future results. Futures trading and hedge fund investing involves risk of loss and is not suitable for
everyone.
Mt Rushmore Securities LLC, 1703 Padmavani Lane Ste A, Fairfield, IA 52556
Tel. 641-472-7373 Ext 112, [email protected]
13
John Locke Inv (Cyril HF)
Consistency Index & Recovery Profile
Overview
Avg Return (CROR):
Max Drawdown:
1,350
1,300
1,250
1,200
1,150
1,100
1,050
1,000
950
900
2.64%
13.79%
0.00
SharpeRatio:
Cur% of Avg-Low 12 mo Spread:
Cur %of Best-Avg 12 mo Spread:
78%
0%
Months Trading:
Jan-10
Jan-09
Jan-08
Jan-07
Jan-06
Adv Notice:
50,000
AUM:
Jan-05
Lev Avail:
66
Mininum:
Pd Red:
133,000,000
7
Monthly
12 Month Time Window:
Last
-5.0%
Avg
3.1%
Worst
-12.0%
Best
11.7%
Lows & Recoveries
After Max Draw, Peak Returns within:
Cur.
Draw
13.0%
Prior
Wrst
Draw
Prior
Wrst
Date
12 Mos
24 Mos
36 Mos
2.8%
Jul-05
11.7%
18.8%
27.0%
After 12 Mo Lows, Peak Returns within:
48 Mos
Last
12
Mos
Prior
Wrst
12 Mos
31.3%
-5.0%
-7.3%
Prior
Wrst
Date
12 Mos
Apr-09
24 Mos
36 Mos 48 Mos
3.0%
3.5%
3.0%
2.5%
2.0%
1.5%
1.0%
0.5%
0.0%
40.0%
30.0%
20.0%
10.0%
0.0%
12Mos
24Mos
36Mos
12Mos
48Mos
24Mos
36Mos
48Mos
Monthly Returns
Jan
Feb
Mar
Apr
May
Jun
2010
0.11%
-0.48%
-0.62%
-0.73%
1.43%
-0.50%
Jul
Aug
Sep
Oct
Nov
2009
2008
0.51%
-0.18%
0.44%
1.04%
-4.59%
0.81%
-6.13%
0.65%
2.59%
0.82%
0.44%
-0.77%
-2.19%
-0.80%
-1.13%
1.71%
-0.09%
0.15%
0.01%
3.14%
-0.43%
-1.82%
2007
0.11%
-1.15%
1.52%
0.28%
0.90%
1.36%
-0.89%
0.65%
1.66%
1.12%
2006
1.75%
-0.98%
2.31%
0.58%
1.04%
1.07%
0.59%
0.78%
0.25%
0.37%
2005
0.42%
0.65%
0.93%
0.64%
0.42%
0.86%
-2.84%
2.01%
0.66%
0.76%
Dec
YTDtxtCounter
MaxDD
-0.8%
-1.8%
-0.48%
0.15%
-10.8%
4.9%
-11.6%
-1.8%
0.12%
0.90%
6.7%
-1.2%
0.95%
0.82%
9.9%
-1.0%
0.67%
0.70%
6.0%
-2.8%
Past performance is not necessarily indicative of future results. Futures trading and hedge fund investing involves risk of loss and is not suitable for
everyone.
Mt Rushmore Securities LLC, 1703 Padmavani Lane Ste A, Fairfield, IA 52556
Tel. 641-472-7373 Ext 112, [email protected]
14
John Locke Inv (Cyril HF)
Consistency Index & Recovery Profile
Manager Background
FRANCOIS BONNIN, managing partner and fund manager, is active in research, risk management and computer programming. In 1986, he
graduated from the Institut Superieur de Gestion with an MBA (Paris-France), majoring in finance. In March 1992, he resigned from his
convertible bond trading desk manager position with Rafe SA to create Cap Stardex SA, a French regulated asset management company
dedicated to systematic investment. Based on pattern recognition and reversal moves analysis, he managed a systematic fund on equity
futures, achieving an average 10% return per annum over the first three years. In 1998, Francois sold his company and started a futures fund for
ING Group. His main orientation and interests continued to be systematic approach to investment management, new system implementation
and development of asset management models. In 2001, Francois created John Locke Investments to further implement strategies on computer
based trading systems.
The CYRIL HIGH FREQUENCY FUND has the objective to profit from the major up or down moves on a large set of
financial futures in order to produce every year a positive performance with a low correlation to stock and bond
markets indices. It targets an annualized net return above 10% with a volatility below 6% and a maximum draw-down
below 8%. The program is targeting over 10% annual return. The investment process relies on the systematic
application of high frequency computerized trading strategies on futures qualified within a quantified risk management
framework including predefined automatically applicable stop losses.
Past performance is not necessarily indicative of future results. Futures trading and hedge fund investing involves risk of loss and is not suitable for
everyone.
Mt Rushmore Securities LLC, 1703 Padmavani Lane Ste A, Fairfield, IA 52556
Tel. 641-472-7373 Ext 112, [email protected]
15
Macquarie Commodity Alpha SP
Consistency Index & Recovery Profile
Overview
Avg Return (CROR):
Max Drawdown:
1,300
1,250
1,200
1,150
6.86%
2.94%
1.15
SharpeRatio:
Cur% of Avg-Low 12 mo Spread:
Cur %of Best-Avg 12 mo Spread:
1,100
1,050
1,000
50%
0%
Months Trading:
950
900
Sep-09
Sep-08
Adv Notice:
50,000
AUM:
Sep-07
Lev Avail:
33
Mininum:
Pd Red:
193,000,000
7
Monthly
12 Month Time Window:
Last
2.8%
Avg
6.6%
Worst
-1.3%
Best
14.4%
Lows & Recoveries
After Max Draw, Peak Returns within:
Cur.
Draw
0.0%
Prior
Wrst
Draw
Prior
Wrst
Date
12 Mos
24 Mos
2.4%
Apr-08
12.2%
13.4%
36 Mos
After 12 Mo Lows, Peak Returns within:
48 Mos
Last
12
Mos
Prior
Wrst
12 Mos
2.8%
7.0%
Prior
Wrst
Date
12 Mos
Mar-09
24 Mos
36 Mos 48 Mos
3.4%
3.5%
3.0%
2.5%
2.0%
1.5%
1.0%
0.5%
0.0%
15.0%
10.0%
5.0%
0.0%
12Mos
24Mos
36Mos
12Mos
48Mos
24Mos
36Mos
48Mos
Monthly Returns
Jan
Feb
Mar
Apr
May
Jun
2010
0.12%
0.39%
1.11%
0.44%
2.05%
-2.56%
2009
2008
3.10%
1.26%
0.60%
1.01%
-2.21%
0.73%
0.70%
-2.45%
1.01%
2.70%
-0.03%
1.16%
2007
Jul
Aug
Sep
Oct
Nov
Dec
YTDtxtCounter
MaxDD
1.5%
-2.6%
0.29%
0.21%
1.42%
1.72%
-0.83%
-0.68%
0.13%
2.44%
0.56%
-0.72%
-2.80%
1.09%
1.8%
8.7%
-2.9%
-2.5%
1.41%
1.20%
2.00%
2.63%
7.4%
0.0%
Past performance is not necessarily indicative of future results. Futures trading and hedge fund investing involves risk of loss and is not suitable for
everyone.
Mt Rushmore Securities LLC, 1703 Padmavani Lane Ste A, Fairfield, IA 52556
Tel. 641-472-7373 Ext 112, [email protected]
16
Macquarie Commodity Alpha SP
Consistency Index & Recovery Profile
Manager Background
ADAM KIBBLE, BCOMM, is the head of the Global Fixed Interest and Currency team. With over 13 years experience in foreign exchange and
fixed interest management, Adam brings invaluable knowledge and market insight. Prior to the management of our clients' portfolios. Adam
has been responsible for the management of Macquarie's Global Bond Fund since we brought management in-house in 1998. During this time
the Fund has achieved consistent top-quartile performance. Currency is a significant source of value-add in this fund. From 1994 to mid 1998,
Adam managed our domestic fixed interest portfolios focusing on trading, security selection and sector allocations. The Macquarie Australian
Fixed Interest Fund was ranked top quartile against competitors in 1996, 1997 and 1998. Prior to joining Macquarie, Adam spent three years as
a portfolio manager at the Queensland Investment Corporation, where his responsibilities at various times included managing cash and fixed
interest, currency and global bonds. From 1988 to 1991, Adam was at JB Were Capital Markets, where his responsibilities were domestic
government and corporate bond sales and trading. WAYNE FITZGIBBON BEC(HONS), MEC, has overall responsibility for Macquarie's cash,
domestic and international fixed interest and currency products. He also has prime responsibility for the active Australian fixed interest funds.
From March 1999 to May 2000 Wayne was Head of Asset Allocation. He was Head of Fixed Interest from 1993 until September 1998. Prior to
joining Macquarie Wayne worked in London for two years with Bankers Trust. Wayne held the position of Senior Economist at Macquarie from
1987 to 1990. His early career was spent in the Commonwealth Public Service, mostly in the Commonwealth Treasury. When he left the
Treasury in 1987 he was head of the Monetary Policy Section. JORIS HILLMANN, Portfolio Manager - Currency, is responsible for trading and
position risk management within our currency portfolio management team. He joined us in April 2006. He has spent the past seven years at ING
Investment Management in The Hague, primarily in currency management. Joris has a strong track record in directional trading, volatility
trading and derivative risk management. From October 2003, he was responsible for managing a hedge fund specialising in G10 volatility
trading. During this time, he also managed currency and fixed income exposures on a proprietary basis for ING Insurance. Joris commenced
working at ING Investment Management in 1999, trading foreign exchange, interest rate swaps, futures and bonds. Joris is a Chartered Financial
Analyst and has a Master in Business Economics from the University of Groningen. ROB ANGUS, Head of Currency, oversees the entire currency
business which includes static currency, dynamic currency hedging and active currency. Robert is also responsible for Volatility trading; he is the
portfolio manager and leads the associated research and development initiatives for the product. Robert joined the global fixed interest and
currency team in April 2006 to develop new hedge fund capabilities, specifically in the area of Volatility trading. He joined Macquarie from
Merrill Lynch Japan, where from 2002 he headed the FX trading activities in the region and directly managed the risk for FX Options. Robert has
an impressive track record and a vast experience in volatility and correlation trading, portfolio management and quantitative R&D. His previous
responsibilities have included trading, structuring and managing regional and global businesses. Prior to Merrill Lynch he held senior risk taking
roles at Citibank London, UBS London, and Westpac Sydney. His market experience extends from Currencies across Rates, Commodities and
Equities.
The MACQUARIE COMMODITY ALPHA SEGREGATED PORTFOLIO is an absolute return fund utilising trading strategies in
the commodities futures markets, developed in a joint venture between Macquarie's Funds Group and Macquarie's
Treasury and Commodities Group. The alpha strategies are predominantly relative value but also include absolute value
trades. The relative value trades include spread trades between different futures of the same commodity and spread
trades between different commodities which have a fundamental link. The fund's strategies are fundamentally based,
quantitative in nature and systematically tested and developed. Trades are triggered through a quantitative process but
discretion is used to implementing trades and to managing the portfolio of trades, using shorter term fundamental
information. Risk within the portfolio is measured and constrained using a VaR approach. The portfolio has a total VaR
cap which takes into account the correlations of the different trades, and each individual trade has a VaR limit based on
a risk equalisation approach. The fund's cash, not required for margin, is invested in highly rated short term securities.
Assets reported are strategy assets.
Past performance is not necessarily indicative of future results. Futures trading and hedge fund investing involves risk of loss and is not suitable for
everyone.
Mt Rushmore Securities LLC, 1703 Padmavani Lane Ste A, Fairfield, IA 52556
Tel. 641-472-7373 Ext 112, [email protected]
17
Mapleridge Diversified 1X
Consistency Index & Recovery Profile
Overview
Avg Return (CROR):
Max Drawdown:
1,900
1,800
1,700
1,600
1,500
1,400
1,300
1,200
1,100
1,000
900
4.95%
11.64%
0.36
SharpeRatio:
Cur% of Avg-Low 12 mo Spread:
Cur %of Best-Avg 12 mo Spread:
Months Trading:
Jan-10
Jan-09
Jan-08
Jan-07
Jan-06
Jan-05
Jan-04
Jan-03
Jan-02
Jan-01
Adv Notice:
50,000
AUM:
Jan-00
Lev Avail:
138
Mininum:
Jan-99
58%
0%
Pd Red:
40,602,000
7
Monthly
12 Month Time Window:
Last
-3.3%
Avg
5.3%
Worst
-9.4%
Best
20.2%
Lows & Recoveries
After Max Draw, Peak Returns within:
Cur.
Draw
3.9%
Prior
Wrst
Draw
Prior
Wrst
Date
12 Mos
24 Mos
36 Mos
11.6%
Mar-07
19.7%
27.7%
28.9%
After 12 Mo Lows, Peak Returns within:
48 Mos
Last
12
Mos
Prior
Wrst
12 Mos
-3.3%
-9.4%
30.0%
30.0%
25.0%
25.0%
20.0%
20.0%
15.0%
15.0%
10.0%
10.0%
5.0%
5.0%
Prior
Wrst
Date
12 Mos
24 Mos
May-07
19.9%
27.0%
36 Mos 48 Mos
27.1%
0.0%
0.0%
12Mos
24Mos
36Mos
12Mos
48Mos
24Mos
36Mos
48Mos
Monthly Returns
Jan
Feb
Mar
Apr
May
Jun
2010
-0.56%
0.95%
-0.50%
0.21%
-1.00%
-1.22%
Jul
2009
2008
-0.23%
1.26%
-0.90%
1.26%
-0.45%
-0.57%
-0.06%
0.81%
3.06%
1.35%
-0.56%
1.23%
0.29%
0.62%
2007
0.62%
2.54%
-4.88%
0.29%
1.13%
0.93%
2006
1.51%
-1.93%
2.70%
2.11%
2.32%
0.77%
2005
-1.34%
-1.69%
0.06%
-1.50%
2.07%
2004
-1.23%
-1.11%
-0.64%
1.91%
2.41%
2003
1.14%
-1.24%
-0.76%
-0.19%
2002
0.11%
-1.68%
-1.00%
2001
-0.22%
-0.52%
2000
4.56%
1999
1.70%
Aug
Sep
Oct
Nov
-0.06%
1.40%
Dec
YTDtxtCounter
MaxDD
-2.1%
-2.5%
-0.70%
-0.48%
-0.4%
8.9%
-1.8%
-1.0%
0.36%
-0.98%
-0.85%
1.09%
-0.23%
1.57%
3.93%
4.08%
1.57%
0.03%
2.95%
0.78%
14.6%
-4.9%
0.31%
-3.62%
0.41%
0.36%
-1.30%
-6.08%
-2.8%
-10.0%
0.68%
2.64%
-0.07%
-0.08%
1.30%
0.09%
0.52%
2.6%
-4.4%
0.01%
2.09%
2.16%
-0.83%
2.46%
0.36%
1.76%
9.6%
-3.0%
1.85%
-1.04%
2.38%
-3.96%
2.53%
-1.48%
1.14%
-0.70%
-0.5%
-4.0%
2.54%
0.28%
2.12%
1.39%
0.68%
1.55%
-1.02%
1.92%
0.25%
7.3%
-2.7%
2.23%
2.44%
1.84%
0.60%
-0.32%
2.18%
0.27%
1.19%
-2.96%
2.34%
9.3%
-3.0%
0.48%
-2.86%
0.72%
3.39%
-1.27%
-0.30%
-1.28%
-0.63%
-1.27%
0.16%
1.57%
3.1%
-4.7%
0.14%
0.46%
2.10%
1.79%
-2.61%
2.88%
-0.47%
0.03%
1.26%
0.77%
0.74%
9.0%
-2.6%
Past performance is not necessarily indicative of future results. Futures trading and hedge fund investing involves risk of loss and is not suitable for
everyone.
Mt Rushmore Securities LLC, 1703 Padmavani Lane Ste A, Fairfield, IA 52556
Tel. 641-472-7373 Ext 112, [email protected]
18
Mapleridge Diversified 1X
Consistency Index & Recovery Profile
Manager Background
Randal Selkirk and Pierre Villeneuve, who have worked together since 1991 in the asset management industry, are the Managing Directors of
Mapleridge.
Mapleridge Capital Corporation is an alternative investment management company with a track record of providing
investment advice exceeding 10 years. The advice is based on proprietary trading strategies and portfolio management
processes that trade markets systematically. Our belief is that human behavior creates market movements that can be
modeled, including moves that result in prolonged trends, overextended prices and varying volatility over time. Our
trading strategies, developed by analyzing price action, are disciplined and systematic. They trade futures contracts in
the short term, a time frame where there are many opportunities to develop new strategies. The result is an
investment process that we believe is sustainable and that provides real diversification through returns with low to
negative correlation to those of other asset classes. Mapleridge is located in Toronto, Canada. Mapleridge provides
investment advice to Mapleridge Fund Limited, an investment fund domiciled in Bermuda, and to separately managed
accounts. Additional information about Mapleridge Fund Limited is available in its offering memorandum.
Past performance is not necessarily indicative of future results. Futures trading and hedge fund investing involves risk of loss and is not suitable for
everyone.
Mt Rushmore Securities LLC, 1703 Padmavani Lane Ste A, Fairfield, IA 52556
Tel. 641-472-7373 Ext 112, [email protected]
19
Mesirow Absolute Returns Strategy
Consistency Index & Recovery Profile
Overview
Avg Return (CROR):
Max Drawdown:
2,100
1,900
14.77%
1.61%
1.89
SharpeRatio:
1,700
1,500
Cur% of Avg-Low 12 mo Spread:
Cur %of Best-Avg 12 mo Spread:
1,300
Months Trading:
1,100
Mininum:
Jun-10
Jun-09
Jun-08
Jun-07
Jun-06
Jun-05
Lev Avail:
61
Adv Notice:
50,000
AUM:
900
126%
0%
Pd Red:
590,000,000
7
Monthly
12 Month Time Window:
Last
0.8%
Avg
14.5%
Worst
-1.3%
Best
39.1%
Lows & Recoveries
After Max Draw, Peak Returns within:
Cur.
Draw
0.3%
Prior
Wrst
Draw
Prior
Wrst
Date
12 Mos
24 Mos
1.6%
Jan-08
17.1%
17.1%
36 Mos
After 12 Mo Lows, Peak Returns within:
48 Mos
Last
12
Mos
Prior
Wrst
12 Mos
0.8%
3.6%
Prior
Wrst
Date
12 Mos
Jun-09
24 Mos
36 Mos 48 Mos
0.8%
1.0%
20.0%
0.8%
15.0%
0.6%
10.0%
0.4%
5.0%
0.2%
0.0%
0.0%
12Mos
24Mos
36Mos
12Mos
48Mos
24Mos
36Mos
48Mos
Monthly Returns
Jan
Feb
Mar
Apr
May
Jun
2010
0.33%
0.24%
-0.38%
0.27%
0.55%
0.32%
2009
2008
0.59%
-1.56%
0.07%
5.13%
-1.10%
2.94%
-0.14%
0.77%
0.62%
0.77%
2007
-0.13%
-1.20%
-0.20%
1.43%
2006
5.31%
-0.85%
0.44%
1.24%
2005
Jul
Aug
Sep
Oct
Nov
Dec
YTDtxtCounter
MaxDD
1.3%
-0.4%
-0.28%
1.72%
0.05%
0.55%
0.36%
1.77%
-0.62%
1.54%
-0.09%
0.69%
1.10%
0.15%
-1.30%
-0.85%
-0.8%
14.3%
-1.4%
-1.6%
0.76%
1.98%
-0.30%
-0.86%
3.94%
2.33%
2.00%
1.59%
11.8%
-1.5%
3.40%
2.47%
-0.14%
5.02%
3.08%
1.88%
2.36%
0.04%
26.9%
-0.8%
0.96%
3.21%
0.51%
4.86%
7.50%
0.48%
4.11%
23.5%
0.0%
Past performance is not necessarily indicative of future results. Futures trading and hedge fund investing involves risk of loss and is not suitable for
everyone.
Mt Rushmore Securities LLC, 1703 Padmavani Lane Ste A, Fairfield, IA 52556
Tel. 641-472-7373 Ext 112, [email protected]
20
Mesirow Absolute Returns Strategy
Consistency Index & Recovery Profile
Manager Background
Gary Klopfenstein - Senior Managing Director and Chief Investment Officer of Mesirow Financial Currency Management. Gary has over 20 years
experience in foreign exchange and is one of the top practitioners in the world in the field of currency risk management. His executive
responsibilities include developing the group's proprietary trading and risk management programs, overall responsibility for the investment
management processes and conceptualization and initiation of new research projects and investment products. Gary consults with clients on a
regular basis regarding currency risk management issues. In 1986, Gary founded the GK Group of Companies, a currency investment specialist
firm. Gary graduated from Illinois Wesleyan University in May 1985, Summa Cum Laude, with a BA in Business Administration. He is a
recognized leader in the field of currency risk management and has lectured at various conferences including the World Economic Congress. He
has authored the book, "Trading Currency Cross Rates" and edited the books, "FX: Managing Global Currency Risk" and "Strategic Trading in the
Foreign Exchange Markets
The objective of MFCM's CURRENCY ALPHA product is to achieve capital appreciation by engaging in foreign currency
transactions on a spot (cash) basis and by entering into forward foreign currency contracts (forward contract). MFCM's
Currency Alpha program is specifically tailored to institutional client's needs by designing the target portfolio's risk
characteristics, including expected return, standard deviation, drawdown risk, and downside volatility. Target returns
for Currency Alpha are 3% to 8% p.a. Portfolio leverage can be constrained by the client, but generally range from 0.2 to
1.0 with an average of 0.5.
Past performance is not necessarily indicative of future results. Futures trading and hedge fund investing involves risk of loss and is not suitable for
everyone.
Mt Rushmore Securities LLC, 1703 Padmavani Lane Ste A, Fairfield, IA 52556
Tel. 641-472-7373 Ext 112, [email protected]
21
P/E Investments (FX Standard)
Consistency Index & Recovery Profile
Overview
Avg Return (CROR):
Max Drawdown:
2,500
2,300
2,100
1,900
12.92%
15.01%
0.98
SharpeRatio:
Cur% of Avg-Low 12 mo Spread:
Cur %of Best-Avg 12 mo Spread:
1,700
1,500
1,300
33%
0%
Months Trading:
1,100
900
Oct-09
Oct-08
Oct-07
Oct-06
Oct-05
Oct-04
Adv Notice:
50,000
AUM:
Oct-03
Lev Avail:
81
Mininum:
Pd Red:
1,250,000,000
7
Monthly
12 Month Time Window:
Last
5.5%
Avg
11.5%
Worst
-6.5%
Best
27.2%
Lows & Recoveries
After Max Draw, Peak Returns within:
Cur.
Draw
5.3%
Prior
Wrst
Draw
Prior
Wrst
Date
12 Mos
24 Mos
36 Mos
15.0%
May-06
28.3%
32.4%
58.6%
After 12 Mo Lows, Peak Returns within:
48 Mos
Last
12
Mos
Prior
Wrst
12 Mos
74.3%
5.5%
-6.5%
80.0%
80.0%
60.0%
60.0%
40.0%
40.0%
20.0%
20.0%
Prior
Wrst
Date
12 Mos
24 Mos
Jun-06
27.1%
31.5%
36 Mos 48 Mos
57.2%
72.7%
0.0%
0.0%
12Mos
24Mos
36Mos
12Mos
48Mos
24Mos
36Mos
48Mos
Monthly Returns
Jan
Feb
Mar
Apr
May
Jun
2010
-2.15%
0.87%
5.28%
1.55%
-3.71%
-1.68%
2009
2008
-2.20%
-0.45%
1.11%
1.61%
3.83%
-1.51%
1.66%
5.20%
4.06%
2.13%
-1.44%
0.32%
2.48%
3.02%
-1.08%
4.77%
0.93%
1.52%
-0.20%
2.14%
-0.73%
-2.27%
2007
4.17%
-1.36%
-4.73%
2.15%
-1.34%
2.85%
1.32%
-1.80%
-0.18%
2.59%
2006
0.30%
-0.83%
-2.67%
-4.47%
-4.07%
0.94%
1.55%
5.08%
-0.89%
6.12%
2005
1.98%
3.52%
-1.64%
3.82%
0.62%
4.55%
-0.54%
-3.85%
7.49%
2004
5.00%
2.64%
1.01%
-4.49%
1.48%
-2.87%
3.08%
-4.31%
2.89%
10.65%
2003
Jul
Aug
Sep
Oct
Nov
Dec
YTDtxtCounter
MaxDD
-0.1%
-5.3%
4.21%
0.57%
13.1%
18.1%
-2.2%
-2.3%
-2.22%
-0.71%
0.4%
-6.0%
1.87%
6.75%
9.3%
-11.5%
3.63%
2.34%
-4.20%
18.4%
-4.4%
-0.55%
3.18%
2.06%
8.9%
-7.1%
3.25%
5.25%
20.2%
0.0%
Past performance is not necessarily indicative of future results. Futures trading and hedge fund investing involves risk of loss and is not suitable for
everyone.
Mt Rushmore Securities LLC, 1703 Padmavani Lane Ste A, Fairfield, IA 52556
Tel. 641-472-7373 Ext 112, [email protected]
22
P/E Investments (FX Standard)
Consistency Index & Recovery Profile
Manager Background
Warren Naphtal has extensive experience in portfolio management and securities trading. He is the co-founder of P/E Investments, and serves
as Chief Investment Officer. From 1993 to 1995, Mr. Naphtal was a Senior Vice President and Head of Derivative Strategies at Putnam
Investments, managing $3.5 billion. He was also responsible for Putnam’s commodity investments and foreign exchange overlay areas working
extensively with core clients in the U.S. and Japan. Mr. Naphtal served on Putnam’s Capital Market Committee, setting the firm’s overall
investment strategy and was a founding member of Putnam’s Risk Management Committee. From 1989 to 1993, Mr. Naphtal was a Managing
Director of Continental Bank, where his responsibilities included Head of Global Risk Management, Head of Proprietary Trading and Managing
Partner of Cardinal Capital Management. From 1987 to 1989, Mr. Naphtal was a Vice President of Continental Bank, where he was responsible
for Derivatives Trading. From 1985 to 1986, Mr. Naphtal traded equity options for O’Connor & Associates, a leading options trading concern
that was subsequently acquired by Swiss Bank. Mr. Naphtal is a graduate of the Sloan School of Management at M.I.T., where he was a COGME
Scholar, and received a S.M. in Management in 1985, and the University of California, Berkeley where he received a B.S. in Civil Engineering in
1983
The FX STANDARD program is unique in its use of a systematic dynamic process utilizing a Bayesian statistical approach.
The program invests in all major currencies by constructing an optimized portfolio that maximizes return for a given
volatility level. Specifically, the FX program utilizes several fundamental factors to forecast returns for each currency on
a weekly basis. These forecasted returns are combined with the current volatilities and correlations to determine
positions in each market that will yield a targeted risk level and maximum return. The process is systematic and
therefore reliable and the process is dynamic. Each variable is re-weighted depending on its effectiveness. As variables
become more effective they increase in weighting and as they become less useful, their weighting is automatically
reduced. In summary, the FX program is disciplined dynamic systematic fundamental process that is risk managed to a
risk level designated by the client. AUM represents all assets traded by P/E Investments
Past performance is not necessarily indicative of future results. Futures trading and hedge fund investing involves risk of loss and is not suitable for
everyone.
Mt Rushmore Securities LLC, 1703 Padmavani Lane Ste A, Fairfield, IA 52556
Tel. 641-472-7373 Ext 112, [email protected]
23
P/E Investments(GFI Program)
Consistency Index & Recovery Profile
Overview
Avg Return (CROR):
Max Drawdown:
4,400
3,900
10.81%
12.34%
0.86
SharpeRatio:
3,400
Cur% of Avg-Low 12 mo Spread:
Cur %of Best-Avg 12 mo Spread:
2,900
46%
0%
2,400
1,900
Months Trading:
1,400
Mininum:
AUM:
Oct-09
Oct-08
Oct-07
Oct-06
Oct-05
Oct-04
Oct-03
Oct-02
Oct-01
Oct-00
Oct-99
Oct-98
Oct-97
900
Lev Avail:
153
Adv Notice:
50,000
Pd Red:
102,000,000
7
Monthly
12 Month Time Window:
Last
3.1%
Avg
10.8%
Worst
-5.9%
Best
39.5%
Lows & Recoveries
After Max Draw, Peak Returns within:
Cur.
Draw
6.2%
Prior
Wrst
Draw
Prior
Wrst
Date
12 Mos
24 Mos
12.3%
Mar-08
23.4%
29.7%
36 Mos
After 12 Mo Lows, Peak Returns within:
48 Mos
Last
12
Mos
Prior
Wrst
12 Mos
3.1%
-5.9%
30.0%
25.0%
25.0%
20.0%
20.0%
Prior
Wrst
Date
12 Mos
24 Mos
Oct-06
12.8%
22.1%
36 Mos 48 Mos
22.1%
15.0%
15.0%
10.0%
10.0%
5.0%
5.0%
0.0%
0.0%
12Mos
24Mos
36Mos
12Mos
48Mos
24Mos
36Mos
48Mos
Monthly Returns
Jan
Feb
Mar
Apr
May
Jun
2010
-1.97%
0.78%
5.28%
1.31%
-4.05%
-2.24%
2009
2008
-3.22%
-2.46%
1.62%
-1.19%
4.35%
-5.95%
1.67%
9.75%
3.42%
5.13%
-1.32%
0.99%
2007
2.90%
-2.14%
-3.40%
1.32%
1.02%
2006
0.59%
-0.74%
-1.26%
-2.44%
-1.36%
2005
1.84%
1.87%
-1.83%
4.43%
1.93%
2004
5.72%
1.50%
1.38%
-5.14%
2003
3.74%
-0.17%
0.94%
2002
-0.55%
1.58%
2001
1.66%
2000
Jul
Aug
Oct
Nov
Dec
YTDtxtCounter
MaxDD
-1.2%
-6.2%
1.06%
1.20%
-0.58%
1.12%
-1.30%
-6.98%
4.68%
-2.25%
11.1%
1.7%
-3.2%
-9.4%
-0.02%
3.12%
-0.43%
-1.83%
-1.07%
3.1%
-5.5%
0.51%
-0.30%
2.47%
1.26%
4.52%
0.7%
-7.9%
0.45%
-1.12%
5.81%
3.63%
0.85%
-1.94%
21.1%
-1.9%
-0.79%
1.46%
-1.76%
1.17%
0.49%
1.09%
1.78%
5.2%
-7.6%
6.73%
1.16%
-5.38%
-0.38%
5.40%
5.49%
1.08%
2.79%
26.9%
-5.7%
1.57%
1.85%
4.03%
1.92%
1.61%
0.06%
-0.65%
0.14%
2.28%
14.0%
-0.7%
5.84%
-5.79%
-0.53%
1.79%
0.29%
2.28%
1.31%
1.43%
-0.47%
-0.82%
7.5%
-6.3%
1.36%
-0.26%
1.49%
-1.09%
-1.28%
1.84%
1.24%
1.22%
0.64%
1.67%
3.98%
14.3%
-2.4%
0.62%
-1.92%
0.86%
1.23%
0.43%
-1.07%
-0.82%
1.14%
2.32%
0.76%
1.22%
-1.37%
3.4%
-1.9%
0.45%
3.67%
3.84%
-0.13%
3.59%
2.46%
0.44%
4.51%
6.96%
-3.18%
0.61%
0.27%
25.7%
-3.2%
7.03%
0.75%
0.55%
8.4%
0.0%
2.32%
1.39%
-1.76%
2.07%
3.17%
0.67%
-1.84%
-0.48%
3.72%
-1.49%
3.29%
-0.56%
0.69%
2.78%
1999
1998
1997
Sep
Past performance is not necessarily indicative of future results. Futures trading and hedge fund investing involves risk of loss and is not suitable for
everyone.
Mt Rushmore Securities LLC, 1703 Padmavani Lane Ste A, Fairfield, IA 52556
Tel. 641-472-7373 Ext 112, [email protected]
24
P/E Investments(GFI Program)
Consistency Index & Recovery Profile
Manager Background
Warren Naphtal has extensive experience in portfolio management and securities trading. He is the co-founder of P/E Investments, and serves
as Chief Investment Officer. From 1993 to 1995, Mr. Naphtal was a Senior Vice President and Head of Derivative Strategies at Putnam
Investments, managing $3.5 billion. He was also responsible for Putnam’s commodity investments and foreign exchange overlay areas working
extensively with core clients in the U.S. and Japan. Mr. Naphtal served on Putnam’s Capital Market Committee, setting the firm’s overall
investment strategy and was a founding member of Putnam’s Risk Management Committee. From 1989 to 1993, Mr. Naphtal was a Managing
Director of Continental Bank, where his responsibilities included Head of Global Risk Management, Head of Proprietary Trading and Managing
Partner of Cardinal Capital Management. From 1987 to 1989, Mr. Naphtal was a Vice President of Continental Bank, where he was responsible
for Derivatives Trading. From 1985 to 1986, Mr. Naphtal traded equity options for O’Connor & Associates, a leading options trading concern
that was subsequently acquired by Swiss Bank. Mr. Naphtal is a graduate of the Sloan School of Management at M.I.T., where he was a COGME
Scholar, and received a S.M. in Management in 1985, and the University of California, Berkeley where he received a B.S. in Civil Engineering in
1983.
The GFI program employs a quantitative global macro strategy, using a proprietary quantitative Bayesian statistical
approach that attempts to forecast movements in G7 Fixed Income and Foreign Exchange markets. The quantitative
analysis studies both technical trends and macroeconomic fundamentals, and utilizes daily market data. P/E takes
long positions in relatively attractive, liquid markets and hedges with short positions in relatively less attractive, liquid
markets. Stochastic analysis of the fundamental factors in a systematic, disciplined format is pertinent to the firm’s
trade generation process. The system is run on a weekly basis using daily market data, and attempts to forecast market
movements for the
following week. The system utilizes four variable optimizations each week based on expected return, covariance
matrices, transaction costs, and liquidity conditions (for smaller markets). Data used in optimization ranges back from
1989 and is time weighted, meaning that more recent data is weighted more heavily. The system uses a Bayesian
statistical method to determine the optimal positions to enter given current market conditions based on specific
values of a set of fundamental inputs. Inputs The list of factors that are involved in signal generation is extensive. Each
series of data tracked by P/E’s system is used
to help gauge various aspects of the financial markets at any given time. Some of the key factors included in
determining investment ideas include: Interest Rates, Inflation,Correlated commodity price changes,Rate movement
and rate acceleration,Yield Curve Characteristics
Liquidity conditions. Because the manager believes investor focus changes over time, the Bayesian approach
dynamically incorporates
new information. As a result, a factor’s influence on a position could change over time.
Although at times holding periods may vary, trades are typically held between 4-8 weeks. Risk Management P/E uses
the JP Morgan Risk Metrics approach which employs a variance/covariance matrix; in which the last 12 daysreceives a
50% weighting. The manager looks to limit portfolio loss in any one month to 5%. As the portfolio approaches the 5%
limit, the system will reduce the exposure of the entire portfolio to a 2% STD. Over the following next 6 to 8 weeks, the
manager will
gradually bring the risk level back up to target. This methodology gives the model time to adjust to the changing
market environment. The manager has seen this limit applied three times in the past six and a half years. Generally,
these situations occur
when there is a structural change in the market, such as the Fed changing the direction of interest rate movements.The
strategy relies on a proprietary Bayesian statistical model to analyze fundamental factors in a disciplined format. One of
the strategy’s most positive attributes is that it adjusts for market changes. The process is quantitative and
adaptive but it does take some time to adjust to a major fundamental policy shifts. The strategy’s performance tends
to excel during periods of higher volatility.
Past performance is not necessarily indicative of future results. Futures trading and hedge fund investing involves risk of loss and is not suitable for
everyone.
Mt Rushmore Securities LLC, 1703 Padmavani Lane Ste A, Fairfield, IA 52556
Tel. 641-472-7373 Ext 112, [email protected]
25
Quantam (GSA)
Consistency Index & Recovery Profile
Overview
Avg Return (CROR):
Max Drawdown:
1,300
1,250
1,200
1,150
3.26%
7.07%
0.23
SharpeRatio:
Cur% of Avg-Low 12 mo Spread:
Cur %of Best-Avg 12 mo Spread:
1,100
1,050
1,000
79%
0%
Months Trading:
950
900
Aug-09
Aug-08
Aug-07
Aug-06
Aug-05
Adv Notice:
500000
AUM:
Aug-04
Lev Avail:
71
Mininum:
Pd Red:
11,460,000
0
Monthly
12 Month Time Window:
Last
-1.4%
Avg
3.7%
Worst
-5.9%
Best
12.7%
Lows & Recoveries
After Max Draw, Peak Returns within:
Cur.
Draw
4.6%
Prior
Wrst
Draw
Prior
Wrst
Date
12 Mos
24 Mos
36 Mos
2.8%
Jul-05
12.7%
20.3%
25.5%
After 12 Mo Lows, Peak Returns within:
48 Mos
Last
12
Mos
Prior
Wrst
12 Mos
26.1%
-1.4%
-2.8%
30.0%
100.0%
25.0%
80.0%
20.0%
Prior
Wrst
Date
12 Mos
Jun-09
24 Mos
36 Mos 48 Mos
0.0%
60.0%
15.0%
40.0%
10.0%
20.0%
5.0%
0.0%
0.0%
12Mos
24Mos
36Mos
12Mos
48Mos
24Mos
36Mos
48Mos
Monthly Returns
Jan
Feb
Mar
Apr
May
Jun
2010
0.62%
-0.69%
-1.26%
0.55%
2.32%
-0.26%
2009
2008
0.62%
0.30%
-0.39%
0.10%
-0.79%
0.23%
-1.37%
0.73%
-0.01%
0.34%
-0.71%
0.44%
2007
0.84%
0.15%
1.06%
0.80%
0.44%
2006
1.75%
-0.96%
2.29%
0.58%
1.04%
2005
0.42%
0.65%
0.93%
0.64%
0.42%
2004
Jul
Aug
Sep
Oct
Nov
Dec
YTDtxtCounter
MaxDD
1.2%
-1.9%
-0.38%
0.13%
-0.75%
0.45%
-0.49%
-1.48%
-0.05%
0.39%
-1.16%
0.61%
0.22%
-0.21%
-5.2%
2.0%
-5.9%
-1.5%
1.24%
-0.16%
-0.59%
1.63%
0.70%
-0.08%
0.51%
6.7%
-0.7%
1.07%
1.46%
1.11%
0.13%
0.19%
0.55%
0.05%
9.6%
-1.0%
0.86%
-2.84%
2.01%
0.66%
0.76%
0.67%
0.70%
6.0%
-2.8%
-0.17%
0.15%
-0.08%
-0.72%
0.39%
-0.4%
-0.8%
Past performance is not necessarily indicative of future results. Futures trading and hedge fund investing involves risk of loss and is not suitable for
everyone.
Mt Rushmore Securities LLC, 1703 Padmavani Lane Ste A, Fairfield, IA 52556
Tel. 641-472-7373 Ext 112, [email protected]
26
Quantam (GSA)
Consistency Index & Recovery Profile
Manager Background
MAXIME DUPONT, Founding Chairman & CEO. After graduating from engineer MS in 1994, Max started his career at Societe Generale Buenos
Aires, working on quantitative modeling on emerging currencies. Then he joined the headquarters in Paris where he worked for various trading
desks (rates / forex / commodities / derivatives). In the late 90s, he founded an IT company, where he hired 50 people developing industrial
real time systems for the web. In 2002, together with a partner, he started a new innovative company dedicated to the research and
development of predictive models on financial markets. In 2004, in order to prove the value of the results, he developed the trading automats
to run the resulting high frequency strategies, and launched Quantam, an asset management company with a French regulated mutual fund.
After 4 years of audited track-record, the program now manages up to 15'000 orders per day on the main futures exchanges, with a trading
level that went from 10 million US$ in 2004 to over 1 billion US$ today for approximately 75 clients worldwide.
GLOBAL STATISTICAL ARBITRAGE offered by Quantam is a high frequency systematic program managed through
automats supervised by their experienced managers, applying simultaneously more than 600 systematic strategies.
These strategies are based on the statistically proven persistent existence of very short-term behaviors in market
prices. The automats take mainly long and short positions on the most liquid electronic future contracts in worldwide
markets (i.e. US and Europe). Additionally, Quantam has invested in an intense R&D program that tracks new
opportunities on the most recent released electronic financial instruments. Quantam is diversified across many markets
(stocks, interest rates, forex, and commodities) and seeks absolute performance with both low volatility and correlation.
Past performance is not necessarily indicative of future results. Futures trading and hedge fund investing involves risk of loss and is not suitable for
everyone.
Mt Rushmore Securities LLC, 1703 Padmavani Lane Ste A, Fairfield, IA 52556
Tel. 641-472-7373 Ext 112, [email protected]
27
QuantMetrics Cap. Mgmt (Directional)
Consistency Index & Recovery Profile
Overview
Avg Return (CROR):
Max Drawdown:
1,300
1,250
1,200
1,150
1,100
1,050
1,000
SharpeRatio:
5.36%
3.07%
0.82
Cur% of Avg-Low 12 mo Spread:
Cur %of Best-Avg 12 mo Spread:
178%
0%
Months Trading:
950
900
Jan-10
Jan-09
Jan-08
Adv Notice:
50,000
AUM:
Jan-07
Lev Avail:
42
Mininum:
Pd Red:
226,000,000
7
Monthly
12 Month Time Window:
Last
-2.5%
Avg
5.7%
Worst
-2.7%
Best
16.5%
Lows & Recoveries
After Max Draw, Peak Returns within:
Cur.
Draw
3.1%
Prior
Wrst
Draw
Prior
Wrst
Date
12 Mos
3.1%
Oct-08
3.8%
24 Mos
36 Mos
After 12 Mo Lows, Peak Returns within:
48 Mos
Last
12
Mos
Prior
Wrst
12 Mos
-2.5%
1.0%
Prior
Wrst
Date
12 Mos
Jun-09
24 Mos
36 Mos 48 Mos
0.0%
100.0%
4.0%
80.0%
3.0%
60.0%
2.0%
40.0%
1.0%
20.0%
0.0%
0.0%
12Mos
24Mos
36Mos
12Mos
48Mos
24Mos
36Mos
48Mos
Monthly Returns
Jan
Feb
Mar
Apr
May
Jun
2010
-0.48%
1.26%
-0.13%
-0.22%
-0.90%
-0.05%
Jul
Aug
Sep
Oct
Nov
2009
2008
-0.27%
2.43%
0.86%
0.86%
0.50%
-0.28%
-0.59%
0.75%
0.29%
1.77%
-0.26%
4.05%
-0.11%
-0.66%
-0.16%
1.70%
-0.73%
-2.24%
-0.54%
-0.85%
0.19%
2.20%
2007
2.09%
1.35%
2.89%
-0.30%
0.68%
0.16%
-0.67%
-0.61%
1.87%
-0.77%
2.67%
Dec
YTDtxtCounter
MaxDD
-0.5%
-1.3%
-0.67%
0.44%
-1.5%
10.5%
-2.6%
-3.1%
1.12%
10.9%
-1.3%
Past performance is not necessarily indicative of future results. Futures trading and hedge fund investing involves risk of loss and is not suitable for
everyone.
Mt Rushmore Securities LLC, 1703 Padmavani Lane Ste A, Fairfield, IA 52556
Tel. 641-472-7373 Ext 112, [email protected]
28
QuantMetrics Cap. Mgmt (Directional)
Consistency Index & Recovery Profile
Manager Background
DR. MUSHTAQ SHAH, Research Having graduated from Cambridge University with a MPhil in Economics, Mushtaq joined UBS as an economist.
He then went back to university to complete a PhD in Financial Econometrics at the LSE. At the same time he consulted for Goldman Sachs.
Mushtaq joined Goldman Sachs full time in 1992 working as part of the Extel and Institutional Investor rated strategy team. Dr Shah left
Goldman in 1995 and joined Bank of America where he worked as a proprietary trader. He joined CSFB in 1996 as a proprietary trader and
became the head of convertible trading in 1998. After several successful years he left CSFB and went on to run the Eclipse 1 fund at Equinox
Capital Management Ltd. Mushtaq left to co-found QuantMetrics with James. DR. GERARD GENNOTTE - Trading Gerard received his PhD in
finance and MS in engineering from MIT and a degree in maths and physics from the Ecole Polytechnique in Paris. He taught and did research at
UC Berkeley, the University of Chicago and the Universitat Autonoma de Barcelona. He then became Head of Research (London) at Long Term
Capital Management where he co-managed the Italian fixed income book. Gerard later was a partner at JWM Partners where he co-managed
equity strategies. JAMES FOWLER, Trading After graduating from Oxford University with a Masters in Engineering Science, James joined Credit
Suisse First Boston as a proprietary trader in the Equity Derivatives and Convertibles Group working closely with Dr Shah. After several
successful years he left to trade convertible bonds for Och-Ziff Capital in New York. He later returned to London to team up with Dr Shah at
Equinox Capital Management Ltd. and launched the Eclipse 1 Fund, a multi-strategy arbitrage fund. After three profitable years he left to cofound QuantMetrics with Mushtaq.
The QUANTMETRICS DIRECTIONAL STRATEGY is a quantitative directional futures strategy. The program aims to
provide investors with long-term capital appreciation by realising short-term gains. The investment approach identifies
and captures market inefficiencies using statistical and econometric models. The strategy employs a collection of high
frequency futures trading strategies with holding periods ranging from 10 minutes to 1 day. As the strategy selectively
chooses the timing of trades, it is ideally positioned to benefit from price shocks. Disciplined risk management is built
into each trading algorithm, with time stops and stop losses strictly adhered to. Returns are net of fees excluding
interest.
Past performance is not necessarily indicative of future results. Futures trading and hedge fund investing involves risk of loss and is not suitable for
everyone.
Mt Rushmore Securities LLC, 1703 Padmavani Lane Ste A, Fairfield, IA 52556
Tel. 641-472-7373 Ext 112, [email protected]
29
Rhicon Currency Mgmt (Strategic)
Consistency Index & Recovery Profile
Overview
Avg Return (CROR):
Max Drawdown:
1,800
1,700
1,600
1,500
1,400
1,300
1,200
1,100
1,000
900
SharpeRatio:
7.33%
6.37%
0.68
Cur% of Avg-Low 12 mo Spread:
Cur %of Best-Avg 12 mo Spread:
118%
0%
Months Trading:
Jan-10
Jan-09
Jan-08
Jan-07
Jan-06
Jan-05
Adv Notice:
50,000
AUM:
Jan-04
Lev Avail:
78
Mininum:
Pd Red:
350,000,000
7
Monthly
12 Month Time Window:
Last
-3.4%
Avg
7.0%
Worst
-4.4%
Best
17.3%
Lows & Recoveries
After Max Draw, Peak Returns within:
Cur.
Draw
5.0%
Prior
Wrst
Draw
Prior
Wrst
Date
12 Mos
24 Mos
36 Mos
6.4%
Jan-05
13.8%
17.1%
29.6%
After 12 Mo Lows, Peak Returns within:
48 Mos
Last
12
Mos
Prior
Wrst
12 Mos
47.9%
-3.4%
-1.8%
Prior
Wrst
Date
12 Mos
24 Mos
Sep-06
12.5%
31.6%
36 Mos 48 Mos
34.9%
35.0%
30.0%
25.0%
20.0%
15.0%
10.0%
5.0%
0.0%
50.0%
40.0%
30.0%
20.0%
10.0%
0.0%
12Mos
24Mos
36Mos
12Mos
48Mos
24Mos
36Mos
48Mos
Monthly Returns
Jan
Feb
Mar
Apr
May
Jun
2010
0.02%
0.34%
-0.59%
-1.06%
1.19%
-0.51%
Jul
2009
2008
-1.08%
-0.08%
-0.59%
3.00%
-0.34%
-0.79%
-0.50%
2.68%
1.87%
-0.46%
-1.03%
-0.58%
-1.08%
1.04%
2007
-0.43%
0.04%
2.55%
0.32%
-0.09%
-0.08%
3.07%
2006
-1.84%
-2.82%
-0.48%
3.24%
-1.98%
0.22%
1.34%
2005
-2.00%
3.86%
0.72%
-4.26%
3.48%
4.52%
2.42%
2004
-0.54%
3.02%
5.84%
2.12%
1.38%
-1.34%
5.06%
Aug
-0.22%
6.23%
Sep
Oct
Nov
Dec
YTDtxtCounter
MaxDD
-0.6%
-1.6%
-0.53%
1.51%
-4.4%
14.1%
-4.4%
-1.0%
0.50%
-0.25%
-0.49%
2.03%
-0.95%
-0.80%
0.53%
0.29%
2.59%
0.51%
1.86%
11.7%
-0.4%
-1.00%
-0.24%
1.27%
5.52%
-0.93%
2.0%
-5.1%
0.12%
0.48%
-2.14%
2.76%
1.36%
11.5%
-4.3%
2.86%
0.56%
-3.90%
0.42%
-1.00%
15.0%
-4.5%
Past performance is not necessarily indicative of future results. Futures trading and hedge fund investing involves risk of loss and is not suitable for
everyone.
Mt Rushmore Securities LLC, 1703 Padmavani Lane Ste A, Fairfield, IA 52556
Tel. 641-472-7373 Ext 112, [email protected]
30
Rhicon Currency Mgmt (Strategic)
Consistency Index & Recovery Profile
Manager Background
PETER JACOBSON started his career in foreign exchange in 1993 at Citibank Sydney, and thereafter at Swiss Bank Corporation in Geneva in 1995.
From 1996 he headed the European Currency desk at Goldman Sachs International Finance in London until 1998 when he relocated to expand
and develop the spot currency desk for Goldman Sachs International Bank in Tokyo. In 1999 He resigned to develop a proprietary currency
trading company with Mr McLaughlin, ForexTechnicals Ltd. Following upon its success, they teamed up with Mr Brandon to start Rhicon
Currency Management in 2000. Mr Jacobson holds a BA in Economics from the University of Sydney. CHRISTOPHER BRANDON joined Swiss
Bank Corporation in Geneva in 1995 and relocated to SBC Warburg London in 1996, as a senior currency trader. He moved to UBS Warburg
Singapore in early 1999 as a proprietary trader and the senior technical analyst in Asia, providing technical expertise to the bank's major
institutional customers. He resigned in 2000 and co-founded Rhicon Currency Management that same year. He holds an MA (Hons) in
Economics from the University of Edinburgh. RYAN MCLAUGHLINjoined AIG Trading in Greenwich, CT in 1992 as part of the Foreign Exchange
trading desk. In 1995 he moved to Banque National de Paris in New York as a senior dealer and European markets specialist. From early 1997 he
served as a senior trader and vice president at Commerzbank New York. He resigned from Commerzbank in mid 1998 to continue trading
currencies as a private trader and in 1999 co-founded ForexTechnicals Ltd with Mr Jacobson. Continuing their partnership he co-founded Rhicon
Currency Management the following year. Mr McLaughlin holds a BA from the University of Michigan.
The RHICON STRATEGIC PROGRAM is a short to medium-term discretionary trading strategy focused on currencies. The
strategy applies technical analysis to implement fundamental, market or purely technical views. The individual trading
approaches of Rhicon's three Investment Managers are combined to capture profits across three different time frames.
The methodology benefits from a uniquely robust risk management framework, coupled with diversification over
managers and time periods. AUM reflects total strategy assets. The investment managers independently generate their
own study of the market, a process that benefits from each their individual expertise. Each manager assesses
fundamental, technical and market developments, across their chosen time frame. Whilst there is a strong degree of
collaboration and discussion, trading decision- making is entirely autonomous. The approach is applied predominantly
to the G-10 currency markets, although liquid emerging market currencies are often traded. Trades are typically
implemented via the cash spot market although options can also be used. The managers thus benefit from a broad set
of markets and instruments to best implement a trading view to generate absolute returns. The three managers each
trade one of the following books, depending on their natural expertise and trading experience. Intra-day trading [Ryan
McLaughlin] - applying pattern recognition, candlestick methodology, oscillators and short-term moving averages. The
focus is on active trading, concentrated in few positions with strict risk management. The manager benefits from his
experience as a premier market-maker with a network of market information providers. Within this book there are
typically 50-60 trades per month, with positions rarely being held for more than 1-2 days. Short-term trading
[Christopher Brandon] - the emphasis is on identifying strong technical setups using a set of proprietary tools developed
over the past decade. These comprise a unique combination of classic technical analysis such as candlesticks and
pattern recognition with an array of market specific studies such as oscillator divergence and ichimoku clouds. The
focus is on identifying vulnerable points in the market that can lead to a change in short-term sentiment. There are
typically 20-25 trades per month, with positions being held from within an intra-day basis to approximately 5 days.
Medium-term trading [Peter Jacobson] - seeks to capture somewhat broader technical set-ups and fundamental
developments. The manager benefits from his experience at evaluating investor sentiment and the market's mis-pricing
of potential economic outcomes. Technical analysis is used to judge how best to implement an established view. The
technical focus is to find the optimal application of a trade idea - which market instruments to be traded, entry levels,
expected profit potential, and most importantly the stage at which a position no longer conforms to the original view.
There are typically ten trades per month, with these being held from 1-2 days to 2-3 weeks.
Past performance is not necessarily indicative of future results. Futures trading and hedge fund investing involves risk of loss and is not suitable for
everyone.
Mt Rushmore Securities LLC, 1703 Padmavani Lane Ste A, Fairfield, IA 52556
Tel. 641-472-7373 Ext 112, [email protected]
31


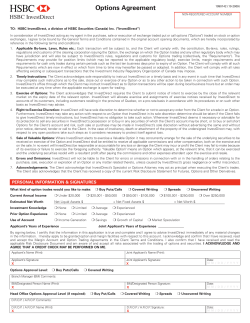


© Copyright 2026