
Aggregate and Soil Proficiency Sample Testing Program for 2013
Ministry of Transportation Materials Engineering and Research Office Report Aggregate and Soil Proficiency Sample Testing Program for 2013 MERO-048 Technical Report Documentation Page Publication Title Aggregate and Soil Proficiency Sample Testing Program for 2013 Author(s) Mark Vasavithasan, Carole Anne MacDonald, Stephen Senior Originating Office Soils and Aggregates Section, Materials Engineering and Research Office Report Number MERO-048; ISBN 978-1-4606-3850-7 (Print, 2013 ed.); ISBN 978-1-4606-3851-4 (PDF, 2013 ed.) Publication Date March 2014 Ministry Contact Soils and Aggregates Section, Materials Engineering and Research Office Highway Standards Branch, Ontario Ministry of Transportation Room 220, Building C, 1201 Wilson Avenue Downsview, Ontario, Canada M3M 1J8 Tel: (416) 235-3735; Fax: (416) 235-4101 Abstract The Materials Engineering and Research Office, Soils and Aggregates Section, conducts a proficiency sample testing program for aggregate and soil materials each year to provide a means for participating laboratories to see if they are performing satisfactorily. We also conduct a sample testing program for the tests related to Superpave consensus properties of aggregates. This is conducted along with our annual Aggregate and Soil Proficiency Sample Testing Program. The laboratories are asked to perform a number of different tests on pairs of samples that have been prepared and randomly selected at the MTO Laboratory. The samples are delivered to the participating laboratories starting in June, and they report their results starting in early August. A preliminary report issued in the second week of September allows the laboratories to examine their procedures or equipment and correct any problems that may have occurred. This is the final report for both the Aggregate and Soil Proficiency Samples and Superpave Consensus Property Testing for 2013. This year, two hundred and thirty-three participants from the private and public sector participated in the Aggregate and Soil Proficiency Sample Testing Program. Sixty-seven laboratories from the private sector and MTO Downsview laboratory reported results for all four of the Superpave consensus property tests. Results of the aggregate and soil tests from the 2013 program are found to be consistent with the results reported in the last three years, but, in majority of the tests, the multilaboratory variations show noticeable improvements over the ASTM, AASHTO or MTO precision estimates where available. Although there is improvement in the multi-laboratory variations, strong laboratory biases still remain in few of the aggregate tests, and all of the soil and Superpave test procedures. We expect that the mandatory Laboratory Quality System implemented by CCIL and their lab inspection process will bring about improvements in multi-laboratory variations. Key Words Aggregate, consensus property, correlation, laboratory, proficiency testing, soil, Superpave Distribution Unrestricted technical audience. Ministry of Transportation Materials Engineering and Research Office Report MERO-048 ISSN 1917-3415 (Print) ISSN 1925-4490 (Online) Aggregate and Soil Proficiency Sample Testing Program for 2013 March 2014 Prepared by: Mark Vasavithasan, Carole Anne MacDonald and Stephen Senior Materials Engineering and Research Office Soils and Aggregates Section Ontario Ministry of Transportation 1201 Wilson Avenue Downsview, Ontario, Canada M3M 1J8 Tel: (416) 235-3735; Fax (416) 235-4101 Published without prejudice as to the application of the findings. Crown copyright reserved -i- Table of Contents Executive Summary ......................................................................................................... iv 1. Introduction ............................................................................................................1 2. Test Results .............................................................................................................3 2.1 Table Of Test Results ......................................................................................... 3 2.2 Scatter Diagrams ................................................................................................ 4 2.3 Outliers ............................................................................................................. 10 3. Discussion..............................................................................................................12 3.1 Notes On Material Sources ............................................................................... 12 3.2 Notes On Sample Preparation .......................................................................... 12 3.3 Notes On Individual Tests ................................................................................ 13 3.4 Proficiency Sample Tests ................................................................................. 14 3.4.1 LS-601 - Wash Pass 75 m (Coarse Aggregate) – Test No. 1 .................. 14 3.4.2 LS-602 - Sieve Analysis (Coarse Aggregate) – Test Nos. 2 to 6 .............. 14 3.4.3 LS-603 - Los Angeles Abrasion Loss (Coarse Aggregate) – Test No. 8 ... 15 3.4.4 LS-604 - Relative Density of Coarse Aggregate – Test No. 9 and ............ 15 Absorption of Coarse Aggregate – Test No. 10 .................................................... 15 3.4.5 LS-606 - Magnesium Sulphate Soundness (CA) – Test No. 11 ................ 16 3.4.6 LS-607 - Percent Crushed Particles – Test No. 12 and ............................. 16 Percent Cemented Particles – Test No. 7 .............................................................. 16 3.4.7 LS-608 - Percent Flat and Elongated Particles – Test No. 13 ................... 17 3.4.8 LS-609 - Petrographic Analysis (Coarse Aggregate) – Test No. 14 ......... 18 3.4.9 LS-616 - Petrographic Examination (Fine Aggregate) – Test No. 15 ....... 20 3.4.10 LS-618 - Micro-Deval Abrasion (Coarse Aggregate) – Test No. 16 ........ 22 3.4.11 LS-614 - Freeze-Thaw Loss – Test No. 17 ............................................... 22 3.4.12 LS-602 - Sieve Analysis (Fine Aggregate) – Test Nos. 20-25 .................. 23 3.4.13 LS-605 - Relative Density of Fine Aggregate – Test No. 27 and .............. 24 Absorption of Fine Aggregate – Test No. 28 ........................................................ 24 3.4.14 LS-621 - Amount of Asphalt Coated Particles – Test No. 30 ................... 24 3.4.15 LS-623 - Moisture-Density Relationship (One-Point) – Test Nos. 31-33 . 25 3.4.16 LS-619 - Micro-Deval Abrasion (Fine Aggregate) – Test No. 34 ............ 25 3.4.18 LS-702 - Particle Size Analysis of Soil – Test Nos. 40-45 ....................... 26 3.4.19 LS-703 and 704 - Atterberg Limits of Soil – Test Nos. 46-48 .................. 26 3.4.20 LS-705 - Specific Gravity of Soils – Test No. 49 ..................................... 26 3.5 Superpave Consensus Property Tests ............................................................... 27 3.5.1 LS-629 - Uncompacted Void Content (FA) – Test No. 95 ....................... 27 3.5.2 ASTM D 2419 - Sand Equivalent Value of Fine Aggregate - Test No. 9628 3.5.3 ASTM D 5821 - Percent of Fractured Particles – Test No. 97.................. 28 3.5.4 ASTM D 4791 - Percent Flat and Elongated Particles – Test No. 99 ....... 28 4. Laboratory Rating System ..................................................................................30 5. Conclusions ...........................................................................................................33 6. Recommendations ................................................................................................34 7. Acknowledgments ................................................................................................35 MTO Aggregate and Soil Proficiency Sample Testing Program for 2013; MERO-048 - ii - References .........................................................................................................................36 Appendix A: Glossary of Terms .....................................................................................37 Appendix B1: List of Participants ..................................................................................39 Appendix B2: List of Participants ..................................................................................54 Appendix C: Multi-Laboratory Precision .....................................................................58 Appendix D1: Scatter Diagrams .....................................................................................64 Appendix D2: Scatter Diagrams ...................................................................................102 Appendix E1: Petrographic Results of Coarse Aggregate .........................................106 Appendix E2: Petrographic Results of Fine Aggregate ..............................................112 Appendix F1: Production Laboratory Ratings ...........................................................116 Appendix F2: Full Service Aggregate Laboratory Ratings .......................................122 Appendix F3: Soil Laboratory Ratings ........................................................................125 Appendix F4: Superpave Laboratory Ratings ............................................................126 MTO Aggregate and Soil Proficiency Sample Testing Program for 2013; MERO-048 - iii - List of Tables Table 1. Summary of Results for Laboratory 47 ............................................................................ 5 Table 2. Summary of Results for Laboratory 47 ............................................................................ 6 Table 3. Summary of Results for Laboratory 47 ............................................................................ 7 Table 4. Summary of Results for Laboratory 47 ............................................................................ 8 Table 5. Insoluble Residue Test Results (LS-613) ........................................................................ 20 List of Figures Figure 1. Figure 2. Figure 3. Figure 4. Figure 5. Examples of Scatter Diagrams ......................................................................................... 9 Production Laboratory Ratings....................................................................................... 31 Full Service Laboratory Ratings..................................................................................... 31 Soil Laboratory Ratings ................................................................................................... 32 Superpave Laboratory Ratings ....................................................................................... 32 MTO Aggregate and Soil Proficiency Sample Testing Program for 2013; MERO-048 -iv- Executive Summary The Soils and Aggregates Section of the Materials Engineering and Research Office runs an annual proficiency sample testing program for aggregate and soil tests. This program provides a means for participating laboratories to see if they are performing satisfactorily. The laboratories are asked to perform a number of different tests on randomly selected pairs of samples that have been prepared by the MTO Soils and Aggregates Laboratory. The samples are delivered to the participating laboratories starting in June and the laboratories are required to report their results by the second week of August. A preliminary report issued in early September gives feedback to the participants while they are still operational in the current year. This allows them to examine their procedures or equipment and correct any problems that may exist. A final report is issued after analysis of the data has been completed. This is the final report for the 2013 MTO Aggregate and Soil Proficiency Sample Testing and the Superpave Aggregate Consensus Property Testing Programs. Proficiency test samples in duplicates were shipped to two hundred and thirty-eight private and public sector laboratories. Two hundred and thirty-three of the laboratories that requested samples submitted test results in 2013. Of these, one hundred and fifty-five were aggregate producers’ and road builders’ Quality Control (QC) laboratories. The remainder were engineering testing consultants’ and owners’ laboratories. Participation in this program is mandatory for laboratories conducting quality assurance (QA) and referee testing work for MTO contracts. However, participation is optional for laboratories that do quality control (QC) testing for contractors. In general, contractor and supplier laboratories are conducting particle size analysis, wash pass 75 m, percent crushed particles, percent asphalt coated particles, percent flat and elongated and density tests for granular base and sub-base aggregates. In 2013, seventy-four laboratories reported results for one or more of the tests related to Superpave aggregate consensus properties. The laboratories that participate in this program conduct uncompacted void content of fine aggregate, sand equivalent value of fine aggregate, percent of fractured particles in coarse aggregate, and percent flat particles, elongated particles, or flat and elongated particles in coarse aggregate tests, in accordance with the ASTM/AASHTO test methods. Reports to individual laboratories contain ratings for each test method, which are based on the standardized deviate for that test (i.e. a rating of 5 for data within 1.0 standard deviation of the mean, a rating of 0 for data 3.0 or more standard deviations from the mean). Ratings of each test method are also used to calculate an overall laboratory rating for each category of tests. This rating system has acted as an incentive for laboratories to improve their performance. The rating is also used as a guide by MTO to select laboratories for its quality assurance testing and for qualifying referee laboratories. MTO Aggregate and Soil Proficiency Sample Testing Program for 2013; MERO-048 -v- Results of the aggregate and soil tests from the 2013 program are found to be consistent with the results from previous years and, in majority of these tests, the multi-laboratory variations show noticeable improvements over the precision estimates published by AASHTO, MTO, or ASTM. Particularly, sieve analysis of coarse aggregates, Los Angeles abrasion, relative density and absorption (coarse and fine), percent crushed particles of coarse aggregates, Micro-Deval abrasion of coarse and fine aggregates, amount of asphalt coated particles, and moisture density relationship (one-point Proctor) show improvements over the precision estimates published by ASTM or MTO. Although the precision of most of the aggregate test methods compares favourably in relation to the results of previous studies and the precision estimates where available, strong laboratory biases still remain in few of the aggregate test methods. The variations in soil test results show improvement and are lower than the values reported in the previous three years of study, but the scatter plots of all three soil tests show a strong laboratory bias. The results of Superpave consensus property tests from the 2013 program also compare favourably with the past performance of the laboratories. The variations of two of the tests in the program were found to be consistent with that of the values reported in the past three years and the values published in ASTM precision statements. The scatter diagrams for all four of the Superpave tests show strong laboratory biases. The Soils and Aggregates Section continues to carry out the inspection of laboratories providing soil testing services to the ministry. This inspection is being done at the request of laboratories. The laboratories that are inspected and accepted by MTO must request a reinspection if a technician who demonstrated the tests during inspection is no longer available or there has been any change in the equipment. To date, forty-nine laboratories have been inspected. Thirty-four of these laboratories are on the MTO Vendors List to do testing of soils for MTO work. MTO Aggregate and Soil Proficiency Sample Testing Program for 2013; MERO-048 -1- 1. Introduction This is the final report of the 2013 interlaboratory testing program organized by MTO for aggregate and soil test methods. It is primarily intended to provide a means for laboratories used by MTO to see if they are performing satisfactorily and to qualify these laboratories to perform quality assurance and referee testing for MTO contracts1. The design of the testing program is based on procedures for determining the precision and variability of test methods. Interested readers should refer to ASTM C6702, C8023, E1774, and E1785 for further information on interlaboratory testing programs. Proficiency test samples were distributed to two hundred and thirty-eight participants from the private and public sector laboratories. A total of two hundred and thirty-three laboratories reported results for the Aggregate and Soil Proficiency Sample Testing Program conducted in the summer of 2013. The participants were also asked to submit results for Superpave aggregate consensus property tests, if they were equipped to perform those tests. Sixty-eight laboratories submitted results for all of the tests related to the consensus properties. Participants in both testing programs included the MTO laboratory in Downsview, the remainder being from the private sector (contractors, aggregate producers, and engineering consultants), and municipalities. Samples were delivered to laboratories in early June. A preliminary report was issued to the participants in early September. Reports to individual laboratories contain ratings for each test method, which are based on the standardized deviate for that test (i.e. a rating of 5 for data within 1.0 standard deviation of the mean, a rating of 0 for data 3.0 or more standard deviations from the mean). Ratings of each test method are also used to calculate an overall laboratory rating. This rating system has acted as an incentive for laboratories to improve their performance. The computer program that was developed by MTO to handle the computation and presentation of test data has two statistical methods, namely the Critical Value Method recommended in Section 4 of ASTM E178 and the Iterative (Jackknife) Technique recommended by Manchester (1979), to detect outlying observations or outliers in a set of data. For details of the program, refer to the User’s Manual (report MERO-013) by Vasavithasan and Rutter, 2004. A number of statistical methods are available to test the hypothesis that the suspect observations are not outliers. MTO study often follows the Critical Value Method to remove outliers. However, the Jackknife method is used where the strict application of the critical value method tends to include extraneous results that may not stand the best chance of representing the testing performed in conformance with each of the test methods. The critical value method and iterative techniques are based on two different 1 Laboratories must also be inspected and recognized by the Canadian Council of Independent Laboratories (CCIL). 2 ASTM C670 Practice for Preparing Precision and Bias Statements for Test Methods of Construction Materials. 3 ASTM C802 Practice for Conducting an Inter-laboratory Test Program to Determine the Precision of Test Methods of Construction Materials. 4 ASTM E177 Practice for Use of Terms Precision and Bias in ASTM Test Methods. 5 ASTM E178 Practice for Dealing with Outlying Observations. MTO Aggregate and Soil Proficiency Sample Testing Program for 2013; MERO-048 -2- statistical approaches. As a result, the confidence intervals yielded by these two methods differ widely depending on the number of observations (number of laboratories participating in a particular test method) and the distribution of data. In the case of Iterative Technique, test results that fall beyond 2.8 times the standard deviation from the mean may be identified as outliers depending on the number of observations and distribution of data. The critical value used in this study is that value of the sample criterion, which would be exceeded by chance with some specified probability (significance level) on the assumption that all observations in the sample come from the same normally distributed population. The critical values provided in ASTM E178, Table 1 are limited to 147 observations, but over 200 laboratories participate in our annual testing program. The critical values that are being used for the MTO study were calculated at five percent significance level (Grubbs' test) based on Grubbs’ (1969 and 1972) recommendations for identifying outliers. MTO Aggregate and Soil Proficiency Sample Testing Program for 2013; MERO-048 -3- 2. Test Results 2.1 TABLE OF TEST RESULTS Each participant receives an individual summary of results for their laboratory. An example of a typical report is shown in Tables 1, 2, 3, and 4. Each Table of Results identifies the laboratory by number and compares the laboratory’s data with the means obtained after statistical analysis of the data received from all laboratories. The identity of the laboratories is kept confidential. Column 1 gives the test method as designated in the MTO Laboratory Testing Manual. Columns 2 and 3 show the test data submitted by the laboratory for a pair of samples. Columns 4 and 5 show the mean (average) test value for each sample after removal of outliers and/or invalid test results from the data set for all laboratories performing the test. Columns 6 and 7 list the standardized deviate for each test result. The standardized deviate is used to show how the individual test results compare to the mean. It is obtained by subtracting the mean of all data ( X ) from the actual test result reported by the laboratory ( X i ) and dividing by the standard deviation (s). That is: Standardized Deviate = X i X s If the test result is less than the mean, the standardized deviate is negative and, if the test result is greater than the mean, the standardized deviate is positive. In brief, the standardized deviate tells us how many standard deviations the test result is away from the mean. Columns 8 and 9 list the test method ratings, which are similar to the standardized deviate, but are in a simple numeric form. Ratings are determined as follows: Rating 5 - data within 1.0 standard deviation of the mean. Rating 4 - data within 1.5 standard deviations of the mean. Rating 3 - data within 2.0 standard deviations of the mean. Rating 2 - data within 2.5 standard deviations of the mean. Rating 1 - data within 3.0 standard deviations of the mean. Rating 0 - data 3.0 or more standard deviations from the mean or data considered to be outlying by other methods. A negative sign simply indicates a result that is smaller than the mean. If one of the paired test results for a given test is excluded based on the outlier criteria, the other test result is still subjected to the statistical analysis and is only excluded if it also fails to meet the criteria. An outlying observation is one that appears to deviate markedly from the sample population. It may be merely an extreme manifestation of the random variability inherent in the data, or may be the result of gross deviation from the prescribed experimental procedure, calculation MTO Aggregate and Soil Proficiency Sample Testing Program for 2013; MERO-048 -4- errors, or errors in reporting data. The outlier criteria employed for exclusion of test results from the analysis will depend on the distribution of data and the number of participants in a test. The iterative technique is one of the methods employed in this study for the selection of outliers, and is used where the strict application of critical value method tends to include the data that does not belong to the population. In the critical value method, the standardized deviate of a lab result is compared with the critical value corresponding to the number of participants in that particular test, for rejecting an outlier. The critical value is greater than 3 when the number of participants in a particular test method is 30 or more. For this reason, results with more than 3 standardized deviates may not have been identified as an outlier unless it is higher than the critical value, but a zero rating is nevertheless assigned for the test result in question. For example, if the computed standardized deviate for a lab result is 3.236 and the critical value corresponding to the number of participants in that particular test is 3.427, the lab will not be identified as an outlier but a zero rating will be assigned. Significance need not necessarily be attached to a single low rating. However, a continuing tendency to get low ratings on several pairs of samples or on a series of tests from one procedure (e.g. sieve analysis) should lead a laboratory to re-examine its equipment and test procedure. A laboratory that reports data for a specific test consistently lower or higher than the mean over a number of test periods also needs to re-examine their test procedure, because this is evidence of a systematic bias in how the laboratory conducts the procedure. Any computer program that is used by a laboratory to calculate test results should be verified as part of this examination. 2.2 SCATTER DIAGRAMS Youden scatter diagrams are supplied with this report (see Appendices D1 and D2). A laboratory can locate itself on the diagrams by plotting its test value for the first sample (1.13) on the horizontal axis, against its test value for the second sample (2.13) on the vertical axis. The horizontal and vertical axes are of equal length and are scaled to give the most informative display of the plotted points. In some cases, the outlying results plot outside the boundaries of the diagram. If the results from two or more laboratories happen to coincide, a single point is plotted. Below each scatter diagram, the test number and title are given, followed by a table of statistical calculations for both samples. Here the mean, median, and standard deviation for each sample are given. The number of laboratories reporting valid data and the laboratories eliminated by statistical analysis are also listed. The vertical and horizontal crosshairs on the plots represent the mean values for all the valid results on the first sample (1.13) and the second sample (2.13), respectively. These lines divide the diagram into four quadrants, numbered 1 through 4, beginning in the upper righthand quadrant and continuing clockwise. In an ideal situation where only random errors occur, the points are expected to be equally numerous in all quadrants and will form a circular distribution. This follows because plus and minus errors should be equally likely. Often, however, the points tend to concentrate in quadrants 1 and 3 on the diagram. This occurs because laboratories tend to get high or low results on both samples. This gives MTO Aggregate and Soil Proficiency Sample Testing Program for 2013; MERO-048 -5- evidence of individual laboratory biases. As the tendency to laboratory bias increases, the departure from the expected circular distribution of points towards a linear distribution from quadrant 1 to 3 occurs. Such a distribution of points indicates systematic variation. Figure 1 gives examples of scatter diagrams. Table 1. Summary of Results for Laboratory 47 TEST RESULTS FOR LABORATORY NUMBER 47 DATE PREPARED: November 15, 2013 COARSE AGGREGATE REFERENCE SAMPLES 1.13 & 2.13 TEST METHOD LABORATORY DATA MEAN OF LABORATORIES 2.13 1.220 1.300 1.216 1.223 0.015 LS-602 – Coarse Aggregate Percent Passing 19.0 mm Percent Passing 16.0 mm Percent Passing 13.2 mm Percent Passing 9.5 mm Percent Passing 4.75 mm 93.600 86.100 80.500 69.300 52.720 96.000 88.400 82.400 70.900 53.990 95.759 90.016 83.755 72.155 54.793 95.779 89.861 83.579 71.848 54.217 LS-603 Los Angeles Abrasion, % 24.100 22.800 22.178 LS-607 Percent Crushed Particles 69.900 69.100 5.900 3.900 211.60 189.80 6.900 7.500 3.303 3.160 *3.281 *3.852 0 0 11.500 11.000 11.472 11.514 0.063 -0.956 5 -5 LS-608 % Flat & Elongated Particles LS-609 Petrographic Number (Concrete) LS-614 Freeze-Thaw Loss, % LS-618 Micro-Deval Abrasion Loss (CA) 1 2 0.301 5 5 -2.587 *-3.526 -2.144 -1.789 -1.371 0.279 -1.194 -0.763 -0.561 -0.131 -1 0 -2 -3 -4 5 -4 -5 -5 -5 22.122 1.667 0.770 3 5 69.139 69.314 0.200 -0.057 5 -5 6.960 6.720 -0.418 -1.183 -5 -4 - - - 2 - 1 - 2 LAB RATING 1.13 LS-601 Wash Pass 75 m (Coarse Agg.) 1 STANDARDIZED DEVIATE - LS-620 Accelerated Mortar Bar (14 Days) Blank spaces represent not tested. Bold and Underline * - Calculation considered outlier ∩ - Outliers by Manual Deletion MTO Aggregate and Soil Proficiency Sample Testing Program for 2013; MERO-048 -6- Table 2. Summary of Results for Laboratory 47 TEST RESULTS FOR LABORATORY NUMBER 47 DATE PREPARED: November 15, 2013 FINE AGGREGATE REFERENCE SAMPLES 1.13 & 2.13 TEST METHOD LABORATORY DATA MEAN OF LABORATORIES 1.13 2.13 2.538 2.490 2.422 2.425 *4.911 2.385 2.340 2.265 2.267 *4.797 6.410 6.400 7.046 7.021 LS-604 – Coarse Aggregate Relative Density (O.D.) Absorption 2.621 1.160 2.618 1.140 2.625 1.133 LS-621 Asphalt Coated Particles, % 54.500 60.000 54.433 LS-623 Maximum Wet Density (g/cm3) Maximum Dry Density (g/cm3) Optimum Moisture, % 1 2 STANDARDIZED DEVIATE 1 2 LAB RATING 1 2 2.679 0 1 2.712 0 1 -2.444 -2.351 -2 -2 2.624 1.126 -0.577 0.356 -1.102 0.197 -5 5 -4 5 54.833 0.023 1.747 5 3 Blank spaces represent not tested. Bold and Underline * - Calculation considered outlier ∩ - Outliers by Manual Deletion MTO Aggregate and Soil Proficiency Sample Testing Program for 2013; MERO-048 -7- Table 3. Summary of Results for Laboratory 47 TEST RESULTS FOR LABORATORY NUMBER 47 DATE PREPARED: November 15, 2013 FINE AGGREGATE REFERENCE SAMPLES 3.13 & 4.13 TEST METHOD LS-605 – Fine Aggregate Relative Density (O.D.) Absorption LS-606 – Coarse Aggregate MgSO4 Soundness Loss, % LABORATORY DATA MEAN OF LABORATORIES 3 4 STANDARDIZED DEVIATE 3 4 LAB RATING 3.13 4.13 3 4 2.649 2.651 2.650 2.650 -0.109 0.043 -5 5 1.220 1.190 1.351 1.329 -0.835 -1.142 -5 -4 1.500 2.500 3.693 3.541 -1.236 -0.551 -4 -5 14.800 14.200 15.609 15.741 -0.671 -1.273 -5 -4 45.400 42.500 44.871 44.490 0.273 -1.126 5 -4 39.100 35.200 37.622 37.324 0.758 -1.235 5 -4 27.900 25.100 27.408 27.368 0.323 -1.518 5 -3 14.500 13.800 14.069 14.100 0.511 -0.355 5 -5 10.400 10.300 10.321 10.336 0.122 -0.063 5 -5 8.650 8.700 8.689 8.714 -0.071 -0.027 -5 -5 LS-606 – Fine Aggregate MgSO4 Soundness Loss, % LS-619 – Fine Aggregate Micro-Deval Abrasion LS-602 – Fine Aggregate Percent Passing 2.36 mm Percent Passing 1.18 mm Percent Passing 600 m Percent Passing 300 m Percent Passing 150 m Percent Passing 75 m Blank spaces represent not tested. Bold and Underline * - Calculation considered outlier ∩ - Outliers by Manual Deletion MTO Aggregate and Soil Proficiency Sample Testing Program for 2013; MERO-048 -8- Table 4. Summary of Results for Laboratory 47 TEST RESULTS FOR LABORATORY NUMBER 47 DATE PREPARED: November 15, 2013 SOILS REFERENCE SAMPLES 5.13 & 6.13 TEST METHOD LABORATORY DATA MEAN OF LABORATORIES STANDARDIZED DEVIATE 5.13 6.13 1 2 LS-702 – Sieve Analysis of Soil Percent Passing 2.00 mm 99.900 100.00 99.594 99.852 0.959 0.769 Percent Passing 425 m 97.800 98.000 96.701 96.997 1.625 Percent Passing 75 m 92.900 93.200 91.350 91.667 Percent Passing 20 m 84.600 83.800 79.325 79.282 Percent Passing 5 m 66.000 65.900 59.395 Percent Passing 2 m 52.600 50.000 LS-703 Liquid Limit, % 39.600 LS-704 Plastic Limit, % Plasticity Index, % LS-705 Specific Gravity of Soil 1 2 LAB RATING 1 2 1.846 3 3 1.527 1.665 3 3 1.569 1.472 3 4 58.940 1.941 2.271 3 2 43.901 43.900 *3.591 2.152 0 2 39.000 37.144 37.069 1.848 1.394 3 4 19.900 20.000 18.813 18.734 0.853 1.109 5 4 19.700 19.000 18.369 18.341 0.835 0.455 5 5 2.743 2.765 2.733 2.734 0.407 1.252 5 4 AGGREGATE CONSENSUS PROPERTIES Uncompacted Void Content 41.800 42.500 42.206 42.270 -0.637 0.351 -5 5 Sand Equivalent Value 58.800 56.400 42.767 42.674 1.995 1.785 3 3 Percent Fractured Particles 71.500 72.800 71.443 71.453 0.012 0.312 5 5 % Flat & Elongated Particles 0.900 0.700 1.434 1.433 -0.664 -0.940 -5 -5 Blank spaces represent not tested. Bold and Underline * - Calculation considered outlier ∩ - Outliers by Manual Deletion MTO Aggregate and Soil Proficiency Sample Testing Program for 2013; MERO-048 -9- Figure 1. Examples of Scatter Diagrams MTO Aggregate and Soil Proficiency Sample Testing Program for 2013; MERO-048 - 10 - 2.3 OUTLIERS In dealing with suspected outlying observations or ‘outliers’, our purpose is to remove those observations that do not belong to the sample population and to provide some statistical criteria for doing so. There are a number of ways to do this. In most of these, as ASTM E178 states, ‘the doubtful observation is included in the calculation of the numerical criterion (or statistic), which is then compared with a critical value based on the theory of random sampling to determine whether the doubtful observation is to be retained or rejected.’ The critical value is that value of the sample criterion that would be exceeded by chance with some specified (small) probability on the assumption that all observations did indeed constitute a random sample from a common system of causes, a single parent population, distribution, or universe. The MTO study often follows the criteria recommended for single samples in Section 4 of ASTM E178 for rejecting the doubtful observations at the ninety-five percent confidence level. The critical value method is based on the assumption of normality, and the critical values are calculated using Student's T distribution. The assumption in this method is that all of the observations come from the same normal population. The doubtful observation is included in the calculation of mean and standard deviation of the population. Then the critical value, Tn, for that observation, n, in question is calculated and compared with the critical value based on the theory of random sampling. The doubtful observation is rejected if Tn is higher than the critical value for the five percent significance level. The outlier is removed from the data set and the iterations are continued until no outliers are detected, and a revised mean and standard deviation are calculated after deleting the outlier. The ratings of the laboratories are determined based on the revised mean, standard deviation, and standardized deviate. In some cases, the strict application of the critical value method tends to include laboratories in the population that report extraneous results. These results may not represent testing performed in conformance with the test method. In those cases, the application of the iterative technique (Manchester6) is used. The Constant C in the iterative technique is computed using Fisher's F distribution, and it depends on the number of participating laboratories in a particular test. In this technique, an outlying observation is rejected based on a statistical criterion, but the confidence interval may vary depending on the number of participants and the distribution of sample population. In the iterative technique, after screening the test results for any errors, the doubtful test result is included in the calculation of mean and standard deviation of the data set. The absolute residual values (actual test result minus the mean) are then computed and test result farthest from the mean by a unit of Cs (standard deviation, s, multiplied by a constant C) is identified as an outlier. One outlier at a time is identified and rejected in a manner similar to that of critical value method. 6 The Development of an Interlaboratory Testing Program for Construction Aggregates, by L. Manchester, Ministry of Transportation, Ontario, Engineering Materials Office Report EM-33, Downsview, December, 1979. MTO Aggregate and Soil Proficiency Sample Testing Program for 2013; MERO-048 - 11 - Three of the test methods included in this proficiency sample testing program requires reporting of control sample results to demonstrate that the testing process of the laboratory is in control. The laboratories that report control sample results outside the range of values established for the material are identified during the screening of test results for any errors or deviations. These laboratories are manually removed from the data set during the analysis and considered as outliers. MTO Aggregate and Soil Proficiency Sample Testing Program for 2013; MERO-048 - 12 - 3. Discussion The following discussion contains general and test-specific comments for the 2013 test period. Where ASTM, AASHTO or MTO precision statements are published for a given test, an attempt has been made to compare these with the statistics for this period. A discussion of statistical techniques is presented in the Glossary of Terms, found in Appendix A. 3.1 NOTES ON MATERIAL SOURCES Materials used in this test period were as follows: Coarse and fine aggregate tests, including Sieve Analysis, Percent Crushed Particles, Moisture Density Relationship, Relative Density and Absorption (fine), Micro-Deval Abrasion Loss (fine), Uncompacted Void Content, Sand Equivalent Value, and Percent Fractured Particles – Granular A (OPSS 1010) from Waterford Sand and Gravel, Simcoe Pit (MTO MAIDB No. S06-109). Coarse aggregate tests, including Wash Pass 75 m, Percent Flat and Elongated Particles, Petrographic Analysis (coarse), Relative Density and Absorption (coarse), Los Angeles Abrasion, Micro-Deval Abrasion Loss (coarse), Freeze-Thaw Loss, Magnesium Sulphate Soundness (coarse), and Percent Flat, Elongated, or Flat and Elongated Particles – clearstone (OPSS 1003) from a quarry south of Hamilton, north of Lake Erie. Fine Aggregate Petrographic Examination - sand from Inland Arkona Pit, London (MTO MAIDB No. P04-123) Soil tests – Glacial Lake Iroquois deepwater laminated silt and clay from Walker Brothers Vineland I Quarry, N03-023. 3.2 NOTES ON SAMPLE PREPARATION The material processed for the coarse and fine aggregate tests conforms approximately to the gradation requirements of Granular A. Bulk samples were prepared using a large spinning riffler, developed and built by staff at the MTO Downsview Laboratory (refer to Figures 2 and 3 of Report MI-179, February 2000). The use of a spinning riffler ensures that, as far as possible, each sample is identical to every other sample. It has been found that this is the best technique for minimizing sample bias. A bobcat loader was used to fill an aggregate bin from the stockpile and the material was fed along a conveyor belt to fill 33 identical bags (fitted with funnels) on a spinning turntable. It was found that about 18 revolutions of the turntable were required to fill each bucket to 23 ± 2 kg of Granular A. This resulted in more homogeneity of the samples than would normally be the case using other techniques. In total, six hundred and fifty 23 ± 2 kg samples were prepared for the tests on Granular A, and randomized for distribution to participating laboratories. The participants were responsible for the preparation of their own fine aggregate samples (3.13 and 4.13) from the two bags of MTO Aggregate and Soil Proficiency Sample Testing Program for 2013; MERO-048 - 13 - Granular A supplied. In addition to Granular A, additional samples consisting of material with approximately 98% retained on 4.75 mm sieve was also supplied for tests that require coarse aggregates. The number of revolutions of the turntable required for coarse aggregate to fill each bucket to approximately 28 ± 2 kg was found to be about 24 revolutions of the turntable. In total, six hundred and fifty 28 ± 2 kg samples were prepared for the coarse aggregate tests, and randomized for distribution to participating laboratories. Soil material was air-dried, processed to pass through a 2.0 mm sieve using a Fritsch Soil Mill Pulveriser, and placed in 20 kg buckets. Individual scoops were collected from each bucket and placed in a separate container. The material from the container was then transferred to the hopper of a small spinning riffle splitter. The hopper of the spinning riffler used is capable of filling 24 identical 2 kg containers per run. This method was used to create uniform 20 kg buckets. The proficiency test material was then prepared by obtaining representative samples from a 20 kg bucket. The material collected from the 20 kg bucket was then transferred to the hopper of the small spinning riffler and the 500 g proficiency test samples were prepared. The samples were then randomized for distribution to participating laboratories. 3.3 NOTES ON INDIVIDUAL TESTS For each test, comments have been made pertaining to the variation illustrated by the associated scatter diagrams shown in Appendices D1 and D2. The technique used to test for outliers is stated and, where possible, reasons for the outlying observations are offered. It is important to keep in mind that there are many variables influencing laboratory testing. A summary of the statistical data is presented in the Multi-Laboratory Precision Tables found in Appendix C. Besides the comparison made to ASTM, AASHTO or MTO precision statements, comparison of the variation between previous test periods is made for each of the tests. Because the materials usually differ from year to year, it is emphasized that the comparison between years should be used only as a guide. It is important to note that the yearly use of different materials will have some effect on the variation exhibited in some tests, while it will have relatively little effect on others. For example, the magnesium sulphate soundness test normally exhibits increased variation as higher mean loss is reported. A coarse aggregate sample having an average mean loss of twenty percent would likely show more variation than a coarse aggregate sample having an average mean loss of ten percent. On the other hand, a sieve analysis could be performed on those same two aggregates, with the percent passing each sieve and the variation being remarkably similar for the two samples. MTO Aggregate and Soil Proficiency Sample Testing Program for 2013; MERO-048 - 14 - 3.4 PROFICIENCY SAMPLE TESTS 3.4.1 LS-601 - Wash Pass 75 m (Coarse Aggregate) – Test No. 1 Two hundred and twenty-two laboratories reported results for this test in 2013. Twenty-one outliers were identified and rejected using the iterative technique. The standard deviations of 0.28 and 0.25 obtained in 2013 are slightly lower than the values that were reported in the 2012 study and comparable to the values reported in 2010 and 2011 studies. However, the standard deviations obtained in 2013 are slightly higher than the multi-laboratory variation of 0.19 published in the MTO Test Method LS-601 for aggregates with less than 2.0% material passing the 75 µm sieve and comparable to that of the value (0.22) published by ASTM C 117 for aggregates with 1.5% of material finer than the 75 µm sieve. The mean value of the aggregate used in 2013 consisted of approximately 1.2% material finer than 75 µm, which is within the range of values for which the ASTM and MTO precision statements were established. Further, the coefficient of variation of 21.7% obtained in 2013 is significantly lower than the values of 34.2% and 26% reported in 2010 and 2011, respectively, but it is slightly higher than the value of 13.5% obtained in 2012. The scatter diagram provided in the Appendix D1 shows a combination of random variation and laboratory bias for some laboratories. The laboratories that are identified as outliers should examine their test procedure more closely, especially the achievement of constant dry mass at the beginning and end of the test. 3.4.2 LS-602 - Sieve Analysis (Coarse Aggregate) – Test Nos. 2 to 6 These tests represent the coarse aggregate portion of the Granular A sample gradation. Tests 20-25 carried out on the material passing 4.75 mm sieve as prepared by the participants (samples 3.13 and 4.13) represent the remainder of the gradation. The data is presented in percent passing format and is compared to precision statements developed in the same format by Vogler and Spellenberg7. The Granular A samples 1.13A and 2.13A supplied for the sieve analysis test consisted of approximately 45.5% of the material retained on 4.75 mm sieve, and conform to the grading of Granular A materials used in the past MTO Aggregate and Soil Proficiency Sample Testing Programs. The gradings reported for Test Nos. 2-6 represent the combined gradings of coarse and fine aggregates. The proficiency test samples were prepared with the large spinning riffler described in Section 3.2. The standard deviations obtained in 2013 for all of the sieves, with the exception of 19.0 mm sieve, are found to be significantly lower than the expected variations given in the ASTM C 136 precision statements. In the case of 19.0 mm sieve, the standard deviation of 0.8 obtained is almost twice that of the precision estimate (0.35) published by ASTM. Two hundred and twenty-three laboratories reported results for the sieve analysis test in 2013. Outliers were eliminated using the iterative technique. Successive scatter diagrams 7 Vogler, R.H., Department of Transportation, Michigan, AASHTO Technical Section 1c; T27 and Spellenberg, P.A., AASHTO Materials Reference Laboratory; Unpublished Paper. MTO Aggregate and Soil Proficiency Sample Testing Program for 2013; MERO-048 - 15 - show a fairly uniform distribution of points about the mean (i.e. a random variation with little laboratory bias). The number of outliers identified varies from sieve to sieve, and ranges from ten for the 19.0 mm sieve to a maximum of twenty-two for 9.5 mm sieve. Possible reasons for outlying observations include factors that impact the measurement process such as sieve condition (state of repair and cleanliness), efficiency of the sieving process and apparatus, initial sample mass, and mass on a given sieve. If your laboratory has performed poorly in this test period, you should inspect your sieves (use CAN/CGSB-8.1-88 or ASTM E11 as guides) and your sieve shaker(s) thoroughly, and, once satisfied that they are in order, perform a sieving efficiency test as described in LS-602 to pinpoint any problems. 3.4.3 LS-603 - Los Angeles Abrasion Loss (Coarse Aggregate) – Test No. 8 Only ten laboratories reported results for this test in 2013. One outlier was detected by the use of critical value method. Considering the number of observations (10) used, the analysis may not yield any meaningful or representative statistical data. The lower left and upper right quadrants together account for eight of the ten points, which is evidence of significant laboratory biases. This test shows systematic variation, as was found in previous years. However, the standard deviations obtained in 2013 are slightly lower than the values that were reported in the past three years. ASTM precision statements for 19.0 mm maximum size coarse aggregate, with percent loss in the range 10% to 45%, give a multi-laboratory coefficient of variation of 4.5%. Therefore, the results from two different laboratories should not differ by more than 12.7%. The mean loss of 22.1% in this test is within the range of values for which ASTM C 131 data was established. This year’s coefficient of variation (average 4.7%) is consistent with that of the value, 4.5%, given in the ASTM precision statements. 3.4.4 LS-604 - Relative Density of Coarse Aggregate – Test No. 9 and Absorption of Coarse Aggregate – Test No. 10 MTO Test Method LS-604 follows the procedures described in ASTM C 127-12 for the determination of relative density (Test No. 9) and absorption property (Test No. 10) of coarse aggregates. ASTM C 127 provides precision statements only for relative density. It does not provide precision estimates for the absorption property. In the case of LS-604, it provides precision estimates for both relative density and absorption of coarse aggregates with absorption properties less than 2.0%. The precision statements published in LS-604 were established using the data collected for a period of twelve years, through the MTO Proficiency Sample Testing Program. One hundred and four laboratories reported results for these tests in 2013. Six laboratories for relative density and three laboratories for absorption were identified as outliers using the iterative technique. The standard deviation of 0.006 obtained for bulk relative density in 2013 is slightly lower than the values that were reported in the past three years and are consistent with the precision estimate of 0.006 published in the LS-604. Further, the MTO Aggregate and Soil Proficiency Sample Testing Program for 2013; MERO-048 - 16 - standard deviations obtained in 2013 are one-half of the value of 0.013 published in ASTM C 127. In the case of absorption test, the standard deviations of 0.076 and 0.072 obtained this year are slightly lower than the precision estimate of 0.09 provided in the LS-604. In addition, the coefficient of variation of 6.5% obtained in 2013 is consistent with the value of 6.1% obtained in 2012 and it is considerably lower than the values 8.4% and 12.3% reported in 2010 and 2011, respectively. The scatter diagrams for both Test Nos. 9 and 10 show a combination of random variation and laboratory bias for some laboratories. 3.4.5 LS-606 - Magnesium Sulphate Soundness (CA) – Test No. 11 Forty-four laboratories reported results for this test in 2013. No outlier was identified by the use of critical value method or iterative technique. The scatter diagram shows a pronounced between laboratory bias. All of the points, with the exception of four (9%), are accounted in the lower left and upper right quadrants. This test has historically shown high coefficients of variation due to the difficulty of maintaining solution of the correct density and insufficient drying by some laboratories. The average mean loss of 3.6% in this test is significantly lower than the range of values (9% to 20%) for which the ASTM C 88 precision estimate was established. The coefficient of variation of 51.4% obtained in 2013 is more than twice that of the values reported in the 2011(17%) and 2012 (20.8%) studies and also, the value published in the ASTM precision statements. ASTM reports a multi-laboratory coefficient of variation of 25% for coarse aggregate with percent loss in the range of 9% to 20%. 3.4.6 LS-607 - Percent Crushed Particles – Test No. 12 and Percent Cemented Particles – Test No. 7 The coarse aggregate samples supplied did not contain adequate amount of material retained on the 19.0 mm sieve. For this reason, participants were advised to perform the test only on coarse aggregate passing the 19.0 mm sieve and to calculate the weighted average by assigning the same percent crushed particles value as the next smaller fraction (i.e., 19.0 mm - 13.2 mm) for 26.5 mm to 19.0 mm that need not be tested. This year, two hundred and twenty-two laboratories submitted results for this test. Fourteen laboratories were selected as outliers by employing the iterative technique. The standard deviations of 3.7 and 3.8 obtained in 2013 are significantly lower than the precision estimate of 4.7 published in the MTO LS-607 and the values ranging from 5.1 to 7.1 reported in the past three years. The standard deviations in 2013 are also significantly lower than the value of 6.0 obtained during the 1989 MTO workshop. The average mean of 69.2% in this test is within the range of values (55% to 85%) for which the MTO precision statements were established. The scatter diagram shows a combination of random variation and operator bias for some laboratories. ASTM has a very similar test method (D 5821) but has not conducted interlaboratory studies to determine precision and currently publishes precision data (standard deviation of 5.2 for a mean percent crushed particles value of 76.0%) obtained from MTO study. The marked improvement in the multi-laboratory variations obtained this year may have resulted from the clarity that was provided in the latest revision of MTO LS607, for the calculation of weighted average of percent crushed particles MTO Aggregate and Soil Proficiency Sample Testing Program for 2013; MERO-048 - 17 - 3.4.7 LS-608 - Percent Flat and Elongated Particles – Test No. 13 The determination of a flat and/or elongated particle is dependent on operator skill and judgement in using the measurement tool. The ASTM and CSA procedures use a proportional calliper device to measure the greatest length or width to thickness ratio. The MTO procedure previously measured the ratio of mean length or width to the mean thickness (MTO Laboratory Manual Revision 15 and earlier). The MTO procedure (Revision 16 and up) has been modified to agree with the ASTM definition. All participants should be using the latest MTO version of the test method. Flat and elongated particles are defined in the MTO Test Method LS-608 as those pieces whose greatest dimension in the longitudinal axis, compared to the least dimension in a plane perpendicular to the longitudinal axis, exceeds a ratio of 4:1. This test method is similar to that of ASTM D 4791 and uses the same definition, with the exception of ratio, for the flat and elongated particles. In ASTM, the flat and elongated particles are defined as the pieces that exceed a ratio of 3:1 or 5:1. In LS-608, the test sample is separated into number of fractions and the weighted average of percent flat and elongated particles is calculated using the result of every fraction tested. The coarse aggregate samples supplied did not contain adequate amount of material retained on the 19.0 mm sieve. For this reason, participants were advised to perform the test only on coarse aggregate passing the 19.0 mm sieve and to calculate the weighted average by assigning the same percent flat and elongated particles value as the next smaller fraction (i.e., 19.0 mm - 13.2 mm) for 26.5 mm to 19.0 mm that need not be tested. Two hundred and twenty-one laboratories reported results for this test in 2013. Iterative technique was used to reject six outliers. LS-608 provides precision estimate for coarse aggregate passing 19.0 mm and retained on 4.75 mm with percent flat and elongated particles ranging from 2.0% to 9.5%. The standard deviations of 2.4 and 2.5 obtained in 2013 are slightly higher than that of the values (1.8 and 1.9) reported in 2012. However, the multilaboratory variations are consistent with the precision estimate of 2.3 published in LS-608. The average mean of 6.8% in this test is within the range of values (2% to 9.5%) for which the MTO precision statements were established. ASTM D 4791 is similar to LS-608 for comparison of multi-laboratory precisions obtained. In ASTM, the precision estimates are provided for individual fractions ranging from 19.0 mm to 4.75 mm (19 mm to 12.5 mm, 12.5 mm to 9.5 mm, and 9.5 mm to 4.75 mm), and the estimates are based on the coefficient of variation. A direct comparison of the precision estimates from ASTM is not appropriate with that of the estimates provided in LS-608. The precision estimates published in LS-608 are on the basis of standard deviation, and was estimated from the weighted averages calculated using the results of four fractions ranging from 19.0 mm to 4.75.mm. The scatter diagram provided in the Appendix D1 shows a combination of random variation and laboratory operator bias for some laboratories. In general, laboratories that reported values in excess of 12% or less than 2% should critically examine their equipment and procedure. MTO Aggregate and Soil Proficiency Sample Testing Program for 2013; MERO-048 - 18 - 3.4.8 LS-609 - Petrographic Analysis (Coarse Aggregate) – Test No. 14 The coarse aggregate examined in 2013 was from a quarry located in the Niagara Peninsula extracting out of the Middle Devonian Dundee Formation. In general the bedrock in the area of extraction consist of horizontally bedded, light grey brown to light grey, cherty crystalline and fossiliferous limestone. Chert occurs as both nodules and bands parallel to the bedding throughout most of the geological section. Other rock types present include shaley limestone and bituminous limestone. At least one bed of large porous colonial and solitary corals is present near the base of the quarry. This bed locally contained petroleum staining and/or a strong petroleum odour that may have been noticed in some particles handled by participants. This sample may have been challenging for many analysts in the correct identification of chert. The chert was generally white to light grey or light grey green in colour, but also included minor dark grey varieties. Lighter coloured chert was commonly carbonaceous, slightly chalky, and locally appeared mottled with darker grey brown inclusions. Lustre ranged from dull and porcelainous (leached and semi-leached) to waxy or vitreous (unleached). Distinguishing between leached and semi-leached chert is based on the rate of water absorption. Absorptive chert (leached) will generally stick to the tongue. Participants are also reminded that the Moh’s hardness of chert is seven, equivalent to that of crystalline quartz, therefore it should not scratch easily with a knife and will typically leave a grey streak of metal transferred from the blade to the particle. Worksheets were submitted by 35 analysts from approximately 26 laboratories. There were no analysts that completed results for more than one laboratory. Calculation and typographical errors were noted on several submissions. In several instances PN worksheets were not completed in full and in a few cases the results were illegible and difficult to discern. Participants are reminded that it is required to complete the worksheets in full, to report the PN as a whole number, and to ensure that the data entered on the worksheets are legible. Please see Appendix E1 for a summary of the Petrographic Number Test submissions received for 2013. This year, the test results included a high number of anomalies, including procedural errors and misidentification of specific rock types. As a result, a comprehensive statistical analysis of the data was not completed for the 2013 program samples. The following is a list of noted issues with the as-received test data: Laboratories 30, 38, 61, 80, 260 and 316 did not examine the required 1500g as per the 2013 MTO Aggregate and Soil Proficiency Sample Program Instructions; Laboratories 1, 13, 30, 61, 102, and 293 identified significant amounts (>2%) of sandy carbonates (Rock Types 2 and/or 40) that were not present in the sample. Analysts are reminded that to classify particles as sandy carbonate the rock must contain between 5 and 49% sand-sized quartz grains. In addition, MTO files on this quarry over their 50 year span have not reported the presence of this rock type; MTO Aggregate and Soil Proficiency Sample Testing Program for 2013; MERO-048 - 19 - Laboratory 183 reported the presence of marble (Rock Type 23) which was not present in the sample; Laboratory 61 reported the presence of Rock Type 3 which was not present in the sample; Laboratory 102 reported the presence of flint/jasper (Rock Type 81), which was not present in the sample. Rock Type 81, is typically reserved for the classification of rock types associated with banded iron formation deposits. This material may have been better placed in Rock Type 26, where the particle likely consisted of dark grey coloured unleached chert; Laboratory 30 reported Carbonate (carbonaceous coral, coral) as a separate rock type in both the good and fair categories. Although not necessarily incorrect, this material might have been better placed in the pitted carbonate category (Rock Type 41) unless the analyst strongly felt that the hardness and quality of the particle warranted placing in another quality category; Some laboratories did not report any amount of Rock Type 26 and/or Rock Type 45. This is a significant omission as large portions of the strata in this quarry are known to contain between 5 and 20% chert (MTO internal files). There was also no consistency in the amounts of Rock Types 26 and 45 reported across all laboratories. Range of Rock Type 26 reported as received was 0 to 20%, and range of Rock Type 45 reported as received was 0 to 19%. This indicates an inherent difficulty with the identification of chert as well as an inconsistency between operators in distinguishing between the leached and unleached varieties of chert. Reported amounts of Rock Type 35 ranged from 0 to 26%. Cause of this variation possibly may have been confusion between shale and bituminous rich seams in the limestone, the latter of which is common in this source. Reported PN values from all laboratories ranged from 104 to 212. The reported data, as received from all laboratories indicated the following category ranges: good aggregates, 65 to 98%; fair aggregates, 2 to 35%; and poor aggregates, 0 to 20%. Deleterious aggregates were only reported by 5 labs to a maximum amount of 0.5%. For reference, ten additional samples were analyzed by a single MTO analyst and checked by the Petrographer. For these samples, the ranges of material in the following rock type categories were reported: good, from 81 to 87%; fair, from 4 to 13%; and poor, from 4 to 10%. No deleterious category aggregates were reported. This yielded PN values ranging from 140 to 167 for this material. The wide variation in the data from this year as well as in the previous year (MTO report MERO-046) demonstrates a strong need for additional training and education of analysts that perform the petrographic number test. Consistency in rock identification as well as incorrect MTO Aggregate and Soil Proficiency Sample Testing Program for 2013; MERO-048 - 20 - rock identification is the main issues. This is particularly emphasized with respect to the carbonate rock types and chert, including shaley carbonates, slightly shaley carbonates, cherty carbonates and leached/unleached chert. Another area recommended for clarification is discerning between shale and bituminous rich seams in carbonate rock types. The similar ASTM standard for this test, C-295, does not report a petrographic number and has no precision statement. 3.4.9 LS-616 - Petrographic Examination (Fine Aggregate) – Test No. 15 The fine aggregate examined in 2013 was sand from the Inland Arkona Pit, located 2.5 km south east of Arkona, Ontario (MAIDB Number P04-123). Eleven analysts from seven laboratories examined samples 1.13 and 2.13 and submitted worksheets showing subdivision according to rock/mineral type. This year there were no analysts that completed results for more than one laboratory. The results are shown in the Appendix E2 and were evaluated by C.A. MacDonald, MTO Petrographer. The reported results indicate an average composition of approximately 40% silicate (including sandstone, quartz, and other Precambrian Shield minerals and lithologies such as gabbro, metabasalt, feldspar, and granite), 55% carbonate, 2% shale and 3% chert. Minor amounts of mica (0.1% average) were also present, mostly concentrated on the P600/R300 and finer sieve sizes. The average amounts of silicate, shale and chert present combined (approximately ~45%) correlates well with insoluble residue of 45.6% for this sample. Silicate and mica contents tended to increase from larger to smaller sieve sizes, while chert and shale contents decreased. The results of petrographic testing for each sieve fraction were also examined individually. To aid in this, MTO completed insoluble residue testing (IR) on samples of each individual fraction of the sand as well as on one overall representative sample of the sand in an attempt to correlate and cross check with the results of the petrographic examination. Insoluble residue test determines the resistance of aggregates to loss when exposed to a hydrochloric acid solution. Carbonate minerals are dissolved by a hydrochloric acid solution, and after complete digestion a remaining residue is left that consists of the non-carbonate components of the material. Results of the IR testing by MTO on this sand are summarized below (Table 1). Table 5. Insoluble Residue Test Results (LS-613) Fraction P4.75 (full)* P4.75/R2.36 P2.36/R1.18 P1.18/R600 P600/R300 P300/R150 P150/R75 Mass Tested (g) 196.3 130.2 129.8 130.0 130.1 130.1 144.6 IR (%) Carbonate (%) 45.6 42.2 38.8 41.6 49.0 59.3 56.6 54.4 57.8 61.2 58.4 51.0 40.7 43.4 *Representative sample MTO Aggregate and Soil Proficiency Sample Testing Program for 2013; MERO-048 - 21 - The reported petrographic results had average carbonate content on the P4.75/R2.36 fraction of approximately 68%, with a range in reported values of 60 to 76%. Insoluble residue data for this fraction indicates the total carbonate content was approximately 58%. One possible reason for the difference between the petrographic data and insoluble residue results may have been that sandstone and siltstone particles with calcareous cement may have been misclassified as carbonate particles when tested with HCl. Participants that reported values above 70% carbonate for this fraction may wish to re-examine their samples. Average petrographic carbonate content reported on the P2.36/R1.18 fraction was 64%, with a range in reported values of 42.5 to 82.5%. Insoluble residue data for this fraction indicates the total carbonate content was approximately 61%. Reasons for the difference in petrographic average versus insoluble residue results may be as described above. Participants that reported either very high or very low amounts of carbonate on this sieve fraction should re-examine their samples. Average petrographic carbonate content reported on the P1.18/R600 fraction was approximately 60%, with a range in reported values of 36 to 77%. Insoluble residue data for this fraction indicates the carbonate content was approximately 58%. Participants that reported either very high or very low amounts of carbonate on this sieve fraction should reexamine their samples. Average petrographic carbonate content reported on the P600/R300 fraction was approximately 49%, with a range in reported values of 33 to 62%. Insoluble residue data for this fraction indicates the carbonate content was approximately 51%. Average petrographic carbonate content reported on the P300/R150 fraction was approximately 40%, with a range in reported values of 16 to 64%. Insoluble residue data for this fraction correlates very well with the petrographic average, indicating the carbonate content was approximately 41%. Average petrographic carbonate content reported on the P150/R75 fraction was approximately 36%, with a range in reported values of 14 to 68%. Insoluble residue data for this fraction indicates the carbonate content was approximately 43%. Possible reasons for the difference between the petrographic data and insoluble residue results could be the difficulty in correctly identifying the difference between quartz and carbonate at such a small particle size. Those laboratories that reported carbonate values that significantly deviated from the averages and/or the amounts indicated by the insoluble residue testing should reexamine their samples. Except for the P4.75/R2.36 and P150/R75 fractions, the petrographic average amounts of carbonate reported for each fraction correlated extremely well with the insoluble residue testing (generally within 1 to 3%). Participants that reported amounts of carbonate that deviated significantly from these amounts should re-examine their samples. Shale and chert were correctly recognized by all laboratories, although there were large ranges in reported values on individual sieve fractions between laboratories (Appendix E2). The shale was typically dark brown to dark grey brown in colour, soft, and absorptive, and MTO Aggregate and Soil Proficiency Sample Testing Program for 2013; MERO-048 - 22 - generally did not effervesce when hydrochloric acid was applied. Chert was generally of the leached variety and appeared white in colour with a porcelainous to earthy lustre. The wide range in petrographic values reported for carbonate and other components of this sample in their various fractions is concerning and suggests that additional training and/or education of analysts may be necessary. One possible reason for the wide variation could be misclassification of sandstone or siltstone particles with calcareous cement in the carbonate category. Another possible source of confusion could be related to the friable nature of some silicate components at smaller particle sizes (i.e. 600 µm and finer). Some of these particles tend to easily break or fracture when applying moderate pressure with a needle or metal probe, possibly leading an analyst to conclude that the particle is of low hardness and incorrectly belongs in the carbonate (or other) category. Several laboratories did not report the minus 75 µm fraction of the gradation. Participants are reminded that for the purpose of calculating the weighted percent of components, the minus 75 µm fraction needs to be included, (assumed to have the same composition as the retained 75 µm sieve fraction). The similar ASTM standard for this test, C-295, has no precision statement. 3.4.10 LS-618 - Micro-Deval Abrasion (Coarse Aggregate) – Test No. 16 Eighty laboratories reported results for this test in 2013. The test method requires reporting of control sample results to demonstrate that the testing process is in control. This year, one laboratory reported control sample results outside the established range and the lab was excluded from the analysis and identified as an outlier. In addition, three outliers were rejected using the iterative technique. The multi-laboratory coefficient of variation of 5.5% published in the LS-618 is for 19.0 mm maximum size aggregate with abrasion losses in the range from 5% to 23%. The mean loss of 11.5% in this year’s program is within the range of values for which the precision estimates were established. The average coefficient of variation of 4.3% obtained in 2013 is noticeably lower than the value published in LS-618, and that of the values reported in the past three years (4.4% to 5.4%). The scatter plot for this test shows random variation with little laboratory bias. 3.4.11 LS-614 - Freeze-Thaw Loss – Test No. 17 The coarse aggregate samples supplied did not contain adequate amount of material retained on the 19.0 mm sieve. For this reason, participants were advised to perform the test only on coarse aggregate passing the 19.0 mm sieve and to calculate the weighted average by assigning the same freeze-thaw loss value as the next smaller fraction (i.e., 19.0 mm - 13.2 mm) for 26.5 mm to 19.0 mm that need not be tested. Sixty-two laboratories reported results for this test in 2013. The test method requires reporting of laboratory control sample losses to demonstrate that the testing process is in MTO Aggregate and Soil Proficiency Sample Testing Program for 2013; MERO-048 - 23 - control. This information is used to alert the laboratory to testing deficiencies. Without testing of the reference material, the test is invalid (see LS-614, Section 9.1). This year, all of the laboratories reported control sample result within the established range for the material. Two outliers were identified using the iterative technique. The multi-laboratory coefficient of variation of 20.2% published in LS-614 is for coarse aggregate with freeze-thaw losses in the range of 4% to 18%. The coefficient of variation of 34.5% obtained in 2013 is significantly higher than the value of 20.2% published in the LS614 and the values (20.6% to 29.3%) reported in the past three years. The majority of the points on the scatter plot (77.4%) are accounted in the lower left and upper right quadrant, indicating a pronounced laboratory bias. It is likely that there are two main reasons for the wide spread of the data for this test: insufficient damage caused by freezing too rapidly or difference in sieving intensity. The laboratories that reported freeze-thaw losses higher than 5.5% should modify their processes to try and achieve losses closer to the mean loss of the control aggregate. Appendix 1 of LS-614 gives a procedure for determining and adjusting sieving time for quantitative analysis. Each laboratory must establish their sieving time, if the mechanical shaker and diameter of sieves are different from that were used to establish the sieving time provided in the Appendix 1 of LS-614. 3.4.12 LS-602 - Sieve Analysis (Fine Aggregate) – Test Nos. 20-25 The test samples for this procedure were prepared by the participants from the material passing the 4.75 mm sieve of the coarse aggregate gradation. This process closely follows the normal testing procedure in which the laboratory prepares its own test samples from the field sample. The scatter diagrams for the fine aggregate sieve analysis show random variation with little laboratory bias. The standard deviations of the fine sieves in 2013 are noticeably lower than that of the values reported in the 2012 study (MERO-046). The multilaboratory variations, with the exception of 2.36 mm and 1.18 mm sieves, are found to be consistent with the values published in the ASTM C 136 precision statements. In the case of 2.36 mm and 1.18 mm sieves, the standard deviations obtained (1.7 to 1.9) are slightly higher than the value of 1.41 published by ASTM. As in previous interlaboratory studies, it was found that the precision of the test varies as a function of the amount of material retained on any sieve. The smaller the amount of material retained, the more efficient the sieving process and the better the precision. When there is a small amount of material retained on a sieve (one layer of particles or less), the particles have a greater chance of falling through the sieve in a given time. The number of outliers identified varies from sieve to sieve, and ranges from nine for the 75 m sieve to a maximum of twenty for the 300 m and 600 m sieves. Outlier laboratories with a very low percent passing the 75 m sieve should inspect their sieves, as low percent passing may be the result of the sieve being blinded when washing the sample. An ineffective washing process will also result in a low percent passing this sieve. MTO Aggregate and Soil Proficiency Sample Testing Program for 2013; MERO-048 - 24 - 3.4.13 LS-605 - Relative Density of Fine Aggregate – Test No. 27 and Absorption of Fine Aggregate – Test No. 28 Participants in the program were asked to test the samples according to MTO Test Method LS-605. This test method follows ASTM C 128, except that it requires the removal of materials finer than 75 µm from the test specimen by washing. LS-605 requires the test specimens to be prepared in duplicate and washed on the 75 µm sieve until all of the material finer than 75 µm is removed. The presence of material finer than 75 µm in the test specimens can result in lower relative densities and higher absorption values. In the past, MTO was using the precision estimates published in the ASTM C 128 for both relative density and absorption to compare and evaluate the multi-laboratory variations obtained from the MTO proficiency sample testing program. Considering the difference in preparation of test specimen between the ASTM C 128 and LS-604, use of the multilaboratory variations published in the ASTM may not be appropriate to evaluate the performance of the participating laboratories. As a result, precision estimates were developed for LS-604 using the MTO proficiency sample test data collected over a period of twelve years. The latest revision of this test method provides precision estimates for both relative density and absorption of fine aggregates with absorption properties less than 2.0%. One hundred and three laboratories reported results for these tests. Four outliers for relative density (Test No. 27) and ten outliers for absorption (Test No. 28) were selected using the iterative technique. As in previous years, greater variation exists in this test compared to the relative density test on coarse aggregate. It is imperative that differential drying of the various sized particles be avoided by constant stirring of the sample under the air current during the drying process. As short as 30-second periods of rest can be detrimental to the outcome of the test results. Differential drying of the particles is known to cause premature collapse in the cone test used to judge the saturated surface dry state. The resulting test observations are lower relative densities and higher absorption values. The standard deviations obtained in 2013 for both relative density (0.013) and absorption (0.12 and 0.16) are consistent with the values published in the LS-605 and that of the values reported in the past three years (refer Appendix C). As in the previous studies, the multilaboratory variations obtained in 2013 are significantly lower than that of the values published in the ASTM C 128 precision statements. ASTM publishes a multi-laboratory variation of 0.023 and 0.23 for relative density and absorption, respectively for fine aggregates with absorption properties less than 1.0%. The scatter plots for both tests, especially Test No. 28, show a pronounced between laboratory bias. 3.4.14 LS-621 - Amount of Asphalt Coated Particles – Test No. 30 Two hundred and twenty-two laboratories reported results for this test in 2013. Twenty laboratories were identified as outliers using the iterative technique. Scatter diagram provided in the Appendix D1shows a random variation and bias for some laboratories. LS621 provides precision estimate for 19.0 mm maximum size coarse aggregate mixed with asphalt coated particles in the range of 25% to 45%. The average mean value of 54.6% reported by the laboratories is outside the range of values for which the precision estimate MTO Aggregate and Soil Proficiency Sample Testing Program for 2013; MERO-048 - 25 - was developed. The standard deviations of 2.9 and 3.0 obtained in 2013 are significantly lower than the precision estimate of 3.8 published in the LS-621 and the values that were reported in the past three years. Further, the coefficient of variation obtained in 2013 (5.3%) is significantly lower than the range of values (9.3% to 22.7%) obtained in the past three years of study. Laboratories that reported values of less than 48% and in excess of 60% should critically evaluate their interpretation of the definition and re-examine their samples. There is no comparable or similar ASTM test procedure. 3.4.15 LS-623 - Moisture-Density Relationship (One-Point) – Test Nos. 31-33 Participants were asked to perform this test on the material passing the 19.0 mm sieve of the Granular A samples 1.13A and 2.13A supplied. One hundred and fifty-five laboratories reported results for this test in 2013. Fourteen outliers for the wet density (Test No. 31) and nine outliers for optimum moisture (Test No. 33) determinations were rejected using the iterative technique. The standard deviations obtained in 2013 for all three tests, i.e. wet density, dry density and optimum moisture content are significantly lower than that of the values reported in the past three years and the precision estimates published in LS-623. The majority of the points in the scatter diagrams are accounted in the lower left and upper right quadrant of the plots, indicating strong laboratory bias. Possible causes for the strong laboratory bias may be operator error and the use of an improper mould, even though the participants were requested to use only the 152.4 mm diameter mould. This test also requires significant operator skill to obtain the point within the band in the first attempt. Those laboratories with poor ratings should examine their equipment and procedure to discover the causes for this variation. There is no comparable or similar ASTM test procedure. However, ASTM D 698 covers the laboratory compaction characteristics of soils and reports precision estimates from the tests conducted on clayey soils. 3.4.16 LS-619 - Micro-Deval Abrasion (Fine Aggregate) – Test No. 34 Participants in this test were asked to prepare their own sample from the bags of bulk Granular A supplied. Eighty laboratories reported results for this test in 2013. The test method requires reporting of control sample test results to demonstrate that the testing process is in control. This year, none of the participants reported control sample results outside the range established for the material. LS-619 provides precision estimates for fine aggregates with the abrasion loss in the range of 7% to 18%. The coefficient of variation of 7.7% obtained in 2013 is consistent with the precision estimate of 7.7% published in LS-619 and the values (6.2% to 7.9%) reported in the past three years. One outlier was selected by the use of critical value method. The majority of the data points are located in the lower left and upper right quadrant of the scatter diagram indicating a strong laboratory bias. MTO Aggregate and Soil Proficiency Sample Testing Program for 2013; MERO-048 - 26 - 3.4.18 LS-702 - Particle Size Analysis of Soil – Test Nos. 40-45 Participants in this test were instructed to submit the data sheets to demonstrate that the test was done according to LS-702. Based on the data sheets submitted, all of the laboratories performed the test in accordance with this test procedure. Ninety laboratories participated in the hydrometer test in 2013. Eighty-five percent of the laboratories reported results ranging from 98.5% to 99.9% of material passing the 2.00 mm sieve. For this reason, the data for 2.0 mm sieve (Test No. 40) was also subjected to the statistical analysis using no outlier technique. This technique does not assign rating for individual test. As a result, no rating was assigned for 2.0 mm sieve and the results of the analysis are reported for information purpose only. Outliers were selected using the iterative technique. The number of outliers identified range from two for percent passing 75 um to a maximum of nine for percent passing 2 µm. Successive scatter diagrams for this test show pronounced between laboratory biases. The standard deviations obtained in 2013 for all the particle sizes passing, except 75 µm, and 425 µm, are consistent with that of the results reported in the past three years. The standard deviations obtained for the 75 µm and 425 µm sizes are slightly higher than the variations reported in the past three years. The laboratories that are identified as outliers should examine their equipment and technician’s skills to ensure that they meet the requirements of the test procedure. 3.4.19 LS-703 and 704 - Atterberg Limits of Soil – Test Nos. 46-48 One hundred and eight laboratories reported results for Atterberg limit tests in 2013. Five outliers for liquid limit (Test No. 46) and four for plastic limit test (Test No. 47) were identified using the iterative technique. The scatter plots for both liquid and plastic limit tests as well as for plasticity index (Test No. 48) show strong laboratory bias. Both liquid and plastic limit tests require significant operator skills. Liquid limit test also requires good condition and calibration of the apparatus. Close attention to the condition and calibration of the liquid limit apparatus and employing skilled technicians may reduce the laboratory biases. The variations obtained for liquid and plastic limit tests in 2013 are consistent with those of the values reported in the past three years. Further, the standard deviations obtained for plastic limit and plasticity index are consistent with the values published in the ASTM precision statements (refer Appendix C). However, the standard deviations obtained for liquid limit test are slightly higher than that of the precision estimate published in ASTM D 4318. 3.4.20 LS-705 - Specific Gravity of Soils – Test No. 49 The participants were requested to perform this test according to LS-705. This test method requires that the test be performed on a minimum of three specimens, and the difference between the largest and smallest (i.e., range) specific gravity values of the test specimens determined is within 0.02. Further, it requires that the test be repeated if the range exceeds MTO Aggregate and Soil Proficiency Sample Testing Program for 2013; MERO-048 - 27 - the specified limit. The laboratories that reported results with the range in excess of 0.02 appear to have difficulty in repeating the test within their testing environment. In 2013, four laboratories reported specific gravity values with the range in excess of the specified limit of 0.02. These laboratories were manually removed from the statistical analysis and identified as outliers. Eighty-three laboratories reported results for this test in 2013. In addition to those laboratories that were removed manually, five more outliers were identified using the iterative technique. Ninety-five per cent of the data points are located in the first and third quadrants of the scatter diagram showing a pronounced between laboratory bias. Several steps in this test procedure can influence the results, particularly the equipment and method employed for preparation of the test specimen and removal of entrapped air from the test specimen. Laboratories finding themselves in this situation should carefully examine their equipment and procedure. The standard deviation of 0.024 obtained in 2013 is consistent with the results reported in the 2012. LS-705 is similar to that of AASHTO T 100, which reports a multi-laboratory standard deviation of 0.04. As in the past three studies, the standard deviations obtained in 2013 are also found to be significantly lower than that of the precision estimate published in the AASHTO T 100. 3.5 SUPERPAVE CONSENSUS PROPERTY TESTS 3.5.1 LS-629 - Uncompacted Void Content (FA) – Test No. 95 The participants were asked to perform the test in accordance with LS-629, using the fine aggregate prepared by splitting the material passing 4.75 mm sieve of the Granular A. This test method is a modified version of AASHTO T 304. LS-629 follows Method A of AASHTO T 304, except for the preparation of the test specimen to be used in the determination of bulk specific gravity of fine aggregates. The significant difference between the methods is that LS-629 requires the test specimens be washed on the 75 µm sieve until all the material finer than 75 µm is removed. In addition, LS-629 specifies that the bulk relative density is determined using the graded sample and not the individual size fraction method described in Clause 9.4 of AASHTO T 304. In order to minimise the testing work, the participants were advised to use the bulk relative densities reported for fine aggregate determined in accordance with LS-605 under Test No. 27, to compute the uncompacted void contents of samples 3.13 and 4.13. Seventy-two laboratories submitted results for this test in 2013. One laboratory was identified as outlier using the iterative technique. Eighty-six percent of the points on the scatter plot are accounted in the first and third quadrant, indicating a strong laboratory bias. The standard deviations of 0.64 and 0.65 obtained in 2013 are fairly consistent with the values obtained in the past three years. The standard deviations obtained for both samples are significantly higher than the value of 0.33% published in the ASTM precision statements for graded standard sand. The estimates of precision published in ASTM C 1252 are based on graded sand as described in ASTM C 778, which is considered rounded, and is graded MTO Aggregate and Soil Proficiency Sample Testing Program for 2013; MERO-048 - 28 - from 600 µm to 150 µm. The type of material used for the development of precision statements published in ASTM C 1252 may not be typical of the sand samples that were used in this testing program. The uncompacted void contents reported were calculated using the bulk relative densities that were determined by the individual laboratories. The use of the bulk relative densities determined by the individual laboratories further compounds the variations associated with the results reported for uncompacted void contents. ASTM C 1252 suggests that a difference in relative density of 0.05 will change the calculated void content by about one percent. The laboratories that are identified as outliers should review their test procedures and the skill of the technician. 3.5.2 ASTM D 2419 - Sand Equivalent Value of Fine Aggregate - Test No. 96 Participants were asked to prepare the fine aggregate sample for this test by splitting the Granular A material passing 4.75 mm sieve. Two alternate procedures for the preparation of test specimen (air-dry or pre-wet) are allowed in both ASTM and AASHTO methods. The participants were given the option of preparing the test specimen in accordance with either method. Sixty-eight laboratories reported results for this test in 2013. No outlier was identified by the use of critical value method or iterative technique. The lower left and upper right quadrants of the scatter diagram account for 94% of the points showing pronounced laboratory bias. The standard deviations of 8.0 and 7.7 obtained in 2013 are significantly higher than the values reported in the past three years. However, these values are consistent with the multilaboratory precision estimate of 8.0 published by ASTM for samples with sand equivalent value less than 80. 3.5.3 ASTM D 5821 - Percent of Fractured Particles – Test No. 97 The Granular A samples 1.13A and 2.13A supplied did not contain adequate amount of material retained on 19.0 mm sieve. For this reason, the participants were advised to perform the test only on coarse aggregate passing the 19.0 mm sieve. ASTM D 5821 is very similar to MTO LS-607. Seventy-four laboratories submitted results for this test in 2013. Two outliers were detected using the iterative technique. The scatter diagram shows a pronounced between-laboratory bias. The average means determined by the ASTM method (71.5%) and MTO version (69.2%) on the same aggregate samples differs only by 2.3%, which is significantly lower than the multi-laboratory variations published by ASTM (5.2) and MTO LS-608 (4.7). Further, the standard deviations (4.3 and 4.6) obtained in 2013 are significantly lower than the precision estimate of 5.2 published by ASTM. ASTM has not conducted interlaboratory studies to determine a precision estimate and currently publishes statistical data provided by MTO. The variation obtained in 2013 is also noticeably lower than that of the values (4.9 to 6.4) reported in 2011 and 2012. 3.5.4 ASTM D 4791 - Percent Flat and Elongated Particles – Test No. 99 The coarse aggregate samples supplied did not contain adequate amount of material retained MTO Aggregate and Soil Proficiency Sample Testing Program for 2013; MERO-048 - 29 - on the 19.0 mm sieve. For this reason, participants were advised to perform the test only on coarse aggregate passing the 19.0 mm sieve, using a ratio of 5:1 and to calculate the weighted average by assigning the same percent flat and elongated particles value as the next smaller fraction (i.e., 19.0 mm - 13.2 mm) for 26.5 mm to 19.0 mm that need not be tested. Seventy-four laboratories reported results for this test in 2013. Two outliers were detected using the iterative technique. The standard deviations of 0.80 and 0.78 obtained in 2013 are significantly higher than the values (0.19 to 0.46) reported in 2011 and 2012. However, the average coefficient of variation of 55.2% obtained in 2013 is significantly lower than the values obtained in 2011(81.8%) and 2012 (64.5%). The majority of points on the scatter plot are located in the first and third quarter indicating significant laboratory bias. ASTM D 4791 requires that the percent flat and elongated particles results are reported separately for each fraction tested. The precision estimates in this test method are also provided separately for each fraction ranging from 19.0 mm to 12.5 mm, 12.5 mm to 9.5 mm, and 9.5 mm to 4.75 mm. However, the results reported in this study are based on the weighted average calculated using the results of five fractions ranging from 26.5 mm to 4.75.mm. For this reason, a direct comparison of the multi-laboratory variations obtained in this study with that of the precision estimates published by ASTM is not possible. MTO Aggregate and Soil Proficiency Sample Testing Program for 2013; MERO-048 - 30 - 4. Laboratory Rating System The laboratory rating system assigns separate overall ratings for each category of laboratories, i.e., low complexity (Production) aggregate laboratories, high complexity (Full Service) Aggregate laboratories, Soil laboratories, and Superpave laboratories. Laboratories must participate in all of the tests that are listed under each category (i.e., Production, Full Service, Soil and Superpave) to assign an overall laboratory rating. Production (CCIL Type C) laboratories are required to carry out wash pass 75 m, sieve analysis, percent crushed particles, percent asphalt coated particles, and percent flat and elongated particles tests. In addition to these tests, Full Service laboratories (CCIL Type D) must carry out micro-Deval (coarse and fine), freeze-thaw, and/or magnesium sulphate soundness, relative density and absorption (coarse and fine) tests. Soil laboratories are required to carry out particle size analysis, Atterberg limits, and specific gravity of soil tests. Superpave aggregate laboratories are required to perform all four consensus property tests (i.e. uncompacted void content, sand equivalent value, percent fractured particles, and flat and elongated particles). The rating system gives a maximum rating of 10 for each test, (e.g. 5 for wash pass 75 m on sample 1.13, plus -5 for wash pass 75 m on sample 2.13, equals 10 (the negative sign indicating a test result less than the mean is ignored)). See Section 2.1 for explanation of test method ratings. Some tests that are normally reported together are averaged and given a maximum of 10. The relative density and absorption (coarse and fine), one-point Proctor values (maximum wet and dry density, and optimum moisture content), particle size analysis of soils, and Atterberg limits are treated in this manner. Because of the large number of individual test ratings in the sieve analysis results, the ratings are modified so as not to unduly bias the overall balance between various tests. The ratings for each sieve size are added and then divided by eleven coarse and fine sieves for which results were reported, and multiplied by 3 to give a laboratory rating with a maximum of 30 for this test. Individual laboratory ratings are calculated by adding the ratings of each test in the appropriate lab category (i.e. Production, Full Service, Soil, or Superpave) and converting the sum to a percentage of the maximum available rating for the category. The spread of laboratory ratings for Production, Full Service, Soil, and Superpave laboratories are given in the form of histograms in Figures 2 to 5. The rating system for “Full Service Laboratory” (Type D) shows that 52% of the participating laboratories in 2013 obtained a rating higher than 90 and, in the case of consensus property tests (Superpave), 62% of the participants obtained an overall laboratory rating higher than 90. The laboratory rating system data is reported in the Appendices F1, F2, F3, and F4. Laboratory ratings for each category are given to participants in the covering letter accompanying the individual laboratory results. A poor or good rating for a laboratory in one year is an indication of how that laboratory performed in the proficiency study, and may not be a reflection of how the laboratory performs year round. A consistently poor rating over two or more years may be cause for serious concern. MTO Aggregate and Soil Proficiency Sample Testing Program for 2013; MERO-048 - 31 - 2013 MTO AGGREGATE AND SOIL PROFICIENCY SAMPLES PRODUCTION LABORATORY RATINGS Number of Laboratories 60 Total Number of Laboratories (n) = 220 45 30 15 95-100 90-95 85-90 80-85 75-80 70-75 65-70 60-65 55-60 50-55 45-50 40-45 0 Production Laboratory Ratings (%) Figure 2. Production Laboratory Ratings 2013 MTO AGGREGATE AND SOIL PROFICIENCY SAMPLES FULL SERVICE AGGREGATE LABORATORY RATINGS Total Number of Laboratories (n) = 62 20 15 10 5 Full Service Laboratory Ratings (%) Figure 3. Full Service Laboratory Ratings MTO Aggregate and Soil Proficiency Sample Testing Program for 2013; MERO-048 95-100 90-95 85-90 80-85 75-80 70-75 65-70 60-65 55-60 50-55 45-50 0 40-45 Number of Laboratories 25 - 32 - 30 Total Number of Laboratories (n) = 81 25 20 15 10 5 95-100 90-95 85-90 80-85 75-80 70-75 65-70 60-65 55-60 50-55 45-50 0 40-45 Number of Laboratories 2013 MTO AGGREGATE AND SOIL PROFICIENCY SAMPLES SOIL LABORATORY RATINGS Soil Laboratory Ratings (%) Figure 4. Soil Laboratory Ratings 2013 MTO CONSENSUS PROPERTY SAMPLE TESTING PROGRAM SUPERPAVE LABORATORY RATINGS Total Number of Laboratories (n) = 68 20 15 10 5 Superpave Laboratory Ratings (%) Figure 5. Superpave Laboratory Ratings MTO Aggregate and Soil Proficiency Sample Testing Program for 2013; MERO-048 95-100 90-95 85-90 80-85 75-80 70-75 65-70 60-65 55-60 50-55 45-50 0 40-45 Number of Laboratories 25 - 33 - 5. Conclusions The method of proficiency sample preparation employed by MTO resulted in almost identical mean gradation values for samples 1.13 and 2.13. The differences in mean, as well as in the standard deviations between pairs of samples for both coarse and fine sieves are almost negligible. Based on the results, it may be concluded that the sample preparation method employed is very effective and capable of producing a uniform and nearly identical material at reasonable cost. The majority of the aggregate and soil test results of the 2013 Aggregate and Soil Proficiency Sample Testing Program compare favourably with the results of previous studies. In some cases, the variations show noticeable improvement over previous years’ results and the precision estimates of those tests where MTO or ASTM precision statements are available. The scatter diagrams for the majority of the aggregate tests show either random variation or a combination of random variation and laboratory bias for some laboratories. Two hundred and twenty of the laboratories that participated in the aggregate tests are CCIL Type C (Production) certified, and sixty-two of those are also CCIL Type D (Full Service) certified. CCIL inspects the certified laboratories for quality control procedures, ability of technicians, and condition and calibration of the equipment at about eighteen month intervals. The performance of laboratories in most of the aggregate tests (Type C and Type D) is consistent with the results in the past and a large number of these tests show improvement in multi-laboratory variation over the established precision estimates. The improvements noted may be due to the on-site laboratory inspection by CCIL at regular intervals, proficiency sample testing, and due to an increased awareness of the importance of proper testing and quality control procedures implemented by CCIL. Eighty-one laboratories participated in all three soil tests. The variations found in 2013 for the soil tests are consistent with that of the values reported in the last three years’ studies, but the scatter diagrams of all three tests still show strong laboratory biases. The results of soil tests are significantly influenced by operator skills, testing environment, and the condition and calibration of the equipment. Thirty-four of the Eighty-one laboratories that participated in the soil tests are on the MTO Vendors List. Most of the laboratories that are on the MTO Vendors List were inspected by MTO staff more than six to eight years ago and only a few re-inspections8 have been done to date. Sixty-eight laboratories participated in all four Superpave consensus property tests. The results of 2013 compare favourably with the results of past three years. However, the multilaboratory precisions obtained in 2013, except uncompacted void content, show improvement over the ASTM precision estimates. As in the past, the scatter diagrams for all four tests show strong laboratory biases. It is expected that the quality control program implemented by CCIL will bring about improvements in multi-laboratory variations. 8 To arrange an inspection of your Soil Laboratory, please contact Mark Vasavithasan, Soils and Aggregates Section, Ministry of Transportation, phone (416) 235-4901, fax (416) 235-4101, [email protected]. MTO Aggregate and Soil Proficiency Sample Testing Program for 2013; MERO-048 - 34 - 6. Recommendations Although, there are improvements in the multi-laboratory variations over the precision estimates established by ASTM and MTO, strong laboratory biases still remain in few of the aggregate tests and all of the soil and consensus property test procedures. The laboratories that were identified as outliers should examine their quality control practices, the condition and calibration of equipment, testing procedures, and skills of the technicians. Laboratories must investigate the causes and prepare corrective action reports as required by the quality system whenever a rating of 2 or less is obtained for each sample in a test. The results of the 2013 MTO Aggregate and Soil Proficiency Sample Testing Program suggest that most laboratories have performed satisfactorily. Laboratories that obtained relatively low ratings must focus on quality control practices, operator training, standardization and calibration of equipment, and improvements to laboratory environment in order to improve their performance. For all of the tests that were included in this study, the equipment to be used is regulated by the test method itself. A good state of equipment maintenance, repair, and correct calibration is required in order to achieve improvements. It is hoped that the mandatory Quality System implemented by CCIL will encourage laboratories to conduct a review of their internal quality control practices to ensure that they have the correct equipment and properly trained technicians. Laboratories will find that a well-documented and regular program of internal inspection, calibration, and testing of control or reference samples is beneficial to maintaining a high level of confidence in their results. MTO Aggregate and Soil Proficiency Sample Testing Program for 2013; MERO-048 - 35 - 7. Acknowledgments The authors would like to acknowledge Bob Gorman of the Soils and Aggregates Section for the selection of aggregate materials for the 2013 proficiency sample testing program. We would also like to thank the many laboratory staff, students and engineers-in-training of the Materials Engineering and Research Office for their dedicated assistance in preparing more than 2290 individual samples, from almost 50 tonnes of aggregate and soil material, for distribution to the program participants. MTO Aggregate and Soil Proficiency Sample Testing Program for 2013; MERO-048 - 36 - References 1. American Society for Testing and Materials. Annual Book of ASTM Standards, Vol. 04.02, Concrete and Aggregate. 2. American Society for Testing and Materials. Annual Book of ASTM Standards, Vol. 14.02, Statistical Methods. 3. Grubbs, F.E. and Beck, G., “Extension of Sample Sizes and Percentage Points for Significance Tests of Outlying Observations”, Technometrics, TCMTA, Vol. 14, No. 4, November 1972, pp. 847–854. 4. Grubbs, F.E., “Procedures for Detecting Outlying Observations in Samples”, Technometrics, TCMTA, Vol. 11, No. 4, February 1969, pp. 1–21. 5. Manchester, L., 1979, “The Development of an Interlaboratory Testing Program for Construction Aggregates”, Engineering Materials Office Report EM-33, Ministry of Transportation, Ontario. 6. MTO, 2013, MTO Laboratory Testing Manual, Ministry of Transportation, Ontario, Canada, Materials Engineering and Research Office, Available from MTO library at www.mto.gov.on.ca. 7. OPSS, 2011, Ontario Provincial Standards for Roads and Municipal Services, Volume 2, General Conditions of Contract and Specifications for Contract 8. Vasavithasan, M. and Rutter, B., 2004, “User’s Manual for Soils and Aggregates Sample Testing (SASTP) Computer Program”, Materials Engineering and Research Office Report MERO-013, Ministry of Transportation, Ontario. 9. Vogler, R.H. and Spellenberg, P.A., “AASHTO T 27 – Sieve Analysis of Fine and Coarse Aggregate”, AASHTO Technical Section 1c, Unpublished Paper. MTO Aggregate and Soil Proficiency Sample Testing Program for 2013; MERO-048 - 37 - Appendix A: Glossary of Terms Acceptable difference between two results (difference two-sigma limit (d2s)) as an index of precision is the maximum acceptable difference between two results obtained on test portions of the same material tested by two different laboratories. The index, d2s, is the difference between two individual test results that would be equalled or exceeded in only one case in twenty in the normal and correct operation of the method. The index is calculated by multiplying the multi-laboratory standard deviation (1s) by the factor 22 (2.83). Accuracy refers to the degree of mutual agreement between a set of measurements with an accepted reference or ‘true value’. This ‘true’ or reference value can be an assigned value arrived at by actual experiments. Bias of a measurement process is a consistent and systematic difference between a set of test results derived from using the process and an accepted reference value of the property being measured. For the majority of aggregate and soil tests, there is no acceptable reference material, so bias is impossible to compute. Coefficient of Variation expresses the standard deviation as a percentage of the mean, where: C.V. = std dev x 100 mean Critical Value is that value of the sample criterion which would be exceeded by chance with some specified probability (significance level) on the assumption that all the observations did indeed constitute a random sample from a common system of causes. MAIDB refers to Mineral Aggregate Inventory Data Bank of the Ministry of Transportation. Median is synonymous with the middle and the sample median is the middle value of a list of test results when the observations are ordered from smallest to largest in magnitude. After rearranging the observations in increasing order (from most negative to most positive), the sample median is the single middle value in the ordered list, if n is odd, or the average of the two middle values in the ordered list, if n is even, where n equals the number of observations. Multi-laboratory precision is a quantitative estimate of the variability of a large group of individual test results when each test has been made in a different laboratory and every effort has been made to make test portions of the material as nearly identical as possible. Under normal circumstances, the estimates of the one-sigma limit (1s) for multi-laboratory precision are usually larger than those for single-operator precision because different operators and different equipment are being used in different laboratories. Outlier is a measurement that, for a specific degree of confidence, is not part of the population. In this study, an outlier is generally three or more standard deviations from the MTO Aggregate and Soil Proficiency Sample Testing Program for 2013; MERO-048 - 38 - mean, giving a confidence level of ninety-nine percent. If a laboratory test result is classified as an outlier, it means that something went wrong either with the sample or in the laboratory. Precision refers to the degree of mutual agreement between individual measurements on the same material. In other words, precision is a measure of how well the individual test results of a series agree with each other. Sample mean or average is the sum of all observations divided by the total number of observations. Single operator precision (one-sigma limit (1s)) indicates the variability, as measured by the deviations above and below the average, of a large group of individual test results when the tests have been made on the same material by a single operator using the same apparatus in the same laboratory over a relatively short time. Standard deviation is the most usual measure of the dispersion of observed values or results expressed as the positive square root of the variance. Variance is a measure of the squared dispersion of observed values or measurements expressed as a function of the sum of the squared deviations from the population mean or sample average. MTO Aggregate and Soil Proficiency Sample Testing Program for 2013; MERO-048 - 39 - A. L. Blair Construction Limited Moose Creek, ON Mr. Justin Blair Tel: 613 538-2271 AGS Associates Inc. Scarborough, ON Mr. Amjed Siddiqui Tel: 416 299-3655 Alston Associates Inc. Toronto, ON Mr. Jonathan Bond Tel: 905 474-5265 AME - Materials Engineering Caledon, ON Mr. Scott Crowley Tel: 905 840-5914 AME - Materials Engineering Ottawa, ON Mr. Harrison Smith Tel: 613 726-3039 AME - Materials Engineering (24-165) Caledon, ON Mr. Scott Crowley Tel: 905 840-5914 AME - Materials Engineering (24-270) Caledon, ON Mr. Scott Crowley Tel: 905 840-5914 AME - Materials Engineering (24-271) Caledon, ON Mr. Scott Crowley Tel: 905 840-5914 AME - Materials Engineering (24-297) Caledon, ON Mr. Scott Crowley Tel: 905 840-5914 AME - Materials Engineering (24-298) Caledon, ON Mr. Scott Crowley Tel: 905 840-5914 AME - Materials Engineering (24-384) Caledon, ON Mr. Scott Crowley Tel: 905 840-5914 AME - Materials Engineering (24-911) Caledon, ON Mr. Scott Crowley Tel: 905 840-5914 AME - Materials Engineering (24-912) Caledon, ON Mr. Scott Crowley Tel: 905 840-5914 AMEC Earth & Environmental Ltd. Scarborough, ON Mr. Mohammadsarif Sufi Tel: 416 751-6565 LS-621 Asphalt Coated Particles LS-620 Accelerated Mortar Bar LS-619 Micro-Deval FA LS-618 Micro-Deval CA (416) 235-4901, or (416) 235-3734 LS-614 Freeze-Thaw Mark Vasavithasan Stephen Senior LS-606 Sulphate Soundness For further information on this program, contact: LS-602 Sieve Analysis Testing Program LS-601 Wash Pass 75m Proficiency Sample LS-604/5 Relative Density Aggregate and Soil LS-603 Los Angeles Abrasion LS-705 Specific Gravity of Soils LS-703/4 Atterberg Limits LS-702 Particle Size Analysis LS-608 Percent Flat and Elongated LS- 623 One Point Proctor Density LS-607 Percent Crushed Particles Ministry of Transportation LS-616 Petrographic Analysis – Fine 2013 Participants List LS-609 Petrographic Number - Concrete Appendix B1: List of Participants MTO Aggregate and Soil Proficiency Sample Testing Program for 2013; MERO-048 LS-606 Sulphate Soundness LS-607 Percent Crushed Particles LS-608 Percent Flat and Elongated LS-609 Petrographic Number - Concrete LS-616 Petrographic Analysis – Fine - 40 - LS-705 Specific Gravity of Soils LS-703/4 Atterberg Limits LS-702 Particle Size Analysis LS- 623 One Point Proctor Density LS-621 Asphalt Coated Particles AMEC Earth & Environmental Ltd. Hamilton, ON Mr. John Balinski Tel: 905 312-0700 AMEC Earth & Environmental Ltd. Cambridge, ON Ms. Tammy Hawkins Tel: 519 650-7100 AMEC Earth & Environmental Ltd. Sarnia, ON Mr. Geoff Collier Tel: 519 337-5409 AMEC Earth & Environmental Ltd. Tecumseh, ON Mr. Justin Palmer Tel: 519 735-2499 AMEC Earth & Environmental Ltd. Thorold, ON Mr. Andrew Markov Tel: 905 687-6616 AMEC Earth & Environmental Ltd. – PN2 Hamilton, ON Mr. Martin Little Tel: 905 312-0700 AMEC Earth & Environmental Ltd. – PN4 Hamilton, ON Mr. Jesse Stickless Tel: 905 312-0700 AMEC Earth & Environmental Ltd. – PN5 Hamilton, ON Ms. Heather Racher Tel: 905 312-0700 AMEC Earth & Environmental Ltd. – PN7 Hamilton, ON Ms. Jennifer McKenna Tel: 905 312-0700 Bernt Gilbertson Enterprises Ltd. Richards Landing, ON Mr. Scott Eddy Tel: 705 246-2076 BOT Construction Oakville, ON Mr. Vicks Sellathurai Tel: 905 827-3250 BOT Construction - Mobile Oakville, ON Mr. Vicks Sellathurai Tel: 905 827-3250 Bruno’s Contracting (Thunder Bay) Ltd. Thunder Bay, ON Mr. Silvio DiGregorio Tel: 807 623-1855 C. Villeneuve Construction – Mobile 1 Hearst, ON Mr. Charles Harris Tel: 705 372-1838 C. Villeneuve Construction – Mobile 2 Hearst, ON Mr. Charles Harris Tel: 705 372-1838 C. Villeneuve Construction – Mobile 3 Hearst, ON Mr. Charles Harris Tel: 705 372-1838 C.T. Soil & Materials Testing Inc. Windsor, ON Mr. Thomas O’Dwyer Tel: 519 966-8863 LS-619 Micro-Deval FA (416) 235-4901, or (416) 235-3734 LS-618 Micro-Deval CA Mark Vasavithasan Stephen Senior LS-604/5 Relative Density For further information on this program, contact: LS-603 Los Angeles Abrasion Testing Program LS-602 Sieve Analysis Proficiency Sample LS-601 Wash Pass 75m Aggregate and Soil LS-614 Freeze-Thaw Ministry of Transportation LS-620 Accelerated Mortar Bar 2013 Participants List MTO Aggregate and Soil Proficiency Sample Testing Program for 2013; MERO-048 LS-705 Specific Gravity of Soils LS-703/4 Atterberg Limits LS-702 Particle Size Analysis LS-621 Asphalt Coated Particles LS-620 Accelerated Mortar Bar LS-619 Micro-Deval FA LS- 623 One Point Proctor Density Caledon Sand & Gravel Ltd. Caledon Village, ON Mr. Dean Glenn Tel: 905 857-3500 Cambium Inc. Peterborough, ON Mr. Wayne Rayfuse Tel: 705 742-7900 Capital Paving Inc. Guelph, ON Mr. Mark Latyn Tel: 519 822-4511 CBM Aggregates Cambridge, ON Mr. Mike Smith Tel: 519 239-4743 CBM Aggregates Brighton, ON Mr. Mike Smith Tel: 519 319-8409 CBM Aggregates London, ON Mr. Mike Smith Tel: 519 240-8410 CBM Aggregates Sunderland, ON Mr. Mike Smith Tel: 519 319-8409 CBM Aggregates Westwood, ON Mr. Mike Smith Tel: 519 319-8409 CCI Group Inc. Woodbridge, ON Mr. M. Sukhandan Tel: 905 856-5200 Chung & Vander Dollen Engineering Limited, Kitchener, ON Mr. William Evans Tel: 519 742-8979 CMT Engineering Inc. St. Clements, ON Mr. Nathan Love Tel: 519 699-5775 COCO Paving Inc. Belleville, ON Mr. Tom Woodcock Tel: 613 962-3461 COCO Paving Inc. Ottawa, ON Mr. Brad Gooderham Tel: 613 907-7283 COCO Paving Inc. Toronto, ON Mr. Andrew Pahalan Tel: 416 347-3590 COCO Paving Inc. Windsor, ON Mr. Ishaq Syed Tel: 519 948-7133 Coffey Geotechnics Inc. Toronto, ON Mr. Rizwan Bajwa Tel: 416 213-1255 Colacem Canada L’Original, ON Mr. Shu Yang Tel: 819 242-4312 LS-618 Micro-Deval CA (416) 235-4901, or (416) 235-3734 LS-614 Freeze-Thaw LS-608 Percent Flat and Elongated Mark Vasavithasan Stephen Senior LS-606 Sulphate Soundness For further information on this program, contact: LS-602 Sieve Analysis Testing Program LS-601 Wash Pass 75m Proficiency Sample LS-604/5 Relative Density Aggregate and Soil LS-603 Los Angeles Abrasion LS-607 Percent Crushed Particles Ministry of Transportation LS-616 Petrographic Analysis – Fine 2013 Participants List LS-609 Petrographic Number - Concrete - 41 - MTO Aggregate and Soil Proficiency Sample Testing Program for 2013; MERO-048 LS- 623 One Point Proctor Density LS-702 Particle Size Analysis LS-703/4 Atterberg Limits LS-705 Specific Gravity of Soils LS-620 Accelerated Mortar Bar LS-619 Micro-Deval FA LS-618 Micro-Deval CA LS-614 Freeze-Thaw LS-621 Asphalt Coated Particles Concrete Materials Lab, Dept. of Engineering, U. of Toronto Dr. R. D. Hooton Tel: 416 946-5496 Construction Testing Asphalt Lab Ltd. Cambridge, ON Mr. Peter Lung Tel: 519 622-7023 Cornwall Gravel Company Limited Cornwall, ON LS-616 Petrographic Analysis – Fine (416) 235-4901, or (416) 235-3734 LS-608 Percent Flat and Elongated Mark Vasavithasan Stephen Senior LS-606 Sulphate Soundness For further information on this program, contact: LS-604/5 Relative Density Testing Program LS-602 Sieve Analysis Proficiency Sample LS-601 Wash Pass 75m Aggregate and Soil LS-603 Los Angeles Abrasion Ministry of Transportation LS-607 Percent Crushed Particles 2013 Participants List LS-609 Petrographic Number - Concrete - 42 - Ms. Billie-Gail Macfarlane Tel: 613 930-3530 Corporation of the County of Grey Chatsworth, ON Mr. Gregory Pell Tel: 519 376-7339 Cox Construction Limited Guelph, ON Mr. Andrew Smith Tel: 519 824-6570 Cruickshank Construction Ltd. Elginburg, ON Mr. Tim Bilton Tel: 613 536-9112 Cruickshank Construction Ltd. - Mobile Kemptville, ON Mr. Tim Bilton Tel: 613 258-9111 D. Crupi & Sons Limited Toronto, ON Mr. P.Kandasaami T el: 416 291-1986 D. F. Elliott Consulting Engineering New Liskeard, ON Mr. Brad Gilbert Tel: 705 647-6871 Danford Construction Madoc, ON Mr. Al Danford Tel: 613 473-2468 Davroc Testing Laboratories Inc. Brampton, ON Mr. Sal Fasullo Tel: 905 792-7792 DBA Engineering Limited Cambridge, ON Mr. Andy Burleigh Tel: 905 851-0090 DBA Engineering Limited Vaughan, ON Mr. Andy Burleigh Tel: 905 851-0090 DBA Engineering Limited – PN2 Vaughan, ON Mr. Nick Sibillia Tel: 905 851-0090 DBA Engineering Limited – PN3 Vaughan, ON Mr. Alhua Liang Tel: 905 851-0090 DBA Engineering Limited – PN4 Vaughan, ON Mr. Kevin Jackson Tel: 905 851-0090 DBA Engineering Ltd. Kingston, ON Mr. Mark McClelland Tel: 613 389-1781 MTO Aggregate and Soil Proficiency Sample Testing Program for 2013; MERO-048 LS-702 Particle Size Analysis LS-703/4 Atterberg Limits LS-705 Specific Gravity of Soils LS- 623 One Point Proctor Density LS-620 Accelerated Mortar Bar LS-619 Micro-Deval FA LS-618 Micro-Deval CA LS-614 Freeze-Thaw LS-621 Asphalt Coated Particles Department of Civil Engineering Ryerson University, Toronto Dr. Medhat Shehata Tel: 416 979-5000 District Municipality of Muskoka Bracebridge, ON Mr. Dave Wood Tel: 705 645-6764 Drain Bros Excavating Ltd. Lakefield, ON Mr. Elton Neuman Tel: 705 639-2301 DST Consulting Engineers Inc. Kenora, ON Mr. Neil Johnson Tel: 807 468-2349 DST Consulting Engineers Inc. Thunder Bay, ON Dr. Myint Win Bo Tel: 807 623-2929 DST Consulting Engineers Inc. Ottawa, ON Mr. George Thomas Tel: 613 247-2425 Dufferin Aggregates Acton, ON Ms. Kelly Mercer Tel: 416 453-3268 Dufferin Aggregates Blair, ON Mr. Gord Taylor Tel: 905 308-5324 Dufferin Aggregates Cayuga, ON Mr. Gord Taylor Tel: 905 308-5324 Dufferin Aggregates Dundas, ON Mr. Gord Taylor Tel: 905 308-5324 Dufferin Aggregates Milton, ON Ms. Kelly Mercer Tel: 416 453-3268 Dufferin Aggregates Orono, ON Ms. Kelly Mercer Tel: 416 453-3268 Dufferin Aggregates Cambridge, ON Mr. Gord Taylor Tel: 905 308-5324 Dufferin Construction Limited - Cayuga Cayuga, ON Mr. Ronald Abdul Tel: 905 827-5750 Dufferin Construction Limited - Mobile 1 Oakville, ON Mr. Ronald Abdul Tel: 905 827-5750 Dufferin Construction Limited - Mobile 2 Oakville, ON Mr. Ronald Abdul Tel: 905 827-5750 Dufferin Construction Limited - Mobile 3 Oakville, ON Mr. Ronald Abdul Tel: 905 827-5750 LS-616 Petrographic Analysis – Fine (416) 235-4901, or (416) 235-3734 LS-608 Percent Flat and Elongated Mark Vasavithasan Stephen Senior LS-606 Sulphate Soundness For further information on this program, contact: LS-604/5 Relative Density Testing Program LS-602 Sieve Analysis Proficiency Sample LS-601 Wash Pass 75m Aggregate and Soil LS-603 Los Angeles Abrasion Ministry of Transportation LS-607 Percent Crushed Particles 2013 Participants List LS-609 Petrographic Number - Concrete - 43 - MTO Aggregate and Soil Proficiency Sample Testing Program for 2013; MERO-048 LS-621 Asphalt Coated Particles LS-620 Accelerated Mortar Bar LS-619 Micro-Deval FA LS-705 Specific Gravity of Soils LS-703/4 Atterberg Limits LS-702 Particle Size Analysis LS-618 Micro-Deval CA Dufferin Construction Ltd. (QC) Oakville, ON Mr. Ronald Abdul Tel: 905 827-5750 E.C. King Contracting Owen Sound, ON Mr. Lance Elliott Tel: 519 376-6140 Engtec Consulting Inc. Vaughan, ON Mr. Salman Bhutta Tel: 905 856-2988 Esko Savela & Son Contracting Inc. Shuniah, ON Mr. Craig Baumenn Tel: 807 983-2097 exp Services Inc. Timmins, ON Mr. Jason Ferrigan Tel: 705 268-4351 exp Services Inc. Brampton, ON Mr. Ammanuel Yousif Tel: 905 793-9800 exp Services Inc. London, ON Mr. David Speller Tel: 519 963-3000 exp Services Inc. Oldcastle, ON Mr. David Speller Tel: 519 963-3000 exp Services Inc. Hamilton, ON Mr. Ashraf Abass Tel: 905 573-4000 exp Services Inc. Sudbury, ON Mr. Rob Ferguson Tel: 705 674-9681 exp Services Inc. Ottawa, ON Mr. Ismail M. Taki Tel: 613 723-2886 exp Services Inc. Thunder Bay, ON Mr. Darryl Kelly Tel: 807 623-9495 exp Services Inc. Barrie, ON Mr. Leigh Knegt Tel: 705 734-6222 Fermar Construction Limited Rexdale, ON Mr. W. Francescantonio Tel: 416 675-3550 Fowler Construction Company Bracebridge, ON Mr. Ross Elliott Tel: 705 644-4037 Fowler Construction Company – Mobile Bracebridge, ON Mr. Ross Elliott Tel: 705 644-4037 G. Tackaberry & Sons Construction Co. Ltd., Athens, ON Mr. Paul Rodgers Tel: 613 924-2634 LS-614 Freeze-Thaw (416) 235-4901, or (416) 235-3734 LS- 623 One Point Proctor Density LS-608 Percent Flat and Elongated Mark Vasavithasan Stephen Senior LS-606 Sulphate Soundness For further information on this program, contact: LS-602 Sieve Analysis Testing Program LS-601 Wash Pass 75m Proficiency Sample LS-604/5 Relative Density Aggregate and Soil LS-603 Los Angeles Abrasion LS-607 Percent Crushed Particles Ministry of Transportation LS-616 Petrographic Analysis – Fine 2013 Participants List LS-609 Petrographic Number - Concrete - 44 - MTO Aggregate and Soil Proficiency Sample Testing Program for 2013; MERO-048 Gamsby and Mannerow Limited Owen Sound, ON Mr. Derek Brewster Tel: 519 376-1805 Gazzola Paving Ltd. Etobicoke, ON Mr. Solomon. Andualem Tel: 416 675-9803 Genivar Peterborough, ON Ms. Kelly Whitney Tel: 705 743-6850 Geo Terre Limited Brampton, ON Mr. Julian Murillo Tel: 905 455-5666 Geo-Logic Inc. Peterborough, ON Mr. Matt Rawlings Tel: 705 749-3317 Geo-Logic Inc. Oshawa, ON Mr. Matt Rawlings Tel: 705 749-3317 Geo-Logic Inc. Pembroke, ON Mr. Sheldon Thoma Tel: 613 735-8361 Golder Associates Ltd. Barrie, ON Mr. Rick Watson Tel: 705 722-4492 Golder Associates Ltd. Cambridge, ON Mr. Jodi Norris Tel: 519 620-1222 Golder Associates Ltd. Markham, ON Mr. Albert Lam Tel: 905 475-5591 Golder Associates Ltd. London, ON Mr. Chris Sewell Tel: 519 652-0099 Golder Associates Ltd. Mississauga, ON Ms. Mariana Manojlovic Tel: 905 567-4444 Golder Associates Ltd. Ottawa, ON Mr. Chris Mangione Tel: 613 592-9600 Golder Associates Ltd. Sudbury, ON Ms. Sylvie LaPorte Tel: 705 524-6861 Golder Associates Ltd. Whitby, ON Mr. Jeremy Rose Tel: 905 723-2727 Golder Associates Ltd. Windsor, ON Mr. Roy Walsh Tel: 519 250-3733 Golder Associates Ltd. Burnabay, B.C. Ms. Lily Hu Tel: 604 592-3259 LS-620 Accelerated Mortar Bar LS-619 Micro-Deval FA LS-618 Micro-Deval CA (416) 235-4901, or (416) 235-3734 LS-614 Freeze-Thaw Mark Vasavithasan Stephen Senior LS-606 Sulphate Soundness For further information on this program, contact: LS-602 Sieve Analysis Testing Program LS-601 Wash Pass 75m Proficiency Sample LS-604/5 Relative Density Aggregate and Soil LS-603 Los Angeles Abrasion LS-705 Specific Gravity of Soils LS-703/4 Atterberg Limits LS-702 Particle Size Analysis LS- 623 One Point Proctor Density LS-608 Percent Flat and Elongated LS-621 Asphalt Coated Particles LS-607 Percent Crushed Particles Ministry of Transportation LS-616 Petrographic Analysis – Fine 2013 Participants List LS-609 Petrographic Number - Concrete - 45 - MTO Aggregate and Soil Proficiency Sample Testing Program for 2013; MERO-048 LS-705 Specific Gravity of Soils LS-703/4 Atterberg Limits LS-702 Particle Size Analysis LS- 623 One Point Proctor Density LS-621 Asphalt Coated Particles Graham Brothers Construction Limited Brampton, ON Mr. Greg Thompson Tel: 905 453-1200 Greenwood Aggregates Amaranth, ON Mr. Andrew Raymond Tel: 519 940-6844 Harold Sutherland Construction Ltd. Kemble, ON Mr. Roland Leigh Tel: 519 376-3506 Hatch Ltd. Niagara Falls, ON Mr. Ralph Serluca Tel: 905 374-5200 Holcim Canada Inc. Etobicoke, ON Mr. G. Julio-Betancourt Tel: 416 744-2206 Holcim Canada Inc. Etobicoke, ON Mr. Kim Ripper 416 744-2206 Houle Chevrier Engineering Limited Carp, ON Mrs. Krystle Smith Tel: 613 836-1422 Huron Construction Co. Ltd. Chatham, ON Mr. David Smith Tel: 519 354-0170 Inspec-sol Inc. St. Catharines, ON Mr. Wayne Russell Tel: 905 682-0510 Inspec-sol Inc. Kingston, ON Mr. Mark Patterson Tel: 613 389-9812 Inspec-Sol Inc. Mississauga, ON Mr. Raj Kadia Tel: 905 712-4771 Inspec-sol Inc. Ottawa, ON Mr. Daniel Boateng Tel: 613 727-0895 Inspec-Sol Inc. Waterloo, ON Mr. Bruce Polan Tel: 519 725-9328 LS-620 Accelerated Mortar Bar (416) 235-4901, or (416) 235-3734 LS-619 Micro-Deval FA Mark Vasavithasan Stephen Senior LS-618 Micro-Deval CA LS-608 Percent Flat and Elongated For further information on this program, contact: LS-614 Freeze-Thaw LS-607 Percent Crushed Particles Testing Program LS-606 Sulphate Soundness Proficiency Sample LS-604/5 Relative Density LS-602 Sieve Analysis Aggregate and Soil LS-603 Los Angeles Abrasion LS-601 Wash Pass 75m Ministry of Transportation LS-616 Petrographic Analysis – Fine 2013 Participants List LS-609 Petrographic Number - Concrete - 46 - Interpaving Asphalt & Aggregate Supply Ltd. Sudbury, ON Ms. Ashley Edwards Tel: 705 694-6210 Intratech Engineering Laboratories Inc. Scarborough, ON Mr. Frank Miles Tel: 416 754-2077 J & P Leveque Bros. Ltd. - Mobile 616 Bancroft, ON Mr. Shawn Fransky Tel: 613 332-5533 J & P Leveque Bros. Ltd. – Mobile 617 Bancroft, ON Mr. Shawn Fransky Tel: 613 332-5533 MTO Aggregate and Soil Proficiency Sample Testing Program for 2013; MERO-048 LS-604/5 Relative Density LS-606 Sulphate Soundness LS-607 Percent Crushed Particles LS-608 Percent Flat and Elongated LS-609 Petrographic Number - Concrete 2013 Participants List LS-618 Micro-Deval CA LS-619 Micro-Deval FA LS-621 Asphalt Coated Particles LS- 623 One Point Proctor Density LS-702 Particle Size Analysis LS-703/4 Atterberg Limits LS-705 Specific Gravity of Soils Testing Program For further information on this program, contact: Mark Vasavithasan Stephen Senior (416) 235-4901, or (416) 235-3734 John D. Paterson & Associates Ottawa, ON Mr. Stephen Walker Tel: 613 226-7381 John D. Paterson & Associates North Bay, ON Mr. Shawn Nelson Tel: 707 472-5331 K. J. Beamish Construction - Mobile 1 King City, ON Mr. Chad Henderson Tel: 905 833-4666 K. J. Beamish Construction - Mobile 2 King City, ON Mr. Chad Henderson Tel: 905 833-4666 K.J. Beamish Construction King City, ON Mr. Chad Henderson Tel: 905 833-4666 Lafarge Canada Orono, ON Mr. Frances Clements Tel: 905 983-9260 Lafarge Canada – Mobile 434 Barrie, ON Ms. Sarah Brown Tel: 705 623-4166 Lafarge Canada - Orillia Lab Barrie, ON Ms. Sarah Brown Tel: 705 623-4166 Lafarge Canada Inc. Brechin, ON Ms. Christine Crumbie Tel: 705 484-5225 Lafarge Canada Inc. Dundas, ON Mr. Chris Thomas Tel: 905 977-7363 Lafarge Canada Inc. Cambridge, ON Mr. Michael Koch Tel: 519 319-9128 Lafarge Canada Inc. Fonthill, ON Mr. Michael Koch Tel: 905 522-7735 Lafarge Canada Inc. Hamilton, ON Mr. Michael Koch Tel: 905 979-3107 Lafarge Canada Inc. London, ON Mr. Michael Koch Tel: 519 319-9128 Lafarge Canada Inc. Paris, ON Mr. Michael Koch Tel: 905 522-7735 Lafarge Canada Inc. Meldrum Bay, ON Mr. Jeff Middleton Tel: 705 283-3011 Lafarge Canada Inc. Ottawa, ON Mr. Fred Douglas Tel: 613 830-3060 LS-602 Sieve Analysis Proficiency Sample LS-601 Wash Pass 75m Aggregate and Soil LS-620 Accelerated Mortar Bar LS-614 Freeze-Thaw Ministry of Transportation LS-616 Petrographic Analysis – Fine LS-603 Los Angeles Abrasion - 47 - MTO Aggregate and Soil Proficiency Sample Testing Program for 2013; MERO-048 Lafarge Canada Inc. Stouffville, ON Ms. Christine Crumbie Tel: 905 640-5883 Lafarge Canada Inc. Caledon, ON Mr. Chris Thomas Tel: 519 927-1113 Lafarge Canada Inc. – Pt. Anne Quarry Belleville, ON Mr. Jason Malcolm Tel: 613 813-4857 Lafarge Construction Materials Ltd. Brockville, ON Mr. Paul Arkeveld Tel: 613 349-7422 Lafarge Construction Materials Ltd. Glenburnie, ON Mr. Paul Arkeveld Tel: 613 349-7422 Landtek Limited Hamilton, ON Mr. Paul Anderson Tel: 905 383-3733 Lavis Contracting Co. Limited Clinton, ON Mr. Allan Gardner Tel: 519 482-3694 Law Engineering (London) Inc. London, ON Mr. Joe Law Tel: 519 680-9991 LVM Inc. Kitchener, ON Mr. Jason Taylor Tel: 519 741-1313 LVM Inc. Branford, ON Mr. David Baillie Tel: 519 720-0078 LVM Inc. London, ON Ms. Amy Helle Tel: 519 685-6400 LVM Inc. Stratford, ON Ms. Vicki Gravelle Tel: 519 273-0101 LVM Inc. Toronto, ON Mr. Dawit Amar Tel: 416 213-1060 LVM/Merlex North Bay, ON Mr. J. P. Duhaime Tel: 705 476-2550 McAsphalt Engineering Services Toronto, ON Mr. Michael Esenwa Tel: 416 281-8181 Mill-Am Corporation - Mobile 890901 Oldcastle, ON Mr. Cesare Di Cesare Tel: 519 945-7441 Miller Northwest Limited – Mobile 120601 Dryden, ON Ms. Melodie Asselin Tel: 807 223-2844 LS-621 Asphalt Coated Particles LS-620 Accelerated Mortar Bar (416) 235-4901, or (416) 235-3734 LS-619 Micro-Deval FA Mark Vasavithasan Stephen Senior LS-618 Micro-Deval CA For further information on this program, contact: LS-614 Freeze-Thaw Testing Program LS-606 Sulphate Soundness Proficiency Sample LS-604/5 Relative Density Aggregate and Soil LS-603 Los Angeles Abrasion LS-705 Specific Gravity of Soils LS-608 Percent Flat and Elongated LS-703/4 Atterberg Limits LS-607 Percent Crushed Particles LS-702 Particle Size Analysis LS-602 Sieve Analysis LS- 623 One Point Proctor Density LS-601 Wash Pass 75m Ministry of Transportation LS-616 Petrographic Analysis – Fine 2013 Participants List LS-609 Petrographic Number - Concrete - 48 - MTO Aggregate and Soil Proficiency Sample Testing Program for 2013; MERO-048 MTO Aggregate and Soil Proficiency Sample Testing Program for 2013; MERO-048 LS-705 Specific Gravity of Soils LS-703/4 Atterberg Limits LS-702 Particle Size Analysis LS- 623 One Point Proctor Density LS-620 Accelerated Mortar Bar LS-619 Micro-Deval FA LS-621 Asphalt Coated Particles Miller Northwest Limited - Mobile 942012 Dryden, ON Ms. Melodie Asselin Tel: 807 223-2844 Miller Paving Limited Markham, ON Ms. Carla Hariprashad Tel: 905 475-6660 Miller Paving Limited Port Colborne, ON Ms. Melissa Slipak Tel: 905 834-9227 Miller Paving Limited Whitby, ON Ms. Carla Hariprashad Tel: 905 655-3889 Miller Paving Limited - Carden Lab Brechin, ON Ms. Christina Watts Tel: 705 484-1101 Miller Paving Limited – Carden Mobile Brechin, ON Ms. Christina Watts Tel: 705 484-1101 Miller Paving Limited - Mobile 8661 North Bay, ON Mr. Herb Villneff Tel: 705 472-3312 Miller Paving Limited - Patterson Quarry Utterson, ON Ms. Christina Watts Tel: 705 385-0249 Miller Paving Ltd. – Mobile 60853 North Bay, ON Mr. Herb Villneff Tel: 705 472-3312 Miller Paving Ltd. – Mobile 8660 North Bay, ON Mr. Herb Villneff Tel: 705 472-3312 Miller Paving Ltd.- Materials Research Lab Gormley, ON Ms. Amma Wakefield Tel: 905 726-9518 Miller Paving Northern - Mobile 1084 North Bay, ON Mr. Herb Villneff Tel: 705 472-3312 Miller Paving Northern - Mobile 1254 North Bay, ON Mr. Herb Villneff Tel: 705 472-3312 Miller Paving Northern - Mobile 50612 North Bay, ON Mr. Herb Villneff Tel: 705 472-3312 Miller Paving Northern - Mobile 60889 North Bay, ON Mr. Herb Villneff Tel: 705 472-3312 Ministry of Transportation Downsview, ON Mr. Stephen Senior Tel: 416 235-3734 Ministry of Transportation – PN1 Downsview, ON Mr. Kliton Verli Tel: 416 235-3734 LS-618 Micro-Deval CA (416) 235-4901, or (416) 235-3734 LS-614 Freeze-Thaw LS-608 Percent Flat and Elongated Mark Vasavithasan Stephen Senior LS-606 Sulphate Soundness For further information on this program, contact: LS-602 Sieve Analysis Testing Program LS-601 Wash Pass 75m Proficiency Sample LS-604/5 Relative Density Aggregate and Soil LS-603 Los Angeles Abrasion LS-607 Percent Crushed Particles Ministry of Transportation LS-616 Petrographic Analysis – Fine 2013 Participants List LS-609 Petrographic Number - Concrete - 49 - LS- 623 One Point Proctor Density LS-702 Particle Size Analysis LS-703/4 Atterberg Limits LS-705 Specific Gravity of Soils LS-620 Accelerated Mortar Bar LS-619 Micro-Deval FA LS-618 Micro-Deval CA LS-614 Freeze-Thaw LS-607 Percent Crushed Particles LS-621 Asphalt Coated Particles Ministry of Transportation – PN2 Downsview, ON Mr. Stephen Senior Tel: 416 235-3734 MNA Engineering Limited Scarborough, ON Mr. Peter Balendran Tel: 416 757-8882 Nasiruddin Engineering Limited Mississauga, ON Mr. Shakeel Nasiruddin Tel: 905 565-9595 Nelson Aggregate Co. Beamsville, ON Mr. Shawn Warkholdt Tel: 905 563-8226 Nelson Aggregate Co. Burlington, ON Mr. Michael Rook Tel: 905 335-5250 Nelson Aggregate Co. Orillia, ON Mr. Chris Roote Tel: 705 325-2264 Peto MacCallum Limited Barrie, ON Mr. Andrew Jones Tel: 705 734-3900 Peto MacCallum Limited Hamilton, ON Mr. Amjad Khan Tel: 905 561-2231 Peto MacCallum Limited Kitchener, ON Mr. Tony Smith Tel: 519 893-7500 Peto MacCallum Limited Toronto, ON Mr. Geoffrey Uwimana Tel: 416 785-5110 Pinchin Environmental Sault Ste. Marie, ON Mr. Wesley Tabaczuk Tel: 705 575-9207 Pioneer Construction Inc. Sault Ste. Marie, ON Mrs. Shelley Geiling Tel: 705 541-2280 Pioneer Construction Inc. Copper Cliff, ON Mr. David Pilkey Tel: 705 693-1363 Pioneer Construction Inc. Thunder Bay, ON Mr. Tony Fazio Tel: 807 345-2338 Port Colborne Quarries Inc. Port Colborne, ON Mr. Tim Cassibo Tel: 905 834-3647 Preston Sand & Gravel Kitchener, ON Mr. Matthew Bell Tel: 519 242-0902 R. W. Tomlinson Limited Ottawa, ON Mr. Paul Charbonneau Tel: 613 822-0543 LS-606 Sulphate Soundness (416) 235-4901, or (416) 235-3734 LS-604/5 Relative Density Mark Vasavithasan Stephen Senior LS-602 Sieve Analysis For further information on this program, contact: LS-601 Wash Pass 75m Testing Program LS-603 Los Angeles Abrasion Aggregate and Soil Proficiency Sample LS-616 Petrographic Analysis – Fine Ministry of Transportation LS-608 Percent Flat and Elongated 2013 Participants List LS-609 Petrographic Number - Concrete - 50 - MTO Aggregate and Soil Proficiency Sample Testing Program for 2013; MERO-048 MTO Aggregate and Soil Proficiency Sample Testing Program for 2013; MERO-048 LS-705 Specific Gravity of Soils LS-703/4 Atterberg Limits LS-702 Particle Size Analysis LS- 623 One Point Proctor Density LS-620 Accelerated Mortar Bar LS-619 Micro-Deval FA LS-621 Asphalt Coated Particles R.S Wilson Materials Testing & Inspection Sault Ste. Marie, ON Mr. Robert Wilson Tel: 705 759-2881 Regional Municipality of Durham Whitby, ON Mr. Joeman Ng Tel: 905 655-3344 Sarafinchin Associates Limited Rexdale, ON Mr. Scott Jeffrey Tel: 416 674-1770 Shaba Testing Services Limited Kirkland Lake, ON Mr. Lad Shaba Tel: 705 567-4187 Shaheen Peaker Thompson Limited Oshawa ON Mr. Dave Thompson Tel: 905 436-9028 Smelter Bay Aggregates Inc. Thessalon, ON Mr. Jordan Bird Tel: 705 842-2597 Soil Engineers Limited Scarborough, ON Mr. S. Sanjeevan Tel: 416 754-8515 SPL Consultants Limited Markham, ON Mr. Jordan Gadjanov Tel: 905 475-0065 SPL Consultants Limited Nepean, ON Mr. Chris Hendry Tel: 613 228-0065 SPL Consultants Limited Vaughan, ON Mr. Andrew Mendonca Tel: 905 856-0065 St Lawrence Testing & Inspection Co. Ltd. Cornwall, ON Mr. Gib McIntee Tel: 613 938-2521 St. Marys Leaside Lab Toronto, ON Mr. Stephen Parkes Tel: 416 423-2439 Stantec Consulting Limited Ottawa, ON Mr. Jeff Weng Tel: 613 738-0708 Stantec Consulting Limited Kitchener, ON Mr. Kenton Power Tel: 519 579-4410 Stantec Consulting Limited Markham, ON Ms. Brani Vujanovic Tel: 905 479-9345 Steed and Evans Limited Heidelberg, ON Mr. Richard Marco Tel: 519 699-4646 Taranis Contracting Group Thunder Bay, ON Mr. Dawn Molcan Tel: 807 475-5433 LS-618 Micro-Deval CA (416) 235-4901, or (416) 235-3734 LS-614 Freeze-Thaw LS-608 Percent Flat and Elongated Mark Vasavithasan Stephen Senior LS-606 Sulphate Soundness For further information on this program, contact: LS-602 Sieve Analysis Testing Program LS-601 Wash Pass 75m Proficiency Sample LS-604/5 Relative Density Aggregate and Soil LS-603 Los Angeles Abrasion LS-607 Percent Crushed Particles Ministry of Transportation LS-616 Petrographic Analysis – Fine 2013 Participants List LS-609 Petrographic Number - Concrete - 51 - LS-607 Percent Crushed Particles LS-608 Percent Flat and Elongated LS-609 Petrographic Number - Concrete LS-616 Petrographic Analysis – Fine LS-614 Freeze-Thaw LS-618 Micro-Deval CA LS-619 Micro-Deval FA - 52 - 2013 Participants List LS-702 Particle Size Analysis LS-703/4 Atterberg Limits LS-705 Specific Gravity of Soils (416) 235-4901, or (416) 235-3734 TBT Engineering Limited Thunder Bay, ON Mr. Tim Fummerton Tel: 807 624-5162 Teranorth Construction & Engineering Ltd. Sudbury, ON Mr. James Bot Tel: 705 523-1540 Terraprobe Inc. Brampton, ON Mr. Chris Elvidge Tel: 905 796-2650 Terraprobe Inc. Barrie, ON Mr. Brian Jackson Tel: 705 739-8355 Terraprobe Inc. Stoney Creek, ON Mr. Gerry Muckle Tel: 905 643-7560 Terraprobe Inc. Sudbury, ON Mr. Dennis Paquette Tel: 705 670-0460 Terraspec Engineering Inc. Peterborough, ON Mr. Shane Galloway Tel: 705 743-7880 The Karson Group Carp, ON Mr. Cam MacDonald Tel: 613 831-0717 The Murray Group Moorefield, ON Mr. Brad Mitchell Tel: 519 323-4411 Thomas Cavanagh Construction Ltd. Ashton, ON Mr. Phil White Tel: 613 257-2918 Thurber Engineering Limited Ottawa, ON Mr. Fred Griffiths Tel: 613 247-2121 Thurber Engineering Limited Oakville, ON Mr. Weiss Mehdawi Tel: 905 829-8666 Tri City Materials Petersburg, ON Mr. Ron Shantz Tel: 519 577-1000 True Grit Consulting Ltd. Thunder Bay, ON Mr. Adam Rose Tel: 807 626-5640 Tulloch Engineering Inc. Sault Ste. Marie, ON Mr. Daren Stadnisky Tel: 705 945-5090 Vicdom Sand and Gravel Limited Uxbridge, ON Mr. Bruno Giordano Tel: 905 649-2193 Walker Aggregates Inc. Thorold, ON Mr. Tom Risi Tel: 905 227-4142 LS-620 Accelerated Mortar Bar Mark Vasavithasan Stephen Senior LS-606 Sulphate Soundness For further information on this program, contact: LS-602 Sieve Analysis Testing Program LS-601 Wash Pass 75m Proficiency Sample LS-604/5 Relative Density Aggregate and Soil LS-603 Los Angeles Abrasion LS-621 Asphalt Coated Particles LS- 623 One Point Proctor Density Ministry of Transportation MTO Aggregate and Soil Proficiency Sample Testing Program for 2013; MERO-048 Testing Program For further information on this program, contact: Mark Vasavithasan Stephen Senior (416) 235-4901, or (416) 235-3734 Walker Aggregates Inc. Duntroon, ON Mr. Tom Risi Tel: 905 445-2300 Aggregate and Soil 2013 Participants List MTO Aggregate and Soil Proficiency Sample Testing Program for 2013; MERO-048 LS-705 Specific Gravity of Soils LS-703/4 Atterberg Limits LS-702 Particle Size Analysis LS- 623 One Point Proctor Density LS-621 Asphalt Coated Particles LS-620 Accelerated Mortar Bar LS-619 Micro-Deval FA LS-618 Micro-Deval CA LS-614 Freeze-Thaw LS-616 Petrographic Analysis – Fine LS-609 Petrographic Number - Concrete LS-608 Percent Flat and Elongated Ministry of Transportation LS-607 Percent Crushed Particles LS-606 Sulphate Soundness LS-604/5 Relative Density LS-603 Los Angeles Abrasion LS-602 Sieve Analysis Proficiency Sample LS-601 Wash Pass 75m - 53 - - 54 - For further information on this program, contact: Mark Vasavithasan (416) 235-4901 or Stephen Senior (416) 235-3734 AGS Associates Inc. Scarborough, ON Mr. Amjed Siddiqui Tel: 416 299-3655 AME -Materials Engineering Caledon, ON Mr. Scott Crowley Tel: 905 840-5914 AME -Materials Engineering Ottawa, ON Mr. Harrison Smith Tel: 613 726-3039 AMEC Earth & Environmental Limited Cambridge, ON Mr. Louis Maier Tel: 519 650-7115 AMEC Earth & Environmental Limited Hamilton, ON Mr. John Balinski Tel: 905 312-0700 AMEC Earth & Environmental Limited Scarborough, ON Mr. Mohammadsarif. Sufi Tel: 416 751-6565 AMEC Earth & Environmental Limited Tecumseh, ON Mr. Justin Palmer Tel: 519 735-2499 C. Villeneuve Construction – Mobile 1 Hearst, ON Mr. Charles Harris Tel: 705 372-1838 Cambium Inc. Peterborough, ON Mr. Wayne Rayfuse Tel: 705 742-7900 CCI Group Inc. Woodbridge, ON Mr. M. Sukhandan Tel: 905 856-5200 COCO Paving Inc. Belleville, ON Mr. Tom Woodcock Tel: 613 962-3461 COCO Paving Inc. Windsor, ON Mr. Ishaq Syed Tel: 519 948-7133 COCO Paving Inc. Ottawa, ON Mr. Brad Gooderham Tel: 613 907-7283 COCO Paving Inc. Toronto, ON Mr. Andrew Pahalan Tel: 416 347-3590 Construction Testing Asphalt Lab Cambridge, ON Mr. Peter Lung Tel: 519 622-7023 Cornwall Gravel Company Ltd. Cornwall, ON Ms. Billie-Gail Macfarlane Tel: 613 930-3530 Cox Construction Limited Guelph, ON Mr. Andrew Smith Tel: 519 824-6570 Cruickshank Construction Elginburg, ON Mr. Tim Bilton Tel: 613 536-9112 Davroc Testing Laboratories Inc. Brampton, ON Mr. Sal Fasullo Tel: 905 792-7792 DBA Engineering Limited Kingston, ON Mr. Mark McClelland Tel: 613 389-1781 ASTM D 4791 – Percent Flat Particles, Elongated Particles or Flat & Elongated Particles in Coarse Aggregate Ministry of Transportation Superpave Aggregate Consensus Property Testing Program ASTM D 4219/AASHTO T 176 – Sand Equivalent Value of Fine Aggregate ASTM D 5821 – Percent of Fractured Particles in Coarse Aggregate 2013 Participants List ASTM D 1252/AASHTO T 304 Uncompacted Void Content of Fine Aggregate Appendix B2: List of Participants MTO Aggregate and Soil Proficiency Sample Testing Program for 2013; MERO-048 For further information on this program, contact: Mark Vasavithasan (416) 235-4901 or Stephen Senior (416) 235-3734 DBA Engineering Limited Vaughan, ON Mr. Andy Burleigh Tel: 905 851-0090 DST Consulting Engineers Inc. Thunder Bay, ON Dr. Myint Win Bo Tel: 807 623-2929 Dufferin Construction Ltd. (QC) - Bronte Oakville, ON Mr. Ronald Abdul Tel: 905 827-5750 Engtec Consulting Inc. Vaughan, ON Mr. Salman Bhutta Tel: 905 856-2988 exp Services Inc. Brampton, ON Mr. Ammanuel Yousif Tel: 905 793-9800 exp Services Inc. Sudbury, ON Mr. Rob Ferguson Tel: 705 674-9681 Fermar Construction Limited Rexdale, ON Mr. Walter Di Francescantonio Tel: 416 629-2701 Fowler Construction Company Bracebridge, ON Mr. Ross Elliott Tel: 705 644-4037 Geo-Logic Inc. Peterborough, ON Mr. Matt Rawlings Tel: 705 749-3317 Golder Associates Limited Burnabay, BC Ms. Lily Hu Tel: 604 412-6899 Golder Associates Limited Cambridge, ON Ms. Jodi Noris Tel: 519 620-1222 Golder Associates Limited London, ON Mr. Chris Sewell Tel: 519 652-0099 Golder Associates Limited Sudbury, ON Ms. Sylvie LaPorte Tel: 705 524-6861 Golder Associates Limited Whitby, ON Mr. Jeremy Rose Tel: 905 723-2727 Graham Bros. Construction Limited Brampton, ON Mr. Greg Thompson Tel: 905 453-1200 Greenwood Aggregates Amaranth, ON Andrew Raymond Tel: 519 940-6844 Harold Sutherland Construction Limited Kemble, ON Mr. Roland Leigh Tel: 519 376-3506 Houle Chevrier Engineering Limited Carp, ON Mrs. Krystle Smith Tel: 613 836-1422 Interpaving Asphalt & Aggregate Supply Limited Sudbury, ON Ms. Ashley Edwards Tel: 705 694-6210 John D. Paterson & Associates North Bay, ON Mr. Stephen Walker Tel: 705 472-5331 K.J. Beamish Construction King City, ON Mr. Chad Henderson Tel: 905 833-4666 Lafarge Canada Inc. Hamilton, ON Mr. Mike Koch Tel: 905 979-3107 Lafarge Canada Inc. Dundas, ON Mr. Chris Thomas Tel: 905 977-7363 ASTM D 4791 – Percent Flat Particles, Elongated Particles or Flat & Elongated Particles in Coarse Aggregate Ministry of Transportation Superpave Aggregate Consensus Property Testing Program ASTM D 4219/AASHTO T 176 – Sand Equivalent Value of Fine Aggregate ASTM D 5821 – Percent of Fractured Particles in Coarse Aggregate 2013 Participants List ASTM D 1252/AASHTO T 304 Uncompacted Void Content of Fine Aggregate - 55 - MTO Aggregate and Soil Proficiency Sample Testing Program for 2013; MERO-048 For further information on this program, contact: Mark Vasavithasan (416) 235-4901 or Stephen Senior (416) 235-3734 Landtek Limited Hamilton, ON Mr. Paul Anderson Tel: 905 383-3733 Lavis Contracting Co. Limited Clinton, ON Mr. Allan Gardner Tel: 519 482-3694 LVM Inc. Toronto, ON Mr. Dawit Amar Tel: 416 213-1060 McAsphalt Engineering Services Toronto, ON Mr. Michael Esenwa Tel: 416 282-8181 Mill-Am Corporation - Mobile 890901 Oldcastle, ON Mr. Cesare Di Cesare Tel: 519 945-7441 Miller Northwest Limited – Mobile 120601 Dryden, ON Ms. Melodie Asselin Tel: 807 223-2844 Miller Northwest Limited – Mobile 942012 Dryden, ON Ms. Melodie Asselin Tel: 807 223-2844 Miller Paving Limited Markham, ON Ms. Carla Hariprashad Tel: 905 475-6660 Miller Paving Limited Port Colborne, ON Ms. Melissa Slipak Tel: 905 834-9227 Miller Paving Ltd. - Materials Research Lab Gormley, ON Ms. Amma Wakefield Tel: 905 726-9518 Miller Paving Ltd. - Mobile 1084 North Bay, ON Mr. Herb Villneff Tel: 705 472-3312 Miller Paving Northern - Mobile 1254 North Bay, ON Mr. Herb Villneff Tel: 705 472-3312 Miller Paving Northern - Mobile 60853 North Bay, ON Mr. Herb Villneff Tel: 705 472-3312 Miller Paving Northern - Mobile 60889 North Bay, ON Mr. Herb Villneff Tel: 705 472-3312 Ministry of Transportation Downsview, ON Mr. Stephen Senior Tel: 416 235-3734 MNA Engineering Limited Scarborough, ON Mr. Peter Balendran Tel: 416 757-8882 Peto MacCallum Limited Hamilton, ON Mr. Amjad Khan Tel: 905 561-2231 Peto MacCallum Limited Kitchener, ON Mr. Gerry Mitchell Tel: 519 893-7500 Peto MacCallum Limited Toronto, ON Mr. Geoffrey Uwimana Tel: 416 785-5110 Pioneer Construction Inc. Sault Ste. Marie, ON Mrs. Shelley Geiling Tel: 705 541-2280 Pioneer Construction Inc. Thunder Bay, ON Mr. Tony Fazio Tel: 807 345-2338 Pioneer Construction Inc. Copper Cliff, ON Mr. David Pilkey Tel: 705 693-1363 R. W. Tomlinson Limited Ottawa , ON Mr. Paul Charbonneau Tel: 613 822-0543 ASTM D 4791 – Percent Flat Particles, Elongated Particles or Flat & Elongated Particles in Coarse Aggregate Ministry of Transportation Superpave Aggregate Consensus Property Testing Program ASTM D 4219/AASHTO T 176 – Sand Equivalent Value of Fine Aggregate ASTM D 5821 – Percent of Fractured Particles in Coarse Aggregate 2013 Participants List ASTM D 1252/AASHTO T 304 Uncompacted Void Content of Fine Aggregate - 56 - MTO Aggregate and Soil Proficiency Sample Testing Program for 2013; MERO-048 For further information on this program, contact: Mark Vasavithasan (416) 235-4901 or Stephen Senior (416) 235-3734 SPL Consultants Limited Markham, ON Mr. Jordan Gadjanov St Lawrence Testing & Inspection Co. Ltd. Cornwall, ON Mr. Gib McIntee Stantec Consulting Limited Ottawa, ON Mr. Jeff Weng Steed and Evans Ltd. Heidelberg, ON Mr. Richard Marco TBT Engineering Limited Thunder Bay, ON Mr. Tim Fummerton Terraprobe Inc. Brampton, ON Mr. Chris Elvidge The Karson Group Carp, ON Mr. Cameron MacDonald Thomas Cavanagh Construction Ltd. Ashton, ON Mr. Phil White Tel: 905 475-0065 Tel: 613 938-2521 Tel: 613 738-0708 Tel: 519 699-4646 Tel: 807 624-5162 Tel: 905 796-2650 Tel: 613 831-0717 Tel: 613 257-2918 ASTM D 4791 – Percent Flat Particles, Elongated Particles or Flat & Elongated Particles in Coarse Aggregate Ministry of Transportation Superpave Aggregate Consensus Property Testing Program ASTM D 4219/AASHTO T 176 – Sand Equivalent Value of Fine Aggregate ASTM D 5821 – Percent of Fractured Particles in Coarse Aggregate 2013 Participants List ASTM D 1252/AASHTO T 304 Uncompacted Void Content of Fine Aggregate - 57 - MTO Aggregate and Soil Proficiency Sample Testing Program for 2013; MERO-048 - 58 - Appendix C: Multi-Laboratory Precision Test 1 WP 75 m Mean 1S D2S n/Outliers 1.10 0.56 0.19 0.55 221/6 2010 Test 2 P 19.0 mm Mean 1S D2S n/Outliers 1.10 95.8 0.9 2.4 227/0 Test 3 P 16.0 mm Mean 1S D2S n/Outliers 1.10 89.3 1.4 4.0 224/3 Test 4 P 13.2 mm Mean 1S D2S n/Outliers 1.10 82.8 1.7 4.9 226/1 Test 5 P 9.5 mm Mean 1S D2S n/Outliers 1.10 71.5 1.8 5.2 226/1 2011 2.10 0.55 0.19 0.55 1.11 0.97 0.25 0.71 210/11 2.10 96.0 0.7 1.9 1.11 96.5 0.7 1.9 215/7 2.10 89.8 1.0 2.9 1.11 86.4 1.1 3.0 208/14 2.10 83.6 1.3 3.6 1.11 76.2 1.4 3.8 214/8 2.10 72.4 1.5 4.3 1.11 62.0 1.7 4.8 215/7 2010 1.10 22.4 1.43 4.05 13/0 1.12 95.0 1.0 2.8 215/2 2.11 85.3 1.6 4.6 1.12 90.2 1.6 4.6 211/5 2.11 74.4 2.1 5.9 1.12 85.4 1.9 5.5 209/8 2.11 59.6 2.3 6.4 1.12 75.8 2.3 6.4 210/7 1.11 46.5 1.8 5.1 211/11 2.10 22.1 1.21 3.42 1.11 24.2 1.02 2.89 12/1 2010 2.12 93.7 1.1 3.1 1.13 95.8 0.8 2.4 213/10 2.12 87.6 1.6 4.6 1.13 90.0 1.1 3.1 207/15 2.12 82.0 1.8 5.2 1.13 83.7 1.5 4.3 209/14 2.12 71.5 2.2 6.4 1.13 72.1 1.6 4.5 201/22 2.11 23.8 1.40 3.96 1.12 22.6 1.32 3.73 11/0 2011 2.13 89.9 1.2 3.5 2013 2.13 83.6 1.5 4.3 2013 2012 1.12 58.1 2.3 6.6 207/10 2.13 95.8 0.8 2.4 2013 2012 2.11 44.0 2.0 5.7 2.13 1.22 0.25 0.72 2013 2012 2011 2.10 54.2 1.5 4.1 1.13 1.22 0.28 0.79 201/21 2012 2011 2010 2013 2.12 2.26 0.32 0.90 2012 2011 2010 Test 8 L. A Mean 1S D2S n/Outliers 2.11 96.2 0.8 2.1 2011 2010 1.10 53.4 1.7 4.7 224/3 1.12 2.39 0.31 0.86 199/18 2011 2010 Test 6 P 4.75 mm Mean 1S D2S n/Outliers 2012 2.11 1.11 0.29 0.83 2.13 71.8 1.7 4.8 2013 2.12 53.8 2.2 6.2 1.13 54.8 1.5 4.3 204/19 2.12 21.9 1.34 3.81 1.13 22.2 1.2 3.3 9/1 2012 2.13 54.2 1.7 4.9 2013 MTO LS-601 < 2.0 0.19 0.53 ASTM C136 A 100 - 95 0.35 1.0 ASTM C136 A 95 - 85 1.37 3.9 ASTM C136 A 85 - 80 1.92 5.4 ASTM C136 A 80 – 60 2.82 8.0 ASTM C136 A 60 – 20 1.97 5.6 ASTM C131 2.13 22.1 0.9 2.5 C of V 10-45 4.5% 12.7% A – AMRL reports percent passing inch series equivalent sieves. * - Calculated from Coefficient of Variation Precision Statement (Coefficient of Variation = Standard Deviation / Mean) MTO Aggregate and Soil Proficiency Sample Testing Program for 2013; MERO-048 * 22.1 1.0 2.8 - 59 - Test 9 RD (O.D.) Mean 1S D2S n/Outliers 2010 1.10 2.631 0.007 0.020 105/6 2011 2.10 2.631 0.006 0.017 Test 10 ABS Mean 1S D2S n/Outliers 1.10 1.259 0.107 0.303 109/2 Test 11 MgSO4 Mean 1S D2S n/Outliers 1.10 5.9 1.9 5.4 40/1 Test 12 % Crush Mean 1S D2S n/Outliers 1.10 72.3 5.1 14.4 206/21 1.11 2.670 0.007 0.020 96/11 2010 2.10 1.246 0.104 0.294 1.11 0.709 0.087 0.246 101/6 2.10 5.5 1.6 4.6 1.11 15.1 2.9 8.3 40/4 2.10 72.2 5.4 15.4 1.11 63.1 4.2 12.0 202/20 Test 14 PN Conc. Mean 1S D2S n/Outliers 1.10 28 Test 16 MDA, CA Mean 1S D2S n/Outliers 1.10 17.2 0.84 2.37 69/5 Test 17 Freeze-thaw Mean 1S D2S n/Outliers 1.10 10.37 2.07 5.85 53/4 2.11 0.703 0.088 0.249 1.12 2.094 0.121 0.342 102/3 2.11 14.9 2.2 6.2 1.12 26.1 5.4 15.2 42/1 2.11 63.7 4.1 11.5 1.12 76.9 5.6 15.8 201/15 1.11 2.4 1.2 3.3 201/18 2.10 - 1.11 28 2.10 17.1 0.88 2.49 1.11 22.8 0.95 2.70 70/7 2.10 10.45 2.28 6.46 1.11 10.40 2.15 6.09 55/2 2010 1.12 3.7 1.8 5.1 203/11 2.11 - 1.12 131.4 15.4 43.3 28/8 2.11 22.7 1.03 2.91 1.12 19.2 1.14 3.23 72/5 2.11 10.31 2.20 6.21 1.12 10.11 2.82 8.00 58/1 2011 2010 1.13 1.133 0.076 0.215 101/3 2.12 25.3 5.3 15.0 1.13 3.7 1.8 5.0 44/0 2.12 77.5 5.9 16.7 1.13 69.1 3.8 10.8 208/14 2.13 3.5 1.9 5.3 2013 2.13 69.3 3.7 10.6 2013 2.12 3.6 1.9 5.3 1.13 6.9 2.5 7.2 215/6 2.12 127.7 10.0 24.7 1.13 35 2.12 19.1 0.92 2.59 1.13 11.5 0.45 1.27 76/4 2.12 9.77 3.00 8.51 1.13 3.30 1.10 3.10 60/2 2.13 6.7 2.4 6.7 2013 2012 2011 2.13 1.126 0.072 0.204 2013 2012 2011 2010 2.12 2.063 0.134 0.379 2012 2.11 2.5 1.3 3.5 2.13 2.624 0.006 0.017 2013 2012 2011 2.10 6.7 2.4 6.7 1.13 2.625 0.006 0.017 98/6 2012 2011 2010 2013 2.12 2.657 0.008 0.023 2012 2011 2010 1.10 7.1 2.6 7.3 217/4 1.12 2.655 0.008 0.023 102/3 2011 2010 Test 13 %F&E Mean 1S D2S n/Outliers 2012 2.11 2.669 0.007 0.020 0.006 0.017 MTO LS-604 < 2% 0.09 0.25 ASTM C88 C of V * 9-20% 3.6 25% 0.9 71% 2.5 MTO LS-607 55% - 85% 4.7 13.2 MTO LS-608 2.0% - 9.5% 2.3 6.4 MTO LS-609 2.13 - No Precision Statements for this Test. 2.13 11.5 0.54 1.52 MTO LS-618 C of V 5-23% 11.5 5.5% 0.63 15.4% 1.79 2.13 3.16 1.13 3.19 MTO LS-614 C of V 4-18% 3.23 20.2% 0.65 57.1% 1.85 2013 2012 MTO LS-604 2013 A – AMRL reports percent passing inch series equivalent sieves. * - Calculated from Coefficient of Variation Precision Statement (Coefficient of Variation = Standard Deviation / Mean) MTO Aggregate and Soil Proficiency Sample Testing Program for 2013; MERO-048 - 60 - Test 20 P 2.36 mm Mean 1S D2S n/Outliers 2010 3.10 38.5 2.1 6.1 216/11 Test 21 P 1.18 mm Mean 1S D2S n/Outliers 3.10 26.4 2.1 6.0 216/11 Test 22 P 600 m Mean 1S D2S n/Outliers 3.10 18.0 1.7 4.7 215/12 Test 23 P 300 m Mean 1S D2S n/Outliers 3.10 12.9 1.1 3.2 215/12 2011 4.10 39.0 2.3 6.5 3.11 37.4 1.9 5.4 219/3 2010 4.10 26.8 2.3 6.4 3.11 30.1 1.9 5.3 219/3 4.10 18.3 1.7 4.8 3.11 22.0 1.5 4.3 216/6 4.10 13.1 1.2 3.4 3.11 12.6 0.8 2.3 214/8 Test 25 P 75 m Mean 1S D2S n/Outliers 3.10 8.5 0.7 1.9 213/14 Test 27 RD (O.D.) Mean 1S D2S n/Outliers 3.10 2.615 0.015 0.042 95/10 Test 28 ABS Mean 1S D2S n/Outliers 3.10 1.499 0.19 0.53 98/7 4.11 28.7 1.8 5.1 3.12 30.2 2.2 6.2 205/12 4.11 21.0 1.4 3.9 3.12 22.0 1.6 4.5 201/16 4.11 12.2 0.8 2.3 3.12 16.5 1.2 3.5 199/18 3.11 8.1 0.5 1.4 206/16 4.10 8.7 0.6 1.8 3.11 6.0 0.4 1.0 206/16 4.10 2.614 0.016 0.045 3.11 2.654 0.010 0.028 99/5 4.10 1.516 0.20 0.57 3.11 0.700 0.12 0.34 94/10 2010 3.12 12.3 0.8 2.3 198/19 4.11 5.8 0.4 1.0 3.12 9.1 0.6 1.7 200/17 4.11 2.654 0.011 0.031 3.12 2.647 0.011 0.031 95/10 4.11 0.684 0.12 0.34 3.12 1.171 0.15 0.44 96/9 2011 2010 3.13 37.6 1.9 5.5 209/14 4.12 21.0 1.7 4.9 3.13 27.4 1.5 4.3 203/20 4.12 16.0 1.2 3.4 3.13 14.1 0.84 2.4 203/20 4.13 27.4 1.5 4.3 2013 4.13 14.1 0.85 2.4 2013 4.12 12.0 0.8 2.3 3.13 10.3 0.6 1.8 210/13 4.12 8.8 0.6 1.7 3.13 8.7 0.5 1.5 214/9 4.12 2.649 0.009 0.025 3.13 2.650 0.013 0.037 99/4 4.12 1.148 0.16 0.46 3.13 1.351 0.16 0.44 93/10 4.13 10.3 0.6 1.8 2013 2012 2011 4.13 37.3 1.7 4.9 2012 2012 2011 2010 4.12 28.5 2.1 5.9 2012 4.11 7.8 0.5 1.4 4.13 44.5 1.8 5.0 2013 2012 2011 4.10 10.5 0.9 2.5 3.13 44.9 1.9 5.5 207/16 2012 2011 2010 2013 4.12 40.3 2.3 6.4 2012 2011 2010 3.10 10.3 0.8 2.4 214/13 3.12 43.2 2.5 7.0 203/14 2011 2010 Test 24 P 150 m Mean 1S D2S n/Outliers 2012 4.11 35.6 1.9 5.4 4.13 8.7 0.5 1.5 2013 2012 4.13 2.650 0.013 0.037 2013 4.13 1.329 0.12 0.34 ASTM C136 60 - 20 1.41 4.0 ASTM C136 A 60 - 20 1.41 4.0 ASTM C136 A 60 - 20 1.41 4.0 ASTM C136 A 15 - 10 0.73 2.1 ASTM C136 A 15 - 10 0.73 2.1 ASTM C136 A 10 - 2 0.65 1.8 MTO LS-605 0.012 0.034 MTO LS-605 < 2.0% 0.16 0.45 A – AMRL reports percent passing inch series equivalent sieves. * - Calculated from Coefficient of Variation Precision Statement (Coefficient of Variation = Standard Deviation / Mean) MTO Aggregate and Soil Proficiency Sample Testing Program for 2013; MERO-048 A - 61 - Test 30 % ACP Mean 1S D2S n/Outliers 1.10 31.2 7.0 19.7 223/4 2010 Test 31 MWD Mean 1S D2S n/Outliers 3.10 2.323 0.027 0.076 149/12 1.11 36.4 3.5 9.8 214/7 4.10 2.322 0.029 0.082 3.11 2.315 0.033 0.093 150/10 2010 Test 32 MDD Mean 1S D2S n/Outliers 3.10 2.152 0.030 0.085 152/9 Test 33 OMC Mean 1S D2S n/Outliers 3.10 7.95 0.32 0.89 144/17 Test 34 MDA, FA3 Mean 1S D2S n/Outliers 3.10 15.5 1.1 3.1 69/5 Test 40 P 2.0 mm Mean 1S D2S n/Outliers 2011 2.10 31.2 7.2 20.4 4.10 2.154 0.029 0.082 3.11 2.147 0.032 0.090 146/14 4.10 7.96 0.29 0.81 3.11 7.99 0.30 0.85 141/19 4.10 15.5 1.1 3.2 3.11 10.7 0.8 2.1 74/3 6.10 100 5.11 99.0 0.6 1.7 71/5 Test 42 P 75 µm Mean 1S D2S n/Outliers 5.10 88.6 0.5 1.3 63/11 4.11 2.154 0.033 0.093 1.12 2.257 0.035 0.099 140/7 4.11 7.94 0.28 0.79 1.12 7.13 0.33 0.93 144/3 4.11 10.7 0.9 2.6 3.12 17.6 1.1 3.0 71/6 6.11 98.9 0.7 1.8 5.12 100 2010 5.11 96.2 0.7 2.1 67/9 6.10 88.7 0.3 1.0 5.11 90.7 1.1 3.1 69/7 2010 1.13 2.422 0.024 0.070 141/14 2.12 2.264 0.034 0.096 1.13 2.265 0.025 0.071 144/11 2.12 7.07 0.33 0.92 1.13 7.05 0.26 0.74 146/9 4.12 17.7 1.1 3.0 3.13 15.6 1.2 3.4 79/1 6.12 100 5.13 99.6 0.3 0.9 90/0 6.12 99.8 0.2 0.5 5.13 96.7 0.7 1.9 86/4 6.11 90.4 1.2 3.5 5.12 99.1 0.3 1.0 71/5 6.12 99.1 0.3 1.0 5.13 91.3 1.0 2.9 88/2 4.13 15.7 1.2 3.4 2013 2012 2011 2.13 7.02 0.26 0.74 2012 76/0 5.12 99.8 0.2 0.5 71/5 2.13 2.267 0.027 0.076 2013 2012 6.11 95.9 0.9 2.7 2.13 2.425 0.024 0.070 2013 2012 2011 6.10 96.5 0.4 1.0 2.13 54.8 3.0 8.4 2013 2.12 2.421 0.032 0.090 2012 2011 74/0 2013 1.13 54.4 2.9 8.1 202/20 2012 2011 2010 5.10 96.4 0.4 1.1 67/7 1.12 2.416 0.032 0.090 133/14 2011 2010 2.12 47.6 5.2 14.8 2012 4.11 2.318 0.038 0.107 2011 2010 Test 41 P 425 µm Mean 1S D2S n/Outliers 2012 1.12 47.1 5.4 15.2 205/11 2011 2010 5.10 100 2.11 37.0 3.3 9.2 6.13 99.8 0.2 0.5 2013 2012 6.13 97.0 0.5 1.5 2013 6.13 91.7 0.9 2.6 MTO LS-621 25% - 45% 3.8 10.8 MTO LS-623 0.030 0.085 MTO LS-623 0.033 0.093 MTO LS-623 0.38 1.07 MTO LS-619 C of V 7-18% 15.7 7.7% 1.2 21.8% 3.4 MTO LS-702 No MTO precision statements for this test MTO LS-702 No MTO precision statements for this test MTO LS-702 No MTO precision statements for this test A – AMRL reports percent passing inch series equivalent sieves. * - Calculated from Coefficient of Variation Precision Statement (Coefficient of Variation = Standard Deviation / Mean) MTO Aggregate and Soil Proficiency Sample Testing Program for 2013; MERO-048 - 62 - Test 43 P 20 µm Mean 1S D2S n/Outliers 2010 5.10 70.6 4.4 12.5 73/1 Test 44 P 5 µm Mean 1S D2S n/Outliers 5.10 44.8 3.0 8.5 69/5 Test 45 P 2 µm Mean 1S D2S n/Outliers 5.10 30.9 2.7 7.8 68/6 Test 46 L. L Mean 1S D2S n/Outliers 5.10 27.0 1.3 3.7 84/6 Test 47 P. L Mean 1S D2S n/Outliers 5.10 15.3 1.0 2.8 86/4 Test 48 P. I Mean 1S D2S n/Outliers 5.10 11.8 1.4 4.0 86/4 Test 49 SG of Soils Mean 1S D2S n/Outliers 5.10 2.729 0.026 0.074 58/7 2011 6.10 70.7 4.2 12.0 5.11 78.0 4.2 12.0 74/2 2010 2012 6.11 77.6 4.0 11.4 5.12 80.6 4.2 12.0 74/2 2011 6.10 44.6 3.3 9.4 5.11 58.2 4.3 12.1 73/3 6.10 30.5 3.4 9.6 5.11 43.6 3.0 8.5 72/4 6.10 27.2 1.4 4.0 5.11 36.6 1.3 3.7 88/6 6.10 15.2 1.1 3.0 5.11 18.6 1.4 3.9 92/2 6.10 11.9 1.5 4.4 5.11 17.9 1.6 4.6 89/5 6.10 2.729 0.029 0.082 5.11 2.734 0.032 0.090 63/5 2010 6.11 58.3 3.9 11.0 5.12 43.7 2.7 7.7 71/5 6.11 43.7 3.2 9.1 5.12 28.6 2.3 6.6 72/4 6.11 36.7 1.6 4.4 5.12 32.2 1.2 3.3 89/6 6.11 18.7 1.3 3.7 5.12 18.9 1.1 3.1 86/9 2010 6.11 17.9 1.6 4.6 5.12 13.3 1.7 4.8 93/2 6.11 2.734 0.034 0.096 5.12 2.721 0.023 0.065 60/10 5.13 59.4 3.4 9.6 84/6 6.12 28.8 2.3 6.6 5.13 43.9 2.4 6.8 81/9 6.12 32.2 1.2 3.3 5.13 37.1 1.3 3.8 103/5 6.12 18.9 1.1 3.1 5.13 18.8 1.3 3.6 104/4 6.12 13.4 1.7 4.8 5.13 18.4 1.6 4.5 101/7 6.12 2.718 0.023 0.065 5.13 2.733 0.024 0.068 74/9 6.13 43.9 2.8 8.0 2013 6.13 37.1 1.4 3.9 2013 2012 2011 6.13 58.9 3.1 8.7 2013 2012 2011 2010 6.12 43.9 2.6 7.2 2012 2011 6.13 79.3 3.1 8.7 2013 2012 2011 2010 5.13 79.3 3.4 9.5 85/5 2012 2011 2010 2013 6.12 80.6 4.2 12.0 6.13 18.7 1.1 3.2 2013 2012 6.13 18.3 1.4 4.1 2013 6.13 2.734 0.025 0.071 MTO LS-702 No MTO precision statements for this test MTO LS-702 No MTO precision statements for this test MTO LS-702 No MTO precision statements for this test ASTM D4318 33.3 0.8 2 ASTM D4318 19.9 1.3 4 ASTM D4318 13.4 1.6 4 AASHTO T 100 0.04 0.11 A – AMRL reports percent passing inch series equivalent sieves. * - Calculated from Coefficient of Variation Precision Statement (Coefficient of Variation = Standard Deviation / Mean) MTO Aggregate and Soil Proficiency Sample Testing Program for 2013; MERO-048 - 63 - Test 95 UC Void Mean 1S D2S n/Outliers 2010 3.10 43.02 0.77 2.18 58/8 Test 96 SE Value Mean 1S D2S n/Outliers 3.10 35.8 7.60 21.43 60/2 Test 97 % Fractured Mean 1S D2S n/Outliers 1.10 74.6 3.8 10.8 67/3 Test 99 %F&E Mean 1S D2S n/Outliers 1.10 1.57 0.83 2.35 69/3 Test 123 Mortar Bar Mean 1S D2S n/Outliers 1.10 0.191 0.028 0.079 19/1 2011 4.10 43.00 0.67 1.90 3.11 40.87 0.71 2.00 59/7 2010 2012 4.11 40.87 0.54 1.53 3.12 44.0 0.66 1.86 66/5 2011 4.10 35.7 7.50 21.36 3.11 36.8 3.81 10.79 56/7 2.10 75.1 3.8 10.7 1.11 63.6 4.9 13.8 69/2 2.10 1.37 0.71 2.00 1.11 0.24 0.19 0.53 65/7 2.10 0.373 0.045 0.127 1.11 2010 4.11 35.8 4.29 12.15 3.12 32.5 3.62 10.24 65/2 2.11 64.2 5.4 15.3 1.12 78.5 5.4 15.4 70/2 2.11 0.31 0.26 0.73 1.12 0.66 0.46 1.30 66/6 2.11 1.12 4.12 32.0 3.67 10.38 3.13 42.8 8.0 22.7 68/0 2.12 78.8 6.4 18.1 1.13 71.4 4.6 12.9 72/2 2.12 0.55 0.32 0.89 1.13 1.43 0.80 2.27 72/2 2.12 1.13 4.13 42.7 7.7 21.8 2013 2012 2011 4.13 42.3 0.65 1.85 2013 2012 2011 2010 3.13 42.2 0.64 1.80 71/1 2012 2011 2010 2013 4.12 44.1 0.63 1.78 2.13 71.4 4.3 12.2 2013 2012 2.13 1.43 0.78 2.21 2013 Not Not Not Conducted Conducted Conducted 2.13 ASTM C1252 ASTM C1252 0.33% 0.93% ASTM D2419 < 80 8.0 22.6 ASTM D5821 76.0% 5.2% 14.7% ASTM D4791 19.0 -12.5 mm 88.5% 250.3% ASTM C1260 Expansion >0.1% 15.2% 43% A – AMRL reports percent passing inch series equivalent sieves. * - Calculated from Coefficient of Variation Precision Statement (Coefficient of Variation = Standard Deviation / Mean) MTO Aggregate and Soil Proficiency Sample Testing Program for 2013; MERO-048 A - 64 - Appendix D1: Scatter Diagrams 2013 MTO AGGREGATE AND SOIL PROFICIENCY SAMPLE TESTING PROGRAM 278 3.0 252 196 32 2.0 195 194 170 21 156 176 280 181 Sample 2.13 2 52 182 1.0 116 219 288 23 333 218 0.0 0.0 1.0 2.0 3.0 Sample 1.13 Test 1: Wash Pass 75 um Mean Median Std Dev Mat 1 1.216 1.280 0.280 Mat 2 1.223 1.230 0.255 n = 201 Labs Eliminated: 2; 21; 23; 32; 52; 116; 156; 170; 176; 181; 182; 194; 195; 196; 218; 219; 252; 278; 280; 288; 333 MTO Aggregate and Soil Proficiency Sample Testing Program for 2013; MERO-048 - 65 - 2013 MTO AGGREGATE AND SOIL PROFICIENCY SAMPLE TESTING PROGRAM 100 126 98 52 Sample 2.13 302 96 159 128 94 129 251 25 157 92 250 90 90 92 94 96 98 Sample 1.13 Test 2: Percent Passing the 19.0 mm Sieve Mean Median Std Dev Mat 1 95.759 95.750 0.835 Mat 2 95.779 95.700 0.790 n = 213 Labs Eliminated: 25; 52; 126; 128; 129; 157; 159; 250; 251; 302 MTO Aggregate and Soil Proficiency Sample Testing Program for 2013; MERO-048 100 - 66 - 2013 MTO AGGREGATE AND SOIL PROFICIENCY SAMPLE TESTING PROGRAM 96 Sample 2.13 322 92 42 302 52 69 167 128 260 47 88 248 257 285 250 261 84 157 82 86 90 94 Sample 1.13 Test 3: Percent Passing the 16.0 mm Sieve Mean Median Std Dev Mat 1 90.016 89.750 1.111 Mat 2 89.861 89.800 1.223 n = 207 Labs Eliminated: 42; 47; 52; 69; 128; 157; 167; 248; 250; 257; 260; 261; 285; 302; 322 MTO Aggregate and Soil Proficiency Sample Testing Program for 2013; MERO-048 98 - 67 - 2013 MTO AGGREGATE AND SOIL PROFICIENCY SAMPLE TESTING PROGRAM 9 322 90 69 85 Sample 2.13 302 167 170 128 260 316 253 248 80 250 261 75 157 75 80 85 Sample 1.13 Test 4: Percent Passing the 13.20 mm Sieve Mean Median Std Dev Mat 1 83.755 83.650 1.518 Mat 2 83.579 83.650 1.546 n = 209 Labs Eliminated: 9; 69; 128; 157; 167; 170; 248; 250; 253; 260; 261; 302; 316; 322 MTO Aggregate and Soil Proficiency Sample Testing Program for 2013; MERO-048 90 - 68 - 2013 MTO AGGREGATE AND SOIL PROFICIENCY SAMPLE TESTING PROGRAM 9 2 322 80 77 Sample 2.13 75 69 302 167 275 170 316 70 16 42 31 248 128 253 260 257 250 149 261 65 157 65 70 75 Sample 1.13 Test 5: Percent Passing the 9.5 mm Sieve Mean Median Std Dev Mat 1 72.155 71.950 1.596 Mat 2 71.848 71.600 1.691 n = 201 Labs Eliminated: 2; 9; 16; 31; 42; 69; 77; 128; 149; 157; 167; 170; 248; 250 253; 257; 260; 261; 275; 302; 316; 322 MTO Aggregate and Soil Proficiency Sample Testing Program for 2013; MERO-048 80 - 69 - 2013 MTO AGGREGATE AND SOIL PROFICIENCY SAMPLE TESTING PROGRAM 322 65 9 77 Sample 2.13 60 302 69 167 55 16 13 157 275 171 31 316 248 128 170 253 260 257 50 45 45 50 55 60 Sample 1.13 Test 6: Percent Passing the 4.75 mm Sieve Mean Median Std Dev Mat 1 54.793 54.340 1.512 Mat 2 54.217 54.000 1.736 n = 204 Labs Eliminated: 9; 13; 16; 31; 69; 77; 128; 157; 167; 170; 171; 248; 253; 257; 260; 275; 302; 316; 322 MTO Aggregate and Soil Proficiency Sample Testing Program for 2013; MERO-048 65 - 70 - 2013 MTO AGGREGATE AND SOIL PROFICIENCY SAMPLE TESTING PROGRAM 30 31 Sample 2.13 25 20 15 15 20 25 Sample 1.13 Test 8: Los Angeles Abrasion Loss, % Mean Median Std Dev Mat 1 22.178 22.300 1.153 Mat 2 22.122 21.800 0.880 n=9 Lab Eliminated: 31 MTO Aggregate and Soil Proficiency Sample Testing Program for 2013; MERO-048 30 - 71 - 2013 MTO AGGREGATE AND SOIL PROFICIENCY SAMPLE TESTING PROGRAM 2.66 337 77 208 Sample 2.13 2.64 245 2.62 31 2.60 260 2.58 2.58 2.60 2.62 2.64 Sample 1.13 Test 9: Relative Density of Coarse Aggregate (O. D) Mean Median Std Dev Mat 1 2.625 2.624 0.006 Mat 2 2.624 2.624 0.006 n = 98 Labs Eliminated: 31; 77; 208; 245; 260; 337 MTO Aggregate and Soil Proficiency Sample Testing Program for 2013; MERO-048 2.66 - 72 - 2013 MTO AGGREGATE AND SOIL PROFICIENCY SAMPLE TESTING PROGRAM 2.00 337 1.50 Sample 2.13 235 1.00 9 0.50 0.00 0.00 0.50 1.00 1.50 Sample 1.13 Test 10: Absorption of Coarse Aggregate Mean Median Std Dev Mat 1 1.133 1.150 0.076 Mat 2 1.126 1.155 0.072 n = 101 Labs Eliminated: 9; 235; 337 MTO Aggregate and Soil Proficiency Sample Testing Program for 2013; MERO-048 2.00 - 73 - 2013 MTO AGGREGATE AND SOIL PROFICIENCY SAMPLE TESTING PROGRAM 10 Sample 2.13 8 6 4 2 0 0 2 4 6 8 Sample 1.13 Test 11: MgSO4 Soundness of Coarse Aggregate, % Loss Mean Median Std Dev Mat 1 3.693 3.850 1.775 Mat 2 3.541 4.100 1.890 n = 44 Labs Eliminated: None MTO Aggregate and Soil Proficiency Sample Testing Program for 2013; MERO-048 10 - 74 - 2013 MTO AGGREGATE AND SOIL PROFICIENCY SAMPLE TESTING PROGRAM 315 90 208 322 236 80 60 250 251 112 129 Sample 2.13 335 70 60 2 326 252 176 50 50 60 70 80 Sample 1.13 Test 12: Percent Crushed Particles Mean Median Std Dev Mat 1 69.139 69.600 3.808 Mat 2 69.314 68.800 3.749 n = 208 Labs Eliminated: 2; 60; 112; 129; 176; 208; 236; 250; 251; 252; 315; 322; 326; 335 MTO Aggregate and Soil Proficiency Sample Testing Program for 2013; MERO-048 90 - 75 - 2013 MTO AGGREGATE AND SOIL PROFICIENCY SAMPLE TESTING PROGRAM 16 208 252 45 16 331 36 Sample 2.13 12 8 4 0 0 4 8 12 Sample 1.13 Test 13: Percent Flat and Elongated Particles Mean Median Std Dev Mat 1 6.960 7.150 2.537 Mat 2 6.720 7.555 2.383 n = 215 Labs Eliminated: 16; 36; 45; 208; 252; 331 MTO Aggregate and Soil Proficiency Sample Testing Program for 2013; MERO-048 16 - 76 - 2013 MTO AGGREGATE AND SOIL PROFICIENCY SAMPLE TESTING PROGRAM 220 Labs: 30, 38, 61, 80, 260, & 316 - Incorrect Mass &/or Rock ID Labs: 1, 13, 30, 61, 102, 183 & 293 - Incorrect Rock ID 200 1 Sample 2.13 180 160 80 30 260 38 316 140 13 102 293 120 183 61 100 100 120 140 160 180 Sample 1.13 Test 14: Petrographic Number (Concrete) Mean Median Std Dev Mat 1 - Mat 2 - n = 35 MTO Aggregate and Soil Proficiency Sample Testing Program for 2013; MERO-048 200 220 - 77 - 2013 MTO AGGREGATE AND SOIL PROFICIENCY SAMPLE TESTING PROGRAM 77 71 16 Sample 2.13 14 124 181 12 10 8 8 10 12 14 Sample 1.13 Test 16: Micro-Deval Abrasion Loss (CA), % Mean Median Std Dev Mat 1 11.472 11.350 0.450 Mat 2 11.514 11.500 0.537 n = 76 Labs Eliminated: 71; 77; 124; 181 MTO Aggregate and Soil Proficiency Sample Testing Program for 2013; MERO-048 16 - 78 - 2013 MTO AGGREGATE AND SOIL PROFICIENCY SAMPLE TESTING PROGRAM 10 8 Sample 2.13 47 6 260 4 2 0 0 2 4 6 8 Sample 1.13 Test 17: Freeze-Thaw Loss, % Mean Median Std Dev Mat 1 3.304 4.000 1.096 Mat 2 3.160 3.750 1.127 n = 60 Labs Eliminated: 47; 260 MTO Aggregate and Soil Proficiency Sample Testing Program for 2013; MERO-048 10 - 79 - 2013 MTO AGGREGATE AND SOIL PROFICIENCY SAMPLE TESTING PROGRAM 280 63 60 322 137 50 Sample 2.13 278 52 332 42 69 13 316 128 260 40 297 249 172 30 30 40 50 Sample 1.13 Test 20: Percent Passing the 2.36 mm Sieve Mean Median Std Dev Mat 1 44.871 44.700 1.936 Mat 2 44.490 44.950 1.767 n = 207 Labs Eliminated: 13; 42; 52; 63; 69; 128; 137; 172; 249; 260; 278; 280; 297; 316; 322; 332 MTO Aggregate and Soil Proficiency Sample Testing Program for 2013; MERO-048 60 - 80 - 2013 MTO AGGREGATE AND SOIL PROFICIENCY SAMPLE TESTING PROGRAM 63 280 137 322 45 52 332 72 Sample 2.13 40 42 13 260 35 285 128 249 172 30 30 35 40 Sample 1.13 Test 21: Percent Passing the 1.18 mm Sieve Mean Median Std Dev Mat 1 37.622 37.750 1.950 Mat 2 37.324 37.650 1.720 n = 209 Labs Eliminated: 13; 42; 52; 63; 72; 128; 137; 172; 249; 260; 280; 285; 322; 332 MTO Aggregate and Soil Proficiency Sample Testing Program for 2013; MERO-048 45 - 81 - 2013 MTO AGGREGATE AND SOIL PROFICIENCY SAMPLE TESTING PROGRAM 280 63 40 137 35 322 52 Sample 2.13 332 38 30 160 42 110 285 13 260 128 186 25 323 172 20 249 86 326 15 15 20 25 30 35 Sample 1.13 Test 22: Percent Passing the 600 um Sieve Mean Median Std Dev Mat 1 27.408 27.450 1.525 Mat 2 27.368 27.250 1.494 n = 203 Labs Eliminated: 13; 38; 42; 52; 63; 86; 110; 128; 137; 160; 172; 186; 249; 260; 280; 285; 322; 323; 326; 332 MTO Aggregate and Soil Proficiency Sample Testing Program for 2013; MERO-048 40 - 82 - 2013 MTO AGGREGATE AND SOIL PROFICIENCY SAMPLE TESTING PROGRAM 63 24 20 Sample 2.13 137 52 322 332 129 65 16 160 184 176 285 110 13 12 280 172 326 249 77 186 8 8 164 12 16 20 24 Sample 1.13 Test 23: Percent Passing the 300 um Sieve Mean Median Std Dev Mat 1 14.069 14.000 0.843 Mat 2 14.100 14.150 0.847 n = 203 Labs Eliminated: 13; 52; 63; 65; 77; 110; 129; 137; 160; 164; 172; 176; 184; 186; 249; 280; 285; 322; 326; 332 MTO Aggregate and Soil Proficiency Sample Testing Program for 2013; MERO-048 - 83 - 2013 MTO AGGREGATE AND SOIL PROFICIENCY SAMPLE TESTING PROGRAM 20 63 Sample 2.13 15 137 322 332 129 52 314 184 10 172 249 186 77 5 280 5 10 15 Sample 1.13 Test 24: Percent Passing the 150 um Sieve Mean Median Std Dev Mat 1 10.321 10.300 0.651 Mat 2 10.336 10.350 0.575 n = 210 Labs Eliminated: 52; 63; 77; 129; 137; 172; 184; 186; 249; 280; 314; 322; 332 MTO Aggregate and Soil Proficiency Sample Testing Program for 2013; MERO-048 20 - 84 - 2013 MTO AGGREGATE AND SOIL PROFICIENCY SAMPLE TESTING PROGRAM 16.0 63 314 Sample 2.13 12.0 322 137 8.0 90 249 77 4.0 186 4.0 8.0 280 12.0 Sample 1.13 Test 25: Percent Passing the 75 um Sieve Mean Median Std Dev Mat 1 8.689 8.685 0.550 Mat 2 8.714 8.770 0.517 n = 214 Labs Eliminated: 63; 77; 90; 137; 186; 249; 280; 314; 322 MTO Aggregate and Soil Proficiency Sample Testing Program for 2013; MERO-048 16.0 - 85 - 2013 MTO AGGREGATE AND SOIL PROFICIENCY SAMPLE TESTING PROGRAM 2.70 182 Sample 2.13 2.68 2.66 2.64 2.62 260 2.60 9 63 2.60 2.62 2.64 2.66 2.68 Sample 1.13 Test 27: Relative Density of Fine Aggregate (O. D) Mean Median Std Dev Mat 1 2.650 2.649 0.013 Mat 2 2.650 2.649 0.013 n = 99 Labs Eliminated: 9; 63; 182; 260 MTO Aggregate and Soil Proficiency Sample Testing Program for 2013; MERO-048 2.70 - 86 - 2013 MTO AGGREGATE AND SOIL PROFICIENCY SAMPLE TESTING PROGRAM 337 2.5 2.0 Sample 2.13 339 90 98 326 71 1.5 1.0 181 77 86 0.5 0.5 1.0 182 1.5 2.0 Sample 1.13 Test 28: Absorption of Fine Aggregate Mean Median Std Dev Mat 1 1.351 1.425 0.157 Mat 2 1.329 1.355 0.122 n = 93 Labs Eliminated: 71; 77; 86; 90; 98; 181; 182; 326; 337; 339 MTO Aggregate and Soil Proficiency Sample Testing Program for 2013; MERO-048 2.5 - 87 - 2013 MTO AGGREGATE AND SOIL PROFICIENCY SAMPLE TESTING PROGRAM 70 182 Sample 2.13 60 36 50 219 235 161 337 214 90 205 40 287 268 255 335 183 279 60 262 16 30 18 30 40 218 50 60 Sample 1.13 Test 30: Percent Asphalt Coated Particles Mean Median Std Dev Mat 1 54.433 53.300 2.874 Mat 2 54.833 54.450 2.957 n = 202 Labs Eliminated: 16; 18; 36; 60; 90; 161; 182; 183; 205; 214; 218; 219; 235; 255; 262; 268; 279; 287; 335; 337 MTO Aggregate and Soil Proficiency Sample Testing Program for 2013; MERO-048 70 - 88 - 2013 MTO AGGREGATE AND SOIL PROFICIENCY SAMPLE TESTING PROGRAM 2.6 2.5 47 16 Sample 2.13 98 2.4 180 263 236 77 9 46 156 43 314 2.3 208 102 2.2 2.2 2.3 2.4 2.5 Sample 1.13 Test 31: Maximum Wet Density g/cm3 (Moisture-Density) Mean Median Std Dev Mat 1 2.422 2.426 0.024 Mat 2 2.425 2.421 0.024 n = 141 Labs Eliminated: 9; 16; 43; 46; 47; 77; 98; 102; 156; 180; 208; 236; 263; 314 MTO Aggregate and Soil Proficiency Sample Testing Program for 2013; MERO-048 2.6 - 89 - 2013 MTO AGGREGATE AND SOIL PROFICIENCY SAMPLE TESTING PROGRAM 215 2.4 47 16 98 Sample 2.13 2.3 180 263 2.2 77 46 43 314 208 2.1 2.1 2.2 2.3 Sample 1.13 Test 32: Maximum Dry Density g/cm3 (Moisture-Density) Mean Median Std Dev Mat 1 2.265 2.267 0.025 Mat 2 2.267 2.268 0.027 n = 144 Labs Eliminated: 16; 43; 46; 47; 77; 98; 180; 208; 215; 263; 314 MTO Aggregate and Soil Proficiency Sample Testing Program for 2013; MERO-048 2.4 - 90 - 2013 MTO AGGREGATE AND SOIL PROFICIENCY SAMPLE TESTING PROGRAM 10.0 9.0 Sample 2.13 314 8.0 54 46 180 7.0 126 6.0 2 98 215 5.0 156 5.0 6.0 7.0 8.0 9.0 Sample 1.13 Test 33: Optimum Moisture, % (Moisture - Density) Mean Median Std Dev Mat 1 7.046 7.000 0.260 Mat 2 7.021 7.045 0.264 n = 146 Labs Eliminated: 2; 46; 54; 98; 126; 156; 180; 215; 314 MTO Aggregate and Soil Proficiency Sample Testing Program for 2013; MERO-048 10.0 - 91 - 2013 MTO AGGREGATE AND SOIL PROFICIENCY SAMPLE TESTING PROGRAM 13 20 Sample 2.13 18 16 14 12 12 14 16 18 Sample 1.13 Test 34: Micro-Deval Abrasion Loss (FA), % Mean Median Std Dev Mat 1 15.609 15.700 1.205 Mat 2 15.741 16.150 1.210 n = 79 Lab Eliminated: 13; MTO Aggregate and Soil Proficiency Sample Testing Program for 2013; MERO-048 20 - 92 - 2013 MTO AGGREGATE AND SOIL PROFICIENCY SAMPLE TESTING PROGRAM 100.0 Sample 2.13 99.0 98.0 97.0 96.0 96.0 97.0 98.0 99.0 Sample 1.13 Test 40: Percent Passing the 2.00 mm Sieve (Soil) Mean Median Std Dev Mat 1 99.594 99.250 0.319 Mat 2 99.852 99.300 0.193 n = 90 Labs Eliminated: None MTO Aggregate and Soil Proficiency Sample Testing Program for 2013; MERO-048 100.0 - 93 - 2013 MTO AGGREGATE AND SOIL PROFICIENCY SAMPLE TESTING PROGRAM 100.0 13 Sample 2.13 98.0 114 86 96.0 301 94.0 94.0 96.0 98.0 Sample 1.13 Test 41: Percent Passing the 425 m Sieve (Soil) Mean Median Std Dev Mat 1 96.701 96.600 0.676 Mat 2 96.997 97.000 0.544 n = 86 Labs Eliminated: 13; 86; 114; 301 MTO Aggregate and Soil Proficiency Sample Testing Program for 2013; MERO-048 100.0 - 94 - 2013 MTO AGGREGATE AND SOIL PROFICIENCY SAMPLE TESTING PROGRAM 100 171 Sample 2.13 95 86 90 85 85 90 95 Sample 1.13 Test 42: Percent Passing the 75 m Sieve (Soil) Mean Median Std Dev Mat 1 91.350 91.050 1.015 Mat 2 91.667 91.800 0.921 n = 88 Labs Eliminated: 86; 171 MTO Aggregate and Soil Proficiency Sample Testing Program for 2013; MERO-048 100 - 95 - 2013 MTO AGGREGATE AND SOIL PROFICIENCY SAMPLE TESTING PROGRAM 171 90 Sample 2.13 85 80 75 144 70 108 70 13 315 75 80 85 Sample 1.13 Test 43: Percent Passing the 20 m Sieve (Soil) Mean Median Std Dev Mat 1 79.325 79.650 3.361 Mat 2 79.282 79.000 3.069 n = 85 Labs Eliminated: 13; 108; 144; 171; 315 MTO Aggregate and Soil Proficiency Sample Testing Program for 2013; MERO-048 90 - 96 - 2013 MTO AGGREGATE AND SOIL PROFICIENCY SAMPLE TESTING PROGRAM 171 70 253 Sample 2.13 60 19 50 17 40 108 315 40 50 60 Sample 1.13 Test 44: Percent Passing the 5 m Sieve (Soil) Mean Median Std Dev Mat 1 59.395 58.700 3.403 Mat 2 58.940 58.750 3.065 n = 84 Labs Eliminated: 17; 19; 108; 171; 253; 315 MTO Aggregate and Soil Proficiency Sample Testing Program for 2013; MERO-048 70 - 97 - 2013 MTO AGGREGATE AND SOIL PROFICIENCY SAMPLE TESTING PROGRAM 171 55 253 208 Sample 2.13 50 322 316 47 45 40 13 35 108 35 40 45 50 Sample 1.13 315 Test 45: Percent Passing the 2 m Sieve (Soil) Mean Median Std Dev Mat 1 43.901 43.550 2.422 Mat 2 43.900 43.400 2.834 n = 81 Labs Eliminated: 13; 47; 108; 171; 208; 253; 315; 316; 322 MTO Aggregate and Soil Proficiency Sample Testing Program for 2013; MERO-048 55 - 98 - 2013 MTO AGGREGATE AND SOIL PROFICIENCY SAMPLE TESTING PROGRAM 45 40 Sample 2.13 30 164 35 126 64 108 30 30 35 40 Sample 1.13 Test 46: Liquid Limit, % Mean Median Std Dev Mat 1 37.144 37.300 1.329 Mat 2 37.069 36.945 1.385 n = 103 Labs Eliminated: 30; 64; 108; 126; 164 MTO Aggregate and Soil Proficiency Sample Testing Program for 2013; MERO-048 45 - 99 - 2013 MTO AGGREGATE AND SOIL PROFICIENCY SAMPLE TESTING PROGRAM 28 24 Sample 2.13 260 52 293 309 20 16 12 12 16 20 24 Sample 1.13 Test 47: Plastic Limit, % Mean Median Std Dev Mat 1 18.813 18.800 1.274 Mat 2 18.734 19.050 1.142 n = 104 Labs Eliminated: 52; 260; 293; 309 MTO Aggregate and Soil Proficiency Sample Testing Program for 2013; MERO-048 28 - 100 - 2013 MTO AGGREGATE AND SOIL PROFICIENCY SAMPLE TESTING PROGRAM 25 333 164 Sample 2.13 20 15 98 52 64 293 108 10 10 15 20 Sample 1.13 Test 48: Plasticity Index, % Mean Median Std Dev Mat 1 18.369 18.450 1.594 Mat 2 18.341 17.950 1.447 n = 101 Labs Eliminated: 52; 64; 98; 108; 164; 293; 333 MTO Aggregate and Soil Proficiency Sample Testing Program for 2013; MERO-048 25 - 101 - 2013 MTO AGGREGATE AND SOIL PROFICIENCY SAMPLE TESTING PROGRAM 2.85 146 Sample 2.13 2.80 2.75 21 326 12 2.70 261 52 2.65 315 2.60 23 2.60 2.65 75 2.70 2.75 2.80 Sample 1.13 Test 49: Specific Gravity of Soil Mean Median Std Dev Mat 1 2.733 2.723 0.024 Mat 2 2.734 2.737 0.025 n = 74 Labs Eliminated: 12; 21; 23; 52; 75; 146; 261; 315; 326 MTO Aggregate and Soil Proficiency Sample Testing Program for 2013; MERO-048 2.85 - 102 - Appendix D2: Scatter Diagrams 2013 MTO SUPERPAVE CONSENSUS PROPERTY TESTING PROGRAM 48 172 Sample 2.13 44 40 36 36 40 44 Sample 1.13 Test 95: Uncompacted Void Content of Fine Aggregate Mean Median Std Dev Mat 1 42.206 42.250 0.638 Mat 2 42.270 42.400 0.655 n = 71 Lab Eliminated: 172 MTO Aggregate and Soil Proficiency Sample Testing Program for 2013; MERO-048 48 - 103 - 2013 MTO SUPERPAVE CONSENSUS PROPERTY TESTING PROGRAM 65 Sample 2.13 55 45 35 25 25 35 45 55 Sample 1.13 Test 96: Sand Equivalent Value of Fine Aggregate Mean Median Std Dev Mat 1 42.767 46.800 8.036 Mat 2 42.674 44.750 7.689 n = 68 Labs Eliminated: None MTO Aggregate and Soil Proficiency Sample Testing Program for 2013; MERO-048 65 - 104 - 2013 MTO SUPERPAVE CONSENSUS PROPERTY TESTING PROGRAM 90 75 Sample 2.13 80 70 13 60 50 50 60 70 80 Sample 1.13 Test 97: Percent Fractured Particles Mean Median Std Dev Mat 1 71.443 71.200 4.562 Mat 2 71.453 71.800 4.322 n = 72 Labs Eliminated: 13; 75 MTO Aggregate and Soil Proficiency Sample Testing Program for 2013; MERO-048 90 - 105 - 2013 MTO SUPERPAVE CONSENSUS PROPERTY TESTING PROGRAM 4.0 215 56 Sample 2.13 3.0 2.0 1.0 0.0 0.0 1.0 2.0 3.0 Sample 1.13 Test 99: Percent Flat and Elongated Particles Mean Median Std Dev Mat 1 1.434 1.600 0.804 Mat 2 1.433 1.625 0.780 n = 72 Labs Eliminated: 56; 215 MTO Aggregate and Soil Proficiency Sample Testing Program for 2013; MERO-048 4.0 - 106 - Appendix E1: Petrographic Results of Coarse Aggregate Laboratory Number Sample Number 1 1.13ST 1 2.13ST 3 1.13ST 3 2.13ST 13 1.13ST 13 2.13ST 15 1.13ST 15 2.13ST 27 1.13ST 27 2.13ST 30 1.13ST 30 2.13ST Type No. Carbonate (hard; silty, hard) Carbonate (surf. weath.; silty, surf. weath.; med. hard; silty, med.hard) Carbonate (sandy, hard or medium hard) Carbonate (slightly cherty: <5%) Marble (hard or medium hard) Conglomerate-Sandstone-Arkose (hard) Gypsite (<10%) Carbonate (carbonaceous coral) Flint/Jasper Total Good Aggregate (%) 1 10.2 6.5 54.3 66.6 34.7 31.3 21.6 18.8 82.5 75.5 63.3 55.7 20 33.9 36.4 23.8 11.6 23.3 43.2 63.3 65.0 4.1 5.1 7.7 6.0 2 21 23 3 77 21.4 6.2 25.9 1.6 7.4 7.9 12.5 19.9 10.9 1.6 2.3 4.1 5.0 8.6 5.2 11.8 8.5 2.8 81 71.67 70.34 85.5 7.8 3.3 10.2 1.7 0.2 2.0 0.8 4.8 1.8 5.2 5.2 8.5 7.8 17.69 22.32 10.7 8.6 0.5 0.1 10.1 1.0 0.3 5.5 3.8 10.55 6.84 0.1 0.5 0.09 0.5 Reported total mass examined 1530.7 Reported PN 188.9 Carbonate (soft; silty, soft; slightly shaley) Carbonate (soft, pitted) Carbonate (deeply weathered; silty, deeply weathered) Carbonate (sandy, soft) Chert-Cherty Carbonate (<20% leached chert) Carbonate (carbonaceous coral) Total Fair Aggregate (%) 35 41 42 40 26 Carbonate (shaley; clayey; silty, clayey) Carbonate (ochreous; sandy, ochreous) Chert-Cherty Carbonate (>20% leached chert) Siltstone Carbonate (coral) Total poor Aggregate (%) 43 44 45 56 Ochre Shale Total Deleterious Aggregate (%) 60 61 86.1 90.64 85.42 86.5 86.1 90.7 85.6 87.7 82.0 7.2 7.4 3.8 1.8 0.4 0.6 2.5 2.2 2.6 0.1 0.9 0.8 1.7 6.1 0.7 11.2 7.0 8.3 10.1 7.4 10.6 0.8 4.7 7.18 14.36 12.1 12.3 8.9 13.9 7.7 0.2 0.2 0.1 5.2 0.7 0.9 0.8 2.0 3.8 5.3 2.38 1501.2 1524.8 1572.3 183.4 140 144 4.3 1.2 1.5 0.4 0.5 0.2 3.8 0.22 1.4 1.6 0.4 0.5 0.6 4.6 0.5 6.8 1520.2 1499.1 1549.9 1552.6 nr nr 1343.9 1312.4 126.9 129.8 131 133 119.8 130.3 138.4 156.4 nr = not reported MTO Aggregate and Soil Proficiency Sample Testing Program for 2013; MERO-048 - 107 Laboratory Number Sample Number 31 1.13ST 31 2.13ST 35 1.13ST 35 2.13ST 38 1.13ST 38 2.13ST 39 1.13ST 39 2.13ST 40 1.13ST 40 2.13ST 47 1.13ST 47 2.13ST 1 6.3 14.0 69.8 69.1 74.4 77.5 60.5 62.4 6.9 7.5 11.5 11.9 20 2 21 23 3 77 77.1 67.0 5.2 5.4 26.2 23.7 66.0 67.4 60.8 65.9 1.1 6.7 9.5 3.0 2.6 5.1 3.6 0.4 0.3 4.6 2.7 2.7 90.1 90.5 78.0 77.1 79.5 81.1 87.1 86.4 77.5 77.6 75.1 79.0 7.3 8.6 4.0 4.2 2.5 1.4 3.9 3.9 0.7 1.7 1.0 3.0 3.6 18.0 18.7 15.0 13.4 7.9 8.4 2.9 2.6 1.7 1.5 22.0 22.9 17.5 14.8 11.8 12.2 3.6 5.3 4.7 5.1 1.2 2.3 1.1 1.4 Type No. Carbonate (hard; silty, hard) Carbonate (surf. weath.; silty, surf. weath.; med. hard; silty, med.hard) Carbonate (sandy, hard or medium hard) Carbonate (slightly cherty: <5%) Marble (hard or medium hard) Conglomerate-Sandstone-Arkose (hard) Gypsite (<10%) Carbonate (carbonaceous coral) Flint/Jasper Total Good Aggregate (%) 81 Carbonate (soft; silty, soft; slightly shaley) Carbonate (soft, pitted) Carbonate (deeply weathered; silty, deeply weathered) Carbonate (sandy, soft) Chert-Cherty Carbonate (<20% leached chert) Carbonate (carbonaceous coral) Total Fair Aggregate (%) 35 41 42 40 26 Carbonate (shaley; clayey; silty, clayey) Carbonate (ochreous; sandy, ochreous) Chert-Cherty Carbonate (>20% leached chert) Siltstone Carbonate (coral) Total poor Aggregate (%) 43 44 45 56 Ochre Shale Corals Total Deleterious Aggregate (%) 60 61 1.7 9.0 8.6 0.9 0.9 0.9 1.3 0.9 2.6 4.2 2.6 4.2 1.1 1.4 17.6 17.1 18.6 13.6 18.9 17.1 19.8 15.9 0.3 0.3 Reported total mass examined 1506.1 1513.1 1504.2 1503.2 995.5 1000.3 1503.2 1503.7 1514 1522 1498 1494 Reported PN 122.5 121.7 144 146 148 151 129.1 131.4 201.7 196.3 211.6 189.8 nr = not reported MTO Aggregate and Soil Proficiency Sample Testing Program for 2013; MERO-048 - 108 Laboratory Number Sample Number 61 1.13ST 61 2.13ST 67 1.13ST 67 2.13ST 76 1.13ST 76 2.13ST 77 1.13ST 77 2.13ST 79 1.13ST 79 2.13ST 80 1.13ST 80 2.13ST 3.2 2.7 57.4 58.2 57.0 56.2 47.0 46.7 31.1 32.0 82.2 74.4 20.3 20.4 21.2 21.0 20.1 20.2 42.7 46.0 92.1 92.0 0.8 1.8 0.5 0.8 9.3 9.6 1.8 1.1 1.8 2.0 1.4 1.6 Type No. Carbonate (hard; silty, hard) Carbonate (surf. weath.; silty, surf. weath.; med. hard; silty, med.hard) Carbonate (sandy, hard or medium hard) Carbonate (slightly cherty: <5%) Marble (hard or medium hard) Conglomerate-Sandstone-Arkose (hard) Gypsite (<10%) Carbonate (carbonaceous coral) Flint/Jasper Total Good Aggregate (%) 1 20 2 21 23 3 77 35 41 42 40 26 Carbonate (shaley; clayey; silty, clayey) Carbonate (ochreous; sandy, ochreous) Chert-Cherty Carbonate (>20% leached chert) Siltstone Carbonate (coral) Total poor Aggregate (%) 43 44 45 56 Ochre Shale Total Deleterious Aggregate (%) 60 61 Reported PN 1.8 81 Carbonate (soft; silty, soft; slightly shaley) Carbonate (soft, pitted) Carbonate (deeply weathered; silty, deeply weathered) Carbonate (sandy, soft) Chert-Cherty Carbonate (<20% leached chert) Carbonate (carbonaceous coral) Total Fair Aggregate (%) Reported total mass examined 2.6 97.9 96.5 78.4 80.4 78.7 78.0 77.8 78.1 75.6 79.1 84.5 76.4 1.9 3.0 2.9 2.1 3.5 2.4 15.2 14.7 4.2 0.7 4.1 0.5 0.2 0.1 0.2 0.5 0.2 2.1 3.5 15.9 14.9 15.7 17.0 6.9 7.1 6.5 6.2 12.5 19.7 18.8 17.0 19.2 19.7 22.1 21.8 11.4 10.8 12.7 19.8 1.1 0.7 0.6 0.4 0.4 1.7 1.9 1.5 1.9 12.6 10.1 2.7 3.7 2.8 2.6 2.1 2.3 13.0 10.1 2.7 3.7 1084.6 1063.3 1508 1510.1 1506.4 1503 1510.2 1517.7 1501 1504.9 1043.9 1071.5 104 107 152 147 149 151 144 143 188 172 139 158 nr = not reported MTO Aggregate and Soil Proficiency Sample Testing Program for 2013; MERO-048 - 109 Laboratory Number Sample Number 86 1.13ST 86 2.13ST 88 1.13ST 88 2.13ST 96 1.13ST 96 2.13ST 101 1.13ST 101 2.13ST 102 1.13ST 102 2.13ST 112 1.13ST 112 2.13ST 1 51.0 39.8 45.3 59.3 34.6 38.5 79.1 80.9 40.1 46.0 20 2 21 23 3 77 27.9 44.5 31.5 20.4 38.3 38.7 7.2 3.6 0.8 2.9 2.5 1.0 2.5 4.0 5.0 20.2 26.0 2.8 22.9 17.4 2.3 64.8 69.2 78.9 85.0 79.7 82.2 73.9 79.7 90.3 89.5 3.1 93.1 2.8 86.1 64.8 69.2 7.1 4.7 4.9 0.3 3.5 0.07 6.0 2.7 0.7 0.4 0.5 25.7 0.9 18.9 1.8 1.7 1.6 Type No. Carbonate (hard; silty, hard) Carbonate (surf. weath.; silty, surf. weath.; med. hard; silty, med.hard) Carbonate (sandy, hard or medium hard) Carbonate (slightly cherty: <5%) Marble (hard or medium hard) Conglomerate-Sandstone-Arkose (hard) Gypsite (<10%) Carbonate (carbonaceous coral) Flint/Jasper Total Good Aggregate (%) 81 Carbonate (soft; silty, soft; slightly shaley) Carbonate (soft, pitted) Carbonate (deeply weathered; silty, deeply weathered) Carbonate (sandy, soft) Chert-Cherty Carbonate (<20% leached chert) Carbonate (carbonaceous coral) Total Fair Aggregate (%) 35 41 42 40 26 Carbonate (shaley; clayey; silty, clayey) Carbonate (ochreous; sandy, ochreous) Chert-Cherty Carbonate (>20% leached chert) Siltstone Carbonate (coral) Total poor Aggregate (%) 43 44 45 56 Ochre Shale Total Deleterious Aggregate (%) 60 61 Reported total mass examined Reported PN 1.8 1.4 11.5 11.2 11.0 10.7 8.9 9.8 2.4 4.1 8.5 10.1 9.2 6.1 16.7 14.8 18.7 15.0 8.9 9.8 3.5 4.6 35.1 30.8 0.6 0.2 0.3 0.2 11.7 0.2 8.7 3.4 3.0 6.8 5.1 0.8 0.7 3.3 4.1 11.9 8.7 3.6 3.0 7.4 5.3 0.8 0.7 3.3 4.1 0.2 0.1 0.1 1500.3 1506.5 1534.7 1534.6 1527.1 1533.3 1500.9 1500.9 1511.8 1497.1 1538.6 1511.8 178 157 151 145 174 156 122 123 123.6 129.6 171 162 nr = not reported MTO Aggregate and Soil Proficiency Sample Testing Program for 2013; MERO-048 - 110 - Laboratory Number Sample Number 114 1.13ST 114 2.13ST 130 1.13ST 130 2.13ST 133 1.13ST 133 2.13ST 152 1.13ST 152 2.13ST 166 1.13ST 166 2.13ST 168 1.13ST 168 2.13ST 1 84.6 71.9 17.1 16.4 14.7 17.3 45.1 50.8 24.2 17.3 39.0 37.1 20 2 21 23 3 77 5.8 14.2 62.5 66.2 72.2 66.8 32.6 32.9 56.5 63.8 27.8 32.4 2.8 3.2 3.5 1.8 4.2 2.7 3.0 3.6 2.0 8.8 4.0 90.4 88.9 82.8 86.1 88.7 88.3 80.4 86.7 84.4 83.1 75.6 73.5 6.1 10.1 4.7 1.1 1.0 0.3 0.6 0.2 1.0 1.3 1.7 0.2 1.4 7.4 1.4 6.8 3.3 2.7 0.1 9.5 9.5 6.1 7.1 15.2 8.7 10.1 10.7 13.1 15.2 8.9 10.2 14.2 10.6 7.4 7.9 16.2 10.0 12.0 12.1 21.9 25.2 0.7 0.8 3.0 3.3 3.9 3.8 3.4 3.3 3.6 4.8 2.1 1.0 3.0 3.3 3.9 3.8 3.4 3.3 3.6 4.8 2.1 1.0 0.4 0.4 0.3 0.3 Type No. Carbonate (hard; silty, hard) Carbonate (surf. weath.; silty, surf. weath.; med. hard; silty, med.hard) Carbonate (sandy, hard or medium hard) Carbonate (slightly cherty: <5%) Marble (hard or medium hard) Conglomerate-Sandstone-Arkose (hard) Gypsite (<10%) Carbonate (carbonaceous coral) Flint/Jasper Total Good Aggregate (%) 81 Carbonate (soft; silty, soft; slightly shaley) Carbonate (soft, pitted) Carbonate (deeply weathered; silty, deeply weathered) Carbonate (sandy, soft) Chert-Cherty Carbonate (<20% leached chert) Carbonate (carbonaceous coral) Total Fair Aggregate (%) 35 41 42 40 26 Carbonate (shaley; clayey; silty, clayey) Carbonate (ochreous; sandy, ochreous) Chert-Cherty Carbonate (>20% leached chert) Siltstone Carbonate (coral) Total poor Aggregate (%) 43 44 45 56 Ochre Shale Total Deleterious Aggregate (%) 60 61 Reported total mass examined Reported PN 0.7 0.8 1515.1 1518.4 1546.2 1585.1 1520.5 1523.2 1550.1 1531.6 1533.9 1528 1504.4 1513.4 121 125 143 137 134 135 149 137 142 148 158 158 nr = not reported MTO Aggregate and Soil Proficiency Sample Testing Program for 2013; MERO-048 - 111 Laboratory Number Sample Number 183 1.13ST 183 2.13ST 188 1.13ST 188 2.13ST 260 1.13ST 260 2.13ST 293 1.13ST 293 2.13ST 316 1.13ST 316 2.13ST 1 33.2 25.6 26.5 40.7 50.81 53.7 62.9 71.7 49.7 46.2 20 2 21 23 3 77 55.5 1.2 2.1 2.7 63.4 0.2 2.7 3.4 46.1 34.9 29.14 28.32 31.9 6.6 1.0 0.22 9.3 1.9 0.7 32.4 2.1 11.9 5.2 0.3 1.7 5.0 94.52 95.39 74.7 82.2 80.95 82.24 80.3 83.6 83.8 83.1 2.8 1.6 2.4 3.6 0.82 5.7 2.9 1.9 2.1 0.3 2.5 4.0 3.25 1.1 0.5 11.9 10.6 11.9 16.4 12.5 14.3 0.8 0.6 Type No. Carbonate (hard; silty, hard) Carbonate (surf. weath.; silty, surf. weath.; med. hard; silty, med.hard) Carbonate (sandy, hard or medium hard) Carbonate (slightly cherty: <5%) Marble (hard or medium hard) Conglomerate-Sandstone-Arkose (hard) Gypsite (<10%) Carbonate (carbonaceous coral) Flint/Jasper Total Good Aggregate (%) 81 Carbonate (soft; silty, soft; slightly shaley) Carbonate (soft, pitted) Carbonate (deeply weathered; silty, deeply weathered) Carbonate (sandy, soft) Chert-Cherty Carbonate (<20% leached chert) Carbonate (carbonaceous coral) Total Fair Aggregate (%) 35 41 42 40 26 Carbonate (shaley; clayey; silty, clayey) Carbonate (ochreous; sandy, ochreous) Chert-Cherty Carbonate (>20% leached chert) Siltstone Carbonate (coral) Total poor Aggregate (%) 43 44 45 56 Ochre Shale Total Deleterious Aggregate (%) 60 61 Reported total mass examined Reported PN 1.47 0.8 0.3 2.1 19.4 9.1 12.41 10.27 0.8 13.3 3.98 3.78 24.3 16.7 16.48 11.74 19.8 0.4 1.0 0.2 0.4 0.1 1.0 1.1 2.57 6.0 2.9 2.0 1.36 0.72 1.0 1.1 2.57 6.02 3.7 2.6 0.13 0.13 0.1 0.1 1487.3 1508.2 1535 1524.2 1000.5 1001.78 1526.2 1508.2 1062.2 1106.6 116 112 153 139 146 154 139.4 132.8 143 142 nr = not reported MTO Aggregate and Soil Proficiency Sample Testing Program for 2013; MERO-048 - 112 - Appendix E2: Petrographic Results of Fine Aggregate Laboratory Number Sample Number 3 1.13 3 2.13 15 1.13 15 2.13 27 1.13 27 2.13 35 1.13 35 2.13 47 1.13 47 2.13 79 1.13 79 2.13 Silicate (4.75-2.36 mm) Silicate (2.36-1.18 mm) Silicate (1.18-0.600 mm) Silicate (0.600-0.300 mm) Silicate (0.300-0.150 mm) Silicate (0.150-0.075 mm) Silicate (wt. avg. %) 22.5 24.0 26.5 37.5 57.0 79.0 33.8 20.0 28.5 30.0 49.0 47.0 37.5 36.6 26.5 24.5 28.5 45.5 61.0 80.5 38.3 22.0 22.5 39.5 55.0 58.5 81.0 42.6 27.3 24.0 36.0 50.7 57.1 62.9 41.1 26.3 27.7 31.5 41.3 50.5 60.2 35.8 21.5 20.5 23.0 35.5 39.0 47.5 28.6 22.5 22.5 22.0 35.5 40.0 46.0 28.8 17.5 27.5 21.5 37.0 34.5 30.0 28.3 27.0 31.5 29.0 42.0 35.5 31.0 33.7 31.0 39.7 47.1 54.0 78.2 80.4 50.6 23.3 35.3 37.0 48.6 80.9 71.2 44.8 Carbonate (4.75-2.36 mm) Carbonate (2.36-1.18 mm) Carbonate (1.18-0.600 mm) Carbonate (0.600-0.300 mm) Carbonate (0.300-0.150 mm) Carbonate (0.150-0.075 mm) Carbonate (wt. avg. %) 67.0 68.5 68.0 60.0 41.0 20.0 61.2 60.0 60.5 59.5 47.0 52.0 62.0 55.1 65.0 68.0 65.5 49.0 35.5 15.0 55.7 68.0 69.5 56.0 42.5 35.0 13.5 52.0 68.3 74.2 61.5 37.9 37.9 35.1 55.8 70.7 66.4 63.1 52.7 47.1 36.8 59.2 71.5 73.0 72.0 60.5 59.5 51.0 66.7 72.0 70.0 70.5 60.5 57.5 53.0 65.7 71.0 63.5 68.5 58.5 62.5 67.0 64.3 66.5 56.0 63.0 55.0 63.5 68.5 60.1 65.0 56.1 49.5 42.3 16.4 14.0 45.3 67.5 59.3 56.3 45.7 15.8 23.5 49.5 2.5 3.0 3.0 3.0 0.5 2.4 1.4 1.5 4.1 4.1 1.6 2.3 2.0 4.5 3.9 5.0 2.4 2.5 4.0 3.0 2.5 3.0 2.5 1.5 1.5 2.5 3.5 3.5 4.0 1.5 2.0 1.0 2.8 0.5 0.5 0.0 0.5 1.0 0.5 1.0 1.0 1.0 2.6 5.5 5.0 2.5 1.5 3.0 0.5 3.0 0.4 0.8 0.5 1.4 2.0 1.9 2.7 4.7 1.8 1.5 0.5 2.5 2.4 1.9 1.8 1.9 1.0 0.5 0.1 0.5 2.5 3.5 0.5 0.5 0.5 0.5 0.4 0.4 2.0 0.1 0.5 0.0 0.9 0.5 0.1 0.5 0.4 0.1 6.0 4.0 3.0 2.5 2.0 3.0 3.2 4.5 3.0 2.0 0.5 1.0 1.5 1.9 11.0 8.5 10.0 4.0 2.0 1.0 6.9 6.0 11.5 7.0 2.0 1.0 3.5 2.8 1.5 1.9 1.8 0.5 2.1 7.8 4.9 3.8 1.9 1.0 3.1 3.5 Shale (4.75-2.36 mm) Shale (2.36-1.18 mm) Shale (1.18-0.600 mm) Shale (0.600-0.300 mm) Shale (0.300-0.150 mm) Shale (0.150-0.075 mm) Shale (wt. avg. %) Mica (4.75-2.36 mm) Mica (2.36-1.18 mm) Mica (1.18-0.600 mm) Mica (0.600-0.300 mm) Mica (0.300-0.150 mm) Mica (0.150-0.075 mm) Mica (wt. avg. %) Chert (4.75-2.36 mm) Chert (2.36-1.18 mm) Chert (1.18-0.600 mm) Chert (0.600-0.300 mm) Chert (0.300-0.150 mm) Chert (0.150-0.075 mm) Chert (wt. avg. %) 0.5 0.1 0.0 0.0 0.0 4.5 2.5 3.5 0.5 13.0 4.0 4.0 0.5 0.5 2.0 3.3 0.5 0.5 0.1 0.0 0.0 2.0 0.4 1.0 0.9 1.0 0.5 4.0 4.0 2.0 1.5 2.0 4.0 3.5 2.5 0.5 0.3 0.7 2.2 2.7 MTO Aggregate and Soil Proficiency Sample Testing Program for 2013; MERO-048 5.4 - 113 Laboratory Number Sample Number Contamination (4.75-2.36 mm) Contamination (2.36-1.18 mm) Contamination (1.18-0.600 mm) Contamination (0.600-0.300 mm) Contamination (0.300-0.150 mm) Contamination (0.150-0.075 mm) Contamination (wt. avg. %) 3 1.13 Cemented Particles (4.75-2.36 mm) Cemented Particles (2.36-1.18 mm) Cemented Particles (1.18-0.600 mm) Cemented Particles (0.600-0.300 mm) Cemented Particles (0.300-0.150 mm) Cemented Particles (0.150-0.075 mm) Cemented Particles (wt. avg. %) 0.5 0.1 0.0 0.0 0.0 0.1 0.2 0.0 0.0 0.0 0.0 0.0 0.2 Conglomerate, sandstone, quartzite (4.75-2.36 mm) Conglomerate, sandstone, quartzite (2.36-1.18 mm) Conglomerate, sandstone, quartzite (1.18-0.600 mm) Conglomerate, sandstone, quartzite (0.600-0.300 mm) Conglomerate, sandstone, quartzite (0.300-0.150 mm) Conglomerate, sandstone, quartzite (0.150-0.075 mm) Conglomerate, sandstone, quartzite (wt. avg. %) 5.5 3.5 2.0 2.0 2.0 0.5 2.6 6.0 7.0 6.5 3.5 1.0 0.5 4.9 0.0 0.0 0.0 0.0 0.0 0.0 0.0 0.0 0.0 0.0 Mudstone and Claystone (4.75-2.36 mm) Mudstone and Claystone(2.36-1.18 mm) Mudstone and Claystone (1.18-0.600 mm) Mudstone and Claystone (0.600-0.300 mm) Mudstone and Claystone (0.300-0.150 mm) Mudstone and Claystone (0.150-0.075 mm) Mudstone and Claystone (wt. avg. %) Gradation (% retained) (4.75-2.36 mm) (2.36-1.18 mm) (1.18-0.600 mm) (0.600-0.300 mm) (0.300-0.150 mm) (0.150-0.075 mm) pass 75 µm Total total without pass 75 3 2.13 15 1.13 15 2.13 27 1.13 27 2.13 35 1.13 35 2.13 47 1.13 47 2.13 79 1.13 79 2.13 0.0 0.0 0.0 0.0 0.0 0.0 0.0 0.0 0.0 0.5 0.5 0.5 0.5 0.0 0.0 1.0 0.1 0.4 0.5 0.4 1.0 1.0 0.2 0.1 0.0 0.0 0.0 0.0 0.0 0.0 0.0 0.0 0.0 0.0 11.4 18.7 25.1 30.8 11.6 2.4 nr 100 100 10.7 19.2 25.6 30.9 11.4 2.2 nr 100 100 9.5 18.1 26.7 30.5 12.1 1.8 1.3 100 98.7 10.9 18.4 26.1 29.9 11.7 1.6 1.4 100 98.6 9.3 17.1 25.9 32.3 12.3 2.3 0.8 100 99.2 11.4 19.3 26 29.5 10.8 2.2 0.8 100 99.2 11.7 18.4 26.1 29.6 11.4 2 0.8 100 99.2 11.6 17.8 26.8 30 11.1 1.9 0.8 100 99.2 12.4 18 26.3 29.3 11.1 2 0.8 99.9 99.1 11.6 18 28.3 28.5 10.7 2.2 0.8 100.1 99.3 11.2 19.4 26 28.1 12.1 2.3 0.9 100 99.1 11.3 19.6 25.6 28.2 12.3 2.3 0.7 100 99.3 MTO Aggregate and Soil Proficiency Sample Testing Program for 2013; MERO-048 - 114 Laboratory Number Sample Number 80 1.13 80 2.13 88 1.13 88 2.13 96 1.13 96 2.13 152 1.13 152 2.13 188 1.13 188 2.13 Average of Results Silicate (4.75-2.36 mm) Silicate (2.36-1.18 mm) Silicate (1.18-0.600 mm) Silicate (0.600-0.300 mm) Silicate (0.300-0.150 mm) Silicate (0.150-0.075 mm) Silicate (wt. avg. %) 23.5 25.6 34.8 47.1 69.9 58.9 40.0 23.8 29.6 31.2 49.8 64.7 64.5 40.4 20.0 23.1 25.9 58.0 60.5 49.0 38.9 24.0 39.0 42.5 45.0 54.0 56.0 42.1 11.0 6.0 16.0 31.0 42.0 56.0 21.9 13.5 16.0 15.0 37.5 48.0 60.0 25.7 16.5 34.5 49.0 56.5 60.5 69.5 46.9 26.5 38.5 50.5 58.5 62.5 65.5 50.0 17.5 28.5 39.5 42.5 68.0 73.5 40.0 18.0 22.0 39.5 54.0 66.0 77.0 42.0 21.9 26.9 32.5 46.0 56.2 60.8 37.8 Carbonate (4.75-2.36 mm) Carbonate (2.36-1.18 mm) Carbonate (1.18-0.600 mm) Carbonate (0.600-0.300 mm) Carbonate (0.300-0.150 mm) Carbonate (0.150-0.075 mm) Carbonate (wt. avg. %) 63.8 68.8 60.4 52.4 30.1 40.1 56.0 65.8 60.6 64.7 47.8 33.8 34.6 54.7 68.5 61.3 64.2 36.0 37.0 45.0 52.0 61.0 42.5 36.0 44.0 36.5 32.5 42.5 76.0 82.5 77.0 62.0 53.0 41.0 69.8 74.5 73.0 75.0 54.5 50.5 36.0 65.4 71.0 52.5 40.0 33.0 31.0 26.5 42.2 63.0 52.5 42.5 36.5 30.5 29.0 42.9 72.5 58.0 52.0 50.5 30.0 24.0 51.8 72.0 64.5 52.0 41.5 30.5 22.5 50.4 68.2 63.7 59.9 48.6 40.3 35.9 55.4 Shale (4.75-2.36 mm) Shale (2.36-1.18 mm) Shale (1.18-0.600 mm) Shale (0.600-0.300 mm) Shale (0.300-0.150 mm) Shale (0.150-0.075 mm) Shale (wt. avg. %) 4.7 0.5 0.5 0.5 3.5 3.3 2.3 1.0 1.5 0.9 2.1 1.5 1.0 0.5 0.5 2.5 0.8 2.0 2.0 1.0 3.5 2.0 2.0 2.2 1.5 0.5 0.5 1.5 2.5 4.0 3.5 1.7 1.0 0.5 1.5 3.5 5.0 1.3 1.0 3.0 0.5 1.0 1.0 1.0 1.2 1.5 3.0 2.0 2.0 1.5 0.5 2.0 1.6 1.8 1.6 1.8 1.6 1.5 1.7 1.0 0.0 0.0 0.0 0.0 0.1 0.1 0.5 1.0 0.1 Mica (4.75-2.36 mm) Mica (2.36-1.18 mm) Mica (1.18-0.600 mm) Mica (0.600-0.300 mm) Mica (0.300-0.150 mm) Mica (0.150-0.075 mm) Mica (wt. avg. %) Chert (4.75-2.36 mm) Chert (2.36-1.18 mm) Chert (1.18-0.600 mm) Chert (0.600-0.300 mm) Chert (0.300-0.150 mm) Chert (0.150-0.075 mm) Chert (wt. avg. %) Contamination (4.75-2.36 mm) Contamination (2.36-1.18 mm) Contamination (1.18-0.600 mm) Contamination (0.600-0.300 mm) Contamination (0.300-0.150 mm) Contamination (0.150-0.075 mm) Contamination (wt. avg. %) 0.5 0.9 0.5 0.5 0.3 2.5 3.5 0.5 2.0 1.9 1.0 0.5 0.0 0.0 5.0 0.1 8.0 5.1 4.3 6.4 6.1 1.8 1.5 7.0 4.5 3.0 0.5 3.1 2.7 2.6 0.0 0.0 0.0 4.5 5.5 0.9 0.0 4.0 6.0 2.0 2.0 0.5 2.0 2.8 9.5 8.0 5.0 2.0 3.0 1.0 4.9 0.0 0.0 0.5 0.5 0.1 6.5 7.0 3.0 2.0 1.0 1.5 3.7 0.0 0.5 1.0 0.5 0.3 2.0 2.0 3.5 2.0 1.5 7.5 10.0 5.5 4.0 0.5 8.0 8.5 3.0 1.0 0.5 0.6 1.1 5.4 3.7 5.8 5.0 3.2 1.4 0.7 0.6 2.9 0.0 0.0 0.0 0.0 0.0 0.0 0.0 0.0 0.0 0.0 0.0 MTO Aggregate and Soil Proficiency Sample Testing Program for 2013; MERO-048 - 115 Laboratory Number Sample Number Cemented Particles (4.75-2.36 mm) Cemented Particles (2.36-1.18 mm) Cemented Particles (1.18-0.600 mm) Cemented Particles (0.600-0.300 mm) Cemented Particles (0.300-0.150 mm) Cemented Particles (0.150-0.075 mm) Cemented Particles (wt. avg. %) 80 1.13 0.0 Conglomerate, sandstone, quartzite (4.75-2.36 mm) Conglomerate, sandstone, quartzite (2.36-1.18 mm) Conglomerate, sandstone, quartzite (1.18-0.600 mm) Conglomerate, sandstone, quartzite (0.600-0.300 mm) Conglomerate, sandstone, quartzite (0.300-0.150 mm) Conglomerate, sandstone, quartzite (0.150-0.075 mm) Conglomerate, sandstone, quartzite (wt. avg. %) Mudstone and Claystone (4.75-2.36 mm) Mudstone and Claystone(2.36-1.18 mm) Mudstone and Claystone (1.18-0.600 mm) Mudstone and Claystone (0.600-0.300 mm) Mudstone and Claystone (0.300-0.150 mm) Mudstone and Claystone (0.150-0.075 mm) Mudstone and Claystone (wt. avg. %) Gradation (% retained) (4.75-2.36 mm) (2.36-1.18 mm) (1.18-0.600 mm) (0.600-0.300 mm) (0.300-0.150 mm) (0.150-0.075 mm) pass 75 µm Total total without pass 75 0.0 80 2.13 0.5 0.5 88 1.13 88 2.13 96 1.13 96 2.13 152 1.13 152 2.13 188 1.13 188 2.13 0.1 0.0 0.0 0.0 0.0 0.0 0.0 0.1 0.0 11.0 11.0 17.5 8.5 4.0 3.5 10.9 1.0 1.5 1.0 1.5 4.0 4.0 4.5 2.5 10.5 11.0 9.5 8.0 4.0 7.0 6.0 5.0 3.0 2.5 1.5 0.5 2.0 3.5 1.5 1.5 0.0 4.5 10.6 6.5 5.5 2.0 0.5 6.1 1.1 3.2 8.5 4.4 0.5 2.5 2.0 0.5 0.5 1.5 2.0 2.3 2.6 2.7 1.7 0.8 0.3 2.1 0.0 0.0 0.0 0.0 0.0 0.0 0.0 0.0 0.0 0.0 0.0 0.0 0.0 0.0 0.0 0.0 0.0 12.5 18 26.5 29.1 11.8 2.1 2.4 102.4 100 11.5 17.6 26.7 30.1 12 2.1 0.9 100.9 100 10.9 19.4 25.7 30.8 11.1 2.1 nr 100 100 11.2 18.9 25.5 30.8 11.3 2.3 nr 100 100 12.1 19 24.9 30.3 11.3 2.4 nr 100 100 12.2 20.6 26.1 29.3 9.9 1.9 nr 100 100 11.3 18.3 24.6 31.3 11.9 2.6 nr 100 100 10.6 18.3 25.7 31.4 11.6 2.4 nr 100 100 11.7 17.9 25.4 31.2 11.5 2.3 nr 100 100 11.2 19.2 25.7 30.5 11.1 2.3 nr 100 100 MTO Aggregate and Soil Proficiency Sample Testing Program for 2013; MERO-048 Average of Results 0.0 0.1 0.1 0.0 0.0 0.0 0.0 11.3 18.6 26.0 30.1 11.5 2.2 1.0 - 116 - Appendix F1: Production Laboratory Ratings Lab No. LS-601 Wash Pass LS-602 Gradation LS-607 % Crushed Particles LS-621 % Asphalt Coated LS-608 % Flat & Elongated Rating 2 3 27.5 2 10 10 75 4 8 28.6 10 8 10 92 8 10 28.9 10 10 9 97 9 10 18.5 10 10 9 82 12 10 30.0 10 10 10 100 13 8 14.7 10 9 10 74 15 10 25.4 10 10 10 93 16 8 20.2 7 0 0 50 17 7 25.6 10 9 9 87 18 10 28.4 9 0 10 82 19 10 28.9 10 9 10 97 20 9 29.2 10 10 10 97 21 3 29.2 6 10 10 83 22 10 30.0 10 10 10 100 23 0 25.4 10 9 8 75 25 10 25.4 10 9 10 92 26 10 28.4 10 10 10 98 27 10 26.5 10 10 10 95 28 5 28.4 10 10 10 91 29 9 26.7 10 10 10 94 30 10 25.9 10 7 10 90 31 6 24.5 10 10 7 82 32 5 28.9 10 10 9 90 33 10 28.9 9 10 10 97 34 10 27.5 8 10 10 94 35 10 30.0 10 10 10 100 36 8 28.4 8 4 5 76 37 8 29.5 10 10 10 96 38 9 21.5 9 9 9 82 39 9 25.1 9 9 10 89 42 5 17.2 10 7 10 70 43 10 26.2 3 10 10 85 44 10 29.7 9 9 10 97 45 9 28.6 8 9 2 81 46 10 21.3 10 10 10 88 MTO Aggregate and Soil Proficiency Sample Testing Program for 2013; MERO-048 - 117 - Lab No. LS-601 Wash Pass LS-602 Gradation LS-607 % Crushed Particles LS-621 % Asphalt Coated LS-608 % Flat & Elongated Rating 47 10 24.5 10 8 9 88 52 4 17.5 8 10 8 68 54 10 25.1 10 9 10 92 56 8 25.6 10 10 6 85 58 10 29.5 10 10 9 98 59 10 27.5 10 10 10 96 60 10 28.9 0 0 4 61 61 10 25.6 10 10 10 94 62 9 29.5 10 8 9 94 63 10 13.1 10 10 10 76 64 10 26.5 8 4 7 79 65 8 26.7 10 9 9 90 68 10 28.4 10 10 10 98 69 5 17.2 10 10 10 75 70 7 28.9 9 10 6 87 71 8 28.4 8 9 10 91 72 7 25.6 7 9 10 84 73 10 25.9 3 2 7 68 74 9 27.8 10 7 4 83 75 8 24.8 6 7 8 77 76 10 30.0 10 7 10 96 77 3 9.3 10 10 10 60 79 9 29.7 10 8 9 94 80 9 25.1 10 7 9 86 81 7 30.0 6 10 10 90 83 8 27.3 9 9 10 90 85 8 30.0 10 9 10 96 86 7 25.6 9 10 10 88 89 9 25.4 10 9 4 82 90 10 23.5 10 0 8 74 93 10 26.5 10 10 10 95 97 10 27.8 10 6 10 91 98 5 27.3 8 10 4 78 99 9 27.3 10 9 6 88 100 9 29.7 10 10 10 98 101 9 27.5 10 10 10 95 102 10 24.0 10 5 10 84 103 6 27.3 10 10 10 90 107 10 22.6 10 6 10 84 MTO Aggregate and Soil Proficiency Sample Testing Program for 2013; MERO-048 - 118 - Lab No. LS-601 Wash Pass LS-602 Gradation LS-607 % Crushed Particles LS-621 % Asphalt Coated LS-608 % Flat & Elongated Rating 108 10 28.1 9 10 10 96 110 9 23.5 10 5 10 82 112 7 23.5 0 9 9 69 113 10 28.1 10 10 10 97 114 9 27.5 10 10 10 95 115 10 29.5 10 9 10 98 116 3 28.1 8 10 10 84 117 9 28.6 6 10 10 91 118 8 24.8 4 10 7 77 119 10 24.8 9 10 10 91 120 10 27.8 9 9 8 91 121 10 29.2 10 10 10 99 122 10 27.0 8 9 9 90 124 10 25.4 6 8 10 85 126 10 26.5 9 10 10 94 127 10 27.5 10 10 5 89 128 10 14.7 6 9 9 70 129 10 20.7 1 10 9 72 137 10 13.4 9 10 10 75 138 10 27.8 10 10 10 97 139 8 25.9 7 8 10 84 141 10 29.5 10 10 10 99 143 10 25.4 9 10 9 91 144 8 28.9 8 8 10 90 146 9 29.7 4 10 10 90 147 8 25.4 10 9 10 89 149 8 22.6 8 9 9 81 151 10 28.9 9 9 9 94 154 10 28.9 10 10 10 98 156 0 29.2 5 10 9 76 157 10 14.7 10 8 10 75 158 6 27.8 10 9 9 88 159 10 28.6 8 10 10 95 160 9 22.9 10 8 10 86 161 6 29.5 9 2 7 76 163 10 27.0 10 8 9 91 164 8 28.4 9 10 10 93 167 10 20.7 9 9 7 80 168 10 25.4 10 10 10 93 MTO Aggregate and Soil Proficiency Sample Testing Program for 2013; MERO-048 - 119 - Lab No. LS-601 Wash Pass LS-602 Gradation LS-607 % Crushed Particles LS-621 % Asphalt Coated LS-608 % Flat & Elongated Rating 169 9 30.0 7 9 9 91 170 2 18.8 10 9 7 67 171 10 21.0 8 10 4 76 172 9 15.8 9 9 9 74 175 10 29.2 10 6 8 90 176 0 19.6 0 7 10 52 177 8 28.6 10 10 10 95 178 10 20.2 10 10 10 86 179 9 23.7 9 8 10 85 180 10 24.3 9 9 9 88 181 0 29.7 9 9 9 81 182 5 28.4 9 0 10 75 183 10 27.3 10 0 5 75 184 6 25.1 9 10 10 86 186 10 18.3 10 9 9 80 187 10 27.5 5 10 9 88 188 8 28.4 10 9 10 93 193 10 30.0 10 9 10 99 194 0 28.4 8 7 10 76 195 0 30.0 10 9 10 84 196 5 29.2 10 6 9 85 198 10 28.1 10 8 10 94 199 6 30.0 10 10 10 94 200 10 27.3 6 10 10 90 205 10 27.3 10 0 10 82 208 10 24.8 0 8 0 61 210 10 29.7 6 10 10 94 214 10 29.7 10 0 7 81 216 8 28.1 10 9 10 93 217 10 29.7 10 10 10 100 218 0 27.8 7 0 9 63 219 0 24.3 9 2 10 65 232 9 25.9 10 6 9 86 234 6 23.7 10 10 10 85 235 6 24.8 10 2 10 75 236 9 27.3 3 10 10 85 245 10 28.4 8 9 7 89 248 9 16.6 7 9 10 74 249 9 19.9 8 8 6 73 MTO Aggregate and Soil Proficiency Sample Testing Program for 2013; MERO-048 - 120 - Lab No. LS-601 Wash Pass LS-602 Gradation LS-607 % Crushed Particles LS-621 % Asphalt Coated LS-608 % Flat & Elongated Rating 250 9 19.6 0 8 9 65 251 10 22.9 0 9 9 73 252 0 19.1 4 10 0 47 253 10 19.1 7 10 7 76 254 10 26.7 10 10 10 95 255 10 29.5 10 4 10 91 257 10 19.1 8 9 10 80 258 6 25.4 7 10 10 83 260 6 16.6 9 8 10 71 261 10 21.8 10 9 10 87 262 8 30.0 10 0 7 79 263 8 30.0 9 10 10 96 268 10 22.9 10 3 9 78 269 10 26.7 10 9 9 92 271 9 29.2 10 10 9 96 272 9 29.5 8 10 10 95 274 10 27.0 10 10 9 94 275 10 19.9 10 9 8 81 276 7 29.2 9 9 10 92 277 7 25.6 7 8 6 77 278 0 21.5 10 9 7 68 279 10 28.1 9 0 10 82 280 0 13.6 10 8 9 58 282 5 22.9 10 9 8 78 284 6 29.2 10 10 6 87 285 10 18.3 9 8 7 75 287 5 28.6 9 3 10 79 288 0 26.7 10 10 8 78 290 10 26.7 10 8 8 90 291 9 27.8 6 5 7 78 293 10 29.5 10 9 7 94 294 10 29.5 10 10 10 99 296 9 24.5 10 10 10 91 297 10 25.1 10 8 9 89 299 10 30.0 10 10 10 100 300 10 27.5 10 10 10 96 301 10 29.5 10 10 9 98 302 10 19.6 10 10 6 79 303 10 25.4 10 10 10 93 MTO Aggregate and Soil Proficiency Sample Testing Program for 2013; MERO-048 - 121 - Lab No. LS-601 Wash Pass LS-602 Gradation LS-607 % Crushed Particles LS-621 % Asphalt Coated LS-608 % Flat & Elongated Rating 305 10 26.7 8 7 9 87 307 10 27.5 9 10 9 94 308 10 27.5 10 10 8 94 309 10 29.5 8 10 8 94 310 9 28.4 10 8 10 93 311 10 28.1 8 9 9 92 312 8 24.5 10 10 10 89 313 10 29.2 10 5 10 92 314 10 20.5 10 10 4 78 315 2 27.8 0 10 7 67 316 10 21.3 10 10 10 88 318 10 26.5 8 7 10 88 320 10 23.7 9 6 10 84 321 9 26.2 8 10 7 86 322 9 14.2 1 10 6 57 323 10 24.8 8 10 10 90 324 10 27.8 10 4 10 88 325 9 27.0 10 10 9 93 326 10 23.5 1 10 8 75 327 9 28.9 10 10 10 97 328 10 30.0 10 10 10 100 329 4 28.1 9 10 5 80 331 10 28.6 8 10 0 81 332 7 21.5 10 10 10 84 333 0 26.5 10 10 10 81 335 9 28.6 3 5 9 78 337 10 25.4 9 0 7 73 339 10 29.2 10 9 8 95 340 8 28.6 5 10 10 88 MTO Aggregate and Soil Proficiency Sample Testing Program for 2013; MERO-048 - 122 - Appendix F2: Full Service Aggregate Laboratory Ratings FULL SERVICE AGGREGATE LABORATORY RATINGS 2013 Lab LS-601 LS-602 LS-603 LS-604 LS-606 LS-607 LS-621 LS-608 LS-618 LS-614 LS-605 LS-623 LS-619 Rating No. Wash Gradation LAA BRD/ABS MgSO4 % Crush % % Flat & MDA F/T BRD/ABS One-Point MDA Pass (CA) (CA) Asphalt Elongated (CA) (FA) Proctor (FA) 8 10 28.9 10.0 9 10 10 9 8 10 10.0 10.0 10 96 12 10 30.0 8.0 6 10 10 10 8 6 10.0 10.0 8 90 13 8 14.7 10.0 10 10 9 10 9 10 8.0 8.7 0 77 15 10 25.4 10.0 9 10 10 10 9 3 9.5 8.3 10 89 18 10 28.4 9.0 7 9 0 10 10 8 9.5 9.7 5 83 19 10 28.9 10.0 10 9 10 10 9 10.0 9.7 10 97 22 10 30.0 10.0 10 10 10 10 4 10.0 10.0 10 95 23 0 25.4 9.0 10 9 8 7 10 10.0 10.0 9 83 27 10 26.5 10 10 10 6 10 10.0 10.0 10 93 28 5 28.4 10 10 10 10 10 7.0 10.0 7 90 31 6 24.5 0 4.5 10 10 10 7 10 6 7.0 10.0 6 74 35 10 30.0 10 9.0 10 10 10 10 9 10 10.0 6.3 10 96 37 8 29.5 10.0 10 10 10 10 10 8 9.5 10.0 10 96 38 9 21.5 9.5 8 9 9 9 9 10 9.0 10.0 10 87 39 9 25.1 9 9 10 8 9 9.0 8.0 9 87 47 10 24.5 8 9.5 9 10 8 9 10 0 9.5 2.0 9 79 56 8 25.6 9 10.0 10 10 10 6 9 9 10.0 10.0 10 91 59 10 27.5 7.5 10 10 10 10 10 10 9.5 6.0 10 93 61 10 25.6 9.5 10 10 10 10 10 10.0 9.3 10 96 69 5 17.2 6.5 10 10 10 10 10 10.0 10.0 10 84 75 8 24.8 9.5 10 6 7 8 10 10 10.0 6.7 10 86 76 10 30.0 7.5 10 10 7 10 10 10 10.0 9 95 9 9 9.5 9 10.0 7 8.5 MTO Aggregate and Soil Proficiency Sample Testing Program for 2013; MERO-048 - 123 Lab LS-601 LS-602 LS-603 LS-604 LS-606 LS-607 LS-621 LS-608 LS-618 LS-614 LS-605 LS-623 LS-619 Rating No. Wash Gradation LAA BRD/ABS MgSO4 % Crush % % Flat & MDA F/T BRD/ABS One-Point MDA Pass (CA) (CA) Asphalt Elongated (CA) (FA) Proctor (FA) 79 9 29.7 80 9 25.1 83 8 86 90 98 10.0 10 8 9 10 9 10.0 9.0 10 95 9.0 6 10 7 9 9 7 7.5 10.0 8 84 27.3 9.5 10 9 9 10 10 9 10.0 10.0 10 94 7 25.6 8.5 9 10 10 10 5 2.5 9.7 6 79 10 23.5 9.0 9 10 0 8 9 5 75 5 27.3 8.5 10 8 10 4 6 10 3.5 3.0 4 71 101 9 27.5 9.5 10 10 10 10 10 9 9.5 10.0 10 96 102 10 24.0 10 5 10 10 10 7.0 8.3 10 87 107 10 22.6 8.5 10 10 6 10 9 10 9.5 108 10 28.1 10.0 9 9 10 10 5 110 9 23.5 9.0 9 10 5 10 10 112 7 23.5 10.0 8 0 9 9 114 9 27.5 10.0 5 10 10 120 10 27.8 7.5 9 9 121 10 29.2 9.5 10 124 10 25.4 7.5 157 10 14.7 7.5 164 8 28.4 172 9 15.8 177 8 28.6 10.0 183 10 27.3 9.5 188 8 28.4 9.5 199 6 30.0 205 10 216 217 245 10 10 9.0 6 10 89 9.5 10.0 10 93 9 10.0 10.0 10 89 9 10 6.5 10.0 10 80 10 9 10 10.0 6.0 10 90 8 10 10 10.0 10.0 8 92 10 10 10 8 10.0 8.3 10 96 6 8 10 1 9 10.0 8.0 10 81 10 10 8 10 9 10 8.0 9 82 7.5 7 9 10 10 10 8 10.0 10 91 6.0 10 9 9 9 7 9 8.0 9 79 10 10 10 7 10 10.0 9 94 9 10 0 5 10 9 10.0 10.0 8 84 8 10 9 10 9 10 10.0 8.0 10 93 9.5 10 10 10 10 10 10.0 10.0 10 97 27.3 9.5 10 0 10 10 8 10.0 8.3 10 87 8 28.1 10.0 9 10 9 10 9 10 10.0 10.0 10 29.7 10.0 10 10 10 10 7 10 28.4 5.0 8 9 7 6 10 9.0 257 10 19.1 10.0 10 8 9 10 10 10 260 6 16.6 4.0 10 9 8 10 8 3 10 9 9.3 8 94 10 95 10.0 6 83 10.0 7.0 10 88 7.5 10.0 8 72 7.5 MTO Aggregate and Soil Proficiency Sample Testing Program for 2013; MERO-048 - 124 Lab LS-601 LS-602 LS-603 LS-604 LS-606 LS-607 LS-621 LS-608 LS-618 LS-614 LS-605 LS-623 LS-619 Rating No. Wash Gradation LAA BRD/ABS MgSO4 % Crush % % Flat & MDA F/T BRD/ABS One-Point MDA Pass (CA) (CA) Asphalt Elongated (CA) (FA) Proctor (FA) 263 8 30.0 9.5 9 9 10 10 10 6 9.0 3.3 10 88 285 10 18.3 7.0 7 9 8 7 10 9 10.0 9.7 8 81 293 10 29.5 10.0 8 10 9 7 10 10 9.5 4.7 10 91 296 9 24.5 10.0 10 10 10 10 10 6.5 7.7 9 90 301 10 29.5 9.5 8 10 10 9 9 10 8.5 8.7 8 93 309 10 29.5 8.5 10 8 10 8 9 10 9.0 10.0 10 94 312 8 24.5 9.0 10 10 10 10 7 10 7.0 10.0 10 90 316 10 21.3 9.5 8 10 10 10 10 9 9.0 10.0 7 88 325 9 27.0 9.0 10 10 9 10 10 9.0 10.0 9 94 326 10 23.5 8.0 1 10 8 9 10 3.5 7.3 10 77 340 8 28.6 9.5 5 10 10 10 10 10.0 10 93 MTO Aggregate and Soil Proficiency Sample Testing Program for 2013; MERO-048 - 125 - Appendix F3: Soil Laboratory Ratings Lab No. 8 9 12 13 15 18 19 20 21 22 23 27 28 29 30 31 32 35 37 38 44 46 47 52 54 56 58 59 62 63 64 68 69 71 72 74 79 80 81 83 86 LS-702 Hydrometer Analysis 7.0 7.6 8.6 4.0 9.6 9.8 7.4 9.6 8.6 10.0 9.4 9.8 8.4 9.8 9.6 8.8 10.0 9.6 9.8 9.8 9.4 9.0 5.2 9.8 6.8 8.2 9.6 10.0 9.6 9.8 9.0 10.0 9.8 9.2 9.6 9.0 9.0 9.6 7.6 9.6 8.0 LS-703 & 4 Atterberg Limits 10.0 10.0 8.0 9.3 9.3 9.7 9.7 10.0 8.7 10.0 6.7 7.7 9.0 9.3 6.3 9.7 9.3 10.0 9.3 9.7 8.3 6.7 8.7 3.7 7.3 10.0 10.0 10.0 10.0 8.0 3.3 10.0 8.3 10.0 10.0 10.0 9.3 10.0 8.3 10.0 7.7 LS-705 Ratin g Specific Gravity 90 10 92 10 55 0 64 6 96 10 92 8 87 9 99 10 58 0 100 10 54 0 92 10 91 10 97 10 80 8 95 10 98 10 99 10 90 8 92 8 92 10 82 9 76 9 45 0 80 10 94 10 99 10 100 10 99 10 89 9 71 9 100 10 77 5 94 9 99 10 93 9 94 10 95 9 86 10 95 9 76 7 Lab LS-702 No. Hydrometer Analysis 98 8.4 101 8.6 102 7.4 108 3.8 112 8.2 114 8.8 120 9.4 121 9.4 138 10.0 139 10.0 144 6.8 146 8.2 149 9.6 159 8.6 168 9.4 170 9.2 171 1.8 172 9.6 183 9.6 188 10.0 195 9.4 208 7.2 210 10.0 216 10.0 253 6.2 260 9.4 261 9.8 266 8.2 276 10.0 284 7.6 285 8.2 287 8.2 296 10.0 300 8.8 301 6.4 307 9.8 312 9.8 315 4.4 320 9.2 326 8.8 LS-703 & 4 Atterberg Limits 4.7 8.0 10.0 2.3 7.3 9.7 10.0 10.0 9.0 8.3 10.0 6.3 8.7 10.0 10.0 9.7 8.0 9.0 10.0 10.0 10.0 8.3 10.0 10.0 7.0 6.0 9.7 7.0 9.7 10.0 10.0 10.0 10.0 10.0 9.7 8.7 9.0 9.3 8.3 6.7 LS-705 Specific Gravity 5 10 10 7 10 8 9 9 10 9 10 0 10 8 9 9 9 10 10 10 6 8 10 10 8 10 0 4 9 7 7 9 10 10 10 8 10 5 8 5 MTO Aggregate and Soil Proficiency Sample Testing Program for 2013; MERO-048 Rating 60 89 91 44 85 88 95 95 97 91 89 48 94 89 95 93 63 95 99 100 85 78 100 100 71 85 65 64 96 82 84 91 100 96 87 88 96 62 85 68 - 126 - Appendix F4: Superpave Laboratory Ratings Laboratory C1252/T 304 D2419/T 176 ASTM D5821 No. Uncompacted Sand Equivalent % Fractured Void Content Particles ASTM D4719 % Flat & Elongated Rating 12 8 8 10 10 90 13 15 18 19 20 21 22 25 26 27 28 31 33 35 37 39 43 47 56 58 59 61 62 69 71 75 77 79 80 86 101 108 112 114 9 9 10 10 10 7 9 9 10 10 4 3 10 10 10 10 9 10 10 10 10 10 10 9 7 9 10 10 8 5 10 10 10 10 7 8 10 10 6 8 8 10 10 10 9 10 7 10 10 6 9 6 10 10 7 10 10 10 6 10 8 10 9 10 3 7 10 10 2 10 10 10 10 8 10 10 10 10 10 10 9 10 10 5 10 10 10 10 10 10 8 10 8 0 9 9 10 5 10 10 2 10 10 10 10 10 10 7 10 10 8 8 9 9 10 10 10 9 6 10 5 10 10 10 10 10 10 10 8 9 10 10 9 10 10 8 70 93 100 100 90 75 93 98 95 95 80 80 90 100 100 75 85 90 88 100 93 100 95 98 78 73 88 95 93 75 80 93 80 95 115 9 9 10 10 95 MTO Aggregate and Soil Proficiency Sample Testing Program for 2013; MERO-048 - 127 - Laboratory C1252/T 304 D2419/T 176 ASTM D5821 No. Uncompacted Sand Equivalent % Fractured Void Content Particles ASTM D4719 % Flat & Elongated Rating 120 121 124 157 172 180 181 182 183 10 10 10 6 0 10 9 10 10 10 6 9 10 7 9 8 10 8 10 10 9 9 6 10 10 10 10 10 10 10 10 9 6 6 9 9 100 90 95 88 55 88 83 98 93 188 10 6 10 10 90 193 10 10 10 8 95 199 10 10 10 10 100 215 2 10 5 3 50 216 10 8 10 8 90 217 6 10 8 10 85 236 7 10 7 10 85 245 9 10 10 8 93 253 10 10 7 10 93 255 9 10 9 9 93 257 10 10 4 6 75 263 10 10 8 8 90 271 9 9 10 6 85 272 8 10 10 8 90 285 293 10 10 10 9 98 10 10 6 8 85 296 10 10 10 10 100 300 10 10 10 10 100 312 10 10 10 10 100 316 9 10 4 7 75 325 10 10 9 6 88 326 6 10 10 6 80 340 10 10 9 9 95 MTO Aggregate and Soil Proficiency Sample Testing Program for 2013; MERO-048
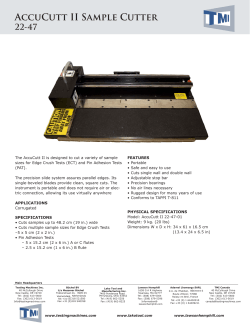


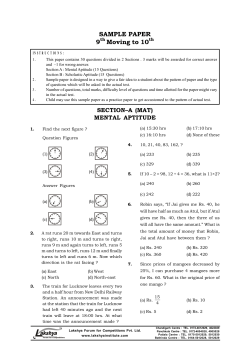

© Copyright 2026