
ANALYSIS OF RESULTS OF THE SAMPLE SURVEY ON FERTILITY PREFERENCES
ANALYSIS OF RESULTS OF THE SAMPLE
SURVEY ON FERTILITY PREFERENCES
OF ARMENIAN POPULATION
Yerevan 2009
1
Surveyt Name:
Sample Survey on Fertility Preferences of Armenian
Population
Implementation Period:
June-December 2009
Place of Implementation:
Yerevan and 10 Marzes of the Republic of Armenia
Implementing Parties:
Ministry of Labor and Social Issues of RA
National Institute of Labor and Social Researches
National Statistical Service of RA
Funded by:
United Nations Population Fund (UNFPA)
2
The Sample Survey on Fertility Preferences of Armenian Population was conducted by the National Statistical
Service of RA, the Ministry of Labor and Social Issues of RA and National Institute of Labor and Social
Researches during June-December 2009. The United Nations Population Fund (UNFPA), within the framework
of Population and Development (PD) Project has provided financial and technical assistance. The purpose of
the current Survey is to study the development of system of family values and reproductive behavior
motivations within current social and economic conditions, to identify and analyze main factors conditioning
family situation, to present recommendations for overcoming major problems.
Additional information on the Survey can be obtained at:
Ministry of Labor and Social Issues of RA
3 Government Building
Republic Avenue
0010 Yerevan, Armenia
Phone: (374 10) 56-53-65
Fax: (374 10) 56-37-91
National Statistical Service of RA
3 Government Building
Republic Avenue
0010 Yerevan, Armenia
Phone: (374 10) 52-39-27
Fax: (374 10) 52-19-21
UNFPA Armenia Country Office
14, P. Adamyan Street
0010 Yerevan, Armenia
Phone: (374 10) 54-34-16, 54-16-89
Fax: (374 10) 54-38-11
E-mail: [email protected], [email protected]
Views and opinions expressed in this Report belong to the authors and may not always reflect the ones of the
UNFPA.
3
Content
Page
Preface
Introduction
Goals and Objectives of the Survey
Sample Methodology
Description of the Sample Population
Main Demographic Terms Used in the Survey
SECTION 1 - SOCIO-DEMOGRAPHIC COMPOSITION AND STRUCTURE OF THE
HOUSEHOLDS AND FAMILIES
Chapter 1.1. Composition and Structure of the Households
5
6
6
6
7
8
Chapter 1.2. Population Distribution by Sex and Age
Chapter 1.3. Population Distribution by Ethnicity and Religion
Chapter 1.4. Distribution of Household Members by Marital Status
Chapter 1.5. Distribution of Household Members by Educational Level
Chapter 1.6. Distribution of Household Members by Socio-Economic Status
Chapter 1.7. Migration
SECTION 2 - EMPLOYMENT
SECTION 3 - INCOMES AND EXPENDITURES
Chapter 3.1. Incomes
Chapter 3.2. Expenditures
9
9
14
14
15
16
17
17
21
26
26
29
SECTION 4 - HOUSING AND DWELLING CONDITIONS OF THE HOUSEHOLDS
SECTION 5 - CARE AND UPBRINGING OF CHILDREN
33
SECTION 6 - HEALTH CARE SERVICES, PROVISION OF REPRODUCTIVE HEALTH
58
45
Chapter 5.1. Who and how much time spends on the upbringing of a child
45
Chapter 5.2. Availability of services which are necessary for child's upbringing and development,
estimation of their accessibility
55
Chapter 5.2.1. Estimation of Educational Services
55
Chapter5.2.2. Estimation of Cultural Services
56
Chapter 5.2.3. Estimation of Social Services
57
Chapter 6.1. Accessibility and Use of Health Care Services
Chapter 6.2. Reproductive Health
SECTION 7 - FAMILY VALUES, MARITAL AND REPRODUCTIVE
TRENDS, MOTIVATIONS (positive and negative)
Chapter 7.1. Family Values
Chapter 7.2. Decision Making
Chapter 7.3. Negative Motivation in Reproductive Behavior: Reasons, effects and needs
CONCLUSIONS
PROPOSALS
4
58
62
64
64
64
77
86
93
PREFACE
The final report of Survey on Fertility Preferences of Armenian Population is the result of joint
initiative of Ministry of Labor and Social Issues of RA, National Statistical Service of RA and
«Population and Development» Project of the United Nations Population Fund.
Conduction of the Survey is conditioned by vital changes in Armenian families, which took
place within past one and a half decades and influenced reproductive behavior of population.
Issues of socio-economic character, housing conditions, structures of expenditures and
incomes, migration and its influence on population reproductive behavior of households and families
constituting households were observed in this survey. The survey importance is stressed by the fact
that RA Government undertook active demographic policy. Particularly, on July 2, 2009 the
Government of the Republic of Armenia has approved and ratified Decree N27 on “Strategy of the
Demographic Policy of the Republic of Armenia and approval of Action Plan of its implementation”.
Results of the Survey may serve as a basis for presentation of concrete actions and
recommendations within the annual state programme directed to improvement of demographic
situation based on the Strategy of Demographic Policy of the Republic of Armenia. Results of the
survey may as well be useful for state government and self-administration bodies, non-governmental
organizations, as well as other interested institutions and individuals dealing with family issues.
5
INTRODUCTION
Within past fifteen years various surveys, statistical handbooks and yearbooks have been
published in relation to Armenian family, which brought forward certain separate issues of the latter.
A full and complex research of family related issues has been conducted in 2006. Results of
that research reflected the general situation, formed in the country, thus allowing to conclude, that
economical, political, public and cultural developments, that had taken place in our country ever
since it gained independence, continue to influence Armenian family, its composition, structure,
social and demographical status.
GOALS AND OBJECTIVES OF THE SURVEY
Goals of the survey
To study the development of system of family values and reproductive behavior motivations
within current social and economic conditions, to identify and analyze main factors conditioning
family situation, to present recommendations for overcoming major problems.
Objectives of the survey
•
•
•
•
Assessment of current social-demographic situation and developments in urban and rural areas.
Identification of current reproductive problems and peculiarities existing among urban and rural
families of the RA.
Assessment of components (economical, social, psychological) of reproductive behavior,
orientations, positive and negative motivations of the childbirth and influence of inter-family and
external factors, as well as identification of peculiarities among young families from urban and
rural areas of the RA marzes.
Identification of changes, peculiarities and needs existing in system of family/marriage values of
urban and rural young families.
SAMPLE METHODOLOGY
The sample was formed on the ground of address database of all households in Armenia,
created by the RA National Statistical Service based on the results of 2001 Population Census with
technical support of the World Bank.
Based on the goals and objectives of survey the stratification (layering) method of sample was
selected. For formation of sample the address database of all households of the republic was divided
into 48 stratas (groups), 12 of which are administrative districts of Yerevan.
In marz level households were divided into three categories: big cities with population of 15
thousands and more, other cities (population less then 15 thousands) and villages: Big cities composed
16 stratas. Only in Vayots Dzor marz there are no big cities. Villages and other cities composed 10
stratas.
A two-level random sample, stratified by marzes was formed in accordance with the given
division. All marzes, as well as urban and rural populated areas were included into the sample
6
population in the same proportion as urban and rural households form total number of households of
the republic. The sample includes 38 cities and 75 villages.
Populated areas were selected during the first stage as preliminary elements of the sample.
During the second stage households subject to survey were selected: 2800 households, 2030 of which
in urban and 770 – in rural areas.
DESCRIPTION OF THE SAMPLE POPULATION
Staff has been formed for conduction of this survey: interviewers, quality controllers (verifiers)
and coders. Prior the start of the survey training has been conducted for the staff implementing field
works in regard to the sample and order of filling out the questionnaires. Each interviewer has
presented the sample report together with the filled questionnaires.
The database of the survey was brought to the final form, data was transformed into SPSS for
WINDOWS format and aggregation of separate working files into one base was performed.
It was assumed, that in some cases questionnaires will not be filled due to either
refusal/absence of members of household or other reasons. Therefore, a reserve sample has been
formed in order to ensure the representativeness required.
Table 1 represents the number of surveyed households and structure as by marzes (Yerevan
has the largest ratio - 29.3%).
Table 1. Number of surveyed households and distribution by marzes
Marz
Yerevan
Aragatsotn
Ararat
Armavir
Gegharkunik
Lori
Kotayk
Shirak
Syunik
Vayots Dzor
Tavush
Total
Number of households
820
150
230
220
210
250
280
220
180
90
150
2800
7
Specific
gravity
within sample %
29.3
5.4
8.2
7.9
7.5
8.9
10.0
7.9
6.4
3.2
5.4
100
(ratio)
MAIN DEMOGRAPHIC TERMS USED IN THE SURVEY
Reproductive behavior - system of actions and relations within family (as well as extramarital)
leading to birth of certain number of children.
Quantitative and qualitative definiteness of need for having children is, correspondingly,
identified by concepts of reproductive commitment and reproductive motivations.
Reproductive commitment specifies the quantitative definiteness of need for having children.
Reproductive motivations identify qualitative side of need for having children, its substance.
Reproductive motivations, having independent psychological nature, also constitute
components of structure of reproductive commitments (behavioral, instigating component).
Within modern understanding reproductive or fertility motivations are subdivided into
economical, social and psychological components.
Nuclear family (from lat. Nucleus - core) - nuclear, simple family; main family, which consists
of married couple and children.
Incomplete nuclear family – a family, which consists of one parent and unmarried children.
Extended complex family – a family with three and more generations, consisting of brothers and
sisters, as well as of other relatives.
Need of having children – one of the social needs of an individual, which characterizes
peculiarity of reproductive behavior.
Ideal number of children – ideas of an individual in regard to preferable number of children in
family in general, in no consideration of different situations or personal preferences.
Required number of children – main characterization of reproductive behavior. During the
survey received as an answer to the following question: how many children the respondent is
planning or going to have in case of getting married.
Expected number of children – number of children an individual is estimating to have,
considering concrete situation and personal preferences.
8
SECTION 1
SOCIO-DEMOGRAPHIC COMPOSITION AND STRUCTURE OF THE
HOUSEHOLDS AND FAMILIES
Chapter 1.1. Composition and structure of the households
Based on the peculiarities of the given survey households (2,800) as well as families,
constituting those households (3,947) were surveyed.
Chart 1.1. Households as per the number of families, percent.
As it can be seen on the chart 1.1, prevailing majority of households consists of one (62.6%)
and two (33.7%) families, and the specific gravity of households, consisting of three and four families
is 3.7%.
According to survey results one household in average consists of 1.4 families, average number
of household members is 4.2 persons, average number of family members is 3.0 persons, and average
number of members in families with underage children is 4 persons.
Table 1.1. Distribution of households by number of members, percent.
Households consisting of
1
person
2800
8.1
Data of 2001
Census
11.0
7
8 and more
persons persons
Total
households
2
persons
3
persons
4
persons
5
persons
6
persons
11.2
14.6
22.8
18.8
15.2
5.8
3.5
100
12.8
13.2
22.0
18.6
11.9
5.8
4.7
100
According to the survey results, households consisting of 3-6 members were dominated (see
Table 1.1.) the specific gravity of them comprise 71.4% and compared to data collected from census of
2001, the given indicator (65.7%) is 5.7 percentage points lower. Share of the households, consisting
9
of one and two members, according to the survey results, is 4.5 percentage points lower compared to
data collected from Census of 2001, correspondingly from 23.8% to 19.3%.
Among almost three quarters of households, both in urban and rural areas, men are holding a
leading role, and average age of the latter in urban areas is 49.8 year and in rural areas - 52.9 years. It
is necessary to mention, that the average age of women, occupying leading position exceeds same
indicator among men, occupying leading position by almost 10 years: in urban areas - 59.8, and in
rural areas - 62.5 years.
Table 1.2. Distribution of household leaders by sex, average age and median
Head of Household
Sex, percent
Average age, years
Median, years
Urban
Man
Woman
74.6
49.8
49
25.4
59.8
60
Total
100
52.3
52
Rural
Man
Woman
75.1
52.9
50
24.9
62.5
65
Total
100
55.3
54
Data on sibling connections in regard to family leaders, collected during the survey, allowed to
classify surveyed households by family types. Taking into consideration the international experience
and framework of the survey research, the given research only referred to households with underage
children, which have been classified into three categories:
1. Nuclear family (parents with child(ren), at least one of whom is under 16 years of age)
2. Incomplete nuclear families (one parent nuclear family)
3. Extended complex family (three-generation family with at least child under 16 years of age,
which may also include other relatives).
Table 1.3. Distribution of surveyed urban and rural households by types of families with underage
children.
Household type
Urban
Rural
Total
Nuclear family
465
159
624
Incomplete nuclear family
49
14
63
Extended complex family
Total
684
1,198
293
466
977
1,664
466 (28%) of 1664 surveyed households comprised households from rural areas and 1198 (72%)
– households from urban areas. 37.5% of the mentioned families are nuclear, 3.5% - incomplete and
59.0% - extended complex families.
10
Among urban families 39% are nuclear, 4% - incomplete and 57% - extended.
Among rural families 34% are of nuclear type, 3%- incomplete and 63%- extended.
Considering the fact, that the survey sampling is representative, it can be stated, that prevailing
majority of families in the country – 59%, particularly 57% of urban and 63% of rural families have
three-generation (in some cases – four-generation) composition, continuing the tradition of Armenian
families, which has been formed during centuries.
It is worth mentioning, that 37.5% indicator, which is not low, may be even higher, if the
housing problem of new or young family, which intends to separate from the mother family, is solved.
Above mentioned conclusion is based upon significant number of responses given within this
survey (see corresponding section of part 7 of the given report).
Incomplete families are mostly divorced families or families with widowed member of family.
Nuclear families are families separated from the mother family, or, apparently, families that became
nuclear after the death of member(s) of older generation.
Data of Table 1.4., which indicates distribution of households by number of children and
families, constituting the latter, shows, that only in 56.5% of first families of households have
children, when among second families only 32.9% and among third families only 3.2% have children:
among families with children, if in the first those having adult children dominate (39%), than in the
second – those having underage children (29.5%).
Table 1.4. Number of children in families, in percentage (weighted indicators).
0 child 1 child 2
3
4
5 and more
child child
child
children
ren
ren
ren
First family
43.5
20.6
23.8
8.7
2.6
0.8
With adult children
60.7
21.2
14.1
3.4
0.6
With underage
73.2
12.2
10.6
2.7
1.0
0.4
Total number of
families
with
children
56.5
39.3
26.8
children
Second family
With adult children
With underage
children
Third family
With adult children
With underage
children
67.1
92.4
70.5
9.6
3.9
11.6
17.7
3.2
14.8
4.6
0.5
2.5
0.8
0.1
0.6
0.0
32.9
7.6
29.5
96.8
99.8
97.0
2.0
0.1
1.9
1.1
0.1
1.1
0.1
0.0
-
-
3.2
0.2
3.0
11
Chart 1.2. Distribution of families by number of underage children, urban/rural, in percentage
(weighted indicators)
100
90
80
70
70.1
68.5
64.8
60
48.0
50
40
31.5
60.8
52.0
35.2
29.9
39.2
30
20
10
0
1 child
Urban
2 children
3 children
4 children
5 and more children
Rural
The chart 1.2. clearly emphasizes the difference between tendencies of having children among
urban and rural families. So, among families having 1 underage child the specific gravity of urban
families is two times higher then such of rural families (urban 68.5%, rural 31.5%). Same picture can
be observed among families with two children (urban 70.1%, rural 29.9%).
Starting from families with 3 underage children the specific gravity of rural families begins to
exceed in regard with urban families. And as the number of children grows, this trend becomes more
obvious.
Table 1.5. represents the data on distribution of families in marzes of Armenia and the city of
Yerevan by number of underage children. The data indicates, that the specific gravity of families
drops drastically as the number of children grows; the largest gap between specific gravity indicatores
is observed in case of comparing families with 2 and 3 underage children.
Significant difference is observed also in specific gravity indicatores of families with 3 and 4
children. The largest gap between these indicatores is registered in Aragatsotn marz – 12% and in
Syunik marz – 10.5%, and the smallest gap – in Vayots Dzor marz (0.6%) and in Yerevan (3.5%).
12
Table 1.5. Distribution of families in marzes and Yerevan by number of children1, percent
Number of children in the family
2-3
3-4
1
5 and more
Marzes
2 children 3 children differe 4 children differe
children
child
nce
nce
Yerevan
48.1
45.9
4.5
40.4
1,0
3.5
0.5
Aragatsotn
45.8
39.6
14.6
25.0
2,0
12.6
0.6
Ararat
41.2
44.0
11.6
22.4
2.6
9.0
0.5
Armavir
49.3
38.4
9.3
29.1
1.4
7.9
1.5
Gegharkunik 40.5
41.2
13.6
27.6
4.6
7.0
0.0
Lori
39.7
39.7
11.4
28.3
7.2
4.2
1.9
Kotayk
31.4
55,6
9.6
46.0
3.0
6.6
0.4
Shirak
46.1 41.5
8.6
32.9
3.0
5.6
0.8
Syunik
45.9 41.4
11.6
29.8
1.1
10.5
0.0
Vayots Dzor 48.0
35.5
5.9
29.6
5.2
0.6
4.4
Tavush
32.4
54.2
13.4
40.8
4.7
8.7
0.0
Total
100 .0
100 .0
100 .0
100 .0
100 .0
100 .0
100 .0
100 .0
100. 0
100 .0
100 .0
Chapter 1.2. POPULATION DISTRIBUTION BY SEX AND AGE
Table 1.6. Distribution of respondents by sex and age (percent)
Sex
By survey
Data of 2001 RA
results
census
Total
100
100
Male
48.6
48. 0
Female
51.4
52. 0
Urban
100
100
Male
47.4
47.2
Female
52.6
52.8
Rural
100
100
Male
50.7
49.4
Female
49.3
50.6
By current calculation results,
as per 2009, January 1
100
48.4
51.6
100
47.6
52.4
100
49.9
50.1
As per Table 1.6., 48.6% of respondents were male, 51.4% - female, from statistical point of
view this data is almost the same as the data collected during current calculations of population (as per
1 January 2009). There is certain difference compared to the Census results to the benefit of women
(by 0.6 percentage points). Moreover, if in urban areas distribution of population by sex has changed
1
Taking into account the fact that the current survey is representative only on Republic, urban and rural levels, it is
necessary to consider marz level data with some reservations
13
insignificantly, in rural areas the change is noticeable – specific gravity of men exceeds the specific
gravity of women by 1.4%.
Age structure of household members is given in Chart 1.3.
Chart 1.3. Age distribution of surveyed population by sex:
14
12
10
8
6
4
2
0
0-4
'5-9 '10-14 15-19 20-24 25-29 30-34 35-39 40-44 45-49 50-54 55-59 60-64 65+
Total
Men
Women
36.4% of members of participating households with children are 0-17 years old (33.3% of
women and 39.7% of men), 54.2% are 18-59 years old (56.5% of women and 51.7% of men), and
9.4% - 60 and more years old (10.2% of women and 8.6% of men):
Table 1.7. Average age and median (years) of surveyed population
Total population
Urban population
Average age
29. 2
29.3
Median
27
28
Rural population
29.1
26
Average age of surveyed urban population almost does not differ from surveyed rural
population. Yet, median of urban population exceeds median of rural population by 2 years.
Chapter 1.3. POPULATION DISTRIBUTION BY ETHNICITY AND RELIGION
Chart 1.4. Distribution of households by ethnicity.
98.3
100
80
60
40
0.8
0.8
0.1
20
0
Armenians
Yesidi
Russians
14
Other
Vast majority (98.3%) of respondents are Armenians, as also reflected in the results of the
national Census of the Republic of Armenia of 2001 (97.3%).
98.2% are Christians. 97.8% of the latter stated, that they belong to the Armenian Apostolic
church. About 0.5% of respondents stated, that they belong to different sectarian groups, 1.2%
practice other religions, and about 0.1% consider themselves atheist (see Chart 1.5.).
Chart 1.5. Distribution of household members by religion (percent).
100
90
80
70
60
50
40
30
20
10
0
98.2
1.2
0.5
Christians:
,Apostolic,
,
Orthodox,
,
Catholic,
Protestant
0.1
Other
Sectarian
Atheist
Chapter 1.4. DISTRIBUTION OF HOUSEHOLDS BY MARITAL STATUS
Table 1.8. Marital status of household members, per cent
Married
Never
Widow/
married
Widower
Survey
72.1
16.6
8.6
Urban
72. 9
14.5
9.7
Rural
70.7
20.3
7.9
National Census of
26.4
8.5
2001 (15 and above
62.12
years old population)
Divorced Live together, no
registration of marriage
2.2
0.5
3,0
0.6
0.8
0.3
100
100
100
3.0
100
…
Total
According to the data brought in Table 1.8., 72.1% of respondents are married, which exceeds
the data collected during the census by 10%. The specific gravity of those never married according to
results of the RA Census of 2001 is 9.8 percentage points lower than the corresponding indicators
received in the result of the given survey, that of widows/widowers almost does not differ and the
specific gravity of divorced is correspondingly 0.9 percentage point lower. Percentage values
indicating marital status of respondents are certainly different, when we observe those in relation of
urban-rural data, for instance in urban areas, compared to rural areas the specific gravity of married
(2.2 percentage points), widows/widowers (1.8 percentage points), divorced (2.2 percentage points)
2
Those living together without registration of marriage inclusive.
15
and residing together (0.3 percentage points) are higher. However, the last two cases can be
conditioned by certain difference of attitude towards marital and familial values present in Armenian
village. Yet, in rural areas the specific gravity of those never married in rural areas exceeds the same
value for urban areas by 5.8 percentage points.
Analyzing the marital status of household members by sex, we can state the fact, that 82.5% of
men and 72.3% of women are married, the specific gravity of widows (14.2%) exceeds the same value
of widowers (3%) by 11.2 percentage points and the specific gravity of divorced, correspondingly by
3.1 percentage points (men -0.6%, women – 3.7%) (See Chart 1.6.).
Chart 1.6. Marital status of household members, by sex (percent).
100
80
60
82.5
70.3
40
20
14.2
13.3
0
11.3
Married
Never married
3.7
0.6
3.0
Widow/widower
Men
Divorsed
0.6
0.5
Living together
Women
When the data is observed by marital status in woman-man relation, the following picture can
be seen. 85% of women and 15% of men are widowed, 88% of women and 12% of men are divorced.
Prevailing specific gravity of women among widowed and divorced can be explained by relatively
high average life expectancy of women and by higher possibility of men getting married after wife’s
death or divorce.
Chapter 1.5. DISTRIBUTION OF HOUSEHOLD MEMBERS
BY EDUCATIONAL LEVEL
Educational level of 6 and more year old household members is given in Chart1.7.
Chart 1.7. Educational level of 6 and more year old household members, (percent)
16
Thus, 35.7% of 6 and more year old have secondary education, 15.2% have general education
18.5 % have secondary professional and incomplete higher education, 16.4% - have either a university
degree ore are post-graduates.
The picture of education level is significantly different, when observing it among household
members over 16 years old, which are reflected in chart 1.8.
Chart 1.8. Education level among 16 and over year old members of household (percent).
The specific gravity of household members above the age of 16 having no basic education
(including illiterates) is only 0.5%, those having secondary and secondary professional education
dominate (correspondingly 41.2% and 22.5%). It is remarkable, that over 1/5th of those above the
age of 16 have university degree or are post-graduates
Chapter 1.6. DISTRIBUTION OF HOUSEHOLD MEMBERS BY SOCIOECONOMIC STATUS
Chart 1.9. Distribution of household members by socio-economic status, percent
17
As it can be seen on the chart 1.9., respondents employed in both private and state sector
constitute 26.9%, self-employed - 15.7%, pensioners and beneficiaries - 25.1, not working
respondents, including unemployed -17.1% and housewives - 13.1%.
Chapter 1.7. MIGRATION
Qualitative and quantitative changes in migration processes in Armenia are among
consequences of social, economical and political changes, which have been taking place in the
country during last twenty years. Moreover, the negative impact of migration, particularly – interstate
migration of individuals of reproductive age, especially men, and their long-term absence from their
families immediately influences reproductive behavior of population. Survey results indicate that
household members absent for three months and longer constitute 3.4% of total number of household
members: 67.9% of which were in Russian Federation, Ukraine and other CIS countries, around 1.8%
- the USA and European countries. Furthermore, as indicated by results of various surveys conducted
during these twenty years and confirmed by the results of the given survey, that main migration route
from the Republic of Armenia is towards the Russian Federation – 61.7% of absent household
members reside there (See Chart 1.10.).
Chart 1.10. Members of household absent for three and more months by residence, percent
Other countries
2.9
0.5
USA
1.3
European countries
4.9
Other CIS countries
1.3
Ukraine
Russian Federation
Other village in Armenia
61.7
9.8
Other City in Armenia
Yerevan
0
11.4
6.2
10
20
30
40
50
60
70
Observation of migration flows by residence area indicates significant differences. So, the flow
from urban areas to capital Yerevan and other cities of RA is relatively large – 20.8% and to other
villages of RA – 13.7%. This indicates that employment possibilities even in other cities of RA are
higher than in rural areas. External migration from villages is higher and it is directed at Russian
Federation and other CIS countries – 78% (See Chart 1.11.). Moreover, if in urban areas 34.5% of
household members absent for three months and more are involved in internal migration processes,
in rural areas this indicator is 20%.
18
Chart 1.11. Household members absent for three months and more (urban/rural breakdown) by place
of residence (percent).
Majority of household members absent for three months and more stated employment as the
main reason for absence: for 60.6% - paid employment, for 4.2% - entrepreneurship, as illustrated in
Chart 1.12.
Chart 1.12. Household members absent for three months and more by reason of absence, percent.
Employment
21.2
Entrepreneurship
Education
1.3
Personal reasons
6
2.5
4.2
60.6
Family circumstances
Treatment
4.2
Other
The specific gravity of those absent due to personal reasons, family circumstances and medical
reasons is 9.8%. The household member responding instead of 21.2% of absent household members
stated other reason of absence, however it can not be excluded that among the latter can be absent
persons because of employment reasons.
19
SECTION 2 - EMPLOYMENT
47.4% of able bodied members of surveyed households are employed, 52.6 % - unemployed.
43.1% of able bodied household members have secondary, 22.8% - secondary professional, 22.1% higher professional and 0.7% - postgraduate education.
Among total number of employed individuals 17.5% have secondary, 10.4% - secondary
professional, 14.3% - higher professional and 0.3% - postgraduate education. This is to say, that 24.7%
of employed (89.0% of total number of employed individuals) have professional qualifications.
In regard to the age, average age of employed individuals having professional qualification are
within 39-41 age group, and the average age of total number of employed individuals are within 34-54
age group.
Table 2.1. 16-63 year old members of surveyed households by economic activity status, education
and age (weighed per republican indicators).
Economic activity status
Education
Average age
N
Total %
Unemployed
1. no basic education
2. basic (1-3 grades)
3. general (4-8 grades)
4. secondary (9-11 grades)
5. primary professional
6. secondary professional
7. incomplete higher
8. higher professional
9. postgraduate
Total
1. no basic education
2. basic (1-3 grades)
3. general (4-8 grades)
4. secondary (9-11 grades)
5. primary professional
6. secondary professional
7. incomplete higher
8. higher professional
9. postgraduate
Total
1. no basic education
2. basic (1-3 grades)
3. general (4-8 grades)
4. secondary (9-11 grades)
5. primary professional
6. secondary professional
7. incomplete higher
8. higher professional
9. postgraduate
Total
25,4
39,6
30,6
31,4
36,0
35,4
21,0
33,5
29,4
32,3
53,7
38,7
42,0
39,0
41,8
40,9
35,0
38,9
33,8
39,6
36,2
39,4
37,0
34,5
39,0
37,9
23,0
37,0
31,5
35,8
2031
2612
29459
369439
23419
179191
35277
112661
5298
759387
1250
917
38061
253260
24274
149767
5624
205942
4815
683910
3281
3530
67520
622699
47693
328958
40901
318603
10113
1443298
0.1
0.2
2.0
25.6
1.6
12.4
2.4
7.8
0.4
52.6
0.1
0.1
2.6
17.5
1.7
10.4
0,4
14.3
0.3
47.4
0.2
0.2
4.7
43.1
3.3
22.8
2.8
22.1
0.7
100.0
Employed
Able-bodied
20
Employed individuals have relatively young age: 21-39.6. Private employers of the Republic
mostly present following employment requirements: young, good-looking, computer literate, in
certain cases – with excellent knowledge of foreign language, high qualification and work experience.
Available labour force is unable to meet these requirements simultaneously. Work experience is
available mostly among economically active population of middle and older age.
Women significantly dominate among job seekers, especially among unemployed population.
Among women there are a significant number of those economically inactive (able-bodied but not
looking for a job); this is mostly conditioned by involvement in upbringing of underage children.
Employment of women also has its peculiarities connected with combination of professional activity
and familial responsibilities. Reproductive behavior of the population is influenced by the fact, that
the issue of combination of parental and employment responsibilities of employed women and
women conducting their own business is not solved. Problems rising from this reality become
especially urgent today, under the conditions of globalization of economy.
Different surveys indicate that the level of economically activeness of 18-20 year old men and
women is practically almost equal. However, birth of the first child forces the woman to leave her job
and undertake child care. Often successful, rather well-paid women are facing a choice between
marriage and career. Often women choose the latter. Birth of second and following children is
making the situation all the more complicated.
Unemployment rate is an important indicator, which characterizes employment rate in the job
market.
Notwithstanding the trend of decrease of unemployment rate, observed during the past few
years, the latter still remains quite high in accordance with results of regularly conducted
international surveys.
The unemployment rate in the republic is assessed in two different manners. First: official
unemployment, officially registered by the state unemployment service, which is defined by relation
between officially registered unemployed and economically active population. Second: the actual
unemployment, which is defined by sample surveys of labour force and mostly corresponds with
standards of International Labor Organization (ILO).
The official (registered) unemployment rate in the republic as per the 31 of December of 2009 is
7.1% against 6.3% in the beginning of the year, and the real unemployment rate according to the
sampling survey of labour force comprised 29.6%.
As indicated in Table 2.2. 2446 (49.2%) of 4967 able-bodied household members of sampling are
unemployed, number of women among which almost twice exceeds the same indicator among men
(69.1% of unemployed are women, 30.9% - men).
Table 2.2. Distribution of household members by employment and sex, percent
Able-bodied
Calculation
Not working
Number
% by sex
% by status
% of able-bodied
Man
Woman
755
30.9%
32.7%
15.2%
1691
69.1%
63.7%
34.0%
21
Total
2446
100.0%
492%
49.2%
Employed
Unemployed
Total able-bodied
Number
1468
850
2318
% by sex
63.3%
36.7%
100.0%
% by status
% of able-bodied
% by status
63.5%
29.6%
88
43.3%
3.8%
32.0%
17.1%
115
56.7%
4.3%
46.7%
46.7%
203
100.0%
4.1%
% of able-bodied
1.8%
2.3%
4.1%
Number
% by sex
2311
46.5%
100.0%
46.5%
2656
53.5%
100.0%
53.5%
4967
100.0%
100.0%
100.0%
Number
% by sex
% by status
% of able-bodied
There are 203 unemployed in the households (115 women and 88 men).
Chart 2.1. Employment of the household members by types of economic activity
Economic activity
Not working
Other
Low enforcement agencies
Enterpreneurship
Judicial agencies
Banking system (finance)
Computers, internet
Social service provision
Communal services
Construction
Industry
Transport and communication
Agriculture
Trade and utility services
Science and culture
Healthcare
Education
State and local administration
%
34.5
0.6
2.5
1.5
0.7
0.7
0.7
0.8
1.7
5.9
3.7
4.2
19.1
9.8
1.4
3
5.1
2.8
0
5
10
15
20
25
30
35
40
As indicated on Chart 2.1. 19.1% of able-bodied members of household are employed in
agricultural sector, 9.8% - in trade and utility service filed, 5.9% - on construction, 5.1% - in
educational sphere. Employment in other spheres is low - 4 %.
22
Chart 2.2. Employment of household numbers by spheres of economic activity
13.3
Not working
0.8
1.3
0.5
1
1.7
Low enforcement agencies
Communal services
Construction
Transport and communication
1.1
2
0.8
Agriculture
1.3
Industrial
Trade and utility services
0.7
Healthcare
Education
1
State and local administration
Rural
Urban
0
16.9
3.2
2.5
21.6
2.4
5.6
1.7
1.7
2.6
1.4
5
10
15
20
25
This proportion, except agriculture, mostly remains same in urban/rural comparison (See Chart
2.2.).
Number of men employed in state sector exceeds specific gravity of women by 12.4% and in
private sector – correspondingly three times. In relation to entrepreneurship, the specific gravity of
men three times exceeds the specific gravity of women.
Table 2.3. Description of employment household members (man/woman) (%)
Nature of employment
Employee (wage-earner)
Employee (wage-earner) in private sector
Self-employed
Entrepreneur
Pensioners
Student / pupil
Unemployed
Housewife
Not working
Man
Woman Total
56.2
43.8
100.0
% in column 18.5
12.4
15.2
% in row
23.4
100.0
% in column 25.4
6.6
15.3
% in row
61.7
38.3
100.0
% in column 23.7
12.5
17.7
% in row
22.2
100.0
% in column 1.9
0.5
1.1
% in row
41.2
58.8
100.0
% in column 11.6
14.1
12.9
% in row
71.3
100.0
% in column 2.1
4.4
3.3
% in row
56.8
100.0
% in column 3.6
4.0
3.8
% in row
0.5
99.5
100.0
% in column 0.2
27.4
14.8
% in row
67.0
100.0
% in row
23
76.6
77.8
28.7
43.2
33.0
Military service
Total
% in column 10.4
18.0
14.5
% in row
0.7
100.0
% in column 2.7
0
1.3
% in row
53.9
100.0
100.0
100.0
99.3
46.1
% in column 100.0
Due to the difficult social-economic conditions and significant gap between supply and
demand in the labor market, conditioned by problems of finding a job, for many individuals, even
those holding a university degree having just any job is a priority, and not its correspondence to
professional skills, preferences and educational level.
24
SECTION 3 - INCOMES AND EXPENDITURES
Chapter 3.1. INCOMES
The income of household is one of the main indicatores for assessment of the living standards
of population. Within the given survey incomes of households include various monetary inflows,
including types of social support. Monetary incomes of households consist of monetary and natural
products (in monetary expression) inflows, which are received by household members as salary, from
self-employment or entrepreneurial activity, as property rent, selling of agricultural products, social
supports, pensions, as well as from relatives and allowances, received from charity organizations or
sums, received as other monetary income.
In the below-presented Chart 3.1. structure of monthly household incomes are shown.
Chart 3.1. Structure of Household Income
Other
monetory
support
9%
Salary
21%
Relatives living
outside Armenia
16%
Relatives living in
Armenia
4%
Pension
9%
Other incomes
12%
Scholarship
2%
Family benefit
8%
Benefit from other
sources
6%
Enemployment
benefit
6%
Child care benefit
7%
As it can be seen from Chart 3.1. sources of household incomes are: salary - 21%, monetary
support from relatives 20% (from those living abroad - 16%, from relatives living in Armenia - 4 %),
other monetary support - 9%, other incomes - 12%, state social allowances constituted 38% of
incomes of surveyed families.
The results of current survey indicate that the specific gravity of state social allowances
(including state support) in income of families still remains high and significantly exceeds (in this case
– by 17%) the specific gravity of salary. In regard to the mentioned specific gravity of salary within
incomes of households, we consider it worth mentioning, that it remains rather low, which is
conditioned by low salaries and low level of employment.
Sizes of salaries were also covered by the current survey.
25
Charrt 3.2. show
ws, that only
y 1.2% of respondents
r
get 200,000 AMD salaary and higgher, 3.3%
r
receive
150,000 – 200,000 AMD, 188.2% receivee 75,000 – 100,000
1
AM
MD, 17.4% reeceive 50,0000 – 75,000
A
AMD,
and over
o
half of families
f
(50.3%) receivee less than 50,000
5
AMD
D wage per month.
m
C
Chart
3.2. Distribution
D
of
o salaries of
o household
d members by
b sizes
0.9 0.3
3.3
3
9..7
18.2
2
5
50.3
17.4
Below 50
0.000
50.000 – 75.000
0
75.00
01 – 100.000
150.001 – 200.000
200.001 – 300.0
000
300.0
000 and more
100.001 – 15
50.000
Calcu
ulations ind
dicate that salary of aro
ound 86% of
o working family
f
mem
mbers does not
n exceed
1
100,000
AM
MD.
Viabiility of fam
milies in thee country to
t significan
nt extent iss provided by monetaary means,
r
received
from
m householld members living outsiide Armeniaa. 20.0% of respondents
r
s mentioned
d receiving
s
some
kind of monetarry support. It is wortth mentioniing, that monetary
m
su
upport received from
r
relatives
doees not have regular
r
natu
ure and mon
nthly amoun
nts in averagge equal 35,000 AMD.
Tablee 3.1. reflects average monthly
m
inccomes per 1 member off household
d distributed
d by urban
a rural areeas.
and
T
Table
3.1. Av
verage month
hly income off 1 household
d member by
y urban and rural
ru distributtion, percentt
URBAN/ RU
URAL MA
ARZES
Urban
Yerevan
Araagatsotn
Araarat
Arm
mavir
Gegharkunik
Lorri
Kotayk
Shiirak
Syu
unik
Vayots Dzor
Tav
vush
Average
inco
ome
318995
238443
293993
230221
266667
229550
189331
205665
289008
206004
199119
26
Number
householdss
417
33
59
72
84
107
152
80
71
20
31
of % in total number of
h
households
2
26.4
2
2.1
3
3.7
4
4.6
5
5.3
6
6.8
9
9.6
5
5.1
4
4.5
1
1.3
2
2.0
Rural
TOTAL
TOTAL
Aragatsotn
Ararat
Armavir
Gegharkunik
Lori
Kotayk
Shirak
Syunik
Vayots Dzor
Tavush
TOTAL
Aragatsotn
Ararat
Armavir
Gegharkunik
Lori
Kotayk
Shirak
Syunik
Vayots Dzor
Tavush
TOTAL
TOTAL
26447
20217
23044
15140
24933
23179
30911
23290
26947
19500
17246
23108
31895
22281
26681
19312
25938
23030
22817
21638
28340
19970
18840
25490
1126
25
44
64
61
57
73
52
29
27
21
453
417
58
103
136
145
164
225
132
100
47
52
1579
71.3
1.6
2.8
4.1
3.9
3.6
4.6
3.3
1.8
1.7
1.3
28.7
26.4
3.7
6.5
8.6
9.2
10,4
14.2
8.4
6.3
3.0
3.3
100.0
Average incomes of families living in different areas are significantly different. As it can be
seen in the Table 3.1., in urban areas average monetary income per one individual is 26,000 AMD and
in rural areas 23,000 AMD.
In Yerevan average monetary income for one person is 32,000 AMD, in cities of Ararat marz –
29,500 AMD and in cities of Gegharkunik marz – 27,000 AMD.
Certain differences were registered both in rural and urban areas of marzes. Average income in
Armavir villages is 0.65 times lower than average indicator in villages of other marzes and is the
lowest among same indicatores of certain villages.
Indicators in Tavush, Vayots Dzor and Aragatsotn marzes are quite low, correspondingly 0.7,
0.8 and 0.9 times lower than indicators of other villages. In urban areas on mentioned marzes average
income for one individual is also the lowest compared to cities of other marzes. Average income for
one individual in Kotayk marz is 19,000 AMD, which is the lowest indicator.
In general, the average indicator of average income per one person in urban and rural areas of
Armenia is lower than average national basket of goods, and in separate cases – lower than minimum
food basket.
27
C
Chapter
3.2. Expend
ditures
Next indicator describing
d
th
he material situation off householdss – expendittures of hou
useholds, is
p
presented
in
n this analyssis through consumer
c
exxpenses. Th
he survey cov
vered all typ
pes of expen
nditures of
h
households.
There are payments
p
m
made
for prod
ducts purch
hased duringg one month
h, as well ass payments
f long-term
for
m use produ
ucts and ritu
ual services.
Acco
ording to survey
s
resu
ults only 5.2% (urban
n residents - 4.9%, rural
r
resideents 5.7%)
m
mentioned
t
that
incomees are sufficcient to coveer all types of expendittures and fo
or saving ass well (See
C
Charts
3.3. an
nd 3.4.).
C
Chart
3.3. Peercentage raatio of thosee satisfied with
w incomess.
2.8
8.5
5.2
46.6
37
Su
ufficient, even have
e some amounts for
f saving
Su
ufficient only for most necessary exp
penditures
Su
ufficient only to purchese food
Inssufficient, get supp
port from relatives
s
Inssufficient, surviving
g only with state support
s
“Suffficient only for necesssary expend
ditures” optiion was sellected by 46.6%
4
of reespondents
(
(urban
resid
dents 49%, ru
ural residen
nts 41.7%).
“Inco
omes sufficieent only to purchase fo
ood” option was chosen
n by 37.0% of
o respondeents (urban
r
residents
- 33.4%,
3
rural residents - 44.1%).
The total
t
value of
o “Insufficieent” optionss almost equ
uals to 12%.
28
Chart 3.4. Percentage ratio of those satisfied with incomes by urban and rural breakdowns
3.4
Insufficient, surviving with state support
2.5
5
Insufficient, get support from relatives
10.2
44.1
Sufficient only to purchase food
33.4
41.7
Sufficient only for most necessary expenditures
49
5.7
Sufficient, even have some amounts for saving
Rural
Urban
4.9
0
10
20
30
40
50
60
The percentage ratio of those satisfied with incomes as per family types (See Table 3.2.) are
mostly preserved, but they indicate vulnerability of incomplete nuclear families. Thus, 36.2% of
incomplete nuclear families mentioned that their incomes are insufficient for covering current
expenditures and they only survive either with state support or with help of relatives.
Responses to “Are the incomes of your household sufficient for covering expenditures?” question were
distributed as follows:
“Sufficient, even have some amounts for saving” option was chosen by 78 of 1664 families
included in the sampling, or 5.2% of families.
Positive response to this question was given by 5.7% of nuclear families involved in the sample
and by 5.1% of extended complex families.
29
T
Table
3.2. Percentage
P
ratio
r
of thosee satisfied with
w incomes by family types.
Family typees
R
Responses
Incom
mplete
Nuclear
nucleaar
Nu
umber
32
2
% in row
40.7
1.3
S
Sufficient,
ev
ven have so
ome
a
amounts
forr saving
% in
5.7
1.9
collumn
Nu
umber
314
14
% in row
39.0
1.9
S
Sufficient
on
nly for the most
m
n
necessary
exxpenditures
% in
49.5
24.5
collumn
Nu
umber
191
23
% in row
31.7
3. 7
S
Sufficient
on
nly to purch
hase
f
food
% in
31.9
37.4
collumn
Nu
umber
67
18
% in row
43.0
12.0
Insufficientt, get support
f
from
relativees
% in
9.9
27.6
collumn
Insufficientt, surviving only
Nu
umber
20
6
w state alllowance
with
% in row
38.7
11.3
% in
2.9
8.6
collumn
Nu
umber
624
63
% in row
36.7
3.7
T
Total
% in
100.0
100.0
collumn
Extended
d
complex
44
58.0
T
Total
5.1
55.2
468
59.1
7796
1100.0
46.1
446.6
374
64.6
5588
1100.0
40.1
337.0
71
45.0
1156
1100.0
6.4
88.5
20
50.0
446
1100.0
2.3
22.8
977
59.6
11664
1100.0
100.0
1100.0
As itt shall be in
ndicated also
o in furtherr parts of th
he current survey, the economic factor still
m
maintains
itss importancce in differen
nt family isssues.
C
Chart
3.5. Ho
ow many respondents hav
ve planned expenditures related to ch
hildcare?
30
0.4
57
7.1
Yes
1
12.5
P
Partially
No
30
778
1100,0
Chart 3.6. How many respondents have planned expenditures related to childcare by urban and rural
breakdowns?
70
58.3
56.5
60
50
40
30.8
29.5
30
20
12.7
12.2
10
0
Yes
Partially, planned only important
expenses
No
Urban
Rural
Table 3.3. Sources of expenditures for childbirth and childcare (%)
Percentage of
reimburseme
nt of
expenses
0
100
Sources of expenditures
Own savings
Support from
relatives
State allowances
Other sources
59.1
40.9
81.7
18.5
93.9
6.1
98.9
1.0
Table 3.4. Sources of expenditures for childbirth and childcare (%)
Rural
Percentage of
reimburseme
nt of
Own savings
expenses
Support from
relatives
State
allowances
Other sources
0
100
39.0
27.3
53.3
13.1
63.6
2.7
65.9
0.4
0
100
20.1
13.6
28.4
5.3
30.3
3.3
33.0
0.6
Sources of expenditures
31
SE
ECTION 4
H
HOUSING
AND DW
WELLING CONDITIO
C
ONS OF THE
T
HOUSSEHOLDSS
Whille estimatin
ng the demo
ographic sittuation and expected development
d
ts particularrly among
p
population
and the mo
otivations of
o fertility preferencess, the experrts from diffferent countries pay
s
special
atten
ntion to the indicator off adequacy of
o housing and
a dwellin
ng condition
ns, which is one of the
c
components
s of family welfare. In
n the curreent part of the survey
y the resultss of observ
vations are
p
presented
in
n order to esstimate the housing and
d dwelling conditions
c
o the houseeholds invollved in the
of
s
sample.
All th
he househo
olds covered
d by the sam
mple have reeplied to th
he question regarding the type of
d
dwelling
(1000%). Accorrding to thee analysis off survey datta 51% of su
urveyed hou
useholds resside in the
p
private
housses, while 45%
4
- in thee apartmentt houses, 2%
% - in the dormitories
d
, 2% - in th
he wagonh
houses
or in the temporrary dwellin
ngs (See Chaart 4.1.).
C
Chart
4.1. Ty
ypes of the dwellings of the househ
holds
2% 2% 0.1%
51%
45%
%
Privatte House or a part of it
Apartame
ent
Dormitory
Wagon/House
Other
The results
r
of qu
uestions ask
ked regardin
ng the owneership of thee dwellings show that 96%
9
of the
h
households
r
reside
in thee main/perm
manent housses and only
y 4% of the households live in the temporary
d
dwellings.
Charrt 4.2. show
ws that 91%
% of dwellin
ngs are priv
vate or priv
vatized by the Govern
nment. Six
p
percent
of th
he household reside in the rented dwellings. One percen
nt of the hou
useholds resside in the
d
dwellings
off state owneership and two percen
nt of them live in the other
o
housees, particularly, in the
h
houses
of their relativess absent from
m the Repub
blic for a lon
ng time.
32
C
Chart
4.2. Ty
ypes of own
nership of th
he households
6%
1%
2%
91%
Private
Rented
Public
Other
Acco
ording to thee analysis off the answerrs to the queestion regarrding havingg other prop
perty, 33%
o the surveeyed househ
of
holds have stated
s
that they
t
don’t have
h
any pro
operty otheer that theirr dwellings
(
(See
Chart 4.3.).
4
Based on the results of the su
urvey, Chartt 4.3. presen
nts the data on the typees of other
p
property
of the
t househo
olds.
C
Chart
4.3. The
T availabillity of otherr property of the househ
holds
31.3
3
32.4
17.9
12.2
2.1
0.4
Land
Private car
2.0
2
Agricultural
A
equipm
ment
1
1.8
Agricultura
al land
Trade and
a service
Indu
ustry
Other
D
Don't
have
The data on pro
ofitable pro
operty show
ws that the 31% of ho
ouseholds haave private plots and
1
12.2%
of hou
useholds haave agricultu
ural lands.
In orrder to estim
mate dwelliing and hou
using condiitions of th
he household
ds from thee different
m
marzes
coveered by the sample the question on number of
o rooms of the dwellin
ngs of houseeholds has
b
been
asked. 99.8% of the
t selected
d household
ds have replied to the above-men
ntioned question. The
b
breakdown
o househollds by the nu
of
umber of ro
ooms of the dwellings
d
iss presented in
i the Chartt 4.4.
33
C
Chart
4.4. Number
N
of ro
ooms in the
38.3
40
35
23.9
30
20.8
25
20
15
10
7.
6.3
5
5 rooms
4 rooms
3 rooms
2 rooms
1 room
0
Charrt 4.4. show
ws that 6.3%
a
apartments,
83% of fam
milies reside
T averagee indicators on living flo
The
p
presented
in
n the Tables 4.1. and 4.2
T
Table
4.1. The
T living flo
oor space pe
L
Living
floor space
s
per capita
< (severely overpopulated
<0.5
d)
0
0.5-0.99
(overp
populated)
1
1-1.48
(in acco
ordance with living space qu
1
1.5-1.96
(satisffactory conditiions)
> (underpop
>=2
pulated)
T
Total
Meanings of
o conditionaal signs broug
• <0.5…
………………..up to 4.5
• 0.5-00.99…………
…...4.5-8.99
• 1 – 1.48…………
……9 – 13.4
……13.5 – 17
• 1.5 – 1.96………
………………
…..18 m2 and
• >=2…
Acco
ording to th
he comparat
l
living
space quota per capita defin
(
(35.4%)
fam
milies out of 1664 survey
c
compliance
with the deefined livin
a severely overpopulaated (4.5 m2
are
Chart 4.5. The living floor space per capita in the Republic
%
Situation with living floor space security per capita
by defined standards
100
31.4
29.4
20.1
15.3
3.8
0
Severely
overpopulated
(<0.5 )
Overpopulated
(0.5-0.99)
In accordance
with standard
(1-1.48 )
Satisfactory
conditions
(1.5-1.96)
Under-populated
(>=2 )
Table 4.2. The living floor space per capita based on the living space quota (defined as 9 m2 per capita)
by urban and rural breakdowns
Correlation of
living floor space
and living space
quota per capita
< 0.5
0.5 - 0.99
1 - 1.48
1.5 - 1.96
Families
Total
Urban
Rural
Number of families
55
8
63
Percent, total
87.3
12.7
100.0
Percent distribution among 4.6
urban and rural families
1.7
3.8
Number of families
420
81
501
Percent, total
83.8
16.2
100.0
Percent distribution among 35.1
urban and rural families
17.4
30.1
Number of families
381
142
523
Percent, total
72.8
27.2
100.0
Percent distribution among 31.8
urban and rural families
30.5
31.4
Number of families
171
78
249
Percent, total
68.7
31.3
100.0
Percent distribution among 14.3
urban and rural families
16.7
15.0
35
>=2
Total
Number of families
171
157
328
Percent, total
52.1
47.9
100.0
Percent distribution among 14.3
urban and rural families
33.7
19.7
Number of families
1198
466
1664
Percent, total
72.0
28.0
100.0
100.0
100.0
Percent distribution among 100.0
urban and rural families
Situation with living floor space security per capita differs depending on urban and rural
households (see Charts 4.6. and 4.7.).
Chart 4.6. Situation with living floor space security per capita in the urban and rural areas
Situation with living floor space security per capita
by defined standards: 9m2
100
90
80
70
60
50
40
30
20
10
0
35.1
33.7
31.8 30.5
17.4
14.3 16.7
14.3
4.6 1.7
<0.5
0.5-0.99
1-1.48
1.5-1.96
>=2
Urban
Rural
Thus, 55 dwellings out of 63 above-mentioned severely over-populated dwellings of the
families, and 420 dwellings out of 501 over-populated dwellings of the families are located in the
urban area, which means that around 40% of surveyed urban families are in extremely bad housing
conditions.
36
Chart 4.7. Situation with living floor space security per capita in the rural areas
Situation with living floor space security per capita
by defined standards: 9m2
100
90
80
70
60
50
40
30
20
10
0
33.7
30.5
17.4
16.7
1.7
<0.5
0.5-0.99
1-1.48
1.5-1.96
>=2
Rural
From this point of view the situation with living floor space security per capita is relatively
moderate among families residing in the rural areas. 19.1% of dwellings among surveyed rural families
are severely over-populated and over-populated. The level of living floor space security per capita,
particularly, 18 m2 and more per capita is significantly high in the rural areas and comprises 33.7% out
of total number of dwellings of surveyed families residing in the rural areas, while in the cities this
indicator is twice low and comprises 14.3%.
25 nuclear families (4%) out of 624 nuclear families with the living floor space per capita of
4.5m2 have 134 family members (which is 5% out of 2703 total number of nuclear family members).
37 families (3.8%) out of 977 extended complex families have same living conditions, with 146 family
members (which is 4% out of 3,679 members of extended complex families), see Tables 4.3. and 4.4.
Table 4.3. Situation with living floor space security per capita by defined standards, types of families
and number
Types of
families
Nuclear
families
Incomplete
nuclear
families
Extended
complex
Number,
Living floor space per capita
Total
0.50.99
1-1.48
1.51.96
>=2
People
of 25
162
211
99
127
624
4.0
26.0
33.8
15.9
20.4
100.0
17
16
7
22
63
% in incomplete
1.6
nuclear families
27.0
25.4
11.1
34.9
100.0
of 37
322
296
143
179
977
percent
Number
families
% in nuclear
families
Number
families
Number
<0.5
of 1
37
families
families
%
in
extended
complex
families
the
Number
families
Total
People
3.8
33.0
30.3
14.6
18.3
100.0
of 63
501
523
249
328
1664
% in the types
of families
100.0
100.0 100.0
100.0
100.0
100.0
%
in
defined
standards
3.8
30.1
15.0
19.7
100.0
the
31.4
There are 754 people (27.9%) in 162 (26.0%) nuclear families, where living floor space per
capita is 4.5 – 9m2. The situation is the same with 322 (33%) extended complex families with 1,243
family members (33.8%).
Table 4.4. The situation with living floor space security by types of families and number of family
members
Living floor space per capita
Number,
Total
Types of
0.51.5<0.5
families
Percent
People
1-1.48
>=2
0.99
1.96
Nuclear
families
Incomplete
nuclear
families
Extended
complex
families
Total
People
Number of
members
134
754
889
407
519
2703
% in nuclear
families
5.0
27.9
32.9
15.1
19.2
100.0
Number of
members
8
57
47
17
60
189
% in incomplete
nuclear families
4.2
30.2
24.9
9.0
31.7
100.0
Number of
members
146
1243
1100
537
653
3679
% in the
extended
complex families
4.0
33.8
29.9
14.6
17.7
100.0
Number of
members
288
2054
2036
961
1232
6571
% in the types of
families
100.0
100.0
100.0
100.0
100.0
100.0
% in the defined
standards
4.4
31.3
31.0
14.6
18.7
100.0
38
Though the number of incomplete nuclear families is low and there are significant differences
in the proportions of family types, however, the situation with living floor space security per capita by
the presented standards is almost equally distributed among all types of families excluding those 22
incomplete nuclear families with living floor space of 18m2 and more, which comprise 34.9% in their
cohort.
Chart 4.8. The correlation of all types of severely over-populated and over-populated families
Correlation of severely over-populated and
over-populated families (%)
100.0
80.0
60.0
40.0
20.0
33.0
27.0
26.0
4.0
3.8
1.6
0.0
Nuclear families
<0.5
Not complete nuclear
Extended complex
families
0.5-0.99
According to the results of current survey one can be assured that nowadays in the Republic
there are quite serious problems related to the housing, especially among multi-members and multichildren families. The housing problem is also very essential for newly formed young families.
For the families with poor housing conditions the birth of each additional child is more worsening the
existing situation and very often the housing problem is the main constraint for not having desired
number of children. We will talk about the above-mentioned in the part related to “Family values,
marriage and reproductive orientations, motivations”.
For the estimation of housing and dwelling conditions of the households the availability of
amenities in the dwelling is very important.
The summarized results of the current survey are presented below in the tables.
Table 4.5. Which kind of amenities are absent in the dwelling
Absence of amenities in the dwellings
Types
Kitchen
Flashed toilet
Bathroom
Telephone
Internet
Centralized supplying with water
%
3.2
25.0
15.1
18.0
87.3
5.7
39
Centralized sewerage system
Tap hot water
Centralized supplying with gas
Garbage disposer
Centralized heating
Private heating system
Other
22.6
54.0
13.2
26.7
95.0
58.8
90.9
Table 4.6. The level of satisfaction with living conditions among urban and rural families
Levels
Less than minimal
Minimal
Average
Normal
Urban
Rural
Urban
Rural
Urban
Rural
Urban
Rural
1.2%
19.3%
4.8%
31.0%
14.1%
22.1%
80.0%
27.5%
In order to estimate the housing amenities of the households covered by the sample four
groups of indicators have been selected and the summarized responses are presented below:
1. 1.2% of urban families and 19.3% of rural families covered by the survey are living in the less than
minimal living conditions.
2. 4.8% of urban families and 31.0% of rural families have minimal living conditions such as
availability of kitchen, flashed toilet, sewerage system and garbage disposer.
3. 14.1% of urban families and 22.1% of rural families have average living conditions such as
availability of kitchen, flashed toilet, sewerage system, garbage disposer, telephone and tap hot water.
4. 80% of urban families and only 27.5% of rural families have normal living conditions such as
availability of kitchen, flashed toilet, sewerage system, garbage disposer, telephone and tap hot water,
bathroom, shower, centralized supplying with gas and water.
According to survey results the necessary housing and living conditions of majority of the
surveyed families are far from being satisfactory; moreover, 20.5% of surveyed families don't have
even minimal housing and living conditions.
All the above-mentioned becomes obvious while analyzing and estimating the situation with
availability of heating system and tap water within the households. The selection and availability of
type of heating system during winter in the households is important indicator for estimation of living
resources, housing and living conditions of the households. The results of survey on the mentioned
needs show that 95.0% of surveyed families don't have centralized heating system and 58.8% of
families don't have private heating system.
Although 94.3% of families have centralized supplying with water, 25.0% of surveyed families
don't have flashed toilets in the dwellings, 54.0% of surveyed families don't have tap hot water, 15.1%
don't have bathroom. Most probably it is conditioned with the fact that the centralized sewerage
40
ssystem is ab
bsent amongg 22.6% of dwellings (mainly
(
in the
t rural arreas). Besidees, 13.2% off surveyed
f
families
don
n't have centtralized supp
plying with gas.
It is necessary
n
to
o mention that
t
the availability of heating
h
systtem and tap
p water is co
onditioned
w not only with cen
with
ntralized sup
pplying with
h water and
d gas in the dwellings, but
b also witth material
o
opportunitie
es of familiees. More thaan 80.0% off dwellings in the urbaan areas are provided with
w
water,
a
around
90.0%
% are provided with gaas and only 45.0%
4
of surveyed famiilies are ablee to use tap hot water.
R
Regarding
th
he mention
ned needs th
he results off survey sho
ow that thee majority of
o surveyed families is
n even ablle to obtain water boilers.
not
The place of reesidence of the family
y with the availability
y of social infrastructu
i
ure, socialp
psychologica
al ahmosph
here and trraditions pllays essentiial role in the proceess of familly natural
d
developmen
nt, formulatiion of reprod
ductive beh
haviour of an
n individuall.
The studies
s
havee been cond
ducted to ideentify the leevel of socio
o-economic interest of the family
t live in thee given regiion. 56.0% of
to
o surveyed families gav
ve positive answers,
a
27..0% - negatiive answer
a 17.0% had
and
h difficultties to answ
wer to the fo
ollowing queestion: “Wo
ould they orr their child
dren desire
t continue to live in th
to
he same areaa of residencce?”
Chart 4.9. According
C
A
to
o responden
nts of the surrvey - “Wou
uld they or their childrren desire to
o continue
t live in thee same area of residencee?”
to
17%
27%
56%
%
Ye
es
No
Difficu
ult to answer
In reesponse to the
t question
n “What is the reason
n that they or their ch
hildren don’t want to
c
continue
to live in the same
s
place of residencee” 21.3% of respondentts have men
ntioned the absence of
a
appropriate
job. It is necessary to mention
m
thatt according to the resullts of not on
nly the curreent survey
b also oth
but
her surveys and studies the majorrity of respondents irrrespective of age, sex, status and
s
socio-econom
mic problem
ms consider appropriatee job as a do
ominant reaason. In otheer words th
he majority
o populatio
of
on thinks th
hat job and
d personal earning
e
is the
t main gu
uarantee fo
or well-bein
ng of their
f
families.
Thuss, in responsse to the ab
bove-mentio
oned questiion 15.4% of
o responden
nts considerr the high
l
level
of pov
verty as the second resp
ponse and 14.9%
1
of resspondents have
h
mentio
oned the ign
norance to
t solution
the
n of problem
ms of young families, 122.8% of resp
pondents haave mention
ned the unsatisfactory
41
conditions of socio-economic and modern communicationof their place of residence. 11.6% have
mentioned current housing problems.
Chart 4.10. According to respondents of the survey - “What is the reason that they or their children
don’t want to continue to live in the same place of residence?”
Other
1.5
Housing problems available
11.6
No conditions for young families to conduct
business
Attention is not paid to solution of problems of
young families
4.3
14.9
Poverty level is high
15.4
No suitable private job
21.3
No health care services
2.7
No educational institutions of different levels
7.3
Transportation services are not provided
1.7
No conditions for cultural values and spare time
6.7
No socio-economic and communication
conditions of the place of residence
12.8
0.0
%
5.0
10.0
15.0
20.0
25.0
It is logical to clarify the upcoming activities and and future of families of the respondents.
Taking into account current difficulties, as well as the difficult socio-economic situation of the
Republic, it is necessary to forecast the developments of new migrational waves among different
cohorts of population, their volumes and trends, to study the intensity of attitude to migrate, the
motivations of migrants and their social status.
From this point of view as the first step the respondents were asked about their desired place
of residence according respondents’ opinion.
42
C
Chart
4.11. Data
D on the desired placce of residen
nce of the reespondents
Desired pla
ace of resid
dence
4
Yerev
van
12
2
39.2
Marz Center
Russian Federation
Any European
E
country
27.4
USA
12.6
Otherr
4.8
44% of the respo
ondents don
n’t see their future
f
in Arrmenia.
In th
his case thee geographiical location
n is not very essentiall due to th
he fact that 27.4% of
r
respondents
mentioned
d any Europeean country
y as a desired
d place to liv
ve. This ind
dicator is twiice as high
a the one fo
as
or Russian Federation
F
as a desired place
p
to live.
Of co
ourse, not all of them will
w leave th
he country. There will be many reeasons for no
ot leaving.
A
Although
th
he migratio
onal attitud
des will leav
ve serious consequesn
nces and it will have its direct
i
influence
on
n the reprod
ductive behaaviour of Arrmenian pop
pulation.
43
SECTION 5 - CARE AND UPBRINGING OF CHILDREN
The solution of problems related with care and upbringing of child is one of the most
important pre-conditions influencing on the positive or negative motivations of reproductive
behaviour. Particularly, they are as follows:
• Who and how much time spends on the upbringring of a child,
• Availability or absence of institutions rendering pre-school services in the given region,
• Availability of opportunities to receive educational, cultural and social services for
development and upbringing of a child.
Chapter 5.1. Who and how much time spends on the upbringing of a child
While studying family and family relationships the researches define two types of relationships
between spouses – jointly and separately. However, these two types of relationships have compound
and complex nature.
Usually within the family there are four types of inter-relationships: care and upbringing of a
child, housework, decision-making (particularly, regarding the financial issues) and organization and
spending of free time.
Within the framework of the above-mentioned, one of the most important goals of the current
survey is to clarify how women having children under 17 years old distribute their duties related with
care and upbringing of children among their spouses and other members of their families.
Due to the fact that «care and upbringing of children» requires plenty of time and efforts, it
was analysed from care providers' point of view /i.e. among family members who and how much time
spends on upbringing of children/.
Table 5.1. Who and how much time spends on care and upbringing of children (level of participation,
estimation, percentage)
Doesn't deal with
upbringing
Spends very
little time
Spends
little time
Spends
enough time
The main
person dealing
with
upbringing
Mother
0
0
2
8
90
Father
4
13
20
46
17
Grandmother
17
13
17
37
16
Grandfather
25
21
19
28
7
Household other
28
16
21
28
7
member
44
School
7
9
25
54
5
Kindergarden
25
11
13
46
6
Baby-sitter
86
2
4
7
1
According to the opinion of 90% of the repondents the main person dealing with upbringing
of child is mother. 17% of the respondents think that the main person dealing with upbringing of
child is father. However, it doesn't mean that in this case mother is leaa dealing with care and
upbringing of child. It simply means that father is the main person dealing with upbringing of child
together with mother. According to the above-mentioned among 17% of families there are egalitarian
relationships and equal/almost equal distribution of work between spouses regarding care and
upbringing of children.
According to the opinion of almost half (46%) of the respondents fathers spend enough time
on upbringing of child/children.
By the way, both urban and rural respondents have estimated the level of participation of
mother as a very high in the care and upbringing of child. Regarding the participation of father there
are obvious difference in the opinions. In comparison with urban respondents rural respondents have
higher estimated the level of participation of father in the care and upbringing of child (See Table
5.2.).
Table 5.2. Who and how much time spends on care and upbringing of children (level of participation,
estimation, urban/rural, percentage)
Doesn't deal with
upbringing
Spends very little
time
Spends little time
Spends enough
time
The main person
dealing with
upbringing
urban
rural
urban
rural
urban
rural
urban
rural
urban
rural
Mother
0
0
0
0
2
1
8
9
90
90
Father
5
4
13
12
22
17
45
47
15
20
Grandm
18
16
11
18
17
16
36
38
18
12
27
20
20
22
19
20
28
30
6
9
other
Grandfa
45
ther
8
5
8
12
26
23
53
55
5
5
School
18
43
8
18
17
2
50
35
7
2
Kinderg
80
93
4
0
4
4
9
3
3
0
Househ
old
other
member
arden
It is quite natural that within the nucreal family the level of participation of both mother and
father in care and upbringing of child is higher than in extended complex families /See Tables 5.3. and
5.4./.
Table 5.3. Within the nuclear family how much time mother and father spend on upbringing of child
/the level of participation, estimation, percent/
Doesn't deal with
upbringing
Spends very
little time
Spends
little time
Spends
enough time
The main
person dealing
with
upbringing
Mother
0
0
1
7
92
Father
2
11
19
46
22
Table 5.4. Within the extended complex family how much time mother and father spend on
upbringing of child /the level of participation, estimation, percent/
Doesn't deal with
upbringing
Spends very
little time
Spends
little time
Spends
enough time
The main
person dealing
with
upbringing
Mother
1
0
2
9
88
Father
5
14
21
46
14
73% of the respondents are satisfied with the above-mentioned distribution of duties, 14% had
difficulties to answer and another 14% stated that it would be desirable if father will spend much time
on care and upbringing of child.
Work overload of parents (especialy fathers) has been mentioned as one of the main reasons
for not spending enough time on upbringing of children /see Charts 5.1, 5.2./.
46
Chart 5.1. The main reasons for not spending enough time on care and upringing of children by
parents
Occupancy of child's father
57,6
Series1
19,2
Series1
Urban
Rural
57,6
19,2
Chart 5.2. The main reasons for not spending enough time on care and upringing of children by
parents
Occupancy of child's mother
7,2
2,9
Urban
Series1
7,2
Series1
Rural
2,9
37% of respondents estimated the level of participation of grandmothers and 28% of
respondents estimated the level of participation of grandfathers in upbringing of children as
satisfactory.
Respondents from rural areas as opposed to urban ones have given lower estimate to the level
of participation of grandmothers in care and upbringing of children and higher estimate to the level of
participation of grandfathers in care and upbringing of children /see Table 5.2./.
Nuclear families have stated that grandmothers and grandfathers have very small participation
in care and upbringing of the children. The situation is opposite among extended complex families:
around 48% of them have mentioned that grandmother spends enough time with child and 39% have
expressed the same opinion about grandfathers /See Tables 5.5. and 5.6./.
47
Table 5.5. How much time grandmothers and grandfathers spend on upbringing of child in the
nuclear families /level of participation, estimation, percentage/
Doesn't deal with
upbringing
Spends
very little
time
Spends
little time
Spends
enough
time
The main
person dealing
with
upbringing
Grandmother
57%
21%
14%
4%
2%
Grandfather
59%
24%
12%
4%
1%
Table 5.6. How much time grandmothers and grandfathers spend on upbringing of child in the
extended complex families /level of participation, estimation, percentage/
Doesn't deal with
upbringing
Spends
very little
time
Spends
little time
Spends
enough
time
The main
person dealing
with
upbringing
Grandmother
4%
10%
17%
48%
21%
Grandfather
9%
19%
23%
39%
10%
54% of respondents are satisfied with the level of participation of schools in the upbringing
process of children and 46% of respondents are satisfied with the level of participation of
kindergartens in the upbringing process of children. By the way, as opposed to the rural respondents
urban respondent have higher estimated the role of kindergartens in the upbringing process of
children. The above-mentioned is obvious as there are only few villages having kindergartens. In case
of schools the situation is opposite: the rural respondents have given higher importance to the role of
schools in comparison with urban respondents /see Table 5.2./.
25% of respondents have stated that schools have low participation in the upbringing of
children.
In general, the nuclear families as opposed to extended complex families have higher estimated
the level of participation of school and kindergarten in the process of upbringing of children /See
Tables 5.7. and 5.8./.
Table 5.7. According to the opinion of nuclear families how much time school and kindergarten spend
on the upbringing of children /the level of participation, estimation, percent/
Doesn't deal with
Spends
Spends
Spends
The main
upbringing
very little
little time
enough
person dealing
time
time
with
upbringing
48
School
5
8
26
56
5
Kindergarten
30
11
10
42
7
Table 5.8. According to the opinion of extended complex families how much time school and kindergarten
spend on the upbringing of children /the level of participation, estimation, percent/
Doesn't deal with
upbringing
Spends
very little
time
Spends
little time
Spends
enough
time
The main
person dealing
with
upbringing
School
9
11
23
51
6
Kindergarten
22
11
14
48
5
Institutions rendering the pre-school services are available at 84% of living settlements /such a
high percentage is due to the urban areas/, however, only 17% of the respondents use them /See Chart
5.3./.
Chart 5.3. Institutions rendering pre-school educational services which are available at the living
settlement
Institutions rendering pre-school educational services
which are available at the living settlement
64,0
Series1
19,8
Series1
Urban
Rural
64,0
19,8
The main reason of not using is not having children of pre-school age or the fact that the other
household members take care for a child (15%). By the way, such a response is more common for
urban respondents rather that for rural ones (see Chart 5.4).
49
Chart 5.4. Main reasons for not using the pre-school services
There is no child of pre-school age
51,0
Series1
17,0
Series1
Urban
Rural
51,0
17,0
22% of users have faced difficulties related with the fee and 8% of users are not satisfies with
the quality of services.
At the same time 60% have mentioned that there are no problems with the use of pre-school
services.
The number of respondents used services of baby-sitter is very low. Those are mainly nuclear
families living in urban areas /See table 5.2./.
Chapter 5.2. Availability of services which are necessary for child's upbringing and estimation
of their accessibility
5.2.1. Estimation of Educational Services
80% of the respondents have estimated the opportunities and accessibility of state schools as
satisfactory or good. Very often the state schools are the only ones, there are no any communities or
private schools among around 90% of settlements, or people are not aware about their existence.
There are no any state secondary specialized institutions in more than half of the living
settlements, there are no community secondary specialized institutions in 89% of the living settlements
and there are no private secondary specialized institutions in 74% of the living settlements. Around
10% of the respondents have stated that they are not aware about their existence.
There are no state higher educational institutions at around 65% of living settlements and there
are no private higher educational institutions at 61% of living settlements. The respondents have given
equal estimates (mainly as satisfactory or good) to opportunities and availability of both state and
private higher educational institutions. 18% of respondents have stated the above-mentioned opinion.
The situation with opportunities to receive additional knowledge (classes and etc.) is not also
satisfactory. Thus, 68% of the respondents have mentioned that there are no such state institutions in
their places of residence, 84% have mentioned that there are no such community institutions, 56% there are no such private institutions. According to the above-mentioned it can be concluded that the
private sector has the highest representation in this sphere.
50
The opportunities to receive additional information (internet clubs, computer halls) are also
provide by the private sector. There are private internet clubs and computer halls among more than half
of places of residence. The opportunities and availability of those have been estimated as «satisfactory or
good» by around 40% of the respondents.
5.2.2. Estimation of Cultural Services
53% of respondents stated that there are no public libraries in their places of residence, amother
8% are not aware about their existance. 49% of respondents stated that they don't have community
libraries and around 7% of respondents are not aware about their existence.
The accessibility of community libraries has been estimated higher in comparison with the state
libraries.
Only 33% of living settlements are provided with the state museums /these are only in the urban areas/.
Only 22% of the respondents have given «satisfactory or good» estimate to the accessibility of museum
services. There are no private museums located out of Capital city.
57% of respondents have mentioned there are no state musical schools and 7% of them were
not aware about their existence. 16% of the respondents have estimated the accessibility of state musical
schools as satisfactory and 10% - as good. The number of community musical schools is less: there are no
community musical schools at 64% of places of residence. The private musical schools are almost not
available or are very few, only 8-9% of the respondents have mentioned about their existence.
The situation related with art schools is almost same or even worse. They are available only at
one fourth of the living areas. In case of availability of the above-mentioned schools only one fifth of the
respondents have estimated their accessibility as «satisfactory of good».
The number of people aware of musical schools is very low. Due to the mentioned reason the
respondents have faced difficulties to estimate the level of opportunities and availability of those schools.
The situation is almost the same with the cultural higher educational institutions. These institutions are
absent or the majority of respondents are not aware about them. Due to this reason the respondents have
faced difficulties to estimate their opportunities and accessibility.
The availability of national handicraft centers is mainly provided by the private sector. By the way the
accessibility of all state, community and private centers has been estimated as not too high – around 10
percent.
The opportunities to receive additional cultural knowledge and organization of spare time are also
provided by the private sector.
51
5.2.3. Estimation of Social Services
The majority of institutions rendering legal consultancy is private and their accessibility is almost
twice higher as opposed to the state and community institutions.
There are almost no institutions rendering psychological services or most often the respondents
are not aware about their existence.
The institutions rendering daily care and services to the elderly and children have been rarely
mentioned. There are several possible reasons for the above-mentioned:
• These institutions are not demanded /particularly in rural areas/
• People are not simply imformed about them
• Care is being implemented by friends or by other members of household.
The Government is the main provider of medical means and other supplementary accessories to
people with disabilities. Though, the accessibility of those was not highly estimated – only 12% of the
respondents considered them as satisfactory.
Regarding the provision of in-kind assistance the population has often mentioned and more
satisfactory estimated the assistance provided by the private sector.
Regarding the financial assistance (which is certainly conditioned by the availability of family
benefits) the assistance provided by Government has been mostly mentioned, though its accessibility has
been estimated as quite low – only 5% of the respondents have estimated it as satisfactory.
52
SECTIION 6 - HE
EALTH CA
ARE SERV
VICES,
PROVISSION OF REPRODU
R
UCTIVE HEALTH
H
Chap
pter 6.1. Acccessibility an
nd Use of Health Care Services
S
Healtth care prov
vision of po
opulation, the
t problem
ms related with
w
the avaailability, acccessibility
a quality improvemeent are conssidered as priority and are constan
and
ntly reflecteed in the po
olitical and
s
strategic
doccuments relaated to the health care sector, as well
w as they are mostly covered
c
by state goalo
oriented
pro
ograms. Thu
us, it is extreemely imporrtant to estimate the reproductive behavior, av
vailability,
a
accessibility
and quality
y of health care
c
servicess through naation-wide surveys
s
amo
ong the userrs.
Curreently in Armenia the provision
p
off health carre includingg reproductiive health iss provided
b primary health
by
h
care//ambulatory
y-polyclinic and hospitaal institution
ns.
Prim
mary level includes 467 health
h
care institutions
i
providing ambulator-p
a
polyclinical services in
A
Armenia
and
d 638 mediccal obstetriccal units worrking in alm
most all rurall communitties.
The following indicator has
h been used
u
in ord
der to estim
mate physiical accessib
bility and
a
availability
o health caare: the availlability of in
of
nstitutions rendering
r
health care seervices in th
he place of
r
residence
off the respond
dent.
Acco
ording to th
he analysis of responsees of 1664 surveyed faamilies on physical
p
accessibility,
a
availability
a quality of medical care, the qualitative
and
q
in
ndicators off medical caare are quitee high.The
v majority
vast
y of the respondents (996.5%) havee mentioned
d that there are instituttions renderring health
c
care
servicess available in
i their placces of resideence and on
nly 54 famillies (3.5%) have
h
stated about the
a
absence
of the above-m
mentioned ones (See Chart
C
6.1.). 38 surveyed rural fam
milies (7.8%
%) and 16
s
surveyed
urrban familiees (1.3%) haave mention
ned that th
here are no health caree institution
ns in their
p
places
of ressidence. Wee can consid
der that the above-ment
a
tioned phen
nomenon is due to theirr low level
o awarenesss (See Chartt 6.2.).
of
Charrt 6.1. Availaability of insstitutions reendering heaalth care serrvices
1610, 96.8%
54, 3.2
2%
Absence off institutions rend
dering health carre services
Availability
y of institutions re
endering health care
c
services
53
C
Chart
6.2. Availability
A
of
o institution
ns renderingg health carre services by urban and
d rural break
kdowns
3 70.4%
38,
%
16
6, 29.6%
Ru
ural
Urba
an
The abse
ence of of in
nstitutions re
endering hea
alth care serv
vices , n=54
m
part of
o responden
nts not having medical care institu
utions in theeir places off residence
The main
(
(83.4%)
has prefered to the medicaal care centeers of the neearest villagge or town. Only
O
of 2.2%
% of them
h applied to
has
t the mediccal care insttitutions of the
t Capital City.
C
Acco
ording to thee analysis off urban/ruraal breakdow
wn of physiccal accessibillity of mediical care, it
c mention
can
ned that amo
ong rural reespondents the
t accessibility is around six timess lower in comparison
w urban ones
with
o
(1.3% and
a 7.8% acccordingly).
C
Chart
6.3. Ph
hysical acceessibility of medical
m
caree by urban and
a rural brreakdowns
7.8%
1
1.3%
Rural
Urb
ban
A parrt of 16 urbaan families (six
( familiess) which aree not attacheed to any heealth care in
nstitutions,
h
have
applied
d to the amb
bulatory of the nearest village or to
own in ordeer to receivee medical caare. At the
s
same
time the
t majority
y of the respondents (447.1%) has applied to the
t medicall institution
ns of Marz
c
centers
or Capital
C
City. In the rurral areas thee majority of
o residents (96.7%) haas mainly used health
c
care
institutions of the nearest
n
town
n or Marz center.
q
of medical
m
care was estimaated as good
d and satisfactory by 233.2% and 65.8% of the
The quality
r
respondents
accorgingly
y, and only 8.3% of theem has estim
mated it as bad
b (See Chaart 6.4.). Acccording to
t analysis of quality of medicall care by th
the
he place of residence it
i can be sttated that th
here is no
s
significant
d
difference:
The
T quality
y of medicaal care was estimated as
a satisfacto
ory by 100%
% of rural
r
respondents
and by 95.4
4% of urban
n responden
nts.
54
C
Chart
6.4. Esstimation off accessibilitty of health care servicees by users
6
65.8%
8.3%
23.2
2%
Good
Satisfactory
Bad
n identified
d by askingg the follow
wing question to the
The prevalence of deseasees has been
of survey: if
r
respondents
i any memb
ber of the household
h
had a seriouss health prob
blem duringg last year.
A
Almost
each
h third respo
ondent (30.0%) has meentioned thee availabilitty of any heealth related
d problem.
T
This
indicattor is higherr with 4.8%
% among urb
ban respond
dents in com
mparison wiith rural resspondents.
T majority
The
y (75%) of respondents
r
having heaalth problem
m was adults above 19 yeears old.
C
Chart
6.5. Th
he frequenccy of occurreence of heallth related problems
p
70%
%
30%
Have problem
p
Don't ha
ave problem
Only
y 25% of you
ung populattion has had
d health prob
blems, of wh
hich 11% beelongs to agge group of
00-6. This indicator sign
nificantly deepends on the
t urban or rural placce of residen
nce. Accord
ding to the
r
results
of su
urvey the halth
h
probleem has beeen recored among urb
ban populatiion under age
a of 18,
m
moreover,
w
within
age groups
g
of 6--14 and 15-18. It shoulld be mentioned this in
ndicatot is twice
t
high
a
among
urbaan respondents. Howev
ver, among population
p
over age 633 this indicaator is loweer with 1.5
t
times
in com
mparison witth rural pop
pulation.
55
C
Chart
6.6. Age
A structuree of respond
dents havingg health prob
blems
25%
2
75%
A
Adult
Not adult
a
a
to th
he medical institutionss has made payments.
The majority off respondentts (64.1%) apllied
R
Regarding
th
his indicato
or there is no
n differencce by urban
n and rural breakdowns
b
s, it compriised 62.6%
a 67.7% accordingly
and
a
and
a for parttial paymentt - 12.2% an
nd 9.5% acco
ordingly.
C
Chart
6.7. Paayment for medical treaatment by urban
u
and ru
ural breakdo
owns
Urban
R
Rural
12.2%
9.5%
%
67.7%
62.6%
Paid
Pa
artially paid
Paid
Partially paid
d
One of the mostt important indicators on
o the estim
mation of qu
uality and acccessibility of medical
c
care
is the in
nvolvementt of patientss, which is the
t percenttage of popu
ulation having diseases applied to
t medical institutionss for this heaalth problem
the
ms. In case of
o availabilitty of health
h related pro
oblems one
o of eigh
out
ht respondents hasn't applied forr medical care
c
and th
he majority
y of them (80%) has
m
mentioned
the lack off financial resources as
a the main
n reason fo
or not apply
ying and for
fo 8.4% u
unreliability
y to effectiv
veness of medical care. There is no
n significan
nt differencce by urban and rural
b
breakdowns
s regarding this
t indicato
or.
56
C
Chapter
6.2.. Reproductiive Health
The Governmen
G
nt of the Rep
public of Armenia has approved
a
an
nd adopted “The nationaal program
o reproducctive health improvemeent, the straategy and tim
on
me schedulee 2007-20155” by N-29 Decree on
2
26.07.2007.
m
p
program
theere are num
mber of imp
plemented
Within thee frameworrk of the mentioned
a
activities
dirrected to thee improvem
ment of qualiity and acceessibility of reproductiv
ve health, paarticularly,
t the accesssibility of ob
to
bstetrical care.
On 1 of July, 20
008 the Statee Birth Certtificate Proggram has beeen introducced, which is directed
t the rendeering of mosst accessiblee and free of charge obstetrical carre for womeen. During the
to
t second
q
quarter
of 2008 for the implementtation of thee above-men
ntioned Pro
ogram the fiinancing of additional
o billion AMD
one
A
has been implem
mented direccted to the conduction
c
of prenatall care and particularly
t the increaase of salariees of in-patient medicall workers.
to
Irresp
pective of financial
f
crisis, financin
ng process is
i still ongoiing and in year
y
2009 1.6
1 and 6.5
b
billion
AMD
D have been
n allocated for ambulattory and in--patient obsstetrical carre respectiveely, which
f exceeds the
far
t level of financing by
y many times allocated during 2000-2006.
T implem
The
mentation prrocess of thee Program iss under the direct mon
nitoring of th
he Ministry
y of Health
o RA (MoH
of
H of RA) and
d the survey
y results prov
ve the data of MoH aud
dit.
A
Among
16644 surveyed families theere are 2788 families deealt with ob
bstetrical caare on pregn
nancy and
d
delivery.
Th
he above-meentioned gro
oup of families are the users
u
of reprroductive heealth servicees.
C
Chart
6.8. Number
N
of peeople dealt with
w obstetrrics servicess
n=1664
278,, 17%
1386, 83%
%
Didn't use
u
Used obstetriics services
Almo
ost all womeen (98.6%) used
u
obstetrrical care seervices havee estimated the
t quality of medical
ccare as «goo
od» and «satiisfactory» an
nd only 1.44% - as «bad
d». There arre some diffferences by urban and
r
rural
breakd
downs. Thus, the urban
n residents have estimaated them as
a «good» with
w
16% mo
ore and as
«
«bad»
with 18%
1
less thaan rural ones.
The special
s
atten
ntion should
d be paid to the comparrison of quallity estimatiions of obsteetrical and
g
general
med
dical care, according
a
t which th
to
he quality of
o medical care is very
y high. Thu
us, «good»
e
estimate
of quality of obstetrical
o
c
care
is higheer with 10%
% and «bad» estimate is
i around 6 times less
t
than
the estiimate of gen
neral medicaal care.
57
C
Chart
6.9. Esstimation off quality of obstetrical
o
c
care
by the respondents
r
s
98.6%
1..4%
Good
d and satisfacto
ory
Bad
Only
y 6.5% of respondents
r
s have paid
d for obstettrical care services,
s
wh
hich provess that the
o
obstetrical
c
care
is free of
o charge. Moreover,
M
900% of expen
nditures werre directed to to mediccal services
(
(separate
waard, food, su
upplies, etc.).
Acco
ording to th
he normativ
ves on out-p
patient obsttetrical and gynecologiical care an
nd services
g
guaranteed
by the Go
overnment, there are number
n
of goal progrrams being implementted in the
R
Republic
wh
hich are directed to thee reproductiive health care
c
provisio
on of the po
opulation. They
T
are as
f
follows:
the complex ch
heck up of health
h
statuss including reproductiv
ve health of 15 years old
d girls and
b
boys
of military age, th
he annual freee of chargee gynecologgical and on
nco-cytological preventiive checku of womeen. All the above-men
up
ntioned serv
vices are reendered freee of chargee in the am
mbulatorymedical in
p
polyclinical
nstitutions. Only 7.2%
% of respon
ndents have paid for those serv
vices. This
i
indicator
do
oesn't depen
nd on the place
p
of residence: it comprised
c
7
7.5%
amongg urban resiidents and
6
6.5%
amongg urban oness.
C
Chart
6.10. Estimation
E
of
o qquality of
o reproducttive health care
c
services by the resp
pondents
96.8
3.2
Satiisfactory
Un-sa
atisfactory
Almo
ost all users (96.8%) off reproductiv
ve health prrovision serrvices have satisfactory
y estimated
tthe quality of services and only 3..2% of them
m stated as unsatisfacto
ory (only by
y urban resp
pondents).
T absencee of health problems
The
p
waas the main
n reason for not applyin
ng to these services
s
(91%), which
t
tells
us abou
ut low level of knowleedge of the respondentts on the im
mportance of
o preventiv
ve medical
c
check-up,
ass well as theeir inactive behavior reelated with women's health
h
care provision
p
am
mong both
u
urban
and ru
ural respond
dents.
58
SECTION 7
FAMILY VALUES, MARITAL AND REPRODUCTIVE TRENDS,
MOTIVATIONS (positive and negative)
Chapter 7.1. Family values
Over the past two decades, political, socio-economic and cultural value changes have left
immediate imprint on the family that is directly affected by these changes. Some complex systemic
changes were a novelty for the Armenian family. Under the Soviet system the family was effectively
isolated from the outer, non-Socialist world and had limited information about the Western
civilization. In fact, values of the Western civilization were offered to the family and in some cases
imposed on it, such as democracy, the rule-of-law state, free market relations, etc.
At first glance, the above has nothing to do with reproductive behavior and planning of the
number of children. However, on closer examination it proved that the latter were factors of family
relations and value system that directly or indirectly affect family development and reproductive
behavior. According to experts, the developments of past years and current living conditions have
affected reproductive behavior.
A large group of researchers consider the man-centered (individual-centered) approach to be a
fundamental distinctive feature of the Western civilization as well as the priority of satisfying the
individual’s needs. The Soviet and Armenian environment is more collective-centered.
Obviously, the differences between individual-centered and collective-centered societies are
systemic, and the transition from one to another is complicated and time-consuming. Intermediate
phases are inevitable; for example, nepotism and favoritism or old boy networks and clanism that are
common in this country.
Chapter 7.2. Decision making
Let us consider the answers given to the questions on the participation of family members in
decision-making in the urban and rural households.
Table 7.1. Decision-making customs in families
How decisions are made on the following issues
by
Husband
and wife
together
Solely
by
husband’s/wife’s
parents
All
family
members’
opinion
is
taken
into
account
99
Solely by
husband
Solely
wife
Child’s upbringing
1.2%
9.8%
62.4%
0.7%
25.8%
0.1%
Child’s education
1.2%
9.5%
64.8%
0.7%
22.9%
0.8%
59
Off-spring’s marriage
0.6%
6.2%
56.4%
0.4%
31.3%
1.9%
6.8%
49.9%
1.3%
40.1%
2.7%
8.2%
49.5%
1.8%
37.8%
Secondary household issues
2.7%
8.2%
49.5%
1.8%
37.8%
Spouse-related issues
0.7%
6.3%
83.8%
0.2%
8.3%
0.7%
Expensive purchases
Number of children
Abortion/contraception
3.3%
0.9%
1.1%
5.4%
7.1%
10.6%
47.4%
81.7%
80.9%
1.4%
0.2%
.0%
42.5%
9.2%
5.0%
0.1%
0.7%
2.0%
Other important familyrelated issues
Important household issues
4.5%
It should be noted that decisions on child upbringing and education, off-spring’s marriage, the
number of children and abortion are made jointly by the spouses. When making decisions on offspring’s marriage the opinions of all family members are taken into account. Likewise, other
important family-related issues are resolved in the family.
The general dynamics of responses shows that the role of senior family members in decisionmaking is weak. The answers to the same question in urban and rural families show that the
participation of all family members in decision-making is higher percentage-wise in rural families
than in urban families, particularly, in issues related to abortion and number of children and
important household issues (See Table 7.2.)
Chart 7.1. Decisions related to child upbringing
Child upbringing decisions / urban
Husband solely
60.1 %
Wife solely
Husband and wife jointly
25.5 %
/ and wife’s parents
Husband’s
solely
12.6 %
1.1 %
0.6 %
All family members’ opinions
count
Let us estimate the changes in the value system of families and reveal the reasons for these
changes. This will enable us to draft the ways of making positive impact on the demographic
situation.
60
Table 7.2. Data on the participation of family members in decision making in urban and rural families
Solely by
husband
Solely by
wife
Solely by
husband’s/wife
’s parents
All family
members’
opinion is
taken into
account
rural
urban
rural
urban
rural
Husband
and wife
together
urb
rura
an
l
26.4
100
100
23.3
22.8
100
100
0.5
31.0
36.9
100
100
1.0
2.0
38.0
44.1
100
100
49.8
1.5
2.2
36.4
40.7
100
100
44.5
45.2
3.0
1.7
23.7
26.8
100
100
3.8
82.6
87.8
0.2
0.2
8.6
7.9
100
100
6.5
3.2
49.3
43.7
1.1
2
40.2
47
100
100
8.9
3.8
81.1
85.1
0
0.4
9.1
9.7
100
100
5.6
80.6
87.1
0
0
4.8
5.9
100
100
urb
rur
urba
an
al
n
4.3
60.1
66.9
0.6
0.9
25.5
4.6
62.9
70.1
0.5
1.1
8.1
3.7
59.7
58.7
0.3
1.8
8.5
3.3
50.4
48.9
2.8
2.6
10
4.8
49.3
1.2
1.8
27.
24.
6
6
Spouse-related issues
0.9
0.3
7.7
Expensive purchases
2.9
4
Number of children
0.9
1
Abortion/contraception
1
1.5
urban
rural
Child’s upbringing
1.1
1.4
Child’s education
1.1
1.4
Off-spring’s marriage
0.8
0.3
2.0
Other important familyrelated issues
Important household
issues
Secondary household
issues
Total,
%
12.
6
12.
1
13.
6
In demography, reproductive behavior is described by three major components:
•
•
•
long family (5 children and more wanted)
middle family (3-4 children wanted)
small family (1-2 children wanted)
If the number of children in the family matches the number of children wanted by the
spouses, then no economic improvement can lead to the birth of new children. Only when the
demand for children is not satisfied, then economic improvement can lead to the increase in the
number of children, but not in all cases. Such a situation also occurs in case of economic decline.
Three levels of demand for children are major characteristics of reproductive behavior:
• “ideal” number of children that reflects the dominant social norm in the society related to
reproductive behavior;
• “desirable” number of children that demonstrates the readiness to have a certain number
of children provided all the prerequisites exist;
61
•
“eexpected” nu
umber of ch
hildren that demonstrattes the inten
ntion to hav
ve children in
i the near
fu
uture as deteermined by the currentt socio-econ
nomic situatiion.
The surveys con
nducted to reveal the impact of financial
f
weellbeing on reproductiive behavior
d
demonstrate
ed that only
y 27% of su
urveyed fam
milies believ
ve that morre children are born in
n financially
y
s
secure
famillies. In the responses to
o the questiionnaire, th
he answer NO
N has the highest speecific gravity
y
(
(47%).
The responses
r
arre shown in the Chart 7.2.:
7
Chart 7.2. On moree children bo
orn to finan
ncially securre families
27%
2
26%
47%
y
yes
no
hard
d to say
This daata allow us to concludee that in thee Armenian context thee number off children iss not much
d
dependent
o the familly’s financiaal status. Th
on
he fact that the large number
n
of children
c
in a family is
n related to economiic factors go
not
oes to show
w that the distinctive
d
e
ethno-cultur
ral features are much
m
more
influen
ntial on reprroductive beehavior.
Let us note that among
a
inteernational exxperts theree is a stereotype that multiple ch
hildren (of
v
various
agess) are evideence of eco
onomic and
d cultural backwardnes
b
ss, while sccarcity of children
c
is
e
evidence
of high culturaal level and informed birth
b
controll.
The ab
bove-mentio
oned, of cou
urse, is rath
her abstractt and does not
n take intto account individual
n
needs
as weell as family
y value systtem, especiaally, the staability of th
he family an
nd the signiificance of
c
children
(as a national distinctive
d
feeature) in th
he moral atttitudes of th
he parents.
It is noteworthy
y that in th
he answers of rural reespondents the correlaation betweeen family
w
wellbeing
an
nd the numb
ber of child
dren is aboutt 10% higheer compared
d to urban reespondents (see Chart
7
7.3.)
althouggh the abovee ratio of po
ositive and negative
n
answ
wers in ruraal responden
nts is maintaained.
The respondents
r
s also estimaated the desiirable numb
ber of childrren.
The desirable
d
nu
umber of ch
hildren in a family is a reproductiv
r
ve target wh
hose analysiss allows to
ju
udge about the establisshed percep
ption of the ideal family
y model in terms of th
he number of
o children
a helps to
and
o estimate th
he reproducttive potentiaal of the pop
pulation.
62
Chart 7.3. On the intention to have more children in financially secure rural and urban families, %
60
49.4
50
42
40
30
32.9
27.5
23
25.1
20
10
0
yes
urban
no
hard to say
rural
The distribution of families’ responses about the desirable number of children is found in Chart 7.4.
5.5% of families noted one child as desirable, 31.7% noted two children. The highest percentage
(38.8%) accounts for those who want to have three children, 18.2% noted four children.
The percentage of families willing to have more children is very low (1.5-2.3%)
63
C
Chart
7.4. Desirable
D
nu
umber of chiildren
1child
d
2 children
8
38.8
3 children
4 children
5.5
5 children
18.2
31.7
2.3
2.1
6 and
d>
childrren
1
1.5
hard to say
Thuss, to sum up
p, the abov
ve data show
w that for 57% of fam
milies the 3-4
3 children
n model is
p
preferable.
This data iss reassuring in terms off state demo
ographic po
olicy. In casee of efficien
nt strategy,
t desirablee 3-4 childreen can beco
the
ome demand
ded for, therrefore, also realistic.
r
Th
he above ten
ndencies in
t desirablee number off children have been prreserved botth in urban and
the
a rural families (see Chart
C
7.5.).
Let us
u note thatt the percen
ntage of rural families wishing to
o have 3-4 children siggnificantly
e
exceeds
thatt of urban families. In
n particularr, the differrence (5 percentage po
oints) is higgher for 4
d
desirable
chiildren.
C
Chart
7.5. Desirable
D
num
mber of chilldren by urb
ban and ruraal breakdow
wns
50
9
42.9
45
40
36.7
36.3
35
30
22.7
25
21.3
16.6
20
15
10
5
2.6
1.3
1
1.7
1.8
3.2
4.7
7.2
0
d
1 child
2 children
3 children
urban
4 children
rural
5 children
6 and >
chidren
hard to say
Charrts 7.5. and 7.6. show the reasoniing behind the answers given by
y the familiies on the
d
desirable
nu
umber of chiildren.
The reasonings that account forr the highestt percentagee come from
m the familiees that menttioned:
mperative of
o time (urbaan families, 32.0%; ruraal families, 32.9%)
3
• the im
• numeerous childrren enhancee families (urban familiees, 27%, rurral families, 31.2%)
• that’ss customary
y for the Arm
menian enviironment (u
urban families, 19%, ru
ural families,, 17.3%)
• that’ss customary
y for the pareental family
y (urban fam
milies, 7.0%, rural familiies, 15.1%).
L us consid
Let
der the dataa on desirablle, demandeed and availlable childreen in familiees (see Charrt 7.6.) The
p
presented
daata show thaat the averagge number of
o desirable children is 2.92.
64
The demanded number of children in women’s opinion is 2.68; in the opinion of their
husbands, 2.83; and the average number of children in the families of the sample is 1.91.
According to the National Statistical Service of RA, in 2009 in Armenia the average number of
children in families was 1.44.
Chart 7.6. The ratio of the actual children in the family and the desired and demanded number of
children
2 children
desirable # of children
3 children
4 children
required # of children
0.7
2.2
3.8
2.6
8.4
1 child
12.2
18.2
38.3
38.8
45.4
40.3
31.7
4.5
2.1
50
45
40
35
30
25
20
15
10
5
0
42.9
%
5 and > children
actual # of children
Reasoning of the families which noted that they desired 1 and 2 children is as follows: (see Chart 7.7.)
•
•
•
no time for career growth (urban families, 2%; no answer from rural families)
better career opportunities (urban families, 7%; no answer from rural families)
to lead unrestricted life (urban families, 1.2%; rural families, 1.5%)
Chart 7.7. Reasoning of urban and rural families about the number of desirable children
0.6
other
5
11.9
hard to say
Allows to maintain normal relations between spouses
1.7
1.5
1.2
Allows to live free
No time for career
0
More career opportunities
0
14.6
4.3
2
7
it's imerative of time
many children stabilize the family
27
that's the tradition in the parents' family
15.1
7
17.3
19
that's the Armenian tradition
rural
urban
32.9
32
31.2
0
5
10
65
15
20
25
30
35
Table 7.3. presents the results of the survey conducted in the marzes of RA and Yerevan about the
desirable number of children. Note the percentage of families that mentioned the 2nd and 3rd desirable
children since the 2nd child provides simple reproduction while the 3rd child provides extended
reproduction of the family. 51.6% of families in Sunik marz, 48.8% and 48.6% in Tavush and Armavir
marzes, respectively, expressed willingness to have three children. In these marzes the quantitative
difference between the 2nd and 3rd desirable children is also significant.
Thus this difference in Armavir marz is 32.6%, in Sunik and Tavush marzes, 23.4% and 23.3%,
respectively. In terms of this indicator, Ararat marz (29.2%, difference 3.9%) and Aragatsotn marz
(32.0%, difference 25%) have the lowest percentage in this country. Let us note that in these marzes
the highest percentage belongs to those families which did not know what to answer 26.2% and
15.0% respectively.
Table 7.3. Desirable number of children in families in the marzes of RA and Yerevan (%)
Desirable number of children, %
Marzes
Yerevan
Aragatsotn
Ararat
Armavir
Gegarkunik
Lori
Kotaik
Shirak
Sunik
Vayots-Dzor
Tavush
Total
1
2
3
4
4.8
3.6
3.0
0.9
1.4
0.0
0.0
0.9
0.0
0.0
0.0
2.1
32.8
34.5
25.3
16.0
45.0
41.1
27.3
32.3
28.2
27.1
26.5
31.7
35.1
32.0
29.2
48.6
43.8
31.8
43.8
40.3
51.6
33.8
48.8
38.8
18.0
11.5
12.2
18.8
7.4
20.9
25.3
19.6
11.1
34.8
22.2
18.2
5 and
more
3.3
3.4
4.1
8.1
2.4
5.5
3.1
2.8
0.6
2.2
2.5
3.8
Don’t
know
6.0
15.0
26.2
7.6
0.0
0.7
0.5
4.1
8.5
2.1
0.0
5.4
The surveyed family members responded to the question about the demanded number of
children provided all prerequisites exist (Table 7.4.) It follows from responses that the opinions of
spouses about 2 and 3 children match within the range of 38%. The opinions of the husband’s and
wife’s parents also match by 33%.
The opinions of spouses differ on 1 and 2 desired children where the percentage of women’s
opinions relatively prevails. Thus, 4.5% of women and 2.1% of men demand 1 child; 40.3% of women
and 35.9% of men demand 2 children.
There are more husbands who demand 4 and more children.
66
Table 7.4. Demanded number of children provided all prerequisites exist
What’s the number of demanded chidren provided all prerequisites exist?
Wife’s
Husband’s
Wife’s
Husband’s
Number of children
parents’
parents’
opinion
opinion
opinion
opinion
1
4.5%
2.1%
1.9%
1.1%
2
40.3%
35.9%
22.6%
17.9%
3
38.3%
38.5%
33.3%
33.9%
4
12.2%
14.7%
15.8%
21.6%
5
.9%
1.5%
1.6%
3.3%
6 and more
1.3%
2.0%
1.6%
3.4%
Don’t need children
0.1%
0.1%
Don’t know
2.5%
5.3%
23.2%
18.8%
Table 7.5. shows data on demanded children in rural and urban families, provided all the
prerequisites exist. It follows from the responses that the opinions of spouses about 2 and 3 children
match, both in rural and urban families.
Table 7.5. Number of demanded children in rural and urban families, provided all the prerequisites
exist, %
Number of children
Urban
Rural
2.1
39.4
36.9
13.2
1.4
1.6
5.4
100
Wife’s
parents’
opinion
2.7
25.5
33.3
12.2
1.4
1.3
23.5
100
1.4
20.7
33.5
18.5
3.1
3.2
19.4
100
2
29.2
41.5
17.8
1.8
2.6
5.0
100
0.2
17.1
33.1
22.8
1.9
2.3
22.6
100
0.5
12.5
34.6
27.5
3.5
3.7
17.7
100
Wife’s
opinion
Husband’s
opinion
1
2
3
4
5
6 and more
Don’t know
Total
5.1
43.6
36.5
11.3
0.8
0.8
1.9
100
1
2
3
4
5
6 and more
Don’t know
Total
3.2
33.9
42
13.9
0.9
2.3
3.7
100
Husband’s
parents’ opinion
Let us note that in rural families the demand for 3 and 4 children is higher by more than 5
percentage points.
67
Chart 7.8. Planning the next child in the next 3 years in rural and urban families
80
69.9
70
65
60
50
40
30
20
16.4
15.5
13.6
19.6
10
0
yes
no
urban
hard to say
rural
The responses to the question “Are going to have the next child in the next 3 years?” will be
analyzed in detail since they enable us to estimate both positive and negative motivations in
reproductive behavior. The responses can serve as guidelines when drafting projects for state
demographic policy.
Table 7.6. Distribution of responses to the question “Are you going to have another child?” by type of
family, %
Responses
question
to
Positive
Negative
Hard to say
Participants
the interview
of
Family type
Total
nuclear
Incomplet
e nuclear
Extended
complex
In all family types
Number of families
Of responses %
Of responses in family
type %
Total %
64
23.1%
1
0.3%
203
76.6%
268
100.0%
10.2%
1.4%
20.7%
16.1%
3.7%
0.1%
12.3%
16.1%
Number of families
Of responses %
Of responses in family
type %
Total %
482
41.6%
59
5.0%
598
53.4%
1139
100.0%
77.4%
92.2%
61.2%
68.3%
28.4%
3.4%
36.5%
68.3%
Number of families
Of responses %
Of responses in family
type %
Total %
78
29.3%
3
1.5%
176
69.2%
257
100.0%
12.5%
6.5%
18.1%
15.6%
4.6%
.2%
10.8%
15.6%
68
Total
Number of families
624
63
977
1664
The data in the table enable us to estimate the percentage of positive, negative and uncertain
responses by family type. Thus, 10.2% of 624 nuclear families in the sample responded positively;
77.4%, negatively; and 12.5% found it hard to answer. 977 extended complex families in the sample
responded to the question as follows: 203 families responded positively (20.7%); 598, negatively
(61.2%) and 176 families or 18.1% found it hard to answer.
16.1% (268) of all family types totaling 1664 responded positively.
12.3% of extended complex families, 3.7% of nuclear families, and 0.1% of incomplete nuclear
families responded positively. 15.6% of all family types (257 families) found it hard to answer to the
same question. 10.8% of extended complex families, 4.6% of nuclear families and 0.2% of incomplete
nuclear families found it hard to say whether they had intentions to have another child.
68.3% of all family types in the sample (1,139) have no intention to have children in the near
future, including 36.5% of extended complex families, 28.4% of nuclear families and 3.4% of
incomplete nuclear families.
Since the sample is considered to be representative, extrapolating the positive, negative and
uncertain responses to the entire country we can state that negative attitudes dramatically prevail in
all types of families (68.1%), and in terms of specific gravity these attitudes are higher in nuclear
families. This situation is of concern also in terms of efficient state demographic policy. Let us also
mention that the main resources for simple and extended reproduction are the families with positive
(16.1%) and uncertain (15.6%) motivation whose specific gravity (31.7%) is not very low.
In our opinion there are sufficient grounds to believe that the negative reproductive behavior
in negatively motivated families is not set in stone, and is mostly the result of negative socioeconomic developments in the early years of economic liberalization, mass poverty and skepticism
about the future.
During the recent years, positive socio-economic developments in Armenia have dramatically
reduced poverty, this country finalizes the optimization of the socio-economic and governance
system, and the reforms of design and implementation of balanced long-term policy in the given
sphere.
To let the positive developments ride is pregnant with deterioration of demography which can
lead not only to enhancement of negative motivation but also to depletion of current resources.
Since 2009 the financial crisis has left a dramatic negative impact on the income and living
standards of the population which in its turn affected the demographic situation.
The analytical vectors below show the causal connection between negative motivations and
their impacts which will be useful not only to evaluate the situation but also to design the measures
that will have positive impact and create relevant environment for positive changes in the
demographic situation.
Table 7.7. summarises the answers of respondents from RA marzes to the question, “Do you
plan to have another child in the next 3 years?” In Yerevan the same percentage of families, 34% gave
positive and negative answers.
69
Let us note that this indicator is the highest among marzes. In Yerevan 74.0% of respondents
responded negatively, 17.3% - positively, 8.7% were uncertain. The relatively high positive
reproductive motivation is also in Kotaik - 16.0 % and Armavir - 12.2 %.
Positive reproductive motivation is low in Vayots-Dzor marz - 1.3% and Aragatsotn marz - 1.6%.
Table 7.7. Responses to the question, “Do you plan to have another child in the next 3 years?” in
marzes and in Yerevan
Responses
Marzes
Yerevan
Total
% in marz
% among marzes
Aragatsotn
% in marz
% among marzes
Ararat
% in marz
% among marzes
Armavir
% in marz
% among marzes
Gegarkunik
% in marz
% among marzes
Lori
% in marz
% among marzes
Kotaik
% in marz
% among marzes
Shirak
% in marz
% among marzes
Sunik
% in marz
% among marzes
% in marz
Yes
No
Uncertain
17.3
74.0
8.7
100.0
33.8
34.1
17.5
31.4
9.4
75.5
15.1
100.0
1.6
3.0
2.6
2.7
16.3
62.0
21.7
100.0
6.2
5.6
8.5
6.1
22.6
69.2
8.2
100.0
12.2
8.8
4.6
8.7
14.1
74.2
11.7
100.0
6.9
8.6
5.9
7.9
7.0
53.0
40.0
100.0
5.3
9.4
30.9
12.1
20.4
64.7
15.0
100.0
16.0
11.9
12.1
12.6
16.9
72.6
10.5
100.0
10.1
10.2
6.4
9.6
20.8
57.0
22.2
100.0
5.8
3.8
6.4
4.5
12.8
72.9
14.3
100.0
70
Vayots-Dzor
% among marzes
Tavush
Total
1.3
1.7
1.5
1.6
% in marz
5.1
74.0
20.9
100.0
% among marzes
0.8
2.8
3.5
2.6
% in marz
% among marzes
% total
16.1
100.0
68.3
100.0
15.6
100.0
100.0
16.1
68.3
15.6
100.0
100.0
High percentage of negative motivation in reproductive behavior is of serious concern and in
further analysis we will present the causes of such outcome. In Chart 7.9 the responses of rural and
urban families are presented.
Chart 7.9. Major reasons for negative motivation in reproductive behavior
10.8
other
19.4
we can't ensure good future for children
25.2
Husband or wife are unwilling
25.3
7.4
family's living conditions
30.3
31.3
6.5
lack of husband
9.8
4.7
4.8
health problems of spouses
urban
38.1
15.7
socio-economic status of family
rural
43.9
0
5
10
15
20
71
25
30
35
40
45
50
Chapter 7.3. Negative motivation in reproductive behavior: reasons, effects and needs
Chart 7.10. brought below presents the responses concerning the difficulties of planning the next
child and the issues requiring state intervention.
Chart 7.10. Issues most affecting the planning of the next child in urban and rural families, and
priority problems requiring state intervention
0.8
Other
4.3
8.2
Education
Healthcare
11.8
12.8
16.9
1.9
3.5
Legal regulation
23
Convinient job
10.6
Income generation at home
17.4
9
Combined work and childcare
25.8
13.8
Improvement of household conditions
20.5
9.9
Improvementof living conditions
4.9
Provision of appartment on privileged conditions
24.3
16.4
24.8
Material
Urban
39.5
30.6
Financial
Rural
38.3
0.0
10.0
20.0
30.0
56.5
40.0
50.0
60.0
According to the above diagram, among the issues most affecting the planning of the next child in
urban and rural families, and priority problems requiring state intervention in 56.5% urban and 30.6% rural
families alike first come financial problems.
The second problem for 39.5% urban and 24.8% rural families is logistics.
The third problem is adequate employment for 38.3% urban and 23.0% rural families.
The fourth problem is improvement of living conditions for 24.3% urban and 9.9% rural
families.
The fifth problem is employment combined with child care for 25.8% urban and 9% rural
families.
The sixth problem is healthcare for 16.9% urban and 12.8% rural families.
Domestic income-generating activity, preferential procurement of apartments, educational and
other problems were also in the list of difficulties. Let us note that in rural families there were half as
much problems than in urban ones.
The percentage of families facing the above problems and difficulties with the next child in RA
marzes and Yerevan are shown in Table 7.8.
72
Table 7.8. Percentage of families in RA marzes and Yerevan facing problems causing negative
motivation in reproductive behavior
Marzes
answer
1
2
3
4
5
6
7
8
9
10
11
12
Yerevan
(%)
Aragatsotn
(%)
Ararat (%)
Armavir
(%)
Gegarkun
ik (%)
Lori
(%)
Kotaik
(%)
Shirak
(%)
Sunik
(%)
Vayots
-Dzor
(%)
Tavush
(%)
76.8
46.6
32.9
40.0
28.3
37.3
18.5
43.1
8.1
17.0
11.9
8.1
90.4
73.4
19.6
26.3
34.1
20.4
14.3
54.6
0.0
13.5
5.5
2.5
89.5
66.4
10.7
23.9
18.8
33.6
22.3
52.7
15.5
50.2
47.3
5.2
88.6
68.3
17.3
37.8
35.2
22.7
30.7
76.6
5.1
20.4
9.0
0.0
95.4
92.3
24.6
29.4
43.9
32.0
22.8
48.1
4.5
52.2
19.3
1.3
100
100
0.0
29.9
56.1
37.7
62.9
96.8
1.3
0.0
9.8
0.0
89.7
68.4
22.4
35.9
34.2
31.9
22.4
68.4
3.0
51.6
35.1
0.0
88.0
44.9
18.0
24.1
22.9
48.7
33.5
66.0
3.7
40.4
29.1
0.8
89.0
43.2
15.7
31.1
31.8
40.1
23.3
58.5
5.1
55.5
39.0
0.0
70.0
50.2
13.9
44.7
46.1
32.3
35.5
67.4
3.7
60.5
14.3
2.2
100
85.0
32.7
49.3
47.2
14.2
20.1
81.2
0.0
40.2
16.4
0.0
1. Financial
2. logistical
3. preferential procurement of apartment
4. improvement of living conditions
5. improvement of amenities
6. combination of work and child care
7. domestic income-generating possibilities
8. adequate employment
9. legal regulation
10. healthcare
11. education
12. etc.
Table 7.9. shows the responses to the survey on the problems most affecting the planning of
the next child and requiring priority solutions
Table 7.9. Problems faced by various family types in terms of planning the next child and state
intervention
Answer
1
2
3
4
Nuclear family
Incomplete family
Extended complex family
urban (%)
83.4
rural (%)
92.5
urban (%)
84.7
rural (%)
92.3
urban (%)
85.5
rural (%)
87.7
59.6
24.9
34.3
75.7
10.3
28.8
68.1
21.9
42.3
89.1
24.7
45.0
56.2
25.7
36.8
74.1
14.7
30.8
73
5
6
7
8
9
10
11
12
29.9
38.8
27.2
55.3
7.1
24.5
17.1
5.2
44.6
24.1
33.6
69.8
7.4
37.9
24.6
0.7
47.2
42.2
18.2
45.9
3.8
20.5
15.6
9.5
74
41.8
58.2
47.3
55.0
0.0
24.7
0.0
0.0
26.4
36.8
24.1
56.2
5.7
24.6
19.3
4.1
41.6
26.4
20.1
65.0
5.4
38.4
24.5
1.8
Chart 7.11. Responses of urban and rural families to the question, “What assistance do you expect
from the state to have at least 3 children?” (%)
30
30.7
39.8
41.3
49.5
58.3
59.5
47.1
27.1
24.6
25.8
40
32.8
31.6
45.4
48.9
45.8
60
59.7
66
70
50
69.7
80
7.1
9.4
10
6.4
8.5
20
0
1
2
3
4
5
6
Urban
ø³Õ³ù
7
8
9
10
11
Rural
¶ÛáõÕ
Here is a summary of responses to the question, “What assistance do you expect from the state to
ensure family reproduction, i.e. to have at least 3 children?” in surveyed urban and rural families.
1. Revival of socio-cultural life at the place of residence and affordable modern
communications;
2. shorter working hours for child-caring mothers with preserved salary rate;
3. extended paid post-natal vacation;
4. after the expiry of the post-natal vacation, free training for the recovery of lost professional
skills;
5. in case of family business, tax privileges after the third child;
6. affordable quality healthcare services;
7. affordable pre-school and education services;
8. preferential or free animals and minor agricultural machinery for young families in rural
areas depending on the number of children;
9. depending on the number of children, long-term preferential agricultural or business loans
to be extended to young families for family business or to develop existing business;
10. conditions for income-generating activity for mothers of underage children in case of the
lack of child care providers or when necessary;
11. etc.
To ensure extended reproduction, 59.7% of urban and 59.5% of rural families need affordable
quality healthcare services. Let us note that the need for this state assistance has the highest specific
gravity in responses.
75
Over 45% of urban families noted the following state support issues:
• shorter working hours for working women related to child care with preserved salary
rate;
• affordable pre-school and education services;
• extended paid post-natal vacation;
• revival of socio-cultural life at the place of residence and affordable modern
communications;
• depending on the number of children, long-term preferential agricultural or business
loans to be extended to young families for family business or to develop existing
business.
About 40% of urban families mentioned the need for state support in creating conditions for
income-generating activity for mothers of underage children in case of the lack of child care providers
or when necessary.
Over 65% of rural families noted the following state-support issues:
• preferential or free animals and minor agricultural machinery for young families in rural
areas depending on the number of children;
• revival of socio-cultural life at the place of residence and affordable modern
communications.
Over 45% of rural families noted the following state-support issues:
• affordable pre-school and education services;
• depending on the number of children, long-term preferential agricultural or business loans
to be extended to young families for family business or to develop existing business;
• in case of family business, tax privileges after the third child.
The responses of nuclear and extended complex families on extended reproduction through
state support are in the Chart 7.13.
This data shows that 21.9% of nuclear families and 35.3% of extended complex families
anticipate state support in affordable quality healthcare services.
76
Chart 7.12. Expectations of nuclear and extended complex families about state support in family
reproduction.
18.4
Affordable pre-school and education services
27.3
21.9
Affordable quality healthcare
Revival of socio-cultural life at the place of residence and
affordable modern communications
35.3
18.7
31.7
%
nuclear
0
extended
Depending on the number of children, long-term preferential
agricultural or business loans to be extended to young
families for family business or to develop existing business
Preferential or free animals and minor agricultural
machinery for young families in rural areas depending on
the number of children
In case of family business, tax privileges after the third child
% 0.0
Nuclear
10
20
30
17.0
10.1
12.4
40
50
60
70
28.0
16.3
18.8
5.0 10.0 15.0 20.0 25.0 30.0 35.0 40.0 45.0 50.0
Extended
77
after the expiry of the post-natal vacation, free training for the recovery
of lost professional skills
12.8
7.0
extended paid post-natal vacation
23.4
13.8
shorter working hours for child-caring mothers with preserved salary
rate
15.6
conditions for income-generating activity for mothers of underage
children in case of the lack of child care providers or when necessary
14.9
23.1
19.7
%
0.0
Nuclear
5.0
10.0
15.0
20.0
25.0
30.0
35.0
40.0
45.0
extended
Table 7.10. summarizes the negative answers to the question, “What support is expected from the
state in family reproduction, i.e. in having 3 children?” by family type.
Table 7.10. Negatively motivated families about expected state support
Answer
1
2
3
4
5
6
7
8
9
10
11
Nuclear family
urban (%)
38.0
53.5
43.7
23.1
35.3
64.9
48.1
8.2
37.6
44.3
10.6
rural (%)
70.8
24.8
25.0
8.8
30.8
53.7
51.0
71.7
57.8
30.7
6.3
Incomplete family
Extended complex family
urban (%)
35.5
50.8
35.3
18.5
9.5
52.9
46.6
9.4
48.6
49.6
19.8
urban (%)
45.3
50.2
42.2
27.8
31.5
57.8
41.7
5.0
39.1
36.5
9.8
1. Revival of
rural (%)
89.1
27.4
10.2
7.5
30.1
49.6
57.4
68.8
38.2
39.0
15.1
rural (%)
62.5
25.2
19.9
6.2
32.0
68.0
52.3
65.1
53.0
31.7
6.4
socio-cultural life at the place of residence and affordable modern
communications;
2. shorter working hours for child-caring mothers with preserved salary rate;
3. extended paid post-natal vacation;
4. after the expiry of the post-natal vacation, free training for the recovery of lost professional
skills;
78
5. in case of family business, tax privileges after the third child;
6. affordable quality healthcare services;
7. affordable pre-school and education services;
8. preferential or free animals and minor agricultural machinery for young families in rural
areas depending on the number of children;
9. depending on the number of children, long-term preferential agricultural or business loans
to be extended to young families for family business or to develop existing business;
10. conditions for income-generating activity for mothers of underage children in case of the
lack of child care providers or when necessary;
11. etc.
48-65% of urban nuclear families expect the following support from the state:
• affordable quality healthcare services;
• shorter working hours for child-caring mothers with preserved salary rate;
• affordable pre-school and education services.
45-58% of urban extended complex families expect the following support from the state (first
three highest percentage responses):
• affordable quality healthcare services;
• shorter working hours for child-caring mothers with preserved salary rate;
• revival of socio-cultural life at the place of residence and affordable modern
communications.
58-72% of rural nuclear families expect the following support from the state (first three highest
percentage responses):
• preferential or free animals and minor agricultural machinery for young families in rural areas
depending on the number of children;
• revival of socio-cultural life at the place of residence and affordable modern
communications;
• depending on the number of children, long-term preferential agricultural or business
loans to be extended to young families for family business or to develop existing
business.
62-68% of rural extended complex families expect the following support from the state (first three
highest percentage responses):
• affordable quality healthcare services;
• preferential or free animals and minor agricultural machinery for young families in rural areas
depending on the number of children;
• revival of socio-cultural life at the place of residence and affordable modern communications.
In terms of state demographic policy special attention shall be paid to the families that are still
uncertain about having the next child. This is the resource whose reproductive motivation has been
not determined yet and in case of necessary state support they can join positively motivated families.
79
Table 7.11. summarizes the attitudes of uncertain families towards state support.
Table 7.11. Expectations of families with undecided reproductive motivation about state support
Answer
1
2
3
4
5
6
7
8
9
10
11
Incomplete family
Nuclear family
urban (%)
59.0
47.4
49.8
27.1
31.1
54.0
57.0
5.3
62.4
45.4
0
rural (%)
71.7
8.4
12.7
4.4
26.2
28.9
54.0
67.2
67.1
39.8
26.5
urban (%)
0
64.6
100.0
100.0
0
0
0
35.4
0
70.7
0
rural (%)
0
0
0
0
0
0
0
0
0
0
0
Extended complex family
urban (%)
64.3
32.0
47.9
28.4
24.0
52.3
58.0
5.5
61.0
29.5
12.8
rural (%)
59.4
24.0
41.2
14.0
24.4
63.7
44.7
79.9
65.5
25.4
3.1
1. Revival of socio-cultural life at the place of residence and affordable modern
communications;
2. shorter working hours for child-caring mothers with preserved salary rate;
3. extended paid post-natal vacation;
4. after the expiry of the post-natal vacation, free training for the recovery of lost professional
skills;
5. in case of family business, tax privileges after the third child;
6. affordable quality healthcare services;
7. affordable pre-school and education services;
8. preferential or free animals and minor agricultural machinery for young families in rural
areas depending on the number of children;
9. depending on the number of children, long-term preferential agricultural or business loans
to be extended to young families for family business or to develop existing business;
10. conditions for income-generating activity for mothers of underage children in case of the
lack of child care providers or when necessary;
11. etc.
57-62% of urban nuclear families with uncertain reproductive motivation expect the following state
support (first three highest percentage responses):
o depending on the number of children, long-term preferential agricultural or
business loans to be extended to young families for family business or to develop
existing business;
o revival of socio-cultural life at the place of residence and affordable modern
communications;
80
affordable pre-school and education services.
58-64% urban extended complex families with uncertain reproductive motivation expect the
following state support (first three highest percentage responses):
• revival of socio-cultural life at the place of residence and affordable modern communications;
• depending on the number of children, long-term preferential agricultural or business loans to
be extended to young families for family business or to develop existing business;
• affordable pre-school and education services.
67-72% of rural nuclear families with uncertain reproductive motivation expect the following state
support (first three highest percentage responses):
• revival of socio-cultural life at the place of residence and affordable modern
communications;
• preferential or free animals and minor agricultural machinery for young families in
rural areas depending on the number of children;
• depending on the number of children, long-term preferential agricultural or business
loans to be extended to young families for family business or to develop existing
business.
59-78% of rural extended complex families with uncertain reproductive motivation expect the
following state support (first three highest percentage responses):
• preferential or free animals and minor agricultural machinery for young families in rural areas
depending on the number of children;
• depending on the number of children, long-term preferential agricultural or business loans to
be extended to young families for family business or to develop existing business;
• revival of socio-cultural life at the place of residence and affordable modern communications.
o
CONCLUSIONS
Socio-demographic composition and structure of the households/families
1. In accordance to survey results one household consists of, in the average, 1.4 families, average
number of household members is 4.2 persons, average number of family members – 3, and
number of members in families with underage children – 4 persons.
2. Among households those consisting of 3-6 members were dominant, and specific gravity of the
latter constituted 71.4%.
3. In almost three quarters of all interviewed families both in urban and rural areas men had the
leading role, average age of the latter is in urban areas - 49.8, and in rural areas - 52.9 years.
4. Average age of women, occupying leading position in the family exceeds same indicator among
men, occupying leading position by almost 10 years: in urban areas - 59.8, and in rural areas 62.5 years.
5. 39% of families with underage children living in urban areas are nuclear, 4% - incomplete and
57% are extended complex families and among those in rural areas 34 % are nuclear, 3 % incomplete and 63% - extended complex families.
81
6.
36.4% of members of households with children are those of 0-17 years of age, 54.2% are 18-59
years old and 9.4% are 60 and more years old.
7. 72.6% of the interviewed are married (living together), 8.6% are widows/widowers, 2.2% are
divorced and 16.6% have never been married. The specific gravity of the latter among rural
inhabitants is 5.8 percentage points higher compared to those of urban areas.
8. While analyzing marital status of household members it is possible to state a fact that among
women there is a high percentage of widows (14.2%) and divorced (3.7%). Comparing in
male-female distinction we get the following picture:
• Widows - 85%, widowers - 15%,
• Divorced women - 88%, divorced men - 12%:
9. As per the survey results household members absent for 3 and more months constitute 3.4% of
total number of household members, 67.9% of the former being in Russian Federation,
Ukraine and other CIS countries, around 1.8 % in the USA and European countries.
Employment
10. Gender problems present in Armenian labor market are clearly visible in surveyed families as
well. Reproductive behavior of the population is influenced by the fact, that the issue of
combination of parental and employment responsibilities of employed women and women
conducting their own business is not solved. Often, when business women or women earning a
significantly high salary are facing a choice between child and career, they choose the latter.
Birth of second and following children is all the more put under question. Problems rising
from this reality become especially burning today, under conditions of globalization of
economy.
11. The reproductive behavior of families is strongly connected to stable and well-paid job, as to
the main source of family development and welfare. Under difficult social-economical
circumstances and limited employment possibilities, first priority for many individuals is a fact
of having a job, and not compliance with professional skills, preferences and education
qualification: In case of highly paid job these factors may not be considered at all.
Incomes and expenditures
12. Among households with at least one underage child and families constituting such households
21% of revenue is received from salaries, 20% - from monetary support of relatives, 9% - from
other monetary support, 12% - other revenues, and state monetary allowances (pensions,
scholarships, unemployment benefits, immediate compensation for childbirth, childcare
benefit, family allowance, etc) constitute 38% of revenue. Thus, the specific gravity of state
social benefits in the structure of revenue of families still remain high and significantly exceeds
(in this case, by 17%) the specific gravity of salary.
82
13. The viability of families in Armenia is currently to significant extent provided by amounts,
sent by members of household who live abroad (average monthly sum is 35,000 AMD),
however those do not have regular nature.
14. In families with underage children indexes of average monetary revenues per one individual
are lower than 2009 basket of goods in the country, and in some cases – less than minimal
ration line. The three highest indexes were registered in Yerevan – 32,000 AMD, in the cities
of Ararat marz – 29,500 AMD and in the cities of Gegharkunik marz – 27,000 AMD.
Accomodation and living conditions
15. Conditions of accomodation and living are among major factors influencing reproductive
behavior. Every 10th of families with underage children do not have an apartment of their
own.
16. Accomodation conditions of 67% of families owning an apartment conform to or exceed the
residential-sanitary norms established during soviet years – 9 square meters per person.
Apartments of 33% of same are overpopulated.
17. 26% of nuclear families are overpopulated, 33% of extended complex families are in similar
situation.
18. Currently there are serious housing problems in the country, especially among multinomial
and large families. Housing problem of newly formed, young families is not less burning.
19. 1.2% of families in urban and 19.3% of families in rural areas are living in conditions below
minimal.
20. 56% of respondents stated, that they would like their children or themselves to continue
living in the same apartment, and 27% gave negative answer, 17% could not answer the
question. 21.3% of those who do not wish to live in the same apartment stated absence of
appropriate job, 15.4% - high level of poverty, 14.9% gave importance to the fact, that
problems of young families are neglected, 12.8% mentioned the insufficient level of modern
communication and social-economical conditions of the populated area, 11.6% - present
residential conditions.
21. 44% of respondents do not see their future in Armenia.
22. Absence of perspective for improvement of housing conditions does not allow families longing
to have children to have any.
Healthcare services
83
23. High level of physical availability and accessibility of healthcare is present. Only 3.5% of
respondents, mostly in rural areas, do not have healthcare institutions in their areas of
residence.
24. Almost in every third family (30%) respondents have stated origination of a health problem
within the last year, both in urban and rural areas (31.6% and 26.8% correspondingly):
25. Among population of urban areas, compared to population of rural areas, occurrence of health
problems is almost 2 times higher within the age group of 6-18 years old. This can speak either
of worse health conditions of children or of higher attention paid to the healthcare of children
by parents in urban families.
26. Amonng members of urban families of 63 years of age and older rate of occurrence of health
problems is 1.5 times higher than among those in rural families. This can indirectly indicate
that the given group of population gives importance to healthcare and to preventive visits to
healthcare institutions.
27. Compared to general healthcare, quality of obstetrics is higher:
28. Notwithstanding the free of charge preventive programs offered in the sphere of reporductive
health and a call for free annual examination visits, the visit rate is very low, equally in urban
and rural areas. Major reason of this is low level of population awareness.
29. In order to provide extended reproduction 59.7% of urban families and 59.5% of rural families
need affordble and quality healthcare services.
30. Healthcare and educational programs are mostly implemented in large cities, where
appropriate professional structures are present.
31. Recently introduced system of obstetrics and birth certificates is successfully working, which
is indicated by low percentage of those who pay for these services, only 6.5%, majority of
whom paid for medical services, paid room, food, disposable items, etc.
Child care and upbringing
32. Respondents from both rural and urban areas assessed the participation level of mother in
child care and upbringing issues as very high. Population of rural areas assesed the level of
participation of fathers in child care and upbringing issues higher than in population of urban
area.
33. Among the reasons for not giving enough time for children upbringing the main reason is their
overloading in the work places. The participation level of parents of nuclear families in the
issue of children care and upbringing is higher than in extended complex families.
84
34. Population of rural areas compared with the population of urban areas assessed the
participation level of grandmothers’ in children care and upbringing issues lower, but
grandfathers’ higher.
35. Population of urban areas assessed the role of preschool institutions in the issue of child
upbringing higher than population of rural areas, which is conditioned by lack of such
institutions in rural areas. It is an opposite situation regarding schools – population of rural
areas give more importance to the role of schools than population of rural areas. Nuclear
families assessed the participation level of schools and kindergartens in child upbringing issue
higher than in extended complex families.
36. Little number of people is using services of nurses. One of the reasons is not well established
institution of nurses. The services of nurses are used by mainly nuclear families living in urban
areas, where in case of parents’ employment there is no one to take care of the child.
Family values, marital and reprodutive orientations
37. The desired number of children comprised 2-3 children. The desired average number of
children comprised 2-3 children according to women’s opinion and 3 children according to
men’s opinion. The current number of children comprised 2 children.
38. The decisions on child upbringing, education, number of children and abortions are generally
made jointly by spouses. The decisions on marriage of child are made based on the opinions of
all members of the family.
39. The general observation shows that the participation of senior members of family in the
decision-making process is weakened. In the rural families the percentage of participation of
senior family members in the decision-making process is higher than in urban families,
particularly, regarding decisions on abortions, number of children and other important
domestic issues.
40. The estimations of impact of material security on fertility preferences state that due to the
opinion of only 27% of families, more children are delievered in families with material wellbeing. 47% of families are not agree with the mentioned statement. The survey results allow to
conclude that in Armenian reality the number of children is less related with the material
well-being of families. The number of children in the families doesn’t particularly depend on
economic factors and it means that group of ethnic-cultiral pecularities has stronger influence
of fertility preferences of population.
41. 57% of families prefers model of 3-4 children. These data are quite encouraging in terms of
state demographic policy. Within the framework of effective strategy and having all necessary
conditions and environment, the desired number of 3-4 children can become required and
85
realistic. The above-mentioned trends on desired number of children are same for both urban
and rural families.
42. The opinions of spouses on having 2-3 children are same for both urban and rural families. It
should be stated that among rural families the desire to have 3-4 children is higher with 5
percent points.
43. 16% of families has positive motivation on fertility preferences, while 68% - negative and 16%
- not oriented.
44. The income of 83% of families with negative motivation on fertility preferences is enough
only for basic or foodstaff expenses. 86% of families not oriented to have another child are in
the same socio-economic conditions.
45. Housing conditions of 52% of families with positive motivation on fertility preferences are
from 9 to 18 sq.meters per capita. 46% of families with same housing conditions have negative
motivation on fertility preferences, which states that their negative motivation is dute to other
reasons. At the same time, 34% of families with negative motivation on fertility preferences
lives in over-populated or severely populated housing conditions.
46. The fertility preferences of families with negative motivation and not-oriented are not
hardened yet. The reasons and supports expected from the state of families with such a
motivation confirm all the above-mentioned. In case of appropriate actions undertaken by the
state their negative motivation will be transformed to positive one.
47. 68% of families have no intentions of having the next child in the nearest years, from which
37% - extended complex families, 28% - nuclear families and 3% - not full nuclear families.
48. By general assessment there are also positive changes in providing free of charge healthcare
services to separate vulnerable groups of population. Expected positive development of
situation, of course, will lead the decrease in influences of facts conditioning negative
motivation of reproductive behavior and many families will revise their orientations and will
continue the traditional line of having mother families – having many children. Leaving
neglected the positive developments of situation is full of the risks of worsening of the
demographic situation, which will lead not only to the hardening of negative motivations but
also to the decrease of existing resources.
49. Among families living in urban and rural areas following negative motivations for having next
child are dominating:
• Absence of opportunities for provision of good future for child / urban – 25%, rural –
44%/
• Socio-economic situation of family / urban and rural – 30%
• Unwillingness of one of spouses / urban – 25%, rural – 38% /
• Bad housing conditions / urban – 16%, rural – 7% /
86
•
•
•
Absence of husband / urban – 5%, rural – 10% /
Health situation of one of spouses / urban and rural – 5% /
Another reasons marked 19.4% of families living in urban areas, 10.8% of families
living in rural areas. Among another reasons there are the following issues: intention to
leave republic, conflicts among spouses, having nobody to deal with child care, career
issues and etc.
50. The main part of respondents supported family model with average number of children, by
opinion of 88.7% desired number of children in the family is 2-4, in spite of this every second
person rejects the idea of having next child during the nearest years connected with socioeconomic situation of family and housing conditions, every fifth - connected with concern on
being unable to provide future well-being. Therefore, in case of implementation of social
programmes and improvement of moral and psychological environment of the country
significant increase of fertility can be expected.
Expected state support for having at least three children
51. Vast majority of families, in spite of the family type and place of residence, expected provision
of availability of qualified healthcare services from state for provision of extended
reproduction.
52. Families living in urban areas expected from state mainly:
• Provision of short working hours with full payment regarding child care
• Provision of availability of preschool and educational services
• Extension of paid postnatal vacation period
• Activation of social-cultural life in residence places and creation of available
opportunities for using modern communication means
• Provision of longterm business loans with special conditions to young families for
conduction of business or developing their owned businesses based on the number
of their children .
53. Families living in rural areas are mainly expecting:
• Provision of cattle, small agricultural machinery under special conditions or free of
charge to young families based on the number of children,
• Activation of social-cultural life in residence places and creation of available
opportunities for using modern communication means,
• Provision of availability of preschool and educational services,
• Provision of longterm agricultural or business loans with special conditions to
young families for conduction of business or developing their owned businesses
based on the number of their children
• Provision of tax prvivileges starting from third child in case of having family
business
87
88
PROPOSALS
1. The problem of women employed in business and hired work combining working and parental
duties shall be solved without delay. In particular, to establish flexible working schedules for women
with underaged children, shorter working hours with preserved salary rate, training (if needed and
requalification) at the expense of the employer, under strict observance of article 114, part 1,
paragraph 2 of the Labor Code.
2. It is necessary to raise the value of the family and family life which would reduce the number of
civil marriages. There is a need to develop and implement long-term targeted state programs for
families with three and more children. In particular, the “family capital” program can be introduced
and to use it for the improvement of living conditions, children’s education and healthcare of parents
and children. This measure would motivate birth rates but would also reduce the artificial single
motherhood and increase the number of official marriages.
3. 88.7% of respondent families quoted 2-4 as the desirable number of children. Of which 50% for
socio-economic reasons are not going to have children in the near future which calls for measures to
enhance the stability and wellbeing of families. Taking into account that about 1/3 of the respondents
have overpopulated apartments, first of all, mortgage loan conditionalities for young families shall be
reconsidered, especially, after the birth of the fourth child the state shall compensate the entire
balance of the mortgage loan. Of no less importance is the construction of social apartments and the
introduction of the apartment allowance system.
4. Taking into account the wide gap between supply and demand on the job market, long-term
unemployment, prevalence of women among registered unemployed (as of 01.01.2010, over 70%),
low competitiveness of women with children on the job market, the expenses on new born childcare,
and the opinions of all the unemployed mothers with small children about their expectations from the
state, it is proposed to provide monthly allowances for childcare also for unemployed mothers, while
for employed mothers, the allowance shall be differentiated based on her average salary. This
approach would encourage working women to disclose their income.
5. Supervision over healthcare services provided by the state for the population (especially, women
and children in rural areas) shall be enhanced.
6. In the sphere of reproductive health services, it is necessary to provide periodic (twice a year) state
programs for mobile medical examination and treatment by means of specialized mobile medical
vehicles equipped with needed instruments.
7. It is necessary to introduce mandatory oversight of the health of children born at home (without
professional intervention) and mothers. Special attention shall be paid to the development of the
institution of the family doctor. Taking into account the problems with healthcare service provision
in rural areas (due to the lack of adequate specialized entities), there is a need to introduce specialized
mobile teams in rural communities (particularly, the ones far from provincial capitals) to make such
services accessible.
89
8. After childbirth, it is reasonable to grant mothers vouchers to pay for health services from the
amounts allocated to hospitals from the state budget, whereby mothers will pay for health services
themselves after completion of medical treatment. This approach will make health institutions
provide quality services.
9. It is necessary to make long families attractive; to this end, first of all, it is necessary to create socioeconomic and dwelling conditions for long families, preferential working conditions for an employed
mother of multiple children (short working hours, working at home if possible), enlargement of the
pre-school network, especially, in rural areas, discount rates for kindergartens depending on the
number of children in a long family, to cover the children from long families in state-funded
university programs, and in paid educational institutions, to make discounts depending on the
number of children in the student’s family or compensation of annual tuition fees.
10. To provide free and high quality reproductive health services.
11. In this country there is a need to take measures for the introduction of the institution of the
qualified baby-sitter for child care and upbringing in families. In this country the services of babysitters are provided by individuals either by classified ads or through friends and relations. There is a
need to take practical steps including secondary vocational education for baby-sitters (regular
training), establishment of entities providing nursing services for chidren, disabled and aged people.
The introduction of the institution of the baby-sitter and its enhancement in all the marzess of this
country would enable mother in busness and hired work to combine child care and upbringing with
full-time employment as well as create conditions for career growth. Let’s us note that there is
demand for a qualified baby-sitter not only in this country but also abroad.
12. In elementary schools, it is necessary to introduce extended day-care groups which would enable
mothers to work.
13. Reproductive behavior of young families is much affected by the availability of kindergartens,
educational, general education and culture facilities at the place of residence, sufficiency of provided
services, accessibility and affordability due to the desire to have well developed children. Integrated
measures shall be implemented to this end in marzes, especially, in remote, borderline rural areas, to
improve accessibility and affordability of kindergartens, educational, general education and culture
services.
14. To raise public awareness about reproductive programs implemented by the state, community,
international and local donors, and NGOs, using TV and print media.
15. State demographic policy is directly related to state family policy. There is a need to specify the
notions of the “family” and “family with multiple children” for the purpose of targeted state policy.
16. Survey results show that state policy shall be implemented in two directions at the same time:
• encouragement of sustainability of the family;
• child support in families.
90
If child support is more or less provided in social policy, then a policy to encourage sustainability of
the family is yet to be designed. The opinions of families and expected forms of state support
presented in this survey can be used for the design of the policy to encourage sustainability of the
family. The needs of and the forms of state support expected by the families as shown in this survey
can be used in the development of family systainability policy (e.g., long-term soft loans for
agriculture or business to develop family business for young families or upgrade of exhisting business
depending on the number of chuldren). It is desirable to encourage income-generating family
business in border-line and remote communities taking into account increased migration from such
communities.
17. State policy strategy aimed at the improvement of the demographic situation can be successful
only when positive motivation in reproductive behavior matches intentions. Otherwise, even large
financial support may be undemanded which occurs in developed European countries with similar
demographic problems. In such conditions state demographic policy shall properly respond to the
current situation; its efficiency to a great extent depends on the assessment and analysis of the current
situation in social surveys, and proposed realistic solutions.
91


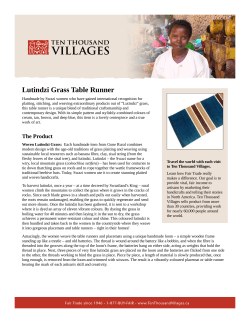


© Copyright 2026