
example for a manufacturing company; however, we can address a similar
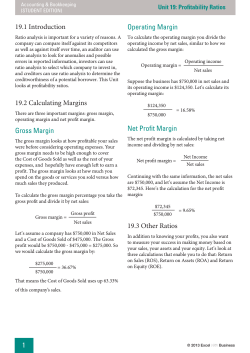
Please NOTE – This example report is
for a manufacturing company;
however, we can address a similar
report for any industry sector.
Performance Review
For the period ended 12/31/2013
Provided By
Holbrook & Manter, CPAs
Page 1 / 14
Financial Score
Sample Manufacturer Narrative Report
Industry:
Revenue:
Periods:
33911 - Medical Equipment and Supplies Manufacturing
$10M - $50M
12 months against the same 12 months from the previous year
Report Summary
Liquidity
67 out of 100
A measure of the company's ability to meet obligations as they come due.
Operating Cash Flow Results
Cash flow from operations has increased relative to sales since last period and is at a
healthy level, generally. This is always good to see; ultimately, cash flow drives long-run
liquidity for almost every company.
General Liquidity Conditions
Unfortunately, all too often in financial analysis, companies get so caught up in the details
that they miss the big picture. That is what the company is going to derive from this report.
The most important component of a firm's success is liquidity -- its ability to pay the bills.
Liquidity is a measure of the firm's cash position and it keeps a company in business in the
short run.
Despite increases in both sales and profits, the company is in approximately the same
liquidity position as it was in last period -- its liquidity barometers have not changed very
much. Like last period, the company's overall liquidity position is quite good. This means
that the firm has plenty of current assets as compared to short-term financial obligations.
This assessment is made by comparing all of the company's current assets to all of its
current liabilities (the current ratio). The positions of other similar companies are also
Page 2 / 14
examined to see how this company compares to other firms in the industry.
However, as was the case last period, the company's cash and near-cash accounts only look
fair as compared to its current obligations. This means that the overall condition of the
firm's liquidity is good, but it may want to work on its liquidity composition over time. To be
specific, there is a difference between having a good overall position and having strong cash
accounts.
The major liquidity "turn" ratios seem to be in line with industry averages. Specifically,
accounts receivable, accounts payable, and inventory days ratios are all in a normal range.
All of these tend to have a substantial effect on the cash account specifically.
LIMITS TO LIQUIDITY ANALYSIS: Keep in mind that liquidity conditions are volatile, and this is a general analysis looking at a
snapshot in time. Review this section, but do not overly rely on it.
Generally, this metric measures the overall liquidity position of a company. It is certainly not a perfect barometer, but it is a good one.
Watch for big decreases in this number over time. Make sure the accounts listed in "current assets" are collectible. The higher the
ratio, the more liquid the company is.
This is another good indicator of liquidity, although by itself, it is not a perfect one. If there are receivable accounts included in the
numerator, they should be collectible. Look at the length of time the company has to pay the amount listed in the denominator
(current liabilities). The higher the number, the stronger the company.
Page 3 / 14
This metric shows how much inventory (in days) is on hand. It indicates how quickly a company can respond to market and/or
product changes. Not all companies have inventory for this metric. The lower the better.
This number reflects the average length of time between credit sales and payment receipts. It is crucial to maintaining positive
liquidity. The lower the better.
This ratio shows the average number of days that lapse between the purchase of material and labor, and payment for them. It is a
rough measure of how timely a company is in meeting payment obligations. Lower is normally better.
Profits & Profit Margin
81 out of 100
A measure of whether the trends in profit are favorable for the company.
The company's sales have increased this period, and so have its net profit dollars. This
Page 4 / 14
company is clearly performing well in the Profitability area at this time. Not only is the net
profit margin good, but net profits (in dollars) have risen by 9.61% from last period.
Whenever a company has a good net margin and increases net profits concurrently, most
other parts of the business will fall into place. Returns on equity and assets will also
generally increase. Even the company's cash position will improve over time. In short, good
work in this area, as this company has achieved, generally leads to overall financial health
for the company.
Keep in mind that the net margin is the net profit percentage -- the cents of net profit
extracted from each sales dollar generated. This company has maintained a strong net profit
margin over multiple periods, which is particularly good. Having a strong net profit margin
means that the company is performing well both generally and relative to other firms in this
industry; this is depicted in the graph area of the report. The net profit margin is the most
important Income Statement ratio to manage because it indicates how effective the
company is at balancing its sales dollars and its costs.
This number indicates the percentage of sales revenue that is not paid out in direct costs (costs of sales). It is an important statistic that
can be used in business planning because it indicates how many cents of gross profit can be generated by each dollar of future sales.
Higher is normally better (the company is more efficient).
This is an important metric. In fact, over time, it is one of the more important barometers that we look at. It measures how many cents
of profit the company is generating for every dollar it sells. Track it carefully against industry competitors. This is a very important
number in preparing forecasts. The higher the better.
Page 5 / 14
This metric shows advertising expense for the company as a percentage of sales.
This metric shows rent expense for the company as a percentage of sales.
This metric shows G & A payroll expense for the company as a percentage of sales.
Sales
76 out of 100
A measure of how sales are growing and whether the sales are satisfactory for the company.
The company's sales have risen this period, which is clearly a positive result. This report
does not focus on sales results because this data tends to be straightforward to analyze.
However, the company's fixed asset base grew at a faster rate than sales. This means that
Page 6 / 14
"asset turns" (or the amount of sales revenue driven through each dollar of fixed assets)
has fallen slightly from last period, which might be considered unfavorable. It is possible
that these new assets require some time to contribute to sales, or that the assets were not
purchased with the idea of increasing sales. Managers should look for long-term trends in
this area.
Borrowing
71 out of 100
A measure of how responsibly the company is borrowing and how effectively it is managing debt.
Net profitability improved with relatively little change in borrowing (debt), which is very
good. There does not seem to be a correlation at this time between debt and profitability,
since profitability improved on an even debt base. Yet, it might be interesting to determine
if there were any prior period changes (increases or decreases) in debt that might have
helped profitability this period. If not, the company has improved Income Statement
performance without adding significant debt, which is positive. Over the short term (two
years or less) it is generally preferable to borrow money when there will be a demonstrated
return -- when the increases in borrowing will improve profitability. In this case, the
company was able to improve profitability without borrowing money, which indicates an
efficient use of debt by the company.
While the overall trend in this area seems to be positive, the following areas may merit
further attention. When compared to its industry peers, the company has generated an
average amount of earnings (before interest and non-cash expenses) to cover its debt
obligations. It also seems to have a relatively high level of debt compared to equity.
Therefore, small changes in earnings could have a significant impact on the company’s
ability to meet interest obligations.
This ratio measures a company's ability to service debt payments from operating cash flow (EBITDA). An increasing ratio is a good
indicator of improving credit quality. The higher the better.
Page 7 / 14
This Balance Sheet leverage ratio indicates the composition of a company’s total capitalization -- the balance between money or assets
owed versus the money or assets owned. Generally, creditors prefer a lower ratio to decrease financial risk while investors prefer a
higher ratio to realize the return benefits of financial leverage.
This ratio measures a company's ability to repay debt obligations from annualized operating cash flow (EBITDA).
Assets
44 out of 100
A measure of how effectively the company is utilizing its gross fixed assets.
Improved profitability is not the sole indicator of success with regard to resource
management. This case is a perfect example: although profitability has improved from last
period, fixed assets increased at a much higher rate than profitability. This is not a favorable
result, because assets are like any other type of cost. When they are added, profitability
should improve at an even faster rate. It is possible that the assets added need time to
become fully contributing or they may simply not be producing enough profitability.
Notice that the company generated a relatively strong return on assets and equity this
period. This is a positive result for both investors/owners and creditors of the company.
Assets generally represent a cost to the company that is expected to reap future benefits, so
it is good to see the company earning strong profitability relative to its assets.
Page 8 / 14
This measure shows how much profit is being returned on the shareholders' equity each year. It is a vital statistic from the perspective
of equity holders in a company. The higher the better.
This calculation measures the company's ability to use its assets to create profits. Basically, ROA indicates how many cents of profit
each dollar of asset is producing per year. It is quite important since managers can only be evaluated by looking at how they use the
assets available to them. The higher the better.
This asset management ratio shows the multiple of annualized sales that each dollar of gross fixed assets is producing. This indicator
measures how well fixed assets are "throwing off" sales and is very important to businesses that require significant investments in
such assets. Readers should not emphasize this metric when looking at companies that do not possess or require significant gross fixed
assets. The higher the more effective the company's investments in Net Property, Plant, and Equipment are.
Employees
86 out of 100
A measure of how effectively the company is hiring and managing its employees.
Page 9 / 14
This company has some rather interesting results with regards to employee management.
Net profitability has improved from last period while the employee base has remained
relatively flat. This means that the company is improving its net profitability per employee
statistic, which is a key performance indicator in this particular industry. It also indicates
that the company's management of its existing employee base is better than it was last
period.
There is no indication from these specific results that hiring more people is necessary at this
time. If the company can generate improved net profitability with about the same employee
base, there may be no compelling reason to add more employees. One exception to this
would be if the company has reached a sort of "employee ceiling" -- the point after which
the efficiency of existing employees is exhausted, and thus the company will need more
employees to improve profitability. This can only be determined internally, so careful
planning is needed here.
"Management is doing things right; leadership is doing the right things." -- Peter F. Drucker
This data is based on the two most recent available periods.
A NOTE ON SCORING: Each section of this report (Liquidity, Profits & Profit Margin, etc.) contains a numerical score/grade, which is
a rough measure of overall performance in the area. Each grade represents a score from 1 to 100, with 1 being the lowest score and 100
being the highest. Generally, a score above 50 would be a "good" score and a score below 50 would be a "poor" score. The scores are
derived by evaluating the company's trends, either positive or negative, over time and by comparing the company to industry averages for
different metrics.
Page 10 / 14
Raw Data
Income Statement Data
12/31/2011
12/31/2012
12/31/2013
Sales (Income)
$19,965,000
$19,800,000
$21,010,000
Cost of Sales (COGS)
Gross Profit
$11,380,050
$8,584,950
$11,286,000
$8,514,000
$12,185,800
$8,824,200
Gross Profit Margin
G & A Payroll Expense
43.00%
$2,298,250
43.00%
$2,298,000
42.00%
$2,396,600
Rent
Advertising
Depreciation
$410,100
$79,480
$399,300
$410,100
$91,350
$406,000
$410,100
$89,750
$420,200
Interest Expense
Net Profit Before Taxes
$389,615
$2,804,835
$398,000
$2,902,375
$395,625
$3,181,425
Adjusted Net Profit before Taxes
Net Profit Margin
$2,804,835
14.05%
$2,902,375
14.66%
$3,181,425
15.14%
EBITDA
Net Income
$3,593,750
$1,766,655
$3,706,375
$1,911,700
$3,997,250
$2,130,925
Balance Sheet Data
12/31/2011
12/31/2012
12/31/2013
Cash (Bank Funds)
$589,640
$619,500
$657,000
Accounts Receivable
Inventory
$1,968,848
$2,388,920
$2,002,000
$2,238,785
$1,990,800
$2,173,190
Total Current Assets
Gross Fixed Assets
$5,726,688
$4,553,160
$5,629,935
$5,085,275
$5,490,790
$6,416,600
Total Assets
Accounts Payable
$9,939,728
$858,753
$9,899,210
$856,377
$10,711,990
$747,863
Total Current Liabilities
Total Liabilities
Total Equity
$1,607,675
$8,507,288
$1,432,440
$1,480,941
$8,100,881
$1,798,329
$1,545,726
$8,563,844
$2,148,146
Number of Employees (FTE)
123.0
121.0
121.0
Common Size Statements
Industry*
(2879)
Income Statement Data
12/31/2011
12/31/2012
12/31/2013
Sales (Income)
100%
100%
100%
100%
Cost of Sales (COGS)
Gross Profit
57%
43%
57%
43%
58%
42%
48%
52%
G & A Payroll Expense
Rent
12%
2%
12%
2%
11%
2%
23%
3%
Advertising
Depreciation
Interest Expense
0%
2%
2%
0%
2%
2%
0%
2%
2%
1%
1%
1%
Net Profit Before Taxes
Adjusted Net Profit before Taxes
14%
14%
15%
15%
15%
15%
5%
5%
EBITDA
Net Income
18%
9%
19%
10%
19%
10%
7%
4%
Balance Sheet Data
12/31/2011
12/31/2012
12/31/2013
Cash (Bank Funds)
6%
6%
6%
10%
Accounts Receivable
Inventory
20%
24%
20%
23%
19%
20%
26%
22%
Total Current Assets
58%
57%
51%
66%
Industry*
(2879)
Page 11 / 14
Gross Fixed Assets
Total Assets
46%
100%
51%
100%
60%
100%
60%
100%
Accounts Payable
Total Current Liabilities
9%
16%
9%
15%
7%
14%
14%
39%
86%
82%
80%
65%
14%
18%
20%
35%
*The industry common size figures shown above were taken from all private company data for companies with industry code 33911 for all years in
all areas in all sales ranges.
Total Liabilities
Total Equity
Page 12 / 14
Industry Scorecard
Financial Indicator
Current Ratio
Current Period
Industry Range
Distance from
Industry
3.55
1.60 to 2.90
+22.41%
= Total Current Assets / Total Current Liabilities
Explanation: Generally, this metric measures the overall liquidity position of a company. It is certainly not a perfect barometer, but
it is a good one. Watch for big decreases in this number over time. Make sure the accounts listed in "current assets" are collectible.
The higher the ratio, the more liquid the company is.
Quick Ratio
1.71
1.00 to 2.20
0.00%
= (Cash + Accounts Receivable) / Total Current Liabilities
Explanation: This is another good indicator of liquidity, although by itself, it is not a perfect one. If there are receivable accounts
included in the numerator, they should be collectible. Look at the length of time the company has to pay the amount listed in the
denominator (current liabilities). The higher the number, the stronger the company.
Inventory Days
65.09 Days
60.00 to 90.00 Days
0.00%
= (Inventory / COGS) * 365
Explanation: This metric shows how much inventory (in days) is on hand. It indicates how quickly a company can respond to
market and/or product changes. Not all companies have inventory for this metric. The lower the better.
Accounts Receivable Days
34.59 Days
30.00 to 60.00 Days
0.00%
= (Accounts Receivable / Sales) * 365
Explanation: This number reflects the average length of time between credit sales and payment receipts. It is crucial to maintaining
positive liquidity. The lower the better.
Accounts Payable Days
22.40 Days
20.00 to 50.00 Days
0.00%
= (Accounts Payable / COGS) * 365
Explanation: This ratio shows the average number of days that lapse between the purchase of material and labor, and payment for
them. It is a rough measure of how timely a company is in meeting payment obligations. Lower is normally better.
Gross Profit Margin
42.00%
35.00% to 46.00%
0.00%
= Gross Profit / Sales
Explanation: This number indicates the percentage of sales revenue that is not paid out in direct costs (costs of sales). It is an
important statistic that can be used in business planning because it indicates how many cents of gross profit can be generated by each
dollar of future sales. Higher is normally better (the company is more efficient).
Net Profit Margin
15.14%
1.00% to 8.00%
+89.25%
= Adjusted Net Profit before Taxes / Sales
Explanation: This is an important metric. In fact, over time, it is one of the more important barometers that we look at. It measures
how many cents of profit the company is generating for every dollar it sells. Track it carefully against industry competitors. This is a
very important number in preparing forecasts. The higher the better.
Interest Coverage Ratio
10.10
4.00 to 15.00
0.00%
= EBITDA / Interest Expense
Explanation: This ratio measures a company's ability to service debt payments from operating cash flow (EBITDA). An increasing
ratio is a good indicator of improving credit quality. The higher the better.
Debt-to-Equity Ratio
3.99
1.00 to 2.50
-59.60%
= Total Liabilities / Total Equity
Explanation: This Balance Sheet leverage ratio indicates the composition of a company’s total capitalization -- the balance between
money or assets owed versus the money or assets owned. Generally, creditors prefer a lower ratio to decrease financial risk while
investors prefer a higher ratio to realize the return benefits of financial leverage.
Debt Leverage Ratio
2.14
N/A
N/A
= Total Liabilities / EBITDA
Explanation: This ratio measures a company's ability to repay debt obligations from annualized operating cash flow (EBITDA).
Page 13 / 14
Return on Equity
99.20%
8.00% to 20.00%
+396.00%
= Net Income / Total Equity
Explanation: This measure shows how much profit is being returned on the shareholders' equity each year. It is a vital statistic from
the perspective of equity holders in a company. The higher the better.
Return on Assets
19.89%
6.00% to 10.00%
+98.90%
= Net Income / Total Assets
Explanation: This calculation measures the company's ability to use its assets to create profits. Basically, ROA indicates how many
cents of profit each dollar of asset is producing per year. It is quite important since managers can only be evaluated by looking at how
they use the assets available to them. The higher the better.
Fixed Asset Turnover
3.27
6.00 to 18.00
-45.50%
= Sales / Gross Fixed Assets
Explanation: This asset management ratio shows the multiple of annualized sales that each dollar of gross fixed assets is producing.
This indicator measures how well fixed assets are "throwing off" sales and is very important to businesses that require significant
investments in such assets. Readers should not emphasize this metric when looking at companies that do not possess or require
significant gross fixed assets. The higher the more effective the company's investments in Net Property, Plant, and Equipment are.
NOTE: Exceptions are sometimes applied when calculating the Financial Indicators. Generally, this occurs when the inputs used to
calculate the ratios are zero and/or negative.
READER: Financial analysis is not a science; it is about interpretation and evaluation of financial events. Therefore, some judgment will
always be part of our reports and analyses. Before making any financial decision, always consult an experienced and knowledgeable
professional (accountant, banker, financial planner, attorney, etc.).
Page 14 / 14


© Copyright 2026