
Seismic analysis of masonry buildings: equivalent frame approach with fiber... elements
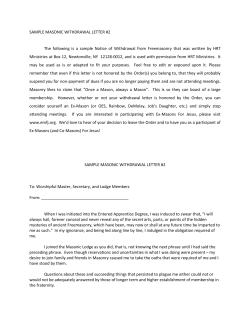
Proceedings of the 9th International Conference on Structural Dynamics, EURODYN 2014 Porto, Portugal, 30 June - 2 July 2014 A. Cunha, E. Caetano, P. Ribeiro, G. Müller (eds.) ISSN: 2311-9020; ISBN: 978-972-752-165-4 Seismic analysis of masonry buildings: equivalent frame approach with fiber beam elements Vincenzo Sepe, Enrico Spacone, Eva Raka & Guido Camata University “G. D’Annunzio” of Chieti-Pescara, Department of Engineering and Geology, Italy email: [email protected], [email protected], [email protected] & [email protected] ABSTRACT: The seismic analysis of masonry buildings by means of the equivalent frame simplified methodology has received considerable attention in the last decades; the walls are modeled with macroelements to represent the in-plane nonlinear behavior of the panels. The mechanical characterization of these macroelements is the crucial point that defines the specific frame approach. In the present paper, the spandrels and the piers of the masonry wall are modeled through fiber section force-based elements that accounts for both axial-flexural and shear deformations, while the connecting nodes are assumed as rigid. The approach is investigated using the open source computational platform OpenSees that allows coupling between flexural and shear responses through a section aggregator procedure. The interaction between axial load and bending behavior is automatically accounted for by the fiber section model. The shear response is given by a phenomenological law and flexure shear coupling is enforced at the element level. The approach is very simple and quite promising for both research and practice and the first numerical tests on sample cases show both numerical robustness in monotonic and cyclic analyses under vertical and horizontal loads and a satisfactory agreement with available experimental test results. KEY WORDS: masonry, macro-element, finite element, frame-equivalent model, nonlinear analysis, fiber section, N-M interaction diagram. 1 INTRODUCTION A significant part of the historic heritage in Italy and many other European countries consists of old masonry constructions and this system is also widespread all over the world. Usually, older unreinforced masonry (URM) buildings were conceived to carry only vertical loads and most of them have experienced a continuous process of modification over the years. Moreover, masonry is a composite material, whose components (bricks or stones and mortar) can be very different due to historical or technological reasons, and this makes its behavior difficult to predict. This difficulty is also due to different possible failure modes and to nonuniformities in construction quality. 2 2.1 GENERALITIES ABOUT MASONRY BUILDINGS Local and global response of masonry buildings 2.2 The Equivalent frame models To deal with the global response of real buildings, many researchers introduced a modelisation of the masonry walls as one-dimensional macro-elements, in such a way to represent the walls by means of framed structures, and to apply then conventional methods of structural mechanics (e.g. [1] and papers there quoted). This idea has been indeed investigated and developed by many researchers, that led for example to the POR method developed in the seventies [2], and that was more recently used in programs such as 3Muri [3] or SAM [4]. Some common assumptions are made in these type of models: the wall deformation is assumed to be lumped in piers and spandrels and the other parts of the wall are considered rigid. A frame equivalent model is shown in Figure 1, where the piers and the spandrels are represented by columns and beams, respectively. Damage observed in past earthquakes showed that masonry buildings are vulnerable to local failures, mainly due to the out-of plane response of walls. These failure mechanisms are mainly caused by poor connections between the orthogonal walls and between walls and floors. Without a box behaviour, the seismic vulnerability mainly depends on the out-of-plane collapse mechanisms of the resisting macroelements – e.g. masonry external walls or portions of them – rather than on the in-plane ultimate strain state in the masonry. In buildings with well connected walls the box behavior governs the seismic response; this buildings are the focus of the present paper. Figure 1. A frame equivalent representation of a wall 237 Proceedings of the 9th International Conference on Structural Dynamics, EURODYN 2014 The main advantage of this numerical approach is its computationally efficiency and for this reason the equivalent frame method may also be suitable for studying very large buildings or aggregates. With an appropriate formulation, in fact, the macroelement model can represent with a good approximation the cyclic shear and the flexural response of masonry panels. In particular, the failure mechanisms of masonry piers subjected to horizontal (e.g. seismic) loads are the following [5][6] (see Figure 2): a) rocking failure: the failure is related to the crushing of the pier in the compressed zone; b) shear-diagonal failure: the failure of the pier is due to excessive shear stresses and consequently formation of inclined diagonal cracks; c) shear-sliding failure: the failure is associated to horizontal cracks in the bed-joints. Figure 2. Failure mechanisms of a masonry pier: a) rocking failure; b) shear-diagonal failure; c) shear-sliding failure (adapted from [6]). 3 3.1 Figure 3. Fiber section discretization 3.2 Shear implementation: the section aggregator Shear deformations, which are often neglected in more simplified procedures, have an important role in the total nonlinear displacements in masonry walls, and for this reason they have been included in the proposed model by means of a trilinear force displacement law with pinching hysteretic behavior. A section aggregator in OpenSees framework is then used to combine flexural and shear behavior. This command aggregates into a single section force-deformation model the flexural response - described here by means of a fiber-section approach - and the shear response -described by the trilinear V- law. Each Material-Object represents the section forcedeformation response for a particular degree-of-freedom, and at the section level there is no interaction between responses in different dofs. THE EQUIVALENT FRAME MODEL USING FIBER FRAME ELEMENTS Formulation of the fiber section beam element In the equivalent-frame approach discussed here the flexural behavior is computed considering a force-based frame element with the fiber section model and performing a moment-curvature analysis. The approach is investigated using the open source computational platform OpenSees [7][17] and the masonry walls are modeled as "NonlinearBeamColumn" elements. This command is used to construct a beam element object, which is based on the iterative force-based formulation, that has been originally developed for the simulation of reinforced concrete members under seismic actions [8]. In the distributed inelasticity used in this model the element response is determined by numerical integration of the nonlinear response at several monitored sections along the element. The flexure and axial behavior is modeled using a nonlinear fiber stress-strain relation (material nonlinearity) (see Figure 3. Figure 4. Section Aggregator Using the force-based formulation [8], equilibrium is imposed at the element level, thus enforcing shear-bending interaction. 4 4.1 PARAMETRIC ANALYSIS OF MASONRY WALLS Opensees parametric analysis implementation In the present Section, the fiber model approach is used to simulate the seismic response of two masonry panels. The accuracy in describing the material properties, combined with the low computational effort required to perform the analyses 238 Proceedings of the 9th International Conference on Structural Dynamics, EURODYN 2014 give the possibility to carry out several analyses. In particular, pushover analyses were performed on two columns with different slenderness ratios to determine the drifts at which failure of the column occur. The panels geometry analyzed are shown in Figure 5. c 0 f cp 2 c 0 c 0 (1) c0 f cp cu cu f cu f cp cu c 0 (2) cu f cu (3) where fcp, fcu , c0 and cu denote the compressive strength and the residual strength, respectively, and their corresponding strains. The second constitutive relation used in this study, that includes tensile strength branch, is called in Opensees Concrete06 (see Figure 7). Figure 5. Panels geometry (N: total load; dimension in [m]) The Opensees input data of the two panels are summarized in Table 1. Table 1. Geometry of panels in Figure 5 (tCol : thickness). First panel Second panel 4.2 LCol [m] 1.6 3 HCol [m] 3 3 tCol[m] 0.25 0.25 Masonry constitutive law In the proposed model the masonry behavior under compression load is described by the modified Kent and Park model [9][10]. Although originally introduced for concrete, this law (see Figure 6) can reproduce many of the properties of masonry nonlinear behaviour: linear elasticity, nonlinear relationship before the peak stress and softening branch. Figure 7. Concrete06 constitutive law The compressive constitutive law of Concrete 06 is defined as the Thorenfeldt - base curve, which is similar to the one defined by Popovics [11][17]: n c 0 c f c' nk c n 1 0 (4) where f 'c and ε0 are the compressive strength and the corresponding strain, respectively, while n and k are parameters. According to Belarbi and Hsu [12], the tensile envelope is described by f c cr c cr c cr Figure 6. Concrete01 Kent and Park constitutive law The following expressions [10][17] are used for the modified Kent and Park model: c cr c f cr cr c (5) b (6) where fcr and εcr are the tensile strength and strain, respectively, and b is a parameter. 239 Proceedings of the 9th International Conference on Structural Dynamics, EURODYN 2014 4.3 Parametric analysis of the slender wall, panel one 250 Material 1 200 Vbase[kN] The panel is modeled with a fiber section force-based element described in section 3.1. The lateral force resistance of this wall depends primarily on the boundary conditions, on the effect of the axial loads and on the characteristics of the material constitutive law. The parameters considered in this work to investigate their influence on the wall global behavior are: the material constitutive law softening branch, the initial axial load and the tensile strength. The geometry, boundary and load conditions are shown in Figure 8. The base shear-displacement curves for each material constitutive law (see Figure 9) are presented in Figure 10. The maximum axial load capacity for the slender panel is equal to Nmax=1600kN. The pushover analyses shown in Figure 10 have all the same value of initial axial load 0.5Nmax = 800kN. It is evident from the graph that the behavior of material 3 is more brittle than the other ones. 150 Material 2 100 50 Material 3 0 0 5 10 15 20 25 Displacement d[mm] Figure 10. Shear-displacement curves for the different material constitutive laws (see Figure 9). Figure 8. Boundary conditions and geometry of first panel In the first analysis the constitutive law chosen to represent the behavior masonry is Concrete 01. Different configurations of the softening branch of the constitutive law are varied as shown in the Table 2 and Figure 9. Table 2. Concrete 01 - Material properties (symbols in Fig. 6). material 1 material 2 material 3 fcp[MPa] 4 4 4 fcu[MPa] 3.5 2.5 1.5 c0 0.004 0.004 0.004 cu 0.02 0.02 0.02 The softening branch influences the behavior of the post peak response of the panel. The second parameter investigated is the initial vertical load. The shear-displacement curves shown in Figure 11 are obtained with the concrete law material 3 (see Figure 9) for different value of axial load. The graph shows that for the axial load equal to 0.1Nmax = 160kN the panel behavior is more ductile, but shows a lower lateral force resistance. 250 5 Material 3 N=0.5 Nmax 200 Material 3 N=0.35 Nmax 4 "Material 1" "Material 2" Vbase[kN] [MPa] 3 Material 3 N=0.25 Nmax 150 100 Material 3 N=0.1 Nmax 2 "Material 3" 50 1 0 0 0 0 0,005 0,01 0,015 0,02 Figure 9. Effect of different materials constitutive law parameters 0,025 5 10 15 20 Displacement d[mm] Figure 11. Shear-displacement curves for different values of axial load imposed on the column It is clear that by increasing the initial axial load, the wall shear strength increases but the wall behavior becomes more 240 Proceedings of the 9th International Conference on Structural Dynamics, EURODYN 2014 brittle The maximum axial load used in this analysis is equal to 0.5Nmax = 800kN. This value correspond to the maximum moment capacity of the wall section as shown in the axial load-moment interaction diagram shown in Figure 13. Figure 15 shows the horizontal load-displacement curves obtained with Concrete 01 (material 3) and Concrete 06. The curves show that after reaching the maximum force, the load decreases abruptly. The post peak behavior is controlled by the softening branch of the curve. The results show that the tensile strength influences slightly the wall behavior. 250 Concrete 06 Figure 12. Slender wall fiber section C 200 C 300 Vbase[kN] 150 200 M [kNm] Concrete 01 B D D B 100 50 100 A 0 0 0 0,2 0,4 0,6 0,8 1 N/Nmax Figure 13. M-N Interaction diagram for the section described in Figure 12 Another important parameter investigated in this study is the masonry tensile strength. The analyses are performed using the material Concrete 06 and Concrete 01 described in section 4.2. Concrete 01 is defined as material 3 in Table 2 and Concrete 06 is described in Table 3. It should be noted (Figure 14) that the softening curve of Concrete 06 is calibrated to match as close as possible material 3, therefore the only parameters varied is the material tensile strength. 0 A 2 4 6 8 10 Displacement d[mm] Figure 15. Pushover shear-displacement curves using the materials of Figure 14 (N = 0.5 Nmax). Figure 16 shows the stress distribution in the section during the analyses. At the beginning of the analyses, point A, the stress distribution is constant. At point B the section starts cracking, at point C the section is cracked and the neutral axis shifted, the stress on the last fiber reached the maximum compressive strength of 4MPa. Point D shows that increasing the displacement the stresses redistribute along the section, and part of the section is on the post peak branch. Table 3. Concrete 06 Material properties (symbols in Fig. 7) f 'c[MPa] M6 4 0[-] cr[-] n k b 0.004 4. E-05 2 1 2 fcr[MPa] 0.3 The two stress-strain constitute laws are shown in Figure 14. 5 4 "Concrete 01" [MPa] 3 "Concrete 06" 2 1 -0,005 0 1E-17 -1 0,005 0,01 0,015 0,02 0,025 Figure 14. Two materials constitutive law with tensile strength (concrete06) and without tensile strength (concrete 01) Figure 16. Section stress distribution [MPa] for the steps indicated in Figure 15 241 Proceedings of the 9th International Conference on Structural Dynamics, EURODYN 2014 Additional analyses were performed with a lower axial load, 0.1Nmax = 160kN. The results are shown in Figure 17. The shear - displacement curves are almost identical indicating that the tensile strength does not play a major role on the loaddisplacement behavior. 100 Concrete 06 80 Vbase[kN] Concrete 01 60 Table 4. Panel two data Panel two E [MPa] G [MPa] ftu [MPa] 2000 1000 0.15 0.4 The second panel is modelled with fixed-fixed boundary conditions (see Figure 18). The shear strength is reached when the stress reaches the tensile strength of the masonry ftu =0.15 MPa (see Table 4). In this examples the resulting shear strength is calculated using the following expression [5][13]: Vd 40 f tu lt b 1 0 (7) f tu 20 where ftu is the masonry tensile strength, 0 the compression stress of the section (0=N/lt), l the width, t the thickness of the wall section and b is a parameter that depends on the 0 0 2 4 6 8 10 aspect ratio h/l. The shear behaviour of the wall is described by means of a Displacement d[mm] trilinear lateral force-displacement law with pinching hysteretic behavior. The constitutive law V- with initial Figure 17. Pushover shear-displacement curves using the axial load equal to N=300kN (i.e. 0.1 Nmax) is described in materials of Figure 14 (N = 0.1 Nmax). Figure 19. 4.4 Parametric analysis of the squat wall, panel two. 250 200 Vbase[kN] The deformation capacity strongly depends on the type of failure mechanism (shear or flexure). The panel described in the previous paragraph is slender and the failure is governed by flexure. For this reason a second panel is investigated in order to analyse the shear failure. The lowest deformation capacities, in terms of horizontal drift θ = δ/H (horizontal deflection/ height of the panel) were found in correspondence of diagonal cracking failures, involving cracking of the units. The second panel is modelled with the material 3 constitutive law described in Figure 9, with other properties shown in Table 4, where denotes the friction coefficient. 150 100 50 0 0 0,001 0,002 0,003 0,004 0,005 Figure 19. V-shear spring Figure 20 shows the flexure (Opensees analysis) and shear failure curves (eq.7) of the panel for different axial load ratio. The figure shows that for an axial load lower than 0.074 Nmax the panel fails in flexure and for a higher axial load the panel fails in shear. Figure 18. Boundary conditions and geometry of panel two 242 Proceedings of the 9th International Conference on Structural Dynamics, EURODYN 2014 800 300 Flexure failure (Opensees) 700 Shear spring 2 250 600 Diagonal shear failure 400 300 Vbase[kN] V(kN) Shear spring1 200 500 150 100 200 100 50 0 0 0,1 0,2 0,3 0,4 0 0,5 0 N/Nmax 0,002 0,004 0,006 0,008 0,01 Figure 20. The V-N Interaction diagram (shear spring 1) Figure 22. V-shear springs 300 250 Flexure Flexure 250 Shear spring 2 and flexure Shear spring1 and flexure 200 Vbase[kN] Vbase[kN] 200 150 100 150 100 Shear and flexure 50 50 0 0 5 10 15 20 Displacement d[mm] 0 0 5 10 15 Displacement d[mm] 20 25 Figure 21. V-d base shear displacement curve The last analyses are performed to investigate the influence of the constitutive law V-(shear spring behavior). Figure 22 shows the two laws used, one with maximum shear strength equal to Vd1 =199.2 kN and the other with Vd2 =240 kN. The two base shear curves for N=300kN (i.e. 0.1 Nmax) without and with shear spring are shown in Figure 21. The base shear curves for N=240kN (i.e. 0.08 Nmax) without shear springs and with the two shear springs are shown in Figure 23. The behavior of the curve without shear springs is stiffer than the other two, due to the fact that the shear spring gives the possibility to consider in addition to the flexure deformation also the shear deformation. The curves show also that for spring 2 the failure is in flexure because the shear strength is higher than the flexural strength. In the case of spring 2 the failure is in shear because the shear strength is lower than the flexural strength. Figure 23. V-d base shear displacement curve CONCLUSIONS Masonry wall in-plane failure modes can be represented efficiently with the nonlinear fiber-beam equivalent-frame model presented in this study. Both shear and flexural deformations, which play an important role in the global response of the masonry walls, are taken into account through constitutive laws widely accepted in the scientific literature, combined by means of a section aggregator in OpenSees framework. The parametric analyses on two different panels show the influence of various parameters on the panel behavior, and in particular slenderness ratio, axial load (that plays a major role on the strength and ductility of the panel), material constitutive law. The force-based fiber section model appears to be a very promising approach to model the masonry behavior. Both flexural behavior and shear behavior can be represented with a good approximation, the numerical model is very stable and 243 Proceedings of the 9th International Conference on Structural Dynamics, EURODYN 2014 efficient and can be easily extended to model complex masonry buildings. Other tests on sample cases show also both numerical robustness in monotonic and cyclic analyses [14] under vertical and horizontal loads and a satisfactory agreement with available experimental test results for masonry panels [15] and 3D buildings [16]. REFERENCES [1] [2] [3] [4] [5] [6] [7] [8] [9] [10] [11] [12] [13] [14] [15] [16] [17] 244 R. Marques and P.B. Lourenco, Possibilities and comparison of structural component models for the seismic assessment of modern unreinforced masonry buildings, Computers and Structures, 89, pp. 2079-2091, 2011. M.Tomaževič, The computer program POR. Report ZRMK (in Slovene), 1978. A. Brencich and S. Lagomarsino, A Macro-Element dynamic model for masonry shear walls. In G.N. Pande & J. Middleton (ed.s), Computer methods in structural masonry - 4 ; Proc. Intern. Symp., Pratolino (FI), 3-5 september 1997. Swansea: Books a& Journals International, 1997. G. Magenes and A. Della Fontana, Simplified non-linear seismic analysis of masonry buildings, 5th International Masonry Conference, Poc. of the British Masonry Society, 1998. G. Magenes and G.M. Calvi, In-plane seismic response of brick masonry walls, Earthq. Engin. and Struct. Dyn., Vol. 26, pp. 10911112, 1997. Caliò, I, Marletta M. and Pantò B., A simplified model for the evaluation of the seismic behaviour of masonry buildings, 10th Int. Conf. on Civil, Structural and Environmental Engineering Computing, Civil-Comp Press, 2005 F. McKenna, G.L. Fenves, M. H. Scott and B Jeremic, Open System for Earthquake Engineering Simulation (OpenSees). Pacific Earthquake Engineering Research Center, University of California, Berkeley, CA, 2000. E. Spacone, F.C. Filippou and F.F. Taucer, Fibre beam-column model for non-linear analysis of R/C frames: part i. formulation. Earthquake Engineering and Structural Dynamics, 1996. D. C. Kent and R. Park, Flexural members with confined concrete. Journal of the structural division ASCE, 97(7): pp.1969-1990, 1971. B. Scott, D. R. Park and M. J. N. Priestley, Stress-strain behaviour of concrete confined by overlapping hoops at low and high strain rates. Structural Journal of the ACI, 79(1):13-27, 1982. S. Popovics, A Numerical Approach to the Complete Stress-Strain Curve of Concrete, Cement and Concrete Research, V. 3, No. 4, pp. 583-599, 1973. H. Belarbi and T. C. C. Hsu, Constitutive Laws of Concrete in Tension and Reinforcing Bars Stiffened by Concrete, ACI Structural Journal, V. 91, No. 4, pp. 465-474, 1994. V. Turnsek, and P. Sheppard, The shear and flexural resistance of masonry walls, Proc. of the International Research Conference on Earthquake Engineering, 517-573, Skopje, Macedonia, 1980 E. Raka, V. Sepe and E. Spacone, A fiber beam element for equivalent frame modeling of masonry buildings, Proc. of the 9th International Masonry Conference 2014, Guimarães, Portugal, 2014 Anthoine A., Magonette G., Magenes G., Shear-compression testing and analysis of brick masonry walls, Proceed. 10th European Conference on Earthquake Engineering, 1995, vol. 3, pp. 1657-1662 G. Magenes G. M. Calvi and R. Kingsley, (1995), Seismic testing of a full-scale, two-story masonry building: Test procedure and measured experimental response. Experimental and numerical investigation on a brick masonry building prototype – numerical prediction of the experiment – Report 3.0, G.N.D.T., Pavia. http://opensees.berkeley.edu


© Copyright 2026