
The Australian Twin Study of Gambling (OZ-GAM): Rationale, Sample Description,
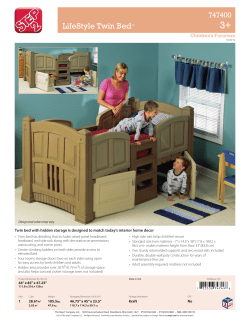
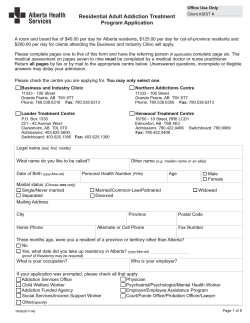
The Australian Twin Study of Gambling
(OZ-GAM): Rationale, Sample Description,
Predictors of Participation, and a First Look
at Sources of Individual Differences in
Gambling Involvement
Wendy S. Slutske,1 Madeline H. Meier,1 Gu Zhu,2 Dixie J. Statham,2 Alex Blaszczynski,3 and Nicholas G. Martin2
1
University of Missouri, Columbia, United States of America
Queensland Institute of Medical Research, Brisbane, Australia
3
University of Sydney, Australia
2
wo major challenges to conducting a communitybased twin study of pathological gambling (PG)
disorder are that: (a) it is relatively rare, and (b) individuals with the disorder in the community may be
difficult to locate and recruit. We describe a new
study of 4,764 individuals recruited from the
Australian Twin Registry in which we attempt to
effectively deal with the first challenge and examine
the impact of the second challenge. The lifetime
prevalence of DSM-IV PG in this Australian twin
sample was 2.2%, which is 400–500% higher than
has been obtained in prevalence surveys conducted
in the United States. A number of predictors of nonparticipation were identified, including a lifetime PG
disorder diagnosis, but these did not have a large net
effect on the estimated number of individuals with
PG or related characteristics in the twin sample.
Results of biometric modeling suggested that the
effect of genetic, shared family environmental, and
nonshared environmental influences on the propensity to engage in 11 different specific forms of
gambling (e.g., playing the lottery, betting on horse
or dog races, playing electronic gaming machines)
were generally moderate, low, and moderate,
respectively, with mean parameter estimates
obtained of 43%, 10%, and 46%. An intriguing comparison with results from a 1963 US adolescent twin
study conducted by Loehlin and Nichols (1976) suggests that: (a) propensity genes for gambling
involvement may be more likely to be expressed in
the heavy-gambling Australian culture, or that (b) the
family environment has a transient effect on the
gambling behavior of young people.
T
lifetime DSM-IV diagnoses (American Psychiatric
Association, 1994) of pathological gambling disorder
(PG) was only 74 (0.17%) and 185 (0.43%), respectively (Slutske, 2006). As it is currently defined, PG is
no more prevalent than schizophrenia or anorexia
nervosa. One of the greatest challenges to conducting
community-based twin studies of PG is the fact that it
is not especially prevalent.
In the book A Mug’s Game: A History of Gaming
and Betting in Australia, John O’Hara (1988) begins by
stating that ‘Australians have long thought of themselves as a nation of gamblers ... The belief that typical
Australians would bet on two flies crawling up a wall is
part of our folklore’ (p. ix). Regulated forms of gambling have been more widely available for a much
longer time in Australia than in the United States. For
example, the first state government-operated lottery
was established in 1920 in Australia (in Queensland;
Australasian Gaming Council, 2008) compared to
1964 in the United States (in New Hampshire;
National Research Council, 1999), and electronic
gambling machines have been legally available outside
of casinos in New South Wales (where about one-third
of the Australian population resides) since 1956, and
with the exception of Western Australia, from the
1990s in all other states and territories (Australasian
Gaming Council, 2008).
The average Australian adult spent over AUD
$1100 on gambling in 2008 (Australasian Gaming
Council, 2008). The 1999 Australian Productivity
Commission reported that ‘While international gambling statistics are patchy, evidence suggests that
Keywords: gambling, twins, Australia, study participation,
reliability, prevalence, genetic
Received 13 November, 2008; accepted 24 November, 2008.
In a recent US national survey of 43,093 adults, the
number of individuals identified with past-year and
Address for correspondence: Wendy S. Slutske, Department of
Psychological Sciences, University of Missouri-Columbia, 210 McAlester
Hall, Columbia, Missouri 65211. E-mail: [email protected]
Twin Research and Human Genetics Volume 12 Number 1 pp. 63–78
63
Wendy S. Slutske, Madeline H. Meier, Gu Zhu, Dixie J. Statham, Alex Blaszczynski, and Nicholas G. Martin
Australians are amongst the biggest gamblers in the
world’ (p. 3.2). The average per capita gambling
expenditure as a percentage of net disposable income
in 2003 was estimated for 21 industrialized nations
(Pryor, 2008) — Australia ranked first and the United
States ranked 14th among the countries included, with
5.85% and 1.75% of their average per capita net disposable incomes spent on gambling, respectively.
The density of gambling venues in Australia is
also quite likely the highest in the world. Australia
reportedly has the highest per capita number of highintensity gaming machines (known as pokies in
Australia, slot machines in the United States, fruit
machines in the United Kingdom, and VLTs in
Canada) in the world. Estimates of the percentage of
worldwide gaming machines that are found in
Australia vary somewhat — one source has suggested
that Australia accounted for about 3% of machines
worldwide, and about 7% of ‘casino-style’ gaming
machines (Australian Gaming Council, 2004;
Australasian Gaming Council, 2008), whereas another
source has suggested that Australia accounted for 20%
of the world’s high-intensity gaming machines
(Australians account for less than 1% of the world’s
population; Productivity Commission, 1999; see Table
1). Most of the Australian population lives within close
proximity to gaming machines, which are distributed
widely throughout the community in Australia in
licensed premises: clubs, hotels and casinos. For these
reasons, Australia may be the ideal setting for conducting a community-based twin study of PG, because
along with the advantage afforded by the greater gambling involvement observed among Australians, it also
allows for an examination of the genetic influence on
PG susceptibility in a culture in which most individuals
have been heavily exposed to gambling opportunities in
relatively mature market segments.
Numerous studies have demonstrated that gambling involvement and problems run in families (e.g.,
Black et al., 2006; Gambino et al., 1993). For
example, in a recent family study, Black et al. (2006)
found that 8% of the first-degree relatives of PGaffected probands, compared to 2% of the first-degree
relatives of PG-unaffected controls, had a lifetime
history of PG. Many experts attribute the familial
transmission of gambling and PG to social modeling
influences (e.g., Gupta & Derevensky, 1997), but this
conclusion is based upon the observation of parent–
offspring transmission in nuclear families, which could
be due to genetic as well as environmental factors. The
role of a possible underlying biological diathesis in the
development of PG has not been ignored by
researchers; in fact, the search for putative indicators
of biological vulnerability for PG (e.g., Blanco et al.,
1996; Carrasco et al., 1994; Roy et al., 1988) and specific susceptibility genes associated with PG (e.g.,
Comings et al., 1996; Comings et al., 1997) actually
preceded the behavioral genetic research documenting
64
Table 1
Overall Percentage of the World’s High-Intensity Gambling Machines,
1999
Country
%
Australia
20
19
United States
64
273
6
31
France
6
59
New Zealand
2
4
South Africa
1
43
Canada
Population in millions
United Kingdom
0
59
Germany
0
82
Spain
0
39
Japan
0
126
Note: Productivity Commission (1999), p. 2.11.
the importance of genetic influences on the risk for PG
(see Lobo & Kennedy, 2006 for a review).
The behavioral genetic literature on PG is scant,
consisting of a single study. Eisen et al. (1998) studied
3,359 twin pairs from the Vietnam Era Twin Registry,
a national sample of male twin pairs in which both
men served in the United States military during the
Vietnam Era. Despite the large size of the Vietnam Era
twin cohort, there were still relatively few men who
met the DSM-III-R criteria (American Psychiatric
Association, 1987) for PG when interviewed in 1991–
93. Of 7,869 interviewed men, only 112 met the
DSM-III-R criteria for PG (Slutske et al., 2001), and
there were only 6 monozygotic (MZ) and 2 dizygotic
(DZ) twin pairs concordant for DSM-III-R PG.
Nonetheless, the lifetime prevalence of PG was significantly elevated among the MZ (23%) and DZ (10%)
co-twins of men with PG compared to the lifetime
prevalence of PG in the full sample (1.4%). When
standard twin structural equation models were fit to
the data, it was not possible to discern whether this
familial similarity for PG was due to genetic or environmental factors (Eisen et al., 1998). In a combined
(and more powerful) bivariate analysis of PG and
alcohol dependence, Slutske et al. (2000) found that
64% of the variation in the risk for PG could be
accounted for by genetic factors, with the remaining
variation accounted for by individual-specific environmental factors or errors of measurement. Family
environmental factors did not significantly contribute
to variation in PG (although these factors may still be
important in either mediating genetic effects, or in
their interaction with an existing genetic predisposition). The results of this study suggest that PG is as
heritable as alcohol dependence, and that genetic
factors, rather than social modeling, predominantly
explain the familial transmission of PG. In a 10-year
follow-up of the Vietnam Era twin cohort, Xian et al.
(2007) found that the same genetic factors accounted
for variation in liability for problem gambling at both
Twin Research and Human Genetics February 2009
Australian Twin Study of Gambling
the baseline and at the 10-year follow-up and that the
estimates of heritability at the two time points were
similar (baseline: 49%; follow-up: 58%). The results
of this follow-up study suggest that the changes in the
availability of gambling that occurred in the United
States between 1992 and 2002 did not alter the underlying genetic architecture of the liability to problem
gambling. The extent to which the results from the
Vietnam Era twin study generalize to women has still
not been established.
The behavioral genetic literature on (nonpathological) gambling involvement is also nearly nonexistent.
The first twin study of gambling involvement comes
from the landmark National Merit Scholarship
Qualifying Test (NMSQT) twin study (Loehlin &
Nichols, 1976). Twins were identified among high
school juniors in the United States who were taking
the 1962 NMSQT. The twins were subsequently
invited to participate in a study, and an extensive
mailed survey was completed by 850 pairs. Included
in the survey were four questions about the frequency
of participation (frequently, occasionally, or not at all)
in gambling in the past year. Because these data
appear to be at risk of forever falling through the
cracks, they have been retabulated and are presented
here in Table 2.
What is especially noteworthy about the NMSQT
twin study is that it was conducted in 1963, during a
period in the United States when there were no casinos
outside of Nevada, the first legal lottery had not yet
been established, and there were few opportunities for
legal gambling. Nonetheless, a substantial portion of
these 17–18 year old students had participated in
gambling activities in the past year (see Table 2) —
these would invariably have been in the form of
unregulated or illegal gambling. The results of this
twin study represent a rare glimpse into the sources of
variation in individual differences in gambling in a
prohibitive (versus the currently more permissive)
gambling environmental context. With the exception
of card gambling among young men, a comparison of
the correlations obtained among MZ versus DZ twins
suggests little evidence for an important genetic influ-
ence and some evidence of shared family environ mental influences on variation in the frequency of
gambling among these young people.
To our knowledge, the only other twin study of
gambling involvement is a small-scale study of 155
Minnesota-born male and female same-sex twin pairs
(born between 1964–1972, with a mean age at assessment of 26 years; Winters & Rich, 1998). The
frequency of involvement in eight different gambling
activities in the past year, as well as three categorical
indexes of gambling (any gambling in the past year,
monthly gambling in the past year, and onset of gambling prior to age 18), and two composite indexes of
gambling involvement (frequency of engaging in ‘highaction’ and ‘non-high-action’ games in the past year)
were examined. Winters and Rich (1998) found that
participation in ‘high-action’ gambling activities
(scratch tabs, lottery, casino cards, and gambling
machines) was significantly heritable among men, but
not among women, and participation in ‘non-highaction’ gambling activities (cards with friends, betting
on sports events or games of skill, and bingo) was not
significantly heritable in either sex. (Three activities
were assessed but were not included in the genetic
analyses due to low base rates: betting on pull tabs,
dice games, and horse/dog races.) The authors concluded from this study that there may be genetic
influences contributing to individual differences only
for certain types of gambling behaviors. However,
inspection of the twin intraclass correlations for the
composite indexes of the two types of gambling activities suggest that genetic influences may be important
for both (high-action: rMZ = 0.56, rDZ = 0.25; non-highaction: rMZ = 0.57, rDZ = 0.40), and inspection of the
prevalences of the activities belonging to each of the
composite categories (high-action: mean prevalence =
58%; non-high-action: mean prevalence = 26%) suggests that the differences obtained may not be
meaningful but could easily be attributable to differences in statistical power.
Another challenge to conducting community-based
twin studies of PG, or any community-based study of
PG (twin or otherwise), is that individuals with gam-
Table 2
Results From the 1963 United States National Twin Study of Loehlin & Nichols: Frequency of Participation in Four Different Gambling Activities in
the Past Year Among High School Seniors
Prevalencea (%)
Twin correlations (ICC)
Men
Women
MZ (N = 215)
DZ (N = 134)
MZ (N = 292)
Gambled with cards
47
17
0.53
0.31
0.51
0.42
Gambled with dice
13
3
0.37
0.43
0.27
0.23
Made bets on a game or other event
(not cards or dice)
46
22
0.45
0.43
0.21
0.14
Played a slot machine
11
11
0.18
0.40
0.34
0.41
Gambling activity
Men
Women
DZ (N = 195)
Note: a = represents the prevalence of participating frequently or occasionally (versus not at all); ICC = intraclass correlation, MZ = monozygotic, DZ = dizygotic.
Twin Research and Human Genetics February 2009
65
Wendy S. Slutske, Madeline H. Meier, Gu Zhu, Dixie J. Statham, Alex Blaszczynski, and Nicholas G. Martin
bling problems may not be as easy to recruit into
research as individuals without gambling problems.
For example, in an 11-year longitudinal study of US
college students, those with gambling problems were
less likely to participate at later waves of the study
(Slutske et al., 2003), and in the family study of Black
et al. (2006), the family members of PG-affected
probands were less likely to participate in the study
than the family members of PG-unaffected controls.
This may be because individuals with gambling problems are more geographically mobile than those
without gambling problems, may be more likely to
move or disconnect their telephone because of financial difficulties or to escape from creditors, or more
likely to be incarcerated. Whatever the reason, the
issue of non-participation likely affects all communitybased studies of gambling pathology. Longitudinal and
family-based studies like those of Slutske et al. (2003)
and Black et al. (2006) are especially well-suited for
documenting and potentially assessing the impact of
this phenomenon.
The purpose of this article is to describe a new
twin study of gambling involvement among men and
women in Australia. There are three aims of this
report. First, we provide a detailed description of the
composition of the twin sample that was recruited for
this study. Second, we present an analysis of gambling-related predictors of participation (and thus
nonparticipation) in the study. Third, we present a
‘first look’ at sources of individual differences in
gambling involvement by presenting biometrical
model-fitting analyses of the propensity to engage in
11 different gambling activities and of four composite
indexes of gambling involvement.
Method
Participants
In 1980–1982, a sample of 4,268 twin pairs born
between 1964 and 1971 were registered as children by
their parents with the Australian Twin Registry (ATR),
maintained by the Australian National Health and
Medical Research Council, in response to systematic
appeals through the media and the Australian school
systems. This cohort has variously been referred to in
publications and presentations as the ATR ‘younger
cohort’, the ‘1989 cohort’, or ‘Cohort II’. In 1989–1992,
when the panel was 18 to 28 years old, the first survey
of the twins was conducted by mailed questionnaire (the
basis for the designation of this twin sample as the ‘1989
cohort’). In cases where twins did not respond to the
original questionnaire mailing and a follow-up mailing,
an abbreviated questionnaire was administered by telephone whenever possible, which increased the overall
individual response rate for the 1989 questionnaire
survey to 59.3% (Heath et al., 2001).
In 1996–2000, a telephone psychiatric interview
containing a wide range of assessments including diagnostic assessments of alcohol dependence, childhood
conduct disorder, and major depression (but not gam66
bling problems or involvement) was conducted with
twin pairs from the ATR Cohort II (e.g., see Hansell et
al., 2008; Lynskey et al., 2002; Waldron et al., 2008).
The target sample for the interview study was all
members of the ATR Cohort II dating back to the
baseline sample of 1980–1982. By the time of the
diagnostic interview survey, a total of 252 pairs (6%)
were identified as ‘lost’, that is, no leads could be
found after extensive efforts to retrace either twin or
other family members. Telephone interviews were
completed with 6,265 individuals, 2,803 men and
3,462 women, who were 30 years old on average
(range = 24–36) at the time of the interview. Allowing
for individuals who could not be located, who were
deceased or incapacitated or otherwise unable to complete a telephone interview, or who were not assigned
for interview by the end of the study, the individual
response rate for the telephone interview was 84.2%.
The 6,265 interviewed individuals included 2,765
complete twin pairs (in which both twins participated
in the telephone interview) and an additional 735
twins from incomplete twin pairs (whose co-twin did
not participate in the interview).
The 6,265 individuals from the ATR Cohort II
who were interviewed by telephone in 1996–2000 and
the 735 non-interviewed co-twins of those interviewed
were targeted for the OZ-GAM study. After excluding
267 twins who were no longer available for study
(they were deceased or no longer in the twin registry),
the target sample of twins from Cohort II was 6,733
individuals. Of these 6,733 targeted individuals, 4,763
(70.7%) were interviewed for the OZ-GAM study.
Reasons that interviews were not obtained were that
the twin: (a) was deceased (n = 14), (b) was no longer
a member of the ATR (n = 222), (c) could not be
located even after extensive tracing efforts (n = 319),
(d) was incapacitated or otherwise unable to conduct
a telephone interview (n = 65), (e) did not have a telephone or had a silent (unlisted) telephone number (n =
48), (f) was currently overseas (n = 49), (g) was not
assigned for an interview by the end of the study (n =
90), and (h) was contacted but declined the interview
(n = 1,163). After excluding twins who could not be
located, were deceased or otherwise unable to complete the interview, or were not assigned for an
interview by the end of the study, the individual
response rate for the OZ-GAM study was 80.4%.
One twin was interviewed who was not in the target
sample, bringing the total sample size to 4,764. There
were 3,750 individual twins from 1,875 complete twin
pairs and 1,014 individual twins from incomplete
pairs. Figure 1 illustrates the history of the ATR
Cohort II and the relation between the previous
surveys and the OZ-GAM study. The average time
interval between the 1996–2000 interview and the
OZ-GAM interview was 7.8 years (SD = 1.4, range =
4–11). During this time interval some of the ATR
Cohort II members were also recruited for and participated in a number of different studies including
Twin Research and Human Genetics February 2009
Australian Twin Study of Gambling
surveys on alcohol involvement, tobacco involvement,
male pattern baldness, and childhood trauma (not
shown). Figure 2 shows the sample overlap between
the two previous ATR Cohort II surveys and the OZGAM study depicted in Figure 1.
Procedure
The twins were assessed by both structured telephone
interview and mailed self-report questionnaire. The
interviews were administered by a team of trained layinterviewers; different interviewers conducted the
interviews of the two members of a twin pair.
Interviewers were supervised by a project coordinator,
a clinical psychologist with over 10 years of experience. All interview protocols were reviewed either by
the project coordinator or by research editors (veteran
skilled interviewers from previous studies who had
maintained consistently low error rates in coding). All
interviews were tape-recorded and a random sample
of interview tapes was reviewed for quality control
and coding inconsistencies. Midway through the
course of the study the interview was adapted from a
paper-and-pencil administered interview to a computer-assisted interview. The change in the format of
the interview was transparent from the perspective of
the respondent, and differed only from the perspective
of the interviewer. Forty-eight per cent (N = 2,297) of
the interviews were conducted using the computerassisted interview. The immediate availability of the
interview data with the computer-assisted interview
made it easy to conduct a small-scale short-term testretest reliability study (N = 166, mean test–retest
interval = 3.4 months, SD = 1.4 months, range = 1.2–
9.5 months) that over-sampled individuals with
gambling problems.
After an initial invitation letter was sent, the twins
were contacted by telephone by an interviewer who
asked whether they were willing to participate in the
study. Twins who agreed to participate in the study
were sent a packet that included a respondent booklet
to be used with the interview and a copy of the selfreport questionnaire along with a reply-paid envelope.
The interview, lasting about 60 minutes, contained
questions about: (1) demographics, (2) lifetime involvement in gambling activities, (3) a detailed assessment of
current gambling involvement, the heaviest period of
gambling involvement, and the period when gambling
involvement first began, (4) lifetime and past-year
symptoms of PG, (5) a screen for mania (an exclusion
criterion for DSM-IV PG), (6) family history of gambling behavior and problems, (7) lifetime history of
alcohol use and alcohol use disorders, (8) lifetime
history of smoking (9) lifetime history of major depression, (10) history of childhood disruptive behavior
disorders, and (11) history of adult antisocial personality disorder symptoms. The self-report questionnaire
contained a variety of personality assessments. After
extensive follow-up, 92% (N = 4,369) of the twins who
participated in the interview portion of the study also
returned the self-report questionnaire.
1980-1982
AUSTRALIAN TWIN REGISTRY
COHORT II
born 1964-1971
N = 4268 pairs
OZ-GAM STUDY
Questionnaire
1989-1992
Interview
1996-2000
Interview
2004-2007
Questionnaire
2004-2007
N = 5,058
59% response rate
N = 6,265
84% response rate
N = 4,764
80% response rate
N = 4,369
92% response rate
M = 4 years
re-test
M = 3 months
re-test
N = 216
N = 166
Figure 1
The relation between the OZ-GAM study and previous surveys of Cohort II of the Australian Twin Registry.
Twin Research and Human Genetics February 2009
67
Wendy S. Slutske, Madeline H. Meier, Gu Zhu, Dixie J. Statham, Alex Blaszczynski, and Nicholas G. Martin
1989-1992 questionnaire
629
992
123
3,314
730
98
1,229
1996-2000 interview
2004-2007 OZ-GAM interview
Figure 2
Venn diagram representing the sample overlap between the OZ-GAM study and two previous surveys of Cohort II of the Australian Twin Registry.
Numbers represent the frequency of individual twins participating in only one survey, in two surveys, or in all three surveys.
Measures
Zygosity
Among the 1,875 complete twin pairs who participated
in the OZ-GAM study, 867 were MZ (520 female, 347
male) and 1,008 were DZ (367 female–female, 227
male–male, and 414 female–male). Among the 1,014
individual twins from incomplete pairs there were 304
individuals from MZ pairs (151 female, 153 male) and
710 individuals from DZ pairs (181 female–female, 216
male–male, and 313 female–male).
Zygosity was initially determined using self-report
questions from the 1989–1992 questionnaire and the
1996–2000 interview surveys regarding physical similarity (e.g., height, eye and hair color, ‘as alike as two
peas in a pod’) and the degree to which parents, relatives, friends, or teachers could tell the co-twins apart.
If co-twins gave inconsistent answers, they were followed up by telephone, and if there was still
inconsistency or uncertainty, they were asked to send
in photographs from various ages, from which a
zygosity assignment was made by project staff.
The zygosity assignment in the OZ-GAM study
was compared to zygosity assignments derived from
an analysis of DNA obtained for 241 same-sex twin
pairs in the OZ-GAM who had also participated in an
unrelated genome-wide linkage study. At least 200
microsatellite markers were genotyped for each individual twin, and the genetic relatedness was
determined based on the proportion of genetic
markers in which the allele sharing between twins
conformed to the pattern expected for MZ and DZ
68
pairs. The original zygosity diagnosis was confirmed
by DNA testing for all 33 MZ twin pairs (100%), and
for 202 of 208 DZ twin pairs (97%). The DNA
testing indicated that 6 MZ twin pairs had originally
been misclassified as DZ, which yielded an overall
estimated error rate of 2.5% for zygosity assignments
in the OZ-GAM study.
OZ-GAM Interview Measures
Demographic characteristics. Three of the demographic
characteristics assessed in the OZ-GAM interview
warrant explanation because they are unique to
Australia — high school graduation, place of residence,
and ancestry. All of these characteristics were assessed
for the OZ-GAM study to potentially examine their
relation to gambling behavior. In addition, ancestry
was assessed in order to assemble genetically homogenous samples for future molecular genetic studies.
Because of differences in their educational systems,
designation as a high school graduate may have different meanings in Australia than in the United States or
other countries. In Australia, schooling is compulsory
through age 15 (16 in Tasmania) compared to 16–18
in the United States (differing across states). High
school usually continues through grade 10 in
Australia, whereas in the United States it continues
through grade 12. After grade 10, young people in
Australia can choose to either: (1) complete grades 11
and 12 and matriculate from high school, (2) enter a
vocational or technical school, or (3) enter the workforce. Currently, about 80% of Australians opt to
Twin Research and Human Genetics February 2009
Australian Twin Study of Gambling
complete grades 11 and 12, but this represents an
increase over previous cohorts; about 68% of individuals who were 35–44 years old, 63% of individuals
who were 45–54 years old, and 52% of individuals
who were 55–64 years old in 2006 completed high
school (Organisation for Economic Co-operation and
Development, 2008). Based on these differences, there
may be fewer high school graduates in Australia than
in the United States among individuals in the age
range of the OZ-GAM cohort.
Twins were asked whether their current (and also
previous) place(s) of residence was a metropolitan area,
regional city, or rural area. A metropolitan area (or
metropolitan city) is typically defined as the urban and
suburban spread surrounding the eight major capital
cities in Australia — Canberra, Sydney, Melbourne,
Brisbane, Perth, Adelaide, Hobart, and Darwin.
Regional cities include all other cities in Australia.
Australia is a nation of immigrants much like the
United States, but the national censuses in the two
countries use different approaches for characterizing
the ethnic diversity of their populations. In the United
States census, one will find questions about race,
whereas this is not included in the Australian census.
Instead, the Australian census focuses on the heritage
of the residents and where they and their parents and
ancestors were born. The assessment in the OZ-GAM
interview followed more closely the method used in
the Australian census. Twins were not asked their
‘race’ but instead were asked where their parents and
grandparents were born and the ancestry of their
parents or grandparents, explained as ‘the place or
ethnic group where most of your ancestors came
from.’ For the ancestry questions, twins were
instructed by the interviewers that the response
‘Australia’ was only appropriate for Indigenous individuals (likewise for the responses of ‘United States,’
‘Canada,’ and ‘New Zealand’).
Gambling involvement. Eleven different gambling
activities that were included in the 1999 Australian
national prevalence survey (Productivity Commission,
1999) were assessed in the OZ-GAM study. Although
the Australian prevalence survey only assessed gambling within the past 12 months, the OZ-GAM
assessment included several different timeframes,
including lifetime as well as the past year. For the purposes of this paper, we focus on any involvement in
each of the 11 activities over the entire lifetime of the
respondent. Two composite indexes of gambling
involvement were created based on involvement in the
11 specific gambling activities: any gambling and gambling versatility. Any gambling was a dichotomous
indicator of whether the participant had ever engaged
in any of the 11 different gambling activities at any
time. Gambling versatility was a continuous indicator
of the number of different activities in which the
respondent had ever been engaged, which reflects the
extensiveness or diversity of the respondent’s gambling
involvement. The internal consistency reliability
(Cronbach’s alpha) of the gambling versatility index
was 0.68. Also included in this report are two other
indicators related to the overall frequency and ‘quantity’ of gambling involvement: the number of days
within a 12 month period in which gambling occurred
during the respondent’s heaviest period of gambling,
and the most that the respondent ever spent on gambling in a single day. The largest amount of money
ever spent on gambling in a single day was defined for
participants as net expenditure, that is ‘the total
amount that you started out with at the beginning of
the day minus the total amount that you ended up
with at the end of the day. So this would be the single
day in which you lost the most money overall.’ Two
different measures of gambling-related problems were
included in the OZ-GAM study, the NODS (NORC
DSM-IV Screen for Gambling Problems; Gerstein et
al., 1999) that was developed for a national United
States gambling prevalence survey conducted in 1999,
the Gambling Impact and Behavior Study (Gerstein et
al., 1999), and the South Oaks Gambling Screen
(SOGS; Lesieur & Blume, 1987) that was originally
developed to assess problems among individuals
seeking treatment. The NODS assessment more
closely matches the current diagnostic criteria used for
diagnosing PG, whereas the SOGS has been the instrument used in the majority of PG epidemiologic
research worldwide, including a 1999 Australian
national prevalence survey (Productivity Commission,
1999). For both the NODS and SOGS, both lifetime
and past-year problems were assessed. For the purposes of this paper, we focus on lifetime diagnoses of
PG, as well as symptom counts based on the NODS
and SOGS lifetime assessments. Both sets of PG measures were very reliable. The test-retest reliabilities for
the lifetime diagnoses of PG from the NODS and the
SOGS were 0.67 and 0.78, respectively, using the
kappa coefficient, and were 0.79 and 0.82 using Yule’s
Y, and 0.92 and 0.95 using the tetrachoric correlation,
based on data obtained from the 166 individuals in
the retest sample. The internal consistency reliabilities
(Cronbach’s alpha) of the NODS and SOGS lifetime
symptom counts were 0.85 and 0.81, respectively.
1996–2000 Interview Measures
Assessments from the 1996–2000 interview were used
to predict participation in the OZ-GAM study.
Although gambling behaviors were not assessed in the
1996–2000 interview, other gambling-relevant features
were, such as demographic characteristics (age, sex,
income, high school graduation, and religion), other
addictive behaviors (alcohol use, smoking), and
comorbid disorders (alcohol dependence, major
depression, conduct disorder). We also examined other
characteristics (e.g., zygosity) that have been associated
with participation in previous ATR surveys.
Demographic characteristics. The demographic predictors are all self-explanatory except for the measure
of income. Twins reported their overall yearly combined gross household income by choosing from a list
Twin Research and Human Genetics February 2009
69
Wendy S. Slutske, Madeline H. Meier, Gu Zhu, Dixie J. Statham, Alex Blaszczynski, and Nicholas G. Martin
of 11 income ranges, presented in three formats corresponding to amounts per week, fortnightly, or
annually. Individuals were categorized as being ‘high
income’ and ‘low income’ based on whether they were
in about the upper 25% and the lower 25% of the
income distribution on this 11-point scale. The
median yearly household incomes of the high and low
income groups corresponded to greater than AUD
$62,500 and less than AUD$30,000, respectively, in
1996–2000.
History of substance use and psychiatric disorder.
‘Regular drinker’ was defined as ever drinking at least
once a month for at least 6 months. ‘Regular smoker’
was defined as ever smoking cigarettes daily or nearly
daily for a period of at least three weeks. Lifetime diagnoses of alcohol dependence, major depression and
childhood conduct disorder were made according to the
DSM-IV criteria, except that clustering of symptoms of
alcohol dependence and of conduct disorder within a
12 month period were not required.
Data Analysis
Predictors of participation in the OZ-GAM study.
Longitudinal twin studies offer at least two clues for
detecting sampling bias. First, one can use assessments
obtained at previous study waves to predict participation at later waves. Second, one can examine
differences between twins whose co-twin did not participate in the interview with those whose co-twin
participated in the interview. The rationale here is not
unlike that underlying the interpretation of the participation rates of the family members of the probands
and controls in the family study of Black et al. (2006).
Rather than starting with individuals with and
without PG and checking to see how many of their
relatives participated in the study, we are starting with
individuals whose relatives (co-twin) did and did not
participate in the study and checking to see how many
of the probands and controls (twins) had PG. If twins
with PG were systematically under-sampled, then
higher rates of PG would be expected among twins
whose co-twin did not participate in the interview
than among twins concordant for participation in the
interview (assuming that PG, like nearly all traits, is
correlated in twin pairs). Following from this logic,
one would also infer that twin pairs in which neither
twin participated in the study would also have higher
rates of PG, perhaps even higher than the pairs in
which one twin participated. We cross-sectionally
examined within the OZ-GAM study whether there
were systematic differences in gambling behaviors
between twins from pairs that were concordant versus
discordant for participation.
For both sets of analyses, procedures for analyzing
survey data were used to adjust for the nonindependence of the observations obtained from two members
of a twin pair. Essentially, the data were treated as
clustered, with the family unit (in this case, the twin
pair) serving as the cluster.
70
Sources of individual differences in gambling involvement. As a ‘first look’ at the sources of individual
differences in gambling involvement, we conducted biometrical model-fitting analyses of the 11 different
gambling activities and the four composite indexes of
gambling involvement. Models were fit by the method
of maximum likelihood directly to the raw twin data
using the Mx program (Neale et al., 2003). The data
from incomplete as well as complete twin pairs were
included in the analyses. This method reduces potential
biases in parameter estimates due to nonparticipation if
the data are missing at random (Little & Rubin, 1987).
Although it has become standard practice in twin
analysis to fit a series of nested submodels in order to
drop nonsignificant parameters, the focus of these
analyses of gambling involvement was on the estimated
parameters and 95% confidence intervals around parameters from a full model allowing for additive genetic,
shared environmental or nonadditive genetic, and nonshared environmental factors as sources of variation.
This is the most effective way of communicating the
results of univariate analyses of twin data, because
estimates from reduced models can be easily misunderstood (a genetic parameter may be significant or an
environmental parameter may be nonsignificant, but
with extremely broad confidence intervals).
The sources of individual differences in whether or
not a twin had ever participated in 11 different gambling activities, as well as any of the 11 activities, were
examined. These were treated as categorical variables
in the analyses, which assumed that the underlying
liability, or propensity, to engage in a particular gambling activity or in any gambling activity is normally
distributed. We also examined the sources of individual
differences for three different continuous indicators of
gambling involvement. All three of these measures were
rank-normalized with a Blom transformation in an
effort to reduce their positive skew.
For this ‘first look’ we did not examine whether
there were sex differences in the estimates of the genetic
and environmental variance components. Threshold or
mean differences between men and women were
included in all of the analyses, however, to take into
account sex differences in the prevalences or mean
levels for the different gambling behaviors.
Results
Sample description
The twins in the OZ-GAM study represent a relatively
broad cross-section of the Australian general population of 32–43 year olds (see Table 3). Similar to most
community-based twin cohorts, the OZ-GAM sample
tends to be relatively socio-economically advantaged.
However, the sample also includes individuals without
post-secondary education (38.0%), who are unemployed (2.3%), and who are on public assistance
(5.7%). The twins come from all walks of life, including truck driver, construction worker, mechanic,
farmer, waitress, police officer, garbage collector,
Twin Research and Human Genetics February 2009
Australian Twin Study of Gambling
plumber, hairdresser, secretary, teacher, nurse, lawyer,
and doctor. Included in Table 3 is the religion in which
the twins were raised; they also reported their current
religion, which showed only moderate agreement with
their childhood religion (kappa = 0.55). Most of the
lack of agreement was due to the fact that over onequarter of the OZ-GAM sample went from being
Christian as children to having no religion as adults.
Eighty-six per cent and 13% of the twins reported
that they were raised Christian, or with no religion,
respectively (see Table 3), compared to 61% and 38%
who were currently Christian or no religion, respectively (not shown).
Table 4 shows the current state or territory of residence for the OZ-GAM sample along with the rank of
the states or territories in their average per capita
expenditure on gambling. What is especially noteworthy is that 47% of the twins live in the two states in
Australia (Victoria and New South Wales) with the
highest average per capita expenditure on gambling
and 14% of the twins live in the state with the lowest
average per capita expenditure on gambling (Western
Australia). For the 63.2% of individuals who reported
that they lived in a metropolitan area (see Table 3), the
current state or territory of residence also provides
information about the particular metropolitan area in
which they are living. For example, of the 912 twins
who are living in New South Wales, 558 indicated that
they live in a metropolitan area. Therefore, we know
from these two pieces of information that about 12%
of the OZ-GAM sample is currently living in the
Sydney metropolitan area.
The ancestry of the participants is presented in
Table 5. As expected from the original settlement of
Australia, most of the twins are of Northern European
ancestry, especially from the United Kingdom and
Ireland. There are also a sizable number of twins with
Southern, Western, Eastern European and Asian
ancestry, and also a small minority with some indigenous Australian (Aboriginal) ancestry.
Predictors of Participation in the OZ-GAM Study
Nearly all of the predictors from the 1996–2000
interview (with the exception of age, being raised
Anglican or with no religion, and having a history of
major depression) significantly predicted participation
in the OZ-GAM study. Twins who participated in the
OZ-GAM study were more likely to: be female, from
MZ and same-sex twin pairs, have a higher household
income and be a high school graduate, and less likely
to: have been raised Catholic, be a regular drinker or
smoker, and have a history of alcohol dependence or
Table 3
Demographic Characteristics of the OZ-GAM Sample (N = 4,764)
M (SE)
Range
37.7 (0.04)
32–43a
%
N
Married
64.2
3,058
Parent
74.2
3,532
Homeowner
78.9
3,737
60.7
2,877
Characteristic
Age
Occupational status
Education
Religion
Residence
Employed full-time
Employed part-time
26.5
1,255
Homemaker
42.3
2,006
Unemployed
2.3
110
Retired/disability
5.7
272
Student
7.0
334
21.1
998
8–10 years
High school graduate
16.9
803
Vocational or technical college
29.0
1376
University education
17.5
828
Post graduate education
15.5
736
Catholic
31.4
1,484
Anglican
29.4
1,391
Other Christian
25.4
1,200
No religion
13.1
618
Metropolitan area
63.2
2956
Regional city
15.9
743
Rural area
20.9
976
64.2
3,054
Both parents born in Australia
Note: a one participant was 30 years old and one was 31 years old; 99% of participants were 32–42 years of age.
Twin Research and Human Genetics February 2009
71
Wendy S. Slutske, Madeline H. Meier, Gu Zhu, Dixie J. Statham, Alex Blaszczynski, and Nicholas G. Martin
Table 4
Distribution of Twins in the OZ-GAM Sample by State or Territory of Residence
Gambling rank
N
Victoria
2
1,311
27.5
24.8
New South Wales
1
912
19.1
32.9
State or territory
%
2006 Australian census
Western Australia
8
685
14.4
9.9
Queensland
3
513
10.8
19.7
South Australia
5
470
9.9
7.6
Australian Capitol Territory
6
129
2.7
1.6
Tasmania
7
96
2.0
2.3
Northern Territory
4
31
0.7
1.0
Live overseas
—
96
2.0
—
Unknown
—
21
0.0
—
Total
—
4,764
100
Note: Gambling rank is from Productivity Commission (1999), and is based on the average per capita expenditure on gambling.
conduct disorder. After adjusting for the main effect of
sex, having a higher household income and being a
regular drinker were no longer statistically significant
predictors, and having a history of major depression
became a statistically significant predictor of participation in the OZ-GAM study. Odds ratios of the
unadjusted associations between each predictor and
OZ-GAM participation are presented in Table 6.
Also presented in Table 6 are the characteristics of
the targeted sample and the final OZ-GAM sample
to illustrate the net effect of this differential attrition.
Note that the statistical tests were not based on
comparing these two groups (because the OZ-GAM
is a subset of the target sample) but is based on a
comparison of the participating (in OZ-GAM) and
nonparticipating twins from the target sample.
Inspection of Table 6 shows that the OZ-GAM
sample was fairly close to the target sample on all of
the demographic, other addictive behavior, and
psychiatric characteristics examined.
A comparison of twins from pairs concordant (i.e.
complete pairs) and discordant (i.e., incomplete
pairs) for participating in the OZ-GAM study is presented in Table 7. For the continuous indicators of
gambling involvement, estimates of the standardized
mean difference (effect size, d) are presented as an
index of the magnitude of the difference between the
two types of twins (from complete versus incomplete
Table 5
Ancestry of Twins in the OZ-GAM Sample
Percentage of grandparents belonging to ancestral group
100%
75%
Europe
3603
418
370
Northern Europe
2358
774
685
237
United Kingdomb
1499
870
1019
429
Ireland
71
74
418
688
Western Europe
89
28
250
603
Southern Europe
229
23
121
148
Region of ancestry
a
50%
25%
Number of participants
136
Eastern Europe
14
9
65
50
Asia
30
7
34
44
Africa
2
1
1
12
South America
2
0
1
2
North America (indigenous)
0
0
0
2
Australia (indigenous)
6
4
16
53
New Zealand (indigenous)
0
0
3
10
Pacific Islands
1
0
3
11
170
113
296
335
Missing information
Note: a see http://unstats.un.org/unsd/methods/m49/m49regin.htm for the composition of the geographical regions used; b United Kingdom includes England, Wales, and Scotland.
72
Twin Research and Human Genetics February 2009
Australian Twin Study of Gambling
Table 6
Longitudinal Predictors from the 1996–2000 Interview of Participation in the 2004–2007 OZ-GAM Study
Odds ratio (95% CI)
Target sample (N = 6,136a) (%)
In OZ-GAM (N = 4,542b) (%)
Sex (male)
0.68 (0.60, 0.76)
44.7
42.2
Zygosity (MZ)
1.37 (1.21, 1.56)
40.6
42.8
Zygosity (same-sex pairs)
1.20 (1.05, 1.37)
75.0
76.0
1996–2000 predictor
High income (upper ~25%)
1.26 (1.10, 1.44)
22.0
23.2
Low income (lower ~25%)
0.50 (0.45, 0.56)
31.9
27.4
High school graduate
1.63 (1.44, 1.84)
54.5
57.7
Catholic
0.85 (0.74, 0.97)
30.3
29.4
Anglican
1.02 (0.89, 1.17)
30.4
30.6
No religion
1.06 (0.87, 1.29)
11.5
11.6
Ever regular drinker
0.78 (0.63, 0.97)
90.4
89.9
Ever regular smoker
0.64 (0.56, 0.72)
48.2
45.3
History of alcohol dependence
0.70 (0.58, 0.83)
10.3
9.4
History of major depression
0.90 (0.79, 1.02)
27.7
27.1
History of conduct disorder
0.71 (0.58, 0.85)
9.9
9.1
Note: a analyses were based on 6,136 of the 6,733 individuals in the target sample who participated in the 1996–2000 interview; b analyses were
based on 4,542 of the 4,764 individuals in the OZ-GAM sample who participated in the 1996–2000 interview.
pairs), and for categorical indicators, odds ratios are
presented as an index of the strength of the
association between the type of twin (from complete
versus incomplete pairs) and the gambling-related
outcome. Twins from pairs that were discordant for
participation in the study reported a larger maximum
number of dollars ever spent gambling in a day, had
more symptoms of DSM-IV PG, and were more
likely to have a lifetime diagnosis of PG by both the
DSM-IV and SOGS definitions. For example, the
prevalences of DSM-IV and SOGS PG diagnoses
were about 50% higher among the twins from
incomplete pairs than among the twins from complete pairs. Overall, the lifetime prevalences of
DSM-IV and SOGS PG diagnoses in the full OZGAM sample were 2.2% and 3.5%, respectively.
Sources of Individual Differences in Gambling
Involvement
The lifetime prevalence, test–retest reliability, twin
correlations, and results of biometric model-fitting
for 11 different gambling activities are presented in
Table 8. Table 8 shows that: (a) many of the
Australian twins in the OZ-GAM have participated
in most of the 11 different gambling activities in their
lifetime (M prevalence = 47%), (b) the test–retest
reliability of self-reports of participation for all of the
11 gambling activities was very high (M reliability =
0.89), (c) the MZ twin correlations exceeded the DZ
twin correlations for all 11 of the gambling activities
(M rMZ = 0.56, M rDZ = 0.32), and (d) across the different activities, the estimates of genetic, shared
Table 7
Gambling Involvement Among Twins From Complete and Incomplete Pairs in the OZ-GAM
Indicator of gambling involvement
Complete pairs
d
Incomplete pairs
M
SE
M
SE
Versatility (0–11 activities)
5.15
Max. frequency (days/year)
46.04
0.04
5.19
0.06
–0.02 (p = .60)
1.14
50.93
2.18
–0.06 (p = .08)
137.97
8.08
189.37
20.09
–0.10 (p = .005)
DSM-IV PG symptoms (1–10)
0.28
0.01
0.40
0.04
–0.06 (p = .02)
SOGS symptoms (1–20)
0.78
0.03
0.94
0.06
–0.04 (p = .20)
Max. spent ($/day)
Complete pairs
Incomplete pairs
%
%
OR (95% CI)
DSM-IV PG diagnosis
1.9
3.4
0.55 (0.36, 0.83)
SOGS PG diagnosis
3.2
4.7
0.67 (0.47, 0.96)
Note: Means and SEs are based on untransformed data, effect sizes (d) are computed with rank-normalized scores. DSM-IV = Diagnostic and Statistical Manual of Mental
Disorders, 4th edition; SOGS = South Oaks Gambling Screen; PG = pathological gambling.
Twin Research and Human Genetics February 2009
73
Wendy S. Slutske, Madeline H. Meier, Gu Zhu, Dixie J. Statham, Alex Blaszczynski, and Nicholas G. Martin
family environmental, and nonshared environmental
influences were generally moderate, low, and moderate, respectively, with mean parameter estimates
obtained of A = 0.43, C = 0.10, E = 0.46. There were
only a few deviations from this general pattern. In
particular, Internet casino gambling was of very low
prevalence, the test–retest reliability of self-reports of
ever participating were somewhat lower than for the
other activities, and probably due to its very low
prevalence, the estimates of A and C were not significantly different from zero (although the estimates of
A and C were nonsignificant, the estimates of the
combined familial influences was statistically significant; A + C = 0.64 [95% CI = 0.16, 0.91]). Also,
betting on games of skill (such as billiards) appeared
to be less heritable than the other forms of gambling
(again, although the estimates of A and C were nonsignificant, the estimates of the combined familial
influences was statistically significant; A + C = 0.39
[95% CI = 0.24, 0.55]).
Any lifetime gambling involvement bore striking
similarities to any alcohol involvement. Both were
extremely common in this Australian sample, were
very reliably measured, and were strongly familial
(MZ twin correlations of 0.79 and 0.77). For any
gambling, the combined familial influences of A + C
was statistically significant (A + C = 0.76 [0.58,
0.88]). For any alcohol use, the broad-sense heritability (A + D) was estimated rather than A and D
individually because additive and nonadditive genetic
effects are not well parsed in the classic twin study
(Martin et al., 1978; Williams, 1993). This combined
influence of additive and nonadditive genetic influences was 0.75 (95% CI = 0.57, 0.87).
The indicators of any gambling involvement and
any alcohol use can also be interpreted as reversed indicators of lifetime abstinence from gambling and from
drinking alcohol. Any lifetime gambling involvement
was based on endorsing at least one of the 11 different
gambling activities; because there are so many different
ways one can gamble, it is possible that a twin’s gambling experiences may not have been captured by this
list. Therefore, participants were also asked to report
any other gambling activities that were not included in
the list. Five per cent of the twins (N = 242) reported
another gambling activity; the three most commonly
reported additional activities were ‘two-up’ (a traditional Australian coin-flipping game), betting on snail,
mouse, rat, cockroach, rabbit, fly, and yabby (crawfish)
races, or betting on the outcome of events. All of the
twins who reported an additional activity also endorsed
at least one of the 11 standard activities, and so the list
appears to have provided adequate coverage of any
gambling involvement. For both gambling and alcohol,
abstinence was rare — 2% of these Australian twins
were lifetime abstainers. Abstention from both gambling and alcohol were strongly familial; it was not
possible to discern the extent to which the familial
factors contributing to individual differences in abstention from gambling were genetic or environmental.
The mean, test–retest reliability, twin correlations,
and results of biometric model-fitting for versatility, frequency, and quantity of gambling involvement are
presented in Table 9. On average, these Australian twins
Table 8
Lifetime Involvement in 11 Different Gambling Activities (and Alcohol Use, for Comparison):
Prevalence, Reliability, Twin Correlations, and Variance Decomposition
Activity
Prevalence Reliabilitya
%
r
Variance componentsb (95% CI)
Twin correlations
MZ
DZ
A
C
E
Lottery
90
0.87
0.59
0.28
0.58 (0.20, 0.68)
0.00 (0.00, 0.32)
0.42 (0.32, 0.54)
Electronic gaming machines
88
0.99
0.54
0.29
0.50 (0.13, 0.65)
0.04 (0.00, 0.34)
0.46 (0.35, 0.59)
Instant scratch tickets
86
0.84
0.56
0.22
0.54 (0.29, 0.64)
0.00 (0.00, 0.20)
0.46 (0.36, 0.56)
Horse or dog races
75
0.94
0.54
0.32
0.41 (0.13, 0.61)
0.11 (0.00, 0.34)
0.48 (0.39, 0.58)
Casino table games
47
0.94
0.60
0.30
0.54 (0.29, 0.64)
0.03 (0.00, 0.23)
0.43 (0.36, 0.52)
Keno
44
0.91
0.57
0.33
0.46 (0.22, 0.64)
0.10 (0.00, 0.30)
0.43 (0.36, 0.52)
Bingo
33
0.96
0.58
0.37
0.43 (0.18, 0.65)
0.14 (0.00, 0.34)
0.42 (0.34, 0.51)
Card games
28
0.84
0.57
0.38
0.29 (0.01, 0.56)
0.23 (0.01, 0.44)
0.49 (0.39, 0.59)
Betting on sporting event
14
0.90
0.50
0.26
0.44 (0.05, 0.58)
0.02 (0.00, 0.31)
0.54 (0.42, 0.68)
Betting on games of skill
9
0.86
0.51
0.35
0.10 (0.00, 0.54)
0.29 (0.00, 0.48)
0.61 (0.45, 0.76)
Internet casino games
1
0.71
0.60
0.44
0.46 (0.00, 0.91)
0.18 (0.00, 0.74)
0.36 (0.09, 0.84)
Any gambling
98
1.00
0.79
0.49
0.55 (0.00, 0.88)
0.21 (0.00, 0.72)
0.24 (0.12, 0.42)
Any alcohol
98
0.94
0.77
0.23
A+D
E
0.75 (0.57, 0.87)
0.25 (0.13, 0.43)
Note: a based on 166 participants who completed the interview on two occasions 1.2–9.5 months apart (mean = 3.4 months); b controlling for the main effects of sex; reliability
coefficient and twin correlations are tetrachoric correlations; MZ = monozygotic; DZ = dizygotic; A = additive genetic influences, C = shared family environmental influences,
E = nonshared environmental influences.
74
Twin Research and Human Genetics February 2009
Australian Twin Study of Gambling
had participated in 5 of the 11 different gambling activities listed in Table 8 in their lifetime, during their
heaviest period of gambling they gambled about once a
week, and on the single day that they spent the most on
gambling, they lost AUD$149. The sources of individual
differences for versatility, frequency, and quantity of
gambling involvement were similar to the sources of
individual differences in the liability or propensity to participate in the individual gambling activities in Table 8 —
there was evidence for moderate genetic effects and very
modest to no shared family environmental effects.
Discussion
In this article, we describe a new twin study of gambling involvement conducted in Australia. The rationale
for conducting a twin study of gambling in this particular setting is that Australia has higher rates of gambling
involvement and problems than anywhere else in the
world (with the possible exception of Taiwan; Hwu et
al., 1989), or at least than in the United States. Below
we discuss the extent to which the recruitment of a
heavy-gambling twin sample was accomplished,
comment on the composition of the OZ-GAM sample,
and then summarize the findings regarding potential
sampling biases and our ‘first look’ at the sources of
individual differences in gambling involvement.
In the United States National Epidemiologic Survey
of Alcohol and Related Conditions (NESARC;
National Institute on Alcohol Abuse and Alcoholism;
Grant et al., 2004; Petry et al., 2005), a national
survey of 43,093 adults conducted in 2001–2002, the
lifetime prevalence of DSM-IV PG was 0.43% in the
full sample and 0.41% when the sample was restricted
to 32–43 year olds (the same age range as the OZGAM). In the United States Gambling Impact and
Behavior Study (GIBS; NORC Gambling Impact and
Behavior Study; Gerstein et al., 1999), a survey of
2,417 adults conducted in 1998–1999 that used the
interview on which the OZ-GAM DSM-IV PG assessment was based, the lifetime prevalence of DSM-IV PG
was 0.80% in the full sample and 0.50% when the
sample was restricted to 30–39 year olds (only age
ranges were available in the public domain dataset in
order to protect confidentiality). In comparison, the
lifetime prevalence of DSM-IV PG in the OZ-GAM was
2.2%, that is, more than 500% and 400% higher than
same-aged individuals from the United States NESARC
and GIBS surveys. (It is worth noting that in addition to
being the first community-based twin study of gambling
involvement conducted in Australia, the OZ-GAM also
may be the first community-based epidemiologic survey
of lifetime DSM-IV PG conducted in Australia — previous community-based surveys have focused on
past-year problems, or were typically based on the
SOGS assessment.) Another perspective is the relative
efficiency of conducting community-based PG research
in Australia versus the United States. In the Australia
OZ-GAM, 4,764 participants were screened in order to
identify 104 individuals with DSM-IV PG, whereas in
the United States NESARC, 43,093 participants needed
to be screened in order to identify 185 individuals with
DSM-PG. Nonetheless, even in a heavy-gambling
culture in Australia where PG is more common than in
the rest of the world, it is still a relatively rare disorder.
The lifetime prevalences of ever participating in
different forms of gambling were generally high, with
the exception of internet casino gambling. Internet
gambling has come under a great deal of scrutiny over
the last decade, in Australia and in the United States,
because of concerns that it will potentially make gambling opportunities more easily available to an even
larger segment of the population, and thus lead to
increased rates of gambling problems. Australia was
the first country to legalize online gambling, and was
also one of the first countries to quickly respond to
the potential harms associated with online gambling.
With the passing of the Interactive Gambling
(Moratorium) Act in 2000, it has become illegal for
any gambling service provider, in Australia or overseas, to provide services to individuals in Australia.
Online casinos in Australia that were in operation
prior to the moratorium have been allowed to remain
available for Australia customers (but perhaps not surprisingly, the largest proportion of their customers is
from the United States and other countries).
In a 1999 Australian national survey, 0.41% of
adults reported that they had played Internet casino
games in the past year, similar to 0.55% of twins from
the OZ-GAM surveyed in 2004–2007 (not shown in
Table 8). The lifetime prevalence of Internet gambling
of 1% obtained in the OZ-GAM is the same as that
obtained in a United States survey conducted in 2001–
2003 (the National Comorbidity Survey Replication;
Table 9
Versatility, Frequency, and Quantity of Gambling Involvement: Mean, Reliability, Twin Correlations, and Variance Decomposition
Gambling index
M (SE)
Versatility (0–11 activities)
5.16 (0.03)
Max. frequency (days/year)
Max. spent ($/day)
Reliability
Variance componentsa (95% CI)
Twin correlations
r
MZ
DZ
A
C
E
0.73
0.58
0.28
0.56 (0.43, 0.61)
0.01 (0.00, 0.13)
0.43 (0.39, 0.47)
47.07 (1.01)
0.64
0.48
0.21
0.47 (0.38, 0.51)
0.00 (0.00, 0.07)
0.53 (0.49, 0.58)
148.87 (7.67)
0.70
0.58
0.31
0.43 (0.30, 0.56)
0.09 (0.00, 0.21)
0.47 (0.43, 0.52)
Note: a controlling for the main effects of sex; MZ = monozygotic; DZ = dizygotic; A = additive genetic influences, C = shared family environmental influences,
E = nonshared environmental influences.
Twin Research and Human Genetics February 2009
75
Wendy S. Slutske, Madeline H. Meier, Gu Zhu, Dixie J. Statham, Alex Blaszczynski, and Nicholas G. Martin
Kessler et al., 2008). Either Internet gambling has not
become as popular in Australia as anticipated, or the
measures taken to control it have been effective.
The OZ-GAM sample is broadly representative of
Australian individuals 32 to 43 years of age. However, it
must be recognized that the sample was originally assembled in 1980–82 (see Figure 1), and so might not match
current Australian national demographic characteristics.
As would be expected from any community-based longitudinal study, the OZ-GAM sample probably reflects the
demographics from the period when the cohort was
originally recruited. Longitudinal twin data provide
several checks on sampling biases that are not possible
with cross-sectional surveys of unrelated individuals. In a
previous paper, Heath et al. (2001) examined the predictors (actually, ‘postdictors’) of participation in the 1989
questionnaire survey from later participation in the
1996–2000 interview in the ATR Cohort II (see Figure
1). The target sample for both surveys was the entire
ATR Cohort II, but a much higher response rate was
achieved with the 1996–2000 interview, and so the question was the extent to which the smaller questionnaire
sample was biased. The postdictors that were identified
by Heath et al. (2001) of participation in the questionnaire were very similar to the predictors of participation
in the OZ-GAM interview — being female, from an MZ
twin pair, obtaining a higher educational attainment, and
not being Catholic, a smoker, or having a history of
alcohol dependence or conduct disorder.
Comparisons of twin pairs concordant and discordant for participation in the OZ-GAM also suggested
that individuals who spent more money on their gambling and who had lifetime symptoms of DSM-IV PG
and PG disorder were less likely to participate. The
prevalence of DSM-IV PG was 2.2 in the OZ-GAM
sample overall, but it was 3.4% among those twins
whose co-twin did not participate in the study. Although
this seems like a big difference, it does not have much of
a net effect. For example, if one assumes that the prevalence of DSM-IV PG was 3.4% among all of the 1969
twins from the target sample of 6,733 individual twins
who did not participate in the OZ-GAM (for all
reasons), this would have yielded an estimated prevalence of 2.5% in the full target sample. If one assumes
that the prevalence of DSM-IV PG in twins who did not
participate was double that estimated in the OZ-GAM,
that is 4.4%, the estimated prevalence in the full target
sample would have been 2.8%.
The propensity to gamble was strongly familial,
but because gambling was so common, it was not possible to determine the extent to which the familial
influences for any lifetime gambling was due to shared
genes or shared environments. Although a different
conclusion was reached, the Minnesota twin study of
Winters and Rich (1998) obtained similar results.
Winters and Rich reported twin concordances of any
gambling in the past year of 86% for MZ twins and
81% for DZ twins, which did not significantly differ,
and that led them to conclude that there were not
76
widespread genetic influences on all gambling behavior, but only for ‘high-risk’ gambling involvement.
However, the MZ and DZ concordances were also not
substantially different from the reported prevalence of
88% of any gambling in the past year among singletons obtained from a state of Minnesota survey,
suggesting that the high base rate of the behavior
made it difficult to disentangle the causes of individual
differences. Extremely common binary traits such as
any gambling can be as difficult to study as extremely
uncommon binary traits such as PG disorder.
When the focus was narrowed to the propensity to
participate in a particular gambling activity, the results
were more straightforward. For 9 of the 11 activities
assessed, the propensity to ever participate was primarily due to genetic and individual-specific environmental
factors. For none of the activities was there statistically
significant evidence for shared family environmental
influences, although the confidence intervals were generally broad and could not rule out the possibility of
shared family environmental influences accounting for
as much as 30% of the variation in liability for most
forms of gambling. A comparison of the results
obtained for the 11 different gambling activities suggests that there were more similarities than differences,
but when the ‘high-action’ and ‘non-high-action’ groupings of Winters and Rich (1998) are examined, a
pattern similar to the findings of the previous study
emerges. Four activities that were ‘high-action’ —
lottery, electronic gaming machines, instant scratch
tickets, and casino table games — had an average heritability of 54%. The four activities that were
‘non-high-action’ — bingo, card games, betting on a
sporting event, and betting on games of skill — had an
average heritability of 32%. Winters and Rich (1998)
describe ‘high-action’ games, as those that tend to be
associated with heavy player promotion and potentially
high-payoffs, and ‘non-high-action’ games, as those
which tend to reflect lower payoffs and informal
involvement, such as social betting. Although the difference between high-action and non-high-action
gambling was not rigorously tested, it looks to be a
promising distinction that may potentially identify
more and less heritable gambling activities.
It is also intriguing to consider the extent to
which the differences between the results of the
NMSQT twin study (which was conducted in the
early 1960s in the United States — a gambling prohibitive milieu) and the OZ-GAM (conducted in the
early 2000s in Australia — a permissive gambling
milieu) may be an example of a genotype × environment interaction. In other words, perhaps the genes
that influence the propensity to gamble are more
likely to be expressed in a more gambling permissive
environment. An alternative explanation for the differences between the results of the NMSQT and
OZ-GAM studies may rest with the ages of the
samples. The NMSQT participants were high school
seniors still living at home with their parents,
Twin Research and Human Genetics February 2009
Australian Twin Study of Gambling
whereas the OZ-GAM participants were adults, most
with children of their own. Perhaps the effect of the
family environment on the propensity to gamble may
be relatively transient and limited to the developmental period when young people are currently living
with their family of origin.
Other indicators of gambling involvement showed a
similar pattern of genetic and environmental influence.
The number of different gambling activities an individual ever tried in their lifetime (versatility) was partially
due to genetic differences, as was the frequency
(number of days gambled) and quantity (amount spent)
of gambling in any form of gambling. Again, there was
limited evidence for an important influence of the
shared family environment. These results cast doubt on
theories that look to social modeling influences to
explain the familial transmission of gambling.
Although an important initial step, this ‘first look’ at
the sources of individual differences in gambling involvement in some ways raises more questions than it
answers. Not presented in this report was an examination of differences in the causes of variation in men
versus women. We also focused on a few crude indices of
gambling involvement, and primarily reported on what
is typically termed ‘initiation’ in the substance use literature — that is, whether one has ever used, or
participated in a given gambling activity. We did not
look at more fine-grained approaches to characterizing
an individual’s level of involvement, or the extent to
which genetic and environmental influences might play
somewhat different roles in the different stages or levels
of involvement (i.e., initiation, regular involvement, frequent involvement, problematic involvement). We have
documented genetic influences on the propensity to
engage in 9 different forms of gambling, but it is
extremely unlikely that there are 9 different sets of genes
involved. Future research (including analyses of our own
data) may be able to identify groupings of activities that
have similar underpinnings, that is, common susceptibility genes, or identify a general propensity to gamble,
with the same genes involved in the propensity to engage
in all the different forms of gambling. Given the high
rates of involvement in many different gambling activities in Australia, the OZ-GAM sample would appear to
be ideal for answering such questions.
Acknowledgments
Wendy S. Slutske and Madeline H. Meier, Department
of Psychological Sciences and Midwest Alcoholism
Research Center, University of Missouri-Columbia;
Alex Blaszczynski, Department of Psychology,
University of Sydney; Gu Zhu and Nicholas G. Martin,
Genetic Epidemiology Laboratory, Queensland Institute
of Medical Research. This work was supported by
National Institutes of Health Grant MH66206. Thanks
to Bronwyn Morris, and Megan Fergusson for coordinating the data collection for the twins, and to David
Smyth, Olivia Zheng, and Harry Beeby for writing the
computer-assisted interviewing software. We appreciate
the continued participation of the Australian Twin
Registry twins.
References
American Psychiatric Association (1987). Diagnostic and
statistical manual of mental disorders: DSM-III-R (Rev.
3rd ed.). Washington, DC: American Psychiatric
Association.
American Psychiatric Association (1994). Diagnostic and
statistical manual of mental disorders: DSM-IV (4th ed.).
Washington, DC: American Psychiatric Association.
Australian Gaming Council. (2004). A database on
Australia’s gambling industry 2004. Melbourne,
Australia: Australian Gaming Council.
Australasian Gaming Council. (2008). A database on
Australia’s gambling industry 2008/09. Melbourne,
Australia: Australasian Gaming Council.
Black, D. W., Monahan, P. O., Temkit, M., & Shaw, M.
(2006). A family study of pathological gambling.
Psychiatry Research, 141, 295–303.
Blanco, C., Orensanz-Munoz, L., Blanco-Jerez, C.,&
Saiz-Ruiz, J. (1996). Pathological gambling and platelet
MAO activity: A psychobiological study. American
Journal of Psychiatry, 153, 119–121.
Carrasco, J. L., Saiz-Ruiz, J., Hollander, E., Cesar, J., &
Lopez-Ibor, J. J., Jr. (1994). Low platelet monoamine
oxidase activity in pathological gambling. Acta
Psychiatrica Scandinavica, 90, 427–431.
Comings, D. E., Gade, R., Wu, S., Chiu, C., Dietz, G.,
Muhleman, D., Saucier, G., Ferry, L., Rosenthal, R. J.,
Lesieur, H. R., Rugle, L. J., & MacMurray, P. (1997).
Studies of the potential role of the dopamine D1 receptor gene in addictive behaviors. Molecular Psychiatry,
2, 44–56.
Comings, D. E., Rosenthal, R. J., Lesieur, H. R., Rugle, L. J.,
Muhleman, D., Chiu, C., Dietz, G., & Gade, R. (1996).
A study of the dopamine D2 receptor gene in pathological gambling. Pharmacogenetics, 6, 223-34.
Eisen, S. A., Lin, N., Lyons, M.J., Scherrer, J., Griffith, K.,
True, W. R., Goldberg, J., & Tsuang, M. T. (1998).
Familial influences on gambling behavior: An analysis of
3,359 twin pairs. Addiction, 93, 1375–1384.
Gambino, B., Fitzgerald, R., Shaffer, H.J., & Renner, J., &
Courtage, P. (1993). Perceived family history of problem
gambling and scores on SOGS. Journal of Gambling
Studies, 9, 169–184.
Gerstein, D, Volberg, R, Murphy, S, Toce, M, et al. (1999).
Gambling Impact and Behavior Study: Report to the
National Gambling Impact Study Commission. New
York: Christiansen/Cummings Associates.
Grant, B. F., Hasin, D. S., Chou, S. P., Stinson, F. S., &
Dawson, D. A. (2004). Nicotine dependence and psychiatric disorders in the United States: Results from
the National Epidemiologic Survey on Alcohol and
Related Conditions. Archives of General Psychiatry,
61, 1107–1115.
Twin Research and Human Genetics February 2009
77
Wendy S. Slutske, Madeline H. Meier, Gu Zhu, Dixie J. Statham, Alex Blaszczynski, and Nicholas G. Martin
Gupta, R., & Derevensky, J. (1997). Familial and social
influences on juvenile gambling behavior. Journal of
Gambling Studies, 13, 179–192.
Hansell, N. K., Agrawal, A., Whitfield, J. B., Morley, K. I.,
Zhu, G., Lind, P. A., Pergadia, M.L., Madden, P.A.,
Todd, R. D., Heath, A. C., & Martin, N. G. (2008).
Long-term stability and heritability of telephone interview measures of alcohol consumption and dependence.
Twin Research and Human Genetics, 11, 287–305.
Heath, A. C., Howells, W., Kirk, K. M., Madden, P. A. F.,
Bucholz, K. K., Nelson, E. C., Slutske, W. S., Statham, D.
J., & Martin, N. G. (2001). Predictors of non-response
to a questionnaire survey of a volunteer twin panel:
Findings from the Australian 1989 twin cohort. Twin
Research, 4, 73–80.
Hwu, H-G., Yeh, E. K., & Chang, L. Y. (1989). Prevalence
of psychiatric disorders in Taiwan defined by the Chinese
diagnostic interview schedule. Acta Psychiatrica
Scandinavica, 79, 136–174.
Kessler, R. C., Hwang, I., LaBrie, R., Petukhova, M.,
Sampson, N. A., Winters, K. C., & Shaffer, H. J. (2008).
DSM-IV pathological gambling in the National
Comorbidity Survey Replication. Psychological
Medicine, 38, 1351–1360.
Lesieur, H. R., & Blume, S. B. (1987). The South Oaks
Gambling Screen (SOGS): A new instrument for the
identification of pathological gamblers. American
Journal of Psychiatry, 144, 1184–1188.
Little, R. J. A., & Rubin, D. B. (1987). Statistical analysis
with missing data. New York: John Wiley & Sons.
Loehlin, J. C., & Nichols, R. C. (1976). Heredity, environment and personality: A study of 850 sets of twins.
Austin: University of Texas Press.
Lobo, D. S. S., & Kennedy, J. L. (2006). The genetics of
gambling and behavioral addictions. CNS Spectrums,
11, 931–939.
Lynskey, M. T., Heath, A. C., Nelson, E. C., Bucholz, K. K.,
Madden, P. A. F., Slutske, W. S., Statham, D. J., &
Martin, N. G. (2002). Genetic and environmental contributions to cannabis dependence in a national young
adult twin sample. Psychological Medicine, 32, 195–
207.
Martin, N. G., Eaves, L. J., Kearsey, M. J., & Davies, P.
(1978). The power of the classical twin study. Heredity,
40, 97–116.
National Research Council. (1999). Pathological gambling:
A critical review. Washington, DC: National Academy
Press.
National Institute on Alcohol Abuse and Alcoholism:
National Epidemiologic Survey on Alcohol and Related
Conditions (NESARC). Available at http://niaaa.
census.gov/
Neale, M. C., Boker, S. M., Xie, G., & Maes, H. H. (2003).
Mx: Statistical Modeling (6th ed.). Richmond, VA:
Department of Psychiatry.
78
NORC Gambling Impact and Behavior Study. Available at
http://www.norc.uchicago.edu/new/gambling.htm
O’Hara, J. (1988). A mug’s game: A history of gaming and
betting in Australia. Sydney, Australia: New South Wales
University Press.
Organisation for Economic Co-operation and Development
(2008). Education at a glance 2008: OECD indicators.
Paris: OECD Publishing.
Petry, N. M., Stinson, F. S., & Grant, B. F. (2005).
Comorbidity of DSM-IV pathological gambling and
other psychiatric disorders: Results from the National
Epidemiologic Survey on Alcohol and Related
Conditions. Journal of Clinical Psychiatry, 66, 564–574.
Productivity Commission (1999). Australia’s gambling
industries (Report No. 10). Canberra, Australia:
AusInfo.
Pryor, F.L. (2008). Macro-determinants of gambling in
industrialized nations. Kyklos, 61, 101–113.
Roy, A., Adinoff, B., Roehrich, L., Lamparski, D., Custer,
R., Lorenz, V., Barbaccia, M., Guidotti, A., Costa, E., &
Linnoila, M. (1988). Pathological gamblers: A psychobiological study. Archives of General Psychiatry, 45,
369–373.
Slutske, W. S. (2006). Natural recovery and treatmentseeking in pathological gambling: Results of two US
national surveys. American Journal of Psychiatry, 163,
297–302.
Slutske, W. S., Eisen, S. A., True, W. R., Lyons, M. J.,
Goldberg, J., & Tsuang, M. T. (2000). Common genetic
vulnerability for pathological gambling and alcohol
dependence in men. Archives of General Psychiatry, 57,
666–673.
Slutske, W. S., Eisen, S.A., Xian, H., True, W. R., Lyons, M.
J., Goldberg, J., & Tsuang, M. T. (2001). A twin study
of the association between pathological gambling and
antisocial personality disorder. Journal of Abnormal
Psychology, 110, 297–308.
Slutske, W. S., Jackson, K. M., & Sher, K. J. (2003). The
natural history of problem gambling from age 18 to 29.
Journal of Abnormal Psychology, 112, 263–274.
Waldron, M., Heath, A. C., Bucholz, K. K., Madden, P. A.
F., & Martin, N.G. (2008). Alcohol dependence and
reproductive onset: Findings in two Australian twin
cohorts. Alcoholism: Clinical and Experimental
Research, 32, 1–10.
Williams, C. J. (1993). On the covariance between parameter estimates in models of twin data. Biometrics, 49,
557–568.
Winters, K. C., & Rich, T. (1998). A twin study of adult
gambling behavior. Journal of Gambling Studies, 14,
213–225.
Xian, H., Scherrer, J. F., Slutske, W. S., Shah, K. R., Volberg,
R., & Eisen, S. A. (2007). Genetic and environmental
contributions to pathological gambling symptoms in a
10-year follow-up. Twin Research and Human Genetics,
10, 174–179.
Twin Research and Human Genetics February 2009


© Copyright 2026