
The measurement of physical activity and sedentary behaviour in a
Loughborough University Institutional Repository The measurement of physical activity and sedentary behaviour in a sample of 2 to 3 year old South Asian and White British children This item was submitted to Loughborough University’s Institutional Repository by the/an author. Additional Information: • A Doctoral Thesis. Submitted in partial fulfilment of the requirements for the award of Doctor of Philosophy of Loughborough University. Metadata Record: https://dspace.lboro.ac.uk/2134/13510 c S´ılvia Costa Publisher: Please cite the published version. This item was submitted to Loughborough University as a PhD thesis by the author and is made available in the Institutional Repository (https://dspace.lboro.ac.uk/) under the following Creative Commons Licence conditions. For the full text of this licence, please go to: http://creativecommons.org/licenses/by-nc-nd/2.5/ The Measurement of Physical Activity and Sedentary Behaviour in a sample of 2 to 3 year old South Asian and White British Children by Sílvia Costa A Doctoral Thesis Submitted in partial fulfilment of the requirements for the award of Doctor of Philosophy of Loughborough University 18th of June 2013 © by Sílvia Costa 2013 i Abstract Abstract Background: Studies have reported that preschool children may not be sufficiently active according to guidelines. This is worrying because early childhood is a critical period for the establishment of sedentary behaviour (SB) and physical activity (PA) habits, which have immediate and long term influences on health. The majority of evidence on levels, determinants, and health consequences of SB and PA in young children is, however, based on subjective measures in predominately White children aged three years or older. Aims: To 1) assess the feasibility and acceptability of using three different accelerometers in South Asian and White British 2-3 year olds and their parents; 2) calibrate and validate the accelerometers to measure SB and PA in 2-3 year olds; 3) investigate the influence of 5-, 10-, and 15-second epochs on time spent in SB, light PA, and moderate-to-vigorous PA (MVPA) in 2-3 year olds; and 4) assess the feasibility of measuring the habitual SB and PA with the ActiGraph GT3X+ accelerometer in South Asian and White British 2-3 year olds and their parents. Methods: Focus groups were performed with 17 South Asian and White British mothers and the audio-recordings were transcribed verbatim and analysed with thematic analysis (Aim 1). To calibrate the three accelerometers against direct observation (Aim 2), semi-structured activity sessions were run with 18 South Asian and White British 2-3 year olds. Mixed-effects regression and receiver-operating characteristics (ROC) curve analysis were used to generate prediction equations and 5- and 10-second cut-points to assess children’s SB and PA. Validity of the generated cut-points against direct observation (Aim 2) was assessed in a separate sample of 20 White British and Black African 2-3 year olds during free-play, using Cohen’s kappa, ROC curve analysis, Bland-Altman plots, and Lin’s concordance coefficient. Differences in estimated time spent in SB, light PA and MVPA from 5-, 10- and 15-second epochs were tested with repeated-measures ANOVA and paired t-tests in the calibration sample (Aim 3). A pilot study was conducted with 120 South Asian and White British families from a birth cohort study to address aim 4. Study intake and compliance with an 8-day measurement ii Abstract protocol were calculated, and differences between ethnicities were assessed with the Chi-square test. Results: The ActiGraph GT3X+ was the most widely accepted accelerometer, with the least amount of issues raised by mothers. Practical and software issues with the Actiheart and activPAL3 during the calibration phase resulted in insufficient good quality data collected, which made it unfeasible to calibrate both monitors. The overall 5second Axis1 cut-points for the ActiGraph GT3X+ provided a valid tool to measure the SB and total PA of 2-3 year olds in free-living conditions. Using 10- and 15-second epochs overestimated children’s light PA and underestimated time spent in SB and MVPA. Less South Asian than White British families were recruited into the study, and less South Asian than White British children complied with the 8-day measurement protocol. There were no ethnic differences in the number of children and parents providing enough accelerometry data (i.e. ≥3 valid days), or the number of parents complying with the measurement protocol. Conclusions: The results demonstrated that it is feasible to use the ActiGraph GT3X+ to assess the habitual SB and PA of a bi-ethnic sample of 2-3 year old children and their parents. The accurate assessment of SB and PA in 2-3 year olds using the overall 5second Axis1 cut-points developed and validated in this thesis will enable researchers to investigate the levels, determinants, and health consequences of SB and PA. Such research will inform public health policies and interventions to improve children’s health. iii Acknowledgements Acknowledgments To my supervisors, Professor Noël Cameron and Dr Stacy Clemes, who supported me from the very first minute of my last minute decision to start this PhD. To Noël – thank you for all your wise words, the endless “red pen ink” spent on all the drafts throughout these nearly four years, and for being everything I could expect of a true mentor. To Stacy – thank you for all your advice and support at every level, the understanding, and the needed pushes through all the ups and downs of the years. I could not have had a better combination of knowledge, experience and personalities to guide me through this adventure, and I only hope that one day I will be able to inspire others as you have inspired me. To Dr Paula Griffiths – thank you for the moral support, the advice and answers to countless methodology questions that would be expected of a supervisor without being one, and for providing me with the opportunity to teach (during which I have learnt more about statistics than during both my undergraduate and masters degrees). To William – thank you for the initial push to start this journey, the companionship and support, and for putting up with all the stress, grumpiness and tears along the way. “Through thick and thin”, across the Atlantic and back we made it through, and I promise that I will try to be more organised and less stressed in the future journeys of our lives! To my family – thank you for the love, moral support, and for always providing me with my Portuguese comfort food and happy moments during my visits home. Your love and support even from a distance have kept me going through all this process, and I hope that I have made you proud. [Para a minha família – obrigado pelo vosso amor, apoio moral, e por fazerem sempre a minha comida portuguesa reconfortante e momentos felizes durante as minhas visitas a casa. O vosso amor e apoio mesmo à distância ajudaram-me a seguir em frente durante todo este processo, e espero que vos tenha feito sentir orgulhosos.] iv Acknowledgements To all my friends, both at home and away – thank you for always “being there” even when I may have disappeared from the social side of this world while writing up, and for the support that has kept me sane through these nearly four years. To the Born in Bradford study – thank you for providing me with the opportunity to do this research. A special thanks to Dr Sally Barber and the Community Team for the help and extra work put in so that I could get enough participants to finish this project. Last but not least, I want to dedicate this thesis to two great persons who were and always will be an inspiration for me. Firstly, to my physical education teacher Daniel Carinhas who was a true sportsman in the full meaning of the word, and whose enthusiasm and love for sports have inspired me and several generations of young people, driving me towards physical activity and sports during my path in education and research. Lastly, to my darling grandmother who was a steady and sturdy rock for me, from the first steps taken as a toddler, to life-changing decisions as a grown adult. I was extremely lucky to have you in my life and, wherever you are, I hope you will be proud of me at the end of one more important phase of my life. v Publications Publications Published Costa S, Barber S, Griffiths P, Cameron N, Clemes S. Qualitative feasibility of using three accelerometers with 2-3 year old children and both parents”. Res Quart Exerc Sport, 2013; 84(3):295-304. Under review Costa S, Barber S, Cameron N, Clemes S. Calibration and validation of the ActiGraph GT3X+ in 2-3 year olds. J Sci Med Sport (submitted on 05/09/2013) Submitted Costa S, Barber S, Cameron N, Clemes S. Estimating sedentary behaviour, light and moderate-to-vigorous physical activity in 2-3 year olds – the effect of epoch duration. Br J Sports Med (submitted on 02/11/2013) Conference contributions Costa S, Barber S, Cameron N, Clemes S. “Differences in the estimation of time spent in sedentary behaviour, light and moderate-to-vigorous physical activity in toddlers, according to different epoch durations”, oral presentation at the 2013 Annual Meeting of the International Society for Behavioral Nutrition and Physical Activity (Ghent, Belgium), 22nd - 25th of May 2013. Costa S, Clemes S, Barber S, Griffiths P, Cameron N. “Actigraph cut-points for sedentary behaviour and moderate-to-vigorous intensity physical activity in 2-3 year old children”, poster presentation at the 59th Annual Meeting and 3rd World Congress on Exercise is Medicine of the American College of Sports Medicine (San Francisco, CA, USA), 29th of May - 2nd of June 2012. vi Publications Costa S, Griffiths P, Varela-Silva I, Barber S, Clemes S, Cameron N. “Barriers and facilitators for the regular practice of physical activity in White and Pakistani toddlers”, poster presentation at the 16th Annual Congress of the European College of Sport Sciences (Liverpool, UK), 6th - 10th of July 2011. Costa S, Griffiths P, Varela-Silva I, Barber S, Clemes S, Cameron N. “Physical activity benefits, harm of sedentary behaviour and activity guidelines for toddlers – what do mothers know?”, poster presentation at the 16th Annual Congress of the European College of Sport Sciences (Liverpool, UK), 6th - 10th of July 2011. Costa S, Barber S, Akhtar S, Varela-Silva MI, Griffiths P, Clemes S, Cameron N. “Feasibility of using activity monitors in surveillance studies with 2 to 3 year old White and Pakistani children”, poster presentation at the 2nd International Conference on Ambulatory Monitoring of Physical Activity and Movement (Glasgow, UK), 24th - 27th of May 2011. Costa S, Griffiths P, Varela-Silva I, Barber S, Clemes S, Cameron N. “Familial and environmental influences on physical activity and sedentary behaviour in a bi-ethnic sample from Bradford”, 2010 Society for the Study of Human Biology symposium (Durham, UK), 16th - 17th of September 2010. vii Table of Contents Table of Contents Abstract.......................................................................................................................... ii Acknowledgments........................................................................................................iv Publications ..................................................................................................................vi Table of Contents ....................................................................................................... viii List of Figures............................................................................................................. xiii List of Tables ............................................................................................................... xv Abbreviations............................................................................................................ xviii 1. Introduction................................................................................................................ 1 1.1. Aims 4 1.2. Constitution of the thesis.....................................................................................4 2. Literature Review....................................................................................................... 8 2.1. Non-Communicable Diseases..............................................................................9 2.1.1. Risk Factors for Non-Communicable Diseases ................................................ 11 2.1.1.1. Biological Risk Factors ........................................................................................ 11 2.1.1.2. Environmental Risk Factors ................................................................................ 17 2.1.1.3. Behavioural Risk Factors..................................................................................... 19 2.1.1.4. High Risk Groups for Non-communicable Diseases......................................... 25 2.2. Physical Activity and Sedentary Behaviour......................................................29 2.2.1. Definition of Physical Activity and Sedentary Behaviour .................................. 29 2.2.2. Physical Activity and Health ................................................................................ 30 2.2.2.1. Physical Health ..................................................................................................... 32 2.2.2.2. Mental Health ........................................................................................................ 35 2.2.2.3. Social Health ......................................................................................................... 36 2.2.2.4. Cognitive and Motor Development ..................................................................... 37 2.2.3. Sedentary Behaviour and Health ........................................................................ 39 2.2.3.1. Physical Health ..................................................................................................... 41 2.2.3.2. Mental Health ........................................................................................................ 45 viii Table of Contents 2.2.3.3. Social Health ......................................................................................................... 47 2.2.3.4. Cognitive and Motor Development ..................................................................... 48 2.2.4. Critical Periods for the Establishment of Activity Behaviours .......................... 49 2.2.5. Physical Activity in Preschool Children .............................................................. 51 2.2.5.1. Activity Patterns and Motor Development.......................................................... 51 2.2.5.2. Physical Activity Levels of Preschoolers ............................................................ 53 2.2.5.3. Influences on young children’s physical activity ................................................ 56 2.2.6. Sedentary Behaviour in Preschool Children ...................................................... 60 2.2.6.1. Sedentary Behaviour levels ................................................................................ 60 2.2.6.2. Influences on young children’s sedentary behaviour........................................ 62 2.3. Assessment of Physical Activity and Sedentary Behaviour in Young Children...................................................................................................64 2.3.1. Objective Measurement of Physical Activity in Young Children ...................... 66 2.3.1.1. Calorimetry............................................................................................................ 66 2.3.1.2. Doubly Labelled Water ........................................................................................ 69 2.3.1.3. Heart Rate Monitoring .......................................................................................... 71 2.3.1.4. Direct Observation ............................................................................................... 73 2.3.1.5. Pedometers........................................................................................................... 76 2.3.1.6. Accelerometers ..................................................................................................... 78 2.3.1.7. Combination of methods...................................................................................... 92 2.3.2. Objective Measurement of Sedentary Behaviour in Young Children .............. 93 3. Feasibility and acceptability of using three accelerometers with 2-3 year old South Asian and White British children and both parents – an exploratory qualitative study ....................................................................................................100 3.1. Introduction .......................................................................................................101 3.2. Methods .............................................................................................................103 3.3. Results ...............................................................................................................108 3.4. Discussion.........................................................................................................115 ix Table of Contents 4. Calibration of the ActiGraph GT3X+, Actiheart, and activPAL3 accelerometers for the assessment of sedentary behaviour and physical activity of 2 to 3 year old children........................................................................119 4.1. Introduction .......................................................................................................120 4.2. Methods .............................................................................................................122 4.2.1. Sample..............................................................................................................122 4.2.2. Physical Activity and Sedentary Behaviour Measurement ................................122 4.2.3. Statistical Analysis ............................................................................................125 4.3. Results ...............................................................................................................128 4.3.1. Issues regarding the Actiheart and activPAL3 ................................................ 128 4.3.2. Characteristics of the final sample .................................................................... 129 4.3.3. Mixed-effects regression equations for the prediction of CARS scores from Axis1, Axis2 and Axis3 combined ..................................................................... 134 4.3.3.1. Agreement of measurements ............................................................................ 135 4.3.4. Mixed-effects regression equations for the prediction of CARS scores from Axis1 .................................................................................................................... 139 4.3.4.1. Agreement of measurements ............................................................................ 141 4.3.5. Mixed-effects regression equations for the prediction of CARS scores from Vector Magnitude ............................................................................................... 144 4.3.5.1. Agreement of measurements ............................................................................ 145 4.3.6. Axis1 cut-points for the classification of sedentary behaviour, light and moderate-to-vigorous physical activity ............................................................. 149 4.3.6.1. Agreement of measurements ............................................................................ 149 4.3.7. Vector Magnitude cut-points for the classification of sedentary behaviour, light and moderate-to-vigorous physical activity ............................................. 152 4.3.7.1. Agreement of measurements ............................................................................ 153 4.4. Discussion.........................................................................................................155 5. Validation of the ActiGraph GT3X+ cut-points for the definition of sedentary behaviour, light and moderate-to-vigorous physical activity in 2 to 3 year old children ............................................................................................................162 x Table of Contents 5.1. Introduction .......................................................................................................163 5.2. Methods .............................................................................................................163 5.2.1. Sample..............................................................................................................163 5.2.2. Physical Activity and Sedentary Behaviour measurement ................................164 5.2.3. Statistical Analysis ............................................................................................165 5.3. Results ...............................................................................................................166 5.4. Uni-axial cut-points...........................................................................................167 5.5. Vector Magnitude cut-points............................................................................173 5.6. Discussion.........................................................................................................179 6. The effect of different epoch durations on the estimation of time spent in sedentary behaviour, light and moderate-to-vigorous physical activity ..........185 6.1. Introduction .......................................................................................................186 6.2. Methods .............................................................................................................188 6.2.1. Statistical Analysis ............................................................................................188 6.3. Results ...............................................................................................................189 6.4. Discussion.........................................................................................................192 7. Measuring the physical activity and sedentary behaviour of 2 to 3 year old South Asian and White British children and both parents – a pilot study with the ActiGraph GT3X+ ....................................................................................199 7.1. Introduction .......................................................................................................200 7.2. Methods .............................................................................................................202 7.2.1. Sample recruitment...........................................................................................202 7.2.2. Data collection procedures................................................................................203 7.2.3. Physical Activity and Sedentary Behaviour Measurement ................................206 7.2.4. Statistical Analysis .........................................................................................208 7.2.4.1. Definition of how many and which days are needed for a reliable estimate of activity behaviours. ........................................................................................ 208 7.2.4.2. Recruitment intake and compliance analyses ................................................. 209 7.3. Results ...............................................................................................................209 7.3.1. Definition of days needed for a reliable estimate of SB and PA........................209 xi Table of Contents 7.3.2. Recruitment intake ............................................................................................212 7.3.3. Compliance of Children.....................................................................................214 7.3.4. Compliance of Parents......................................................................................215 7.4. Discussion.........................................................................................................217 7.4.1. Issues, reasons for non-wear and suggestions reported by parents.................218 7.4.2. Hardware issues ...............................................................................................220 7.4.3. Other successful strategies...............................................................................221 8. Conclusions ...........................................................................................................223 8.1. Key Findings and Implications ........................................................................224 8.1.1. Chapter Three...................................................................................................224 8.1.2. Chapter Four.....................................................................................................225 8.1.3. Chapter Five .....................................................................................................225 8.1.4. Chapter Six .......................................................................................................226 8.1.5. Chapter Seven ..................................................................................................227 8.2. Future Research................................................................................................229 8.3. Implications .......................................................................................................231 References .................................................................................................................234 Appendices ................................................................................................................271 Appendix 1 – Questioning guide used in the focus groups..........................................272 Appendix 2 – Triaxial equation model build .................................................................276 Appendix 3 – Example of the memory, time-discrepancies and connectivity issues of the activPAL3. ....................................................................................278 Appendix 4 – Scatterplots of 5-second Axis1, 2, and 3 acceleration counts by CARS-scores …………………………………………………………………279 Appendix 5 – Bland-Altman plots for differences in sedentary behaviour time estimates, between 5-, 10-, and 15-second epochs...............................281 xii List of Figures List of Figures Figure 1 - Diagram of the Socio-Ecological model applied to the influences on young children’s physical activity. ............................................................................57 Figure 2 - Schematic representation of two common piezoelectric sensor configurations (from Chen & Bassett, 2005)..................................................81 Figure 3 - The ActiGraph GT3X+ accelerometer worn by a 2-year old girl. .................105 Figure 4 - The Actiheart accelerometer worn by a 2-year old girl ................................106 Figure 5 - The activPAL3 accelerometer worn by a 2-year old girl. .............................107 Figure 6 - Median Axis1, Axis2 and Axis3 counts per 5-second epochs (total and by sex). ............................................................................................................132 Figure 7 - Median Axis1, Axis2 and Axis3 counts per 10-second epochs (total and by sex).........................................................................................................132 Figure 8 – Median Vector Magnitude per 5-second epochs (total and by sex). ...........133 Figure 9 - Median Vector Magnitude per 10-second epochs (total and by sex)...........133 Figure 10 - Bland-Altman plot for triaxial equation (5-second epochs). .......................137 Figure 11 - Bland-Altman plot for triaxial equation (10-second epochs). .....................137 Figure 12 – Axis1 counts by observed CARS score, for 5-secod epochs....................140 Figure 13 - Bland-Altman plot for Axis1 equation (5-second epochs)..........................142 Figure 14 - Bland-Altman plot for Axis1 equation (10-second epochs)........................142 Figure 15 - Bland-Altman plot for Vector Magnitude equation (5-second epochs).......146 Figure 16 - Bland-Altman plot for Vector Magnitude equation (10-second epochs).....147 Figure 17 – Comparisons of kappa values (Y axis) between Costa et al. and Trost et al. Axis1 cut-points...............................................................................156 Figure 18 - Bias in estimates of Sedentary Behaviour for Axis1 cut-points .................168 xiii List of Figures Figure 19 - Bias in estimates of Light Physical Activity for Axis1 cut-points.................170 Figure 20 - Bias in estimates of Moderate-to-Vigorous Physical Activity for Axis1 cut-points...................................................................................................172 Figure 21 - Bias in estimates of Sedentary Behaviour for Vector Magnitude and Trost et al’s cut-points ...............................................................................174 Figure 22 - Bias in estimates of Light Physical Activity for Vector Magnitude and Trost et al’s cut-points ...............................................................................176 Figure 23 - Bias in estimates of Moderate-to-Vigorous Physical Activity for Vector Magnitude and Trost et al’s cut-points.......................................................178 Figure 24 - Bias in estimates of time spent in Sedentary Behaviour and Physical Activity, from 5-second and Trost et al’s cut-points. ..................................180 Figure 25 - Bias in estimates of time spent in Sedentary Behaviour and Physical Activity, from 10-second and Trost et al’s cut-points. ................................181 Figure 26 - Median estimated seconds spent in sedentary behaviour according to the 3 epoch durations. ...............................................................................190 Figure 27 - Median estimated seconds spent in light physical activity according to the 3 epoch durations. ...............................................................................191 Figure 28 - Median estimated time (seconds)in moderate-to-vigorous physical activity according to the 3 epoch durations................................................192 Figure 29 - Sedentary behaviour classification agreement diagnostics from the validation study, by epoch length...............................................................195 Figure 30 - Light physical activity classification agreement diagnostics from the validation study, by epoch length...............................................................195 Figure 31 – Moderate-to-vigorous physical activity classification agreement diagnostics from the validation study, by epoch length..............................196 Figure 35 – Recruitment intake in White British and South Asian families. .................214 xiv List of Tables List of Tables Table 1 - Characterization of the mothers present in the focus groups. ......................109 Table 2 - Issues raised by the mothers regarding the use of each accelerometer with their children, themselves and the fathers. ............................................114 Table 3 - Sample description. ......................................................................................130 Table 4 - Description of 5- and 10-second epochs included in the analysis. ...............130 Table 5 - Median accelerometry counts for Axis1, Axis2 and Axis3, by sex and CARS levels..................................................................................................131 Table 6 - Agreement statistics for prediction of CARS scores from triaxial regression equations, for 5- and 10-second epochs.......................................................136 Table 7 - Agreement statistics for the classification of sedentary behaviour from the triaxial regression equations, for 5- and 10-second epochs..........................138 Table 8 - Agreement statistics for the classification of moderate-to-vigorous Physical Activity from the triaxial regression equations, for 5- and 10-second epochs. .........................................................................................................139 Table 9 - Agreement statistics for prediction of CARS scores from Axis1 regression equation, for 5- and 10-second epochs. .......................................................141 Table 10 - Agreement statistics for sedentary behaviour classification from Axis1 regression equation, for 5- and 10-second epochs.......................................143 Table 11 - Agreement statistics for moderate-to-vigorous physical activity classification from Axis1 regression equation, for 5- and 10-second epochs. .........................................................................................................144 Table 12 - Agreement statistics for prediction of CARS scores from Vector Magnitude regression equation, for 5- and 10-second epochs. ....................145 Table 13 - Agreement statistics for sedentary behaviour classification from Vector Magnitude regression equation, for 5- and 10-second epochs. ....................148 xv List of Tables Table 14 - Agreement statistics for moderate-to-vigorous physical activity classification from Vector Magnitude regression equation, for 5- and 10second epochs..............................................................................................148 Table 15 - Agreement statistics for sedentary behaviour classification from Axis1 cut-points, for 5- and 10- second epochs......................................................150 Table 16 - Agreement statistics for moderate-to-vigorous physical activity classification from Axis1 cut-points, for 5- and 10-second epochs................151 Table 17 - Comparison of agreement statistics for Axis1 overall and sex-specific sedentary behaviour cut-points, for 5- and 10-second epochs .....................151 Table 18 - Comparison of agreement statistics for Axis1 overall and sex-specific Moderate-to-Vigorous cut-points, for 5- and 10-second epochs ...................152 Table 19 - Agreement statistics for sedentary behaviour classification from Vector Magnitude cut-points, for 5- and 10-second epochs. ....................................153 Table 20 - Agreement statistics for moderate-to-vigorous physical activity classification from Vector Magnitude cut-points, for 5- and 10-second epochs. .........................................................................................................154 Table 21 - Comparison of agreement statistics for Vector Magnitude overall and sexspecific Sedentary Behaviour cut-points, for 5- and 10-second epochs .......154 Table 22 - Comparison of agreement statistics for Vector Magnitude overall and sex-specific Moderate-to-Vigorous cut-points, for 5- and 10-second epochs ..........................................................................................................155 Table 23 - Sample characteristics. ..............................................................................166 Table 24 - Agreement measures for newly derived Axis1 and Trost et al’s cut-points – Sedentary Behaviour cut-points.................................................................168 Table 25 - Agreement measures for newly derived Axis1 and Trost et al’s cut-points – Light Physical Activity. ...............................................................................170 xvi List of Tables Table 26 - Agreement measures of newly derived Axis1 and Trost et al’s cut-points – Moderate-to-Vigorous Physical Activity......................................................172 Table 27 - Agreement measures for newly derived Vector Magnitude and Trost et al’s cut-points – Sedentary Behaviour cut-points. .........................................174 Table 28 - Agreement measures for newly derived Vector Magnitude and Trost et al’s cut-points – Light Physical Activity cut-points.........................................176 Table 29 - Agreement measures for derived Vector Magnitude and Trost et al’s cutpoints – Moderate-to-Vigorous Physical Activity cut-points. .........................178 Table 30 - Description of the sample of epochs available for analysis. .......................189 Table 31 – Mean (SD) time spent in sedentary behaviour, light and moderate-tovigorous physical activity according to the different epoch durations............190 Table 32 - Reliability of 7-day sedentary behaviour and physical activity estimates, and days needed for a 0.8 reliability. ............................................................212 Table 33 - Recruitment intake (in total and by ethnicity). .............................................213 Table 34 – Compliance of children with data collection protocol (by sex and ethnicity). ......................................................................................................215 Table 35 – Compliance of parents with data collection protocol (by parental figure and ethnicity). ...............................................................................................216 xvii Abbreviations Abbreviations AUC – Area under the Receiver-Operating Characteristics curve BIB – Born in Bradford BMI – Body Mass Index BP – Blood pressure CAD – Coronary artery disease CARS – Children’s Activity Rating Scale CHD – Coronary heart disease CI – Confidence interval CPAF - Children’s Physical Activity Form cpm – Counts per minute CVD – Cardiovascular disease EE – Energy expenditure EF – Effect size HDL – High density lipoprotein HR – Heart rate IQ – Intelligence quotient LDL – Low density lipoprotein LSI – Large-scale Integrated Motor Activity Monitor MARM – Movement Activated Recording Monitor xviii Abbreviations MET - Metabolic Equivalent Units MVPA – Moderate-to-vigorous physical activity NASPE – National Association for Sport and Physical Education NCDs – Non-communicable diseases NHANES – National Health and Nutrition Examination Survey NICE – National Institute for Health and Care Excellence NPV – Negative predictive value OR – Odds ratio OSRAC-P – Observational System for Recording Physical Activity in Children– Preschool PA – Physical activity PPV – Positive predictive value RCT – Randomised clinical trial ROC – Receiver-Operating Characteristics RR – Relative risk SB – Sedentary behaviour SD – Standard deviation SEE – Standard error of estimates SES – Socioeconomic status T2DM – Type two diabetes mellitus TV – Television xix Abbreviations UK – United Kingdom US – United States WHO – World Health Organization xx Chapter One – Introduction CHAPTER ONE Introduction 1 Chapter One – Introduction The 20th century has seen impressive and unrivalled improvements in health status worldwide (World Health Organisation [WHO], 1999; Sen & Bonita, 2000). These improvements in health appear to be related to technology advancements and the economic changes seen as a result from the agricultural and industrial revolutions (WHO, 1999). Along with the global industrialization and improvements in technology, the world has witnessed an epidemiological transition (Yusuf et al, 2001a), whereby the major causes of death shift from nutritional deficiencies and infectious diseases, to noncommunicable diseases (NCDs) such as coronary heart disease (CHD), cancer, and type two diabetes mellitus (T2DM) (Omran, 1971;Yusuf et al, 2001a; WHO, 2011). This is mainly due to two factors: 1) the demographic transition that occurs alongside this shift in the main causes of death, whereby previously high mortality and fertility rates decrease and life expectancy at birth increases (Omran, 1971); and 2) the lifestyle changes driven by the global industrialization and urbanisation phenomena (Yusuf et al, 2001a; Popkin, 2006). The improvements in technology lead to an ever increasing efficiency of machines, which resulted in a decrease of the physical effort needed for work and house-related chores, and an increase the availability and affordability of sedentary activities such as watching television (TV) and using computers or other such media (Yusuf et al, 2001a). The urbanisation process resulted in a decrease in the opportunities for people to be active in work, leisure and transport related pursuits (Yusuf et al, 2001a). Altogether, these events have led to the adoption of unhealthy habits and increasingly sedentary lifestyles across all ages (Popkin, 2006), including children as young as two years of age (Gubbels et al, 2009). Due to the increasing evidence of the detrimental effects of SB (Healy et al, 2008b; Owen et al, 2010a; Tremblay et al, 2010; Carson & Janssen, 2011; Ford & Caspersen, 2012; LeBlanc et al, 2012), the widely acknowledged health benefits of a physically active lifestyle (Pate et al, 1995; WHO, 2004; Nocon et al, 2008; Andersen et al, 2011; Janssen & LeBlanc, 2010; WHO, 2011; Timmons et al, 2012), and the modifiable nature of both behaviours across the life course, SB and PA have become a major focus of research and action aimed at promoting health and tackling the increasing epidemic of NCDs (Thompson et al, 2003; WHO 2004; Froberg & Andersen, 2005; Pérez et al, 1 Chapter One – Introduction 2010; Zhang & Hu, 2012). PA is generally defined as “any bodily movement produced by skeletal muscles that results in energy expenditure” (Caspersen, Powell & Christenson, 1985). Sedentary behaviour (SB) is the group of activities that do not substantially increase the energy expenditure (EE) above resting levels (e.g.lying, standing, or watching television), although it has been sometimes confused in the literature with low amounts of PA or “inactivity”, which is generally when individuals do not meet a certain level of PA (e.g. PA guidelines) (Pate, O’Neill & Lobelo, 2008; WHO, 2011). There is evidence that these behaviours may be established during the early years (Reilly et al, 2004; Janz, Burns & Levy, 2005; Reilly et al, 2008) and track throughout childhood (Janz, Burns & Levy, 2005; Kelly et al, 2007; Biddle et al, 2010; Pearson et al, 2011; Kwon & Janz, 2012) and into adulthood (Malina, 2001; Telama et al, 2005), and the need for surveillance and intervention studies during early childhood has been highlighted in the literature (Reilly et al, 2004; Pratt et al, 2008). This is particularly important in sub-groups of the population with higher risk for NCDs, such as South Asian migrants (Bhopal, 2002; Misra et al, 2007) who represent one of the largest ethnic minorities in the UK - roughly 5% of the population of England and Wales in the 2011 Census (Office for National Statistics, 2012). The choice of the PA and SB measurement tool should be primarily based on the aims of the study, which PA and SB dimensions are of interest to fulfil the aims, the resources available (e.g. budget and skilled staff), the feasibility of use and willingness of the participants to wear the monitor (Trost, McIver & Pate, 2005; McClain & TudorLocke, 2008; Cliff, Reilly & Okely, 2009; Hardy et al, 2013). Instrument selection for use with young children is even more complicated, due to challenges associated with detecting the typically short and sporadic pattern of children’s activity behaviours, the diversity of developmental maturity among children (e.g., from toddlers to primary school aged children), as well as children’s inherent curiosity and the associated potential for reactivity to activity monitors (McClain & Tudor-Locke, 2008; Cliff, Reilly & Okely, 2009). Until recently, children’s PA and SB have been traditionally assessed by subjective self- or proxy-report measures, such as questionnaires and recalls (Kohl, Fulton & Caspersen, 2000; Reilly et al, 2008; Loprinzi & Cardinal, 2011). However, 2 Chapter One – Introduction these subjective measures suffer from several limitations, including difficulty in accurately recalling the duration and frequency of PA/SB, cultural dependence, the risk of social-desirability bias (Fulton et al, 2001; Sirard & Pate, 2001; Warren et al, 2010; Atkin et al, 2013). Because of this and the critical need for accurate measures of PA and SB to assess prevalence and trends in PA/SB time, and understand the doseresponse relationship between PA/SB and NCDs (LaPorte, Montoye & Caspersen, 1985; Dollman et al, 2009; Loprinzi & Cardinal, 2011), the development of methods to objectively assess SB and PA has seen a recent exponential increase (Kohl, Fulton & Caspersen, 2000; Fulton et al, 2001; Sirard & Pate, 2001; Ward et al, 2005, McClain & Tudor-Locke, 2008). From Laplace’s and Lavoisiers’ 1780-90’s work applied to heat conduction which lead to the building of the first respiration calorimeter ever used on mankind (Henry, 2005; Frankenfield, 2010), through the Holter-monitor (Holter, 1961) which made it possible to record a free-living individual’s heart activity for prolonged periods of time (Achten & Jeukendrup, 2003), objective PA/SB measurement methods have rapidly evolved into smaller, more practical, efficient and feasible tools to use in young children, such as pedometers (measuring steps taken) and accelerometers (measuring the acceleration of the body) (Kohl, Fulton & Caspersen, 2000; Trost, 2007; McClain & Tudor-Locke, 2008). Of these, accelerometers have become the preferred method for the assessment of PA in young children (Pate, O’Neill & Mitchell, 2010; Loprinzi & Cardinal, 2011), as shown by the dramatic increase in the number of published studies using this method since 2001 (Rowlands, 2007; Cain et al, 2013), although their use and interpretation of collected data is far from standardised, and many issues still need clarification (Trost, McIver & Pate, 2005; Cliff, Reilly & Okely, 2009; Warren et al, 2010; Cardon, Van Cauwenberghe & De Bourdeaudhuij, 2011; Bassett, Rowlands & Trost, 2012). A relatively large body of research has investigated the PA and SB of preschoolers between three and six years of age, but very limited information exist on the PA and SB of children younger than three years, and on those of different ethnic backgrounds (Cliff, Reilly & Okely, 2009; Cardon, Cauwenberghe & De Bourdeaudhuij, 2011). 3 Chapter One – Introduction 1.1. Aims The aims of this PhD research were: I. To assess the qualitative and practical feasibility and acceptability of using the Actigraph GT3X+, the Actiheart and the activPAL3 accelerometers with 2-3 year old children, mothers and fathers of South Asian and White British ethnicities. II. To calibrate and validate the Actigraph GT3X+, the Actiheart and the activPAL3 accelerometers against direct observation (criterion measure), to measure PA and SB in 2-3 year old children of different ethnicities; III. To investigate the influence of using 5-, 10-, and 15-second epochs on the estimates of time spent in SB, light PA, and moderate-to-vigorous PA (MVPA) in 2-3 year olds IV. To test the feasibility of measuring the habitual PA and SB of 2-3 year old South Asian and White British children and both parents, with the accelerometer that shows the best trade-off between accuracy and acceptability (from addressing aims I and II). 1.2. Constitution of the thesis This thesis will start by critically reviewing the literature regarding NCDs and corresponding risk factors, of which PA and SB assume a particular importance. Because the results chapters represent very individual studies with distinct methodologies, this thesis will be organised in the following self-contained chapters: Chapter Three – This chapter starts with a more focused background on the feasibility of using monitors with young children and both parents, and the lack of information about ethnic minorities, followed by a detailed description of the qualitative methodology used. The aim of this study was to explore the practical feasibility and acceptability of using the ActiGraph GT3X+, the Actiheart and the 4 Chapter One – Introduction activPAL3 to measure the PA and SB of 2-3 year old South Asian and White British children and their parents, using focus groups with mothers. Results from the focus groups conducted with South Asian and White British mothers are presented, focusing on feasibility and acceptability of using the ActiGraph GT3X+, the Actiheart and the activPAL3 accelerometers with their 2-3 year old children, themselves and their husbands, and potential issues brought up by the mothers. In light of the results, the discussion section presents a reflection of the implications of the choice of a monitor for epidemiological and clinical studies, and provides strategies to enhance recruitment, retention and compliance with study protocols; Chapter Four – This chapter will start by providing a brief description of the importance and methodological issues of using accelerometry with 2-3 year old children, followed by the need for new SB and PA cut-points for children younger than three years. The aim of this study was to derive equations and cut-points for the triaxial ActiGraph GT3X+ accelerometer, to assess SB and PA intensity in 2-3 year old children. The methods section has a detailed description of the procedures and methodology used to assess children’s PA/SB and derive equations and cut-points for the prediction of SB and MVPA (from direct observation). The results provide a detailed description of the mixed-effects regression equations that provided the best fit for mean Children’s Activity Rating Scale (CARS) intensity score from triaxial and uniaxial acceleration, and derived Axis1 (vertical axis) and Vector Magnitude (triaxial) cut-points for the ActiGraph GT3X+ (at 5- and 10-second epochs). A thorough evaluation of the agreement between observed and predicted SB and MVPA is presented for the derived equations and cut-points; Chapter Five – This chapter will include a short background on the importance of validating cut-points in independent free-living samples, followed by a brief description of the procedures and statistical tests performed. The aims of this study were to validate the new ActiGraph GT3X+ cut-points derived in chapter four in an independent sample of 2-3 year olds, and compare their validity to 5 Chapter One – Introduction that of Trost et al’s (2012) toddler cut-points. The results section provides detailed information about the agreement between observed and predicted SB, light PA and MVPA from the cut-points derived in the previous chapter, for both 5- and 10-second epochs, and comparing agreement diagnostics of these with Trost et al’s (2012) cut-points. The chapter finishes with a discussion of which newly derived cut-points show the best agreement with the observed activity behaviours of the free-living sample, and the possible reasons for the improvement of these cut-points in relation to those by Trost et al (2012); Chapter Six – This chapter includes a short background on the issues and potential effects of using long epoch durations in assessing time spent in SB, light PA and MVPA in 2-3 year olds. The aim of this study was to investigate the effect of using 5-, 10- and 15-second time sampling periods (epochs) on the estimated time spent in SB, light PA and MVPA, according to direct observation. A short description of the methodology used and results found is provided after. The last section includes a detailed discussion of the results regarding the effects of epoch durations and biases found chapter five. Further, it also presents a discussion of the consequences of the latter effects for the calibration of accelerometers using ROC-curve analysis, which is supported by the results of chapters four and five. Chapter Seven – This chapter shows the results of the final study undertaken for this PhD research, where the aim was to test the practical feasibility of using the ActiGraph GT3X+ in the Born in Bradford birth cohort study, focusing on potential differences between South Asian and White British ethnicities. The procedures for data collection and cleaning are described in detail, together with the methodology used to analyse the accelerometry data and recruitment and compliance rates. The results section provides descriptive statistics about recruitment and compliance (overall and by ethnicity), together with issues that arose during data collection and strategies used to deal with them. 6 Chapter One – Introduction Chapter Eight – This chapter discusses the findings from the previous five results chapters, the implications of the results, and directions for future research. 7 Chapter Two – Literature Review CHAPTER TWO Literature Review 8 Chapter Two – Literature Review 2.1. Non-Communicable Diseases Non-communicable diseases (NCDs) are chronic non-infectious diseases, such as cardiovascular disease (CVD) (this includes coronary heart disease (CHD), cerebrovascular disease, peripheral arterial disease, among others), type two diabetes mellitus (T2DM), obesity and chronic obstructive pulmonary disease (WHO, 2011). Currently the leading cause of death worldwide, NCDs were responsible for 63% of the 57 million global deaths in 2008, with CVD (48%), cancer (21%) and respiratory diseases (12%) as the main contributors (WHO, 2011). NCDs are the most frequent cause of death in most countries (except in the African region), affecting high-, middleand low-income countries alike (Yusuf et al, 2001a; WHO, 2011). Non-communicable diseases not only pose one of the biggest threats to population health, but they are also considered by some as the greatest sustained threat to the stability of health systems worldwide (Theodore, 2011). Heart disease, stroke and T2DM cause billions of dollars in yearly losses of national income in the world’s most populous nations, with a calculated 0.5% lower rate of annual economic growth for each 10% rise in NCDs (WHO, 2011). In the UK, the Government Office for Science (Foresight, 2007) has estimated that, on current trends and holding everything apart from BMI constant, the annual NHS costs of diabetes and CHD related to increased body mass index (BMI) would increase from £2.0 and £3.9 billion in 2007 respectively, to £2.6 and £5.5 billion in 2025. The estimated annual costs for the NHS of elevated BMI alone are predicted to nearly double from £4.2 billion in 2007, to £8.3 billion in 2025 (Foresight, 2007). In addition to the costs for national health services, the costs related to the treatment of NCDs are leading to the impoverishment of individuals, and a widening of the socioeconomic and health inequalities within and between populations (WHO, 2008; WHO, 2011; Beaglehole et al, 2011). Non-communicable diseases are rapidly increasing among low-income countries that are already heavily burdened with high prevalences of infectious diseases and undernutrition, imposing a severe barrier for their socioeconomic development (WHO, 2008; Probst-Henscha et al, 2011). Within 9 Chapter Two – Literature Review countries, the poorer sections of the population tend to live in settings where policies, legislation, and regulations to tackle NCDs do not exist or are inadequate (Beaglehole et al, 2011), and have a disproportional exposure to NCD risk factors. Because most NCDs are of a chronic nature, they can lead to continued treatment expenses that result in a tremendous burden on the budget of individuals, driving poor households into cycles of debt and illness and perpetuating health and economic inequalities (WHO, 2011; Beaglehole et al, 2011; Probst-Henscha et al, 2011). NCDs and poverty create a vicious cycle, whereby poverty disproportionately exposes people to behavioural risk factors for NCDs, and the resulting NCDs can lead individuals to an even worse economical situation (WHO, 2011). In addition to the expenses with treatment, NCDs also cause loss of productivity resulting from the incapacity to work due to illness. This diminishes household earnings and a family’s ability to provide for and educate children, and also has a substantial macroeconomic effect – the summed individual losses of productivity reduce a country’s effective labour force, resulting in reductions in the overall economic output (WHO, 2011; Beaglehole et al, 2011). As populations age and the impact of NCDs increases, the global annual number of deaths attributable to NCDs is projected to rise (15% between 2010 and 2020), and the significant costs to individuals, families, businesses, governments and health systems add up to major macroeconomic impacts, affecting both the economic growth of developing countries and progress towards the United Nations’ Millennium Development Goals (WHO, 2011; Beaglehole et al, 2011). A key objective to counteract the current NCD epidemic is to ensure the early detection and treatment of the condition, using cost-effective and sustainable health-care interventions (WHO, 2011). The primary prevention of NCDs and their risk factors from early in life are considered by many as the most affordable, sustainable and cost-effective control of the epidemic and its adverse socio-economic effects (WHO, 2003; Bhatia, 2004; Lobstein, Baur & Uauy, 2004; WHO, 2005; Probst-Henscha et al, 2011). To achieve both successful prevention strategies and interventions, a comprehensive knowledge of the risk factors for NCDs across the life course must exist. 10 Chapter Two – Literature Review 2.1.1. Risk Factors for Non-Communicable Diseases Risk factors for NCDs are spread throughout the world (albeit showing different rates across socioeconomic levels and world regions), often beginning early in life and continuing throughout adulthood, and into old age (WHO, 2011). Risk factors can lead to disease by direct (e.g. hypertension or cholesterol) or indirect influence (e.g. physical inactivity, which leads to an increase in body fat, impaired glucose metabolism and raised blood pressure) (WHO, 2009). They can have individual effects on disease, or a cumulative effect, which may be bigger than the sum of the individual effects (WHO, 2003). Non-communicable disease risk factors can generally be divided into three categories: biological, environmental and behavioural factors. A description of the main risk factors for all three categories is presented below, including prevalence estimates and examples of associations with NCDs. Although the latter will try to concentrate on young children (the focus of this thesis), research in the early years is scarce. Therefore, whenever information from children aged five years or younger is not available or conclusive, data relative to older children and adults will also be presented. 2.1.1.1. Biological Risk Factors Biological risk factors include overweight and obesity, hypertension, raised blood glucose and cholesterol levels, which are consistently ranked in the top 10 global risk factors for NCDs by the WHO (WHO, 1999, 2009 and 2011). Because of its direct and unchangeable influence on disease and ability to modify an individual’s susceptibility to several diseases and risk factors, the genetic composition (i.e. genotype) and expression (i.e. phenotype) will also be considered and described in this section. 2.1.1.1.1. Overweight and obesity At least 2.8 million people die each year as a result of being overweight or obese (WHO, 2011), placing it as the 5th leading risk factor for global mortality (WHO, 2009). The worldwide prevalence of obesity (as defined by BMI ≥30 kg/m2) has nearly doubled 11 Chapter Two – Literature Review between 1980 (5% of men; 8% of women) and 2008 (10% of men; 14% of women) (WHO, 2011). It is estimated that 40 million infants and young children (6% of total) worldwide are already overweight, as defined by a weight-for-height ratio >2 standard deviations of the WHO child growth standards median (WHO, 2011). High- and uppermiddle-income countries show more than double the prevalence of overweight seen in low- and lower-middle-income countries (WHO, 2011). For obesity, the prevalence rates in upper-middle-income countries are more than triple of the rates seen lower- and middle-income countries (24% versus 7%) (WHO, 2011). Although not a direct measure of body fat, because it is associated with body composition and risk factors and based on widely available measurements, the BMI is widely used as a valid (indirect) tool to assess excessive adiposity in both adults and children (Cole et al, 2000; Rolland-Cachera, 2011; WHO, 2011). However, using BMI to define overweight/obesity in children is not as straightforward as in adults (Cole et al, 2000).Because children are growing in size (and at different rates/timings between sexes), and BMI changes substantially throughout childhood and adolescence in a normal/healthy development trajectory, BMI cut-offs to define overweight/obesity need to be adjusted for age and sex (Cole et al, 2000; Rolland-Cachera, 2011). Independently of the definition used, overweight and obesity are widely associated with an increased risk of numerous NCDs, including CHD, ischemic stroke, T2DM and certain cancers (e.g. breast and colon) (WHO, 2009; Strazzullo et al, 2010; Morrisson et al, 2012), and also an increased risk for several other risk factors such as hypertension, insulin resistance, low high-density lipoprotein (HDL) cholesterol, and high LDLcholesterol and triglyceride serum levels (Lobstein, Baur & Uauy, 2004; Guh et al, 2009; WHO, 2011; Department of Health, 2011). This is true both during childhood and throughout adulthood. It is because these same adverse health consequences of overweight and obesity are also seen for children both in the short- and long-term (Reilly, 2005; Freedman et al, 2008; Zapalla, 2010; Datillo et al, 2012; Morrison et al, 2012), that the increasing childhood obesity epidemic has become one of the biggest public health concerns worldwide (Lobstein, Baur & Uauy, 2004; Raghuveer, 2010; Zapalla, 2010; Datillo et al, 12 Chapter Two – Literature Review 2012). A systematic review by Reilly and colleagues (2003) reported a large number of high quality studies consistently showing associations between obesity and most of the main CVD risk factors (e.g. high blood pressure (BP), dyslipidemia and insulin resistance) in childhood, as well as a tendency for tracking of obesity from childhood into adulthood. Morrison et al (2012) reported a significant inverse association between CVD and normal BMI retained from childhood to adulthood (OR=0.25, 95%CI: 0.077– 0.79; p=0.019). Freedman et al (2008) have reported a significant positive association between increased childhood BMI with adult carotid artery intima-media thickness (a marker of atherosclerosis) which was independent of adult levels of triglycerides, lowdensity lipoprotein (LDL) cholesterol, BP and BMI. Worryingly, these alterations in the vasculature are already seen in children. Obese children (7-14 years) have shown nearly double the carotid artery intima-media thickness than their normal weight counterparts (0.69 mm versus 0.38 mm; p<0.01) (Fang et al, 2010). In children aged 215 years from the Bogalusa Heart Study, Berenson et al (1998) observed that fatty streaks in the coronary arteries were already present in nearly half of the children, and fibrous-plaque lesions in the aorta were present in roughly 20% of the children. Furthermore, the extent of atherosclerotic lesions was positively and significantly correlated with increased BMI, among other variables (Berenson et al, 1998). The high prevalence of obesity in infants and toddlers, and its long-term consequences, highlights the necessity for early identification and potential for interventions focusing on this age group (Zapalla, 2010; Datillo et al, 2012). 2.1.1.1.2. High blood pressure Raised BP (or hypertension) is a major risk factor for CVD and the leading risk factor for mortality worldwide, causing an estimated 7.5 million deaths, which represents about 12.8% of all deaths (WHO, 2009). The global overall prevalence of high BP in adults aged ≥25 years was around 40% in 2008, with the lowest rates observed in the Americas (35%) and the highest in the African Region (46%) (WHO, 2011). The prevalence of hypertension is similar across all income groups, though it is generally lowest in high-income populations (WHO 2011). 13 Chapter Two – Literature Review In adults, raised BP has long been associated with an increasing risk for CHD, stroke, atherosclerotic CVD, T2DM and chronic kidney disease (He & Whelton, 1999; Gu et al, 2008; WHO, 2011; Assadi, 2012; Morrison et al, 2012). After reviewing evidence from several prospective studies from 1967-1997, He and Whelton (1999) concluded that the association between adulthood systolic BP and CHD, stroke and end-stage renal disease is continuous, graded and independent from several other risk factors such as age, race, diabetes and smoking. High BP is not confined to adults, and paediatric hypertension is a growing concern (Chaudhuri et al, 2013). In fact, recent research has reported an increase in the rates of childhood hypertension, largely attributable to the childhood obesity epidemic (Falkner & DeLoach, 2009; Xi, Liang & Mi, 2013), which can increase the risk of other diseases if carried into adulthood (Assadi 2012; Morrison et al, 2012). For example, a recently published 26-year follow-up study of 909 individuals (mean starting age = 12 years) showed not only a higher risk of impaired fasting glucose for adults with hypertension, but also that children who had high BP and retained it through adulthood had higher odds of suffering from T2DM as adults than all other individuals (Morrison et al, 2012). Systolic BP has been shown to be significantly and positively correlated with the extent of fatty-streak and fibrous plaque lesions in the aorta and coronary vessels in 2-15 year old children from the Bogalusa Heart Study (Berenson et al, 1998). 2.1.1.1.3. Elevated blood glucose Elevated blood glucose (associated with T2DM) is the third leading risk factor for mortality worldwide, causing an estimated 3.4 million deaths per year (5.8% of all deaths), more than 50% of which occur in high-income countries (WHO, 2009a). Individuals with diabetes (i.e. fasting blood glucose ≥126 mg.dL, or 2-hour post glucose test blood levels ≥200 mg/dL) are at increased risk for other NCDs such as CVD (Gerstein, 1997; Ford, Zhao & Li, 2010). In a meta-analysis including 38 prospective studies, Levitan et al. (2004) found that subjects in the highest category of blood glucose level had a 1.36 (95% CI: 1.23 – 1.52) higher relative risk (RR) of CVD in 14 Chapter Two – Literature Review comparison with the lowest category, independently of assessment method. This relationship was attenuated but not eliminated with the adjustment for other CVD risk factors – RR 1.19 (95%CI: 1.07 – 1.32) (Levitan et al, 2004). Even among apparently healthy individuals without diabetes, elevated blood glucose levels have been associated with higher risk for CVD (Gerstein, 1997; Levitan et al, 2004; Ford, Zhao & Li, 2010; Sui et al 2011). Type two diabetes mellitus is increasingly being reported in children as young early as 4 years of age in Pima Indians (Bhatia, 2004; Hale, 2004). This rise is widely linked to the growing childhood obesity epidemic (Hale, 2004), since obesity is considered the strongest determinant of diabetes risk alongside heredity (Bhatia, 2004). Elevated blood glucose is not only harmful for children’s current health, but it also represents an added risk for future NCDs (Bhatia, 2004; Hale, 2004; Morrison et al, 2012). Morrison et al. (2012) report a significantly higher risk of T2DM in adulthood (mean age 38.5 years) for individuals who had high blood glucose (≥100 mg/dL) as a child (mean age=12.4 years). Studies assessing such relationships from younger ages are lacking. 2.1.1.1.4. Elevated cholesterol Ranked as the sixth leading risk factor for mortality worldwide, raised cholesterol is estimated to cause 2.6 million deaths annually, with higher prevalence rates among high-income countries (WHO, 2009). In 2008, the global prevalence of raised total cholesterol among adults was 39%, a rate that has seen little change between 1980 and 2008 (WHO, 2011). Raised cholesterol increases the risks of several CVD, such as CHD and stroke (Stary et al, 1994; Stamler et al, 2000; Chow et al, 2008; WHO, 2011). A review of 62 clinical trials to reduce LDL cholesterol (Gould et al, 2007) has reported 24.5% and 29.5% reduced risk of CHD mortality and CHD events, respectively, for every 1 mmol/L decrease in total cholesterol among patients with and without previous CHD events. Among other factors, LDL cholesterol concentrations have been shown to be positively and significantly associated with the extent of fatty-streak and fibrous plaque lesions in 15 Chapter Two – Literature Review the aorta and coronary vessels in 2-15 year olds (Berenson et al, 1998). Cholesterol levels seem to track through childhood and adolescence into adulthood, and may remain at elevated risk for the metabolic syndrome in adulthood (Katzmarzyk et al, 2001). Importantly, research suggests that even maternal hypercholesterolaemia during pregnancy may induce changes in the foetal aorta that determine the long-term susceptibility of children to fatty-streak formation and subsequent atherosclerosis (Napoli et al, 1999). It is important to note that not all types of blood cholesterol are detrimental to health. Total cholesterol is composed by LDL and HDL. Whereas high levels of LDL cholesterol play a major role in the initiation and development of the atherosclerotic process (i.e. lesion of the arterial intima layer, with accumulation of fat deposits and muscle cells leading to the deformation and/or blockage of the artery) (Stary et al, 1994), a high level of HDL cholesterol is reported as protective against atherosclerosis (Badimon & Vilahur, 2012). This protective effect of HDL cholesterol has been seen in both adults and children. For example, Le and colleagues (2010) performed carotid artery ultrasound in 70 children, (6-19 years) with obesity- and atherosclerosis-promoting risk factors, and found that HDL cholesterol had a negative correlation with maximum carotid artery intima-media thickness. HDL cholesterol remained a significant predictor of maximum carotid artery intima-media thickness when controlling for age and BMI, in a model that accounted for 67% of the variation in the outcome (Le et al, 2010). 2.1.1.1.5. Genotype and phenotype One’s genotype (Yusuf et al, 2001; Bullen, 2008) and/or phenotype (Gluckman & Hanson, 2004; Hanson et al, 2011) may also represent a risk factor for several NCDs. Genetic factors can explain variance in the risk of CVD incidence within populations, by providing the basis for differences in individual susceptibility for disease in a shared and relatively homogenous environment (Yusuf et al, 2001), or by magnifying the effect of other risk factors for CVD (e.g. certain polymorphisms are suspected to increase susceptibility to CHD in smokers) (Bullen, 2008). Differences in genotype can also contribute to inter-population differences, due to variable frequencies of one or more 16 Chapter Two – Literature Review genetic determinants of risk in various ethnic groups (e.g. polymorphisms) (Yusuf et al, 2001). Evidence suggests that elements of the heritability component of susceptibility to NCDs can be transmitted across generations by non-genomic means (Hanson et al, 2011). Suboptimal maternal diet during pregnancy, for example, can induce changes in the foetus’ phenotype which may confer immediate or future survival advantage to the offspring (i.e. predictive adaptive response), provided the nutritional environment during post-natal life remained similar to that experienced during gestation (Gluckman & Hanson, 2004; Hanson et al, 2011). When there is a mismatch between the offspring’s phenotype and the later environment, from rapid environmental changes resulting from the improvement of SES for example, the altered phenotype becomes disadvantageous and predisposes the individual to the development of NCDs, such as the metabolic syndrome (MetS) (Gluckman & Hanson, 2004; Hanson et al, 2011). It has been reported, for example, that the higher levels of risk factors for CVD in South Asians (SA) are predominantly due to their unique phenotype of having higher quantity of visceral adipose tissue than Europeans, even at the same BMI (Lear et al, 2012). It is important, however, to realise that the plastic phase of human development does not stop at birth. Environmental influences in infancy and early childhood can have longterm health implications (Hanson & Gluckman, 2008), and growing evidence suggests it is possible to reverse pre-natal epigenetic and phenotypic changes through endocrine or nutritional interventions during early postnatal life (Hanson et al, 2011). 2.1.1.2. Environmental Risk Factors Aspects of an individual’s surrounding environment also influence the risk for NCDs. Environmental risk factors may have direct effects on the development and/or worsening of NCDs (e.g. pollutants), or indirect effects through their influence on several other NCD risk factors (e.g. built environment, which influences diet, PA habits, passive smoking, among others). Contrary to what happens with biological and behavioural risk factors, where the latter act at the individual level, environmental risk 17 Chapter Two – Literature Review factors affect large numbers of individuals, therefore representing important (and considered by many as some of the most cost-effective) targets for the prevention of NCDs (Leal & Chaix, 2010; Global Advocacy for Physical Activity, 2011). 2.1.1.2.1. Pollution Indoor and outdoor air pollution, asbestos and benzene are some identified causes of cancer (WHO, 2011). Although they might be more widely linked with cancer, the effect of environmental pollutants extends to other chronic diseases. For example, a growing body of research supports a positive association between some pollutant agents and the development and severity of diabetes and its consequences (e.g. renal dysfunction) (Navas-Acien et al, 2008; Edwards & Prozialeck, 2009). A review of epidemiological and laboratory studies has reported that Cadmium reduces insulin levels and has direct cyto-toxic effects on the pancreas, and elevates fasting blood glucose levels in an animal model of sub-chronic Cadmium exposure before overt signs of renal dysfunction are evident (Edwards & Prozialeck, 2009). Arsenic exposure has also been associated with increased risk of T2DM occurrence. Investigating cross-sectional data from the 2003-2004 NHANES survey, individuals at the ≥80th percentile of total arsenic exposure showed significantly higher odds for T2DM than individuals at the ≤20th percentile, even after adjustment for other diabetes risk factors (Navas-Acien et al, 2008). 2.1.1.2.2. Built environment The built environment also poses as a risk factor for NCDs, such as T2DM and obesity (Feng et al, 2010; Beaglehole et al, 2011), mainly due to constraints for the practice of PA (e.g. lack of destinations within safe walking distance) and the increased availability of energy-dense food retailers (e.g. fast food) (Rahman, Cushing & Jackson, 2011; Salois et al, 2012). Salois et al (2012) have recently reported that objectively measured criminal activity of the area is significantly and positively related to obesity in low-income preschool children, with a 10% increase in criminal activity resulting in 1.5% and 1.1% higher rates of childhood obesity in metropolitan and non-metropolitan counties, respectively. Additionally, the density of full-service restaurants (i.e. establishments 18 Chapter Two – Literature Review where customers are seated while ordering and being served food, and then pay after eating) was negatively associated with the prevalence of obesity, suggesting that a greater relative availability of full-service restaurants over fast-food retailers may be indicative of a healthier food environment (Salois et al, 2012). In a multidisciplinary review investigating the relationship between built environment attributes and childhood obesity, Rahman, Cushing and Jackson (2011) reported that the availability of sidewalks, safe intersections, walkable communities (with mixed land use for residential and commercial purposes, well connected streets, high residential density) (Saelens et al, 2003), accessible destinations, appealing green spaces, and public transit can improve population PA levels and related health outcomes. In order for individuals to be more active and sustain healthier diets, they need access to safe places for recreation, walkable neighbourhoods, and local markets that offer healthy and affordable food (Rahman, Cushing and Jackson, 2011). This is true for both the objectively measured and the individuals’ perceptions of built environment characteristics. The latter deserves careful consideration, since the perceived built environment may not match the objectively measured attributes, and even have greater influence on an individual’s behaviours (Ding & Gebel, 2012), such as PA (Gebel et al, 2011). 2.1.1.3. Behavioural Risk Factors Behavioural risk factors are responsible for about 80% of CHD and cerebrovascular disease (WHO, 2011). In fact, the WHO (2011) has recently stated that a large proportion of NCDs are preventable through the reduction of their shared four main behavioural risk factors: smoking, harmful use of alcohol, unhealthy diet and physical inactivity. 2.1.1.3.1. Smoking With nearly six million people dying from tobacco use each year, both from direct use and second-hand smoke (WHO, 2011), smoking is reported as the second leading risk 19 Chapter Two – Literature Review factor for mortality worldwide and the leading risk factor in high-income countries (WHO, 2009). Smoking prevalence is highest among upper-middle-income countries (approximately 24%) (WHO, 2011). In 2006-2007, smoking-related ill health was estimated to cost the NHS £3.3 billion (Scarborough et al, 2011). Tobacco use is estimated to cause about 71% of lung cancer, 42% of chronic respiratory disease and nearly 10% of CVD (WHO, 2011). Smoking increases the risk for several cancers, CHD, stroke and peripheral vascular disease among others (Znaor et al, 2003; Inoue et al, 2005; Bullen, 2008; WHO, 2011). A systematic review of eight cohort studies in Japan reported that all studies consistently showed an increased risk of total cancer occurring in current smokers versus never-smokers, for both men and women (albeit weaker for women), with an estimated summary relative risk of 1.53 (95%CI: 1.41–1.65) (Inoue et al, 2005). A case control study involving South Indian men diagnosed with oral (n=1 563), pharyngeal (n=636) and esophageal (n=566) cancer, who were compared with 1 711 male disease controls and 1 927 healthy hospital visitors, observed a significant dose-response relationship for duration and amount of consumption of tobacco smoking and chewing with the development of the 3 neoplasms (Znaor et al, 2003). Furthermore, significant decreases in risk for all 3 cancer sites were observed in individuals who quit smoking (Znaor et al, 2003). Importantly for children’s health, not only the direct use of tobacco but also the exposure to second-hand smoke (i.e. inhalation of smoke resulting from other individuals’ use of tobacco) is associated with higher risks for several NCDs (Bullen, 2008). Using data from 7599 never-smoking adults who took part in the third NHANES survey, Venn and Britton (2007) reported that, compared with subjects with no detectable cotinine (an objective measure of smoking), those with detectable but low-level cotinine had significantly higher levels of fibrinogen and homocysteine, both important biomarkers of CVD risk. These associations remained virtually unchanged even after adjustment for various covariates such as diet, PA, social class and obesity (Venn and Britton, 2007). More recently, Griffiths et al (2010b) have found that 5-year old children from the Millennium Cohort Study were more likely to show rapid weight gain between three and five years if it had been reported that others smoked in the same room, controlling for 20 Chapter Two – Literature Review child’s sex, ethnicity, BMI at age three, and parental overweight among others. This is especially worrying because rapid weight gain during infancy in children born with normal birth weights, and an early adiposity rebound (i.e. the lowest BMI value reached before the start of the second period of rapid growth in body fat in post-natal life) have both been reported to be significantly associated with increased risk for obesity and T2DM by early childhood (Rolland-Cachera et al, 1984; Cameron & Demerath, 2002). 2.1.1.3.2. Alcohol Harmful use of alcohol is responsible for approximately 2.3 million deaths per year (more than half resulting from NCDs including cancers, CVD and liver cirrhosis), accounting for about 3.8% of global deaths (WHO, 2011). It is also the third global risk for burden of disease, being responsible for 4.5% of global disability-adjusted life years (WHO, 2009). Adult (≥15 years) per capita consumption is highest in the European Region (12.2 litres), and in upper-middle- and high-income countries (approximately 10.0 litres) (WHO, 2011). Comparatively to the expenses with smoking, alcohol-related illness has been estimated to cost the NHS £3.3 billion (Scarborough et al, 2011). Alcohol intake (including low dosages) is associated with numerous NCDs such as CVD (Panagiotakos et al, 2009) and several types of cancer (Znaor et al, 2003; Corrao et al, 2004). A meta-analysis including 240 studies (Corrao et al, 2004) has reported significant increased risks for cancers of the oral cavity, esophagus, larynx, colon, rectum, liver and breast, hypertension, liver cirrhosis and chronic pancreatitis, starting from the lowest dose of alcohol considered - 25 g/day (i.e. about two drinks per day). A J-shaped relationship was found between alcohol consumption and CVD, where significant increased risks for both CHD and ischemic stroke were found at 100 g/day, and at 50 g/day for haemorrhagic stroke, but a significant protective effect was observed at 25–50 g/day for CHD (Corrao et al, 2004). 21 Chapter Two – Literature Review 2.1.1.3.3. Diet It is estimated that approximately 16 million (1.0%) disability-adjusted life years and 1.7 million (2.8%) of deaths worldwide are attributable to low fruit and vegetable intake (WHO, 2011). In the UK alone, Scarborough et al. (2011) have estimated that poor dietrelated ill health has cost the NHS around £5.8 billion in 2006-2007. Insufficient fruit and vegetable consumption is estimated to cause around 14% of gastrointestinal cancer deaths, 11% of ischaemic heart disease deaths and about 9% of stroke deaths worldwide (WHO, 2009). Poor diets, generally characterised by high intakes of saturated fats, salt, and sweets have been associated with increased risk for heart disease and T2DM, whereas healthier diets generally characterised by high intakes of fruit, vegetables, cereals and utilisation of healthy oils (e.g. olive oil) are associated with lower risks for CVD and certain types of cancer (Panagiotakos et al, 2009; WHO, 2011). Worryingly, dietary changes appear to be occurring universally from a traditional and largely plant-based diet to an energy-dense one, with high intakes of animal foods and partially hydrogenated fats, and lower intakes of fibre (WHO, 2003; Popkin, 2006). Panagiotakos et al (2009) reported that the dietary pattern of adults (18-89 years) mainly characterized by sweets, red meat, margarine, salty nuts intake, and hard cheese was associated with increased risk for CVD. Conversely, the dietary patterns characterised by: 1) cereals, small fish, dry breads or biscuit, and olive oil intake; and 2) fruits, vegetables intake and olive oil use in daily cooking, were associated with significantly lower CVD. Low intake of fruit and vegetables, higher intake of energy dense foods, skipping breakfast, large portion sizes and consumption of snacks have been identified by epidemiological research as risk factors for childhood obesity (Birch & Ventura, 2009; Mushtaq et al, 2011). For example, in a recent study with five to 12 year old children from Pakistan, Mushtaq et al (2011) found that skipping breakfast (adjusted OR=1.82, 95% CI: 1.22-2.71), and eating fast food and snacks more than once a week (adjusted OR=1.41, 95% CI: 1.07-1.86) were independent predictors of being overweight, even controlling for child’s age and sex. 22 Chapter Two – Literature Review 2.1.1.3.4. Physical inactivity Inactivity (i.e. insufficient PA) is highest in high-income countries, but very high levels are now also seen in some middle-income countries especially among women (WHO, 2011). In England alone, physical inactivity has been estimated to cost £8.2 billion annually (including expenses for the NHS and other costs for the national economy, such as absence from work), not including the contribution of physical inactivity to obesity which has been individually estimated at £2.5 billion annually (Department of Health, 2004). Based upon 2006/07 data, the British Heart Foundation Health Promotion Research Group at Oxford University estimated that physical inactivity has a yearly average healthcare cost of £5 million for each Primary Care Trust unit in England (Department of Health, 2009). Similar high costs have also been reported in other countries, such as Canada and Australia (Naylor & McKay, 2009). Low PA levels and excessive time spent in sedentary activities are related to several NCDs, including CHD, T2DM and obesity, and numerous risk factors for NCDs (Moore et al, 2003; Lobstein, Baur & Uauy, 2004; WHO, 2004;Nocon et al, 2008; Owen et al, 2009; Stamatakis, Hamer & Primatesta, 2009). Using data from 20 177 respondents (age ≥35 years; 43.6% men) of the Scottish Health Survey and the Health Survey for England, Stamatakis, Hamer and Primatesta (2009) have reported an association of PA with all-cause and CVD mortality in both medicated and unmedicated adults. As with most of the other risk factors, these relationships between physical inactivity and NCDs are also seen in children. The European Youth Heart Study (Ekelund et al, 2012) has recently shown significant inverse associations of 9-15 year old children and adolescents’ PA levels with systolic and diastolic BP, triglycerides, glucose and fasting insulin serum levels (all p<0.008), as well as with total metabolic risk score (p<0.0001), independently of TV viewing time and adiposity. Similar findings were found in a crosssectional study of 2 049 White British, African-Caribbean and South Asian primary school children (aged 9-10 years) in the UK (Owen et al, 2010b). Owen et al. (2010b) reported strong inverse graded associations between PA and adiposity markers, and several cardiometabolic risk factors such as fasting insulin, HOMA-insulin resistance, 23 Chapter Two – Literature Review triacylglycerol and C-reactive protein. While the relationship between PA and some cardiometabolic risk factors was considerably attenuated by the adjustment for adiposity levels, the beneficial effect of PA on fasting insulin, HOMA-insulin resistance, triacylglycerol and diastolic BP remained significant (all p≤0.02) and virtually the same for all ethnicities (Owen et al, 2010b). Although the aforementioned studies are cross-sectional and, as such, limited by the possibility of reverse causality, prospective studies have reported similar relationships between PA and risk factors for NCDs. A longitudinal study following 94 children from four to 11 years of age reported consistently lower triceps skinfold thickness and sum of five skinfolds for children in the highest tertile of PA, who also reached the adiposity rebound roughly one year later than the lower two tertiles (Moore et al, 2003). At age 11, the sum of five skinfolds was 74.1, 94.5 and 95.1 mm for the high, medium and low tertiles of PA respectively (ptrend = 0.045), and a similar trend was observed for BMI although it did not reach significance (ptrend = 0.052) (Moore et al, 2003). A recent systematic review has found similar associations in children as young as 9-12 months (Timmons et al, 2012). After reviewing 22 articles investigating the relationship between PA and measures of adiposity and cardiometabolic health indicators (among others), Timmons and colleagues (2012) concluded that there was low- to moderate-quality evidence that increased or higher PA was positively associated with improved measures of adiposity in infants, and low- to high-quality evidence that increased or higher PA was associated with improved measures of adiposity and cardiometabolic health indicators. However, because of the limited amount of information, and the variety of methods used in the assessment of PA, the specific amount, intensity, frequency, or type of PA needed to promote healthy growth and development could not be determined (Timmons et al, 2012). A similar review focusing on SB found low- to moderate-quality evidence that increased TV viewing is associated with unfavourable measures of adiposity in 0-4 year old children (LeBlanc et al, 2012). However, TV viewing is only a crude and incomplete measure of SB, and no other aspects or types of SB (e.g. pattern of accumulation, overall volume of SB) were explored (LeBlanc et al, 2012). 24 Chapter Two – Literature Review It is because of this beneficial effect on several NCDs and their risk factors, along with numerous added health benefits (e.g. improved motor development, cardio-respiratory fitness and mental health), that PA plays a prominent role in the prevention and treatment of ill health throughout the life course. Because low levels of PA and high levels of SB are already seen in very young children (Reilly et al, 2004; Kelly et al 2006; Reilly et al, 2008; Birch, Parker & Burns, 2011; O’Dwyer et al, 2011) and these behaviours seem to track from childhood into adulthood (Malina, 2001; Reilly et al, 2004; Janz, Burns & Levy, 2005; Telama 2005; Biddle et al, 2010), early childhood has been highlighted as a critical period for increasing PA and decreasing SB to prevent NCDs (Fulton et al, 2001; Sirard & Pate, 2001; Whincup et al, 2002; Moore et al, 2003; Misra et al, 2007; Reilly et al, 2009; LeBlanc et al, 2012; Timmons et al, 2012). 2.1.1.4. High Risk Groups for Non-communicable Diseases Although the burden of NCDs is spread throughout different geographical regions, reaching developed and developing countries alike, certain groups within populations present a higher propensity or risk of suffering from NCDs. In general, women are reported to have higher risk of suffering from NCDs than men (WHO, 2011) due to a variety of social, psychological and biological factors. For example, men are free of several health complications that many women have during pregnancy, such as gestational diabetes, hypertension and preeclampsia, which have been linked to higher risk for inflammatory deregulation, vascular dysfunction, hypertension and diabetes later in life (Carpenter, 2007; Mielke, Kaiser & Centuolo, 2013; Weissgerber et al, 2013). Weissgerber et al (2013) have recently reported that 60 (±10) year old women with a history of hypertensive pregnancies had a significantly higher risk of peripheral arterial disease than those with history of normotensive pregnancies, decades after being pregnant. This risk was significant after the adjustment of numerous covariates including age, ethnicity, height, hypertension, 25 Chapter Two – Literature Review diabetes, dyslipidemia, family history of hypertension or CHD, BMI and education (Weissgerber et al, 2013). The WHO (2011) has reported that over 50% of women in the WHO European, Eastern Mediterranean and Americas Regions are overweight, with women from all WHO regions being more likely to be obese than men. Women are also reported to be less active than men (Health and Social Care Information Centre, Lifestyles Statistics, 2013; WHO, 2011), and it’s been repeatedly reported that the role of women as carers in the family has an influence on their lower PA levels (Caperchione, Mummery & Joyner, 2009). Among women, those with young children have been reported as a sub-group with higher risk for being inactive, with competing responsibilities due to childcare and house-work, lack of social support, lack of time and energy being reported as some of the main reasons (Brown & Trost, 2003; Brown et al, 2009; Caperchione, Mummery & Joyner, 2009). The influence of women’s role as carer is stronger in certain sub-groups. In South Asian culture, women should show modesty and are expected to focus on the family and domestic duties over all other activities, so the resulting lack of time, inappropriate mixed-sex facilities and fear of stigma from others in the community represent serious barriers to the practice of PA (Caperchione, Mummery & Joyner, 2009; Babakus & Thompson, 2012). However, it has also been noted that the current evidence base regarding the PA levels, health outcomes, and moderators of PA in women with young children and South Asian women is heavily based on self-reported leisure-time activity (Mackay, Schofield & Oliver, 2011; Babakus & Thompson, 2012). There is an urgent need for research using objective measurement methods sensitive to the patterns and contexts of PA of these sub-groups of the population (Mackay, Schofield & Oliver, 2011; Babakus & Thompson, 2012). The epidemic of NCDs strikes disproportionately among people from lower socioeconomic status within a country, and those in less developed countries (WHO, 2008; WHO, 2011). Non-communicable diseases and poverty create a vicious cycle whereby poverty exposes individuals to behavioural risk factors for NCDs (such as difficulties in providing for healthy diets) and, in turn, the resulting disability and costs 26 Chapter Two – Literature Review with NCDs may become an important driver to the downward spiral that leads families towards poverty (WHO, 2009b; WHO, 2011). Although it is also a factor that has an influence on the social position of individuals (WHO, 2011), ethnicity on its own also represents an increased risk for NCDs (Yusuf et al, 2001; Lear et al, 2012). Several ethnic groups are at high risk for NCDs. South Asians, one of the main migrant groups in the UK (Office for National Statistics, 2012), have been repeatedly reported as one of the higher risk groups for NCDs (McKeigue, Shah & Marmot, 1991; Anand et al, 2000; Bhopal 2000; Yusuf et al, 2001; Bhopal, 2002; Bhatia & , 2004; Patel & Bhopal, 2007; WHO, 2011). In the latest Census data, people identified as Bangladeshi, Indian and Pakistani represented roughly 5% of the population of Engalnd and Wales, with the latter two groups having some of the largest increases between the 2001 and 2011 Censuses (around 0.4 million each) (Office for National Statistics, 2012). Compared to White Europeans, South Asians show much higher prevalence rates of several NCDs, such as T2DM and CHD, both within their geographical area of origin (Bhatia, 2004; Gupta et al, 2006; WHO Regional Office for South-East Asia, 2011), and in countries where they have migrated to (McKeigue, Shah & Marmot, 1991; Bhopal et al, 2000; Patel & Bhopal, 2007; Nightingale et al, 2012). The WHO Regional Office for South-East Asia (2011) has recently reported that 22% of the global NCD deaths occur in South-East Asia, and that over half of all deaths in the region are resultant of NCDs. This was attributed to the high prevalence of the main risk factors for NCDs, where about 80% of the population does not consume enough fruit and vegetables and up to a quarter of the adult population does not meet the global recommendations for PA (WHO Regional Office for South-East Asia, 2011). The higher risk for CVD seen in South Asians in relation to White Europeans has been largely attributed to their unique phenotype, where South Asians present higher amounts of visceral adipose tissue even at the same BMI (Bhatia, 2004; Patel & Bhopal, 2007; Lear et al, 2012), and these differences are seen as early as at birth (Yajnik et al, 2002). Research has shown that, although Indian new-born babies appear to be lighter (2665 versus 3450 grams), shorter (47.3 versus 50.2 cm) and thinner (ponderal index: 27 Chapter Two – Literature Review 24.1 versus 27.3kg/cm3) than White British babies, their subcutaneous fat measurements were comparable to those of the White British babies (Yajnik et al, 2002). Adverse cardiometabolic risk profiles (e.g. markedly higher skinfold thickness, LDLcholesterol, and fasting insulin levels) have been reported UK South Asian children aged 9-10 years, both in relation to White Europeans and to their peers from India (Nightingale et al, 2012). This is closely linked with Barker and colleagues’ developmental origins of health and disease hypothesis, which proposes that adverse environmental influences during the intra-uterine period and infancy (such as undernutrition) directly increase the susceptibility for several diseases (e.g. CHD, diabetes), by for example reprogramming the relationship between glucose and insulin (Barker, 2007; Wadhwa et al , 2009). Several lifestyle and cultural factors also contribute to South Asians’ increased risk of NCDs, particularly for South Asian women. A recent systematic mixed-methods review by Babakus and Thompson (2012) reported that, because in South Asian culture women’s focus should be on the family and domestic duties, those who took time (or wanted to) participate in PA may be stigmatised as selfish by their family and community. Other barriers that disproportionately affect women include the lack of single-sex facilities (to accommodate muslim requirements of modesty), safety worries regarding going out in their neighbourhoods alone, and lack of time due to family duties (Farooqi et al, 2000; Babakus & Thompson, 2012), In addition, there are several other factors affecting South Asian migrants at large, including the lack of clear knowledge about the harms of alcohol, smoking and insufficient PA, unhealthy cooking methods (e.g. high use of clarified butter and frying), difficulties in assessing health services due to language barriers and culturally-sensitive issues (e.g. the need for female doctors to attend to South Asian women), and the concept of fatalism regarding the (lack of) control of their own health (Farooqi et al, 2000; Bhopal, 2002; Babakus & Thompson, 2012) Because of the high susceptibility of South Asian children to develop NCDs from very young ages, and the importance of early life development and experiences for risk of adulthood chronic disease (Barker, 2007; Wadhwa et al , 2009), a need for aggressive preventative measures focusing on therapeutic lifestyle changes incorporating diet and 28 Chapter Two – Literature Review PA from early childhood has been repeatedly highlighted in the literature (Bhopal, 2002; Bhatia, 2004; Khunti & Samani, 2004; Misra et al 2007; Nightingale et al, 2012). 2.2. Physical Activity and Sedentary Behaviour 2.2.1. Definition of Physical Activity and Sedentary Behaviour PA is generally defined as “any bodily movement produced by skeletal muscles that results in energy expenditure” (Caspersen, Powell & Christenson, 1985). It can be categorized in various ways, such as wilful or compulsory, week or weekend day, work or leisure, and according to the intensity of the activity (i.e. light, moderate, vigorous) (Caspersen, Powell & Christenson, 1985). SB is defined as the group of activities that do not substantially increase the energy expenditure (EE) above resting levels (between 1.0 and 1.5 METs), such as lying, sitting, standing, watching television and other screen-based behaviours (Pate, O’Neill & Lobelo, 2008). This definition has recently become a subject of much debate, with several researchers questioning the classification of “standing” as SB (Yates et al, 2011), and including only those behaviours with EE 1.5 METs that are performed while in a sitting or reclining posture (Sedentary Behaviour Research Network, 2012). It is also important to distinguish SB from the term “inactivity”, which is usually defined as not meeting studies’ criteria for moderate or higher levels of activity (Pate, O’Neill & Lobelo, 2008), such as not complying with PA guidelines as used for example by the WHO (2011).. Conceptualizing SB as distinct from a lack of PA is important for three main reasons: 1) the unique nature of SB; 2) the physiological responses to SB; and 3) the measurement of SB. As such, it has been advocated that future studies should measure both SB and PA to determine their independent and joint contributions to health outcomes (Pate, O’Neill & Lobelo, 2008; Cleland & Venn, 2010; Owen et al, 2010b; Salmon, 2010; Tremblay et al, 2010; Salmon et al, 2011; Liese et al, 2013). 29 Chapter Two – Literature Review 2.2.2. Physical Activity and Health The relationship between PA and health has been, and continues to be, widely investigated. It has long been established that PA has a positive effect on all aspects of health – physical, mental (or psychological) and social – throughout the life course (Pate et al, 1995; Boreham & Riddoch, 2001; Department of Health, 2004; WHO, 2004; Janssen & LeBlanc, 2010; Katzmarzyk, 2010). In children, the effects of PA largely pertain to improvement in the risk factors for disease, avoidance of weight gain, achievement of a high peak bone mass and mental wellbeing (Kohl, Fulton & Caspersen, 2000; Boreham & Riddoch, 2001; Hale et al, 2004; Trost & Loprinzi, 2008; Owen et al, 2010b; Carson & Janssen, 2011; Basterfield et al, 2012 Liese et al, 2013; te Velde et al, 2012; Timmons et al, 2012). PA also reduces the risk of disease in adulthood, due to the carry-over of direct health effects and positive PA behaviours into adulthood (Kohl, Fulton & Caspersen, 2000; Boreham & Riddoch, 2001; Department of health, 2004; Datillo et al, 2012) – i.e. primary prevention. In adults, PA is protective against several NCDs (Department of Health, 2004), but it is also a major tool in the treatment and management of already established disease states, such as CAD, hypertension, type one and T2DM, glucose intolerance, and obesity (Kesaniemi et al, 2001; Thompson et al, 2003; Swedish National Institute of Public Health, 2010; Matheson et al, 2011; Liese et al, 2013). The American College of Sports Medicine currently recommends that all healthy adults (18–65 years old) should practice moderate-intensity aerobic PA for ≥30 minutes on five days per week, or vigorous-intensity aerobic PA for ≥20 minutes on three days per week, to promote and maintain health (Haskell et al, 2007). Additionally, strength and flexibility activities that maintain or increase muscular strength and endurance should be performed at least two days per week (Haskell et al, 2007). These are the guidelines generally accepted and recommended worldwide (WHO, 2011), although in the UK the Department of Health (2011) has simplified the recommendation into a minimum of 150 minutes of moderate PA or 75 minutes of vigorous PA per week, without a minimum daily amount. Accumulating 150 minutes of moderate PA per week is estimated to reduce the risk of ischemic heart disease by approximately 30%, the risk of diabetes by 30 Chapter Two – Literature Review 27%, the risk of breast and colon cancer by 21–25%, among others (WHO, 2011). In a scientific statement from the American Heart Association summarising the evidence of the benefits of exercise and PA for the prevention and treatment of atherosclerotic CVD, Thompson et al (2003) reported strong evidence that the most physically active individuals generally demonstrated half the rates of CAD than physically inactive individuals. The studies demonstrated a graded relationship of decreasing CAD with increasing levels of PA and, in many studies, the lower rates of CAD were independent of several other known atherosclerotic risk factors (Thompson et al, 2003). PA can also be used as a treatment for many already established atherosclerotic risk factors, such as hypertension, insulin resistance, elevated blood triglyceride concentrations, and obesity (Thompson et al, 2003; Swedish National Institute of Public Health, 2010; Montesi et al, 2013). In addition to the vast benefits for physical health, PA is known to have positive effects for both the prevention and treatment of several mental and social health outcomes, such as depression, anxiety, stress and dementia (Kesaniemi et al, 2001; Swedish National Institute of Public Health, 2010). For children, the amount and type of PA recommended to maintain health varies with children’s age (mostly reflecting the variation in their motor development), and between countries. The American National Association for Sport and Physical Education (NASPE) guidelines are some of the most widely used worldwide (Benjamin et al, 2008; Tucker, 2008; Okely et al, 2009; Vale et al, 2010; Beets et al, 2011; O’Dwyer et al, 2011). The latter advocate that: toddlers (12-36 months) should engage in at least 30 minutes of structured PA and ≥60 minutes of unstructured PA per day; preschoolers (35 years) should accumulate ≥60 minutes of structured PA and ≥60 minutes of unstructured PA per day (NASPE, 2002; NASPE, 2009); and children aged five to 12 years should accumulate ≥60 minutes of age-appropriate PA on all or most days of the week, including moderate and vigorous intensity PA, accumulated through several bouts ≥15 minutes (NASPE, 2004). 31 Chapter Two – Literature Review In the UK, the National Institute for Clinical Excellence (NICE) has recently published an updated set of PA guidelines (Department of Health, 2011), where the main novelty is the inclusion of specific recommendations for children under five years of age and, within these, distinguishing between children who are able to walk and those who do not yet walk (Department of Health, 2011). According to the latter, children under five years of age who are not yet capable of walking should be encouraged to be physically active from birth, in particular through floor-based play and water-based activities in safe environments (Department of Health, 2011). Children under five years of age who are capable of walking unaided should be physically active for ≥180 minutes daily, accumulated throughout the day (Department of Health, 2011). These recommendations are in line with the current Australian (Australian Government, 2010) and Canadian (Canadian Society for Exercise Physiology, 2012a) recommendations for the early years. The current UK guidelines (Department of Health, 2011) have updated and replaced the previous set from the Department of Health (2004). Because the focus of this thesis is on 2-3 year old children, a more detailed description of the available evidence for the effects of PA on several aspects of young children’s health will be presented below. Whenever possible, data will be presented regarding children aged 2-3 years. However, due to the paucity of data available in this younger age range (Reilly et al, 2008; Timmons et al, 2012; Tremblay et al, 2012a), studies with older children may also be presented when no evidence is found for 2-3 year old children. 2.2.2.1. Physical Health The effects of PA on physical health represent perhaps the largest amount of research investigating the relationship between PA and children’s health. In a systematic review of studies investigating the effect of PA (amount and type) on several health outcomes of five to 17 year old children, aerobic exercise was reported to have a positive effect on blood lipids, systolic BP, fasting insulin and insulin resistance, overweight and obesity, and bone mineral content (Janssen & LeBlanc, 2010). Furthermore, higher cardiorespiratory fitness was significantly and negatively associated with overweight, obesity, 32 Chapter Two – Literature Review hypercholesterolemia and the MetS (Janssen & LeBlanc, 2010). Using 2003-2006 NHANES data including objective measures of PA, Carson and Janssen (2011) reported that a lower volume of MVPA predicted a high cardio-metabolic risk (based on age- and sex-adjusted waist circumference, systolic BP, LDL cholesterol, and Creactive protein values) in six to 19 year olds, independently of the volume of SB and several other confounders, such as age, gender, ethnicity and SES. A recent study pooling objective PA data from several countries and including children between four and 18 years of age has reported similar results (Ekelund et al, 2012). Ekelund et al (2011) reported that time in MVPA was significantly associated with all cardiometabolic outcomes studied (waist circumference, systolic BP, fasting triglycerides, HDL cholesterol, and insulin) independent of sex, age, monitor wear time, SB time, and waist circumference (when not the outcome). Although these studies have included only children aged ≥4 years, a recent systematic review suggests that positive effects of PA on cardiometabolic health and adiposity can already be seen in children aged four years and younger (Timmons et al, 2012). After reviewing a series of RCT and prospective studies with children younger than five years of age, Timmons et al. (2012) found evidence supporting a positive relationship between increased or higher PA levels and favourable measures of adiposity and cardiometabilic health, as well as for bone and skeletal health. The positive effect of PA on adiposity was seen in children as young as 9–12 months (Timmons et al, 2012). Different health benefits may require different PA types. For example, whereas obesity and some cardiometabolic health markers have been shown to respond almost exclusively to aerobic exercise interventions, bone health is more favourably affected by modest amounts of resistance exercise and other high-impact activities such as jumping (Janssen & LeBlanc, 2010). This positive influence of PA on physical health in childhood is not only seen for current health, but also for future health (Boreham & Riddoch, 2001; Timmons et al, 2012). Using longitudinal data from the Framingham Children’s Study, Moore et al (2003) investigated the relationship between objectively measured PA level and several anthropometric indicators of fatness. From ages four to 11 years, children in the highest 33 Chapter Two – Literature Review tertile of average daily PA had consistently smaller gains in BMI, triceps, and sum of five skinfolds. By 11 years of age for example, the sum of five skinfolds was 95.1, 94.5, and 74.1 for the low, middle, and high tertiles of PA, respectively (p trend = 0.045), with this protective effect being evident for both boys and girls (Moore et al, 2003). Similar effects have been reported for bone health, with children in the highest quartile of MVPA at five years of age showing 4%–14% more bone mineral content at ages eight and 11 years than those in the lowest quartile of MVPA (p<0.05), and boys’ MVPA at five years of age predicting bone mineral content at ages eight and 11 years (Janz et al, 2010). How early in life does PA level have an influence on immediate or future physical health has not yet been established, but it has been advocated that prevention and interventions in the early years may produce the largest effects (Bhopal, 2002; Misra et al, 2007; Reilly, 2008; Janz et al, 2010; Nader et al, 2012; Timmons et al, 2012). Studies with children younger than four years of age are scarce, the evidence available is often of low quality, mainly regarding children of White backgrounds (Reilly, 2008; Janssen & LeBlanc, 2010; Timmons et al, 2012), and largely focused on indicators of fatness (e.g. waist circumference or BMI), with limited evidence for other health indicators such as BP (Jones & Okely, 2011). Although the use of objective measurement tools to assess PA in children aged five years or younger has increased in recent years (Cliff, Reilly & Okely, 2009), a large part of the evidence available for the positive effect of PA on physical health is still based on proxy-reports (Timmons et al, 2012), which presents several limitations (Cliff, Reilly & Okely, 2009) that may mask the true magnitude of the relationship (Sallis & Saelens, 2000). There is an urgent need for research using objective and reliable measurement methods in longitudinal and experimental studies in more diverse and large samples, to identify what types, intensity, duration and patterns of accumulation of PA are needed to promote healthy growth and development from the early years (Janssen & LeBlanc, 2010; Skouteris et al, 2012; Timmons et al, 2012). 34 Chapter Two – Literature Review 2.2.2.2. Mental Health In a recent meta-analysis of studies published between 1974 and 2009 looking at the PA and mental health of children aged 3.67 to 17.66 years, Ahn and Fedewa (2011) reported a small to moderate effect of PA on children’s mental health. PA was effective in reducing depression, anxiety, psychological distress and emotional disturbance in RCT’s, and increasing self-esteem in non-RCT’s (Ahn & Fedewa, 2011). Correlation studies showed PA level to be negatively associated with childhood depression, and positively associated with children’s self-concept (Ahn & Fedewa, 2011). Self-concept was not clearly defined by the authors, but it was reported to include several areas including exercise, physical, academic, social and family/home self-concepts (Ahn & Fedewa, 2011). The beneficial effects of PA were observed across all ages and regardless of children’s BMI. However, boys seemed to get larger benefits from PA than girls, and the same was true for children who were diagnosed as cognitively impaired or emotionally disturbed versus normally developing children (Ahn & Fedewa, 2011). These findings are in accordance with the conclusions of Biddle and Asare (2011) after an extensive review of reviews investigating the relationship between PA and depression, anxiety and self-esteem in children and adolescents. Looking at five year old children from the UK Millennium Cohort Study, Griffiths et al (2010a) have recently reported that children who participate in sports clubs or classes outside of school at least once a week show lower total difficulties scores, and fewer emotional, conduct and hyperactivity-inattention problems, assessed with the parent reported Strengths and Difficulties Questionnaire (Goodman et al, 2000). The Strengths and Difficulties Questionnaire is an emotional and behavioural screening questionnaire consisting of 25 psychological attributes, divided into five scales examining emotional symptoms, conduct problems, hyperactivity/inattention problems, peer relationship problems, and pro-social behaviour (Goodman et al, 2000). The total difficulties score used in the paper by Griffiths et al (2010a) was derived from the sum of scores for the emotional, conduct, hyperactivity and peer relationship problem scales, ranging from zero to 40, where higher scores indicated more difficulties. With the exception of hyperactivity-inattention problems for boys, these associations persisted even after 35 Chapter Two – Literature Review adjusting for confounders such as child’s longstanding illness, household income, and mother’s education, longstanding illness and emotional problems. All of the aforementioned studies indicate a positive effect of PA on mental health, both in healthy children and children with cognitive and physical impairments, despite the paucity of good quality research available (Biddle & Asare, 2011). However, research has mainly included White children aged three years or older, and studies assessing the relationship between PA and the mental health of children younger than three years of age are scarce (Timmons et al, 2012). The potential influence of ethnicity on this relationship has not yet been addressed (Timmons et al, 2012). In addition, there is a paucity of good quality research designs in the literature (Biddle & Asare, 2011), and prospective and experimental studies are necessary in order to clarify the mechanisms underlying these relationships (Timmons et al, 2012) and rule out the hypothesis of inverse causality (Biddle & Asare, 2011). 2.2.2.3. Social Health In addition to the association with mental health outcomes mentioned in the previous section, Griffiths et al (2010a) also found that participating in sports at least once a week was associated with less peer relationship problems and more pro-social behaviours (i.e. considerate of others' feelings, shares readily with others, kind to younger children, often volunteers to help others) in five year old children. These associations remained significant after adjusting for confounders, although a reduction in significance was observed for pro- social behaviours (Griffiths et al, 2010a). These findings are supported by a recent systematic review of RCT and prospective studies (Timmons et al, 2012), which identified a study where more active preschoolers participating in a RCT dance program were classified by their teachers as less socially withdrawn and more outgoing. These children also showed improved social competence and externalising behaviour than children not participating in the intervention (Timmons et al, 2012). However, the research available has a serious risk of bias and, apart from one study conducted with infants in the 1970’s, experimental and prospective studies with children aged three years or younger are lacking (Timmons et 36 Chapter Two – Literature Review al, 2012). There is a clear need for RCT and prospective studies to investigate the causal pathways involved in the associations of PA with such behavioural problems, and identify which components of PA (e.g. timing of exposure, amount and type) are most beneficial for prevention and treatment programs for young children (Griffiths et al, 2010a). To address the latter, studies need to move from subjective measures of PA (which result in large measurement errors and risk of response bias) to direct and objective measurement tools (e.g. accelerometers), which offer a more accurate, valid and reliable measure of PA outcomes such as total amount of PA, time spent in different PA intensities and daily patterns (Cliff, Reilly & Okely, 2009). 2.2.2.4. Cognitive and Motor Development For some time now, PA has been believed to have an influence on cognition (Sibley & Etnier, 2003; Vaynman & Gomez-Pinilla, 2006; Biddle & Asare, 2011). A meta-analysis has reported a significant positive relationship between PA and cognitive function in both healthy children (aged 4–18 years) and those with physical and mental impairments, with an overall effect size of 0.32 (SD = 0.27) (Sibley & Etnier, 2003). The largest effect sizes (0.34 - 0.49) were seen for the categories of perceptual skills, developmental level/academic readiness, IQ and other category (including creativity, concentration, and cross-disciplinary batteries), for middle (ES = 0.48) and early elementary school children (ES = 0.40) (Sibley & Etnier, 2003). Externally-valid measures of academic achievement are complex, constituting a diverse combination of cognitive functions (Hillman, Kamijo & Scudder, 2011). The wide number of cognitive instruments available and the use of measures with poor/unknown psychometric properties in this literature can contribute to inconsistent findings in this area (Sibley & Etnier, 2003). This has highlighted the need for intervention studies (both short and long term) exploring the effects of childhood PA and cognition, with the use of direct, valid and reliable measures of both variables (Sibley & Etnier, 2003; Timmons et al, 2012). A RCT involving 171 overweight and inactive 7-10 year old children, investigating the effects of an after-school aerobic exercise program, showed an improvement in cognitive performance, specifically dose-response benefits of exercise on executive 37 Chapter Two – Literature Review function and mathematics achievement (Davis et al, 2011). In a review of studies examining the relationship of PA with neuroelectric attributes of cognition during childhood, Hillman, Kamijo and Scudder (2011) concluded that the evidence supported a beneficial short- and long-term effects of PA practice on brain health and cognition, which may lead to an improved academic performance and improved overall effective functioning throughout the lifespan. One of the underlying mechanisms proposed to explain this relationship is that exercise, through its modulation of energy metabolism, impacts molecular systems important for synaptic plasticity, learning and memory (Vaynman & Gomez-Pinilla, 2006). The majority of research, thus, suggests a positive influence of PA in the cognitive development of children. However, there are no studies with children aged one to four years (Timmons et al, 2012), when the neural tissue is rapidly growing (Cameron & Demerath, 2002). There is an urgent need for statistically powerful longitudinal and intervention studies using valid and reliable measures of cognitive outcomes, objective measures of PA, and controing for potential confounding variables (e.g. ethnicity and SES) (Sibley & Etnier, 2003; Timmons et al, 2012). This will allow researchers to establish whether a causal relationship exists, clarify the types and duration of PA that may benefit cognitive performance, and identification of the possible mechanisms underlying the observed relationship (Sibley & Etnier, 2003; Timmons et al, 2012). The literature also recognizes a positive role of PA for the motor development of children (Williams et al, 2008; Bürgi et al, 2011; Timmons et al, 2012). Greater improvements in body control balance, grasping and hand-eye coordination were seen in infants (one month to one year), as a result of a passive cycling intervention; in preschoolers (3.1-4.9 years), increased fundamental movement skills and improved scores on the Test of Gross Motor Development were seen as a result of three different PA interventions (Timmons et al., 2012). In a recent cross-sectional and longitudinal study involving 217 healthy 4-6 year old children, Bürgi et al (2011) found a positive association between PA and children’s agility and balance, and a significant relationship 38 Chapter Two – Literature Review between baseline PA and change in both of those motor skills. Williams et al. (2008) found similar results with slightly younger children (three to four years), reporting that those in the highest tertile of locomotor and total motor skill performance scores spent significantly more time in vigorous and MVPA (p≤0.05). There is, however, a lack of research during the period of one to three years of age (Timmons et al, 2012) – a critical time for motor development – when children gain and consolidate competency in basic motor skills such as walking alone and running (WHO Multicentre Growth Reference Study Group, 2006; Cliff, Reilly & Okely, 2009). In line with the area of cognitive development, there is a need for larger cohort studies including children between the ages of one and three years (Timmons et al, 2012), to investigate the long-term consequences of early childhood PA on motor skill development and performance and the possibility of reverse causality (Williams et al, 2008; Burgi et al, 2011). Although the literature has been increasing in recent years, a critical need to expand the research capacity and improve the understanding of what types and how much PA is needed for optimal growth and development from the early years remains (Reilly et al, 2008; Timmons et al, 2012; Tremblay et al, 2012a). 2.2.3. Sedentary Behaviour and Health SB has consistently been associated with detrimental health outcomes throughout the life course (Rey-Lopez et al, 2008; Bassett, Freedson & Kozey, 2010; Owen et al, 2010a; Tremblay et al, 2010; te Velde et al, 2012). Often viewed as the “low end” of the PA continuum or insufficient MVPA according to published PA guidelines, an emerging body of evidence now suggests that SB, distinct from the lack of PA, has independent and different effects on metabolism, physical function and health (Pate, O’Neill & Lobelo, 2008; Reilly et al, 2009; Bassett, Freedson & Kozey, 2010; Katzmarzyk, 2010; Tremblay et al, 2010; Ford & Caspersen, 2012). 39 Chapter Two – Literature Review In the UK, SB guidelines for adults recommend that individuals should minimise the amount of time spent being sedentary (sitting) for extended periods of time (Department of Health, 2011). SB has been extensively associated with detrimental effects on the health of adults, including metabolic dysfunction (e.g. decreased insulin sensitivity), a reduction in bone mineral content, impaired vascular function and increased risk for the development of CVD and mental disorders (Healy et al, 2008a and 2008b; Katzmarzyk, 2010; Tremblay et al, 2010; Gill et al, 2011; Thorp et al, 2011; Ford & Caspersen, 2012). Probably due to the fact that most studies addressing SB in young children have used time spent watching television and/or other screen-related activities as the measure of choice (Chinapaw et al, 2011; LeBlanc et al, 2012), most of the existing SB guidelines for young children are related to a daily limit of TV viewing time (Salmon et al, 2011). The American Academy of Pediatrics (2001) recommends that children should spend no longer than two hours per day in media entertainment, and children younger than two years of age should avoid watching TV. The Australian guidelines are in agreement with the American Academy of Pediatrics (2001) guidelines for children under two years of age but are stricter for two to five year olds, recommending a maximum of one hour per day spent watching television or using other electronic media (Australian Government, 2010). Additionally, the Australian Government (2010) recommends that infants, toddlers and preschoolers should not be sedentary, restrained or kept inactive for more than one hour at a time (except when sleeping), which has also been advocated on the newly published Canadian SB Guidelines for the early years (Canadian Society for Exercise Physiology, 2012b) In the UK, the recently published PA guidelines now include statements regarding younger children’s SB (Department of Health, 2011). Similarly to the Australian and Canadian guidelines (Australian Government, 2010; Canadian Society for Exercise Physiology, 2012b), the British National Institute for Health and Care Excellence (NICE) (2011) recommends that all children under five years of age should minimize the amount of time being sedentary (especially avoiding prolonged bouts), although no daily limit is indicated. 40 Chapter Two – Literature Review Because the focus of this thesis is 2-3 year old children, a more detailed description of the available evidence for the effects of SB on several aspects of young children’s health will be presented below. Whenever data may not be available for 2-3 year olds, data from older children or adults will also be presented. 2.2.3.1. Physical Health A recent review by te Velde et al (2012) has reported moderate strength evidence for a positive association between TV viewing and overweight in 4-6 year old children. Another systematic review of longitudinal studies and clinical trials investigating the relationship between SB and several health indicators in children of four years and younger has also concluded that TV viewing is associated with unfavourable measures of adiposity (LeBlanc et al, 2012). Evidence of this relationship in toddlers (1.1 – 3.0 years old) was classified as moderate quality, with three prospective cohort studies reporting a significant positive dose-response relationship between TV viewing time and BMI and %BF (LeBlanc et al, 2012). These conclusions are in contrast with an earlier systematic review of prospective studies, where Chinapaw et al. (2011) concluded that there was insufficient evidence for a longitudinal relationship between self- or proxyreported SB time (mainly TV viewing) and BMI or fat mass indicators. These inconsistencies may be due to differences in the search strategies and inclusion criteria between reviews. Nevertheless, these studies show that research has mainly focused on TV viewing (as a surrogate for SB) (te Velde, et al, 2012) and indicators of fatness, and research investigating the relationship between different components of SB and other physical health indicators is needed (Chinapaw et al, 2011; Salmon et al, 2011; LeBlanc et al, 2012). Importantly, the relationship between TV viewing and obesity and other metabolic risk factors is a complex one, confounded by the effect of potential mediators (such as TV-associated eating and unhealthy snacking) (Rey-Lopez et al, 2008; Okely & Jones, 2011; Salmon et al, 2011; Datillo et al, 2012) and issues relating to the validity and reliability of parental reports as the measurement tool. Consequently, the mechanism behind these associations (Vandewater, Bickham & Lee, 2006) and the direction of causation (Prentice & Jebb, 2006) remains unclear. 41 Chapter Two – Literature Review Associations of SB and impaired physical health in childhood have also been reported to track in longitudinal studies. For example, Hancox, Milne & Poulton (2004) used data from approximately 1000 New Zealand children participating in the Dunedin Multidisciplinary Health and Development Study, followed from age three to 26 years, to investigate the association of childhood TV viewing habits and adult health. Average weeknight TV viewing time between five and 15 years was significantly associated with higher BMI, lower cardiorespiratory fitness, increased cigarette smoking, and raised serum cholesterol. All associations persisted after adjusting for potential confounders such as childhood SES, BMI at age five years, parental BMI and smoking, and PA at age 15 years (Hancox, Milne & Poulton, 2004). In 26-year-olds, population-attributable fractions indicated that 17% of overweight, 15% of raised serum cholesterol, 17% of smoking, and 15% of poor fitness could be attributed to SB (from excessive TV viewing) during childhood and adolescence (Hancox, Milne & Poulton, 2004). Conversely, Ekelund et al. (2012) have found no longitudinal association between time spent in SB and the waist circumference of four to 17 year old children (average follow-up time = 2.1 years, 0.3–8.0 years). These contradictory results are likely due to the limitations and differences in the methods used to assess SB (i.e. TV viewing time proxy-reports versus objective measurement with accelerometers), the covariates included in the analysis, and a difference in follow-up time. Importantly, longitudinal studies following children from ages younger than three years are scarce (Rey-Lopez et al, 2008; LeBlanc et al, 2012). Because SB and PA may have independent and different effects on metabolism and health (Tremblay et al, 2010; Thorp et al, 2011), it is important that studies take into consideration children’s PA to clarify the individual role of SB on health (Pate, O’Neill & Lobelo, 2008). However, much of the published literature fails to control for any indicator of PA when analysing SB data. In the UK, a recent study involving 7 758 children from the Avon Longitudinal Study of Parents and Children found that those who watched TV for >4 hours/week at age three years had significantly higher odds of being classified as obese at age seven (Reilly et al, 2010). The analysis included several known obesity risk factors, such as sex, parental obesity, maternal education and infant breastfeeding, 42 Chapter Two – Literature Review but lacked control for children’s PA at any age. As such, one cannot discard the possibility of the higher risk attributed to TV representing in fact a low level of PA (i.e. displacement of time in PA), or the existence of an interaction with children’s PA (ReyLopez et al, 2008; Okely & Jones, 2011). Some recent studies have started attempting to disentangle the independent contributions of PA and SB for health (Hancox, Milne & Pulton, 2004; Carson & Janssen, 2011; Ekelund et al, 2012). As mentioned before, Hancox, Milne and Pulton, (2004) found that average weeknight TV viewing time between ages five and 15 years was associated with higher BMI, raised serum cholesterol and lower cardiorespiratory fitness, even after controlling for PA at age 15. However, contradictory results have been reported in the literature. Carson & Janssen (2011) looked at the relationship between SB volume, patterns and types and the cardiometabolic health of 6-19 year old children from the US NHANES survey, using objective measures of both SB and PA. Controlling for several covariates such as gender, race, SES, smoking and diet parameters, SB volume and patterns were not associated with higher cardio-metabolic risk score (based on age- and sex-adjusted waist circumference, systolic BP, LDL cholesterol and C-reactive protein values) or any of its individual components, and the significance of the association was greatly reduced when the regression model further controlled for MVPA (Carson & Janssen, 2011). Ekelund et al. (2012) also found no longitudinal association of SB with waist circumference. Furthermore, any crosssectional associations between SB and several cardiometabolic outcomes of children were not significant once time spent in MVPA was controlled for in the analysis (Ekelund et al, 2012). Differences between studies may be due to the difference in the covariates included in the analysis, children’s characteristics (e.g. age, maturation and ethnicity), the method used to assess both SB and PA, and the design of the studies (cross-sectional versus longitudinal). Nevertheless, the independent effect of SB (and its different components) on children’s physical health remains unclear. It was not until recently that the research into the relationship between SB and health expanded its focus from the volume of SB alone. Research suggests that the type (Carson & Janssen, 2011) and patterns of SB accumulation (Healy et al, 2008a; Owen 43 Chapter Two – Literature Review et al, 2010a) may impact health independently of the total amount of SB. As mentioned earlier, Carson and Janssen’s (2011) study found a significant positive association between the amount of TV viewing and higher cardio-metabolic risk factors in six to 19 year old children. A study conducted with Australian adults, using accelerometers to objectively measure PA and SB, has reported that a higher number of breaks in SB was associated with lower waist circumference, BMI, triglycerides and 2-hour plasma glucose, independent of total SB and time in MVPA (Healy et al 2008a). In contrast, Carson and Janssen’s (2011) study found no evidence of a relationship between either volume or patterns of objectively measured SB with children’s cardiometabolic risk score or any of its components (waist circumference, systolic BP, LDL cholesterol and C-reactive protein). Similar studies in younger children are lacking, and there is an urgent need for research to improve the understanding of the relationship between SB patterns and cardiometabolic health across all ages (Carson & Janssen, 2011; Saunders et al, 2012). The inconsistencies in the relationship between physical health and SB may be due to physiological differences in the way SB impacts health in adults and children, differences in the measurement tools and protocols used (for data collection, cleaning and analysis), and the characteristics of SB that were assessed (Rey-Lopez et al, 2008; Carson & Janssen, 2011; van Grieken et al, 2012). It is important that researchers clearly define SB (Tremblay et al, 2010) and the study aims, chose adequate SB measurement tools which assess the specific behaviours that are of interest to answer the study questions (e.g. TV viewing or total daily time spent in SB), and draw conclusions limited to the specific behaviours measured (Pate, O’Neill & Lobelo, 2008; Lubans et al, 2011), to avoid adding confusion to the existing literature on SB and health. A need to focus on using direct measures of SB (i.e. accelerometers or inclinometers) within prospective studies with large and multi-ethnic samples, which allow researchers to understand the SB patterns of children younger than 5 years of age, and the implications of both SB volume and patterns in several health indicators has been highlighted in the recent literature (Salmon, 2010; Tremblay et al, 2010; Salmon et al, 44 Chapter Two – Literature Review 2011; Okely & Jones, 2011; LeBlanc et al, 2012). An improved understanding about the latter would help to identify specific times of the day when parents/caregivers should promote reductions in SB (LeBlanc et al, 2012), and potentially more inactive groups (e.g. ethnic minorities) which policy makers can target to implement interventions aiming to reduce children’s SB (Rich, Griffiths & Dezateux, 2012). While the entire range of activity intensities (from sedentary to vigorous) contribute to total EE (TEE), activities performed within a specific intensity range (e.g. sedentary) may influence metabolic health in unique ways (Healy et al, 2008b; Pate, O’Neill & Lobelo, 2008). Consequently, it is important to control for time spent in different PA intensities when investigating the relationship between SB and health, to clarify the independent effect of SB on different health outcomes (Pate, O’Neill & Lobelo, 2008). 2.2.3.2. Mental Health Although there is little research about the effects of SB on the mental health of young people (Biddle & Asare, 2011), published studies have associated excessive SB with detrimental mental health, such as depression (Jolin & Weller, 2009). In a brief review of studies investigating this relationship in children and adolescents aged 4-17 years, Biddle and Asare (2011) have reported that there is evidence for a consistent negative mental health association with SB (mainly assessed through TV viewing time). For example, Hamer, Stamatakis and Mishra (2009) have reported that higher levels of TV viewing time increase psychological distress in four to 12 year old Scottish children, as assessed by the Strengths and Difficulties Questionnaire. LeBlanc et al (2012) have also reported moderate quality evidence of a dose-response relationship between TV viewing time and psychosocial health in children aged four years or younger. A review of research on the impact of TV viewing on childhood behaviours concluded that increased TV exposure was associated with depression and that, as the use of electronic media continues to rise, it is important to investigate its long-term effects on the risk of psychiatric illness (Jolin & Weller, 2009). 45 Chapter Two – Literature Review Although most existing studies seem to indicate a negative effect of SB on children’s mental health, studies with contradictory results have also been published. Mistry et al. (2007) found a small significant association (p≤0.01) between the “anxious or depressed” scale and excessive TV viewing at five years and sustained excessive TV viewing (from two to five years). However, this association was no longer significant after adjusting for potential confounders such as child’s gender, household income, and maternal education and depressive symptoms (Mistry et al, 2007). Griffiths et al (2010b) also found that more than two hours of “screen entertainment” per day was not associated with any mental health problems in five year old Scottish children, after adjustment for several confounders. The contradictory results may be due to the different mental health outcomes, the measurement methods used (“screen entertainment” was not defined in the latter study, and may include time spent playing with a computer or console games), or children’s age. Importantly, it is also possible that it is the content of TV programmes that is affecting the mental health outcomes of children (American academy of Pediatrics, 2001), rather than the “volume” of TV (Mistry et al, 2007), and this may partly explain existing contradictions in the literature. Most of the research regarding children’s mental health has been done with children older than three years (Biddle & Asare, 2011), the measurements used to assess mental health outcomes (e.g. “psychological distress”) are many times more reflective of children’s social health and behaviours (e.g. victimisation, aggressiveness, cooperation (LeBlanc et al, 2012), and largely assessing SB only through proxy-reports of time spent watching TV or other screen-based entertainment (Biddle & Asare, 2011; Chinapaw et al, 2011; Leblanc et al 2012). It is important that future prospective and intervention studies focus on mental health indicators, using valid and reliable measures to assess daily SB (total and patterns) and its subcomponents beyond TV viewing in large cohorts of children, thus allowing for the control of several covariates (including PA) and the clarification of the long-term effects of high levels of SB in young children (Biddle & Asare, 2010; Chinapaw et al, 2011; Lubans et al, 2011; LeBlanc et al, 2012). 46 Chapter Two – Literature Review 2.2.3.3. Social Health Increased TV viewing has been reported to displace time spent in activities with parents and siblings, and also associated with social skills and attachment issues (Jolin & Weller, 2009). Mistry et al (2007) investigated the long term effects of having a TV in the room and excessive TV exposure (according to AAP recommendations) between 30 months to 5.5 years of age on behavioural and social skills at five years, measured by the Social Skills Rating System. The authors found a significant negative association between excessive TV viewing at five years and measures of cooperation, assertion, self-control, and the composite social skills score, even accounting for child’s sex, household income, mother’s education and ethnicity among others (Mistry et al, 2007) Vandewater, Bickham and Lee (2006) examined this in a nationally representative sample of children (age= 0–12 years), and reported that time spent watching TV was negatively related with time spent interacting with parents or siblings in other activities. For example, for every hour spent watching TV without their parents present on a weekday, zero to two year olds and three to five year olds spent 52 and 45 minutes less time, respectively, interacting with their parents (Vandewater, Bickham & Lee, 2006). These results are in line with the systematic review by LeBlanc et al (2012), which found moderate quality evidence of an association btween SB (assessed with TV viewing time) and lower scores of pro-social behaviour and higher risk for aggressive behaviour, externalizing problems and victimization in toddlers, and anti-social behaviour, victimization and bullying in preschoolers. Importantly, all of these studies reported a significant dose-response gradient in the association of SB with the social health outcomes (LeBlanc et al, 2012). All of these findings suggest a harmful effect of SB on the social health of young children. However, TV viewing was the only measurement method used across all studies, offering only a partial view of children’s SB (Chinapaw et al, 2011; LeBlanc et al, 2012), and the effects of TV viewing on social interactions and behaviours of children may be due to the content of the TV programmes (American Academy of Pediatrics, 2001; Mistry et al, 2007; Salmon et al, 2011) or simply a marker for more “individualistic” 47 Chapter Two – Literature Review family styles (Vandewater, Bickham & Lee, 2006). Similar studies using tools that assess content and context of TV viewing are needed, in order to clarify the mechanism underlying the harmful effects of TV on the social health of young children (Mistry et al, 2007). It’s been highlighted that future experimental and longitudinal research needs to focus on objective measures of SB with large cohorts of children, enabling the stratification by child’s age and sex and control for potential confounders (e.g. ethnicity or PA) (Chinapaw et al, 2011; LeBlanc et al, 2012). This will allow researchers to clarify if harmful effects are also observed for other SB indicators, if the pattern of SB is important and the longitudinal effects of excessive SB during the early years (Chinapaw et al, 2011; LeBlanc et al, 2012). 2.2.3.4. Cognitive and Motor Development As with all other relationships between SB and health, the vast majority of research conducted to date relating to children’s cognitive development (e.g. development of language and attention) has used reports of TV viewing time as the measure of SB (LeBlanc et al, 2012). In children younger than five years of age, increased TV viewing time has been negatively associated with time spent in creative play (p<0.01) , independently of child’s sex and ethnicity, family income and education of household (Vandewater, Bickham & Lee, 2006). Zimmerman and Christakis (2005) have reported significant adverse effects of TV viewing before three years of age and later cognitive development. Each hour of average daily TV viewing before three years of age was associated with a decline of 0.31 points on the Peabody Individual Achievement Test Reading Recognition Scale, -0.58 points on the Reading Comprehension Scale, and −0.10 points on the Memory for Digit Span assessment (Zimmerman & Christakis, 2005). For the Reading Recognition Scale score only, a beneficial effect of TV at ages 3–5 years was identified, with each hour associated with a 0.51 point improvement in the score (Zimmerman & Christakis, 2005). Similar studies using objective measurements of SB are lacking (LeBlanc et al, 2012). 48 Chapter Two – Literature Review Akin to the relationship with mental and social health, the effects of TV viewing on the cognitive development of children may be due to the content of the TV programmes (American Academy of Pediatrics, 2001; Linebarger & Walker, 2005; Zimmerman & Christakis, 2005) rather than the displacement of time from other activities deemed more developmentally appropriate, such as active play (Vandewater, Bickham & Lee, 2006). It has been urged that future studies use valid and reliable objective tools in addition to parent/teacher reports (LeBlanc et al, 2012) to assess SB time and patterns, TV viewing time and content in young children (Mistry et al, 2007) are needed, to clarify if other aspects of SB are negatively related to cognitive development or if this relationship exists only for the particular sedentary activity of TV viewing, and if the latter is driven by program content (Okely and Jones, 2011). Research addressing the effects of SB in the motor development of young children is very limited (Salmon et al, 2011; LeBlanc et al, 2012). Cross-sectional associations have been reported between SB and motor skill performance in three and four year old US children (Williams et al, 2008), with those in the highest tertile of locomotor scores spending significantly less time in SB than children in the medium and low tertiles. However, LeBlanc et al (2012) found no prospective or experimental studies (complying with the inclusion criteria defined for this review) examining the relationship between SB and motor development of children aged four years or younger. Authors have highlighted the need for future work to use direct measures of SB on large cohorts of children so that analysis can be stratified by sex, age group and other variables (e.g. ethnicity), clarify the longitudinal effects of excessive SB in the early years in children’s cognitive and motor development (Leblanc et al, 2012), and identify biologically plausible mechanisms for the observed effects (Salmon et al, 2011). 2.2.4. Critical Periods for the Establishment of Activity Behaviours The preschool period is considered by many as a critical time for the establishment of activity behaviours (both PA and SB) that can track throughout childhood (Certain & Khan, 2002; Reilly et al, 2004; Janz, Burns & Levy, 2005; Kelly et al, 2007; Mistry et al, 49 Chapter Two – Literature Review 2007; Reilly, 2008; Francis et al, 2011; Okely & Jones, 2011) and into adulthood (Malina, 2001; Telama et al, 2005; Biddle et al, 2010). Although PA seems to decrease during the preschool years (Taylor et al, 2009), low to moderate tracking of PA has been reported in several studies (Janz, Burns & Levy, 2005; Kelly et al, 2007), including studies with long-term follow-up (21 years) into adulthood (Telama et al, 2005). In a review of longitudinal studies with follow-up periods ranging from one to 27 years, Biddle et al. (2010) have reported that SB tracks moderately during childhood and into adulthood, and it appears that SB tracks more strongly and consistently over time than PA (Janz, Burns & Levy, 2005; Taylor et al, 2009). Specifically in the early years, Certain & Khan (2002) have reported that two year olds who watched ≥3 hours of television per day were almost three times more likely than other children to watch ≥3 hours per day at age six (OR: 2.7; p<0.0001). It is during the preschool period that children develop several fundamental fine- and gross-motor skills (WHO Multicentre Growth Reference Study Group, 2006; Cliff, Reilly & Okely, 2009). These fundamental skills compose the motor competency that will enable preschoolers to engage in more elaborate forms of PA demanding the combined use of several fine- and gross-motor skills (Hills, King & Armstrong, 2007), such as those necessary during organised sports (Castelli & Valley, 2007). If a child does not develop his/her fundamental motor skills properly, it will likely jeopardise his/her ability to participate in more demanding activities, limiting the variety and number of activities they can engage in and risk building a preference for more sedentary activities in the future (Castelli & Valley, 2007). This, in turn, may increase the risk for several diseases later in life. In addition to the importance of early years for the establishment of motor competency and activity behaviours, preschooler’s PA and SB are important because of both the immediate and long-term effects of PA and SB on health (Hills, King & Armstrong, 2007; Tucker, 2008; Chinapaw et al, 2011; LeBlanc et al, 2012; Timmons et al, 2012), as described above in sections 2.2.3. and 2.3.4. Several NCDs such as obesity (Stamatakis, Wardle & Cole, 2010; WHO, 2011; Kuhl, Clifford & Stark, 2012), diabetes (Hale, 2004) and hypertension (Assadi, 2012) have already been reported in very young 50 Chapter Two – Literature Review children, and the importance of surveillance studies,and primary prevention and intervention programmes involving PA and SB early in life has been repeatedly highlighted in the literature (Fulton et al, 2001; Sirard & Pate, 2001; Whincup et al, 2002; Moore et al, 2003; Misra et al, 2007; Reilly et al, 2009; LeBlanc et al, 2012; Timmons et al, 2012). Because some ethnic minorities have a higher susceptibility for certain chronic diseases (e.g. T2DM or CVD), which can already be observed in prepubertal children (Whincup et al, 2002; Whincup et al, 2010) and even pre-natal life (Taveras et al, 2010), it has been highlighted that interventions and primary prevention during early childhood may be key in reducing ethnic disparities in health later in life (Bhopal, 2002; Misra et al, 2007; Taveras et al, 2010). Given the metabolic programming and developmental plasticity (Barker, 2007; Hanson & Gluckman, 2008), in addition to the malleability of behavioural modelling during the early years, infancy and the toddler years are considered by many as one of the most critical and potentially most effective periods to address modifiable factors of several chronic diseases, such as obesity and insulin resistance (Cameron & Demerath, 2002; Datillo et al, 2012; Nader et al 2012). 2.2.5. Physical Activity in Preschool Children The following sections will provide a description of the type and level of PA present in the preschool years, and what factors influence the latter. 2.2.5.1. Activity Patterns and Motor Development The developmental stage from one to three years of age is often described as the toddler period. PA during this period is mainly characterised by unstructured activities (i.e. play) and an increased proficiency in locomotor skills, such as running, jumping and skipping (Cliff, Reilly & Okely, 2009). According to the WHO Motor Development Study, by one year of age, 75% of children are capable of standing alone, 97% are capable of crawling on hands and knees and walking with assistance, and only 50% are able to walk alone (WHO Multicentre Growth Reference Study Group, 2006). It is not until 17.6 (95%CI: 17.1–18.0) months that nearly all children are capable of walking alone (WHO 51 Chapter Two – Literature Review Multicentre Growth Reference Study Group, 2006). In most children, the attainment of gross motor milestones follows a fixed sequence for five of the skills (in order): sitting without support, standing with assistance, walking with assistance, standing alone and walking alone (WHO Multicentre Growth Reference Study Group, 2006). The attainment of hands-and-knees crawling may shift between the other five milestones, and not all children exhibit this motor skill in a healthy and normal pattern of growth and development (WHO Multicentre Growth Reference Study Group, 2006). It should be noted, however, that there is natural variation within a population of healthy children in the attainment of motor milestones, as can be seen from the wide range in the windows of achievement of several gross motor skills, ranging from five to ten months (WHO Multicentre Growth Reference Study Group, 2006). There are also normal variations in the timing of achievement of motor development milestones across different populations, reflecting differences in several aspects such as cultural variations in childcare practices, nutrition (e.g. iron deficiency) (Angulo-Barroso et al, 2011), and possibly due to other ethnic and genetic causes (WHO Multicentre Growth Reference Study Group, 2006). Although by age two all children may be expected to walk alone, human locomotion is a complicated process and it takes several years to reach a mature gait pattern (Keen, 1993). At age one, children do not exhibit reciprocal arm swing, pelvic incline and hip abduction are exaggerated during the swing phase, the base of support is wide, and children generally present a much higher step frequency than adults (Keen, 1993). By two years of age, there is a significant decrease in pelvic incline, abduction and external rotation of the hip, but the base of support remains wide (although slightly reduced in comparison to one year olds) (Keen, 1993). By age three, 90% of children have reciprocal arm swing, the base of support is proportionately the same as in adults and, although small differences in pelvic incline and hip joint rotation still exist, an adult pattern of joint angles during the gait cycle is generally achieved by this stage (Keen, 1993). Toddlers also explore activities that involve stability skills (e.g. balancing and climbing) and object-control skills such as kicking, catching and throwing (Cliff, Reilly & Okely, 52 Chapter Two – Literature Review 2009). Studies involving direct observation and parental reports have described a wide variety of unstructured spontaneous activities performed by children younger than five years of age, including playing tag and “hide-and-seek”, dancing, riding a bicycle, wrestling, swinging, balancing on unsecured bars or ropes, climbing up and going down the slide, rolling and jumping on trampolines (Irwin et al, 2005; McIver et al, 2009; Oliver, Schluter & Schofield, 2009). Furthermore, children in the toddler years may also start taking part in structured activities, such as learning to swim and children’s gym programmes, along with other less structured (but guided) activity experiences such as movement of the body to music and different sounds (Irwin et al, 2005; Cliff, Reilly & Okely, 2009). Young children’s activity pattern during a day is typically sporadic and intermittent, consisting of short bursts of MVPA punctuated by periods of lower intensity PA, SB or rest (Bailey et al, 1995; Fulton et al, 2001; Cliff, Reilly & Okely, 2009; Dwyer, Baur & Hardy, 2009; Oliver, Schofield & Schluter, 2009). Daytime naps are common in this age group, lasting from 30 minutes to three hours (Cliff, Reilly & Okely, 2009). Children’s activity pattern also seems to vary across seasons (Carson & Spence, 2010; Rich, Griffiths & Dezateux, 2012), although the evidence for seasonal variation in young children (aged 2-6 years) is less clear, with contradictory results between studies (Fisher et al, 2005; Taylor et al, 2010; Carson & Spence, 2010; McKee et al, 2012; Rich, Griffiths & Dezateux, 2012). More research is needed in order to clarify if seasonality impacts all age groups independently of children’s location, if it has a varying degree of impact depending on the region of residence, or if seasonality impacts only in later childhood when children have more autonomy from their parents (Carson & Spence, 2010; Rich, Griffiths & Dezateux, 2012). 2.2.5.2. Physical Activity Levels of Preschoolers Despite the general assumption that young children are inherently active, recent research shows that preschool children may not be sufficiently active according to the various existing guidelines (Cardon & de Bourdeaudhuij, 2008; Tucker, 2008; Reilly, 2010; Bornstein et al, 2011). 53 Chapter Two – Literature Review In a systematic review of research on the PA levels of two to six year old children including 39 studies from seven different countries, Tucker (2008) concluded that only 54% of the children throughout the studies engaged in sufficient PA according to the US NASPE (2002) guidelines, defined by the author as 60 minutes or more of MVPA per day. However, the NASPE guidelines mention structured and unstructured PA while never addressing the intensity of PA. The studies included in the review assessed PA with a variety of objective and subjective methods, which increases the sources of bias and errors for the estimates. Consequently, the true compliance with the NASPE (2002) PA guidelines cannot be assessed from Tucker’s (2008) review, and it should only be concluded that nearly half of the participants seem to be accumulating <60 minutes of MVPA daily. For example, Vale et al (2010) have assessed the PA of 245 Portuguese children (aged 3.5–6 years) using the ActiGraph GT1M accelerometer, and reported an average of 123.9–143.8 minutes in PA per day (88.4–102.3 minutes in MVPA). Considering 120 minutes as the minimum recommended by the NASPE (2002) guidelines (i.e. 60 minutes structured plus 60 minutes unstructured play), 74.3% of children obtained enough daily PA (Vale et al, 2010). A more recent study using accelerometers with a nationally-representative sample of Canadian preschoolers found even higher rates of compliance with more current guidelines for the early years (Colley et al, 2013). Colley and colleagues (2013) reported that 3-4 year olds accumulated a daily average of 352 minutes of total PA, with 83.8% meeting the current guidelines of 180 minutes of PA per day. Studies from the UK report similar if not worse PA levels. Reilly et al (2004) have reported that three (n=78) and five year old (n=72) Scottish children typically spent 20– 25 minutes per day in MVPA, representing only an average of 2% and 4% of monitored time per day for three and five year olds respectively. In a larger sample (n=339), Kelly et al. (2006) reported that preschool children (mean=4.2 ±0.3 years) spent only a median of 3% (0-13%) of their days in MVPA. O’Dwyer et al (2011) have reported similarly low levels in 50 English preschoolers (mean age = 4.4 ±0.5 years) from Liverpool, with only 15–25% of normal weight children and none of the overweight children achieving the Department of Health’s (2004) PA guideline of at least 60 54 Chapter Two – Literature Review minutes of MVPA per day. However, these studies were conducted with samples constituted almost entirely of White British children aged three years or older, and information about children younger than three years of age and potential differences between ethnicities is lacking (Cardon, Van Cauwenberghe & de Bourdeaudhuij, 2011). The differences in the reported levels of PA and compliance rates may be due to the different interpretation of the PA guidelines, but also because of the difference in the methodology used to assess PA (e.g. objective versus subjective methods, or the protocol of PA data collection, cleaning and analyses) (Beets et al, 2011; Bornstein et al, 2011). The current UK PA guidelines for children younger than five years state that: 1) PA should be encouraged from birth, particularly through floor-based play and water-based activities in safe environments; 2) children able to walk unaided and who have not yet started school should be physically active daily for >180 minutes; and 3) should minimise the amount of time spent being sedentary (i.e. being restrained or sitting) for extended periods, except when sleeping (Department of Health, 2011). Although existing PA recommendations for young children may be useful to give parents/caregivers some guidance, their development has relied heavily on expert opinion and extrapolation from the knowledge about the relationship between PA and health in adults and older children (Reilly et al, 2009; Pate & O’Neill, 2012). The type, intensity, frequency and duration of PA required for healthy growth and development in children younger than five years is unclear (Reilly et al, 2009; Skouteris et al, 2012; Timmons et al, 2012). There is a need to develop PA guidelines that are based on empirical evidence (Reilly et al, 2009; Cardon, Van Cauwenberghe & de Bourdeaudhuij, 2011; Pate & O’Neill, 2012), to examine whether children are sufficiently active, to harmonise data collection internationally and enable a comparison of trends across countries (Cardon, Van Cauwenberghe & de Bourdeaudhuij, 2011; Skouteris et al, 2012). This can only be achieved with the use of objective, valid and reliable measurement tools that can be used across geographical locations and cultures. 55 Chapter Two – Literature Review 2.2.5.3. Influences on young children’s physical activity Young children’s PA levels can be influenced by a large variety of factors, which can be organised according to McLeroy and colleagues (1988) socio-ecological model (see figure 1 below). Although the latter was devised specifically for health promotion programmes, it can be interpreted and applied to children’s PA (Hinkley et al, 2008 and 2011; Dolinsky et al, 2011). Several modifiable and non-modifiable children’s characteristics (i.e. intrapersonal level) have been reported to influence young children’s PA levels. For instance, boys have repeatedly been reported to be more active than girls (Finn & Specker, 2002; Tucker et al, 2008; Hinkley et al, 2008 and 2011), although some recent studies have shown contrary results for young children (Cardon & De Bourdeaudhuij, 2008; Bornstein et al, 2011; Hnatiuk et al, 2012). Age has also been reported to influence PA levels (Hinkley et al, 2011), although a review of several studies has concluded that it may have no effect in the narrow range of the preschool years (Hinkley et al, 2008). Williams et al. (2008) have reported significant positive associations between 3-4 year olds’ motor skill performance and time spent on MVPA, but the cross-sectional nature of the data does not allow determining whether causality exists and in which direction it would happen (i.e. better motor skills making it easier for children to engage in PA, or more time spent in PA leading to improved motor skills). Other reported intrapersonal influences on young children’s PA levels include weight status (O’Dwyer et al, 2011) and personality, (Hinkley et al, 2011), although Hinkley et al’s (2008) review had found no evidence of these relationships. Differences in the sample characteristics (e.g. sample sizes, ethnic backgrounds, urban/rural locations), statistical analyses performed, and PA measurement methods and protocols are among some of the main factors that have contributed for the differences across studies. 56 Chapter Two – Literature Review Figure 1 - Diagram of the Socio-Ecological model applied to the influences on young children’s physical activity. Several interpersonal factors have also been investigated and reported to influence young children’s PA levels, ranging from siblings, friends, teachers and family. Because young children are dependent on the actions of the adults who care for them, parents are considered one (if not the) most important interpersonal influence on young children’s PA (Moore et al, 1991; Gustafson & Rhodes, 2006; Zecevic et al, 2010; Birch, Parker & Burns, 2011; Gubbels, van Assema & Kremers, 2013). Their influence is suggested to work through a variety of mechanisms, including their role as a facilitator for activities (e.g. providing resources and eliminating barriers to PA practice), parental support (e.g. encouragement), role modelling, and shared activities (Gustafson & Rhodes, 2006; Hills, King & Armstrong, 2007; NICE, 2009; Birch, Parker & Burns, 2011; Hinkley et al, 2011; Trost & Loprinzi, 2011). In an early study using accelerometers with 4-7 year old children and their parents, Moore et al (1991) reported that the offspring of active mothers and fathers (i.e. accelerometer counts per hour greater than the sample 57 Chapter Two – Literature Review median) were significantly more likely to be active than offspring of inactive parents, especially if both parents were active. However, a recent review has found contradictory results for the influence of parents’ PA and that of their preschool children (Trost & Loprinzi, 2011), with only 33% of the included studies reporting a positive association between parental and offspring’s PA. A more consistent body of evidence indicates that parental support is a significant positive influence on young children’s PA levels (Trost & Loprinzi, 2011; Gustafson & Rhodes, 2006). For example, after assessing the PA and potential parental PA correlates of 156 parent–child dyads from Australia, Loprinzi and Trost (2010) found that parental support was positively associated with their four year olds’ PA at home (proxy-reported), as well as parents' perceptions of competence positively associated with both home-based and objectively measured child care PA (all p<0.05). Nevertheless, there are studies reporting contrary results (Hinkley et al 2008), and there’s a lack of research regarding potential mediators and moderators in the relationship between parental correlates of children’s PA (such as parental education, occupation and ethnicity) (Gustafson & Rhodes, 2006). Although there has been an increase in the number of studies addressing the mechanisms of parental influences on young children’s PA, no consensus has yet been reached, because of the variety of measurement methods used, different statistical analyses, and contradictory results between studies (Trost & Loprinzi, 2011; Hinkley et al, 2008 Gustafson & Rhodes, 2006). Among the several influences at the institutional level, preschools and childcare centres are potential important influences on young children’s PA (Hinkley et al, 2008; Dowda et al, 2009; Trost, Ward & Senso, 2010; Gubbels, van Kann & Janssen, 2012), because of their unique position to offer children adequate opportunities for PA practice (Ward, 2010). For example, Finn, Johannsen and Specker (2002) objectively measured 214 children (aged 3-5 years) enrolled in 10 childcare centres from South Dakota, and found that the childcare centre was the highest individual predictor of children’s PA between 9 a.m. and 5 p.m., independently of child’s sex. A recent review by Trost, Ward and Senso (2010) reported that staff education, training and behaviour, and features of both 58 Chapter Two – Literature Review the indoor and outdoor play environment of childcare facilities (e.g. less children per square meter of play space, or hard play surfaces) do indeed influence preschooler’s PA. For example, a study with 2-3 year old Dutch children found that only 5.5% of the indoor PA observations were classified as MVPA, and the size of both the indoor and outdoor playing areas showing a significant positive association with children’s PA levels (Gubbels, van Assema & Kremers, 2013). Community factors such as the physical environment, security (e.g. traffic safety problems), social groups (e.g. availability of playgroups), and the climate can influence children’s PA levels (Hinkley et al, 2008). Existence of appropriate outdoors spaces, such as parks or playgrounds, are likely to influence children’s activity levels, since children who spend more time outdoors and live in areas with more green spaces have been found to be more active than those who spend more time indoors (Hinkley et al, 2008; Dolinsky et al, 2011). National regulations and policies play a key role in promoting and maintaining adequate levels of PA (WHO, 2008; Birch, Parker & Burns, 2011). So much so that, nearly a decade ago, the WHO (2004) called on nations across the world to develop detailed strategic plans to promote increased PA in its Global Strategy on Diet, PA and Health report. Given the importance of neighbourhoods and communities to provide children with opportunities for PA, establishing and effectively communicating recommendations about the amount and types of PA and SB that young children should be engaging in on a daily basis is useful to guide parents and all those responsible for childcare in providing children with adequate activity levels (WHO, 2004; NICE, 2009). Laws and policies also play a strong role on the opportunities available for young children to be physically active (Copeland et al, 2012; Pate et al, 2011). After focus groups conducted with 49 child care providers from Ohio, Copeland et al (2012) reported that stricter licensing codes designed to reduce children’s injuries on playgrounds rendered these spaces less physically challenging and interesting, which may in turn lead children to be less physically active. For example, given that several characteristics of the preschool environment have consistently been shown to be associated with an increased PA level, such as larger playground areas with lower density of children (Dowda et al, 2009; 59 Chapter Two – Literature Review Trost, Ward & Senso, 2010), governments could generate appropriate regulations regarding the minimum size of playground areas according to the capacity of preschools. 2.2.6. Sedentary Behaviour in Preschool Children The following sections will provide a description of the types and level of SB present in the preschool years, and what factors have been reported to influence SB in this age group. 2.2.6.1. Sedentary Behaviour levels Despite having a more limited body of evidence, published research suggests that habitual SB levels of children aged five years and younger are high (Reilly, 2008; Reilly, 2010; Birch, Parker & Burns, 2011; Tremblay et al, 2012b). A recent study by Colley and colleagues (2013) has reported that, while a high proportion of Canadian five year olds met the age-specific guideline of <2 hours of TV time per day (81%), only 18% of 34 year olds met their corresponding screen time recommendation of <1 hour per day. Furthermore, 3-4 year olds spent roughly 50% of their daily awake time (~348 minutes) engaged in SB, while only <10% of the awake time (~66 minutes) was spent in MVPA (Colley et al, 2013). Even higher SB levels have been reported for UK preschoolers. Reilly et al (2004) objectively assessed SB in a representative sample of three year old children from Glasgow, which they followed up after two years. Median proportion of time spent in SB at age three was 79%, and remained similarly high (76%) at age five (Reilly et al, 2004). Similar rates were reported in another study using accelerometers with 339 Scottish preschoolers (4.2 ±0.3 years), where on average 77% (53–93%) of awake time was spent in SB (Kelly et al, 2006). While there is a growing body of research investigating the SB levels of young children, this has been largely assessed through parental or teacher reports of time spent watching TV (LeBlanc et al, 2012; Lubans et al, 2011; Tremblay et al, 2012b), and mainly targeting three to five year old children (Cardon, Van Cauwenberghe & de Bourdeaudhuij, 2011). Studies assessing other forms of SB, and using direct measures to capture patterns and total SB in 60 Chapter Two – Literature Review children younger than three years of age are scarce (Reilly 2008; Cardon, van Cauwenberghe & De Bourdeaudhuij, 2011; Salmon et al, 2011; Tremblay et al, 2012b). It has been urged that future research assessing the levels of SB in young children should use valid, reliable and accurate measurement tools (Fulton et al, 2001; Reilly, 2008; Cardon, van Cauwenberghe & De Bourdeaudhuij, 2011; Hardy et al, 2013; Tremblay et al, 2012b), and harmonise the methodology of data collection in order to make comparisons among different regions and populations possible (Salmon et al, 2011). Public health guidelines for SB have mainly targeted the daily limit of TV viewing time (American Academy of Pediatrics, 2001; Salmon et al, 2011), which has led to much of the information available about the SB levels of young children being related to the prevalence of compliance with these TV viewing recommendations. For example, in a nationally representative sample of US children, Certain and Kahn (2002) have reported that between 17% and 48% of children aged three years or younger are already reported to watch more than two hours of TV per day. More recent guidelines from the USA, Canada, Australia and the UK also recommend the avoidance of prolonged periods of time spent sedentary (Department of Health, 2011), sometimes defined as more than one hour in continuous SB (Department for Health and Ageing, 2010; Tremblay et al, 2012b). However, these are widely based on experts’ opinions and limited existing cross-sectional data (Reilly et al, 2009), largely collected by proxy-report methods which have an inherent potential for high measurement error resulting from recall errors, misinterpretation and social desirability bias (Sirard & Pate, 2001; Reilly et al, 2009; Salmon et al, 2011; Hardy et al, 2013). Further, the lack of a definition for a “prolonged period of time” in the UK’s NICE (Department of Health, 2011) guidelines leaves much room for varying interpretations, making it impossible to assess true compliance with current SB guidelines. Consequently, this makes it hard to investigate the relationship between non-compliance and possible detrimental effects on young children’s health. Recent literature has repeatedly highlighted the need for research using objective and valid methods to describe young children’s SB (including total amount of time, frequency, and types of sedentary activities performed), and 61 Chapter Two – Literature Review investigating the longitudinal and dose-response relationships between children’s SB and health outcomes (Reilly et al, 2009; Chinapaw et al, 2011; Salmon et al, 2011; Tremblay et al, 2012b). 2.2.6.2. Influences on young children’s sedentary behaviour The structure of McLeroy et al’s (1988) socio-ecological model shown before in relation to PA (section 2.2.5.3.) can also be applied to the sources of influence on young children’s SB. Although there is a paucity of literature addressing the correlates of preschool children’s SB, Many of the same influencing factors presented in relation to PA also apply to SB (Hinkley et al, 2010; Birch, Parker & Burns, 2011; Cardon, van Cauwenberghe & De Bourdeaudhuij, 2011). Intrapersonal factors such as sex, age, motor skills and personality, have all been reported to influence children’s SB. For example, Byun, Dowda and Pate (2011) reported that child’s BMI z-score and athletic coordination were negatively associated with SB, controlling for possible confounders such as sex, PA equipment and TV viewing time. The same study found that girls were more sedentary than boys (p=0.05), with sex being a significant predictor of SB time (i.e. girls showing higher SB). However, much like the situation regarding PA, the influence of children’s sex on their SB levels is largely inconclusive (Hinkley et al, 2010). Where some studies have found that boys spent less time in SB (Byun, Downda & Pate, 2011; Dolinsky et al, 2011; Byun, Blair & Pate, 2013), others have found contradictory and inconsistent results (Certain & Kahn, 2002; Hinkley et al, 2010). Parents are also regarded as the main influence on young children’s SB (Birch, Parker & Burns, 2011; Cardon, van Cauwenberghe & De Bourdeaudhuij, 2011). Because parents are the main decision-makers regarding children’s daily schedule and routines, they can limit the amount of time children watch TV and decrease the time children spend restricted, for example in buggies or car-seats (Birch, Parker & Burns, 2011; Cardon, van Cauwenberghe & De Bourdeaudhuij, 2011; Salmon et al, 2011; Gubbels, van Assema & Kremers, 2013). Although evidence is still inconclusive (Hinkley et al, 2010), parental education also seems to play a strong role in children SB (Salmon et al, 2011). Looking at data from young children taking part in the US National Longitudinal 62 Chapter Two – Literature Review Survey of Youth, Certain & Khan (2002) found that the offspring of high school graduates were more than twice as likely as to exceed the American Academy of Pediatrics TV viewing recommendations than the offspring of college graduates at age six. Because a large proportion of children aged 2-5 years is enrolled in out-of-home childcare (McWilliams et al, 2009; Ward, 2010), preschools and childcare centres are one of the main organisational influences on young children’s SB. Using the Early Childhood Environment Rating Scale (revised edition), Dowda et al (2009) reported that children attending preschools classified as higher quality spent significantly less SB minutes per hour and lower use of electronic media. Similarly, Byun, Blair and Pate (2013) have compared the SB of children attending Montessori and traditional preschools in South Carolina (USA). Montessori preschools have a unique approach to children’s education, where children are allowed to move about freely and provided with self-chosen/directed activities for at least two thirds of attending hours, which likely provides more opportunities for PA and consequently reducing SB time (Byun, Blair & Pate, 2013). The authors found that children attending Montessori preschools spent less time in SB than those attending traditional preschools during both the in-school and after-school periods, as well as during the total day, independently of several covariates (e.g., sex, ethnicity, parent education and child’s participation in after-school sports programmes) (Byun, Blair & Pate, 2013). Although many social and physical environmental characteristics have been generally overlooked and poorly investigated (Hinkley et al, 2010), some community factors have been reported to influence young children’s SB (Birch & Burns, 2011). In a crosssectional survey in 20 large US cities, Burdette and Whitaker (2005) found that children living in neighbourhoods in the lowest neighbourhood safety tertile (perceived by the mother) watched significantly more TV and were significantly more likely to watch TV >2 hours/day than those living in the upper two tertiles. These differences remained significant even when adjusting for household income, mothers’ education, ethnicity, age, and marital status (Burdette & Whitaker, 2005). 63 Chapter Two – Literature Review Most of the same political level factors and national strategies used to promote PA are also applicable to promoting a reduction of SB (Birch, Parker & Burns, 2011). For example, if the significantly low level of objectively-measured SB among children from Montessori preschools is due to their unique curriculum and allowing children to freely move about during school hours (Byun, Blair & Pate, 2013), national preschool curricula could be adapted accordingly in an attempt to promote a reduction of young children’s SB. 2.3. Assessment of Physical Activity and Sedentary Behaviour in Young Children Because of its complex and multidimensional nature, no single assessment method currently exists that captures and describes every aspect of PA or SB (Trost, 2007; McClain & Tudor-Locke, 2008; Dollman et al, 2009; Warren et al, 2010; Atkin et al, 2012; Hardy et al, 2013). PA and SB can be assessed using subjective and/or objective methods. These methods measure either single or multiple dimensions of these behaviours, and vary widely in the level of participant and researcher burden, and associated costs (Esliger &Tremblay, 2007; McClain & Tudor-Locke, 2008; Reilly et al, 2008; Pate, O’Neill & Mitchell, 2010; Loprinzi & Cardinal, 2011; Lubans et al, 2011; Butte, Ekelund & Westerterp, 2012; Hardy et al, 2013). Until recently, both PA and SB in children have been traditionally assessed by subjective self- or proxy-report measures (Kohl, Fulton & Caspersen, 2000; Fulton et al, 2001; Ward et al, 2005; Reilly et al, 2008; Loprinzi & Cardinal, 2011). Due to their low cost, convenience of administration and low participant burden (Trost, 2007; Loprinzi & Cardinal, 2011; Hardy et al, 2013), the vast majority of epidemiological research into the relationship of PA, SB and health has relied on these subjective measures (Sallis, 1991; Cliff, Reilly & Okely, 2009). Self- or proxy-report measures include questionnaires (e.g. International PA Questionnaire), recalls (e.g. Previous Day PA Recall) or diaries (e.g. Bouchard 3-day PA record). Because of its complexity, PA and SB are extremely hard to quantify using recall methods, and these difficulties are even more exacerbated when studying children (Sirard & Pate, 2001; Boreham & Riddoch, 2011). Because young children are unable to recall and report their own activity behaviours, their PA and SB 64 Chapter Two – Literature Review have typically been assessed by parental or teacher proxy-report (Trost, 2007; Pate, O’Neill & Mitchell, 2010; Loprinzi & Cardinal, 2011). These subjective measures have several limitations, such as difficulty in accurately recalling the duration and frequency of PA and SB’s, distinguishing between different intensities of PA, cultural dependence, the risk of social-desirability bias and parent’s lack of knowledge about children’s activity while they attend day care (Fulton et al, 2001; Sirard & Pate, 2001; Baranowski et al, 2004; Warren et al, 2010; Hallal, Matsudo & Farias, 2012; Atkin et al, 2013). Additional problems with the interpretation of questions or knowledge about PA and SB related expressions (e.g. “moderate-tovigorous” or “leisure time”) are also possible (Ainsworth et al, 2012; Arredondo et al, 2012). These problems are exacerbated in migrant populations, with a different culture and a language that is not that of the questionnaires or interviews, when the latter have not been carefully translated and culturally adapted (Arredondo et al, 2012; Atkin et al, 2013). All these issues increase measurement error, which can lead to inaccurate estimates of PA and SB, underestimate effect sizes, bias study results (e.g. attenuate or underestimate relationships between PA/SB and health) (Atkin et al, 2013), and lead to incorrect conclusions (Baranowski et al, 2004; Warren et al, 2010; Ainsworth et al, 2012; Arredondo et al, 2012). The accurate and reliable measurement of PA and SB is critical in order to understand their determinants, the dose-response relationship between PA/SB and NCDs as well as its risk factors, accurate surveillance and trends, and investigate the impact of interventions involving the reduction of SB and increase in PA of children (LaPorte, Montoye & Caspersen, 1985; Kohl, Fulton & Caspersen, 2000; Sirard & Pate, 2001; Baranowski et al, 2004; Dollman et al, 2009; Warren et al, 2010; Loprinzi & Cardinal, 2011; Atkin et al, 2012). This has highlighted the need for the development of objective measurement methods (Fulton et al, 2001; Sirard & Pate, 2001; Ward et al, 2005, McClain & Tudor-Locke, 2008), which are more accurate, valid and reliable than subjective measures (Kohl, Fulton & Caspersen, 2000). 65 Chapter Two – Literature Review The following sections will review the relevant literature describing objective measures of both PA and SB that have been used in young children. 2.3.1. Objective Measurement of Physical Activity in Young Children Several methods are considered to provide objective measures of PA. Some methods measure physiological parameters (e.g. heart rate (HR) or EE), others measure movement or mechanical parameters (e.g. number of steps or acceleration), some measure the type of PA (e.g. intensity of PA or description of activity performed) and/or the context (e.g. indoor/outdoor or structured/unstructured activity), and some methods measure a combination of both physiological and movement parameters (e.g. heart rate and acceleration). Each method presents strengths and limitations that need careful consideration and no single method will be optimal for all situations (Trost, 2007; McClain & Tudor-Locke, 2008; Dollman et al, 2009; Loprinzi & Cardinal, 2011). Selection of a PA measurement tool should be based primarily on the scope and aims of the study and which method provides the information required to address these. Nevertheless, there will always be a trade-off between practicality (age and size of sample), availability of resources (both human and economic), participant burden, and validity and reliability when it comes to selecting a PA measurement tool for use with young children (Kohl, Fulton & Caspersen, 2000; McLain & Tudor-Locke, 2008; Dollman et al, 2009; Warren et al, 2010; Loprinzi & Cardinal, 2011; Butte, Ekelund & Westerterp, 2012). The main objective PA measurement methods used with young children are listed and described below. 2.3.1.1. Calorimetry Calorimetry is considered by many as one of the gold standards for the assessment of PA (Sirard & Pate, 2001; Trost, 2007; Pate, O'Neill & Mitchell, 2010; Bassett, Rowlands & Trost (2012), and it has been widely used to validate other PA measurement methods 66 Chapter Two – Literature Review in children (Puhl et al, 1990; Welk, 2005; Pate et al, 2006; Tanaka et al, 2007; Evenson et al, 2008; Takken et al, 2010). Calorimetry measures EE, and is based on the concept that total EE (TEE) in humans consists of three components: 1) basal metabolic rate (BMR), which is the energy expended when an individual is lying down in complete rest in the morning, in the postabsorptive state; 2) the thermal effect of food, which is the increase in EE associated with the digestion of food, absorption and storage of nutrients; and 3) activity thermogenesis, which is the EE resulting from PA (Levine, 2005; Haugen, Chan & Li, 2007). Each of the latter EE components is highly variable, and it is the summed effect of these variances which accounts for the between-individuals variability in daily EE (Levine, 2005). There are two types of calorimetry: 1) Direct calorimetry, which is the quantification of TEE through direct measurement of heat produced by the body; and 2) Indirect calorimetry, whereby EE is calculated from the amount of O2 consumed and/or the amount of CO2 produced by the body (Levine, 2005; Haugen et al, 2007). Research on energy metabolism can be traced back to S. Laplace’s work applied to heat conduction (i.e. steady-state heat equation), and A. Lavoisiers’ classical experiments in the 1780’s and 1790’s, where the latter sought to prove that respiration generated body heat through the use of the first built calorimeter with animals and burning charcoal, and 10 years later with the first respiration calorimeter ever used on mankind (Henry, 2005; Frankenfield, 2010). However, the site of heat production and the presumed chemistry processes were wrong (i.e. O2 was directly converted to CO2 in the lungs), and there was still a 10% gap between heat production and O2 consumption (Frankenfield, 2010). Closed circuit respiration chambers for the study of human gas exchange first appeared in 1843, and the first rudimentary calorimeter chamber was built in 1849 (Frankenfield, 2010). But it wasn’t until the last decade of the 19th century that M. Rubner and W. Atwater achieved a 99.4–99.7% agreement between directly measured heat production 67 Chapter Two – Literature Review and that calculated from gas exchange (Frankenfield, 2010). At the same time, the conditions defining resting state were outlined by N. Zuntz, which remain the standard to which metabolic rates are compared to in health and disease studies until the present day (Frankenfield, 2010). Calorimetry was initially only applied for nutrition science in clinical settings, for the diagnosis of hypo- and hyperthyroidism (Henry, 2005). After the early 20th century findings of J. Haldane and J. B. Weir, who devised equations to calculate inspired gas volume outside of a chamber and metabolic rate from total CO2 production and O2 consumption respectively (Frankenfield, 2010), and the design of simple and portable devices like the Benedict-Roth spirometer (Henry, 2005), it was possible to use calorimetry outside of purposely built cameras. The applicability of this method was subsequently spread to various other areas, such as the measurement of EE to assess PA in free living individuals (with indirect calorimetry) (Levine, 2005), and the calibration of recently developed PA measurement methods such as accelerometers (Pate et al, 2006; Evenson et al, 2008; Takken et al, 2010). The main advantage of calorimetry, be it direct or indirect, is that it provides an accurate, reliable and valid measure of EE (Sirard & Pate, 2001), provided the protocol is correctly followed (Haugen, Chan & Li, 2007). Due to the high cost, and participant and researcher burden, calorimetry is usually deemed as an unviable method for the assessment of preschool children’s PA in larger public health surveillance and intervention studies (Kohl, Fulton & Caspersen, 2000; Fulton et al, 2001). For example, portable indirect calorimetry requires the use of a telemetry unit connected to the mouth piece or mask, which is usually worn at the back or waist – whilst in adults this may not be very bothersome, the size and weight of the telemetry unit in relation to young children’s bodies will likely impose a significant additional physical effort, and make it highly burdensome for children (Sirard & Pate, 2001). Because direct calorimetry requires the individual to be enclosed in the measurement chamber, and indirect calorimetry requires the individual to wear a tight-fitting mouth piece or mask (Matarese, 1997) which does not allow the intake of food or liquids, calorimetry is not feasible for long-term measurements of activity in free-living individuals. 68 Chapter Two – Literature Review Accurate measurement of EE with indirect calorimetry requires the achievement of a steady state in O2 and CO2 exchange (Matarese, 1997; Levine, 2005; Haugen, Chan & Li, 2007), which is hard to achieve with very young children (Rowlands, Eston & Ingledew, 1997). The measurement of resting EE also needs to occur under standardised conditions and follow a strict protocol (e.g. fasting for at least five hours and no exercise for at least four hours prior to the measurement); failure to do so will result in highly variable and inaccurate measurements (Haugen, Chan & Li, 2007). These conditions are difficult to obtain outside of clinical settings, and especially challenging to perform with young children. Calorimetry devices do not provide information about the type (e.g. structured or unstructured) or context of PA, and direct calorimetry even restricts the PA to the “artificial” environment of a closed chamber. Its use is, therefore, not appropriate in studies for which those PA traits are relevant for the research aims. Further disadvantages for large-scale studies include the costs associated with the regular maintenance of the equipment, and the necessary training and/or hiring of specialised staff (Haugen, Chan & Li, 2007). 2.3.1.2. Doubly Labelled Water Considered by many as a gold standard (Kohl, Fulton & Caspersen, 2000; Sirard & Pate, 2001; Trost, 2007; Loprinzi & Cardinal, 2011), the doubly labelled water (DLW) technique measures total daily EE, and can be used to estimate total EE resulting from PA when combined with the measurement of resting EE by another method, such as indirect calorimetry (Schoeller, 1988; Goran, 1994). The DLW method is based on the kinetics of the 2H2O (deuterium-labeled water) and H2 18O (oxygen-18-labeled water) stable isotopes, which are naturally occurring compounds without known toxicity or sideeffects at the low doses currently used (Goran, 1994). Individuals are given DLW to ingest after baseline collection of urine, saliva or blood samples, time is then allowed for the complete mixing of the isotopes within the body’s water space, and samples of urine, saliva or blood are subsequently collected over 7–21 days (Levine, 2005). The concentrations of the two isotopes are measured in these samples, and the difference in 69 Chapter Two – Literature Review the rate of loss between these isotopes is a function of the production rate of CO2 (Goran, 1994), allowing EE to be calculated (Levine, 2005). Several assumptions underlie this method: 1) the pool size of body water does not change (i.e. no expansion or contraction of total body water occurs during the study period); 2) there is no exogenous addition of extra isotopes during the study period (i.e. level of the 2H2O and H2 18O isotopes in the diet remain constant); 3) the rate of water loss and CO2 production is constant from day to day; 4) the 2H2O and H2 18O isotopes have the same chemical and physical properties as those found in the most abundant form of water (H2O); and 5) the stable isotope 2H2O is lost only through loss of body water, and H2 18O is lost only through water loss and CO2 production (Goran, 1994). It is well known that some of these assumptions are violated in human studies (Schoeller, 1988; Goran, 1994), although several modelling refinements have been introduced to take these into account (Schoeller et al, 1986; Speakman, Nair & Goran, 1993). The technique was first introduced in 1949 by Lifson and colleagues, and used through the 1950’s as a technique to measure the production rate of CO2 in small animals (Schoeller, 1988). Because of the relatively poor sensitivity of isotope ratio mass spectrometry at that time, the cost associated with the dose required made its use unfeasible in humans (Goran, 1994). Only in the 1970’s, Lifson et al. (1975) described the feasibility of applying the technique to humans, with the use of lower doses of the isotopes, making it feasible to use with humans. The DLW is a precise, unobtrusive and non-invasive method to measure children’s total daily EE in free-living conditions (Schoeller, 1988; Goran, 1994; Kohl, Fulton & Caspersen, 2000), allowing the participants to maintain their usual lifestyle (Kohl, Fulton & Caspersen, 2000). It is a reliable method (Fulton et al, 2001) that has been validated in adults and young children against indirect calorimetry (Schoeller et al, 1986; Jones et al, 1987; Trost, 2007), with reported accuracy within 5 - 10% (Goran, 1994). However, the high costs and inherent participant and researcher burden related to the collection of multiple urine or blood samples and visits to the laboratory, make this method impossible to use in large population-based studies (Kohl, Fulton & Caspersen, 70 Chapter Two – Literature Review 2000; Fulton et al, 2001; Sirard & Pate, 2001). Additionally, the DLW method is hardly feasible for use with very young children who may not yet have voluntary bladder control and still wear nappies (Fulton et al, 2001), which makes the complete collection of urine samples extremely challenging. Another limitation of this method is that it does not provide indication of patterns of PA or EE (Kohl, Fulton & Caspersen, 2000; Trost, 2007) or about the context of PA. Consequently, other parameters of PA such as the duration, intensity and frequency of MVPA, the structured or unstructured nature of PA, which may be the variables of interest, cannot be assessed (Sirard & Pate, 2001). 2.3.1.3. Heart Rate Monitoring Considered by some as the first widely used objective method to measure PA in children (Rowlands & Eston, 2007), HR monitoring can be used with preschool-aged children (DuRant et al, 1992; Jago et al, 2005; Pate, O’Neill & Mitchell, 2010) to provide information about the intensity, frequency and duration of PA (Sirard & Pate, 2001; Loprinzi & Cardinal, 2011). HR devices consist of a transmitter and a receiver, where children typically wear a HR transmitter on a elastic belt or two electrodes attached to the chest, and a receiver unit which continuously records children’s HR at specific timeintervals (e.g. minute-by-minute) for a determined period of time (DuRant et al, 1992; Kohl, Fulton & Caspersen, 2000; Achten & Jeukendrup, 2003; Dollman et al, 2009). HR monitoring with devices can be traced back to the invention of the stethoscope by R. Laenec in the 19th century (Achten & Jeukendrup, 2003), which made it possible to listen to heart beats more accurately but did not enable the accurate assessment of HR variability during PA. The invention of the electrocardiograph by W. Eithoven in 1887 made it possible to record the electrical activity of the heart (Holter, 1961; Achten & Jeukendrup, 2003). However, the large size of the instruments and the amount of leads that connected the subject to the instrument made it unsuitable for use in studies with active subjects and out of laboratory settings (Holter, 1961; Achten & Jeukendrup, 2003). 71 Chapter Two – Literature Review With the advent of radio-electrocardiography in the 1940’s and 50’s, and the development of the Holter-monitor (Holter, 1961), it was finally possible to make a continuous recording of an individual’s heart activity in free-living conditions and for a prolonged period of time (Achten & Jeukendrup, 2003). The need for a relatively large control box, the cost and complexity of the Holter-monitor made it unsuitable for use during exercise in all conditions (Laukkanen & Virtanen, 1998; Achten & Jeukendrup, 2003). The first wireless HR monitor (the Polar PE 2000) was developed by the University of Oulu (Finland) and introduced in 1983, consisting of a watch-like receiver and a transmitter that could be attached to the chest using either disposable electrodes or an elastic electrode strap (Laukkanen & Virtanen, 1998). Initially targeted for coaches and athletes, HR monitors soon started to be used by exercise scientists and, by the late 1980’s, HR monitors were being used with children, in both laboratory and field settings (Laukkanen & Virtanen, 1998). HR is considered to be a valid and reliable (albeit indirect) objective measure of PA (Rowlands & Eston, 2007). Because devices continuously record HR at short time intervals, it allows for the assessment of both total PA and the patterns of activity (i.e. time spent in different PA intensities) (Sirard & Pate, 2001). Additional advantages of the HR assessment method are the possibility of prolonged data collection with low participant and researcher burden, with unobtrusive and waterproof devices (Rowlands, Eston & Ingledew, 1997; Sirard & Pate, 2001; Loprinzi & Cardinal, 2011). In addition, its relatively low cost makes HR monitors feasible for small to moderate size studies (Rowlands, Eston & Ingledew, 1997; Sirard & Pate, 2001; Loprinzi & Cardinal, 2011). This method assumes a linear relationship between HR and increasing PA and resulting O2 consumption, whereby an increase in O2 consumption will correspond to a proportionate increase in HR (Sirard & Pate, 2001; Pate, O’Neill & Mitchell, 2010). However, this relationship is not as robust at lower HR’, where it is influenced by factors other than movement, such as age (Pate, O’Neill & Mitchell, 2010), body size (Trost, 2007), psychological stimuli, environmental stresses (Sirard & Pate, 2001), cardiorespiratory fitness (Rowlands, Eston & Ingledew, 1997; Loprinzi & Cardinal, 2011) and the type of muscular contractions (Rowlands & Eston, 2007). To account for the 72 Chapter Two – Literature Review problems associated with the prediction of EE at low HR, investigators have used a “flex” HR approach (Trost, 2007). This approach assumes that any registered HR below a pre-determined threshold is considered as resting EE and an individual HR-EE regression equation is used to predict EE above this threshold. Because the individual calibration needed is so labour intensive, the use of this flex HR technique is limited (Rowlands & Eston, 2007) and impractical for large scale studies. Further limitations of HR are that its relationship with EE resulting from PA becomes nonlinear at higher intensities (Pate, O’Neill & Mitchell, 2010), the activation of different muscle groups can cause different HR responses (e.g. although the EE of leg exercises is greater than arm exercises, HR response is greater for the latter) (Freedson, 1991; Rowlands, Eston & Ingledew, 1997), and the delay in HR response after movement occurs or stops (Trost, 2007; Loprinzi & Cardinal, 2011). This delay in HR response is especially significant in young children, because it may mask the intermittent pattern characteristic of their PA (Rowlands, Eston & Ingledew, 1997; Trost, 2007; Loprinzi & Cardinal, 2011). Other practical limitations for the use of HR monitors with 2-3 year old children include discomfort caused by the direct contact of the electrode pads with the skin, the possibility of allergic skin reaction to the electrode pads, and children pulling off or fiddling with the device (Costa, et al, In Press). Akin to calorimetry and DLW, because HR devices do not provide information about the context (e.g. outdoors or indoors) or type (e.g. structured or play) of PA, the method is not useful for studies in which these two PA dimensions are relevant for the research aims. 2.3.1.4. Direct Observation Direct observation consists of the recording of the PA behaviour of a child by a trained observer, during a predetermined time period and following a pre-set coding system, where specific codes that correspond to characteristics of the PA behaviour are recorded (Trost, 2007; Pate, O’Neill & Mitchell, 2010). Observational techniques were developed by behavioural scientists as an approach to the monitoring of PA (LaPorte, Montoye & Caspersen, 1985), and used in the study of several health issues in preschool children, such as hyperactivity (Goggin, 1975). This method can provide 73 Chapter Two – Literature Review extensive information about a child’s PA, including PA intensity (e.g. light or vigorous), type (e.g., running or jumping), environmental context (e.g., what equipment is used), social context (e.g., who is interacting with the child), location (e.g., indoors or outdoors), and prompts (e.g. encouragement from others), or a combination of all the previous (Pate, O’Neill & Mitchell, 2010). Several direct observation systems have been validated against other physiological or mechanical measures of PA, such as indirect calorimetry (Puhl et al, 1990) and accelerometers (Finn & Specker, 2000; Ridgers, Stratton & McKenzie, 2010), and are considered by some as a gold standard for the assessment of PA in children (Sirard & Pate, 2001; Van Cauwenberghe et al, 2011; Trost et al, 2012). The Children’s Activity Rating Scale (CARS) (Puhl et al, 1990) and Children’s PA Form (CPAF) (O’Hara et al, 1989), which measure only PA intensity, have been extensively used with young children (Reilly et al, 2003; Sirard et al, 2005; Pate et al, 2006; Pate, O’Neill & Mitchell, 2010; Loprinzi & Cardinal, 2011; Trost et al, 2012). The CARS system (Puhl et al, 1990) categorizes PA of a child into five intensity levels: 1) stationary with no movement, such as laying or sitting still while watching TV; 2) stationary with limb movement, such as seated puzzle building or throwing balls; 3) slow/easy translocation, such as walking or crawling slowly; 4) moderate translocation, such as walking at a faster pace or climbing on monkey bars; and 5) fast translocation, such as running or jumping continuously. The CPAF (O’Hara et al, 1989) is also based on the intensity of PA, but has only four categories: 1) stationary with no movement; 2) stationary with limb movement; 3) slow trunk movement; and 4) rapid trunk movement. One example of a more comprehensive direct observation tool is the Observational System for Recording Activity in Children – Preschool Version (OSRAC-P) developed by Brown et al. (2006), which measures the intensity, type and context of preschoolers’ PA. Specifically, the observer registers data about: 1) PA intensity, following the CARS classification system; 2) PA type (e.g. climb, jump or roll); 3) location of PA (e.g. inside or outside of the preschool building); 4) indoor activity context (e.g. being in an area for art activities, or engaging in TV viewing) ; 5) outdoor activity context (e.g. engaging in activity on fixed playground equipment, or being in an outside eating area); 6) activity 74 Chapter Two – Literature Review initiator (e.g. activity was initiated by an adult or a peer); 7) composition of the group (e.g. solitary or one-to-one activities with a peer); and 8) prompts (e.g. no prompts or teacher prompt to increase/decrease PA) (Brown et al, 2006). Such a tool would be useful, for example, in studies that require contextual information about children’s PA to address their research question (e.g. are young children more active in the outdoor or indoor areas of preschools?). Direct observation is considered to be a valid and reliable tool to directly measure PA in young children (Trost, 2007), when observers are well trained and follow a specific protocol (Loprinzi & Cardinal, 2011). The main advantages are the feasibility of use in many different contexts (e.g. free living or laboratory settings), the ability to capture short duration patterns and sudden changes in PA, which is crucial when studying young children, and the ability to provide a richness of data about the type and context of PA, which cannot be recorded by other objective methods that measure only physiological or mechanical parameters of PA (e.g. indirect calorimetry or accelerometers, respectively) (Rowlands, Eston & Ingledew, 1997; Sirard & Pate, 2001; Trost, 2007; Pate, O’Neill & Mitchell, 2010; Loprinzi & Cardinal, 2011). These features make direct observation useful and adequate as a validation criterion for other PA measurement instruments (LaPorte, Montoye & Caspersen, 1985) for use with young children, such as pedometers (Oliver et al, 2007) and accelerometers (Puhl et al, 1990; Reilly et al, 2003; Sirard et al, 2005; Pate et al, 2006; Trost et al, 2012). However, this method also has several limitations that deserve careful consideration. The relatively high burden for the researchers in the observer role may make it unfeasible to use in larger scale studies, due to potentially high costs with observer hours, insufficient staff resources or time restrictions of the project (Sirard & Pate, 2001). Training of the observers is also burdensome and time-consuming, and refresher training and regular inter-observer reliability tests are needed for studies using multiple observers (Pate, O’Neill & Mitchell, 2010). Reactivity of the study participant to the presence of the observer is possible (LaPorte, Montoye & Caspersen, 1985; Sirard & Pate, 2001; Oliver, Schofield & Kolt, 2007; Trost, 2007), and has been reported in children as young as 5 years of age (Puhl et al, 1990). Additionally, it is likely that only a 75 Chapter Two – Literature Review select group of individuals would volunteer and consent to being continually observed (LaPorte, Montoye & Caspersen, 1985), which would introduce bias into the results. Since having an observer follow a child since wake-up time until bed time is unfeasible in free-living situations (McNamara, Hudson & Taylor, 2010), direct observation does not allow the continuous assessment of PA throughout full days. Nevertheless, direct observation systems have been used extensively as criterion measures in the validation of other tools to assess PA (Sirard & Pate, 2001; Sirard et al, 2005; De Bock et al, 2010; Van Cauwenberghe et al, 2011; Trost et al, 2012). 2.3.1.5. Pedometers Pedometers are motions sensors that record the number of steps taken by an individual over a period of time (Sirard; 2001; Bassett & Strath, 2002; McClain & Tudor-Locke, 2008). Pedometers are believed to have been invented in the 1400’s by Leonardo da Vinci, whose sketches illustrate the principle behind the mechanical pedometer (GibbsSmith, 1978, cit. Bassett & Strath, 2002). Early mechanical pedometers worked on a ratchet and gear system, and were mainly used to measure land (Bassett & Strath, 2002). In the 1960’s, researchers gained interest in pedometers as a potential tool to measure habitual PA in free-living populations, but the variation in spring tension and friction involved in the moving gears of early mechanical pedometers limited their validity for research purposes (Bassett & Strath, 2002). A new generation of more accurate electronic pedometers was developed in the 1990’s (Bassett & Strath, 2002), and most of the devices currently used for research operate through either a spring lever mechanism or a piezo-electric accelerometer (Clemes & Biddle, 2013). Spring-lever mechanisms comprise a spring suspended horizontal lever arm which moves up and down in response to the vertical accelerations of the hip; this movement opens and closes an electrical circuit, and a step is registered each time the lever arm makes an electrical contact (Crouter, Schneider & Bassett, 2005). The piezo-electric mechanism consists of a horizontal cantilevered beam bearing a weight at the end; when subjected to acceleration, this weight compresses a piezo-electric crystal which generates a voltage proportional to the acceleration, and these oscillations in voltage 76 Chapter Two – Literature Review are used to record steps (Crouter, Schneider & Bassett, 2005). Most models are worn at the waist level with the help of an elastic belt or a clip, and contain a digital display showing the amount of steps accumulated (Bassett & Strath, 2002). Simpler models provide only information about the number of steps performed, while others give the user the option of inputting step length and body mass which allows the pedometer to also provide information on the estimated distance travelled and/or energy expended, respectively (Bassett & Strath, 2002). However, the validity of these features has been questioned, and it has been recommended that pedometers are only used to count steps (Clemes & Biddle, 2013). Depending on the memory capacity of the device, some pedometers can store up to seven days of recorded step count data. Pedometers are considered to provide an objective, valid and reliable measurement of overall PA (Rowlands, Eston & Ingledew, 1997; Rowlands & Eston, 2007; McNamara, Hudson & Taylor, 2010; Loprinzi & Cardinal, 2011), in children as young as five years of age (Clemes & Biddle, 2013). Due to their small size, ease of use, unobtrusive nature and intuitive interpretation of the standardised “steps-per-day” unit, pedometers have become a practical tool that has been increasingly used for the measurement of PA in children (Rowlands, Eston & Ingledew, 1997; Rowlands & Eston, 2007; Dollman et al, 2009; Tudor-Locke et al, 2009; Loprinzi & Cardinal, 2011; Clemes & Biddle, 2013). The low cost associated with purchase and maintenance, together with all the previously highlighted advantages, makes pedometers a useful tool for large-scale studies where total volume of daily PA is the outcome of interest (Rowlands, Eston & Ingledew, 1997; Trost, 2007; Tudor-Locke et al, 2009; Loprinzi & Cardinal 2011). However, because pedometers only provide information on the relative volume of steps taken over a large time period (usually per day), they are not suitable for studies with research questions that need information about the intensity or pattern of PA (McClain & Tudor-Locke, 2008; Trost, 2007). Pedometers are also insensitive to capture certain activities such as cycling or upper-body movement (Rowlands, Eston & Ingledew, 1997; Loprinzi & Cardinal, 2011), and unsuitable for water-based activities (Dollman et al, 2009). Although pedometers have been considered as valid and reliable measures of PA in children older than five years of age (Trost, 2007; Loprinzi & Cardinal, 2011; Clemes & 77 Chapter Two – Literature Review Biddle, 2013), studies with preschool children have reported that pedometers may not be sufficiently accurate for research purposes with such young children (Oliver et al, 2007). Differences of 40–64% have been found between observer-recorded and pedometer-recorded number of steps during a 29 meter walk in a straight line, in children aged 4.1 (±0.6) years old (Oliver et al, 2007). The immature walking patterns (Keen, 1993) may have an influence on the ability of pedometers’ sensors to acknowledge and accurately register stepping in such young children (Oliver et al, 2007). Pedometers may be compatible with most daily activities in older children, which are based on ambulatory movement (i.e. walking and running). Their use for registering PA in younger children, however, is likely to be more limited, due to their frequent engagement in other activities such as climbing, rolling, riding a tricycle or wrestling (Irwin et al, 2005; McIver et al, 2009), to which pedometers will be insensitive to. 2.3.1.6. Accelerometers Accelerometers have become the preferred method for the assessment of PA in young children (Pate, O’Neill & Mitchell, 2010; Loprinzi & Cardinal, 2011), as shown by the dramatic increase in the number of published studies using this method since 2001 (Rowlands, 2007; Cain et al, 2013). Accelerometers are devices that measure the acceleration of body movements (Chen & Bassett, 2005; Rowlands, 2007). The invention of such a device for the measurement of PA can be traced back to the late 1950’s, when J. L. Shulman and J. M. Reissman modified a self-winding calendar wristwatch by removing the parts of the timing mechanism, resulting in a device that records acceleration and deceleration of body movements (Maccoby, Dowley & Hagen, 1965) – the actometer. The waving weight that is left on the modified watch acts as a pendulum that moves clockwise and counter-clockwise about its axis, in response to the acceleration-deceleration of body movements (Johnson, 1971). This movement is transmitted by gears to the minute and hour indicators of the actometer, and the amount of movement can then be read in minutes and hours and noted down by the researcher (Johnson, 1971). It was used by many researchers from the 1960’s until early 1980’s in studies investigating hyperactivity (Barkley & Ullman, 1975), personality and 78 Chapter Two – Literature Review socialization (Buss, Block & Block, 1980) and cognition (Maccoby, Dowley & Hagen, 1965; Loo & Wenar, 1971; Buss, Block & Block, 1980) in preschool children. Although it showed a significant correlation (p≤0.01) with O2 consumption, the uneven sensitivity to different planes of movement and intensity of acceleration, differences in readings resulting from variations in the positioning of the device, and high inter- and intrainstrument variability made the actometer an unreliable measure of activity (Johnson, 1971). McPartland et al. (1976a) later developed and tested the two first electronic devices created specifically for the measurement of PA. The first device was a Frquency Model (FM) transmitter, consisting of a telemetric sensor encased with batteries in a 2.0 x 2.0 x 4.0 cm epoxy case, worn on the non-dominant wrist, which transmits waves to the antenna of the receiver unit (McPartland et al, 1976a). The receiver unit sends the waveform through a trigger, resulting in a square wave for each detected frequency deviation and each frequency deviation indicates a movement. The number of square waves, or counts, was then stored in digital format at 15 minute intervals into a magnetic tape cassette. Although this device allowed the prolonged monitoring of activity from inpatients, because of the restricted transmitting range (100 feet) dictated by power consumption and frequency of operation, it was not feasible for use in freeliving situations (McPartland et al 1976a). The second device, the Large-scale Integrated Motor Activity Monitor (LSI), is a small electronic device encased in a 3.8 x 4.5 x 2.2 cm waterproof plexiglas unit (weight = 51 grams), containing a large-scale-integrated circuitry that scales, counts, decodes and displays the motor movements (i.e. counts) in a single plane detected by a small mercury switch (McPartland et al, 1976a). Every 16 closures of this mercury switch produces an increment on the internal counter by one unit (LaPorte et al, 1979) and the number of counts accumulated is shown on a 4-digit light-emitting-diode (i.e. LED) red display, which is activated by placing a magnet close to the device (McPartland et al, 1976a). The LSI was worn at the hip (Freedson, 1991), wrist or ankle using a watchband, and battery life lasted around seven days (McPartland et al, 1976a). Because of the apparent high association with EE (indicating good accuracy) and ease 79 Chapter Two – Literature Review of use with free-living adults, LaPorte et al (1979) concluded that the LSI fulfilled the criteria for an objective measure of PA that could be used in epidemiological research. Although it showed a marked improvement from the actometer in terms of accuracy and reliability, the LSI still required the subject to record the activity counts for free-living PA assessment (McPartland et al, 1976a). In addition, the display automatically reset to zero after reaching 9999 counts and battery life was limited to less than one week (LaPorte et al, 1979). Studies with children indicate only low to moderate correlations of LSI counts with maximum VO2 and activity data from observation techniques (Freedson, 1991). Advances in microelectronics allowed for McPartland and colleagues (1976b) to quickly develop the next generation of motion sensors, the Movement Activated Recording Monitor (MARM), by adding a time-based and multi-cell Random Access Memory (i.e. RAM) to the previously described LSI monitor. This allowed the storage of movement counts accumulated over sequential time intervals (from 1.875 to 30 minutes) for up to 10.7 consecutive days depending on the time sampling rate (i.e. shorter time intervals will result in more memory being used and shorter duration of continuous monitoring) (McPartland et al, 1976b). The time-stamped data could then be downloaded directly into a computer or a teletype (McPartland et al, 1976b). Akin to the LSI, the MARM is a small (4.0 x 2.0 x 2.0 cm) and lightweight (35 grams) device that can be worn as a wristwatch, with mercury batteries that can last for over one month (McPartland et al, 1976b). As a result of technological advancements, accelerometry devices improved greatly regarding the movement sensor systems, data storage and transfer, memory and battery capacity during the 1980’s and 1990’s (Redmond & Hedge, 1985; Freedson, 1991; Matthews & Freedson, 1995; Nichols et al, 1999), resulting in the more advanced accelerometers that are widely used to objectively assess children’s PA in research nowadays (Rowlands et al, 2007). Most current accelerometers use piezo-electric sensors to detect acceleration in one to three orthogonal planes – vertical, anteroposterior, and medio-lateral (Chen & Bassett, 2005). A piezoelectric sensor consists of a piezoelectric element and a seismic mass, housed in a container (Figure 2). 80 Chapter Two – Literature Review Figure 2 - Schematic representation of two common piezoelectric sensor configurations (from Chen & Bassett, 2005) When acceleration acts on the sensor, the seismic mass causes the piezoelectric element to deform by bending in beam sensors, or by direct tension/compression in the newer integrated chip sensors (Chen & Bassett, 2005; Butte, Ekelund & Westerterp, 2012). These deformations cause the displaced charge to build up on one side of the sensor, generating a variable output voltage signal that is proportional to the applied acceleration (Chen & Bassett, 2005; Butte, Ekelund & Westerterp, 2012). To measure accelerations in multiple directions, several unidirectional accelerometer sensors must be mounted orthogonally to one another, either manually or through the use of a multiaxial integrated chip sensor (Chen & Bassett, 2005). Data are sampled at a frequency that allows capturing the full range of human movement, usually between one and 64Hz in commercially available accelerometers (Chen & Bassett, 2005), although more recent models can reach sampling frequencies of 100Hz (The ActiGraph, 2012). After data have been sampled, the sensor output is filtered using a band pass filter which allows only frequencies between a set range to pass while the remaining are attenuated (Chen & Bassett, 2005). This reduces possible influences from artefacts such as the ageing of the piezoelectric elements, temperature-related sensor drifts, external vibrations or electronic noises, to be included in the acceleration signals (Chen & Bassett, 2005). The resulting voltage is then converted from an analog signal into a digital string of numbers, named raw counts (Chen & Bassett, 2005; Butte, Ekelund & Westerterp, 2012). The amplitude of these raw counts is determined by the hardware of the accelerometer, including the analog voltage the amplification and the analog-digital conversion factors 81 Chapter Two – Literature Review (Chen & Bassett, 2005). The raw counts then go through the processor where different analytical approaches can be applied to convert the bidirectional (i.e. negative and positive) acceleration signals into a positive-only value of counts, which are summarised for specified time-sampling units, named epochs (Chen & Bassett, 2005; Butte, Ekelund & Westerterp, 2012). This final summary of counts per epoch (usually referred to as activity counts) (Chen & Bassett, 2005) are then calibrated against a gold-standard to convert the dimentionless acceleration data into meaningful measurement units about PA intensity or EE (e.g. MVPA) (Warren et al, 2010; Bassett, Rowlands & Trost, 2012; Butte, Ekelund & Westerterp, 2012). This process has been denominated as “value calibration” (Welk, 2005; Bassett, Rowlands & Trost, 2012) Before using accelerometers in the field, researchers must make several important decisions: 1) what type (e.g. uniaxial or triaxial) of accelerometer will be used; 2) whether participants should wear only one or multiple accelerometers; 3) the positioning of the accelerometers on the body; 4) what epoch duration to use; 5) What cut-points or equations will be used to determine PA intensity; 6) how many days do the participants need to wear the accelerometers; 7) how many hours of wear constitute a valid day; 8) how to classify non-wear time; and 9) what to do with missing data (Trost, McIver & Pate, 2005; Cliff, Reilly & Okely, 2009; Warren et al, 2010). 2.3.1.6.1. Type of accelerometer There are currently numerous brands, and several models within the brands of accelerometers available (Rowlands, 2007; McClain & Tudor-Locke, 2009). No study has simultaneously compared the validity and reliability of all accelerometers (Rowlands, 2007), and research evaluating the validity and reliability of accelerometers to measure PA in children younger than three years of age is warranted (Cliff, Reilly & Okely, 2009; Cardon, Van Cauwenberghe & de Bourdeaudhuij, 2011). The uniaxial ActiGraph (ActiGraph, Fort Walton Beach, FL; also referred to as the CSA, MTI, and WAM), the omni-directional Actical and Actiwatch (Mini Mitter Co., Inc., Bend, 82 Chapter Two – Literature Review OR), and the triaxial RT3 (Stayhealthy, Inc., Monrovia, CA; which superseded the Tritrac) have been the most widely used with children (Rowlands, 2007). Because devices differ in the number of movement axes measured, memory and battery capacity, placement position, dimensions, price, technical support available, and various other characteristics, careful consideration about all of these issues must exist when choosing an accelerometer for large scale epidemiological studies (Warren et al, 2010). Some studies have shown a slight improvement in accuracy when using triaxial instead of uniaxial accelerometers, but the strong positive correlation between the outputs of both types (Trost, McIver & Pate, 2005) and with other criterion measures (Loprinzi & Cardinal, 2011) suggest that uniaxial and triaxial accelerometers provide comparable information. However, the vast majority of the research reviewed by these papers (Trost, McIver & Pate, 2005; Loprinzi & Cardinal, 2011) was conducted in older children or adults, or by comparing different brands of accelerometers which may (by default) differ in accuracy. Because of the wide range of activities performed by young children besides walking/running (e.g. crawling, swinging, climbing, rolling) (McIver et al, 2009), and the immaturity of their gait during locomotion (e.g. two year olds have a wider base of support and more pronounced knee flexion than older children and adults) (Keen, 1993), triaxial accelerometers should theoretically be more accurate in assessing preschool children’s habitual PA (Cliff, Reilly & Okely, 2009; Loprinzi & Cardinal, 2011). Limited research has investigated the validity of different accelerometers and the potential improvement of using triaxial instead of uniaxial accelerometry to measure the PA of young children (Kelly et al, 2004; Cliff, Reilly & Okely, 2009). One study has investigated this issue with the triaxial accelerometer ActivTracer (GMS, Tokyo, Japan) in 27 Japanese children aged five to six years. Tanaka et al. (2007) reported an improvement in the prediction of EE (measured by indirect calorimetry) and standard error of estimates (SEE) from combined vertical and horizontal acceleration counts and synthesised vector acceleration counts (vector resulting from the three axes combined), in relation to the EE estimates from the vertical axis accelerations only (R2 = 0.947– 83 Chapter Two – Literature Review 0.949 versus R2 = 0.930–0.938; SEE= 0.045–0.046 versus SEE= 0.050–0.052, respectively). This may be indicative of an advantage of triaxial accelerometers in the early years, but contradictory results have also been reported. For example, Hislop et al (2012) assessed this issue in 31 preschoolers (4.4 ± 0.8 years), using the CARS (Puhl et al, 1990), the triaxial RT3 and the uniaxial ActiGraph GT1M. No significant differences were found in terms of the number of minutes classified as MVPA between the GT1M or the RT3 and the CARS (considered the gold standard), suggesting that there was no advantage of a triaxial over a uniaxial model (Hislop et al, 2012). However, differences regarding sensitivity to movement or the analog-digital conversion process for the two accelerometers, and the cut-points applied to each device may have confounded the results in Hislop et al’s (2012) study. The different accelerometers and statistical analyses used may be responsible for the different results between Tanaka et al (2007) and Hislop et al’s (2012) studies. Therefore, the limited information available from published studies does not allow any conclusions to be drawn regarding the advantage of triaxial versus uniaxial accelerometry to accurately assess young children’s PA (Rowlands, 2007; Cliff, Reilly & Okely, 2009). When choosing an accelerometer for use with children younger than five years of age, several additional practical issues may be especially relevant (Fairweather et al, 1999; Cliff, Reilly & Okely, 2009). Because of their particular physical, cognitive and psychological characteristics, it is important that researchers consider the size, weight, and how tamper-proof and robust a device is when choosing an accelerometer to measure PA in such young children (Cliff, Reilly & Okely, 2009; McClain & Tudor-Locke, 2010). Although a small number of recent studies have used accelerometers with very young children (Van Cauwenberghe et al, 2011; Trost et al, 2012), the utility and feasibility of using several types of accelerometers in children younger than three years of age is largely unknown (Cliff, Reilly & Okely, 2009). Studies addressing these issues are warranted to help researchers in taking the first steps towards a better understanding of PA and its role in early childhood development (Cliff, Reilly & Okely, 2009). Improving our understanding of the measures of PA in young children will aid in the design of adequate and evidence-based public health policies aiming to increase PA 84 Chapter Two – Literature Review during this critical period of growth (Cardon, Van Cauwenberghe & de Bourdeaudhuij, 2011). 2.3.1.6.2. Number of accelerometers Similarly to the decision between a uniaxial or a triaxial accelerometer, using multiple accelerometers may increase the accuracy of the PA measurement, by picking up activity in multiple planes of movement, or movement of the limbs that a single waistmounted accelerometer would not register (Trost, McIver & Pate, 2005). While some of these decisions can be made by the researchers based on previous research and experience (e.g. the most appropriate accelerometer to measure the outcome of interest), other decisions will be better made by consulting with the target sample. For example, a research team might decide that participants should wear multiple accelerometers because previous research has shown an improvement in the explanatory power of the estimated PA EE (Trost, McIver & Pate, 2005). However, this may increase participant burden too much and jeopardise recruitment and compliance because certain participants may not be willing to wear more than one monitor. Researchers need to carefully consider if the improvement in accuracy conferred by multiple accelerometers justifies the possible decrease in sample size recruited and lower compliance with the protocol resulting from a high participant burden (Trost, McIver & Pate, 2005). This issue has not been rigorously evaluated in children and deserves further investigation especially in preschool children (McIver & Pate, 2005), due to their frequent engagement in non-ambulatory movement (e.g. climbing, riding a tricycle or digging in sand boxes) (Irwin et al, 2005; McIver et al, 2009). 2.3.1.6.3. Position of accelerometers While some accelerometers have a specific and unchangeable placement site, others are more flexible and can be used in multiple body sites (Cliff, Reilly & Okely, 2009). The most common placement for the majority of the models is near the hip, at the waist level, so that the device is attached as close as possible to the body’s centre of mass (Trost, McIver & Pate, 2009). Other sites used with children include at the wrist and 85 Chapter Two – Literature Review ankle (Cliff, Reilly & Okely, 2009; Nyberg et al, 2009; Routen et al, 2012; Phillips, Parfitt & Rowlands, 2013). No published studies have explored the accuracy of different monitor placements in children younger than 3 years (Cliff, Reilly & Okely, 2009). Choosing the placement site is an important issue, as small but significant differences in accelerometer counts have been reported in the literature between devices placed, for example, at the mid-axillary line and the anterior or posterior axillary line (Welk, 2005), or between the hip and wrist placements (Routen et al, 2012). The practical importance of these differences is questionable, especially since it is unlikely that the regular study participant would wear their device at exactly the same site on every monitoring day (Trost, McIver & Pate, 2009). 2.3.1.6.4. Epoch duration Although more recent accelerometers can record raw acceleration data continuously, most accelerometers have recorded the signal over a given time interval (i.e. epoch) which can be set a priori by the researcher (Rowlands & Eston, 2007; McClain et al, 2008; Cain et al 2013). Each epoch can last for as short as one second and as long as several minutes (McClain et al, 2008), depending on the battery life and memory capacity of the accelerometer (Rowlands, 2007; Loprinzi & Cardinal 2011), which varies between brands and models (Rowlands & Eston, 2007). Epoch length is a key issue that affects both the interpretation of young children’s accelerometer-recorded PA levels (McClain & Tudor-Locke, 2008; Oliver, Schofield & Schluter, 2009; Vale et al, 2009) and the subsequent relationship of different PA patterns and intensity with several health outcomes (Rowlands, 2007; Loprinzi et al, 2012). Because of the sporadic and intermittent nature of their PA (Trost, McIver & Pate, 2005; Oliver, Schofield & Schluter, 2009; Pate, O’Neill & Mitchell, 2010), the use of shorter epochs (e.g. <15 seconds) has been recommended when assessing young children’s PA (Rowlands, 2007; Cliff, Reilly & Okely, 2009; Vale et al, 2009; Hislop et al, 2012). For longer epoch lengths, the process of averaging count outputs is a potential threat to the validity of estimates of time in different PA intensities (McClain et al, 2008; Reilly et al, 2008). This happens when the epoch duration is longer than the bout of PA being 86 Chapter Two – Literature Review measured, or when a bout of PA occurs between epochs, and within each both inactive and active seconds are considered together to determine PA intensity for the measured epochs (McClain et al, 2008; Reilly et al, 2008). Consequently, shorter periods of true MVPA would be classified and reported as light PA, resulting in an underestimation of MVPA time (Trost, McIver & Pate, 2005; McClain et al, 2008; Oliver, Schofield & Schluter, 2009). 2.3.1.6.5. Classification of physical activity intensity Assessing PA intensity from accelerometry data requires the application of cut-points or equations to the counts of each collected epoch (Chen & Bassett, 2005; McClain & Tudor-Locke, 2008). This requires the comparison of accelerometer output against a gold standard, such as direct observation or indirect calorimetry (Chen & Bassett, 2005; McClain & Tudor-Locke, 2008), using data collected simultaneously in multiple individuals representative of the population of interest, and applying statistical methods (e.g. ROC analysis) to obtain the best cut-points or equations to convert the dimentionless acceleration data into the desired PA information (e.g. PA intensity) (Welk, 2005; Bassett, Rowlands & Trost, 2012). As previously mentioned, this process is called “value calibration” (Welk, 2005; Bassett, Rowlands & Trost, 2012). Following this calibration prossess, the derived cut-points or equations need to be cross-validated against a gold-standard with an independent sample, and in free-living conditions (Welk, 2005) – this process is called “criterion-referenced validity” (Bassett, Rowlands & Trost, 2012). There are two types of criterion-referenced validity: 1) concurrent validity – which is determined by comparing data simultaneously collected by the accelerometer and the criterion measure (e.g. agreement in epochs classified as MVPA); and 2) predictive validity – which is the extent to which an accelerometer is able to predict some score obtained by the criterion measure (e.g. time spent in MVPA) (Bassett, Rowlands & Trost, 2012). Choosing an appropriate set of cut-points for the population of interest is extremely important, because the prediction of the time children spend in different PA intensities will vary greatly depending on the cut-points used (Oliver, Schofield & Schluter, 2009; Beets et al, 2011; Loprinzi et al, 2012; Trost et al, 2012). Consequently, 87 Chapter Two – Literature Review this will affect estimates of compliance with PA guidelines (Beets et al, 2011; Loprinzi et al, 2012), possibly influencing the relationship between PA and health outcomes (Loprinzi et al, 2012), which in turn makes it harder to understand how much PA is indeed needed to keep healthy and to inform policy-makers (Beets et al, 2011). As previously mentioned, because of the intermittent nature of young children’s PA (Trost, McIver & Pate, 2005; Oliver, Schofield & Schluter, 2009; Pate, O’Neill & Mitchell, 2010), shorter epoch lengths should be used with preschool children. However, the shortest epochs for which accelerometers have been calibrated to use with children younger than six years of age are 15-second epochs (Sirard et al, 2005; Pate et al, 2006; Trost et al, 2012). To date, the only existing set of cut-points for children younger than three years of age are those published by Trost et al. (2012). The latter were calibrated for the ActiGraph GT1M with 22 toddlers (aged 16-35 months) and validated in an independent sample (18 toddlers; aged 2.3 ± 0.4 years), who were videotaped during a 20-minute play break, and the resulting videos coded second-by-second with an adaptation of the CARS (Puhl et al, 1990). Accuracy was considered fair to excellent, with the area under the curve (AUC) ranging between 0.74 for SB and 0.90 for MVPA (Trost et al, 2012). However, in the validation sample, the SB cut-points significantly overestimated observed SB by a mean of 7.6 minutes, and significantly underestimated light PA by a mean of 7.2 minutes (both p<0.001), performing slightly worse than Pate et al’s (2006) cut-points for 3-5 year old children (Trost et al, 2012). The lack of improvement of Trost et al’s (2012) cut-points may be due to the use of a similar epoch length and vertical acceleration only. Epochs <15 seconds may be needed to accurately register the short bouts of more intense PA (Rowlands, 2007; Cliff, Reilly & Okely, 2009; Vale et al, 2009; Hislop et al, 2012). Triaxial accelerometry also has theoretical advantages in assessing the full range of activities observed in younger children (Cliff, Reilly & Okely, 2009). To date, no published calibration studies have tried to incorporate triaxial accelerometry using epochs <15 seconds with children younger than three years. 88 Chapter Two – Literature Review 2.3.1.6.6. Missing data, wear time and valid day determination Arguably one of the most challenging issues in accelerometer data cleaning and interpretation is how to identify and manage missing data (Warren et al, 2010), and no consensus on methods for cleaning and reducing data currently exists (Cliff, Reilly & Okely, 2009; Cain et al, 2013). Screening and cleaning of accelerometer data is done to ensure the biological plausibility of the registered accelerations, and to minimise the influence of spurious data on the activity outcomes (Cliff, Reilly & Okely, 2009). Firstly, researchers need to decide whether the lack of accelerometer counts is actually missing data rather than a sustained period of SB (Cliff, Reilly & Okely, 2009; Warren et al, 2010). Where the study aim is to define PA during waking time, special attention also needs to be given to identify and remove daytime napping periods, which are common in children younger than three years (Cliff, Reilly & Okely, 2009). Concurrent completion of daily activity/accelerometer logs by the parents can be a good aid in distinguishing between non-wear, sleep and inactivity times (Cliff, Reilly & Okely, 2009), and to identify the reasons for non-wear time and help to decide what to do with these time periods (Warren et al, 2010). Typically, consecutive periods of non-wear time (normally defined as consecutive zero counts) longer than 10 minutes are removed from the data (Warren et al, 2010; Cain et al, 2013), based on the assumption that accelerometer sensitivity to even small movements would result in the registration of a count value higher than zero if the monitor is worn correctly (Cliff, Reilly & Okely, 2009). Choosing the right procedure for defining non-wear time is very important because: 1) confusing SB with missing data would lead to a bias towards underestimating SB levels (Warren et al, 2010); and 2) excluding participant data can reduce the valid wear time per day and lead to the exclusion of participants, consequently increasing the likelihood of sampling-bias influencing study outcomes (Cliff, Reilly & Okely, 2009). However, this decision rule was one of the least reported in a recent review of methodologies of studies using accelerometers with children (Cain et al, 2013). Next, researchers need to define how many hours of registered wear time are needed to be considered as a valid day. A typical day varies for individuals in different age 89 Chapter Two – Literature Review groups and may also vary between week/weekend days and seasons (Ward et al, 2005; Rowlands, 2007; Cliff, Reilly & Okely, 2009). Some researchers recommend that decision rules for a valid day should be defined at the planning stages of a study (Warren et al, 2010), while others suggest that such decisions can be defined using the sample from the study under investigation (Ward et al, 2005). Focusing on the methods and decision rules applied to accelerometry in 273 reviewed articles, Cain and colleagues (2013) found 12 different definitions for a valid day for children (ranging from six to 12 hours) and one quarter of the studies did not report any information on this decision rule. Taking into consideration the longer overall daily sleep duration of children younger than three years compared with older children, it has been suggested that as little as three hours of accelerometer data per day (for 2-3 days) may be enough to accurately estimate habitual PA in this younger age group (Cliff, Reilly & Okely, 2009). Deciding what constitutes a valid day is crucial, since including days in which only a few hours were measured is likely to underestimate the real PA level (Ward et al, 2005), but excluding participants with valid accelerometry data may lead to biased results and/or the inability to generalise results in large population studies (Cliff, Reilly & Okely, 2009; Loprinzi et al, 2012). 2.3.1.6.7. Duration of data collection period Because PA varies from day to day (Ward et al, 2005), assessing habitual PA levels requires measuring PA for several days (Trost, McIver & Pate, 2005; Rowlands, 2007; Trost, 2007; Cliff, Reilly & Okely, 2009; Loprinzi & Cardinal, 2011). The number of days required in a study protocol depends on the setting, the population under study, the study resources (e.g., small or larger budget), and the research question (e.g. the need for population- or individual-level estimates of PA) (Kohl, Fulton & Caspersen, 2000; Ward et al, 2005). The minimum number of days needed to assess habitual PA is, however, subject to much debate (Cliff, Reilly & Okely, 2009; Warren et al, 2010), and has important implications for the adequate representation of children’s PA (Ward et al, 2005), compliance with protocol and overall study costs (Trost, 2007). On one side, researchers need participants to wear the monitors for enough days so that the resulting 90 Chapter Two – Literature Review measurements are a real representation of a child’s habitual PA behaviour (Trost, 2007; Cliff, Reilly & Okely, 2009; Loprinzi & Cardinal, 2011; Warren et al, 2010). However, care is needed to define a monitoring protocol that is not too demanding for study resources (Trost, McIver & Pate, 2005) or too long and burdensome for children (Kohl, Fulton & Caspersen, 2000; Trost, 2007; Loprinzi & Cardinal, 2011), since participant compliance in wearing the accelerometer is also critical for obtaining accurate PA measurements (Ward et al, 2005). A 7-day monitoring period has been suggested as a reliable and sensible choice for children, which would account for possible differences between week and weekend days (Trost, McIver & Pate, 2005; Warren et al, 2010; Loprinzi & Cardinal, 2011). However, day-to-day variability in the PA of children younger than five years is probably lower than school aged children, and more likely to be influenced by daytime sleeping patterns than by week/weekend day differences in PA (Cliff, Reilly & Okely, 2009). Cliff, Reilly and Okely (2009) have suggested that differences between week and weekend days seems to be small and, although the reliability of PA estimates may be maximised using a 7-day monitoring protocol, a minimum of three days may be sufficient to assess habitual PA in 3-5 year old children. Available evidence was insufficient to suggest an evidence-based protocol for children younger than three years (Cliff, Reilly & Okely, 2009). 2.3.1.6.8. Limitations of accelerometers Although accelerometers can effectively address many of the disadvantages of other objective measurement methods (e.g. high participant burden), and their ability to assess detailed information about PA (e.g. intensity and patterns of accumulation) allows investigators to examine questions that cannot be answered from subjective measures (Esliger & Tremblay, 2007), they still present several disadvantages. Arguably, the most important limitations are the lack of standardisation regarding the protocols used for data programming, collection, cleaning and analysis, what outcome measures are used and reported, and how the output is interpreted, which limits the comparability between studies (Rowlands, 2007; Rowlands & Eston, 2007; Loprinzi & 91 Chapter Two – Literature Review Cardinal, 2011; Cain et al, 2013). The lack of industry standards for the conversion of captured raw accelerometry into count outputs, as well as disclosure of proprietary algorithms, are important disadvantages of accelerometers (Butte, Ekelund & Westerterp, 2012), which further limit the ability to compare different accelerometers and studies. Similarly to pedometers, accelerometers are not sensitive to upper body movement and non-ambulatory movement such as cycling (Trost, McIver & Pate, 2005; Warren et al, 2010), nor can they capture the additional energy cost associated with carrying extra loads, walking up stairs or with incline (Trost, 2007; Cliff, Reilly & Okely, 2009; Warren et al, 2010). The inability of most accelerometers to detect the static component acceleration makes them unsuitable for measuring the angles of the surfaces to which they are attached, so they cannot directly assess body postures (Chen & Bassett, 2005). Information about the context of PA is also not captured by accelerometers (Cliff, Reilly & Okely, 2009; Hardy et al, 2013). If such information is needed to address the aims of a study, researchers will need to use another method (e.g. global positioning systems [GPS] or direct observation) in addition to or instead of accelerometers. 2.3.1.7. Combination of methods Another approach to try to improve accuracy or completeness of the PA information assessed by objective measurement tools is to combine different methods (Trost, 2007; Warren et al, 2010; Butte, Ekelund & Westerterp, 2012). For example, using HR monitors allows the recording of intensity and patterns of PA accumulation but does not provide any contextual information. Global positioning systems can provide information about the places where children spend their day, but not about the intensity of the activities they undertake in different spaces. Thus, combining these two methods would give a much more detailed picture of children’s PA than using either method alone. This was the approach used by Quigg et al (2010) with 5-10 year old children from New Zealand, where the ActiGraph GT1M accelerometer was used together with the Globalsat DG-100 GPS to quantify children’s PA and identify the proportion of PA occurring in public parks with playgrounds. Eston, Rowlands and Ingledew (1998) have 92 Chapter Two – Literature Review used a HR monitor, a pedometer, one triaxial and one uniaxial accelerometer with 30 Welsh children (8-10 years), to assess their individual and combined accuracy in measuring EE against indirect calorimetry. The authors found that a multiple-regression equation including triaxial accelerometry counts and HR predicted EE better than any measure alone (R2=0.85), although this was not a substantial improvement over using triaxial accelerometry alone (R2=0.83) (Eston, Rowlands & Ingledew, 1998). The cost and complexity associated with processing and analysing data from multiple sensors may limit their use for epidemiological studies (McClain & Tudor-Locke, 2008; Atkin et al, 2012). Further, the use of several devices may be too burdensome, especially for younger children (McClain & Tudor-Locke, 2008). Recently developed devices have integrated two methods into single devices, in an attempt to eliminate some of the limitations of each of the individual methods (Brage et al, 2005; Warren et al, 2010; Butte, Ekelund & Westerterp, 2012) presented in sections 2.3.1.1 – 2.3.1.6, but avoiding the increased burden posed by the multiple sensor approach. The Actiheart (CamNtech, Cambridge, UK) is a device that combines HR and accelerometer data to improve the accuracy and precision of EE estimation (Brage et al, 2005; Butte, Ekelund & Westerterp, 2012). It has been calibrated and validated in adults (Brage et al, 2005) as well as children (Corder et al, 2005; De Bock et al, 2010). De Bock et al (2010) have calibrated the Actiheart to assess SB and MVPA in 33 German preschoolers (aged 3-6 years). By combining HR and accelerometer cut-points, 87-91% of the 15-second epochs observed as MVPA were correctly classified (De Bock et al, 2010). However, due to the smaller frame size and the possibility of allergic skin reaction to the electrode pads, the practical feasibility of using the Actiheart with children younger than three years is not yet known. 2.3.2. Objective Measurement of Sedentary Behaviour in Young Children As mentioned before, SB is not just the lower end of the PA continuum but a set of distinct behaviours commonly characterised by an EE between 1.0 and 1.5 MET (Pate O’Neill & Lobelo, 2008). Selection of a SB measurement tool should be based on the scope and aims of the study, and which method provides the information required to 93 Chapter Two – Literature Review address these (Loprinzi & Cardinal, 2011; Hardy et al, 2013). However, there will always be a trade-off between practicality (age and size of sample), available study resources, participant burden, validity and accuracy when it comes to selecting a SB measurement tool for use with young children (McLain & Tudor-Locke, 2008; Hardy et al, 2013). Given the increasing evidence base on the adverse health consequences of time spent in SB, independently of PA (Tremblay et al, 2010; Chinapaw et al, 2011; LeBlanc et al 2012), its appropriate and reliable assessment is an important public health priority (Loprinzi & Cardinal, 2011; Lubans et al, 2011; Salmon et al 2011). Accurate, reliable and valid assessment of SB is key for future research investigating the dose–response relationships between SB and health and developmental outcomes, population health monitoring, determining the impact of interventions targeting reductions in time spent in SB, and determining the correlates and predictors of SB (Fulton et al, 2001; Reilly et al, 2008; Lubans et al, 2011; Hardy et al, 2013). Research into young children’s SB is still in its infancy, and only a small number of studies have investigated the associations between children’s objectively measured overall SB time and health (Salmon et al, 2011). The most commonly measured SB in children has been time spent watching TV or engaging in other screen-based activities, such playing video games or computer use, through self- or proxy-reports (Chinapaw et al, 2011; Loprinzi & Cardinal, 2011; Lubans et al, 2011; LeBlanc et al, 2012). However, this is but one of many activities representative of SB and assessing only screen time will provide an incomplete picture of a child’s habitual SB (Chinapaw et al, 2011; Loprinzi & Cardinal, 2011; Salmon et al, 2011; LeBlanc et al, 2012), in addition to suffering from all the problems already highlighted regarding subjective measurement methods, such as memory difficulties and social desirability bias (see section 2.3.). Objective measurement methods are considered as the most valid and reliable form of assessing SB (Loprinzi & Cardinal, 2011; Lubans et al, 2011). Because SB is a particular set of behaviours commonly defined by a low EE (usually between 1-1.5 MET) (Pate, O’Neill & Lobelo, 2008; Ainsworth et al, 2011), some of the objective 94 Chapter Two – Literature Review measurement method described in section 2.3.1. are not useful for the study of SB. For example, the DLW method and pedometers can only provide information on total PA (TEE and steps per day, respectively), not being able to provide information on different PA intensities or SB. Nevertheless, many of the previously described methods for PA measurement can also be used to measure SB in young children. For example, levels one and two of the already mentioned CARS (Puhl et al, 1990) and CPAF (O’Hara et al, 1989) observation systems correspond to sedentary activities, allowing duration and patterns of SB to be calculated. Calorimetry, considered by many as a gold-standard method for EE (Ceesay et al, 1989; Welk 2005; Haugen, Chan & Li, 2007; Lubans et al, 2011), can also be used to measure SB and calibrate other measurement methods, since it can assess the full range of EE. HR monitors are a less burdensome and more feasible method for monitoring SB in larger samples. The possibility of recording the full range of HR during long periods of data collection allows HR monitors to provide a detailed picture of children’s habitual SB. Accelerometers are currently regarded as the objective method of choice (Reilly et al, 2008), because of their practicality, reliability and validity for quantifying the amount of time children spend in SB (Loprinzi & Cardinal, 2011; Lubans et al, 2011; Hardy et al, 2013). As described for PA, using accelerometers for the assessment of SB requires the calibration against a gold standard, by deriving acceleration cut-points that can then identify SB epochs (Reilly et al, 2008; Loprinzi & Cardinal, 2011). Many sets of published accelerometry PA cut-points for children younger than five years also include SB cut-points (Sirard et al, 2005; de Bock et al, 2010; Van Cauwenberghe et al, 2011; Trost et al, 2012), although some cut-points have been specifically derived to assess SB (Reilly et al, 2003). In most of the available accelerometers, researchers are required to specify the sampling frequency (i.e. epoch length) during the device programming process (Atkin et al, 2012). Although significant effects of epoch length on accelerometer-assessed SB time (Edwardson & Gorely, 2010) and data collection at shorter epoch lengths has been advised (Loprinzi & Cardinal, 2011; Atkin et al, 2012), findings are inconsistent, and the ideal epoch length for determining SB time has not yet been established (Atkin et al, 2012). Generally, such studies have focused mainly on 95 Chapter Two – Literature Review investigating the effect of epoch length on the resulting MVPA time-estimates in older children (McClain et al, 2008; Reilly et al, 2008; Oliver, Schofield & Schluter, 2009; Vale et al, 2009; Edwardson & Gorely, 2010), and studies investigating potential effects on SB time estimates of children younger than three years are lacking. Although the appropriate duration of the data collection period in order to assess habitual SB of young children has not yet been established, seven consecutive days of measurement have been advised (Hardy et al, 2013). Importantly, although all these methods can be used to assess SB, the same limitations previously highlighted for each method regarding the measurement of PA still apply when measuring SB. For example, because factors such as emotional stress can alter the relationship between HR and VO2, and HR response tends to remain elevated after cessation of movement (Trost, 2007), HR monitors may underestimate true SB levels. In addition to the difficulties associated with the decisions related to the choice of devices and procedures, accelerometers cannot detect body posture, which is a critical limitation if the SB of interest in a study is the frequency or time spent in sitting behaviours. Although recent accelerometers have attempted to derive body posture from triaxial accelerometry (e.g. ActiGraph GT3X+) (Atkin et al, 2012), it has been shown to have limited validity against direct observation in both laboratory and freeliving conditions (possibly influenced by body placement site) (McMahon, Brychta & Chen, 2010), and that it significantly underestimate SB (Clemes et al, 2012). As previously mentioned, accelerometers cannot assess contextual information about SB; researcher will need to use subjective measures in addition to accelerometers if they need such information to answer their studies’ research questions (Lubans et al, 2011; Hardy et al, 2013). Contrary to most of the previously described methods, posture monitors or “inclinometers” are a measurement method which is suitable for SB but not PA, measuring anatomical positions (i.e. laying, sitting and standing) and postural changes (e.g. sit to stand) (Atkin et al, 2012; Hardy et al, 2013). Earlier methods constituted by several inclinometers were able to identify 100% of the body postures recorded by observers (Lanningham-Foster et al, 2005). However the use of such devices is 96 Chapter Two – Literature Review probably too burdensome and impractical for use with preschool children (Davies, et al, 2012). Although showing clear advantages over many other objective methods in measuring sitting behaviour, posture monitors are still unable to provide contextual information about the recorded activities (e.g. outdoor or indoor settings, leisure or work context) (Atkin et al, 2012). Because inclinometers tend to be taped or strapped to the thigh (Atkin et al, 2012), their use during prolonged periods of time may be uncomfortable for children (Hardy et al, 2013). Davies et al (2012) reported that the overall feedback from parents supported the practicality of using the activPAL with their preschool children. However, 25-40% of the parents did report that they agreed to some extent that the activPAL was uncomfortable to wear (attaching/removing the device) and interfered with their child’s usual daily activity (Davies et al, 2012). More recently, after five days of monitoring with 4-6 year olds from Belgium, 38% of parents reported that their children had skin irritation due to wearing the activPAL for consecutive days, with a further 13% of parents reporting that their child found it very unpleasant to wear the activPAL during the measurement period. No similar information for children younger than three years has been published, although such issues are more likely to appear in the younger age range, due to their smaller frame size and potentially more sensitive skin. In summary, NCDs represent the leading cause of death worldwide, with several biological, behavioural and environmental factors contributing to increase the risk of these chronic diseases (WHO, 2011). Both the NCDs and their major risk factors are increasingly being found in children of younger ages (Bhatia, 2004; Hale, 2004; Lobstein, Baur & Uauy, 2004; Reilly, 2008; Falkner & DeLoach, 2009). This is worrying given evidence that suggests many of these risk factors track throughout childhood and into adulthood (Malina, 2001; Certain & Khan, 2002; Janz et al, 2005; Biddle et al, 2010; Zapalla, 2010; Morrison et al, 2012). Excessive time in SB and insufficient PA levels represent major behavioural risk factors for NCDs (WHO, 2009 and 2011), which are already reported in very young children (Reilly et al, 2004; Kelly et al 2006; Reilly et al, 2008; Birch, Parker & Burns, 2011; O’Dwyer et al, 2011).However, the majority of the existing evidence regarding the PA and SB levels, and the relationship between these 97 Chapter Two – Literature Review behaviours and health in very young children originates from research that used subjective measurement methods, which have several inherent limitations that lead to inaccurate estimations of SB and PA levels (Reilly et al, 2009; Cardon, Van Cauwenberghe & De Bourdeaudhuij, 2011; Chinapaw et al, 2011; LeBlanc et al, 2012; Timmons et al, 2012). An urgent need for research using objective measurement methods with large and varied samples of young children has been repeatedly highlighted in the literature, to assess the true levels of SB and PA and clarify their individual and joint effects on children’s health and development (Reilly et al, 2009; Cardon, Van Cauwenberghe & De Bourdeaudhuij, 2011; Chinapaw et al, 2011; LeBlanc et al, 2012; Timmons et al, 2012) There are several objective measurement methods available to assess children’s SB and PA, all of which present both advantages and limitations that are important to consider when planning future studies (McClain & Tudor-Locke, 2008; Cliff, Reilly & Okely, 2009; Loprinzi & Cardinal, 2011). Of these methods, accelerometers have become the preferred tool for the assessment of both SB and PA in young children (Pate, O’Neill & Mitchell, 2010; Loprinzi & Cardinal, 2011), Several accelerometers have been calibrated and used with preschool children aged 3-5 years (Fairweather et al, 1999; Sirard et al, 2005; Pate et al, 2006; Pate, O’Neill & Mitchell, 2010). However, only one recent study has calibrated and validated the ActiGraph GT1M in children younger than three years of age (Trost et al, 2012), which used 15-second epochs that may not be a short enough time sampling period to accurately capture the sporadic and intermittent nature of children’s activity behaviours (Cliff, Reilly & Okely, 2009). When using accelerometers with young children, a number of additional practical issues that influence monitor selection might be particularly relevant, such as the size, weight, sturdiness and acceptability of the accelerometer (McClain & Tudor-Locke, 2008; Cliff, Reilly & Okely, 2009). To date, studies exploring the validity, utility and feasibility of different accelerometers to assess the SB and PA of children aged <3 years and of different ethnic backgrounds are lacking (McClain & Tudor-Locke, 2008; Cliff, Reilly & Okely, 2009). This is the subject of focus of the results chapter that follows, which 98 Chapter Two – Literature Review investigated the feasibility and acceptability of three accelerometers with 2-3 year old South Asian and White British children and both parents. 99 Chapter Three – Feasibility and acceptability of using three accelerometers with 2 to 3 year old South Asian and White British children and both parents – an exploratory qualitative study ______________________________________________________________________________________________________ CHAPTER THREE Feasibility and acceptability of using three accelerometers with 2-3 year old South Asian and White British children and both parents – an exploratory qualitative study The results presented in this chapter have been published. Reference: Costa S, Barber SE, Griffiths PL, Cameron N, Clemes SA. Qualitative feasibility of using three accelerometers with 2-3 year old children and both parents. Res Quart Exerc Sport, 2013; 84(3):295-304. Preliminary results have also been presented in poster format at the 2nd International Conference on Ambulatory Monitoring of Physical Activity and Movement (Glasgow, UK), 24th - 27th of May 2011. 100 Chapter Three – Feasibility and acceptability of using three accelerometers with 2 to 3 year old South Asian and White British children and both parents – an exploratory qualitative study ______________________________________________________________________________________________________ 3.1. Introduction Accelerometers are currently recognized as the most appropriate measures of physical activity (PA) and sedentary behaviour (SB) in children (Cardon, Van Cauwenberghe & De Bourdeaudhuij, 2011; Rowlands, 2007), because of the various advantages they have over other previously used methods such as parental report (e.g. objective measure, independent of recall difficulties or social desirability bias) (Cliff, Reilly & Okely, 2009). Several new and improved accelerometers are continuously being made available, which leaves researchers with many methodological and budgetary issues to consider when choosing an instrument to measure PA. The preschool period is considered a critical time for the establishment of obesogenic behaviours that can track into adulthood, such as low PA (Reilly, 2008; Goldfield et al, 2012). Assessing PA in children younger than five years of age is especially challenging (Cliff, Reilly & Okely, 2009) because of the typically short and sporadic pattern of activity and the potential reactivity due to children’s inherently curious nature (McLain & TudorLocke, 2009). Additionally, there are a number of relevant practical issues that need careful consideration, such as monitor size, weight, durability, robustness and how easy it is to tamper with the device (Cliff, Reilly & Okely, 2009; Trost, McIver & Pate, 2005). Although the use of accelerometers with children has become ubiquitous during the past 20 years, studies assessing the utility, feasibility and acceptability of using these instruments in young children are scarce (Cliff, Reilly & Okely, 2009). To date, only one study has reported the feasibility and acceptability of using an accelerometer with children younger than three years of age. Van Cauwenberghe et al (2011) assessed parents’ reports on how pleasant/unpleasant they perceived it was for their toddlers to wear the ActiGraph GT1M, after the children had worn the accelerometer for six consecutive days. Eighty-three percent of the parents reported wearing the accelerometer was “not unpleasant and not pleasant” for their child, while no parent rated it as being “unpleasant”. Three parents also reported that the GT1M occasionally did not stay in the correct position, with one parent associating this with child’s curiosity (Van Cauwenberghe et al, 2011). No published studies have yet reported on which type 101 Chapter Three – Feasibility and acceptability of using three accelerometers with 2 to 3 year old South Asian and White British children and both parents – an exploratory qualitative study ______________________________________________________________________________________________________ of accelerometer may be the most feasible for use with children younger than three years. It is important to simultaneously measure parents’ PA and SB levels to objectively assess their influence on the offspring’s activity levels (Gustafson & Rhodes, 2006). Although there has been an increase in the number of studies addressing this relationship, no consensus has yet been reached, because of the variety of measurement methods used, different approaches to statistical analyses, and contradictory results (Gustafson & Rhodes, 2006; Hinkley et al, 2008). There is, thus, a need for further studies with longitudinal designs, larger sample sizes, and including participants of different ethnicities, to investigate differences in paternal and maternal influences on children’s PA (Gustafson & Rhodes, 2006). If PA/SB surveillance studies with activity monitors aim to involve large multi-ethnic samples of both parents/caregivers, it is important to assess the feasibility, potential issues and acceptability of different monitors with both mothers and fathers, of different ethnic backgrounds. No published studies have assessed the feasibility and acceptability of using activity monitors with parents/caregivers of children under three years of different ethnicities. The Born in Bradford (BIB) study (Raynor & Born in Bradford Collaborative Group, 2008) presents a remarkable opportunity to address the association between parents’ and offspring’s PA, and investigate potential ethnic differences in this relationship. BIB is a longitudinal birth cohort study involving a bi-ethnic sample of over 13,000 families of children born at the Bradford Royal Infirmary between 2007 and 2010, which aims to identify the factors that contribute to health and those that influence health disparities in people from South Asian and White European origins (Raynor & Born in Bradford Collaborative Group, 2008). The aim of this study was to assess the qualitative feasibility and acceptability of using the ActiGraph GT3X+, the Actiheart and the activPAL3 to measure the PA and SB of 23 year old South Asian and White British children and their parents, for 8 consecutive days, with the intention to incorporate the most appropriate device into the BIB study. 102 Chapter Three – Feasibility and acceptability of using three accelerometers with 2 to 3 year old South Asian and White British children and both parents – an exploratory qualitative study ______________________________________________________________________________________________________ 3.2. Methods Six focus group meetings were run with a total of 17 South Asian and White British mothers of 2-3 year old children, from September 2010 to March 2011, at Children’s Centres in the city of Bradford (UK). Bradford was chosen due to its multi-ethnic population (18.9% of the population is South Asian, mainly Pakistani) (Office for National Statistics, 2011), and the prospect of introducing the measurement of PA into the ongoing BIB birth cohort study (Raynor & Born in Bradford Collaborative Group, 2008). Participants were recruited during playgroups at Children’s Centres, which are mostly attended by mothers and their children. At recruitment, mothers were given the participant information sheet which stated the aims and reasons for the study, what would be asked of mothers during the focus groups, possibility of data anonymization and what would happen with study materials and results. Additionally, the study aims and procedures were explained to the mothers directly, and they were given an opportunity to ask questions. Thirty-one mothers showed interest in taking part in the study, and provided contact details and information about the most suitable days and times to run the focus group. The focus groups were conducted by a moderator and a note-taker (both female) using a semi-structured questioning guide (see appendix 1), in English or Urdu (based on participants’ chosen language for the focus group), and lasted between 45 and 70 minutes. This questioning guide was translated and transliterated into Urdu according to methods previously employed by the BIB birth cohort study (Raynor & Born in Bradford Collaborative Group, 2008). In the Urdu-speaking focus group, both the moderator and the note-taker were of South Asian background, spoke Urdu and had the transliterated version of the questioning guide available at all times. In the English-speaking South Asian focus groups, the moderator was of White European background and a South Asian note-taker and interpreter was also present. In the focus groups with White British mothers, both the moderator and note-taker were of White European origin. To ensure the comfort and safety of participants, the number of researchers present was never higher than the number of participants, and mothers were allowed to bring an accompanying person (as well as their children) into the focus group. All moderators 103 Chapter Three – Feasibility and acceptability of using three accelerometers with 2 to 3 year old South Asian and White British children and both parents – an exploratory qualitative study ______________________________________________________________________________________________________ and note-takers had previous training and experience in conducting and taking notes during focus groups. A briefing was given which explained the aims of the focus groups, the question guide, the importance of the order of presenting particular questions, how and when to introduce prompts to generate discussion, and the importance of ensuring consistency across focus groups. Prior to the start of the audio recording of the focus groups, mothers were reminded of the study procedures, given an opportunity to ask questions, and requested to provide written informed consent and fill out a brief demographics questionnaire. This questionnaire assessed mother’s age, country of birth, ethnicity, education, home postcode, and whether their child was participating in the BIB study. Mothers’ socioeconomic status (SES) was assessed with the 2010 Index of Multiple Depravation (IMD) (Department for Communities and Local Government, 2011), using the reported home postcode. There are 32 482 postcode areas in England; the English 2010 IMD combines a range of economic, social and housing indicators into a single deprivation score for each postcode area, allowing the ranking of areas from one to 32482, according to their level of deprivation (Department for Communities and Local Government, 2011). To facilitate interpretation, these rankings were converted to percentages where 0% represents the most deprived area and 100% represents the least deprived area. All study materials were available in English and Urdu. Mothers were shown all three activity monitors, and each monitor’s characteristics and wearing procedures were explained and demonstrated. The ActiGraph GT3X+ (The ActiGraph, Pensacola, USA) is a triaxial accelerometer enclosed in a case measuring 4.6 x 3.3 x 1.5cm, weighs 19grams, and is usually worn at the lower waist attached to an elastic belt (see Figure 3 below). 104 Chapter Three – Feasibility and acceptability of using three accelerometers with 2 to 3 year old South Asian and White British children and both parents – an exploratory qualitative study ______________________________________________________________________________________________________ Figure 3 - The ActiGraph GT3X+ accelerometer worn by a 2-year old girl. The Actiheart (CamNtech, Cambridge, England; Figure 4) is a uniaxial accelerometer and heart rate monitor that consists of two electrodes, the larger one measuring 3.2cm in diameter by 0.6cm depth, which is connected to a smaller electrode by an 11.5cm long cable. It weighs 10 grams, and is attached directly onto the chest with the help of two electrode pads. 105 Chapter Three – Feasibility and acceptability of using three accelerometers with 2 to 3 year old South Asian and White British children and both parents – an exploratory qualitative study ______________________________________________________________________________________________________ Figure 4 - The Actiheart accelerometer worn by a 2-year old girl The activPAL3 (PAL Technologies, Glasgow, Scotland; Figure 5) is a uniaxial accelerometer and inclinometer that measures 5.3 x 3.5 x 0.7cm, weighs 15 grams, and is attached directly onto the centre of the anterior midline of the thigh with the PAL stickies TM (PAL Technologies, Glasgow, Scotland). 106 Chapter Three – Feasibility and acceptability of using three accelerometers with 2 to 3 year old South Asian and White British children and both parents – an exploratory qualitative study ______________________________________________________________________________________________________ Figure 5 - The activPAL3 accelerometer worn by a 2-year old girl. Subsequently, the moderator asked for mothers’ opinions about the feasibility and acceptability of using each accelerometer with their children, themselves and their husbands/partners, for eight consecutive days. The choice of an eight-day period was based on previous research advising a seven-day period of data collection (Cliff, Reilly & Okely, 2009), with an extra day added to enable the exclusion of the first measurement day to account for potential reactivity (McLain & Tudor-Locke, 2009). At the end of the focus group, all participants were individually asked to state: 1) which monitor they would prefer to wear: and 2) which monitor they would prefer or find more appropriate for their children and husbands to wear. Ethical approval for the study was obtained from Loughborough University’s Ethical Advisory Committee. All focus group discussions were audio-recorded and transcribed verbatim (except for the Urdu-speaking focus group, where translation was made at the time of transcription). Within an exploratory research design, and following a thematic analysis 107 Chapter Three – Feasibility and acceptability of using three accelerometers with 2 to 3 year old South Asian and White British children and both parents – an exploratory qualitative study ______________________________________________________________________________________________________ approach, the resulting data was entered and analysed on the NVivo 9 software by the author, in consultation with supervisors and other members of the research group. Coding of the English transcripts followed a coding scheme with an a priori set of categories, which was developed after discussion among all co-authors about what information was important to capture and code. Categories included: 1) Monitor preference; 2) Monitor rejection; and 3) Issues regarding the use of the monitors with the children, mothers and fathers. These categories were established to investigate if mothers had preference for any one of the devices, if any of the devices prompted negative reactions from the mothers (i.e. rejection), and to identify potential issues regarding the use of the three devices with both parents and children. Categories were further contrasted for differences between ethnicities. Differences according to SES level were not investigated because mothers were recruited from low SES areas and focus groups were not separated by SES levels. The final set of coded information and results were reviewed in detail with Dr Sally Barber from the BIB study (who had been present in five focus groups), and any disagreements were discussed until a final agreement was reached. It was intended that this information could be used to choose the accelerometer to use in the BiB study that shows the best trade-off between acceptability, low number of foreseen issues and type of information provided. 3.3. Results A brief characterization of the study sample is presented in Table 1. 108 Chapter Three – Feasibility and acceptability of using three accelerometers with 2 to 3 year old South Asian and White British children and both parents – an exploratory qualitative study ______________________________________________________________________________________________________ Table 1 - Characterization of the mothers present in the focus groups. Sample size 17 mothers Mean Age (SD) 30.4 (±6.9) Ethnicity (n) 8 South Asian / 9 White British Child’s sex* 65.0% girls / 35.0% boys Median number of children (min-max) Median IMD rank score (min-max) 2 (1-4) 8.8% (0.3% - 42.2%) Education Mothers who were educated in England 54.5% 0 levels, GCSE or School Certificate 45.5% NVQ levels Mothers who were educated in Pakistan 33.3% No Qualifications 50.0% Secondary School Certificate 16.7% Overseas Bachelor of Science SD – Standard Deviation; IMD – Index of Multiple Depravation; NVQ – National Vocational Qualifications; GCSE - General Certificate of Secondary Education * Sex of the 2-3 year old child who was the target of the discussion. 3.3.1. Monitor preference Table 2 summarizes the main findings related to the use of the three accelerometers with both the children and their parents. For children, the ActiGraph GT3X+ was the activity monitor that was clearly preferred by all of the mothers, and the monitor that raised the least number of feasibility issues. In contrast, the Actiheart was the least preferred monitor, and the one that mothers raised the most issues about (see Table 2). Moderator – “So, if for your… for your children to start with, which… If you were to choose one of those, which one would you choose? You’d choose…” 109 Chapter Three – Feasibility and acceptability of using three accelerometers with 2 to 3 year old South Asian and White British children and both parents – an exploratory qualitative study ______________________________________________________________________________________________________ C1 – “The Actigraph.” Moderator – “The Actigraph…” C2 – “I’d say the same.” – Focus group with White British mothers H1 – “If I compare with the belt and that [Actiheart]… I thinks she, she’ll wear the belt, she not gonna like that [Actiheart]. ” H2 – “Yeah yeah yeah, she’ll wear the belt.” – Focus group with English-speaking South Asian mothers For the mothers, although there was not such a clear preference as with the children, the ActiGraph GT3X+ was still the most preferred monitor, followed closely by the Actiheart. However, in the South Asian focus groups, the Actiheart was the only device that some mothers said they would definitely not wear (Table 2). E1 – “I prefer the belted one” Moderator – “Or, not one that goes on the chest…?” E1 – “Oh no!” – Focus group with English-speaking South Asian mothers Similarly to the opinions regarding mothers, the ActiGraph GT3X+ was also the most preferred monitor to use with the fathers, but in this case, followed closely by the activPAL3. Generally, more doubts were raised about the fathers being willing to wear any monitor when compared with the children or the mothers (Table 2). However, this uncertainty was mainly observed among the South Asian participants, whereas most of the White British mothers thought the fathers would not have problems wearing at least one of the monitors. Moderator – “And, finally, what about the, your (hmm) husbands, partners what do you think, so do you think men would wear any of those?” E1 – “[giggles] No, mine wouldn’t…” 110 Chapter Three – Feasibility and acceptability of using three accelerometers with 2 to 3 year old South Asian and White British children and both parents – an exploratory qualitative study ______________________________________________________________________________________________________ E2 – “Oh I have no idea darling!” E3 – “NO, mine no…” – Focus group with English-speaking South Asian mothers Moderator – “Partners?” C1 – “They’d wear whatever they’re given…” Note-taker – “What do you think…?” C2 – “Any…” Moderator – “Any..?” C2 – “Hmm… [nodding head in agreement]” C1 – “Cause as long as they’re not visible… I mean, from a male perspective I’ve got… Certainly for my partner, if you couldn’t see it…” C2 – “Exactly, they won’t bother will they?” C1 – “They won’t bother…!” – Focus group with White British mothers In the South Asian focus groups, some mothers also seemed uncomfortable with commenting on whether their husbands would wear the devices or not (e.g. refrained from commenting), while some mentioned that this question should be asked to their husbands directly. FU2 – “(…) after we ask then that’s when we’ll find out if they’ll wear it...” – Focus Group with Urdu-speaking South Asian mothers H1 – “I think I would ASK him... And then... Yeah... He might, he might wear it yeah... I don’t know...” – Focus group with English-speaking South Asian mothers 111 Chapter Three – Feasibility and acceptability of using three accelerometers with 2 to 3 year old South Asian and White British children and both parents – an exploratory qualitative study ______________________________________________________________________________________________________ 3.3.2. Issues regarding the use of monitors Several issues were raised by the mothers, concerning the use of the three activity monitors with each family member, with little difference between ethnicities. The only issue raised with the ActiGraph GT3X+ was the possibility of children taking off the device or playing with it if its presence was noted. The possibility of wearing it under the clothes was regarded by the mothers as a possible solution for this. H1 – “She, sometime... so you know, for a little while she’ll forget it, and then she’ll, she’ll take it off again, like when she realize "Oh, I’ve got something on" she’ll take it off... Yeah...” – Focus group with English-speaking South Asian mothers The most common issues raised with the Actiheart were: children fiddling and pulling off the device, the possibility of an allergic skin reaction to the electrode pads (in children) and the discomfort caused by the direct contact of the electrode pads with the skin (in all three family members). The latter regarded both physical discomfort (i.e. “itching”) and embarrassment, due to the visibility of the device to others when using certain clothes (i.e. low necklines). FU 2 – “Has your child ever worn a sticker? My daughter had it on here, she pull top up and tried to pull at it. (…) No, my daughter had these stickers on before and she didn’t leave them on…” FU1 – “The sticker one [Actiheart] isn’t [good], because of the tabs… some children …. Some children get allergy and then you’re saying you can’t even take it off… This [ActiGraph GT3X+], ok you can…” – Focus group with Urdu-speaking South Asian mothers T2 – “I think mine would pull it off… (…) He would… He’s got a thing about pulling stuff down his vest and his tops that wouldn’t, anything that he finds just goes down and if he noticed it he WOULD pull it off.” – Focus group with White British mothers 112 Chapter Three – Feasibility and acceptability of using three accelerometers with 2 to 3 year old South Asian and White British children and both parents – an exploratory qualitative study ______________________________________________________________________________________________________ H1 – “It’s, it’s the shape of it… It’s certain clothes you’re wearing and people might ask "Oh my God what have you got on?"… You know what I mean? So it’s a bit… Embarrassing!” – Focus group with English-speaking South Asian mothers The main issues raised with the activPAL3 were the large size of the device in relation to the size of children’s thighs and the unease of use with certain types of clothing for the mothers. C 1 – “That actually if you, if you thought about it in an adult…” C 2 – “It looks a bit big doesn’t it?” C 1 – “You’re looking at something like that on our legs… [mimicking equivalent size of activPAL3 on mother’s leg]” Moderator – “Yeah…” C 1 – “That would be annoying… [placing activPAL3 against child’s thigh]” Moderator – “Yeah…” C 1 – “And actually that, for the size of his legs… It would be uncomfortable for him.” - Focus group with White British mothers Regarding the issue with the large size of the activPAL3 in relation to children’s thighs, mothers suggested that devising a similar accelerometer to be as thin as a sticker might help with making it less noticeable and less uncomfortable for such young children. For the embarrassment issue with both the Actiheart and the activPAL3, the only solution mentioned by the mothers was to wear clothes that would conceal the accelerometer during the data collection period. While some mothers seemed willing to make this effort “for the benefit of the study” (focus group with White British mothers), others showed some apprehension about it. C 3 – “It just means you can’t wear skinny jeans… And leggings… [wearing the activPAL3]“ C 1 – “It’s only for a week!” 113 Chapter Three – Feasibility and acceptability of using three accelerometers with 2 to 3 year old South Asian and White British children and both parents – an exploratory qualitative study ______________________________________________________________________________________________________ C 3 – “I know, yeah but…” C 1 – “Just wear some more baggy…” C 3 – “It’s skinny jean weather really! You don’t wanna wear something baggy, ‘cause the air goes up your leg and you get cold…!” - Focus group with White British mothers Table 2 - Issues raised by the mothers regarding the use of each accelerometer with their children, themselves and the fathers. ActiGraph GT3X+ Actiheart activPAL3 1. Placement location is too invasive (on chest and directly onto skin); 1. Large size of the device in 1. Children may pull off or Children fiddle with device, if its presence is noticed. 2. Discomfort caused by the direct contact of the electrode relation to the size of children’s thighs; pads with skin; 2. Possible allergic skin 3. Children pulling-off and/or reaction to the stickie. fiddling with the device; 4. Possible allergic skin reaction to electrode pads. 1. Unease of use with tight Mothers - 1. Unsuitability of use with items of clothing (e.g. “skinny certain items of clothing (e.g. jeans”, leggings or skirts), tops that do not cover chest linked to the possibility of area), which could lead to accidentally detaching the embarrassment; device and embarrassment 2. Discomfort caused by the due to visibility of the monitor; direct contact of the electrode 2. Discomfort caused by the pads with skin. direct contact of the stickie with the skin. Fathers 1 - 1. Unsuitability of use due to - chest hair. 1 Note: South Asian mothers found it especially difficult to comment on the suitability of devices for fathers. A separate study with fathers would be required to fully understand the potential problems associated with them wearing the monitors. 114 Chapter Three – Feasibility and acceptability of using three accelerometers with 2 to 3 year old South Asian and White British children and both parents – an exploratory qualitative study ______________________________________________________________________________________________________ 3.4. Discussion This study investigated the qualitative feasibility of using the ActiGraph GT3X+, the Actiheart and the activPAL3 accelerometers to monitor the PA of 2-3 year old South Asian and White British children and both parents, for eight consecutive days. The ActiGraph GT3X+ was the most preferred activity monitor overall, and the one that prompted the least number of issues for use with the children. The Actiheart was the least accepted monitor, and the one raising the highest amount of issues regarding its use with all three family members. Regarding the issues raised about use of each monitor with the toddlers, no substantial differences were found between ethnicities. However, most South Asian mothers suggested that fathers should be directly asked for their opinions about wearing the accelerometers, and some showed a stronger opposition to wearing the Actiheart than White British mothers. The current results regarding the ActiGraph GT3X+ are in line with the findings of van Cauwenberghe et al. (2011). The authors reported that, after data collection, the majority of the parents in their study perceived wearing the accelerometer (GT1M model) was “not unpleasant and not pleasant” for their children (van Cauwenberghe et al, 2011). Although some issues raised by the mothers are not based on actual experiences and may not arise in real circumstances (e.g. allergic reaction of the skin to the electrode pads [Actiheart] or stickies [activPAL3]), these are issues that they would be likely to consider when deciding whether to take part in a study or not. Knowledge about the latter can aid researchers in choosing the most appropriate activity monitor for future studies and help to tailor information materials to tackle potential problems that may stop some parents and children from enrolling in studies. If attachment to the skin is necessary (as with the Actiheart and activPAL3), researchers can include in study information materials if the electrode pads are hypoallergenic, if there is a possibility of a slight rash appearing after pealing the pads and how this can be addressed if the mother is worried (e.g. applying creams designed for nappy rash). An alternative approach could be to demonstrate the procedure of monitor placement and removal while explaining the study to the parent/caregiver (if recruitment is conducted in person), to allow the parent/caregiver to witness the inexistence of a rash, or the possible light 115 Chapter Three – Feasibility and acceptability of using three accelerometers with 2 to 3 year old South Asian and White British children and both parents – an exploratory qualitative study ______________________________________________________________________________________________________ rash appearing and disappearing. To address worries of embarrassment due to the monitor being visible to other people, study information materials can state if the monitor can be worn underneath the clothes or removed if necessary (e.g. for special occasions where hiding the monitor under the clothes may not be possible). Considering the reaction of the South Asian mothers regarding the acceptability of the three activity monitors for the fathers, it was not clear if the latter would be willing to wear, or have issues with the devices. Further research with South Asian fathers is therefore needed. Several challenges in recruiting South Asian individuals into research have been previously reported (Hussain-Gambles, Atkin & Leese, 2006; Rooney et al, 2011), and the exclusion and/or under representation of such ethnic minorities often seriously hinders the generalizability of study results (Hussain-Gambles, Atkin & Leese., 2006). The findings of this study highlight the importance for researchers to also assess the feasibility and acceptability of using the different tools that are planned for use in a study measuring PA/SB (such as activity monitors) directly with representatives from all participant groups. Local organisations or projects that have established connections with minority groups (e.g. the BIB project or Children’s Centers) are valuable resources of useful information about: 1) how to best approach individuals during recruitment – what are the best means of communication (e.g. using written information letters, advertisement posters or direct contact), if there is a need for translated materials, which language is appropriate (e.g. within South Asian migrants from Bangladesh, several languages or dialects may be spoken, such as Bengali, Sylheti or Rangpuri) and where to find resources for the translation; 2) information that may be key for individuals to consider participating in the study – for example, the possibility of having the study explained/run in a migrant’s first language, and providing crèche facilities or allowing mothers to have children present during the focus groups was crucial for their attendance in the present study; 3) issues that may come up with study procedures/materials and possible solutions – for example, if the aim of the study is to assess habitual PA in Muslim communities and researchers are not aware of religious holidays or practices, it would be important to know in advance the dates of such festivals so that data collection can happen outside of this period, when individuals are 116 Chapter Three – Feasibility and acceptability of using three accelerometers with 2 to 3 year old South Asian and White British children and both parents – an exploratory qualitative study ______________________________________________________________________________________________________ likely to alter many daily routines. Additionally, creating links with such organisations/projects can help with issues of mistrust (Hussain-Gambles, Atkin & Leese, 2006), by associating the image of the study with an organisation that participants already know and trust. The organisations’ staff might also facilitate participant recruitment. Ultimately, these strategies will help to increase cultural sensitivity of study tools and procedures, maximize the chances for enrolment, and improve compliance with the study protocol (Hussain-Gambles, Atkin & Leese, 2006). This study adds to the literature by reporting several practical issues that may arise with the use of three of the most recently available accelerometers, in parents and very young children of two different ethnic backgrounds, which have not been previously reported. Such information is important for the challenging process of choosing the most appropriate activity monitor for studies with very young children (Cliff, Reilly & Okely, 2009; MacLain & Tudor-Locke, 2009; Trost, McIver & Pate, 2005). Nevertheless, this study is not without limitations. Firstly, the results are based on mothers’ opinions only, and not on a practical investigation where the accelerometers were placed on children and their actual reactions assessed. The latter will be assessed in the following chapter. Secondly, the acceptability of the monitors for use with the fathers was also only indirectly assessed through the mothers, thus, one cannot ignore the possibility of different results if the fathers had directly been asked for their opinions. Thirdly, although the sample included different ethnicities and education levels, because of the qualitative method used and the low range of SES levels, one cannot generalize the results to the wider UK population. Nevertheless, this remains the first study to assess such practical issues regarding more than one activity monitor, in relation to both parents and children, in a multiethnic sample, and the results represent important issues that researchers should consider before instrument selection for future research involving the assessment of PA and SB in such young children and their parents/caregivers concurrently. 117 Chapter Three – Feasibility and acceptability of using three accelerometers with 2 to 3 year old South Asian and White British children and both parents – an exploratory qualitative study ______________________________________________________________________________________________________ In conclusion, the ActiGraph GT3X+ was the overall most accepted monitor for use with all three family members, whereas the Actiheart raised the highest number of issues and negative reactions by the mothers (especially South Asians). As such, when planning a study using activity monitors to measure PA/SB, it is important that researchers assess the feasibility and acceptability of a range of devices with a sample of individuals that is representative of the population of interest, to enhance compliance with study protocols and reduce the chances of recruiting a biased sample because certain types of participants are not willing to use the sensor. While this chapter has shown that the ActiGraph was the most accepted accelerometer for use with the toddlers, there is currently only one set of cut-points available to assess time spent in SB and different intensities of PA in this younger age group (Trost et al, 2012), and its validity has not been investigated beyond Trost et al’s (2012) calibration study. The following chapter describes a study aiming to calibrate the ActiGraph GT3X+, the Actiheart and the actvPAL3 to assess SB, light PA and MVPA in 2-3 year old South Asian and White British children 118 Chapter Four - Calibration of the ActiGraph GT3X+, Actiheart, and activPAL3 accelerometers for the assessment of sedentary behaviour and physical activity of 2 to 3 year old children CHAPTER FOUR Calibration of the ActiGraph GT3X+, Actiheart, and activPAL3 accelerometers for the assessment of sedentary behaviour and physical activity of 2 to 3 year old children The results presented in this chapter and in chapter five have been submitted for publication as one manuscript, which is currently under review at the Journal of Science and Medicine in Sport. 119 Chapter Four - Calibration of the ActiGraph GT3X+, Actiheart, and activPAL3 accelerometers for the assessment of sedentary behaviour and physical activity of 2 to 3 year old children 4.1. Introduction From the beginning of the 21st century, there has been an increase in the amount of studies investigating the validity and reliability of accelerometers to measure PA and SB in preschool children (Cliff, Reilly & Okely, 2009). To date, the vast majority of research using accelerometers with pre-schoolers has focused on children aged ≥3 years (Cliff, Reilly & Okely, 2009) and studies with toddlers are lacking (Cardon, Van Cauwenberghe & De Bourdeaudhuij, 2011). Trost et al (2012) have recently published the first set of accelerometry cut-points to define SB, light and moderateto-vigorous PA (MVPA) for the ActiGraph GT1M, in 1.5-3 year olds. These cut-points showed high classification accuracy in the calibration study, and group-level estimates of MVPA that were not significantly different from the gold-standard of direct observation (Trost et al, 2012). However, Trost et al (2012) used a modified and non-validated version of the CARS (Puhl et al, 1990) as the gold-standard to calibrate and validate the ActiGraph GT1M, where an average epoch score of three was considered MVPA instead of a score of four or greater in the original CARS. Additionally, no information about the sensitivity or specificity of each cut-point was presented, and predicted time spent in SB for the validation sample was significantly overestimated in relation to direct observation. The same study concluded that an adaptation of the existing NHANES SB cut-point (≤25 counts/15-sec) and Pate et al’s (2006) MVPA cut-point (≥420 counts/15-sec) seemed to be better suited for use with toddlers than the newly developed cut-points (Trost et al, 2012). The lack of improvement of Trost and colleagues’ (2012) cut-points in relation to previously published cut-points for 3-5 year olds may be due to the use of a similar epoch length and vertical acceleration only. Young children’s activity patterns are typically sporadic and intermittent, with short bursts of MVPA punctuated by periods of lower intensity PA or SB (Bailey et al, 1995; Cliff, Reilly & Okely, 2009; Oliver, Schofield & Schluter, 2009). Using the CARS with video-recorded free-play, Oliver, Schofield and Schluter (2009) reported that preschoolers spent 75% of time in one intensity level for ≤5 seconds, and CARS level two (no translocation) was most commonly associated with longer durations before a change in intensity. Thus, epochs <15 seconds may be needed to accurately identify and register short bouts of more intense activity (Freedson, Pober & Janz, 2005), and avoid computing short 120 Chapter Four - Calibration of the ActiGraph GT3X+, Actiheart, and activPAL3 accelerometers for the assessment of sedentary behaviour and physical activity of 2 to 3 year old children bouts of SB or light PA and MVPA into longer epochs that would be wrongly classified as “light PA” (Cliff, Reilly & Okely, 2009). No published calibration studies with toddlers have used epochs <15 seconds. Due to their distinctive and immature gait pattern (Keen, 1993), the wide range of activities performed (McIver et al, 2009; Oliver, Schofield & Schluter, 2009), and developing motor skills (e.g. balance and kicking), triaxial accelerometry has theoretical advantages in assessing the full range of the activities of children younger than three years but this has not yet been investigated (Oliver, Schofield & Kolt, 2007; Cliff, Reilly & Okely, 2009; Romanzini, Petroski & Reichert, 2012). The ActiGraph (The ActiGraph, Pensacola, USA) is the most widely used accelerometer in research with children (Trost, 2007), and the one for which the most thresholds have been published (Romanzini, Petroski & Reichert, 2012). The GT3X+ model is a triaxial accelerometer that collects information from the vertical, medio-lateral, and anterior-posterior axes, and can combine the acceleration from the three axes into a magnitude vector. Although the newer GT3X+ model has been available for over two years, calibration studies for the ActiGraph have been done using only the vertical axis of the older 7164 and GT1M models, and similar studies using information from all three axes are lacking (Romanzini, Petroski & Reichert, 2012). Similarly, activity monitors combining accelerometry with other PA and SB indicators have become available, which could be an advantage when assessing the distinctive pattern and wide range of toddlers’ activity behaviours (Cliff, Reilly & Okely, 2009). The Actiheart and the activPAL3 are two devices recently available in the market, which have been described in detail in the previous chapter (see section 3.2.).. Although both the Actiheart and activPAL3 have been available for a few years, there are no published studies calibrating these monitors for use with children younger than three years. The aims of this study were: 1) to calibrate the ActiGraph GT3X+, the Actiheart, and the activPAL3 to assess SB, light PA and MVPA in 2-3 year old children, and 2) to evaluate the possible improvement in classification accuracy of using triaxial versus uniaxial acceleration in the classification of SB, light and MVPA 121 Chapter Four - Calibration of the ActiGraph GT3X+, Actiheart, and activPAL3 accelerometers for the assessment of sedentary behaviour and physical activity of 2 to 3 year old children 4.2. Methods 4.2.1. Sample Children were recruited from Children’s’ Centres, playgroups and nurseries from Bradford and Loughborough (UK) between January 2011 and January 2012. The study was explained to the parents either directly or through an invitation letter and participant information sheet. Prior to the start of data collection, written informed consent was provided by the parents for their child’s participation. Twenty-six toddlers (mean age: 2.79 ±0.55 years; 13 girls) took part in the study. Before the start of the activity session, children’s height and weight were measured on site by the author (who has had extensive experience and anthropometry training with individuals certified by the International Society for the Advancement of Kinanthropometry), with children wearing light clothes (e.g. t-shirt and light trousers) and no shoes. Mothers also reported their child’s date of birth and ethnicity through a small questionnaire, before each activity session. All study procedures were reviewed and approved by the Loughborough University’s Ethical Advisory Committee. 4.2.2. Physical Activity and Sedentary Behaviour Measurement Similarly to several previous calibration/validation studies with preschool children (Trost et al, 2012; De Bock et al, 2010; Van Cauwenberghe et al, 2011; Sirard et al, 2005), the CARS observation system (Puhl et al, 1990) was chosen as the goldstandard for the assessment of SB and PA intensity. The CARS classifies children’s activity into five levels of intensity: level one – stationary with no movement; level two – stationary with movement of limbs; level three – slow/easy translocation; level four – translocation with moderate effort; and level five – fast translocation requiring strenuous effort (Puhl et al, 1990). Children were video-recorded during semistructured activity sessions based on activities described for each of the five levels of the CARS (Puhl et al, 1990). The latter were also representative of the typical activities performed by young children, as previously advised (Welk, 2005). Recording was done using high-definition video-cameras that were synchronised with the portable computer used to initialise all accelerometers. These activity sessions were run by the author and an assistant (whenever possible) in a separate room at Bradford’s Children’s Centres, and in a small sports hall or a classroom at 122 Chapter Four - Calibration of the ActiGraph GT3X+, Actiheart, and activPAL3 accelerometers for the assessment of sedentary behaviour and physical activity of 2 to 3 year old children Loughborough University, and mothers or caregivers (e.g. nursery practitioners) were present in all activity sessions. Each activity session lasted 20-30 minutes, which allowed between four and six minutes per set of activities corresponding to each level of the CARS (Puhl et al, 1990), depending on how well children were complying with the requested activities. The video files from the activity sessions were coded according to the CARS (Puhl et al, 1990) on a second-by-second basis, in Microsoft Office ExcelTM, after training with the CARS coding system using videos of 4 independent children. The colours of children’s clothes were noted on their measurement sheets at the beginning of all activity sessions, to allow the clear identification of each child during the videocoding process. CARS scores were then averaged for each 5- and 10-second epochs, and time spent in SB, light PA and MVPA was calculated. Only complete epochs (i.e. where children were visible in the videos for the whole epoch duration) were used for analyses. Intra-rater reliability was tested by coding one random minute of video from each child, with more than one month between the two rating episodes. The Intra-class Correlation Coefficient (two-way model, consistency type) for the average measures between the two ratings was 0.96. During the activity sessions, children wore an ActiGraph GT3X+, an Actiheart, and an activPAL. The ActiGraph GT3X+ accelerometer (figure 1, section 3.2.) consists of piezoelectric sensors that record raw acceleration data in three axes (described in detail in section 3.2.), enclosed in a case that is waterproof at depths <1.5 meters for up to 30 minutes (The ActiGraph, 2012). The accelerations registered range in magnitude from -/+ 6 g, and the acceleration output is digitalized by a 12-bit analogto-digital converter at a sampling rate (30-100 Hz) specified by the researcher upon initialisation. During the download process, the resulting raw file is converted into an agd file that contains acceleration data grouped into epochs ranging from one to 60 seconds, which can then be analysed by the ActiLifeTM software (The ActiGraph, Pensacola, IL, USA). A proprietary filter algorithm can be applied during the download process, called the low frequency extension, to eliminate accelerations outside of the bandwidth of normal human movement (The ActiGraph, 2012). Applying the low frequency extension increases the sensitivity to activities with very 123 Chapter Four - Calibration of the ActiGraph GT3X+, Actiheart, and activPAL3 accelerometers for the assessment of sedentary behaviour and physical activity of 2 to 3 year old children low amplitude, which can be useful when measuring activity data for individuals who move slowly or take very few steps (The ActiGraph, 2012). The ActiGraph GT3X+ was programmed in advance to start collecting data at the planned time for the start of the activity session, and placed on the children’s right hips (at the level of the anterior superior iliac spine) and on top of their clothes. Monitors were programmed to collect acceleration data at 80Hz, which was the maximum resolution possible in order to collect data for at least eight days. This resolution was chosen since up to seven days may be needed to reliably assess the PA of preschool children in surveillance studies (Cliff, Reilly & Okely, 2009), and one extra day added to allow the removal of the first day to account for possible reactivity. Data were downloaded and converted into activity counts for 5- and 10second epochs, using the low frequency extension. Subsequently Microsoft Office ExcelTM spread sheets for each epoch duration were created with the ActiLifeTM software (v. 6), containing data from Axes one (vertical), two (medio-lateral), three (anterior-posterior), and vector magnitude (VM) acceleration. VM is computed by the ActiLifeTM software (v. 6) as follows: √(Axis12 + Axis22 + Axis32) (The ActiGraph, 2012). The Actiheart (figure 2, section 3.2.) is a uniaxial accelerometer and heart rate monitor that consists of two electrodes connected by a cable, and attached directly onto the chest with the help of two electrode pads (see section 3.2. for dimensions). It collects accelerometry and heart rate data aggregated into epochs ranging from 15 to 60 seconds (specified by the researcher at the time of programming), for 10-21 days. Its piezoelectric sensor registers vertical acceleration within a magnitude range > +/-2.5g, digitalized by an 8-bit analog-to-digital converter at a sampling rate of 32Hz (CamNtech, 2010). The electrodes collect a basic electrocardiogram (sensitivity: 250uV), which registers heart rate ranging from 30 to 250 beats per minute at a sampling frequency of 128 Hz (CamNtech, 2010). Before attaching the electrode pads the manufacturers recommend that skin should be prepared by cleaning it with warm water and soap to ensure that skin is clean and oil free (CamNtech, 2010). The manufacturers also recommend rubbing with an abrasive material or cloth to remove the top layer of skin where the electrode pads are going to be placed (CamNtech, 2010). Because of the time-consuming nature of this 124 Chapter Four - Calibration of the ActiGraph GT3X+, Actiheart, and activPAL3 accelerometers for the assessment of sedentary behaviour and physical activity of 2 to 3 year old children process and the resulting redness of the skin (CamNtech, 2010), these two steps were omitted and the electrode pads were placed on children’s chests after cleaning the skin with cleaning towels. The Actihearts were programmed on the proprietary software to collect data in 15-second epochs, and the signal test was performed with every child before the start of the activity session to assure the correct assessment of heart rate. After the activity sessions, data were downloaded into the Actiheart proprietary software. The activPAL3 is a triaxial accelerometer and inclinometer that is attached directly onto the centre of the anterior midline of the thigh (see Figure 3, section 3.2.). It can be made waterproof by wrapping the device in a medical grade adhesive and attaching it to the thigh using another sheet of adhesive. The activPAL3 registers acceleration within a magnitude range > +/-2g, digitalized by an 8-bit analog-todigital converter at a sampling rate of 20Hz, for up to 10 days. Each device was programmed in advance with the proprietary software to start collecting data at the time scheduled for the activity session, with the shortest epoch duration of 15 seconds. After data download and transferral into Excel TM spread sheets containing accelerometer counts per epoch were manually matched with the timecorresponding CARS score, and introduced into STATA (v.6) and SPSS (v.19) statistical software packages for analyses. 4.2.3. Statistical Analysis Due to several issues that arose during data collection (further explained below in section 4.3.1), not enough good quality data was available to perform calibration analyses for both the Actiheart and the activPAL3. Thus, the statistical analysis described henceforward refers only to the calibration of the ActiGraph GT3X+. For clarity purposes, in this chapter “calibration” refers to the value calibration process described earlier in section 2.3.1.6.5. Means, medians, standard deviation (SD), percentiles, and percentages were calculated to describe children’s characteristics and the sample of epochs available for analysis. Normality of the distributions of CARS scores, VM, Axis1, Axis2 and 125 Chapter Four - Calibration of the ActiGraph GT3X+, Actiheart, and activPAL3 accelerometers for the assessment of sedentary behaviour and physical activity of 2 to 3 year old children Axis3 acceleration counts was checked with histograms, and formally tested. Because data were found to be non-normally distributed, relationships between VM, Axis1, Axis2 and Axis3, as well as between these four acceleration parameters and CARS-scores were firstly investigated by scatterplots and tested using Spearman rank correlations. Differences in VM, Axis1, Axis2 and Axis3 acceleration counts between CARS levels were investigated with the Mann-Whitney U tests. Potential differences in the distribution of acceleration magnitudes (VM, Axis1, Axis2 and Axis3) between sexes were explored firstly by plotting VM and each axis against CARS-scores, with separate graphs for boys and girls; and after observation of different distribution shapes, sex differences in accelerations were tested using the Mann-Whitney U test. Bonferroni corrections were applied to all previously mentioned tests to account for multiple comparisons. To account for the repeated nature of the data (i.e. several epochs from the same child), mixed-effects linear regression models were conducted to derive equations predicting mean CARS score (i.e. value calibration) from: 1) the three axes combined (triaxial); 2) Vector Magnitude (VM); and 3) Axis1. All mixed-effects linear regressions were set to run with unstructured covariance of the random effects, and maximum likelihood estimation. To test if the mixed-effects linear regressions provided a significantly better fit for the accelerometry data, all model development procedures started with an “empty model” (i.e. a model with no independent variables) and simple linear regressions. Linear and non-linear approaches (obtained by elevating each axis to the power of 0.5, -0.5, 2, -2, 3 and -3) were tested for improvement in model fit (Bayesian Information Criterion, BIC) and residual diagnostics (SD of the residuals for the random-effects component, histograms and normal probability plots). A power of 0.5 consistently provided the best fit for all prediction equations, thus, the model development process will be explained with the non-linear terms to the power of 0.5 only. The triaxial mixed-effects regression models were developed as follows: Step 1 – including Axis1 and subsequently adding Axis2 and Axis3 (separately and together) to the fixed-effects portion, and participant’s code (ID) to the random-effects portion of the model; Step 2 – adding the non-linear terms Axis10.5, Axis20.5 and Axis30.5 (separately and together) to the fixed-effects portion of the best model from Step 1; 126 Chapter Four - Calibration of the ActiGraph GT3X+, Actiheart, and activPAL3 accelerometers for the assessment of sedentary behaviour and physical activity of 2 to 3 year old children Step 3 – testing for the influence of individual characteristics on the best model from Step 2, by separately adding age, height, weight, BMI and sex as covariates to the fixed-effects portion of the model; Step 4 – when covariates from Step 3 were significant (p<0.05) or borderline significant (p≤0.1), interactions of the covariate were tested by adding interaction terms with each axis to the fixed-effects portion of the model (see appendix 2, describing [in order] the STATA commands used in the model development of the triaxial equation). Axis1 mixed-effects regression models were developed as follows: Step 1 – including Axis1 to the fixed-effects portion, and participant’s code (ID) to the randomeffects portion of the model; Step 2 – adding the non-linear term Axis10.5 to the fixedeffects portion of the model from Step 1; Step 3 – testing for the influence of individual characteristics on the best model so far (Step 1 or 2), by separately adding age, height, weight, BMI and sex as covariates to the fixed-effects portion of the model; Step 4 – when covariates from Step 3 were significant (p<0.05) or borderline significant (p≤0.1), interactions of the covariate were tested by adding interaction terms with each axis to the fixed-effects portion of the model. VM mixed-effects regression models were developed using the same steps as for Axis1, substituting Axis1 and Axis10.5 by VM and VM0.5 respectively. Separate models were conducted for 5- and 10-second epochs, following the procedures described above. Lin’s Concordance coefficients (Lin, 1989 and 2000) and Bland-Altman plots (Altman & Bland, 1983) were conducted to assess precision and accuracy between observed and predicted CARS scores from the mixed-effects equations. Cohen’s kappa (Cohen, 1960), Receiver Operating Characteristic (ROC) curves, predictive and negative predictive values (Altman & Bland, 1994) were calculated to assess the validity of the triaxial equation, Axis1 and VM cut-points resulting from the mixedeffects equations, in classifying SB and MVPA against CARS classification. Because the mixed-effects equations showed very large limits of agreement between observed and predicted CARS scores, and very low agreement for MVPA classification, value calibration of the ActoGraph GT3X+ was also undertaken using ROC curves to derive Axis1 and VM cut-points for SB and MVPA. A set of possible cut-points were gathered based on the best trade-offs between sensitivity and 127 Chapter Four - Calibration of the ActiGraph GT3X+, Actiheart, and activPAL3 accelerometers for the assessment of sedentary behaviour and physical activity of 2 to 3 year old children specificity. The cut-points showing the highest kappa value (thus, higher agreement with the gold-standard) were chosen as the final cut-points. Total time spent in SB, light PA and MVPA was calculated, according to CARS, the mixed-effects equations (3 axis, VM and Axis1), ROC-derived Axis1 and VM cutpoints. Normality of the distribution of time spent in SB, light PA and MVPA according to the different definitions was formally tested. Differences between CARS-predicted SB and PA time (i.e. gold-standard) and that predicted by the newly derived equations and cut-points were tested with paired t-tests (for normally distributed data) or Wilcoxon signed-rank test (for non-normally distributed data). Bonferroni corrections were used to account for multiple comparisons. ROC curve analyses were run on SPSS (v.19) statistical software, and all other statistical analyses were run on STATA (v.12). 4.3. Results 4.3.1. Issues regarding the Actiheart and activPAL3 Several issues (practical and software) with the Actiheart and activPAL3 emerged during the data collection process, which deemed it unfeasible to calibrate both monitors with the toddlers. Regarding the Actiheart, the main practical issues that appeared during the activity sessions were 1) four children not accepting to wear the monitor, 2) four children fiddling with the monitor during data collection, 3) two monitors were found detached from the electrode pads at the end of the session, and 4) failure to pass the signal test (n=2) after three attempts. There was also an error with the proprietary Actiheart software that did not allow the programming of any devices for one of the activity sessions. This error was later resolved by reinstalling the software. All these issues resulted in only 10 children with apparently good quality accelerometer data after inspection of the downloaded files. However, due to the small chest area of the toddlers and the dimensions of the Actiheart, it proved to be extremely hard to keep the accelerometer unit in the correct position necessary for an accurate measurement of PA (CamNtech, 2010), as illustrated in figure 2 (section 3.2). Thus, 128 Chapter Four - Calibration of the ActiGraph GT3X+, Actiheart, and activPAL3 accelerometers for the assessment of sedentary behaviour and physical activity of 2 to 3 year old children it was not possible to assure that the data available were of good quality for use in a calibration study, and no further analysis was conducted with the Actiheart data. Regarding the activPAL3, the main practical issues that appeared during the activity sessions were some children not accepting to wear the monitor (n=3), and fiddling with the monitor during data collection (n=3), which resulted in the detachment of the activPAL3 in one child. However, the critical problems with the activPAL3 were related to software and hardware issues. Firstly, five out of the six activPAL3 units available showed “empty memory” (see Appendix 3) after data collection for the fifth activity session, which resulted in the loss of all data from that session. At the same time, after identifying the activPAL3 with “empty memory”, the proprietary software automatically disconnected the units and was unable to detect them when the researchers attempted to re-establish connection (without disconnecting any of the units from the docking station). Because this problem persisted and only one unit remained active, it was not possible to continue data collection for the activPAL3. Secondly, at download, device clocks showed both time advances and delays in relation to the time on the computer where devices had been programmed. These time differences ranged from a 26-second delay to a 98-second advance, within less than 20 hours of programming time. These differences were not consistent within units – i.e. the same devices could show both delays and advances in time. For example, one unit initially showed a seven-second delay, then a 30-second advance and a 10-second delay in subsequent activity sessions. Some units showed the device clock running backwards, resulting in time delays of over four years, with the most extreme situation showing the activPAL3 clock at 7:34am on 25/06/1970 when the computer time was 12:04pm on 27/10/2011 (see Appendix 3). Such time discrepancies and inconsistencies made it impossible to synchronise the activPAL3 data with the video files, deeming the available data unsuitable to pursue any calibration analysis. 4.3.2. Characteristics of the final sample After removal of nine children due to problems with the synchronisation of video with accelerometer data, the final sample comprised 18 children. Sample characteristics are presented below in table 3. 129 Chapter Four - Calibration of the ActiGraph GT3X+, Actiheart, and activPAL3 accelerometers for the assessment of sedentary behaviour and physical activity of 2 to 3 year old children Table 3 - Sample description. Sample size 18 Mean age (SD) 2.9 (0.6) in years 56% ♀ / 44% ♂ Sex Ethnicity 83% WB / 17% SA Mean height (SD) 93.6 (6.8) in centimetres Mean weight (SD) 14.9 (3.0) in kilograms Mean BMI (SD) 16.8 (1.7) SD – Standard Deviation; WB – White British; South Asian – South 2 Asian; BMI – Body Mass Index (kg/m ) A total of 3417 valid 5-second epochs, and 1644 valid 10-second epochs were available for analysis. Within the 5-second epochs, 40.30% had CARS scores ≤2 (i.e. SB), 48.20% had CARS scores >2 but <4 (i.e. light PA), and 11.50% had CARS scores ≥4 (i.e. MVPA). Within the 10-second epochs, 36.86% had CARS scores ≤2, 54.93% had scores >2 but <4, and only 8.21% had CARS scores ≥4. Further details for boys and girls can be found on the table below. Table 4 - Description of 5- and 10-second epochs included in the analysis. 5-second epochs 10-second epochs Overall ♂ ♀ Overall ♂ ♀ 189.8 181.6 196.4 91.3 88.0 94.0 (134 – 247) (134 – 211) (147 – 247) (62 – 122) (62 – 100) (71 – 122) Total SB 1 377 487 890* 606 217 389* epochs (40.30%) (33.52%) (45.31%) (36.86%) (30.82%) (41.38%) 1 647 745 902* 903 415 488* (48.20%) (51.27%) (45.93%) (54.93%) (58.95%) (51.92%) 393 221 172* 135 72 63* (11.50%) (15.21%) (8.76%) (8.21%) (10.23%) (6.70) Mean number of epochs per child (range) Total Light PA epochs Total MVPA epochs SB – Sedentary behaviour; PA – Physical activity; MVPA – Moderate-to-vigorous PA. 130 Chapter Four - Calibration of the ActiGraph GT3X+, Actiheart, and activPAL3 accelerometers for the assessment of sedentary behaviour and physical activity of 2 to 3 year old children *Proportion of epochs classified as SB, Light PA and MVPA is significantly different between boys and girls (5-second: 2 2 x = 64.033, p<0.001; 10-second: x = 21.893, p<0.001) Axis1, Axis2 and Axis3 were highly and significantly correlated with each other (r= 0.878 - 0.892; p<0.0001) and with CARS-scores (r= 0.808 - 0.816; p<0.0001), suggesting that all axes provide similar information about children’s activity intensity. Median (95% CI) axes’ counts overall and for each CARS level are presented below in table 5, for 5- and 10-sec epochs in boys and girls. Table 5 - Median accelerometry counts for Axis1 (vertical), Axis2 (medio-lateral) and Axis3 (anterior-posterior), by sex and CARS levels. 5-second epoch ♂ Median counts 95% CI 10-second epoch ♀ ♂ ♀ Axis 1 Axis 2 Axis 3 Axis 1 Axis 2 Axis 3 Axis 1 Axis 2 Axis 3 Axis 1 Axis 2 Axis 3 47* 117* 118* 17 71 87 148* 282* 298* 78 191 227 0 - 472 0 - 442 0 - 459 0 - 374 0 - 346 0 - 371 0 - 868 0 - 842 0 - 864 0 - 700 0 - 637 0 - 719 Median counts by CARS levels: 1 0* # § 0* 0* 0 0 0 0 55 62 * 19 70 91 81 6 § 10 § § 0 16 34 95 218 247 2 10 3 138 * 207 * 205 § 104 161 186 403 § 463 * 481 * 331 365 405 4 326 § 309 * 307 * 236 251 228 708 * 665 * 613 § 415 518 455 5 447 § 313 350 293 288 240 882 802 572 572 519 CI – Confidence Interval; 197 213 837 § *Mann-Whitney U (♂ versus ♀) p≤0.0001; Mann-Whitney U (♂ versus ♀) p<0.008 There was a significant difference between boys and girls in the median accelerometer counts for Axis1, Axis2 and Axis3 (all p<0.0001, two-tailed). Further investigation showed a significant difference between boys and girls in the median accelerometer counts by CARS levels, whereby boys showed lower median counts for levels one and two (representing SB) but higher median counts for levels three, four and five (representing light through vigorous PA; all p<0.0008, two-tailed). This suggested a difference in the magnitude of acceleration counts through CARS scores for boys and girls, which can be seen in figures 6 through 9. 131 Chapter Four - Calibration of the ActiGraph GT3X+, Actiheart, and activPAL3 accelerometers for the assessment of sedentary behaviour and physical activity of 2 to 3 year old children Girls Total 700 600 500 400 300 200 0 100 Counts per 5-second epoch 800 900 Boys 1 2 3 4 5 1 2 3 4 5 1 2 3 4 5 CARS levels Median of Axis1 Median of Axis2 Median of Axis3 Figure 6 - Median Axis1, Axis2 and Axis3 counts per 5-second epochs (total and by sex). Girls Total 700 600 500 400 300 200 100 0 Counts per 10-second epoch 800 900 Boys 1 2 3 4 5 1 2 3 4 5 1 2 3 4 5 CARS levels Median of Axis1 Median of Axis2 Median of Axis3 Figure 7 - Median Axis1, Axis2 and Axis3 counts per 10-second epochs (total and by sex). 132 Chapter Four - Calibration of the ActiGraph GT3X+, Actiheart, and activPAL3 accelerometers for the assessment of sedentary behaviour and physical activity of 2 to 3 year old children Total 200 400 600 800 1,000 1,200 1,400 Girls 0 Vector Magnitude per 5-second epoch Boys 1 2 3 4 5 1 2 3 4 5 1 2 3 4 5 CARS level Figure 8 – Median Vector Magnitude per 5-second epochs (total and by sex). Total 200 400 600 800 1,000 1,200 1,400 Girls 0 Vector Magnitude per 10-second epoch Boys 1 2 3 4 5 1 2 3 4 5 1 2 3 4 5 CARS levels Figure 9 - Median Vector Magnitude per 10-second epochs (total and by sex). 133 Chapter Four - Calibration of the ActiGraph GT3X+, Actiheart, and activPAL3 accelerometers for the assessment of sedentary behaviour and physical activity of 2 to 3 year old children 4.3.3. Mixed-effects regression equations for the prediction of CARS scores from Axis1, Axis2 and Axis3 combined Separate mixed-effects regression models were conducted for 5- and 10-second epochs, testing several combinations of axes with linear and non-linear approaches (obtained by elevating each axis to the power of 0.5, -0.5, 2, -2, 3 and -3) for improvement in model fit and diagnostics. A power of 0.5 consistently provided the best fit for the prediction of CARS scores in both 5- and 10-second epochs The best regression model for 5-second epochs was model m1656, which included the following predictor variables: Axis1, Axis2, Axis3, Axis1 0.5, Axis2 0.5, Axis3 0.5, sex, and an interaction term between sex and Axis2. The resulting prediction equation is: 1) CARSxj = 1.369601 + 0.0010698*axis1xj - 0.0013908*axis2xj 0.0020842*axis3xj + 0.0236698*axis10.5xj + 0.093086*axis20.5xj + 0.0637576*axis30.5xj - 0.0833596*sexxj, - 0.0004093*sex_axis2xj Let CARS be the predicted CARS-score of epoch j from child x; axis1, axis2 and axis3 represent the acceleration counts from each axis for epoch j from child x; axis10.5, axis20.5 and axis30.5 represent the acceleration counts from each of the axis for epoch j from child x, elevated to the power of 0.5; sex represent the sex of child x, where male is 0 and female is 1; and sex_axis2 represent the interaction term between the sex of child x and acceleration counts from Axis2 for epoch j from child x (i.e. Axis2 counts multiplied by 0 if male; or Axis2 counts multiplied by one if female). The interaction term means that, although sex does not have an effect on the predicted CARS-score, the effect of Axis2 on predicted CARS-scores differs for boys and girls. This can be illustrated by plotting Axis2 counts against the corresponding CARS-scores, as shown in appendix 4. In general, boys reached higher Axis2 peak accelerations than girls (1509 versus 655 maximum counts), but girls tended to show higher Axis2 acceleration at lower CARS-scores (e.g. percentile 95 at CARS ≤2: 122 134 Chapter Four - Calibration of the ActiGraph GT3X+, Actiheart, and activPAL3 accelerometers for the assessment of sedentary behaviour and physical activity of 2 to 3 year old children versus 85 counts). The minimum Axis2 acceleration to reach a CARS-score of four was higher for boys than for girls (79 versus 45 counts per epoch). The best regression model for 10-second epochs was model m1655, which included the following predictor variables: Axis1, Axis2, Axis3, Axis10.5, axis20.5, Axis30.5, sex, and an interaction term between sex and Axis1. The resulting prediction equation is: 2) CARSxj = 1.205205 + 0.000982*axis1xj - 0.000525*axis2xj 0.001116*axis3xj + 0.0087013*axis10.5xj + 0.0655702*axis20.5xj + 0.0428141*axis30.5xj - 0.0813181*sexxj, - 0.000175*sex_axis1xj Let CARS be the predicted CARS-score of epoch j from child x; axis1, axis2 and axis3 represent the acceleration counts from each axis for epoch j from child x; axis10.5, axis20.5 and axis30.5 represent the acceleration counts from each of the axis for epoch j from child x, elevated to the power of 0.5; sex represent the sex of child x, where male is 0 and female is 1; and sex_axis1 represent the interaction term between the sex of child x and acceleration counts from Axis1 for epoch j from child x. As before, the interaction term means that sex does not have an effect on predicted CARS-score, but the effect of Axis1 on predicted CARS-score differs for boys and girls (illustrated in appendix 4). Girls reached higher peaks of Axis1 acceleration than boys (1917 versus 1537 maximum counts), but they also tended to show higher Axis1 acceleration than boys at lower CARS scores (e.g. percentile 95 at CARS ≤2: 171 versus 97 counts). The minimum Axis1 acceleration to reach a CARS-score of four was higher for boys than for girls (304 versus six counts). 4.3.3.1. Agreement of measurements Lin’s concordance coefficient ranged from 0.806 to 0.898 for 5- and 10-second epochs, which can be classified as poor agreement (McBride, 2005) between observed and predicted CARS-scores. Overall agreement for the classification of SB, light and MVPA was substantial (Landis & Koch, 1977), except for 10-second 135 Chapter Four - Calibration of the ActiGraph GT3X+, Actiheart, and activPAL3 accelerometers for the assessment of sedentary behaviour and physical activity of 2 to 3 year old children epochs in girls where agreement was only moderate (Landis & Koch, 1977). In general, both triaxial equations seemed to perform better for boys than for girls, as shown by the higher kappa values, smaller mean differences between observed and predicted CARS scores, and narrower limits of agreement. Further details can be seen below in table 6. Table 6 - Agreement statistics for prediction of average CARS scores from triaxial regression equations, for 5- and 10-second epochs. 5-second epoch Lin's Concordance 95% CI Mean difference (Bland-Altman) 95% Limits of Agreement Cohen's kappa Correctly classified* 10-second epoch Overall ♂ ♀ Overall ♂ ♀ 0.844 0.875 0.809 0.855 0.898 0.806 0.835 - 0.853 0.863 - 0.886 0.795 - 0.824 0.842 - 0.867 0.884 - 0.910 0.785 - 0.827 -0.006 <0.001 -0.010 -0.008 -0.001 -0.014 -1.069 - 1.056 -0.982 - 0.981 -1.129 - 1.108 -0.956 - 0.939 -0.839 - 0.827 -1.042 - 1.015 0.623 0.631 0.614 0.619 0.659 0.587 78.99% 79.15% 78.87% 80.35% 82.53% 78.72% CI – Confidence Interval; *Total overall percentage of epochs correctly classified as sedentary behaviour, light physical activity and moderate-to-vigorous physical activity. Bland-Altman plots showed very small mean differences between observed and predicted CARS scores for both 5- (-0.006) and 10-second epochs (-0.008). However, many epochs had differences of one unit or higher between the observed and predicted CARS score, with a large portion of differences falling outside of the already wide 95% limits of agreement (see figures 10 and 11). 136 Chapter Four - Calibration of the ActiGraph GT3X+, Actiheart, and activPAL3 accelerometers for the assessment of sedentary behaviour and physical activity of 2 to 3 year old children 1.056 -0.006 -1.069 Figure 10 - Bland-Altman plot for triaxial equation (5-second epochs). 0.939 -0.008 -0.956 Figure 11 - Bland-Altman plot for triaxial equation (10-second epochs). 137 Chapter Four - Calibration of the ActiGraph GT3X+, Actiheart, and activPAL3 accelerometers for the assessment of sedentary behaviour and physical activity of 2 to 3 year old children Agreement between observed and predicted SB classification was substantial (Landis & Koch, 1977), with higher kappa values for 5- than 10-second epochs (table 7). The 5-second triaxial equation identified between 75-80% of the observed SB epochs, whereas the 10-second equation identified between 70-77% of the observed SB epochs. Both 5- and 10-second triaxial equations seemed to perform better in correctly identifying observed SB epochs for boys than for girls, as indicated by higher kappa values and higher rates of true positives and negatives (>89%) . Table 7 - Agreement statistics for the classification of sedentary behaviour from the triaxial regression equations, for 5- and 10-second epochs. Sedentary Behaviour 5-second epoch 10-second epoch Overall ♂ ♀ Overall ♂ ♀ Sensitivity 76.76% 80.08% 74.94% 72.44% 77.42% 69.67% Specificity 96.76% 96.07% 97.39% 95.95% 95.89% 96.01% 0.758 0.785 0.740 0.715 0.761 0.682 Agreement 88.70% 90.71% 87.22% 87.29% 90.20% 85.11% PPV 94.12% 91.12% 95.97% 91.27% 89.36% 92.49% NPV 86.05% 90.54% 82.43% 85.64% 90.50% 81.76% Cohen's kappa PPV – Positive Predictive Value; NPV – Negative Predictive Value. Agreement between observed and predicted MVPA classification was fair for boys and only slight for girls (Landis & Koch, 1977), and marginally higher kappa values for 10- than 5-second epochs, and the kappa value for 10-second epochs in girls approaching zero (table 8). Both 5- and 10-second triaxial equations showed very high specificity but extremely low sensitivity to identify MVPA epochs, especially for girls (see table 8). The triaxial equations identified only 35-39% of observed MVPA in boys, misclassifying roughly a fourth of the resulting MVPA epochs. Although rates of agreement and correctly classified MVPA epochs was high (especially for 10-second: 100%), the epochs identified by the triaxial equations represented only 5-8% of girls’ observed MVPA. 138 Chapter Four - Calibration of the ActiGraph GT3X+, Actiheart, and activPAL3 accelerometers for the assessment of sedentary behaviour and physical activity of 2 to 3 year old children Table 8 - Agreement statistics for the classification of moderate-to-vigorous Physical Activity from the triaxial regression equations, for 5- and 10-second epochs. Moderate-to-Vigorous Physical Activity 5-second epoch 10-second epoch Overall ♂ ♀ Overall ♂ ♀ Sensitivity 23.16% 34.84% 8.14% 22.96% 38.89% 4.76% Specificity 98.97% 97.97% 99.67% 99.34% 98.42% 100.00% 0.316 0.421 0.130 0.327 0.472 0.085 Agreement 90.25% 88.37% 91.65% 93.07% 92.33% 93.62% PPV 74.59% 75.49% 70.00% 75.61% 73.68% 100.00% NPV 90.83% 89.34% 91.87% 93.51% 93.39% 93.60% Cohen's kappa PPV – Positive Predictive Value; NPV – Negative Predictive Value. 4.3.4. Mixed-effects regression equations for the prediction of CARS scores from Axis1 Separate regression models were conducted for 5- and 10-second epochs, and the non-linear approach which elevated Axis1 counts to the power of 0.5 consistently provided the best fit for CARS scores. The best regression model for 5-second epochs was model m555, which included the following predictor variables: axis1, axis1 0.5, sex, and an interaction term between sex and axis1. The resulting prediction equation is: 3) CARSxj = 1.700403 - 0.0029261*axis1xj + 0.1714354*axis10.5xj 0.0829257*sexxj - 0.0003888*sex_axis1xj Let CARS be the predicted CARS score of epoch j from child x; axis1 represent the acceleration counts from Axis1 for epoch j from child x; axis10.5 represent the acceleration counts from Axis1 for epoch j from child x, elevated to the power of 0.5; sex represent the sex of child x, where male is 0 and female is 1; and sex_axis1 represent the interaction term between the sex of child x and acceleration counts from axis1 for epoch j from child x (i.e. Axis1 counts multiplied by 0 if male; or Axis1 counts multiplied by 1 if female). Similarly to section 4.3.3., this interaction means 139 Chapter Four - Calibration of the ActiGraph GT3X+, Actiheart, and activPAL3 accelerometers for the assessment of sedentary behaviour and physical activity of 2 to 3 year old children that the effect of Axis1 on predicted CARS scores differs for boys and girls. Girls reached higher peaks of Axis1 acceleration than boys (962 versus 883 maximum counts), and the minimum Axis1 acceleration to reach a CARS score of 4 was higher for girls than for boys (56 versus 43 counts), as illustrated below in figure 12. However, girls also showed higher Axis1 acceleration than boys at lower CARS scores (e.g. percentile 95 at CARS ≤ 2: 76 versus 31 counts). Figure 12 – Axis1 counts by observed CARS score, for 5-secod epochs The best regression model for 10-second epochs was also model m555, including the same predictor variables. The resulting prediction equation is: 4) CARSxj = 1.526659 - 0.0011472*axis1xj + 0.1163342*axis10.5xj - 0.0543172 *sexxj - 0.0003888 *sex_axis1xj Let CARS be the predicted CARS score of epoch j from child x; axis1 represent the acceleration counts from Axis1 for epoch j from child x; axis10.5 represent the acceleration counts from Axis1 for epoch j from child x, elevated to the power of 0.5; 140 Chapter Four - Calibration of the ActiGraph GT3X+, Actiheart, and activPAL3 accelerometers for the assessment of sedentary behaviour and physical activity of 2 to 3 year old children sex represent the sex of child x, where male is 0 and female is 1; and sex_axis1 represent the interaction term between the sex of child x and acceleration counts from axis1 for epoch j from child x. As in section 4.3.3., this interaction term means that the effect of Axis1 on predicted CARS scores differs for boys and girls. 4.3.4.1. Agreement of measurements Lin’s concordance coefficient was 0.735–0.867 for both 5- and 10-second epochs, which can be classified as poor agreement (McBride, 2005) between observed and predicted CARS scores. Overall agreement for classification of SB, light and MVPA was moderate to substantial (Landis & Koch, 1977). Both 5- and 10-second equations seemed to perform better for boys than for girls, as indicated by the higher kappa values, smaller mean differences between observed and predicted CARS scores, and narrower limits of agreement. Further details can be seen in table 9. Table 9 - Agreement statistics for prediction of CARS scores from Axis1 regression equation, for 5- and 10-second epochs. 5-second epoch Overall ♂ ♀ Overall ♂ ♀ 0.786 0.831 0.735 0.814 0.867 0.755 0.774 - 0.798 0.816 - 0.846 0.717 - 0.754 0.799 - 0.830 0.849 - 0.885 0.729 - 0.781 -0.008 -0.001 -0.014 -0.011 -0.002 -0.018 Lin's Concordance 95% CI Mean difference (Bland-Altman) 95% Limits of Agreement 10-second epoch -1.225 - 1.209 -1.113 - 1.110 -1.303 - 1.276 -1.067 - 1.044 -0.933 - 0.928 -1.158 - 1.123 Cohen's kappa Correctly classified 0.577 0.596 0.556 0.599 0.652 0.557 76.29% 76.88% 75.87% 79.08% 81.82% 77.02% CI – Confidence Interval Bland-Altman plots showed very small mean differences between observed and predicted CARS scores. However, the 95% limits of agreement were extremely wide and a large proportion of epochs reached a difference ≥1.5 units between the observed and predicted CARS scores (see figures 13 and 14) 141 Chapter Four - Calibration of the ActiGraph GT3X+, Actiheart, and activPAL3 accelerometers for the assessment of sedentary behaviour and physical activity of 2 to 3 year old children Figure 13 - Bland-Altman plot for Axis1 equation (5-second epochs). Figure 14 - Bland-Altman plot for Axis1 equation (10-second epochs). 142 Chapter Four - Calibration of the ActiGraph GT3X+, Actiheart, and activPAL3 accelerometers for the assessment of sedentary behaviour and physical activity of 2 to 3 year old children Agreement between observed and predicted SB classification was substantial (Landis & Koch, 1977), with good to excellent accuracy shown by AUC ranging from 0.899 to 0.960 (Metz, 1978 in Trost et al, 2012). The 5-second Axis1 equation identified 81–86% of the observed SB epochs, and the 10-second equation identified 74–86% of the observed SB epochs. Both 5- and 10-second Axis1 equations seemed to perform better in correctly identifying observed SB epochs for boys than for girls, as indicated by higher kappa values and better rates of true negatives (>93%) for similar true positives (table 10). Table 10 - Agreement statistics for sedentary behaviour classification from Axis1 regression equation, for 5- and 10-second epochs. Sedentary Behaviour 5-second epoch 10-second epoch ♂ ♀ ♂ ♀ ≤3 ≤5 ≤ 18 ≤ 23 Sensitivity 86.40% 81.30% 85.70% 73.80% Specificity 91.50% 87.30% 92.40% 90.60% 0.933 0.899 0.960 0.906 0.919 - 0.946 0.885 - 0.914 0.945 - 0.974 0.887 - 0.925 0.773 0.689 0.775 0.656 Agreement 89.81% 84.62% 90.34% 83.62% PPV 83.70% 84.19% 83.41% 84.66% NPV 93.05% 84.96% 93.56% 83.03% Cut-point (counts) AUC 95% CI Cohen's kappa AUC – Area under the curve; CI - Confidence Interval; PPV – Positive Predictive Value; NPV – Negative Predictive Value. Agreement between observed and predicted MVPA classification was fair for boys (Landis & Koch, 1977), with slightly higher kappa values for 10- than 5-second epochs (table 11). Due to the negative coefficients for sex and sex*axis1 interaction in girls, predicted CARS scores start to decrease from 669 counts for 5-second epochs, and 1650 counts for 10-second epochs. Because of this, predicted CARS score for girls is never >3.84, resulting in poor agreement (Landis & Koch, 1977) with no epoch being classified as MVPA. Both 5- and 10-second Axis1 equations showed very high specificity but very low sensitivity to identify boy’s observed MVPA epochs (see table 11). Less than 30% of 143 Chapter Four - Calibration of the ActiGraph GT3X+, Actiheart, and activPAL3 accelerometers for the assessment of sedentary behaviour and physical activity of 2 to 3 year old children boys’ observed MVPA epochs were identified, and roughly a third of epochs classified by the regression equation as SB were false positives. Table 11 - Agreement statistics for moderate-to-vigorous physical activity classification from Axis1 regression equation, for 5- and 10second epochs. Moderate-to-Vigorous Physical Activity 5-second epoch 10-second epoch ♂ ♀ ♂ ♀ ≥ 429 * ≥ 920 * Sensitivity 29.40% - 29.20% - Specificity 97.20% - 98.40% - 0.919 0.906 0.928 0.871 0.904 - 0.933 0.892 - 0.921 0.906 - .950 0.839 - 0.903 0.344 0.000 0.384 0.000 Agreement 86.99% 91.24% 91.48% 93.30% PPV 66.67% 00.00% 68.75% 00.00% NPV 88.43% 91.24% 92.56% 93.30% Cut-point (counts) AUC 95% C. I. Cohen's kappa AUC – Area under the curve; CI - Confidence Interval; PPV – Positive Predictive Value; NPV – Negative Predictive Value. *Predicted CARS score is never >3.84, thus, no cut-point for CARS ≥4 can be defined. 4.3.5. Mixed-effects regression equations for the prediction of CARS scores from Vector Magnitude Separate regression models were conducted for 5- and 10-second epochs, and the non-linear approach which elevated VM counts to the power of 0.5 consistently provided the best fit for CARS scores. In contrary to the triaxial and Axis1 analysis, sex showed no significant interaction with Vector Magnitude and was, therefore, not included in the final regression models. The best regression model for 5-second epochs was model m5, which included the following predictor variables: VM and VM0.5. The resulting prediction equation is: 5) CARSxj = 1.285095 - 0.0011025*VMxj + 0.1235048*VM0.5xj 144 Chapter Four - Calibration of the ActiGraph GT3X+, Actiheart, and activPAL3 accelerometers for the assessment of sedentary behaviour and physical activity of 2 to 3 year old children Let CARS be the predicted CARS score of epoch j from child x; VM represent the VM for epoch j from child x; and VM0.5 represent the VM for epoch j from child x, elevated to the power of 0.5. The best regression model for 10-second epochs was also model m5. The resulting prediction equation is: 6) CARSxj = 1.104998 - 0.0004469*VMxj + 0.0873266*VM0.5xj Let CARS be the predicted CARS score of epoch j from child x; VM represent the VM for epoch j from child x; and VM0.5 represent the VM for epoch j from child x, elevated to the power of 0.5. 4.3.5.1. Agreement of measurements Lin’s concordance coefficient was 0.785–0.862 for both 5- and 10-second epochs, which can be classified as poor agreement (McBride, 2005) between observed and predicted CARS scores. Overall agreement for classification of SB, light and MVPA was only moderate (Landis & Koch, 1977), with overall correct classification rates always <80%. Further details can be seen below in table 12. Table 12 - Agreement statistics for prediction of CARS scores from Vector Magnitude regression equation, for 5- and 10-second epochs. 5-second epoch Lin's Concordance 95% CI Mean difference (Bland-Altman) 95% Limits of Agreement Cohen's kappa Correctly classified 10-second epoch Overall ♂ ♀ Overall ♂ ♀ 0.813 0.842 0.785 0.825 0.864 0.785 0.803 - 0.824 0.827 - 0.856 0.769 - 0.801 -0.009 0.084 -0.077 0.810 - 0.839 0.846 - 0.882 -0.010 0.074 0.762 - 0.808 -0.073 -1.153 - 1.136 -0.982 - 1.151 -1.259 - 1.104 -1.034 - 1.014 -0.854 - 1.001 -1.148 - 1.002 0.549 0.537 0.557 0.554 0.5704 0.542 75.29% 74.64% 75.76% 77.43% 78.69% 76.49% 145 Chapter Four - Calibration of the ActiGraph GT3X+, Actiheart, and activPAL3 accelerometers for the assessment of sedentary behaviour and physical activity of 2 to 3 year old children Bland-Altman plots showed small mean differences between observed and predicted CARS scores, but consistently larger than those from the triaxial and Axis1 equations. The observed 95% limits of agreement were wide, with an even larger proportion of predicted CARS scores falling outside of those limits than in the triaxial and Axis1 equations (figures 15 and 16). Figure 15 - Bland-Altman plot for Vector Magnitude equation (5-second epochs). 146 Chapter Four - Calibration of the ActiGraph GT3X+, Actiheart, and activPAL3 accelerometers for the assessment of sedentary behaviour and physical activity of 2 to 3 year old children Figure 16 - Bland-Altman plot for Vector Magnitude equation (10-second epochs). Agreement between observed and predicted SB classification was substantial (Landis & Koch, 1977), with excellent accuracy shown by AUC ranging from 0.937 to 0.965 (Metz, 1978 in Trost et al, 2012). However, the 5-second VM equation identified only 68–79% of the observed SB epochs, and the 10-second equation identified slightly less of the observed SB epochs at a rate of 64–78%. Both 5- and 10-second VM equations still seemed to perform better in correctly identifying observed SB epochs for boys than for girls, as indicated by much higher kappa values and better trade-off’s between true negative and true positive rates (table 13). 147 Chapter Four - Calibration of the ActiGraph GT3X+, Actiheart, and activPAL3 accelerometers for the assessment of sedentary behaviour and physical activity of 2 to 3 year old children Table 13 - Agreement statistics for sedentary behaviour classification from Vector Magnitude regression equation, for 5- and 10-second epochs. Sedentary Behaviour 5-second epoch 10-second epoch All ♂ ♀ All ♂ ♀ ≥ 37.44 ≥ 37.44 ≥ 37.44 ≥ 117.62 ≥ 117.62 ≥ 117.62 Sensitivity 73.00% 78.60% 67.90% 69.10% 77.90% 64.30% Specificity 96.60% 96.00% 98.00% 96.00% 95.10% 96.70% 0.947 0.961 0.937 0.945 0.965 0.965 95% CI 0.941 - 0.953 0.951 - 0.971 0.953 - 0.976 0.953 - 0.976 Cohen's kappa 0.715 0.772 0.675 0.6851 0.753 0.639 Agreement 86.79% 90.14% 84.32% 86.07% 89.77% 83.30% PPV 94.18% 90.76% 96.49% 90.89% 87.57% 93.28% NPV 83.52% 89.89% 78.63% 84.19% 90.61% 79.32% Cut-point (counts) AUC 0.926 - 0.947 0.934 - 0.955 AUC – Area under the curve; CI – Confidence Interval; PPV – Positive Predictive Value; NPV – Negative Predictive Value. Agreement between observed and predicted MVPA classification was only slight (Landis & Koch, 1977), with marginally higher kappa values for 10- than 5-second epochs (table 14). Both 5- and 10-second VM equations showed very high specificity (>98%) but extremely low sensitivity to identify observed MVPA epochs (<8%). Additionally, only <60% of the resulting MVPA classified epoch were true positives. Table 14 - Agreement statistics for moderate-to-vigorous physical activity classification from Vector Magnitude regression equation, for 5- and 10-second epochs. Moderate-to-Vigorous Physical Activity 5-second epoch 10-second epoch All ♂ ♀ All ♂ ♀ ≥ 901.58 ≥ 901.58 ≥ 901.58 ≥ 1789.67 ≥ 1789.67 ≥ 1789.67 Sensitivity 7.00% 7.20% 7.60% 3.70% 4.20% 3.20% Specificity 99.00% 98.30% 99.50% 99.20% 98.60% 99.70% 0.901 0.906 0.890 0.891 0.910 0.875 0.873 - 0.906 0.871 - 0.912 0.885 - 0.935 0.845 - 0.904 Cut-point (counts) AUC 95% CI Cohen's kappa 0.891 - 0.910 0.889 - 0.922 0.098 0.079 0.117 0.048 0.044 0.050 Agreement 88.49% 84.49% 91.45% 91.36% 88.92% 93.19% PPV 49.125% 42.86% 59.09% 29.41% 25.00% 40.00% NPV 89.16% 85.52% 91.81% 92.01% 90.03% 93.48% AUC – Area under the curve; CI - Confidence Interval; PPV – Positive Predictive Value; NPV – Negative Predictive Value. 148 Chapter Four - Calibration of the ActiGraph GT3X+, Actiheart, and activPAL3 accelerometers for the assessment of sedentary behaviour and physical activity of 2 to 3 year old children 4.3.6. Axis1 cut-points for the classification of sedentary behaviour, light and moderate-to-vigorous physical activity Separate ROC analyses were performed for 5- and 10-second epochs. Because sex had previously shown an interaction with Axis1, ROC analyses were run to investigate cut-points for boys, girls and overall (i.e. both sexes combined). For 5-second epochs, the SB and MVPA cut-points which showed better agreement with observed CARS classification, and best trade-off between sensitivity and specificity were: Overall: SB ≤ 5 counts/epoch; MVPA ≥ 165 counts/epoch Boys: SB ≤ 5 counts/epoch; MVPA ≥ 203 counts/epoch Girls: SB ≤ 6 counts/epoch; MVPA ≥ 149 counts/epoch The best SB and MVPA cut-points for 10-second epochs were: Overall: SB ≤ 28 counts/epoch; MVPA ≥ 367 counts/epoch Boys: SB ≤ 21 counts/epoch; MVPA ≥ 519 counts/epoch Girls: SB ≤ 28 counts/epoch; MVPA ≥ 267 counts/epoch 4.3.6.1. Agreement of measurements Agreement between observed SB epochs and those classified by Axis1 cut-points was substantial (Landis & Koch, 1977), with excellent accuracy as shown by AUC of 0.899-0.960 (Metz, 1978 in Trost et al, 2012). All 5- and 10-second cut-points identified >76% of the observed SB epochs, and correctly identified >86% of the non-SB epochs. In line with the mixed-effects regressions, Axis1 cut-points performed better in correctly identifying observed SB for boys than for girls, as indicated by higher AUC and kappa values, and better trade-offs between true negatives and true positives (table 15). 149 Chapter Four - Calibration of the ActiGraph GT3X+, Actiheart, and activPAL3 accelerometers for the assessment of sedentary behaviour and physical activity of 2 to 3 year old children Table 15 - Agreement statistics for sedentary behaviour classification from Axis1 cutpoints, for 5- and 10- second epochs. Sedentary Behaviour 5-second epoch 10-second epoch All ♂ ♀ All ♂ ♀ ≤5 ≤5 ≤6 ≤ 28 ≤ 21 ≤ 28 Sensitivity 85.40% 87.30% 82.10% 81.00% 87.60% 76.30% Specificity 87.30% 90.40% 86.70% 89.30% 92.00% 88.60% 0.911 0.933 0.899 0.929 0.960 0.906 0.917 - 0.942 0.945 - 0.974 0.887 - 0.925 Cut-point (counts) AUC 95% CI 0.902 - 0.920 Cohen's kappa 0.722 0.764 0.689 0.704 0.784 0.656 Agreement 86.63% 89.33% 84.62% 86.25% 90.63% 83.51% PPV 83.38% 82.05% 83.64% 81.56% 82.97% 82.50% NPV 88.82% 93.37% 85.41% 88.96% 94.32% 84.14% 0.919 - 0.946 0.885 - 0.914 AUC – Area under the curve; CI - Confidence Interval; PPV – Positive Predictive Value; NPV – Negative Predictive Value. Agreement between observed MVPA epochs and those classified by Axis1 cutpoints was moderate for boys and fair for girls (Landis & Koch, 1977), with good to excellent accuracy as shown by AUC ranging from 0.871 to 0.928 (Metz, 1978 in Trost et al, 2012). Both 5- and 10-second Axis1 cut-points showed high sensitivity (>79%) and specificity (>76%). The rate of true negatives was very high (>96%), however, only 46-45% of boys’ and 21-32% of girls’ MVPA classified epochs were true positives. Axis1 cut-points performed better in correctly identifying observed MVPA for boys than for girls, as indicated by higher AUC and kappa values, and better trade-offs between true negative and true positive rates (table 16). 150 Chapter Four - Calibration of the ActiGraph GT3X+, Actiheart, and activPAL3 accelerometers for the assessment of sedentary behaviour and physical activity of 2 to 3 year old children Table 16 - Agreement statistics for moderate-to-vigorous physical activity classification from Axis1 cut-points, for 5- and 10-second epochs. Moderate-to-Vigorous Physical Activity 5-second epoch 10-second epoch All ♂ ♀ All ♂ ♀ ≥ 165 ≥ 203 ≥ 149 ≥ 367 ≥ 519 ≥ 267 Sensitivity 83.60% 84.60% 82.00% 79.30% 79.20% 88.90% Specificity 84.20% 84.90% 83.60% 80.80% 89.20% 76.40% 0.914 0.919 0.906 0.898 0.928 0.871 0.878 - 0.919 0.906 - .950 0.839 - 0.903 Cut-point (counts) AUC 95% CI 0.906 - 0.923 Cohen's kappa 0.458 0.542 0.388 0.319 0.516 0.267 Agreement 83.61% 84.86% 83.45% 80.66% 88.21% 77.45% PPV 39.95% 50.13% 32.41% 26.95% 45.60% 21.46% NPV 97.64% 96.85% 97.97% 97.75% 97.41% 98.97% 0.904 - 0.933 0.892 - 0.921 AUC – Area under the curve; CI – Confidence Interval; PPV – Positive Predictive Value; NPV – Negative Predictive Value. Although sometimes overlapping (e.g. both overall and boys’ SB 5-second cut-point = 5 counts), sex-specific Axis1 cut-points generally showed improvements in the agreement parameters versus the overall cut-points, which can be better assessed in tables 17 and 18. Boys’ SB cut-points tended to be lower and MVPA cut-points tended to be higher than those for girls. Table 17 - Comparison of agreement statistics for Axis1 overall and sex-specific sedentary behaviour cut-points, for 5- and 10-second epochs Sedentary Behaviour 5-second epoch ♂ 10-second epoch ♀ ♂ ♀ specific overall specific overall specific overall specific overall ≤5 ≤5 ≤6 ≤5 ≤ 21 ≤ 28 ≤ 28 ≤ 28 Sensitivity 87.30% 87.30% 82.10% 81.30% 87.60% 89.40% 76.30% 76.30% Specificity 90.40% 90.40% 86.70% 87.30% 92.00% 92.00% 88.60% 88.60% 0.764 0.764 0.689 0.689 0.7835 0.771 0.656 0.656 Agreement 89.33% 89.33% 84.62% 84.62% 90.63% 89.91% 83.51% 83.51% PPV 82.05% 82.05% 83.64% 84.19% 82.97% 80.17% 82.50% 82.50% NPV 93.37% 93.37% 85.41% 84.96% 94.32% 95.02% 84.14% 84.14% Cut-point (counts) Cohen's kappa AUC – Area under the curve; CI - Confidence Interval; PPV – Positive Predictive Value; NPV – Negative Predictive Value. 151 Chapter Four - Calibration of the ActiGraph GT3X+, Actiheart, and activPAL3 accelerometers for the assessment of sedentary behaviour and physical activity of 2 to 3 year old children Table 18 - Comparison of agreement statistics for Axis1 overall and sex-specific Moderate-toVigorous cut-points, for 5- and 10-second epochs Moderate-to-Vigorous Physical Activity 5-second epoch ♂ 10-second epoch ♀ ♂ ♀ specific overall specific overall specific overall specific overall ≥ 203 ≥ 165 ≥ 149 ≥ 165 ≥ 519 ≥ 367 ≥ 267 ≥ 367 Sensitivity 84.60% 91.40% 82.00% 75.60% 79.20% 91.70% 88.90% 65.10% Specificity 84.90% 80.80% 83.60% 85.30% 89.20% 76.40% 76.40% 83.90% 0.542 0.515 0.388 0.385 0.516 0.3622 0.267 0.261 Agreement 84.86% 82.45% 83.45% 84.47% 88.21% 77.98% 77.45% 82.66% PPV 50.13% 46.12% 32.41% 33.08% 45.60% 30.70% 21.46% 22.53% NPV 96.85% 98.13% 97.97% 97.33% 97.41% 98.77% 98.97% 97.10% Cut-point (counts) Cohen's kappa AUC – Area under the curve; CI – Confidence Interval; PPV – Positive Predictive Value; NPV – Negative Predictive Value. 4.3.7. Vector Magnitude cut-points for the classification of sedentary behaviour, light and moderate-to-vigorous physical activity Separate ROC analyses were performed to find VM cut-points for 5- and 10-second epochs. Although sex did not show a significant interaction with VM in the mixedeffects regression analyses, ROC curves were still run for overall, boys and girls separately, to maintain consistency with previous analyses. From ROC analysis, the best SB and MVPA cut-points for 5-second epochs were: Overall: SB ≤ 96.12; MVPA ≥ 361.94 Boys: SB ≤ 78.72; MVPA ≥ 429.09 Girls: SB ≤ 97.02; MVPA ≥ 327.51 The best SB and MVPA cut-points for 10-second epochs were: Overall: SB ≤ 232.35; MVPA ≥ 784.40 Boys: SB ≤ 187.55; MVPA ≥ 914.94 Girls: SB ≤ 244.18; MVPA ≥ 693.98 152 Chapter Four - Calibration of the ActiGraph GT3X+, Actiheart, and activPAL3 accelerometers for the assessment of sedentary behaviour and physical activity of 2 to 3 year old children 4.3.7.1. Agreement of measurements Agreement between observed SB epochs and those classified by VM cut-points was substantial (Landis & Koch, 1977), with excellent accuracy as shown by AUC of 0.937-0.965 (Metz, 1978 in Trost et al, 2012). All 5- and 10-second cut-points identified >84% of the observed SB epochs, and correctly identified >88% of the non-SB epochs. In line with the mixed-effects regressions, VM cut-points performed better in correctly identifying observed SB for boys than for girls, as indicated by slightly higher AUC and kappa values, and better trade-offs between true negatives and true positives (table 19). Table 19 - Agreement statistics for sedentary behaviour classification from Vector Magnitude cut-points, for 5- and 10-second epochs. Sedentary Behaviour 5-second epoch 10-second epoch All ♂ ♀ All ♂ ♀ Cut-point ≥ 96.12 ≥ 78.72 ≥ 97.02 ≥ 232.35 ≥ 187.55 ≥ 244.18 Sensitivity 87.60% 87.10% 84.20% 86.30% 87.60% 85.30% Specificity 88.40% 91.80% 90.10% 89.40% 91.60% 88.20% 0.947 0.961 0.937 0.945 0.965 0.965 95% CI 0.941 - 0.953 0.951 - 0.971 0.926 - 0.947 0.934 - 0.955 Cohen's kappa 0.761 0.782 0.745 0.750 0.778 0.733 Agreement 88.46% 90.21% 87.42% 88.26% 90.34% 87.02% PPV 85.28% 84.29% 87.60% 82.62% 82.25% 83.63% NPV 90.65% 93.35% 87.29% 91.79% 94.29% 89.50% AUC 0.953 - 0.976 0.953 - 0.976 AUC – Area under the curve; CI – Confidence Interval; PPV – Positive Predictive Value; NPV – Negative Predictive Value. Agreement between observed MVPA epochs and those classified by VM cut-points was moderate for boys and fair for girls (Landis & Koch, 1977), with excellent accuracy for boys and good accuracy for girls (Metz, 1978 in Trost et al, 2012). Both 5- and 10-second VM cut-points showed high sensitivity (≥75%) and specificity (≥82%). The rate of true negatives was very high (≥96%), however, only 38-47% of boys’ and 24-30% of girls’ epochs classified as MVPA were true positives. VM cutpoints performed better in correctly identifying observed MVPA for boys than for girls, as indicated by higher AUC and kappa values, and better true positive rates for similar true negative rates (table 20). 153 Chapter Four - Calibration of the ActiGraph GT3X+, Actiheart, and activPAL3 accelerometers for the assessment of sedentary behaviour and physical activity of 2 to 3 year old children Table 20 - Agreement statistics for moderate-to-vigorous physical activity classification from Vector Magnitude cut-points, for 5- and 10-second epochs. Moderate-to-Vigorous Physical Activity 5-second epoch 10-second epoch All ♂ ♀ All ♂ ♀ Cut-point ≥ 361.94 ≥ 429.09 ≥ 316.72 ≥ 784.40 ≥ 914.94 ≥ 693.98 Sensitivity 82.20% 80.50% 84.90% 76.30% 81.90% 74.60% Specificity 83.10% 83.80% 81.20% 82.40% 85.00% 82.60% 0.901 0.906 0.890 0.891 0.910 0.875 95% CI 0.891 - 0.910 0.889 - 0.922 0.873 - 0.906 0.871 - 0.912 0.885 - 0.935 0.845 - 0.904 Cohen's kappa 0.428 0.499 0.364 0.328 0.445 0.285 Agreement 82.25% 83.39% 81.52% 81.87% 84.66% 82.02% PPV 37.64% 47.20% 30.23% 27.91% 38.31% 23.50% NPV 97.41% 96.00% 98.24% 97.49% 97.64% 97.84% AUC AUC – Area under the curve; CI – Confidence Interval; PPV – Positive Predictive Value; NPV – Negative Predictive Value. The more detailed investigation of ROC analyses by sex showed only a slight improvement in the agreement parameters when applying sex-specific versus overall VM cut-points, and this difference was not as marked as for Axis1 cut-points. In general, boys’ SB cut-points tended to be lower than those for girls, and boys’ MVPA cut-points were also lower than those for girls (tables 21 and 22). Table 21 - Comparison of agreement statistics for Vector Magnitude overall and sex-specific Sedentary Behaviour cut-points, for 5- and 10-second epochs Sedentary Behaviour 5-second epoch ♂ 10-second epoch ♀ ♂ ♀ specific overall specific overall specific overall specific overall Cut-point ≥ 78.72 ≥ 96.12 ≥ 97.02 ≥ 96.12 ≥ 187.55 ≥ 232.35 ≥ 244.18 ≥ 232.35 Sensitivity 87.10% 90.80% 84.20% 84.00% 87.60% 90.80% 85.30% 83.80% Specificity 91.80% 89.40% 90.10% 90.20% 91.60% 89.70% 88.20% 89.10% 0.782 0.776 0.745 0.745 0.778 0.775 0.733 0.730 Agreement 90.21% 89.73% 87.42% 87.42% 90.34% 90.06% 87.02% 86.91% PPV 0.8429 0.8125 87.60% 87.87% 82.25% 79.76% 83.63% 84.46% NPV 0.9335 0.9503 87.29% 87.09% 94.29% 95.62% 89.50% 88.63% Cohen's kappa PPV – Positive Predictive Value; NPV – Negative Predictive Value. 154 Chapter Four - Calibration of the ActiGraph GT3X+, Actiheart, and activPAL3 accelerometers for the assessment of sedentary behaviour and physical activity of 2 to 3 year old children Table 22 - Comparison of agreement statistics for Vector Magnitude overall and sex-specific Moderate-to-Vigorous cut-points, for 5- and 10-second epochs Moderate-to-Vigorous Physical Activity 5-second epoch ♂ 10-second epoch ♀ ♂ ♀ specific overall specific overall specific overall specific overall Cut-point ≥ 429.09 ≥ 361.94 ≥ 316.72 ≥ 361.94 ≥ 914.94 ≥ 784.40 ≥ 693.98 ≥ 784.40 Sensitivity 80.50% 92.30% 84.90% 71.50% 81.90% 91.70% 74.60% 58.70% Specificity 83.80% 78.40% 81.20% 84.70% 85.00% 76.70% 82.60% 86.40% 0.499 0.484 0.364 0.352 0.445 0.366 0.285 0.268 Agreement 83.39% 80.57% 81.52% 83.50% 84.66% 78.27% 82.02% 84.57% PPV 47.20% 43.38% 30.23% 30.90% 38.31% 30.99% 23.50% 23.72% NPV 96.00% 98.27% 98.24% 96.87% 97.64% 98.78% 97.84% 96.68% Cohen's kappa PPV – Positive Predictive Value; NPV – Negative Predictive Value. 4.4. Discussion The current study was the first to use epochs <15 seconds and triaxial accelerometry to identify SB and MVPA cut-points for children younger than three years of age. The mixed-effects regression analyses produced triaxial, Axis1 and VM equations that showed much lower sensitivity (especially for MVPA), agreement and accuracy than expected. Because of the very wide limits of agreement (Altman & Bland, 1983) observed, and consistently large underestimation of both SB and MVPA, all three mixed-effects prediction equations are considered unsuitable for use in future research. On the other hand, the VM and Axis1 cut-points derived from ROC analysis showed much higher sensitivity to observed SB/MVPA, and better accuracy, which make them a suitable tool for the assessment of SB and PA in toddlers. Considering the better AUC values for both SB and MVPA cut-points, the ROCderived Axis1 and VM cut-points from the current study seem to be more accurate than the only other set of accelerometry cut-points developed specifically for toddlers (Trost et al, 2012). This improvement in accuracy may be due to the differences in how the CARS was used, but more likely due to the shorter epoch durations used in the current study. The lack of information about the sensitivity/specificity or agreement tests between predicted and observed SB and PA classification in Trost et al’s (2012) study make it harder to compare the validity of their cut-points with 155 Chapter Four - Calibration of the ActiGraph GT3X+, Actiheart, and activPAL3 accelerometers for the assessment of sedentary behaviour and physical activity of 2 to 3 year old children those of the present study. Applying Trost et al’s (2012) cut-points to the data from the current calibration study showed lower kappa values than those seen for the sexspecific 5-second Axis1 cut-points (see Tables 21-22), as shown below in figure 17. 0.9 0.8 0.7 0.6 0.5 0.4 0.3 0.2 0.1 0.0 SB Light PA Costa ♂ Costa ♀ MVPA Trost Figure 17 – Comparisons of kappa values (Y axis) between Costa et al. and Trost et al. Axis1 cut-points However, because they were derived from this data and chosen based on the best kappa value, a higher agreement would be expected for the newly developed Axis1 cut-points than for those calibrated in another sample, and with different activities. Testing the accuracy of Trost et al’s (2012) and the newly developed cut-points with an independent sample of children in free-living conditions would clarify if the differences in agreement were only a result of the sample and activities used in the present study. Furthermore, it would provide an indication about how valid and reliable both sets of cut-points are for measuring SB and PA in field-based research (Welk, 2005). This will be addressed next in chapter five. Using 5-second epochs generally showed better agreement, higher positive and negative predicted values, and smaller differences between observed and predicted SB and MVPA time than 10-second epochs. Generally, VM cut-points showed slightly better agreement than Axis1 cut-points for the classification of MVPA, whereas Axis1 cut-points showed slightly better agreement than VM cut-points for 156 Chapter Four - Calibration of the ActiGraph GT3X+, Actiheart, and activPAL3 accelerometers for the assessment of sedentary behaviour and physical activity of 2 to 3 year old children SB classification. The substantial to excellent agreement for SB classification (Landis & Koch, 1977), high positive and negative predicted values (>85% and >87% respectively), and very low differences between observed and predicted SB time (range: -2.81% to +3.63%), demonstrate that the ROC-derived Axis 1 and VM cutpoints are an accurate tool for the assessment of SB in toddlers. Because of the low agreement (kappa: 0.542-0.267), positive predictive values (≤50%), and subsequent overestimation of MVPA from the use of both Axis1 and VM cut-points (more than double of the observed MVPA time), the author discourages the use of the MVPA cut-points defined in this study for epidemiological and clinical research. Instead, it is recommended that researchers use the ROC-derived SB cut-points for VM (or Axis1 if using the GT1M model) to distinguish between SB and PA only (without differentiating light from MVPA). Although this approach would not allow researchers to investigate the effects of different PA intensities in various aspects of young children’s health and development (e.g. obesity prevention or motor development), it provides a valid and reliable tool that allows the assessment of total volume and patterns of both SB and PA for use in such studies. It also allows researchers to assess compliance with most of the guidelines aimed at the toddler age, such as those existing in the UK (Department of Health, 2011) and Canada (Tremblay et al, 2012a and 2012b), which refer only to SB and PA in general instead of distinguishing between specific PA intensities. The GT3X+ is a recent model (launched in 2010) that has not yet been widely used in published research. It can be considered as an upgrade from the older bi-axial GT1M model, which continues to be extensively used with preschoolers (Trost et al, 2012; Van Cauwenberghe et al, 2011; Vale et al, 2011). Robusto and Trost (2012) found extremely high ICC values for total Axis1 counts, total VM counts, and estimated MVPA (ICC: 0.994-0.981), and extremely low inter-monitor differences for total Axis1 and VM counts (0.3-1.5%) between ActiGraph GT1M, GT3X and GT3X+ models. The authors concluded that this strong agreement between these three ActiGraph models indicate that it would be acceptable for researchers and practitioners to use them interchangeably within studies. As such, although the cutpoints defined in the current study were derived for the GT3X+ model, they may also be applied to data collected by the GT1M (Axis1 cut-points only) and GT3X models with reasonable confidence in the validity of the outcomes. Nevertheless, further 157 Chapter Four - Calibration of the ActiGraph GT3X+, Actiheart, and activPAL3 accelerometers for the assessment of sedentary behaviour and physical activity of 2 to 3 year old children research is needed to corroborate this assumption, using the different ActiGraph models simultaneously, to assess classification agreement and potential differences in SB and PA time estimates. Due to the practical and technical issues that occurred with the Actiheart and the activPAL3, it was not possible to calibrate either of the monitors to use with the toddlers. Although previous studies have used the activPAL3 (an earlier version of the activPAL3) with preschool children without reporting any issues (Davies et al, 2012; Davies, Reilly & Paton, 2012), similar problems have been described in the literature regarding its use with preschoolers. Van Cauwenberghe et al (2012) lost participants due to refusal of wearing the monitor, and had to exclude five children due to technical failures to download data from the activPAL. In contrast to our results, the only existing study calibrating the Actiheart in young children (De Bock et al, 2010) did not report any similar issues, which may be attributable to the slightly older age range (three to six years) and bigger frame size of their sample. In future studies with toddlers, researchers should bear in mind the technical and practical issues that arose in the current study when considering both the activPAL3 and the Actiheart as the PA/SB monitors, due the potential loss of data and participants that may result from this. There are limitations to consider in the present study. Firstly, although CARS is a validated systematic observation system (DuRant et al, 1993) which has been widely used and recommended as a gold standard for calibration studies with young children (Trost et al, 2012; De Bock et al, 2010; Van Cauwenberghe et al, 2011; Cliff, Reilly & Okely, 2009; Sirard et al, 2005), it is still subjected to possible observer bias and misclassification that could have influenced the results. Although direct measures of EE (e.g. indirect calorimetry) might have been considered a more objective and reliable gold-standard, such methods require the use of protocols that are hard to use with young children and are largely unrepresentative of their daily-life activities (Welk, 2005; Oliver, Schofield & Schluter, 2009). For example, in contrary to EE methodologies, direct observation does not require children to perform specific activities for durations sufficient to obtain a “steady state” of oxygen consumption. This allows researchers to undertake calibration studies with protocols that include intermittent activities, akin the habitual daily PA patterns of young children (Oliver, 158 Chapter Four - Calibration of the ActiGraph GT3X+, Actiheart, and activPAL3 accelerometers for the assessment of sedentary behaviour and physical activity of 2 to 3 year old children Schofield & Schluter, 2009), as previously advised in the literature (Freedson, Pober & Janz, 2005; Welk, 2005; Cliff, Reilly & Okely, 2009). Secondly, the worse performance of the mixed-effect regression models in relation to the ROC-derived cut-points may be greatly due to the fact that the outcome variable is not a true continuous variable. CARS score is originally an ordinal variable, which becomes continuous only after averaging the scores over each 5- or 10-second epochs. This means that 1) various degrees of each activity level will be attributed the same CARS score (low precision), and 2) several different combinations of CARS scores can result in the same average score for one epoch. For example, a 5second epoch with an average CARS score of 3 may be composed by only scores of light PA (e.g. 3+3+3+3+3) or a mix of vigorous PA and SB scores (e.g. 5+5+2+2+1), which will likely have very different total acceleration values and introduce noise into the mixed-effects regression models. Although it may be difficult in terms of logistics and feasibility with such young children (Costa et al, 2013), researchers should make an effort to use more accurate and completely objective PA measurement methods as the gold-standard (e.g. whole room calorimetry) in future studies. The increased accuracy and true continuous nature of the data are likely to improve the performance of mixed-effects linear regressions in predicting SB and PA intensities. Also, the use of epochs (even as short as five seconds) implies an unavoidable dependency on the clock time, that will always fail to accurately detect short bouts of SB or a given PA intensity if they occur between epochs. For example, considering 5-second epochs: if eight seconds of MVPA occur from 10h 00m 02s a.m. onwards, three MVPA seconds will be registered in the epoch starting at 10h 00m 00s, and the remaining five MVPA seconds will be registered in the following epoch. If the remaining two seconds were from SB, the resulting acceleration of the epoch starting at 10h 00m 00s would likely be misclassified as light PA (from the averaging of SB and MVPA). There is a need for studies employing recently developed techniques that eliminate this time-dependency, such as artificial neural networks (Rothney et al, 2007; Bassett, Rowlands & Trost, 2012), enabling short bouts of SB and PA to be accurately picked up independently of time of occurrence. Nevertheless, the application of these advanced techniques to accelerometry is still in its early stages (Rothney et al, 2007; Bassett, Rowlands & Trost, 2012), and the 5-second cut-points 159 Chapter Four - Calibration of the ActiGraph GT3X+, Actiheart, and activPAL3 accelerometers for the assessment of sedentary behaviour and physical activity of 2 to 3 year old children derived in the current study seem to be an improvement from the most up-to-date set of cut-points for toddlers (Trost et al, 2012). Lastly, nearly one third of the original sample was lost because of issues with the video-cameras and the synchronisation of video with accelerometry files. Although the characteristics of the excluded children were similar to those of the final sample, one cannot exclude the possibility of different results if a larger sample size was available (especially in the accuracy of the mixed-effects prediction equations). Future studies using video-recording should test all planned procedures prior to the start of data collection, to detect potential problems and identify solutions in advance. This includes issues related to hardware (e.g. incompatibility of memory card with high-definition recording), the synchronisation of video with other data (e.g. no indication of time of day in the recorded video, even if such information appears in the camera’s screen while recording), possible “black spots” in the room (i.e. areas of the room that none of the cameras can register), among others. Such efforts will help to prevent an avoidable loss of good and useful observation data and, eventually, the loss of participants. In conclusion, the high accuracy indicates that the cut-points derived in the present study are a useful and valid tool for epidemiological studies involving toddlers’ SB and PA when measured by ActiGraph accelerometers (models GT1M, GT3X and GT3X+). Because of the low accuracy and reliability observed for all MVPA cutpoints, the use of the SB cut-points to distinguish between SB and PA only is advised. Due to the slightly better performance in assessing SB, the ROC-derived VM cut-points for 5-second epochs are considered the best and most appropriate for use in future studies with toddlers. If researchers cannot use one of the latest ActiGraph models (GT3X or GT3X+), the use of the ROC-derived Axis1 cut-points for 5-second epochs with the GT1M is advised, and expected to produce comparable estimates of SB and PA (mean difference <2.5%). When using 5-second epochs might be unfeasible (e.g. due to the lack of memory or battery life for the required data collection duration), the use of the cut-points derived for 10-second epochs will provide estimates of PA and SB time similar to 5-second epochs (mean difference ≤5.0%). Nevertheless, additional studies using independent samples are 160 Chapter Four - Calibration of the ActiGraph GT3X+, Actiheart, and activPAL3 accelerometers for the assessment of sedentary behaviour and physical activity of 2 to 3 year old children needed to further explore the utility and validity of the cut-points for epidemiological studies, and confirm the better performance of VM over Axis1 cut-points in the assessment of SB and PA. This is the focus of the following chapter. 161 Chapter Five - Validation of the ActiGraph GT3X+ cut-points for the definition of sedentary behaviour, light and moderate-to-vigorous physical activity in 2 to 3 year old children CHAPTER FIVE Validation of the ActiGraph GT3X+ cutpoints for the definition of sedentary behaviour, light and moderate-to-vigorous physical activity in 2 to 3 year old children The results presented in this chapter and in chapter four have been submitted for publication as one manuscript, which is currently under review at the Medicine and Science in Sports and Exercise journal. 162 Chapter Five - Validation of the ActiGraph GT3X+ cut-points for the definition of sedentary behaviour, light and moderate-to-vigorous physical activity in 2 to 3 year old children 5.1. Introduction In the previous chapter, new sets of SB and MVPA cut-points were developed for the VM and Axis1 accelerations of the ActiGraph GT3X+. A preliminary analysis with the data from the calibration study showed an improvement of the latter in relation to Trost et al’s (2012) cut-points, regarding the accuracy of classification of epochs as SB, light and MVPA. However, this would be expected, since the newly developed cut-points were derived from the acceleration and activities of that sample of children. The accuracy of Trost et al’s (2012) and the newly developed cut-points needs to be cross-validated and compared using an independent sample of children in free-living activities, to clarify if the improved agreement seen in the previous chapter was only a result of the sample and activities used in the calibration study. Such analyses would also provide an indication about how accurate and reliable both sets of cut-points are for measuring SB and PA in field-based research (Welk, 2005; Bassett, Rowlands & Trost, 2012). The aim of the current study was to: 1) assess the reliability, concurrent and predictive validity of the newly developed Axis1 and VM cut-points with an independent sample, in free-living conditions; and 2) to compare the reliability, concurrent and predictive validity of the newly developed Axis1 and VM cut-points to those of Trost et al’s (2012). 5.2. Methods 5.2.1. Sample Toddlers were recruited at three nurseries, two playgroups and via word-of mouth in Bradford, Loughborough and Northampton (UK). At the nurseries, a study pack was sent to the parents of 2-3 year old children, containing the participant information sheet, an informed consent form, the child’s characteristics form, and an introductory letter instructing parents to fill in and return the latter two documents if they consented for their child to participate in the study. For the playgroups and word-ofmouth recruitment: parents were either approached by the author directly, by an acquaintance, or by the playgroup leader, who provided the participant information sheet and briefly explained the study aims and procedures. In the playgroups, parents then contacted the author via email, in order to schedule a convenient date 163 Chapter Five - Validation of the ActiGraph GT3X+ cut-points for the definition of sedentary behaviour, light and moderate-to-vigorous physical activity in 2 to 3 year old children and time to carry out the video-recording of their offspring during free-play. For participants recruited via word-of-mouth, parents agreed the time and date for the video-recording session either by phone, email or directly with the author. All procedures were reviewed and approved by the Ethical Advisory Committee of Loughborough University. At the beginning or end of each video session, children’s height and weight was measured with the same materials and following the same procedures as in the previous chapter (see section 4.2.1.). Child’s weight status was classified according to Cole et al’s (2000) cut-points. 5.2.2. Physical Activity and Sedentary Behaviour measurement Free-play sessions were conducted and video-recorded at the nursery, participants’ homes or in a spacious room at Loughborough University (where sofas, tables and age-appropriate toys were available). Prior to the start of video-recording, the participant information sheet was shown and study procedures were again explained to the parents. All parents had the opportunity to ask questions before they were asked to sign the informed consent form. One or both parents were present during all of the video-recording session at home and at Loughborough University, and nursery practitioners were always present during the video sessions conducted at the nursery. At the beginning or end of each video session, children’s height and weight was measured with the same materials and following the same procedures as in the previous chapter (see section 4.2.2.). The ActiGraph GT3X+ was placed on each child at the right hip (at the level of the anterior superior iliac spine, and on top of the clothes) between 10-15 minutes before the start of video-recording, to allow children some time to get used to the device. Because sessions with two children always included one boy and one girl, there was no need to take note of further information to identify each child on the video images. The CARS (Puhl et al, 1990) was again used as the gold-standard for this study. Videos were coded second-by-second according to the CARS (Puhl et al, 1990), and the resulting activity scores were averaged for 5-, 10- and 15-second epoch durations, as described before in section 4.2.2. For each child, time periods with complete matching 5-, 10- and 15-seconds of CARS-classified totalling a minimum of 164 Chapter Five - Validation of the ActiGraph GT3X+ cut-points for the definition of sedentary behaviour, light and moderate-to-vigorous physical activity in 2 to 3 year old children 30 consecutive seconds were selected for analyses. For example, if CARS classification started at 10:00:40 am, the 20 seconds of observation data between 10:00:40 am and 10:01:00 am would not be included because it would correspond to four 5-second and two 10-second epochs but only 1.33 of 15-second epochs in the accelerometry data. Because one cannot use that 0.33 of the 15-second accelerometry epoch (but only full epochs), the accelerometry data-set to test Trost et al’s (2012) epochs would be five seconds shorter and not fully matching the time and activity included in the 5- and 10-second data-sets. If the image was too distorted or the child was not visible on the video image for a few seconds, the 30second period containing the latter would be excluded from the analyses. This ensured that the total time and activities included for analysis were exactly the same for all epoch durations and cut-points. The GT3X+ was programmed in advance and downloaded using the same parameters as in the calibration study. After data download and transferral into Excel TM spread sheets for each epoch duration, accelerometer counts per epoch were manually matched with the time-corresponding CARS-score, and introduced into STATA (v.6) databases for analyses. Each epoch was classified as SB, light or MVPA according to the CARS, 5- and 10-second (both VM and Axis1) cut-points developed in chapter four, and Trost et al’s (2012) cut-points. Total time spent in SB, light PA and MVPA according to the CARS and all accelerometry cut-points was then calculated for each child. 5.2.3. Statistical Analysis Means, medians, standard deviation (SD), percentages and ranges were calculated to describe children’s characteristics and the sample of video time available for analysis. Normality of the distribution of time spent in SB, light PA and MVPA according to the different definitions was checked with histograms, and formally tested. Overall differences in time spent in SB and light PA according to the CARS and all cut-points were tested with one-way repeated measures ANOVAs. Because time in MVPA was non-normally distributed, overall differences in time spent in MVPA according the CARS and all cut-points were tested using Friedman’s two-way ANOVA for related samples. In the case of significant ANOVA or Friedman’s test results, further individual differences between observed and predicted time spent in 165 Chapter Five - Validation of the ActiGraph GT3X+ cut-points for the definition of sedentary behaviour, light and moderate-to-vigorous physical activity in 2 to 3 year old children SB, light PA and MVPA were investigated with paired t-tests (for normally distributed data) or Wilcoxon signed-rank test (for non-normally distributed data). Bonferroni corrections were applied, to account for multiple comparisons. Cohen’s kappa (Cohen, 1960), specificity, sensitivity, and PPV and NPV (Altman & Bland, 1994) were calculated to assess the reliability and concurrent validity (see section 2.3.1.6.5. for definition) of each cut-point in classifying SB, light and MVPA against CARS classification. Lin’s concordance coefficients (Lin, 1989 and 2000) and Bland-Altman plots (Altman & Bland, 1983) were conducted to assess predictive validity and precision of predicted versus observed time spent in SB, light PA and MVPA. Absolute percent differences between predicted and observed time were calculated as [mean difference between predicted and observed time / mean observed time * 100], to assess the magnitude of the over or underestimation of SB, light and MVPA of each cut-point versus the gold-standard. All tests were run on SPSS (v.19) or STATA (v.12) statistical software packages. 5.3. Results Twenty children aged between 2.0 and 3.6 years were recruited and included in the analyses (see characteristics in Table 23), providing a total of 15 570 seconds for analyses, with a median of 795 seconds per child (range: 600–900 seconds). Table 23 - Sample characteristics. Total sample (n) 60% ♀ / 40% ♂ Sex Age (years) Ethnicity Height 20 2.99 (±0.48) 19 White British / 1 Black-African (cm) 96.12 (±5.51) Weight (Kg) 15.20 (±1.86) 2 BMI (Kg/m ) 16.44 (±1.47) Weight Status 80% Normal weight / 20% Overweight Note: data presented in mean (± standard deviation) unless otherwise indicated. Children displayed a varied set of activities, performed individually or engaging with a parent, a nursery practitioner, or ≥1 siblings or friends. Examples of the most 166 Chapter Five - Validation of the ActiGraph GT3X+ cut-points for the definition of sedentary behaviour, light and moderate-to-vigorous physical activity in 2 to 3 year old children common activities displayed are: running, jumping, crawling, laying down, sitting while playing with toys (e.g. balls, balloons, dolls, board games) or listening to stories, colouring drawings, riding a tricycle or scooter, jumping on a trampoline, and going down a slide. 5.4. Uni-axial cut-points Agreement between observed SB epochs and those classified by the Axis1 cutpoints was moderate but bordering on substantial (Landis & Koch, 1977), with the sex-specific 10-second cut-points showing the lowest classification agreement. For both 5- and 10-second epochs, the overall cut-points showed slightly better agreement in classification and prediction of time spent in SB than the sex-specific cut-points. With the exception of the 10-second sex-specific epoch, Trost et al’s (2012) cut-point showed lower kappa and Lin’s concordance coefficient values than the 5- and 10-second Axis1 cut-points. Between 69.89% and 76.82% of the observed SB epochs were identified by all cut-points, with sensitivity increasing with the longer epoch durations. While NPV were high for all cut-points (87.69–92.85%) and increased with longer epoch durations, PPV were always ≤71.54% and decreased with the longer epoch durations. Further details can be seen below in table 24. Lin’s concordance coefficient was 0.650–0.766 for all cut-points (the lowest belonging to the sex-specific 10-second cut-point), which can be classified as poor agreement (McBride, 2005) between observed and predicted time spent in SB. Bland-Altman plots showed very small mean differences between observed SB time and that predicted by both 5-second Axis1 cut-points, representing an underestimation of only 0.77% to 2.31%. Both the 10-second and Trost et al’s (2012) cut-points overestimated observed SB by 12.27–19.06% and 21.46% respectively (Figure 18). However, none of the cut-point derived SB time significantly differed from the observed SB (all p>0.131). 167 Chapter Five - Validation of the ActiGraph GT3X+ cut-points for the definition of sedentary behaviour, light and moderate-to-vigorous physical activity in 2 to 3 year old children Table 24 - Agreement measures for newly derived Axis1 and Trost et al’s cut-points – Sedentary Behaviour cut-points. Sedentary Behaviour 5-second epoch overall Lin's Concordance 10-second epoch sex-specific overall 15-second epoch sex-specific Trost et al (2012) 0.766 0.759 0.684 0.650 0.661 0.587 - 0.944 0.576 - 0.942 0.460 - 0.908 0.402 - 0.898 0.425 - 0.898 -5.250 sec -1.750 sec +36.500 sec +23.500 sec +37.500 sec -181.632 - 171.132 -181.644 - 178.144 -166.716 - 239.716 -196.898 - 243.898 -171.803 - 246.803 Cohen's kappa 0.588 0.584 0.536 0.530 0.594 % Agreement 83.08% 82.82% 81.70% 81.82% 84.78% PPV 71.54% 70.76% 60.75% 61.63% 63.25% NPV 87.69% 87.74% 90.37% 89.53% 92.85% Sensitivity 69.89% 70.22% 72.32% 69.19% 76.82% Specificity 88.52% 88.02% 84.75% 85.95% 87.08% 95% CI Mean difference 95% LOA CI - Confidence Interval; LOA – Limits of Agreement; PPV – Positive Predictive Value; NPV – Negative Predictive Value. Sedentary Behaviour 30% 20% 5-sec - ALL: 5-sec - SEX 10% 10-sec - ALL: 10-sec - SEX 0% Trost et al -10% Figure 18 - Bias in estimates of Sedentary Behaviour for Axis1 cutpoints 168 Chapter Five - Validation of the ActiGraph GT3X+ cut-points for the definition of sedentary behaviour, light and moderate-to-vigorous physical activity in 2 to 3 year old children Agreement between observed light PA epochs and those classified by any of the cutpoints was only slight to fair (Landis & Koch, 1977), with the overall 10-second cutpoint showing the lowest classification agreement. For both 5- and 10-second epochs, the overall cut-points showed slightly better agreement in classification and prediction of time spent in light PA than the sex-specific cut-points. Trost et al’s (2012) cut-points showed the lowest agreement between predicted and observed light PA time, and had generally lower kappa values than the newly developed Axis1 cut-points, with the exception of the sex-specific 10-second cut-point. All cut-points showed good specificity (74.57–81.66%), but only 46.82–58.08% of the observed Light PA epochs were identified by any of the cut-points, with sensitivity increasing with shorter epoch durations. Although a high proportion of the predicted light PA epochs were true (i.e. observed) light PA, NPV were low (37.82–55.06%) and decreased with the longer epochs. Lin’s concordance coefficient ranged from 0.232 to 0.449 (the lowest belonging to Trost et al’s (2012) cut-points), which can be classified as poor agreement (McBride, 2005) between observed and predicted time. Bland-Altman plots showed significant mean differences (all p<0.0002) between observed light PA time and that predicted by all cut-points, representing an underestimation of 24.40–44.73% (Figure 19). The underestimation of light PA increased with increasing epoch durations. Further details about agreement can be seen below in table 25. 169 Chapter Five - Validation of the ActiGraph GT3X+ cut-points for the definition of sedentary behaviour, light and moderate-to-vigorous physical activity in 2 to 3 year old children Table 25 - Agreement measures for newly derived Axis1 and Trost et al’s cut-points – Light Physical Activity. Light Physical Activity 5-second epoch Lin's Concordance 95% CI Mean difference 10-second epoch 15-second epoch overall sex-specific overall sex-specific Trost et al (2012) 0.449 0.393 0.421 0.243 0.232 0.184 - 0.713 0.147 - 0.640 0.187 - 0.655 0.044 - 0.441 0.038 - 0.426 -112.500 sec -134.000 sec -172.000 sec -223.000 sec -251.250 sec -320.446 - 95.446 -337.948 - 69.948 -401.857 - 57.857 -488.337 - 42.337 -545.070 - 42.570 Cohen's kappa 0.309 0.291 0.275 0.194 0.220 % Agreement 64.80% 63.52% 62.62% 56.58% 57.51% PPV 76.83% 77.06% 83.26% 81.12% 87.20% NPV 55.06% 53.71% 45.27% 40.82% 37.82% Sensitivity 58.08% 54.66% 56.11% 46.82% 48.20% Specificity 74.57% 76.38% 76.29% 77.09% 81.66% 95% LOA CI - Confidence Interval; LOA – Limits of Agreement; PPV – Positive Predictive Value; NPV – Negative Predictive Value. Light Physical Activity 0% -10% 5-sec - ALL: -20% 5-sec - SEX 10-sec - ALL: -30% 10-sec - SEX Trost et al -40% -50% Figure 19 - Bias in estimates of Light Physical Activity for Axis1 cutpoints 170 Chapter Five - Validation of the ActiGraph GT3X+ cut-points for the definition of sedentary behaviour, light and moderate-to-vigorous physical activity in 2 to 3 year old children Agreement between observed MVPA epochs and those predicted by the cut-points was moderate for 5-second cut-points, fair for the 10-second epochs, and only slight for Trost et al’s (2012) cut-points (Landis & Koch, 1977). Similarly to SB and light PA, for both 5- and 10-second epochs, the overall cut-points showed slightly better agreement in classification of MVPA than the sex-specific cut-points. Trost et al’s (2012) cut-points showed the lowest agreement between predicted and observed MVPA time and lowest kappa value. Sensitivity ranged between 80% and 99.86%, and increased with the longer duration of epochs. Concurrently, specificity showed slightly lower values (70.85–81.48%) and increased with the shorter epochs. Although sensitivity and NPV were extremely high, the PPV were always <37%, decreasing to only 16.13% for Trost et al’s (2012) cut-points. Lin’s concordance coefficient ranged from 0.128 to 0.411 (the lowest belonging to Trost et al’s (2012) cut-points), which can be classified as poor agreement (McBride, 2005) between observed and predicted time. Bland-Altman plots showed significant mean differences (all p<0.00001) between observed MVPA time and that predicted by all cut-points, representing an overestimation of 121.67–240.34% for 5- and 10second Axis1 cut-points, and an extremely high overestimation of 508.92% by Trost et al’s (2012) cut-points (see Figure 20). The overestimation of MVPA increased with increasing epoch durations. Further details about agreement can be seen below in table 26. 171 Chapter Five - Validation of the ActiGraph GT3X+ cut-points for the definition of sedentary behaviour, light and moderate-to-vigorous physical activity in 2 to 3 year old children Table 26 - Agreement measures of newly derived Axis1 and Trost et al’s cut-points – Moderate-to-Vigorous Physical Activity. Moderate-to-Vigorous Physical Activity 5-second epoch Lin's Concordance 95% CI Mean difference 95% LOA 10-second epoch 15-second epoch overall sex-specific overall sex-specific Trost et al (2012) 0.398 0.411 0.316 0.238 0.128 0.199 - 0.598 0.205 - 0.671 0.145 - 0.487 0.066 - 0.411 0.019 - 0.238 +117.750 sec +109.500 sec +135.500 sec +143.000 sec +213.750 sec -51.405 - 286.905 -73.366 - 292.366 -74.776 - 345.776 -118.654 - 404.654 -66.439 - 493.939 Cohen's kappa 0.408 0.402 0.326 0.295 0.203 % Agreement 81.02% 81.31% 80.54% 79.06% 71.32% PPV 36.10% 36.09% 26.41% 24.44% 16.13% NPV 97.37% 96.89% 98.26% 99.86% Sensitivity 83.33% 80.00% 98.63% 86.55% 83.19% 98.21% 81.48% 80.04% 78.72% 70.85% Specificity 80.72% CI - Confidence Interval; LOA – Limits of Agreement; PPV – Positive Predictive Value; NPV – Negative Predictive Value. Moderate-to-Vigorous Physical Activity 600% 500% 400% 5-sec - ALL: 5-sec - SEX 300% 10-sec - ALL: 10-sec - SEX 200% Trost et al 100% 0% Figure 20 - Bias in estimates of Moderate-to-Vigorous Physical Activity for Axis1 cut-points. 172 Chapter Five - Validation of the ActiGraph GT3X+ cut-points for the definition of sedentary behaviour, light and moderate-to-vigorous physical activity in 2 to 3 year old children 5.5. Vector Magnitude cut-points Agreement between observed SB epochs and those classified by VM cut-points was moderate to substantial (Landis & Koch, 1977), with the sex-specific 10-second cutpoints showing the lowest classification agreement. For 10-second epochs, the overall cut-points showed slightly better classification agreement with the observed SB than the sex-specific cut-points. With the exception of the 10-second sex-specific cut-point, Trost et al’s (2012) cut-points showed lower kappa and Lin’s concordance coefficient values than all the newly developed VM cut-points. Between 79.63% and 84.07% of the observed SB epochs were identified by all VM cut-points, with the overall cut-points showing better sensitivity than the sex-specific cut-points. Although showing very high NPV (>92%), only 58% of the SB epochs classified by the 10second cut-points were true SB. Trost et al’s (2012) showed better agreement than 10-second VM cut-points, performing as well as the 5-second cut-points. Lin’s concordance coefficient was 0.549–0.741 for all VM cut-points (the lowest belonging to the sex-specific 10-second cut-point), which can be classified as poor agreement (McBride, 2005) between observed and predicted time spent in SB. Bland-Altman plots showed a consistent overestimation of SB (16.15–44.39%) by all VM cut-points, with mean differences ranging from 36 to 85 seconds between observed and predicted SB time. Nevertheless, with the exception of the overall 10second VM cut-points (p= 0.003), none of the cut-point derived SB times significantly differed from that observed (after Bonferroni corrections; all p>0.015). The 5-second VM cut-points performed slightly better than Trost et al’s (2012), but the latter showed better agreement and lower overestimation of observed SB than both 10second VM cut-points (see Figure 21). Further details about agreement can be seen below in table 27. 173 Chapter Five - Validation of the ActiGraph GT3X+ cut-points for the definition of sedentary behaviour, light and moderate-to-vigorous physical activity in 2 to 3 year old children Table 27 - Agreement measures for newly derived Vector Magnitude and Trost et al’s cut-points – Sedentary Behaviour cut-points. Sedentary Behaviour 5-second epoch 10-second epoch 15-second epoch overall sex-specific overall sex-specific Trost et al (2012) 0.741 0.734 0.583 0.549 0.661 0.560 - 0.922 0.543 - 0.925 0.278 - 0.820 0.425 - 0.898 + 48.000 sec + 36.750 sec +85.000 sec +71.000 sec +37.500 sec -121.928 - 217.928 -144.097 - 217.597 -130.877 - 300.877 -164.015 - 306.015 -171.803 - 246.803 Cohen's kappa 0.618 0.618 0.560 0.541 0.594 % Agreement 83.24% 83.46% 81.25% 80.86% 84.78% PPV 71.54% 70.76% 58.23% 58.10% 63.25% NPV 87.69% 87.74% 93.92% 92.44% 92.85% Sensitivity 81.87% 79.78% 84.07% 79.63% 76.82% Specificity 83.80% 84.98% 80.32% 81.26% 87.08% Lin's Concordance 95% CI Mean difference 95% LOA 0.341 - 0.824 CI - Confidence Interval; LOA – Limits of Agreement; PPV – Positive Predictive Value; NPV – Negative Predictive Value. Sedentary Behaviour 50% 40% 5-sec - ALL: 30% 5-sec - SEX 10-sec - ALL: 20% 10-sec - SEX Trost et al 10% 0% Figure 21 - Bias in estimates of Sedentary Behaviour for Vector Magnitude and Trost et al’s cut-points 174 Chapter Five - Validation of the ActiGraph GT3X+ cut-points for the definition of sedentary behaviour, light and moderate-to-vigorous physical activity in 2 to 3 year old children Agreement between observed light PA epochs and those classified by VM cut-points was only fair (Landis & Koch, 1977), with the sex-specific 10-second cut-points showing the lowest classification agreement. For both 5- and 10-second epochs, the overall cut-points showed better classification agreement with the observed Light PA than the sex-specific, but all VM cut-points performed better than Trost et al’s (2012). Although specificity was high, only 47.40–55.83% of the observed light PA epochs were identified by VM cut-points. PPV ranged 76.83–88.44% and increased with longer epochs, while NPV were low and decreased with longer epochs. In general, Trost et al’s (2012) cut-points showed worse agreement between observed and predicted light PA epochs than all VM cut-points. Lin’s concordance coefficient ranged 0.376–0.231 for all VM cut-points (the lowest belonging to the 5-second sex-specific), which can be classified as poor agreement (McBride, 2005) between observed and predicted time spent in light PA. BlandAltman plots showed a consistent underestimation of observed light PA (all >35%) by all VM cut-points, with mean differences ranging from 163 to 227 seconds and increasing with longer epoch durations. All of the cut-point derived light PA times differed significantly from that observed (all p<0.0001). In general, all VM cut-points performed better than Trost et al’s (2012) in predicting time spent in Light PA (see table 28 and Figure 22). 175 Chapter Five - Validation of the ActiGraph GT3X+ cut-points for the definition of sedentary behaviour, light and moderate-to-vigorous physical activity in 2 to 3 year old children Table 28 - Agreement measures for newly derived Vector Magnitude and Trost et al’s cut-points – Light Physical Activity cut-points. Light Physical Activity 5-second epoch 10-second epoch 15-second epoch overall sex-specific overall sex-specific Trost et al (2012) 0.340 0.226 0.376 0.231 0.232 0.134 - 0.547 0.048 - 0.405 0.168 - 0.584 0.049 - 0.413 0.038 - 0.426 -163.500 sec -189.500 sec -194.500 sec -227.000 sec -251.250 sec -342.996 - 15.996 -394.568 - 15.568 -399.321 - 10.321 -476.065 - 22.065 -545.070 - 42.570 Cohen's kappa 0.335 0.281 0.337 0.263 0.220 % Agreement 65.32% 62.04% 65.13% 60.18% 57.51% PPV 76.83% 77.06% 88.44% 86.19% 87.20% NPV 55.06% 53.71% 47.70% 43.83% 37.82% Sensitivity 52.98% 47.40% 55.83% 49.10% 48.20% Specificity 83.23% 83.31% 84.66% 83.47% 81.66% Lin's Concordance 95% CI Mean difference 95% LOA CI - Confidence Interval; LOA – Limits of Agreement; PPV – Positive Predictive Value; NPV – Negative Predictive Value. Light Physical Activity 0% -10% 5-sec - ALL: -20% 5-sec - SEX 10-sec - ALL: -30% 10-sec - SEX Trost et al -40% -50% Figure 22 - Bias in estimates of Light Physical Activity for Vector Magnitude and Trost et al’s cut-points 176 Chapter Five - Validation of the ActiGraph GT3X+ cut-points for the definition of sedentary behaviour, light and moderate-to-vigorous physical activity in 2 to 3 year old children Agreement between observed MVPA epochs and those classified by VM cut-points was fair to moderate (Landis & Koch, 1977), with the sex-specific 10-second cutpoints showing the lowest classification agreement. Overall cut-points showed slightly better classification agreement with the observed MVPA than the sexspecific. The overall 5-second VM cut-points showed the best agreement with observed MVPA from the cut-points derived in the previous chapter, and kappa values decreased with increasing epoch durations. Between 83.19% and 86.55% of the observed MVPA epochs were identified by all VM cut-points, with specificity always >80%. Although NPV were extremely high (≥96.89%), only <37% of the VMclassified epochs were true MVPA. In general, Trost et al’s (2012) showed worse agreement than all VM cut-points. Further details can be seen below in table 29. Lin’s concordance coefficient was 0.549–0.741 for all VM cut-points (the lowest belonging to the sex-specific 10-second cut-point), which can be classified as poor agreement (McBride, 2005) between observed and predicted time spent in MVPA. Bland-Altman plots showed a consistent and significant overestimation of more than double the observed MVPA time by all VM cut-points (p<0.0001), with mean differences ranging from 109 to 118 seconds. Nevertheless, all VM cut-points performed much better than Trost et al’s (2012), with the latter showing more than double the rate of overestimation of observed MVPA than that from VM cut-points (see Figure 23). 177 Chapter Five - Validation of the ActiGraph GT3X+ cut-points for the definition of sedentary behaviour, light and moderate-to-vigorous physical activity in 2 to 3 year old children Table 29 - Agreement measures for derived Vector Magnitude and Trost et al’s cut-points – Moderate-to-Vigorous Physical Activity cut-points. Moderate-to-Vigorous Physical Activity 5-second epoch 10-second epoch 15-second epoch overall sex-specific overall sex-specific Trost et al (2012) 0.423 0.384 0.392 0.327 0.128 0.227 - 0.618 0.181 - 0.586 0.206 - 0.577 0.140 - 0.515 0.019 - 0.238 +115.500 sec +117.750 sec +109.500 sec +118.500 sec +213.750 sec -49.309 - 280.309 -71.595 - 307.095 -66.550 - 285.550 -90.697 - 327.697 -66.439 - 493.939 Cohen's kappa 0.423 0.410 0.381 0.341 0.203 % Agreement 81.63% 81.09% 83.88% 82.21% 71.32% PPV 36.10% 36.09% 30.47% 27.81% 16.13% NPV 97.37% 96.89% 98.69% 98.33% 99.86% Sensitivity 84.72% 83.61% 86.55% 83.19% 98.21% Specificity 81.23% 80.76% 83.66% 82.13% 70.85% Lin's Concordance 95% CI Mean difference 95% LOA CI - Confidence Interval; LOA – Limits of Agreement; PPV – Positive Predictive Value; NPV – Negative Predictive Value. Moderate-to-Vigorous Physical Activity 600% 500% 400% 5-sec - ALL: 5-sec - SEX 300% 10-sec - ALL: 10-sec - SEX 200% Trost et al 100% 0% Figure 23 - Bias in estimates of Moderate-to-Vigorous Physical Activity for Vector Magnitude and Trost et al’s cut-points 178 Chapter Five - Validation of the ActiGraph GT3X+ cut-points for the definition of sedentary behaviour, light and moderate-to-vigorous physical activity in 2 to 3 year old children 5.6. Discussion The aim of the present study was to evaluate the validity of the Axis1 and VM cut-points defined in the previous chapter in free-play sessions, using an independent sample of toddlers, and to compare their performance to that of the only other existing set of accelerometry cut-points for the toddler population (Trost et al, 2012). In general, Axis1 and VM cut-points (both overall and sex-specific) defined in the previous chapter performed better than Trost et al’s (2012) in the classification and prediction of SB, light and MVPA. In the present study, Trost et al’s (2012) 15-second cut-points overestimated SB by 21% of the observed time, and underestimated light PA by nearly half of the observed time, which is in line with the validation study performed by the same authors . However, observed MVPA time was overestimated by over 500% when using Trost et al’s (2012) cut-points, which was contrary to the findings of their original validation study, where the MVPA cut-point showed a non-significant mean difference of 0.5 minutes between the predicted and observed MVPA time. The differences found between the two validation studies in the performance of Trost et al’s (2012) cut-points may be largely due to the different application of the CARS and type of activities performed during the free-play sessions. Since there is no description of the type and frequency of activities observed in Trost et al’s (2012) validation study, the influence of the latter cannot be assessed. Trost et al (2012) used the same CARS cut-point for SB as the present validation study (i.e. ≤2), but a much lower ≥3 as the cut-point to derive MVPA. This means that several activities that would have been classified as only light PA in the present validation study (e.g. slow walk or crawl) and according to the original CARS (Puhl et al, 1990), would have been erroneously classified as MVPA in the validation study conducted by Trost et al (2012). Because the only divergence between studies in the direction of under/overestimation of observed activity behaviours was in MVPA (where the CARS cut-points differed), it seems plausible and logical that the different application of the CARS had a strong influence on the extremely high overestimation of MVPA seen in the present study. However, formal tests of this assumption cannot be made. 179 Chapter Five - Validation of the ActiGraph GT3X+ cut-points for the definition of sedentary behaviour, light and moderate-to-vigorous physical activity in 2 to 3 year old children The generally improved performance of the newly derived Axis1 and VM cut-points in relation to Trost et al’s (2012) is most likely due to 1) the shorter epoch durations used (which will be able to pick up shorter bursts of PA/SB typical of young children’s activity patterns) (Oliver, Schofield & Schluter, 2009); and 2) the previously mentioned differences in the application of the CARS during the calibration and validation phases. Although the influence of using the adapted version of the CARS cannot be formally assessed, the influence of epoch duration could be better understood by investigating the effect of using shorter and longer epochs with a gold-standard measure (e.g. CARS). This would remove possible errors introduced by the accuracy of the ActiGraph GT1M or GT3X+ in registering body movements, differences in the interpretation and application of Puhl et al’s (1990) CARS, and the inherent error from an “imperfect” calibration of any cut-points to classify SB and PA. No such studies have been published yet, but this will be addressed in the following chapter. Regarding the newly derived cut-points, those for 5-second epochs consistently performed better than the cut-points for 10-second epochs (see figures 24 and 25), and Axis1 cut-points generally performed better than those for VM (except for MVPA), in this independent validation sample. Light Physical Activity Sedentary Behaviour Moderate-Vigorous Physical Activity 40% 0% 600% 30% -10% 500% 20% -20% Axis1 - All 400% 300% 10% 200% -40% -10% -50% VM - All VM - Sex -30% 0% Axis1 - Sex Trost et al 100% 0% Figure 24 - Bias in estimates of time spent in Sedentary Behaviour and Physical Activity, from 5-second and Trost et al’s cut-points. 180 Chapter Five - Validation of the ActiGraph GT3X+ cut-points for the definition of sedentary behaviour, light and moderate-to-vigorous physical activity in 2 to 3 year old children Sedentary Behaviour Light Physical Activity 50% 0% 40% -10% 30% -20% 20% -30% Moderate-Vigorous Physical Activity 500% 400% Axis1 - All: 300% Axis1 - Sex VM - All: 200% VM - Sex Trost et al 10% -40% 100% 0% -50% 0% Figure 25 - Bias in estimates of time spent in Sedentary Behaviour and Physical Activity, from 10second and Trost et al’s cut-points. Observed SB time was overestimated in this study, and at a higher rate than in the previous chapter. This was expected, given that the cut-points had been chosen partly based on the better agreement shown for that particular sample of children and dataset. Nevertheless, the 5-second cut-points approached the low bias rates seen in the previous chapter (-0.77% to -2.31%, versus 0.07–1.09% in the calibration study), and both 5- and 10-second Axis1 cut-points performed better than the previously published set of toddler cut-points (Trost et al, 2012) ionn the SB estimates. VM cut-points did not show such striking improvements over Trost et al’s (2012), with the 10-second cutpoints overestimating SB by nearly double the rate shown by Trost et al’s (2012) estimation (see figure 25). Light PA was underestimated by all cut-points, showing larger underestimation with larger epoch durations. Taking the overall Axis1 and Trost et al’s (2012) cut-points as an example, underestimation increased from -24% with the 5-second cut-points, to -33% and -44% using the 10-second and Trost et al’s (2012) 15-second cut-points respectively. Although all newly derived cut-points performed better that Trost et al’s (2012), only the 5-second Axis1 cut-points underestimated light PA by less than one third (see figures 24 and 25). The different application of the CARS MVPA cut-point used as the gold-standard during the calibration may also explain the lower underestimation rates seen for both VM and Axis1 cut-points in relation to Trost et al’s 181 Chapter Five - Validation of the ActiGraph GT3X+ cut-points for the definition of sedentary behaviour, light and moderate-to-vigorous physical activity in 2 to 3 year old children (2012). An average CARS-score ≥3 was chosen in Trost et al’s (2012) study as the gold-standard cut-point for MVPA. As such, many of the epochs in the upper end of the light PA spectrum classified with the original CARS will have been identified as MVPA with Trost et al’s (2012) cut-points. With the average CARS-score ≥4 used as the MVPA cut-point in the present validation study, those epochs will have had a higher chance of being correctly identified as light PA. In line with the results of the previous chapter, all MVPA cut-points overestimated observed MVPA by over 100% (see figures 24 and 25). This further reinforces the discouragement of their use in future clinical and epidemiological studies, to avoid the inflation of toddlers’ activity levels in relation to what they are in reality, as well as confounding the relationships between MVPA and health. Instead, it is advisable to use the SB cut-points to distinguish between SB and total PA only (using 5-second epochs). The overall 5-second Axis1 cut-points seemed to show the best trade-off in performance, only underestimating SB by 2% and overestimating total PA by 0.95%, whereas the sex-specific cut-points only underestimated SB by 0.77% but overestimated total PA by nearly 5%. Using the overall 5-second Axis1 cut-points would provide a very accurate estimation of SB and PA at the population level, which would improve the power and chances of future clinical and epidemiological studies to assess the effects of both PA and SB on health, and the compliance with several national PA guidelines for the early years (Department of Health, 2011; Tremblay et al, 2012a, 2012b). As with the previous chapter, there are limitations that need to be considered when interpreting the results. Firstly, the use of two different models of the ActiGraph accelerometer may have slightly influenced the differences found between the present chapter and Trost et al’s (2012) validation study. Nevertheless, in a study comparing the ActiGraph GT1M, GT3X, and GT3X+ models, Robusto and Trost (2012) found extremely high intraclass correlation coefficients for the vertical axis (i.e. Axis1) and VM (available only in models GT3X and GT3X+) – 0.994 and 0.981, respectively. The authors concluded that the strong agreement seen between the three accelerometer 182 Chapter Five - Validation of the ActiGraph GT3X+ cut-points for the definition of sedentary behaviour, light and moderate-to-vigorous physical activity in 2 to 3 year old children generations suggested it would be acceptable to use the different models within a given study. Therefore, it is not expected that the use of the GT1M by Trost et al (2012) would have had a significant influence on the differences seen between studies. Secondly, although the CARS is a validated systematic observation system (DuRant et al, 1993) which has been widely used and is recommended as a gold-standard for calibration studies with young children (Trost et al, 2012; Van Cauwenberghe et al, 2011; De Bock, 2010; Cliff, Reilly & Okely, 2009), it is still subject to possible observer bias and misclassification that could have influenced the results. However, this issue would not have influenced any of the observed differences between the performances of all cutpoints, since the same CARS-classified video data were used for all analyses. The low availability of MVPA epochs from which to judge the validity of the cut-points may have had an influence on the much higher biases seen for MVPA than for SB and light PA. Lastly, the relatively small sample size, including only 5% of childrem from non-White British ethnic groups, and the short duration of each play-session also limited the amount of epochs and type of activities available for the overall validation results. Further studies using larger and more varied samples, using longer play-sessions and including more opportunities for MVPA are needed, to confirm the results of the present study (Bassett, Rowlands & Trost, 2012). The extent to which these factors may have influenced the agreement analyses between the cut-points and the gold-standard also requires further investigation. Nevertheless, the present validation study did use an independent sample (including both sexes and a wide range of BMI values), and included a varied range of free-living activities representative of children’s habitual activity habits. In turn, the current study demonstrated the advantages of using the newly derived Axis1 cut-points (chapter four) over the only previously published set of cut-points for the toddler population (Trost et al, 2012), in line with what was recently advised by Bassett, Rowlands and Trost (2012) for the calibration and validation of activity monitors. In conclusion, all newly derived Axis1 and VM cut-points generally showed better validity against the CARS than Trost et al’s (2012), although MVPA was highly and 183 Chapter Five - Validation of the ActiGraph GT3X+ cut-points for the definition of sedentary behaviour, light and moderate-to-vigorous physical activity in 2 to 3 year old children significantly overestimated by all cut-points. The overall 5-second Axis1 cut-points seem to provide the best estimates of observed SB and PA, and the use of the SB cut-point (≤5 counts/epoch) to distinguish only between PA and SB is advised, in lieu of the MVPA cut-point (≥165 counts/epoch) to further distinguish between light and MVPA. This provides a valid measure of SB and PA that can be used in future studies assessing activity levels of toddlers, rates of compliance with existing guidelines, and the relationships between SB, PA and health. Ultimately, the results of such research can provide the necessary evidence base from which new PA and SB guidelines for toddlers can be devised, or existing guidelines can be confirmed, according to what type and how much PA is needed for positive health outcomes in young children (Skouteris et al, 2012). 184 Chapter Six - The effect of different epoch durations on the estimation of time spent in sedentary behaviour, light and moderate-to-vigorous physical activity CHAPTER SIX The effect of different epoch durations on the estimation of time spent in sedentary behaviour, light and moderate-to-vigorous physical activity The results of this chapter have been submitted to the British Journal of Sports Medicine (20/10/2013), and presented as an oral presentation (long format) at the 2013 meeting of the International Society for Behavioural Nutrition and Physical Activity (ISBNPA) in Ghent (Belgium). Costa S, Barber SE, Cameron N, Clemes SA. Differences in the estimation of time spent in sedentary behaviour, light and moderateto-vigorous physical activity in toddlers, according to different epoch durations. Book of Abstracts of the 2013 meeting of the ISBNPA. Ghent: 2013. p. 318-9. 185 Chapter Six - The effect of different epoch durations on the estimation of time spent in sedentary behaviour, light and moderate-to-vigorous physical activity 6.1. Introduction As discussed in the two previous chapters, there are several methodological issues that warrant investigation regarding the use of accelerometers with toddlers (Cliff, Reilly & Okely, 2009). Due to the sporadic nature of their activity behaviours (Oliver, Schofield and Schluter, 2009), the question of what epoch length provides the most accurate estimate of the PA and SB of children under five years of age is one of the most critical issues that needs urgent clarification (Cliff, Reilly & Okely, 2009). To investigate this, Mahar et al (2008) collected data from preschool children (3.9 ±0.6 years) with an ActiGraph accelerometer, set to record at 1-second epochs, which were subsequently reintegrated into 3-, 5-, 15-, 30- and 60-second epochs for comparison. The authors found a significant epoch effect (p<0.01) on the estimates of time spent in moderate-to-vigorous and vigorous PA. It was reported that using longer epochs resulted in fewer minutes of MVPA than shorter epochs (Mahar et al, 2008). However, possible effects of reintegrating shorter epochs into longer durations (Kim et al, 2012) were not considered, and may have accounted for part of the variance observed. Furthermore, it is not clear how the estimation of MVPA and vigorous PA was assessed for epochs of one to five seconds, since there are no published accelerometry cut-points for epochs <15-seconds, and cut-points developed for longer epochs cannot be applied to shorter epochs (Pate, O’Neill & Mitchell, 2010). Also using the ActiGraph with 2-5 year olds, Vale et al (2009) compared estimates of MVPA from 5- and 60-second epochs against observed MVPA (according to the CARS), and found that applying the longer epoch resulted in roughly 17 minutes less MVPA during the school-hours period than applying the 5-second epoch. However, the 60- and 5-second cut-points applied to estimate MVPA from the accelerometry data were derived by simply multiplying or dividing Sirard et al’s (2005) 15-second cut-points. Because one cannot assume that a 15-second epoch is constituted by shorter epochs of the exact same acceleration magnitude (or the same CARS-score for the goldstandard), it cannot be assumed that the accuracy and reliability of the derived 5- and 60-second cut-points are the same as those reported by Sirard et al (2005) in the 186 Chapter Six - The effect of different epoch durations on the estimation of time spent in sedentary behaviour, light and moderate-to-vigorous physical activity original calibration study. The effect of this manipulation on the validity of the cut-points to assess MVPA is also not known. Thus, it is not possible to disregard the possibility that the differences observed may be due to the manipulation of the accelerometry cutpoints instead of the different epoch durations. More recently, Hislop et al (2012) have reported a higher overestimation of the observed MVPA time of preschoolers (4.4 ±0.8 years) derived from accelerometry when using 60- versus 15-second epochs. Like the procedures of Vale et al (2009), Hislop et al (2012) also manipulated Sirard et al’s (2005) validated cut-points to derive the corresponding cut-points for longer epoch durations, so the same limitation regarding the influence of this manipulation in the variance of MVPA estimates is still present. In chapter four, the newly derived 5-second Axis1 and VM cut-points consistently showed better agreement with CARS scores than the corresponding 10-second cutpoints (see tables 15-16 in section 4.3.7., and tables 19-20 in section 4.3.8.), and lower differences in estimated time spent in SB and MVPA. Although the current calibration study did not have the same limitations as the three previous studies (Mahar et al, 2008; Vale et al, 2009; Hislop et al, 2012), the observed variation in agreement could be a result of how accurately acceleration counts and cut-points reflect SB or PA level; the slight differences in the sample of epochs used to derive the 5- and 10-second epoch cut-points; the averaging of different activity intensities in the gold-standard measure (i.e. CARS scores) which will likely result in very different total counts per epoch; or a combination of all of these issues. Using a gold-standard method to measure SB and PA intensity, and comparing time spent in SB and PA estimated from different epoch durations directly with these measures would eliminate confounding effects from the limitations of accelerometry or monitor calibration procedures. It would also help to clarify whether part of the variance in the estimates of SB or PA time derived from different accelerometry cut-points may be due to epoch duration, independently of how accurate an accelerometer is in measuring children’s accelerations. To date, no such studies have been published. Although previous research has highlighted the need to investigate the effect of epoch duration on the estimates of time spent in SB (Cliff, Reilly & Okely 2009), no published 187 Chapter Six - The effect of different epoch durations on the estimation of time spent in sedentary behaviour, light and moderate-to-vigorous physical activity studies have assessed it. It is likely that longer epochs will also underestimate SB, by averaging short bouts of SB and MVPA into misclassified longer periods of light PA. However, this is only a theoretical assumption which requires formal testing. The aim of this study was to investigate the effect of using 5-, 10- and 15-second time sampling periods (epochs) on the estimated time spent in SB, light PA and MVPA according to direct observation, in 2-3 year old children. 6.2. Methods The same sample and procedures described for chapter four (see section 4.2.1.) were used in the current study. Briefly, 18 toddlers (10 girls) aged 2.86 years (±0.60) were video-recorded during semi-structured activity sessions, based on the activities described for each level of the CARS direct observation system. Videos were coded second-by-second according to CARS, and resulting CARS-scores were averaged for 5-, 10- and 15-second epoch durations, as described in section 4.2.2. Following the same procedures as in the previous chapter, only time periods of 30 seconds (or multiples of 30 seconds) with complete matching 5-, 10- and 15-second epochs for each child were selected for analyses. This ensured that the activities and total time included in the analysis was the same for 5-, 10- and 15-second epochs. 6.2.1. Statistical Analysis Descriptive statistics (means/medians, standard deviations/inter-quartile range (IQR)) were used to describe the sample of epochs included in the analysis. Normality of data were checked visually with histograms, and formally tested. Because all data were normally distributed, repeated measures ANOVA tests were run to assess differences in estimated SB, light PA and MVPA time (according to CARS) between the three epoch durations, using the partial eta-squared (ῆp2) to assess effect size. Single comparisons of estimates between each epoch duration (e.g. 5- versus 10-second epochs) were tested with Bland-Altman plots (Altman & Bland, 1983) and paired t-tests, with post-hoc Bonferroni corrections applied for multiple comparisons. Absolute percent differences between epochs were calculated as [mean difference / mean for shorter epoch * 100], 188 Chapter Six - The effect of different epoch durations on the estimation of time spent in sedentary behaviour, light and moderate-to-vigorous physical activity to assess the magnitude of the over or underestimation of SB, light and MVPA by longer epochs. All statistical analyses were conducted in SPSS (v.19) statistical software. 6.3. Results In total, 12 900 seconds (or 215 minutes) were included in the analyses, with a mean of 717 (±159) seconds per child. A detailed description of the sample of SB, light and MVPA epochs included in the analysis can be seen below on table 30. Table 30 - Description of the sample of epochs available for analysis, from the 18 children included in the study. 5-second epoch 10-second epoch 15-second epoch Total (n) Median (IQR) Total (n) Median (IQR) Total (n) Median (IQR) Sedentary Behaviour 1070 66 (31-74) 483 29 (15-34) 335 19 (9-22) Light PA 1246 70 (64-74) 711 40 (35-42) 509 26 (24-32) MVPA 270 14 (7-20) 99 5 (2-8) 55 3 (1-5) IQR – inter-quartile range: PA – physical activity; MVPA – moderate-to-vigorous physical activity. Estimates of SB, light PA and MVPA according to 5-, 10-, and 15-second epochs can be seen below in table 31. There was a significant epoch effect for the estimates of SB, light PA and MVPA (all p<0.0001), where the difference in epoch durations explained 63.33–78.88% of the variance. 189 Chapter Six - The effect of different epoch durations on the estimation of time spent in sedentary behaviour, light and moderate-to-vigorous physical activity Table 31 – Mean (SD) time spent in sedentary behaviour, light and moderate-to-vigorous physical activity according to the different epoch durations. 5-second epoch 10-second epoch Sedentary Behaviour 296.67 sec * (±154.44) 267.22 sec (±149.38) Light Physical Activity 345.83 sec * (±84.00) 395.00 sec (±92.94) Moderate-to vigorous Physical Activity 75.00 sec * (±48.84) 55.00 sec (±40.62) ῆp2 15-second epoch F (p-value) # 247.50 sec (±142.98) 29.36 (<0.0001) 0.6333 # 424.17 sec (±101.45) 63.49 (<0.0001) 0.7888 45.83 sec (±40.34) 36.22 (<0.0001) 0.6806 # Effect size sec – seconds. * p<0.0001 for t-test versus 10- and 15-second epochs; # p≤0.003 for t-test versus 15-second epochs In relation to 5-second epochs, 10- and 15-second epochs significantly underestimated time spent in SB (see figure 26). Ten-second epochs showed a significant mean difference of -29.44 seconds (95% limits of agreement (LOA): -68.63 to 9.74), underestimating time spent in SB by 9.93%. Fifteen-second epochs showed a significant mean difference of -49.17 seconds (95% LOA: -113.23 to 14.90), representing a 16.57% underestimation of SB. In relation to 10-second epochs, 15second epochs also significantly underestimated time spent in SB by 7.38% (mean difference= -19.72 seconds; 95% LOA: -74.59 to 35.15), although this difference was smaller than those seen relative to 5-second epochs. Bland-Altman plots for all SB comparisons are presented in appendix 5. Figure 26 - Median estimated seconds spent in sedentary behaviour according to the 3 epoch durations. 190 Chapter Six - The effect of different epoch durations on the estimation of time spent in sedentary behaviour, light and moderate-to-vigorous physical activity In contrast, time spent in light PA was significantly overestimated by 10- and 15-second epochs in relation to 5-second epochs (see figure 27). Ten-second epochs showed a significant mean difference of +49.17 seconds (95% LOA: 1.25 to 97.09), overestimating time spent in light PA on average by 14.22%. Fifteen-second epochs showed a significant mean difference of +78.33 seconds (95% LOA: 12.47 to 144.20), overestimating time spent in light PA on average by 22.65%. In relation to 10-second epochs, 15-second epochs also significantly overestimated time spent in light PA by 7.38% (mean difference= +29.17 seconds; 95% LOA: -30.89 to 89.23), although this difference was smaller than those seen relative to 5-second epochs. Bland-Altman plots for all light PA comparisons are presented in appendix 6. Figure 27 - Median estimated seconds spent in light physical activity according to the 3 epoch durations. Time spent in MVPA was significantly underestimated by 10- and 15-second epochs in relation to 5-second epochs (see figure 28). Ten-second epochs showed a significant mean difference of -20 seconds (95% LOA: -48.52 to 8.52), which represents a 26.67% average underestimation of time spent in MVPA. Fifteen-second epochs showed a significant mean difference of -29.167 seconds (95% LOA: -64.46 to 6.13), underestimating time spent in SB on average by more than one third (-38.89%). In relation to 10-second, 15-second epochs also significantly underestimated time spent in 191 Chapter Six - The effect of different epoch durations on the estimation of time spent in sedentary behaviour, light and moderate-to-vigorous physical activity MVPA by -16.67% (mean difference= -9.17 seconds; 95% LOA: -31.27 to 12.94). BlandAltman plots for all MVPA comparisons are presented in appendix 7. Figure 28 - Median estimated time (seconds)in moderateto-vigorous physical activity according to the 3 epoch durations. 6.4. Discussion The present study was the first to assess the effect of using different epoch durations in the resulting estimates of SB, light PA and MVPA, using a measurement method considered by many as a gold-standard. Light PA was overestimated and both SB and MVPA were underestimated by 10- and 15-second epochs in relation to 5-second epochs. The variances observed in the estimates of time spent in MVPA were not influenced by some of the methodological limitations present in previously published research using accelerometry (Mahar et al, 2008; Vale et al, 2009; Hislop et al, 2012). By using the CARS, possible effects from reintegrating shorter epochs into longer ones (Kim et al, 2012) or from the way in which MVPA cut-points were applied (Vale et al, 2009; Hislop et al, 2012) were removed. In spite of these differences, the observed underestimation of time spent in MVPA is in agreement with the three previously mentioned studies 192 Chapter Six - The effect of different epoch durations on the estimation of time spent in sedentary behaviour, light and moderate-to-vigorous physical activity (Mahar et al, 2008; Vale et al, 2009; Hislop et al, 2012). Whilst the effect of the way in which Vale et al (2009) and Hislop et al (2012) manipulated the cut-points for MVPA cannot be discounted (i.e. dividing/multiplying Sirard et al’s (2005) 15-second cut-point to apply to shorter/longer epochs), it is fair to consider that epoch duration had a substantial effect on the variance of MVPA estimates observed in both studies. The underestimation of SB is a novel and important finding, taking into consideration the recent rise in the interest of the effect of SB on children’s health (Chinapaw et al, 2011; LeBlanc et al, 2012). The results of the current study show that shorter epochs are also needed when assessing SB, to avoid underestimating the time children spend sedentary, erroneously associating lower amounts of SB with negative health outcomes, and misleading the development of SB guidelines for toddlers. Table 31 shows a larger increase observed in time spent in light PA along with the decreases in time spent in both SB and MVPA from 5- to 15-second epochs, as well as a greater effect size and F-value for the effect of epoch length on estimated time in light PA than for SB and MVPA. This supports the theoretical assumption mentioned in the introduction, that longer epochs will average short bouts of SB and MVPA into misclassified time spent in light PA. The larger effects on light PA are probably due to the fact that, as epoch length increases, the amount of light PA increases from the contribution of both SB and MVPA bouts that were wrongly averaged into light PA epochs. Consequently, even studies focusing on the estimates of SB and total PA, will tend to underestimate the time young children spend in sedentary activities and possibly overestimate the number of children complying with toddler-specific PA guidelines. The biological significance of these over and underestimations of activity behaviours is unknown, and should be addressed in future research. These results seem contradictory with the results of both the calibration (chapter four) and validation (chapter five) studies. In chapters four and five, MVPA and SB were actually overestimated (except for SB derived with the 5-second Axis1 cut-points) and light PA underestimated, with increasing magnitude in longer epoch lengths. However, this can be explained by the method used to derive the cut-points – ROC curve 193 Chapter Six - The effect of different epoch durations on the estimation of time spent in sedentary behaviour, light and moderate-to-vigorous physical activity analysis. To understand this, three key issues need to be considered: 1) longer epoch durations provide progressively less number of observed epochs with average CARSscores of ≤ 2 or ≥4 (i.e. SB and MVPA) to use in the ROC-curve analysis (see table 30); 2) longer epoch durations allow for a wider variety of CARS intensity levels to be included in epochs that present an average CARS-score ≤2 or ≥4; 3) as a result of the latter, the range of acceleration (i.e. counts) corresponding to observed SB and MVPA epochs will be progressively wider with increasing epoch durations. When using ROC curve analysis with accelerometers, a given count value has to be able to identify a high proportion of the observed SB/MVPA epochs (i.e. high sensitivity) to be chosen as the cut-point. The larger variability of accelerometry counts allowed by longer epochs, together with the lower number of observed SB/MVPA epochs available, will drive the choice of a SB cut-point to higher count values, and the choice of a MVPA cut-point to lower count values in order to identify enough observed SB/MVPA epochs (i.e. high sensitivity). As a consequence, several observed light PA epochs will likely be misclassified by cut-points into both SB and MVPA, resulting in the overestimation of time spent in SB and MVPA, and the even larger underestimation of light PA seen in chapters four and five. To help in understanding the dynamic of the effect of epoch lengths, figures 29-31 provide a representation of the sensitivity, specificity, PPV and negative predictive values (NPV) of SB, light and MVPA classification, from the Axis1 overall (5- and 10second epochs) and Trost et al’s (2012) cut-points (15-second epochs) applied to the sample of the validation study. 194 Chapter Six - The effect of different epoch durations on the estimation of time spent in sedentary behaviour, light and moderate-to-vigorous physical activity 100% 90% 80% 70% 60% 5-seconds 50% 10-seconds 40% 15-seconds 30% 20% 10% 0% PPV NPV Sensitivity Specificity Figure 29 - Sedentary behaviour classification agreement diagnostics from the validation study, by epoch length. 100% 90% 80% 70% 60% 5-seconds 50% 10-seconds 40% 15-seconds 30% 20% 10% 0% PPV NPV Sensitivity Specificity Figure 30 - Light physical activity classification agreement diagnostics from the validation study, by epoch length. 195 Chapter Six - The effect of different epoch durations on the estimation of time spent in sedentary behaviour, light and moderate-to-vigorous physical activity 100% 90% 80% 70% 60% 5-seconds 50% 10-seconds 40% 15-seconds 30% 20% 10% 0% PPV NPV Sensitivity Specificity Figure 31 – Moderate-to-vigorous physical activity classification agreement diagnostics from the validation study, by epoch length As the duration of epochs increases, there is a graded decrease in the positive predictive values (PPV) of SB/MVPA, which means that progressively higher proportions of SB/MVPA epochs identified by the cut-points are not observed SB/MVPA epochs. Simultaneously, light PA (figure 30) shows high PPV (>77%) but low sensitivity (48-58%), and the latter decreasing with longer epoch lengths. This means that, although a high proportion of the cut-point identified light PA epochs are true positives (i.e. PPV), only 48-58% of the observed light PA epochs are identified by the cut-points (i.e. sensitivity). As such, the remaining 42-52% of the observed light PA epochs will have been incorrectly identified as SB or MVPA by the cut-points, leading to the low NPV (38-55%) and overestimation of SB and MVPA seen in the validation study. The extremely high NPV in both SB and MVPA classification (always >87%) seen on figures 29 and 31 are simply a result of how this value is calculated. Take MVPA as an example: if PPV is 16-36%, this means that 64-84% of the cut-point identified MVPA epochs are false positives, very likely from observed epochs in the upper end of the light PA range that were wrongly identified as MVPA; as such, an extremely high proportion of the non-MVPA epochs classified by the accelerometry cut-points will be true negatives (i.e. NPV), originating from the remaining observed light PA and SB. 196 Chapter Six - The effect of different epoch durations on the estimation of time spent in sedentary behaviour, light and moderate-to-vigorous physical activity The graded effect of epoch duration is clearer for MVPA, probably due to the much lower prevalence of MVPA compared to SB epochs, and the influence that has on both PPV and sensitivity (Metz, 1978). Taking the example of 5-second epochs, median number of MVPA epochs available is 19 (IQR: 6-25), in comparison to 46 (IQR: 31-67) epochs in SB. This difference is even more striking in the 15-second epochs, where the median number of MVPA epochs available is 2 (IQR: 0-4), versus 10 (IQR: 6-18) epochs in SB. As such, one observed MVPA epoch misclassified into light PA will result in a much greater reduction in the corresponding sensitivity and PPV than would the misclassification of one observed SB epoch into light PA. Although showing several advantages over previous similar studies, the present study still presents limitations that warrant consideration. Firstly, although CARS is a validated systematic observation system (DuRant et al, 1993), which has been widely used and recommended as a gold standard for calibration studies with young children (Trost et al, 2012; Cliff, Reilly & Okely, 2009; Sirard et al, 2005), it is still subject to possible observer bias and misclassification that could have had some influence on the results (see section 4.4 for a more detailed discussion). Secondly, the sample size of children included in the analysis was small (n=18), and selecting only matching 5-, 10- and 15second epochs substantially reduced the amount of observation data available for analysis. Despite this, large effect sizes were observed for the influence of epoch duration on all estimates, and the selection of matching epochs ensured that any differences found could not be attributable to slight differences in the activities and total time periods of each epoch duration data-sets. In conclusion, the use of 10- and 15-second epochs resulted in significantly higher estimates of time spent in light PA, and significantly lower estimates of time spent in both SB and MVPA (as classified by the CARS) than when using 5-second epochs. Due to the lower number of observed SB and MVPA epochs available in longer epochs and the procedures of selecting cut-points using ROC curve analysis, accelerometry cutpoints derived for longer epochs will tend to progressively underestimate light PA, and overestimate both time spent in SB and MVPA in 2-3 year olds. This is a novel and 197 Chapter Six - The effect of different epoch durations on the estimation of time spent in sedentary behaviour, light and moderate-to-vigorous physical activity crucial finding, which highlights the importance of using epochs ≤5 seconds when calibrating accelerometers to assess SB, light and MVPA. The current results provide additional support for using the newly developed Axis1 cut-points for 5-second epochs in future epidemiological research with 2-3 year old children, instead of those developed for longer epochs, as this will provide a more accurate representation of the full range of their activity behaviours. 198 Chapter Seven - Measuring the physical activity and sedentary behaviour of 2 to 3 year old South Asian and White British children and both parents – a pilot study with the ActiGraph GT3X+ ______________________________________________________________________________________________________ CHAPTER SEVEN Measuring the physical activity and sedentary behaviour of 2 to 3 year old South Asian and White British children and both parents – a pilot study with the ActiGraph GT3X+ 199 Chapter Seven - Measuring the physical activity and sedentary behaviour of 2 to 3 year old South Asian and White British children and both parents – a pilot study with the ActiGraph GT3X+ ______________________________________________________________________________________________________ 7.1. Introduction South Asians are at a higher risk of developing NCDs, such as CHD, insulin resistance or diabetes (Yusuf et al, 2001b). This increased risk has been reported in both adults (Bhopal, 2000;Forouhi et al, 2006) and children (Whincup et al, 2002; Misra et al, 2007), and seems to persist in generations already born in the country where South Asian migrated to (Whincup et al, 2010). Authors have reported that ethnic differences in adiposity (Whincup et al, 2010), SES, insulin resistance parameters or metabolic syndrome (Forouhi et al, 2006) do not account for the excess risk of South Asian compared to White British. It has been suggested that the lower PA levels of South Asian may play a major role in their worse metabolic profile and higher risk for NCDs (Bhatia, 2004; Khunti & Samani, 2004; Owen et al, 2009; Williams et al, 2011). Owen et al (2009) have reported that 9-10 year old South Asian children registered 905 fewer steps (95% CI: 624–1187), spent 39 minutes more (95% CI: 26–52) in SB, and 5 minutes less (95% CI: 2–7) in MVPA than their White British peers (all p<0.001), as measured by the ActiGraph GT1M model. It has been urged that the prevention and management of the MetS and diabetes in South Asian should be instituted early in childhood (Bhopal, 2002; Khunti & Samani, 2004), with a particular focus on lifestyle changes including the increase of PA (Misra et al, 2007). However, there is no information on the PA levels of South Asian children younger than nine years of age, how early in life do these differences in PA and SB begin to appear; or the extent to which these differences in activity levels have on the emergence of ethnic inequalities in the precursors of NCDs (e.g. increased adiposity and insulin resistance) (Whincup et al, 2002; Owen et al, 2009). The BIB cohort study (Raynor et al, 2008; Wright et al, 2012), previously described in chapter three (section 3.1.) presents a remarkable opportunity to address this gap in the literature, as well as the potential influences that parental PA and SB levels may have on their offspring’s activity behaviours throughout childhood (Gustafson & Rhodes, 2006). Having enough numbers of both White British and South Asian families is crucial to assess any ethnic differences in activity levels. However, this can be challenging since particular difficulties in recruiting South Asian into research have been previously 200 Chapter Seven - Measuring the physical activity and sedentary behaviour of 2 to 3 year old South Asian and White British children and both parents – a pilot study with the ActiGraph GT3X+ ______________________________________________________________________________________________________ highlighted in the literature (Douglas et al, 2011; Rooney et al, 2011), and South Asian women have reported finding certain activity monitors as intrusive, after only four days of data collection (Pollard & Guell, 2012). Despite the increasing emphasis on the need to include ethnic minorities in research, information about the best practice and rates of recruitment in UK South Asian populations is scarce (Rooney et al, 2011), and no studies besides that of Pollard & Guell’s (2012) have yet reported on the acceptability of South Asian (adults or children) in wearing accelerometers in PA measurement studies. Furthermore, families taking part in the BIB cohort study are already required to contribute with a high amount of information and time (Raynor et al, 2008). It is possible that the additional burden resulting from the introduction of PA and SB measurement may not be acceptable to participating families, but this has not been assessed. In chapter three, the ActiGraph GT3X+ was found to be the most easily accepted accelerometer to use in South Asian and White British children and parents, as well as the accelerometer for which mothers identified the least amount of potential issues for use with the toddlers. However, this was assessed only through mothers’ opinions, and not through the actual experience of wearing the ActiGraph GT3X+ for the planned 8day period. Furthermore, children’s acceptability cannot be the only deciding factor when choosing the adequate activity monitor for a study. Arguably, the most important factor regarding monitor selection is the required outcome measure (McClain & TudorLocke, 2008). The activity monitor selected must show evidence of validity and reliability in assessing that outcome (McClain & Tudor-Locke, 2008), in order to provide appropriate and accurate data on the PA and SB levels of toddlers, which is necessary for example to identify priority target groups and the effect of interventions (Baranowski et al, 2004). The validity of the ActiGraph GT3X+ with toddlers was tested and confirmed in chapters four and five, as shown by the high accuracy of the newly developed cut-points for SB and PA, and the better agreement with direct observation than the only other set of cut-points developed for the toddler population (Trost et al, 2012). Additionally, between the Actiheart, the activPAL3 and the ActiGraph GT3X+, the latter proved to be the most easily accepted by the toddlers in chapter four, and the monitor which showed the least amount of software/hardware issues. However, the 201 Chapter Seven - Measuring the physical activity and sedentary behaviour of 2 to 3 year old South Asian and White British children and both parents – a pilot study with the ActiGraph GT3X+ ______________________________________________________________________________________________________ feasibility of wearing the ActiGraph GT3X+ for enough days to assess toddlers’ habitual PA and SB has not yet been tested. Likewise, the issue of reactivity (Oliver, Schofield & Kolt, 2007) and number of days needed to assess the habitual PA and SB of children younger than three years of age has not yet been investigated (Cliff, Reilly & Okely, 2009). Therefore, the aims of this study were to assess: 1) the potential reactivity of toddlers to the use of the ActiGraph GT3X+; 2) the amount and type of days needed to assess toddlers’ habitual PA and SB; and 3) the feasibility of recruiting and measuring the habitual PA and SB of 2-3 year old South Asian and White British children and both parents participating in the BIB cohort study. 7.2. Methods 7.2.1. Sample recruitment Participants were recruited by BIB staff during routine home visits or baby clinics, conducted with families taking part in the BIB1000 focus sample from the BIB study, which aims to investigate growth trajectories and identify modifiable risk factors for childhood obesity (Wright et al, 2012). BIB1000 includes over 1700 families, who have agreed to have additional measurements taken at six, 12 and 18 months, two, three and four years (Wright et al, 2012). BIB staff showed the participant information sheet while briefly explaining the study to the parent, and filled in a contact sheet for those parents who showed an interest in taking part. Participant information sheets were available both in English and Urdu, to facilitate the recruitment of non-English speaking South Asian families. The contact sheets were collected from the BIB liaison on a regular basis (every two to four weeks), each family was assigned with a study ID, and contact details were noted on a database in Excel TM. Parents were contacted by telephone at their preferred days and times, unless email was the preferred method of contact stated (in which case the first contact was undertaken via email). During the telephone call, the study procedures were explained with greater detail, and parents were provided with the opportunity to ask questions. For those who agreed to participate, current address was 202 Chapter Seven - Measuring the physical activity and sedentary behaviour of 2 to 3 year old South Asian and White British children and both parents – a pilot study with the ActiGraph GT3X+ ______________________________________________________________________________________________________ confirmed and a date and time was set for the first home visit. To ensure that no important information was missed, all recruitment telephone calls were made following a template guide. If there was more than one week between the telephone call and the first home visit, participants were also asked if they would like a reminder text message or telephone call to confirm if the scheduled date and time were still suitable. For participants who declared that they would like to think about the decision to take part in the study, the researcher asked for permission to call them a second time and the best time to do this. 7.2.2. Data collection procedures After the recruitment telephone call, each family was assigned with a “family pack” consisting of: one family pack checklist; one first home visit guide; parent and child informed consent forms; one anthropometric measurement sheet; one activity diary; one mother’s questionnaire form; one “end of data collection” interview; one magnet reminder to wear the accelerometers; one extra belt for the child’s accelerometer; and one accelerometer per participant family member, identified with the labels shown on figure 32. The attachment of these labels allowed participants to clearly and quickly identify each family member’s unique accelerometer (thus reducing the possibility of unintentional switches between family members). The additional belt was not included in the first round of analysis, but was added after the experience of the first family with issues resulting from potty-training, allowing parents to quickly replace the belt in case the original one needed washing. It also allows children to wear the ActiGraph GT3X+ during aquatic activities and have a dry belt to place the accelerometer back on straight after the activity, thus avoiding loss of data because of waiting for the original belt to dry. Figure 32 - Images for labelling child, mother and father's accelerometers. 203 Chapter Seven - Measuring the physical activity and sedentary behaviour of 2 to 3 year old South Asian and White British children and both parents – a pilot study with the ActiGraph GT3X+ ______________________________________________________________________________________________________ During the first visit, parents were reminded of the procedures regarding accelerometer use, shown how to fill in the activity diary, and given the opportunity to ask questions. After this, parents were requested to sign the informed consent forms for themselves and their children. If one of the participating parents was not present during the first visit, a copy of the informed consent form was left in the family pack for them to sign before the last home visit. After formal consent was given, the following parents’ and children’s anthropometrical measurements were taken by the author: height, weight, waist circumference, triceps and subscapular skinfolds (in children only), hip circumference and percent body fat (in parents only). Height was measured to the nearest 1 mm, using a portable stadiometer (Holtain Ltd, Crosswell, UK), with a wooden standing platform placed on a hard horizontal surface. Weight was measured to the nearest 0.1 Kg on a Tanita weighing scale (Tanita, model BC 418 MA, Tokyo, Japan), placed on a hard horizontal surface, with participants being barefoot and free of heavy clothing (e.g. outdoor jackets, heavy sweat-shirts or work trousers). When children were not willing to stand on the scale alone, the mothers were weighed again bearing the child on their lap, and mother’s individual weight was subtracted from the latter to obtain the child’s weight. For parents, percent body fat was also measured with the bioelectrical impedance feature of the Tanita scale. Waist circumference was measured with a Seca measuring tape to the nearest 0.5 cm at the level of the umbilicus, directly over the skin when this was allowed by the participants. In case this was considered embarrassing or unsuitable for participants (particularly due to cultural sensitivity in South Asian families), participants were asked to either change into lighter clothing or remain with the thinnest possible layer of clothing, and measurement was made with care to remove any bold creases that would introduce further error into the measurement. Parents’ hip circumference was measured to the nearest 0.5 cm at the level of the most posterior part of the Gluteus Maximus, with the participant standing sideways towards the author. Children’s triceps skinfold was measured to the nearest 0.5 mm on the posterior surface of the child’s left arm, half way between the most distal point of the Acromion and the Lateral Epicondile. 204 Chapter Seven - Measuring the physical activity and sedentary behaviour of 2 to 3 year old South Asian and White British children and both parents – a pilot study with the ActiGraph GT3X+ ______________________________________________________________________________________________________ The subscapular skinfold was measured on the left of the Lower Angle of the left scapula, on a perpendicular angle. Both skinfolds were measured using a Harpenden Skinfold Caliper, and the value was recorded after three seconds if the pointer had reached stability. Whenever it was not possible to take the measurements on the first home visit, these were taken during the last home visit or on a third meeting specifically arranged for this purpose up to 8 days after the last day of data collection. At the end of this first visit, the time and date for the last home visit was scheduled and participants were asked if they would like to be sent a text message reminder during the first three days of data collection (in addition to the magnet given to all participants). In case participants requested this, mobile phone contact and usual wake-up times for both week and weekend days were recorded, and a standardised text message was sent roughly five minutes after the advised wake-up times. All participants were advised to contact the author via email or mobile telephone in case of any concerns or issues regarding any of the study materials or protocols during data collection. During the last home visit, all monitors and study documents were collected, and any missing anthropometric measurements were taken (e.g. from a family member who was absent during the first visit, or any measurements that were previously unfeasible to make due to child’s lack of collaboration). Mothers were also asked to fill in the questionnaire form assessing built environment attributes of their neighbourhood (based on the Neighborhood Environment Walkability Scale) (Adams et al, 2009), PA and walking habits. After completion of the questionnaire, the semi-structured “end of data collection” interview was conducted with the mother, to assess if there were difficulties in wearing the accelerometer for both parents and the child, filling in the activity diary or the questionnaire, whether the week of data collection had been a “typical week” or more/less active (and why), and also if the child had been ill during that week. Because most of the information collected in addition to the accelerometry data is not under the primary focus this thesis (i.e. the measurement of PA and SB), it will not be formally analysed in the current chapter. However, the measurements and procedures described above were necessary to answer the research questions proposed in the main BIB-attached project for which the current chapter acted as a pilot-study. Thus, the 205 Chapter Seven - Measuring the physical activity and sedentary behaviour of 2 to 3 year old South Asian and White British children and both parents – a pilot study with the ActiGraph GT3X+ ______________________________________________________________________________________________________ full description of all data collection procedures was provided to provide the reader with enough information on 1) the full spectrum of participant burden, 2) the possible attrition effects of the latter, and 3) the measures that were taken to address cultural sensitivity and promote adherence to the protocol. 7.2.3. Physical Activity and Sedentary Behaviour Measurement Children and parents’ activity behaviours were measured with the ActiGraph GT3X+, during waking hours over eight consecutive days. The ActiGraph GT3X+ was set to record data at 60Hz, which was the maximum frequency possible for nine consecutive days of data collection. This nine-day period was programmed to give families the opportunity to still comply with the eight-day protocol if they forgot to wear the monitors on the first day. Each device was programmed to start recording at 5:00am of the first day, and stop recording at 5:00am on the 10th day (i.e. nine full 24-hour days). At the first home visit, parents (most commonly mothers) were instructed and shown how to place the ActiGraph GT3X+ at the level of the anterior superior iliac spine, underneath or on top of clothes, and to place it consistently on the same side of the body. Parents were advised to place the devices underneath children’s clothes, to avoid any issues resulting from children’s curiosity (e.g. removal of the device, or erroneous acceleration data resulting from the child playing with the monitor). Participants were instructed to place the accelerometers after waking up in the morning and remove them at the time of going to bed, and to note down in the activity diary any other periods when the accelerometer was removed and the corresponding reason. Additionally, parents were asked to record in the activity diary any day-time sleep (i.e. naps) that the child may have during the data collection period. After collecting the monitors at the second home visit, the raw accelerometry data (*.gt3x file) was downloaded from parents and children’s accelerometers and analysed in the proprietary software ActiLife (v.6). The raw accelerometry file was then transformed into an *AGD file (which can then be visualised and analysed in ActiLife), displaying the acceleration counts by 5-second epochs, using the low frequency extension filter. Due to the scarce research defining the correct criteria specifically for 206 Chapter Seven - Measuring the physical activity and sedentary behaviour of 2 to 3 year old South Asian and White British children and both parents – a pilot study with the ActiGraph GT3X+ ______________________________________________________________________________________________________ toddlers (Cliff, Reilly & Okely, 2009), wear-time validation and day inclusion criteria was undertaken in agreement with procedures used previously both in preschoolers (Hinkley et al, 2012b) and toddlers (van Cauwenberghe et al, 2011). Non-wear time was determined as ≥10 minutes of consecutive zero counts, which was considered adequate for the typical activity patterns of this age group (Oliver, Schofield & Schluter, 2009). Following wear time validation, children’s accelerometry files were scanned to assess what time the accelerometer was placed on and taken off, thus defining the start and end of each day. The start of a day was recorded after the first consecutive minute of acceleration data higher than zero, and the end of a day was defined as the last epoch. Only days with ≥3 hours and ≤18 hours of valid wear time were included for analysis (Hinkley et al, 2012a and 2012b). This ensured that implausible wear times (Hinkley et al, 2012a and 2012b) would not influence the definition of a valid day, nor the following assessment of SB and PA levels. A valid day was defined according to the 70/80 rule (Ward et al, 2005; van Cauwenberghe et al, 2011): 80% of the period during which at least 70% of the study population has recorded accelerometer data. Since at least 70% of the sample had ≥587.82 minutes of valid acceleration data, a valid day was defined as one containing ≥470.26 minutes of valid acceleration data. SB and PA were assessed with the overall Axis1 cut-points defined in chapter four. The appropriate number of days needed for a reliable estimate of SB and PA in children younger than three years has not yet been defined (Cliff, Reilly & Okely, 2009), this was also investigated in the analysis for the current chapter, following procedures similar to those used by Hinkley et al (2012a) in preschoolers. In parents, accelerometry data cleaning procedures followed those previously employed in the literature (Metzger et al, 2008; Tudor-Locke, Camhi & Troiano, 2012). Non-wear time was defined as ≥60 minutes of consecutive zeros, and a valid day was considered if wear-time was ≥600 minutes. Parents with ≥3 valid days were considered to provide enough data for inclusion in studies assessing habitual PA (Metz et al, 2008), and included in further analyses. Acceleration files were downloaded in 1-minute epochs, and time spent in SB, light PA and MVPA were calculated using Sasaki, John and Freedson’s (2011) VM cut-points. 207 Chapter Seven - Measuring the physical activity and sedentary behaviour of 2 to 3 year old South Asian and White British children and both parents – a pilot study with the ActiGraph GT3X+ ______________________________________________________________________________________________________ 7.2.4. Statistical Analysis All scale variables were checked for normality of distribution by visual inspection of histograms and formally tested. All analyses were run in Stata (v.12) or SPSS (v.19) statistical software packages. 7.2.4.1. Definition of how many and which days are needed for a reliable estimate of activity behaviours. Mean or median (according to the normal or non-normal distribution of the variable) of SB, total PA, MVPA, and percentage of wear time spent in SB (%SB), total (%total) PA and MVPA (%MVPA) were calculated for week days, weekend days, and overall. The use of %SB, %total PA and %MVPA was to account for potential differences in wear time within and between participants (Hinkley et al, 2012a). To eliminate potential confounding effects of lost days, only children with ≥7 complete days were included in this part of the analyses (n=44). Before the reliability analysis of SB and PA data was undertaken, differences in wear time, %SB, %total PA and %MVPA between week and weekend days were assessed with paired t-tests or Wilcoxon matched-pair signed-rank tests. This was to investigate the need of a valid weekend day to estimate a child’s habitual activity behaviour, thus making it a requirement to include a child in further analyses, since it is not currently known whether SB and PA differs between week and weekend days in children younger than three years (Cliff, Reilly & Okely, 2009). The number of days needed to reach a reliability of 0.8 was investigated using the Spearman–Brown prophecy formula (Hinkley et al, 2012a; Trost et al, 2000). When this resulted in a value with decimal places, the number of days needed was rounded up to the next complete day – i.e. if calculations resulted in 3.4 days, four days was considered the amount needed to ensure that enough data would be collected for a reliability of 0.80. To assess potential reactivity of children to the accelerometers (e.g. less time spent in SB), one-way repeated measures ANOVA or Friedman’s two-way ANOVA by ranks were used to assess differences in %SB, %total PA and %MVPA 208 Chapter Seven - Measuring the physical activity and sedentary behaviour of 2 to 3 year old South Asian and White British children and both parents – a pilot study with the ActiGraph GT3X+ ______________________________________________________________________________________________________ across the 7-day monitoring period. Reliability of the activity estimates was assessed with two-way random intra-class correlation coefficients (defined for consistency type). 7.2.4.2. Recruitment intake and compliance analyses Descriptive statistics (means, medians, standard deviation (SD), inter-quartile ranges (IQR), and percentages) were computed to describe the sample of provided contacts, recruitment intake and compliance with the study protocol of eight days of wearing the accelerometer. Differences between ethnicities, parental figures, and child’s sex were assessed with the Chi-square (2) or Fisher’s Exact test. Differences in the SES of those who accepted or refused to take part, compliant versus non-compliant with the 8day protocol, and provided enough accelerometry data or not were investigated with Mann-Whitney U or unpaired t-tests. 7.3. Results In total, 160 families provided contact details, with balanced number of boys and girls, but predominantly of White British ethnicity. From these families, 70% (n=97) agreed to take part in the study, and the vast majority of children (85%) wore the accelerometer for at least one day. Valid data from 44 children were available for the investigation of monitor reactivity, and number and type of days needed to include a child in a study of habitual PA and SB. Detailed results on defining the minimum days needed to for inclusion in the study, study intake and compliance (separately for parents and children) are described below in sections 7.3.1–7.3.4. 7.3.1. Definition of days needed for a reliable estimate of SB and PA. There was no evidence of reactivity to the monitor, as illustrated in figure 33. Differences in %SB, %PA and %MVPA between the 1st through 7th day of wearing the monitor were non-significant (all p≥0.797). The only significant differences observed were in wear time (p=0.042), but showing no evidence of a trend (i.e. first few days longer than the last, or vice-versa), with differences alternating between positive and 209 Chapter Seven - Measuring the physical activity and sedentary behaviour of 2 to 3 year old South Asian and White British children and both parents – a pilot study with the ActiGraph GT3X+ ______________________________________________________________________________________________________ negative differences through the seven consecutive days (range: -9.28% to +8.49%). For example, the median minutes for day one was 691.30, increasing to 713.92 minutes on day three, decreasing to 655.13 minutes on day five, finishing at 674.71 minutes on the last day. As such, there was no exclusion of the first day in subsequent analyses. Figure 33 – Wear time and percentages of time spent in sedentary behaviour, total physical activity and moderate-to-vigorous physical activity from the first through seventh monitoring day. The only significant difference observed between week and weekend days was again regarding wear time duration, whereby on week days children tended to wear the monitor for a mean of 24.47 minutes (±73.14) longer than on weekend days (p=0.032). 210 Chapter Seven - Measuring the physical activity and sedentary behaviour of 2 to 3 year old South Asian and White British children and both parents – a pilot study with the ActiGraph GT3X+ ______________________________________________________________________________________________________ Because no other variable showed a significant difference between week and weekend days (see figure 34), and the mean difference observed in wear time was small (3.593.72% of a day), no restriction on the type of day was imposed for any subsequent analyses. Figure 34 – Wear time and percentages of sedentary behaviour, total physical activity and moderate-to-vigorous physical activity between week and weekend days. After confirming the absence of reactivity and the lack of any significant difference in activity behaviours between week and weekend days, reliability and the number of days needed to estimate habitual activity behaviours were calculated with the exact same seven days used in those two analyses. Regarding the consistency of SB, MVPA and 211 Chapter Seven - Measuring the physical activity and sedentary behaviour of 2 to 3 year old South Asian and White British children and both parents – a pilot study with the ActiGraph GT3X+ ______________________________________________________________________________________________________ total PA, ICC values over the seven days ranged between 0.91 and 0.93 (all p<0.0001). Rounding up to full days (to ensure enough data is collected), the Spearman-Brown prophecy formula suggests that three valid days are needed for a reliability ≥0.80 for %SB, %total PA and %MVPA (see table 32). Consequently, all toddlers presenting ≥3 valid days (i.e. days with valid wear time ≥470.26 minutes) were considered to provide enough data to calculate habitual levels of PA and SB in subsequent analyses. Table 32 - Reliability of 7-day sedentary behaviour and physical activity estimates, and days needed for a 0.8 reliability. 7-day ICC p-value (95%CI) % Sedentary Behaviour % Total Physical Activity % Moderate-to-Vigorous Physical Activity 0.93 (0.89 - 0.96) 0.93 (0.89 - 0.96) 0.91 (0.87 - 0.95) Minimum days needed for 0.8 reliability <0.0001 2.05 <0.0001 2.05 <0.0001 2.66 ICC – Intraclass correlation coefficient 7.3.2. Recruitment intake A total of 160 families provided contact details from recruitment at BIB clinics or home visits, of which 70% agreed to participate in the study, and only 17% refused. A further 12% requested to be contacted again at a later date, or did not answer the contact attempts made by the author. Roughly one third of families who provided contact details were South Asian, and half of the sample belonged to the 20% most deprived SES. Further details can be seen below in table 33. 212 Chapter Seven - Measuring the physical activity and sedentary behaviour of 2 to 3 year old South Asian and White British children and both parents – a pilot study with the ActiGraph GT3X+ ______________________________________________________________________________________________________ Table 33 - Recruitment intake (in total and by ethnicity). Total Families IMD rank † White British South Asian 160 112 48 (100%) (70%) (30%) 18.30 24.55* 8.80* (6.06 - 41.01%) (6.05 - 44.94%) (6.32 - 22.60%) Recruitment Accepted Refused Contact again / no return to contact 97 76* 21 * (70.29%) (77.55%) (53.50%) 24 11* 13 * (17.39%) (11.22%) (32.50%) 17 11* 6* (12.32%) (11.22%) (15.00%) IMD - Index of Multiple Depravation; † Median (inter-quartile range); * significant difference between ethnicities (p≤0.006) IMD differed significantly between ethnicities (p<0.001), but not between those who accepted or refused to take part in the study (p=0.461). There was a significantly lower refusal and higher proportion of intake into the study by White British than South Asian families (2=10.258, df= 2, p= 0.006), as illustrated in the Figure below. 213 Chapter Seven - Measuring the physical activity and sedentary behaviour of 2 to 3 year old South Asian and White British children and both parents – a pilot study with the ActiGraph GT3X+ ______________________________________________________________________________________________________ 2= 10.258, df= 2, p= 0.006 Figure 35 – Recruitment intake in White British and South Asian families. 7.3.3. Compliance of Children In total 89 children (54% boys; 74% White British) had a first home visit and were set to start data collection. Of those, the vast majority (85%) wore the accelerometer for at least one valid day, with a median of seven days per child. There were no significant differences between sexes or ethnicities regarding the proportion of children who wore the accelerometer for at least one day. Only 39% of those who wore the ActiGraph GT3X+ actually complied with the instructed eight consecutive days of data collection, with a significantly higher proportion of White British complying with the protocol than South Asian (2= 5.14, df= 1, p= 0.023). There were no significant differences between sexes or South Asian and White British in the number of children providing ≥3 valid days. There was, however, a significant difference between ethnicities in daily wear time. South Asian children wore the accelerometer for a median of 696 minutes per day, whereas White British children wore the accelerometer for a median of 642 minutes (p=0.017). Full details about wearing and compliance rates can be seen below in table 34. 214 Chapter Seven - Measuring the physical activity and sedentary behaviour of 2 to 3 year old South Asian and White British children and both parents – a pilot study with the ActiGraph GT3X+ ______________________________________________________________________________________________________ Table 34 – Compliance of children with data collection protocol (by sex and ethnicity). Total Participants IMD rank † Boys Girls White British South Asian 89 48 53 66 23 (100%) (53.93%) (46.07%) (74.16%) (25.84%) 17.34% 18.79% 12.64% 21.57% * 8.23% * (5.86 - 41.46%) (8.23 - 41.58%) (5.35- 40.82%) (5.92 - 44.40%) (5.66 - 12.67%) Wear (≥1 day) Worn Not worn Days worn† 76 # (85.39%) 13 41 35 58 18 (85.42%) (85.37%) (87.88%) (78.26%) # (14.61%) 7 6 8 5 (15.58%) (14.63%) (12.12%) (21.74%) 7 7 7 7 6 (5.25 - 8) (6 - 8) (5 - 8) (5.75 - 8) (4.5 - 8) Compliance with 8-day protocol Complied Not complied Enough valid data Yes No 30 16 14 27 * 3* (39.47%) (39.02%) (40.00%) (46.55%) (16.67%) 46 25 21 31 * 15 * (60.53%) (60.98%) (60.00%) (53.45%) (83.33%) (≥3 days) 67 36 31 52 15 (88.1%) (87.80%) (88.57%) (89.66%) (83.33%) 9 5 4 6 3 (11.84%) (12.20%) (11.43%) (10.34%) (16.67%) IMD - Index of Multiple Depravation; † Median (inter-quartile range); * Significant difference between ethnicities (p≤0.023); # Children who wore the ActiGraph had significantly higher IMD rank than those who didn't (18.59% versus 5.45%; p=0.033) Children who did not wear the accelerometer had a significantly lower IMD rank than those who wore it for at least one day (p=0.033). SES was significantly higher in White British than in South Asian toddlers, with nearly identical values to those from the families who provided contact details. 7.3.4. Compliance of Parents In total, 133 parents (60% mothers; 77% White British) had a first home visit and were set to start data collection. Over 90% wore the accelerometer for ≥1 valid day, with a 215 Chapter Seven - Measuring the physical activity and sedentary behaviour of 2 to 3 year old South Asian and White British children and both parents – a pilot study with the ActiGraph GT3X+ ______________________________________________________________________________________________________ median of seven days per parent. There were no significant differences between mothers and fathers or ethnicities in the number of individuals who wore the accelerometer for ≥1 valid day. Significantly more mothers complied with the 8-day protocol than fathers (2= 6.99, df= 1, p=0.008). However, there was no significant difference in the number of mothers or fathers providing ≥3 valid days. Full details can be seen below in table 35. Table 35 – Compliance of parents with data collection protocol (by parental figure and ethnicity). Total Participants IMD rank† Mother Father White British South Asian 133 80 53 102 31 (100%) (60.15%) (39.85%) (76.69%) (23.31%) 16.58% 15.83% 18.79% 23.35% * 10.05% * (5.66 - 41.69%) (5.56 - 41.5%8) (5.83 - 43.71%) (5.52 - 44.40%) (5.66 - 17.97%) Wear (≥1 day) Worn Not worn Days worn † 123 74 50 97 27 (93.18%) (92.50%) (94.34%) (95.10%) (87.20%) 9 6 3 5 4 (6.82%) (7.50%) (5.66%) (4.90%) (12.90%) 7 8# 7# 7 7 (6 - 8) (6 - 8) (5 - 8) (5 - 8) (6 - 8) 54 40 # 15 # 44 11 (43.90%) (54.05%) (30.00%) (45.36%) (40.74%) 69 34 # 35 # 53 16 (56.10%) (45.95%) (70.00%) (54.64%) (59.26%) Compliance with 8-day protocol Complied Not complied Enough data (≥3 days) Yes No 112 70 43 87 26 (91.06%) (94.59%) (86.00%) (89.69%) (96.30%) 11 4 7 10 1 (8.94%) (5.41%) (14.00%) (10.31%) (3.70%) IMD - Index of Multiple Depravation; † Median (inter-quartile range); * Significant difference between ethnicities (p=0.005); # significant difference between mother and father (p≤0.018) Similarly to the sample of toddlers and mothers who provided contacts, IMD rank was significantly higher for White British than for South Asian families (p=0.005). 216 Chapter Seven - Measuring the physical activity and sedentary behaviour of 2 to 3 year old South Asian and White British children and both parents – a pilot study with the ActiGraph GT3X+ ______________________________________________________________________________________________________ 7.4. Discussion The current study assessed the feasibility of introducing the additional measurement of toddlers and parents’ habitual PA and SB in the BIB cohort study, exploring the possible differences in the recruitment and compliance rates between White British and South Asian families. Bearing in mind the >75% follow-up rates for each round reported by Wright et al (2012), and that recruitment was undertaken during the fourth and fifth follow-up rounds, the number of families who agreed to take part in the study represents roughly between 15-25% of the families retained in the BIB1000 sub-sample. Although there was a significantly higher rate of White British families who provided contact details (70% versus 30%) and agreed to take part in the study (78% versus 54%), there was no difference in the number of White British and South Asian parents and children who provided enough data for the assessment of habitual PA and SB (see tables 34 and 35). This suggests that the difficulty may be indeed in the recruitment of South Asian participants, as previously reported in the literature (Douglas et al, 2011; Rooney et al, 2011), but not in providing enough data to be included for analysis once they have agreed to take part in the study. Rooney et al (2011) identified several barriers to the recruitment of South Asian into research, including unfamiliarity with the research process, fear of the unknown, competing priorities (e.g. employment or childcare), potential language or communication issues, and the lack of a direct and personalized approach from researchers (considered by the authors as the main barrier). Although the current study attempted to recruit participants through BIB staff, with whom the families were already familiar and have an ongoing trust relationship, recruitment of South Asian families particularly could have benefited from the establishment of further partnerships with religious and local South Asian organisations, which was a successful strategy used previously by Douglas et al (2011). It should also be taken into account that the families approached were part of the BIB1000 focus sample of the BIB study, who have already agreed to have an increased number of measurements taken in relation to the wider cohort (Wright et al, 2012). It is possible that taking part in an additional sub-study was considered by many of the BIB1000 families as too burdensome. Establishing links with 217 Chapter Seven - Measuring the physical activity and sedentary behaviour of 2 to 3 year old South Asian and White British children and both parents – a pilot study with the ActiGraph GT3X+ ______________________________________________________________________________________________________ trusted local organisations (e.g. Children’s Centres, who proved to be very helpful and successful in both chapters three and four) would also allow the opportunity of reaching families taking part only in the wider BIB study, to whom the participation in one additional sub-study may not represent as much of an excessive burden as for families from the BIB1000 focus sample. In line with what had been suggested by Cliff, Reilly and Okely (2009), no significant differences were observed in toddlers’ SB and PA between week and weekend days. There was also no evidence of reactivity to wearing the monitor, in the sense of increased PA resulting from wearing a “PA monitor” as seen in adults (Clemes & Deans, 2012), which had not been investigated before in such young children (Oliver, Schofield & Kolt, 2007). Although three days proved to be enough for the reliable assessment of habitual PA & SB (ICC ≥0.80), data collection periods may need to last longer than that. For 10 out of the 37 children who did not comply with the 8-day protocol but still provided ≥3 valid days, it took between four and five days to reach this minimum. In one case, it took seven days for the toddler to add up three valid days. It may be sensible to set the data collection period at a minimum of five days in future studies assessing the habitual PA and SB of toddlers, to allow the exclusion of two days and still obtain the minimum days needed for inclusion in the study. 7.4.1. Issues, reasons for non-wear and suggestions reported by parents Nearly all parents reported that wearing the accelerometer was not difficult for their toddlers. For more than 10% of the children who provided ≥3 valid days, the parents reported that wearing the ActiGraph GT3X+ was “fun”, and that in many days it was even the child who reminded the parent to place the accelerometer on in the morning. The main issue reported by the parents was the unwillingness of some children to wear the accelerometer, even after a few days and several strategies used by the parents to try to convince them. The latter was the reason given for the majority of children who started data collection but did not register any valid days of wearing the accelerometer, in both White British and South Asian families. In most cases, parents had expressed uncertainty about the unwillingness of children to wear the monitor during recruitment or 218 Chapter Seven - Measuring the physical activity and sedentary behaviour of 2 to 3 year old South Asian and White British children and both parents – a pilot study with the ActiGraph GT3X+ ______________________________________________________________________________________________________ the first visit, reflecting their experiences with other accessories which their offspring refuse to wear in daily life (e.g. belts or hair accessories). Therefore, the loss of these participants was not unexpected – it is up to each researcher to decide if it is worth attempting data collection with children whose parents have greater doubts about their willingness to wear the activity monitor. On the other hand, there were also four children for whom the parents reported no issues with wearing the ActiGraph GT3X+ (including forgetting to wear the device or the child repeatedly taking it off) but who barely registered any acceleration data during the eight days or did not provide ≥1 valid day, after cleaning and analysing each individual acceleration file. Two children used the accelerometer as a “hide-and-seek” game, which resulted in no valid days registered because of temporary misplacement of the device, or too many daily occasions of nonwear time. Three further children did not wear the accelerometer due to personal issues of parents (e.g. going through a divorce or extra unexpected work load), which made it difficult to remember to wear the accelerometer during the data collection period, or just too burdensome at the time. Such issues are likely to happen in other settings, and should be taken into account when calculating sample sizes needed for future studies, which should include compensation for possible data losses. This will help to avoid missing significant differences or relationships between variables due to insufficient final sample sizes, especially if the expected effect sizes are small. In agreement with the speculations made in the focus groups from chapter three, some mothers reported that their children had occasionally played with the ActiGraph GT3X+ when its presence was noted, or refused to wear the device. As mentioned above, this resulted in the lack of any valid days for some children. However, two children were recovered for inclusion after a second attempt or prolonging the data collection period, and using strategies such as competing with the parents to see who would wear it for longer, or using a reward scheme for wearing the accelerometer from morning until bed time. Similar strategies may be useful for future studies using activity monitors to measure the habitual PA and SB of such young children. Two devices could not be retrieved from a White British family, even after the last home visit and two phone calls, (presumably) due to the participants losing the 219 Chapter Seven - Measuring the physical activity and sedentary behaviour of 2 to 3 year old South Asian and White British children and both parents – a pilot study with the ActiGraph GT3X+ ______________________________________________________________________________________________________ accelerometers. At the last home visit, the mother reported that she was not sure of where she had stored the monitors, to which the author reassured there was no problem and arranged to call in one week’s time to re-assess the situation. After confirming in the first follow-up phone call that the accelerometers had been found, the mother was not present at the arranged pick-up visit, denying knowledge of the study and the previous contacts during the final follow-up phone call. Researchers need to be aware of the possibility of device losses during data collection, and have extra devices set aside to ensure the timely continuation of the planned data collection, thus avoiding delays resulting from a decreasing number of accelerometers available. There were two suggestions made by the parents regarding the use of the ActiGraph GT3X+. One of them was regarding the use of the accelerometer with the parents: some parents suggested that using a clip instead of a belt might be easier and more comfortable for individuals whose professions already require the use of specialised belts and accessories (e.g. policemen or construction workers). The other was regarding the use of the accelerometer with the children: it was suggested that placing the accelerometer underneath the clothes (as advised during the first visit) was the best strategy to avoid the children noticing its presence, and playing with the device due to their inherent curiosity. 7.4.2. Hardware issues Additionally to the loss of data resulting from practical issues, there was partial data loss from one White British father and one South Asian child, due to faulty memory of two devices. The older batch of ActiGraph GT3X+ showed a shortening in battery life towards the final data collection rounds (regardless of the complete recharging of batteries prior to every round), which in two cases resulted in the loss of the last day. This issue with battery life results from the repeated usage of the accelerometers. Researchers are advised to ensure the complete recharge of batteries before all data collection rounds, to avoid the loss of valuable data. If low temperatures are expected during the programmed data collection period, and the latter is longer than six days (minimum time recorded before device stand-by due to low battery), an alternative 220 Chapter Seven - Measuring the physical activity and sedentary behaviour of 2 to 3 year old South Asian and White British children and both parents – a pilot study with the ActiGraph GT3X+ ______________________________________________________________________________________________________ option would be to provide participants with a second accelerometer unit half-time between monitor delivery and collection. 7.4.3. Other successful strategies The magnet reminder was reported by most families as a good strategy to remind parents to wear the ActiGraph GT3X+ soon after getting up. The text messages at time of waking up during the first three days was reported as very useful by all families who requested it, with over one third of mothers reporting it as crucial for complying with the protocol, or without which they would not have remembered to place the monitor on themselves and their children during the first day. Programming the ActiGraph GT3X+ with one extra day allowed three families to still comply with the 8-day protocol, or at least enough days to be included in studies assessing the habitual levels of PA and SB in both the toddlers and adults (Metzger et al, 2008). Providing participants with a contact telephone number which they can use whenever doubts regarding any part of the data collection protocol arise is also advisable. In the current study several mothers contacted the author during the first days of data collection regarding different issues, such as making sure the device should not have any lights on while collecting data (as they were programmed to flash while waiting to begin data collection), or asking for suggestions of strategies to encourage the child to wear the accelerometer. The clarification of such doubts and reassurance provided by the author was appreciated by the mothers, and reported by some as very useful for the success of using the accelerometer for enough days with the children. The use of a check-list with all the materials/documents needed for each visit was crucial to avoid the loss of important data due to forgetfulness. Collecting parents’ opinions and suggestions about study documents, materials and protocols is extremely important and advised, and preferably with open-ended questions. The latter allow participants to fully describe any issues that they may have faced and any strategies used to cope with them. This information is valuable to enable the refinement of study procedures and documents, minimising participant burden, and promoting better compliance with future study protocols. 221 Chapter Seven - Measuring the physical activity and sedentary behaviour of 2 to 3 year old South Asian and White British children and both parents – a pilot study with the ActiGraph GT3X+ ______________________________________________________________________________________________________ This study is not without limitations. First and foremost, the recruitment rates and intake into the study are inherently linked to the BIB study and the procedures used for recruitment and retention of participants. Because this was only a pilot-study and a “satellite research project” within the core BIB cohort study, extra care was taken to avoid creating (from the first contact) an extra burden for participants, which could lead to the drop-out of families from the main study. Secondly, many of the issues identified during data collection may be very specific to the sample of the current study. However, the majority of the practical issues (both noted by the author and those raised by the parents) regarding hardware of the device or accelerometer use are transferable to the wider population and to varied settings, and the suggestions and strategies employed would be relevant in any study attempting to assess the habitual PA and SB of toddlers with activity monitors in general. In conclusion, to our knowledge, this was the first pilot-study that investigated the feasibility of using an accelerometer in a large sample of White British and South Asian toddlers and their parents. From our results, it seems feasible to measure the habitual PA and SB of both South Asian and White British toddlers and their parents, taking part in the BIB cohort study. More White British than South Asian families were recruited and agreed to take part in the study, but both ethnicities showed similar rates of toddlers and parents providing enough data for the assessment of habitual PA and SB. Additional opportunities for the direct recruitment of South Asian participants, partnering with trusted institutions, may help to overcome some of the barriers previously reported in the literature (Rooney et al, 2011), thus increasing the chances of recruitment and intake of South Asian families into the study. There was no evidence of reactivity of wearing the ActiGraph GT3X+, and a minimum of three days proved to be necessary for reliably assessing the habitual SB and PA in South Asian and White British toddlers. Several issues and suggestions resulting from the experience of conducting this pilotstudy were also presented, which should be considered when planning future studies, to enhance the recruitment and compliance with the study protocol in both White British and South Asian families with 2-3 year old children. 222 Chapter Eight - Conclusions ______________________________________________________________________________________________________ CHAPTER EIGHT Conclusions 223 Chapter Eight - Conclusions ______________________________________________________________________________________________________ Because the self-contained chapters three to seven had individual discussion sections which included limitations and concluding remarks, the present chapter will reiterate the key findings, but focus mainly on the implications and directions for future research. 8.1. Key Findings and Implications 8.1.1. Chapter Three The aim of chapter three was to explore the practical feasibility and acceptability of using the ActiGraph GT3X+, the Actiheart and the activPAL3 to measure the PA and SB of 2-3 year old South Asian and White British children and their parents, using focus groups with mothers. The ActiGraph GT3X+ was the most preferred activity monitor overall, and prompted the least number of perceived issues for use with the children. The Actiheart was the least accepted monitor, and raised the largest number of issues regarding its use with all three family members. Some ethnic differences were found: 1) most South Asian mothers suggested that fathers should be directly asked for their opinions about wearing the accelerometers; and 2) some South Asian mothers showed a stronger opposition to wearing the Actiheart than White British mothers. Several practical issues that may arise with the use of three of the most recently available accelerometers were identified, in both parents and very young children of two different ethnic backgrounds, which had not been previously reported. Such issues have the potential to negatively impact recruitment and retention rates, as well as compliance with study protocols. This highlights the importance of assessing the acceptability and feasibility of a range of devices with a sample of individuals that is representative of the population of interest, when planning a study using activity monitors to measure SB/PA. Such information can enhance compliance with study protocols, and reduce the chances of recruiting a biased sample with under-representation of certain population groups (Hussain-Gambles, Atkin & Leese, 2006). 224 Chapter Eight - Conclusions ______________________________________________________________________________________________________ 8.1.2. Chapter Four The aims of this study were to derive triaxial equations and Axis1 and VM cut-points for the ActiGraph GT3X+ accelerometer, to assess SB and PA intensity in 2-3 year old children. Additionally, this chapter also investigates the theoretical advantage of using triaxial accelerometry to accurately assess young children’s SB and PA, over using the vertical axis only. Using mixed-effects linear regression models to derive cut-points did not show better accuracy or agreement with CARS than using ROC curve analysis (the technique used in most previous calibration studies). Similarly, incorporating three axes of movement (i.e. VM) showed little improvement over using the vertical axis (i.e. Axis1) only, regarding the accuracy and reliability of resulting cut-points against the goldstandard, and the estimated time spent in SB, light PA and MVPA. The cut-points for 5second epochs showed better agreement with CARS than those for 10-second epochs, with the sex-specific showing better agreement than overall cut-points in the calibration sample. The newly developed cut-points provide a more accurate assessment of toddlers’ SB and PA than Trost et al’s (2012) 15-second cut-points. However, due to the extreme overestimation of MVPA and significant underestimation of light PA observed in the validation study, it is advisable that future studies use the SB cut-point only to distinguish between SB and PA, in order to avoid inflated estimates of toddlers’ PA levels. The overall 5-second Axis1 cut-points provide the best trade-off of biases in the estimation of time spent in SB/PA, therefore offering the best choice of cut-points for future research with toddlers. 8.1.3. Chapter Five The aims of this study were to validate the new ActiGraph GT3X+ cut-points derived in the previous chapter with an independent sample of 2-3 year olds, and compare their validity to that of Trost et al’s (2012) toddler cut-points in assessing toddlers SB, light PA and MVPA. The validation study confirmed that the newly developed 5-second cutpoints provided the best classification accuracy, and the smallest biases in the estimation of time spent in SB, light PA and MVPA. It also confirmed that the 5-second 225 Chapter Eight - Conclusions ______________________________________________________________________________________________________ cut-points show a large improvement in classification accuracy and reliability relative to those published by Trost et al (2012), and much smaller biases in the under- or overestimation of SB, light PA, and especially MVPA. Although the VM cut-points still showed slightly higher classification agreement with the CARS (akin to the calibration study), the 5-second Axis1 cut-points showed much smaller bias in the estimation of time spent in SB, light and total PA, with similar bias in the estimated MVPA time. Because all cut-points overestimated observed MVPA by ≥121% and underestimated light PA by ≥24%, it is advisable to use the SB cut-point to distinguish only between SB and PA. For this, the overall Axis1 SB cut-points of ≤5 counts/epoch provided the best trade-off of biases in estimated time spent in SB and total PA (-2.31% and 0.95% respectively) in relation to direct observation The use of this cut-point is, therefore, recommended for future surveillance and intervention studies assessing the SB and PA of 2-3 year old children. Because the vertical acceleration assessed by the ActiGraph GT1M and GT3X+ models has been shown to have near perfect agreement (Robusto & Trost, 2012), the overall 5second Axis1 cut-points developed in this thesis can also be applied to data assessed with the GT1M model, with reasonable confidence in the validity of the outcomes. This allows researchers to maximise the use of existing equipment resources, if already owned ActiGraph GT1M units have enough memory and battery capacities to assess toddlers’ activity for enough days using 5-second epochs. Some published studies have collected data in 5-second epochs to try to detect the intermittent SB and PA patterns of such young children, but later aggregated acceleration into 15-second epochs in order to use available accelerometry cut-points (e.g. Vale et al, 20110). Such data can be reclassified using the overal 5-second Axis1 cut-points developed in this thesis, thus providing a more accurate measure that can be used to reanalyse the data and confirm the results. 8.1.4. Chapter Six The aim of the study reported in chapter six was to investigate the effect of using 5-, 10and 15-second time sampling periods (epochs) on the estimated time spent in SB, light 226 Chapter Eight - Conclusions ______________________________________________________________________________________________________ PA and MVPA, according to direct observation Using the CARS as the gold-standard, longer epochs of 10- and 15-seconds gradually underestimated SB and MVPA, and overestimated light PA in relation to 5-second epochs. This resulted in smaller amounts of observed SB and MVPA epochs available to be identified by accelerometry cutpoints. Longer durations also allow for a wider variety of CARS intensity levels to be included in epochs with an average CARS score ≤ 2 or ≥4, and consequently a larger range of acceleration values corresponding to observed SB and MVPA epochs. To be considered as a cut-point, a given acceleration threshold has to be able to identify a high proportion of the observed SB/MVPA (i.e. high sensitivity). The larger variability of accelerometry counts allowed by longer epochs, together with the lower availability of observed SB/MVPA, will drive the choice of a SB cut-point to higher acceleration values, and the choice of a MVPA cut-point to lower acceleration values when applying the widely used ROC analysis. As a consequence, several observed light PA epochs will be misclassified into both SB and MVPA, resulting in the overestimation of SB and MVPA, underestimation of light PA, and the low positive predictive values observed in both the calibration and validation studies (chapters four and five). This further supports the use of the newly developed overall Axis1 cut-points in future studies, in order to get a more accurate assessment of 2-3 year old children’s levels and patterns of SB and PA. 8.1.5. Chapter Seven The aim of chapter seven was to test the practical feasibility of using the ActiGraph GT3X+ to measure the PA and SB of 2-3 year old South Asian and White British children and both parents, participating in the Born in Bradford birth cohort study. This was particularly focused on the potential differences between ethnicities in the rates of recruitment uptake and compliance with study protocols. Compared to White British families, less South Asian provided contacts for recruitment, a significantly lower proportion accepted and a higher proportion refused to take part in the study. A significantly higher proportion of White British children complied with the 8-day 227 Chapter Eight - Conclusions ______________________________________________________________________________________________________ monitoring protocol than South Asian, but there was no difference between ethnicities regarding the number of children who provided enough data to be included for further analyses (i.e. ≥3 days). In the parents, there were no differences between ethnicities regarding monitor wear, compliance with protocol, or providing enough data. There was no significant SES difference between the families who accepted and those who refused to participate in the study. Similarly, there was no significant SES difference between children who complied and those who did not comply with the 8-day monitoring protocol, nor between children who did and those who did not provide data to be included for further analyses. However, children who actually wore the accelerometer for at least one day had significantly higher SES than those who did not wear the accelerometer. The differences between South Asian and White British families were observed mainly in the recruitment phase. However, when enrolled in the study both ethnicities providing similar rates of toddlers and parents who wore the activity monitor and provided enough accelerometry data. In line with previous research (Rooney et al, 2011), this suggests that it may take more effort and culturally sensitive approaches to achieve similar recruitment rates to those of White British families but, once they chose to take part in the study, South Asian do not tend to have higher chances of drop-out or providing insufficient accelerometry data than White British participants. There was no evidence of reactivity of children to the activity monitor. As such, future studies measuring toddlers’ habitual SB/PA may not need to exclude the first day of wearing the activity monitor if it was classified as a valid day. The lack of differences in time spent in SB/PA between week and weekend days suggest that, contrary to older preschool children, there is no need to include weekend days in order to include a toddler in further analyses, if he/she has provided enough valid days according to the study’s protocol for inclusion. Based on the sample-specific definition of a valid day, a minimum of three valid days is required to reliably estimate toddlers’ SB or PA (ICC≥0.8). 228 Chapter Eight - Conclusions ______________________________________________________________________________________________________ 8.2. Future Research During the development of this thesis, several issues worthy of further investigation were identified. Considering the reaction of the South Asian mothers regarding the acceptability of the three activity monitors for the fathers, it was not clear if the latter would be willing to wear, or have issues with the devices. Further research directly assessing South Asian fathers’ acceptability of wearing activity monitors is needed. Reporting any practical issues arising during recruitment and data collection in future studies using accelerometers with young children would clarify whether the issues raised by mother in chapter three also arise in practical situations, in different settings and with different populations, and the impact they may have in both recruitment and compliance with study protocols. This thesis only assessed the acceptability and feasibility of the ActiGraph GT3X+, the Actiheart and the activPAL3, which were three of the most novel and recently available activity monitors in 2010. There is a wide variety of activity monitors available to assess activity behaviours, with some novel devices becoming commercially available during the past three years. There is a clear need for more research assessing the acceptability and feasibility of using the vast amount of alternative activity monitors with young children, individuals of varied ethnic backgrounds, and in settings beyond urban cities in industrialised countries (where different issues may arise). Regarding the calibration of the ActiGraph GT3X+, the mixed-effects linear regression approach used in chapter four provided cut-points that showed low accuracy and very wide limits of agreement between observed and predicted time spent in SB/PA. Nevertheless, it is still an adequate and promising statistical approach which deserves further exploration with triaxial accelerometry. Mixed-effects linear regression accounts for the repeated nature of the data from calibration studies, and allows for each axis of motion to contribute in different magnitudes to the predicted intensity of each epoch (i.e. individual coefficients), contrary to what happens when using the VM. Using other exponential values or functions, for which the resulting shape of the curve may better 229 Chapter Eight - Conclusions ______________________________________________________________________________________________________ describe the relationship between acceleration and PA intensity, may improve the prediction of SB and PA intensity and deserves exploration in future research. Also, using a truly continuous gold-standard would provide a more accurate and precise measure of SB and PA intensity (i.e. dependent variable), which would very likely improve the model fit and predicted time in SB/PA from a mixed-effects linear regression model. This theoretical assumption needs to be tested in future studies. Independently of epoch duration, using epochs to assess PA and SB implies an unavoidable dependency on clock time, which will never allow for an absolute and accurate detection of short bouts of SB or a given intensity of PA if these occur at the transition of one epoch to the next. There is a need for studies employing recently developed techniques that eliminate this time-dependency, such as artificial neural networks (Rothney et al, 2007), enabling short bouts of SB and PA to be accurately picked up independently of time of occurrence. Although the newly developed cut-points were calibrated in a sample that included White British and South Asian toddlers with weight status ranging from thin to obese, the range of weight status present in the validation sample was much narrower and only one of the 20 toddlers was of a non-White British ethnicity. Further studies with larger samples, including a wider weight status range, with different ethnicities and in different settings (e.g. rural areas, underdeveloped countries), are necessary to corroborate the validity and reliability of the newly established cut-points for the assessment of SB and PA in the wider population. If 5-second ActiGraph GT1M accelerometer data from 2-3 year old children is available from previous studies, it would be valuable to use the newly developed 5-second overall Axis1 cut-points to confirm previous results regarding the predictors of SB/PA, the relationships between SB/PA and health outcomes, or the rates of compliance with current SB/PA guidelines (among others). The study from chapter six presents novel results regarding the effect of using larger epochs in the resulting measure of SB, light PA and MVPA from the CARS. It is necessary to conduct similar studies with other more accurate and precise methods 230 Chapter Eight - Conclusions ______________________________________________________________________________________________________ used as gold-standard in calibration studies, to investigate whether the results of the current study using the CARS are also observed with other methods. Additionally, such research would provide precise enough data to estimate SB/PA at the second-bysecond level, and consequently provide an estimate of the magnitude of biases that will undoubtedly be present even for short epoch durations, such as the lowest 5-second epochs used in the present thesis. Some important aspects regarding the feasibility of measuring SB/PA in toddlers and their parents from different ethnicities also deserve further exploration. Firstly, the sample for the feasibility study carried out for this PhD research was drawn from a very specific population, which was already involved in a longitudinal research project and, thus, more likely to be available for further research. Although the current results provide valuable insights into the feasibility of recruiting and retaining South Asian participants in SB/PA studies, further research is needed to confirm whether the same findings are observed in the general population and in settings other than Bradford. Additionally, it would be interesting to assess the acceptability of other ethnic minorities for the assessment of PA with several monitors, to assess if comparable recruitment and compliance rates are observed, and whether different practical issues arise. Scarce information is available regarding the type and number of days needed to reliably assess toddlers’ habitual SB/PA. In the present study, three days were enough to provide reliable estimates of time spent in SB/PA, independently of including weekend days or not. However, this was calculated from a sample specific “valid day” definition and similar studies are needed in other settings and different populations (including other ethnic minorities), to check whether the same number and type of valid days are applicable to the wider population. 8.3. Implications The qualitative results from chapter three, together with the practical experience of using the ActiGraph GT3X+, the Actiheart and the activPAL3 with 2-3 year old children in chapters four and five, provide detailed information to aid researchers in making an informed decision regarding what accelerometer to use in future surveillance and 231 Chapter Eight - Conclusions ______________________________________________________________________________________________________ intervention studies with this young age group. This represents an important contribution to the literature, since there was a lack of information regarding the feasibility of using a variety of accelerometers in children younger than three years of age (Cliff, Reilly & Okely, 2009). In the feasibility study (chapter seven), the differences between South Asian and White British families were observed mainly in the recruitment phase, with both ethnicities providing similar rates of toddlers and parents who wore the activity monitor and provided enough accelerometry data. In line with previous research (Rooney et al, 2011), the results of chapter seven suggest that researchers targeting South Asian families should employ greater efforts and culturally sensitive approaches to recruit participants, which will facilitate the recruitment and retention of South Asian families and enable the attainment of more comparable final sample sizes to those seen in the White British population. The derived and validated overall Axis1 SB cut-point provides an accurate tool to objectively assess the SB and PA of 2-3 year old children, showing a substantial improvement in the prediction of time spent in these behaviours over the only other existing set of cut-points for toddlers (Trost et al, 2012). As such, the overall Axis1 SB cut point of ≤5 counts/epoch provides the best choice of cut-point for future surveillance and intervention studies involving toddlers. The use of these cut-points will enable the accurate assessment of SB and PA levels and patterns of 2-3 year old children, which is critical in order to understand 1) the determinants of both behaviours; 2) the doseresponse relationship between young children’s SB/PA and healthy growth and development, as well as NCDs and their risk factors; 3) the generation of SB and PA guidelines for early childhood that are based on empirical evidence; 4) the accurate surveillance and identification of population trends in SB and PA levels; and 5) to investigate the impact of interventions involving the reduction of SB and increase of PA in young children (LaPorte, Montoye & Caspersen, 1985; Kohl, Fulton & Caspersen, 2000; Sirard & Pate, 2001; Baranowski et al, 2004; Dollman et al, 2009; Reilly et al, 2009; Warren et al, 2010; Loprinzi & Cardinal, 2011; Atkin et al, 2012; LeBlanc et al, 2012; Timmons et al, 2012). 232 Chapter Eight - Conclusions ______________________________________________________________________________________________________ Such research will provide much needed evidence in this understudied population group (Reilly et al, 2009; Cardon, Van Cauwenberghe & De Bourdeaudhuij, 2011; LeBlanc et al, 2012; Timmons et al, 2012), which can inform public health policies to increase young children’s PA levels (Trost, Ward & Senso, 2010; Skouteris et al, 2012), and reduce time spent in SB (Birch, Parker & Burns, 2011) during a critical period of the growth process (Cameron & Demerath, 2002). This, in turn, may help to halt the rise of NCDs seen at increasingly younger ages (such as the worldwide obesity epidemic) (Reilly, 2008), prevent the establishment of ethnic disparities in health from early childhood (Bhopal, 2002; Misra et al, 2007), and presenting a great potential to narrow the worldwide socioeconomic and ethnic disparities in health observed in adulthood (Yusuf et al, 2001a and 2001b; WHO, 2011) 233 References ______________________________________________________________________________________________________ References Achten J, Jeukendrup AE. Heart Rate Monitoring: Applications and Limitations. Sports Med. 2003; 33(7):517-38. Adams MA, Ryan S, Kerr J, Sallis JF, Patrick K, Frank LD, Norman GJ. Validation of the Neighborhood Environment Walkability Scale (NEWS) Items Using Geographic Information Systems. J Phys Act Health. 2009; 6(supp 1):S113-23. Ahn S, Fedewa AL. A Meta-analysis of the Relationship Between Children’s Physical Activity and Mental Health. J Pediatr Psychol. 2011; 36(4):385-97. Ainsworth BE, Caspersen CJ, Matthews CE, Mâsse LC, Baranowski T, Zhu W. Recommendations to Improve the Accuracy of Estimates of Physical Activity Derived From Self Report. J Phys Act Health. 2012; 9(Suppl 1):S76-84. Ainsworth BE, Haskell WL, Herrmann SD, Meckes N, Bassett DRJ, Tudor-Locke C, Greer JL, Vezina J, Whitt-Glover MC, Leon AS. 2011 Compendium of Physical Activities: A Second Update of Codes and MET Values. Med Sci Sports Exerc. 2011; 43(8):157581. Akhtar-Danesh N, Dehghan M, Morrison KM, Fonseka S. Parents' perceptions and attitudes on childhood obesity: A Q-methodology study. J Am Acad Nurse Pract. 2011; 23(2):67-75. Altman DG, Bland JM. Measurement in medicine: the analysis of method comparison studies. Statistician. 1983; 32(3):307-17. Altman DG, Bland JM. Statistics Notes: Diagnostic tests 2: predictive values. BMJ. 1994; 309(6947):102. American Academy of Pediatrics. Children, Adolescents, and Television. Pediatrics. 2001; 107(2):423-6. 234 References ______________________________________________________________________________________________________ Anand SS, Yusuf S, Vuksan V, Devanesen S, Teo KK, Montague PA, Kelemen L, Yi C, Lonn E, Gerstein H, Hegele RA, McQueen M. Differences in risk factors, atherosclerosis, and cardiovascular disease between ethnic groups in Canada: the Study of Health Assessment and Risk in Ethnic groups (SHARE). Lancet. 2000; 356(9226):279-84. Andersen LB, Riddoch C, Kriemler S, Hills A. Physical activity and cardiovascular risk factors in children. Br J Sports Med. 2011; 45(11):871-6. Arredondo EM, Mendelson T, Holub C, Espinoza N, Marshall S. Cultural Adaptation of Physical Activity Self-Report Instruments. J Phys Act Health. 2012; 9(Suppl 1):S37--S43. Assadi F. The Growing Epidemic of Hypertension Among Children and Adolescents: A Challenging Road Ahead. Pediatr Cardiol. 2012; Online First. Atkin AJ, Gorely T, Clemes SA, Yates T, Edwardson C, Brage S, Salmon J, Marshall SJ, Biddle SJ. Methods of Measurement in epidemiology: Sedentary Behaviour. Int J Epidemiol. 2012; 41(5):1460-71. Australian Government. National Physical Activity Recommendations for Children 0-5 Years; 2010. Available From: http://www.health.gov.au/internet/main/publishing.nsf/ Content/phd-physical-activity-0-5-pdf-cnt.htm. Babakus W, Thompson J. Physical activity among South Asian women: a systematic, mixed-methods review. Int J Behav Nutr Phys Act. 2012; 9(1):150. Badimon L, Vilahur G. LDL-cholesterol versus HDL-cholesterol in the atherosclerotic plaque: inflammatory resolution versus thrombotic chaos. Ann N Y Acad Sci. 2012; 1254(1):18-32. Bailey RC, Olson J, Pepper SL, Porszasz J, Barstow TJ, Cooper DM. The level and tempo of children's physical activities: an observational study. Med Sci Sports Exerc. 1995; 27(7):1033-41. 235 References ______________________________________________________________________________________________________ Baranowski T, Klesges LM, Cullen KW, Himes JH. Measurement of outcomes, mediators, and moderators in behavioral obesity prevention research. Prev Med. 2004; 38(Suppl 1):S1-13. Barker DJ. The origins of the developmental origins theory. J Intern Med. 2007; 261(5):412-7. Barkley RA, Ullman DG. A comparison of objective measures of activity and distractibility in hyperactive and nonhyperactive children. J Abnorm Child Psychol. 1975; 3(3):231-44. Bassett DR Jr, Rowlands A, Trost SG. Calibration and validation of wearable monitors. Med Sci Sports Exerc. 2012; 44(1 Suppl 1):S32-8 Basset DR Jr, Strath SJ. The Pedometer. Physical Activity Assessments for HealthRelated Research. In: Welk G, Dale D, editors. Human Kinetics. IL: Champaign; 2002, p. 163-77. Beets MW, Bornstein D, Dowda M, Pate RR. Compliance With National Guidelines for Physical Activity in U.S. Preschoolers: Measurement and Interpretation. Pediatrics. 2011; 127(4):658-64. Benjamin SE, J Haines, SC Ball, DS Ward. Improving Nutrition and Physical Activity in Child Care: What Parents Recommend. J Am Diet Assoc. 2008; 108(11):1907-11. Bhatia V. IAP National Task Force for Childhood Prevention of Adult Diseases: insulin resistance and Type 2 diabetes mellitus in childhood. Indian Pediatr. 2004; 41(5):443-57. Bhopal R. What is the risk of coronary heart disease in South Asians? A review of UK research. J Public Health. 2000; 22(3):375-85. Bhopal R. Epidemic of cardiovascular disease in South Asians. BMJ. 2002; 324(7338):625-6. 236 References ______________________________________________________________________________________________________ Biddle SJH, Asare M. Physical activity and mental health in children and adolescents: a review of reviews. Br J Sports Med. 2011; 45:886. Biddle SJH, Pearson N, Ross GM, Braithwaite R. Tracking of sedentary behaviours of young people: A systematic review. Prev Med. 2010; 51(5):345-51. Birch LL, Parker L, Burns A, editors. Early Childhood Obesity Prevention Policies. Washington, DC: 2011. p. 1-140. Available from: http://www.nap.edu/openbook.php? record_id=13124&page=R1. Birch LL, Ventura AK. Preventing childhood obesity: what works? Int J Obes (Lond). 2009; 33(Suppl 1):S74-81. Boreham C, Riddoch C. The level and tempo of children's physical activities: an observational study. J Sports Sci. 2001; 19(12):915-29. Bornstein DB, Beets MW, Byun W, McIver KL. Accelerometer-derived physical activity levels of preschoolers: A meta-analysis. J Sci Med Sport. 2011; 14(6):504--511. Brage S, Brage N, Franks PW, Ekelund U, Wareham NJ. Reliability and validity of the combined heart rate and movement sensor Actiheart. Eur J Clin Nutr. 2005; 59(4):56170. Brown WJ, Heesch KC, Miller YD. Life events and changing physical activity patterns in women at different life stages. Ann Behav Med. 2009; 37(3):294-305. Brown WJ, Trost SG. Life transitions and changing physical activity patterns in young women. Am J Prev Med. 2003; 25(2):140-3. Brown WH, Pfeiffer KA, McIver KL, Dowda M, Almeida MJ, Pate RR. Assessing preschool children's physical activity: the Observational System for Recording Physical Activity in children-preschool version. Res Q Exerc Sport. 2006; 77(2):167-76. Bullen C. Impact of tobacco smoking and smoking cessation on cardiovascular risk and disease. Expert Rev Cardiovasc Ther. 2008; 6(6):883-95. 237 References ______________________________________________________________________________________________________ Burdette HL, Whitaker RC. Resurrecting Free Play in Young Children: Looking Beyond Fitness and Fatness to Attention, Affiliation, and Affect. Arch Pediatr Adolesc Med. 2005; 159(1):46-50. Burgi F, Meyer U, Granacher U, Schindler C, Marques-Vidal P, Kriemler S, Puder JJ. Relationship of physical activity with motor skills, aerobic fitness and body fat in preschool children: a cross-sectional and longitudinal study (Ballabeina). Int J Obes. 2011; 35(7):937-44. Butte NF, Ekelund U, Westerterp KR. Assessing physical activity using wearable monitors: measures of physical activity. Med Sci Sports Exerc. 2012; 44(Suppl 1):S5-12. Byun W, Dowda M, Pate RR. Correlates of Objectively Measured Sedentary Behavior in US Preschool Children. Pediatrics. 2011; 128(5):937-45. Byun W, Blair S, Pate R. Objectively measured sedentary behavior in preschool children: comparison between Montessori and traditional preschools. Int J Behav Nutr Phys Act. 2013; 10(1):2. Cain KL, Sallis JF, Conway TL, Van Dyck D, Calhoon L. Using Accelerometers in Youth Physical Activity Studies: A Review of Methods. J Phys Act Health. 2013; 10(3):437-50. Cameron N, Demerath EW. Critical periods in human growth and their relationship to diseases of aging. Am J Phys Anthropol. 2002; 119(Suppl 35):159-84. Canadian Society for Exercise Physiology. Canadian Physical Activity Guidelines for the Early Years 0-4; 2012a. Available From: www.csep.ca/guidelines. Canadian Society for Exercise Physiology. Canadian Sedentary Behaviour Guidelines for the Early Years 0-4; 2012b. Available From: www.csep.ca/guidelines. Cardon G, Van Cauwenberghe E, De Bourdeaudhuij I. What do we know about physical activity in infants and toddlers: A review of the literature and future research directions. Sci Sport. 2011; 26:127-30. 238 References ______________________________________________________________________________________________________ Cardon G, De Bourdeaudhuij I. A Pilot Study Comparing Pedometer Counts With Reported Physical Activity in Elementary Schoolchildren. Pediatr Exerc Sci. 2004; 16(4):355-67. Carpenter MW. Gestational Diabetes, Pregnancy Hypertension, and Late Vascular Disease. Diabetes Care. 2007; 30(Suppl 2):S246-50. Carson V, Janssen I. Volume, patterns, and types of sedentary behavior and cardiometabolic health in children and adolescents: a cross-sectional study. BMC Public Health. 2011; 11(1):274. Castelli DM, Valley JA. Chapter 3: The Relationship of Physical Fitness and Motor Competence to Physical Activity. J Teach Phys Educ. 2007; 26(4):358-74. Ceesay SM, Prentice AM, Day KC, Murgatroyd PR, Goldberg GR, Scott W, Spurr GB. The use of heart rate monitoring in the estimation of energy expenditure: a validation study using indirect whole-body calorimetry. Br J Nutr. 1989; 61(2):175-86. Certain LK, Kahn RS. Prevalence, Correlates, and Trajectory of Television Viewing Among Infants and Toddlers. Pediatrics. 2002; 109(4):634-42. Chaudhuri A. Pediatric ambulatory blood pressure monitoring: diagnosis of hypertension. Pediatr Nephrol. 2013; 28(7):995-9. Chen KW, Basset DRJ. The Technology of Accelerometry-Based Activity Monitors: Current and Future. Med Sci Sports Exerc. 2005; 37(Suppl 1):S490-500. Chinapaw MJM, Proper KI, Brug J, van Mechelen W, Singh AS. Relationship between young peoples' sedentary behaviour and biomedical health indicators: a systematic review of prospective studies. Obes Rev. 2011; 12(7):e621-32. Chow CK, McQuillan B, Raju PK, Iyengar S, Raju R, Harmer JA, Neal BC, Celermajer DS. Greater adverse effects of cholesterol and diabetes on carotid intima–media thickness in South Asian Indians: Comparison of risk factor-IMT associations in two population-based surveys. Atherosclerosis. 2008; 199(1):116-22. 239 References ______________________________________________________________________________________________________ Cleland V, Venn A. Encouraging Physical Activity and Discouraging Sedentary Behavior in Children and Adolescents - Editorial. J Adol Health. 2010; 47(3):221-2. Clemes SA, Deans NK. Presence and duration of reactivity to pedometers in adults. Med Sci Sports Exerc. 2012; 44(6):1097-101. Clemes S, Edwardson C, Connelly J, Konstantinidis T, Koivula R, Yates T, Gorely T, Biddle S. Validity of the ActiGraph GT3X + inclinometer and different counts per minute cut-points for the assessment of sedentary behaviour. J Sci Med Sport. 2012; 15(Suppl 1):S68. Clemes SA, Biddle SJ. The use of pedometers for monitoring physical activity in children and adolescents: measurement considerations. J Phys Act Health. 2013; 10(2):249-62. Cliff DP, Reilly JJ, Okely AD. Methodological considerations in using accelerometers to assess habitual physical activity in children aged 0–5 years. J Sci Med Sport. 2009; 12(5):557-67. Cohen J. A Coefficient of Agreement for Nominal Scales. Educ Psychol Meas. 1960; 20(1):37-46. Cole TJ, Bellizzi MC, Flegal KM, Dietz WH. Establishing a standard definition for child overweight and obesity worldwide: international survey. BMJ. 2000; 320(7244):1240-3. Colley R, Garriguet D, Adamo K, Carson V, Janssen I, Timmons B, Tremblay M. Physical activity and sedentary behavior during the early years in Canada: a crosssectional study. Int J Behav Nutr Phys Act. 2013; 10(1):54. Copeland KA, Sherman SN, Kendeigh CA, Kalkwarf HJ, Saelens BE. Societal Values and Policies May Curtail Preschool Children’s Physical Activity in Child Care Centers. Pediatrics. 2012; 129(2):265-74. 240 References ______________________________________________________________________________________________________ Corder K, Brage S, Wareham NJ, Ekelund U. Comparison of PAEE from combined and separate heart rate and movement models in children. Med Sci Sports Exerc. 2005; 37(10):1761-7. Corrao G, Bagnardi V, Zambon A, La Vecchia C. A meta-analysis of alcohol consumption and the risk of 15 diseases. Prev Med. 2004; 38(5):613-9. Costa S, Barber SE, Griffiths PL, Cameron N, Clemes SA. Qualitative feasibility of using three accelerometers with 2-3 year old children and both parents. Res Quart Exerc Sport. In Press. Crouter SE, Schneider PL, Bassett DRJ. Spring-Levered versus Piezo-Electric Pedometer Accuracy in Overweight and Obese Adults. Med Sci Sports Exerc. 2005; 37(10):1673-9. Davies G, Reilly JJ, Paton JY. Objective measurement of posture and posture transitions in the pre-school child. Physiol Meas. 2012; 33(11):1913-21. Davies G, Reilly JJ, McGowan AJ, Dall PM, Granat MH, Paton JY. Validity, Practical Utility, and Reliability of the activPALTM in Preschool Children. Med Sci Sports Exerc. 2012; 44(4):761-8. Davis CL, Tomporowski PD, McDowell JE, Austin BP, Miller PH, Yanasak NE, Allison JD, Naglieri JA. Exercise improves executive function and achievement and alters brain activation in overweight children: a randomized, controlled trial. Health Psychol. 2011; 30(1):91-8. Department for Communities and Local Government. The English Indices of Deprivation 2010. London: 2011. Available From: Crown Copyright. Department of Health. Start Active, Stay Active: A Report on Physical Activity from the Four Home Countries’ Chief Medical Officers. London: 2011. Available From: https://www.gov.uk/government/publications/start-active-stay-active-a-report-onphysical-activity-from-the-four-home-countries-chief-medical-officers. 241 References ______________________________________________________________________________________________________ Department of Health. A Report of the Chief Medical Officer: At Least Five a Week: Evidence on the Impact of Physical Activity and its Relationship to Health. London: 2004. Available From: http://webarchive.nationalarchives.gov.uk/+/dh.gov.uk/en/publications andstatistics/publications/publicationspolicyandguidance/dh_4080994. Ding D, Gebel K. Built environment, physical activity, and obesity: what have we learned from reviewing the literature? Health Place. 2012; 18(1):100--105. Dollman J, Okely AD, Hardy L, Timperio A, Salmon J, Hills AP. A hitchhiker's guide to assessing young people's physical activity: Deciding what method to use. J Sci Med Sport. 2009; 12(5):518-25. Douglas A, Bhopal RS, Bhopal R, Forbes JF, Gill JM, Lawton J, McKnight J, Murray G, Sattar N, Sharma A, Tuomilehto J, Wallia S, Wild SH, Sheikh A. Recruiting South Asians to a lifestyle intervention trial: experiences and lessons from PODOSouth Asian (Prevention of Diabetes & Obesity in South Asians). Trials. 2011; 12:220. Dowda M, Brown WH, McIver KL, Pfeiffer KA, O'Neill JR, Addy CL, Pate RR. Policies and Characteristics of the Preschool Environment and Physical Activity of Young Children. Pediatrics. 2009; 123(2):e261-6. Durant RH, Baranowski T, Davis H, Thompson WO, Puhl J, Greaves KA, Rhodes T. Reliability and variability of heart rate monitoring in 3-, 4-, or 5-yr-old children. Med Sci Sports Exerc. 1992; 24(2):265-71. Durant RH, Baranowski T, Davis H, Thompson WO, Puhl J, Greaves KA, Rhodes T. Reliability and variability of indicators of heart-rate monitoring in children. Med Sci Sports Exerc. 1993; 25(3):389-95. Dwyer GM, Baur LA, Hardy LL. The challenge of understanding and assessing physical activity in preschool-age children: Thinking beyond the framework of intensity, duration and frequency of activity. Journal of Science and Medicine in Sport. 2009; 12(5):534-6. Edwards JR, Prozialeck WC. Cadmium, Diabetes and Chronic Kidney Disease. Toxicol Appl Pharmacol. 2009; 238(3):289-93. 242 References ______________________________________________________________________________________________________ Edwardson CL, Gorely T. Activity-Related Parenting Practices and Children's Objectively Measured Physical Activity. Pediatr Exerc Sci. 2010; 22(1):105-13. Ekelund U, Luan J, Sherar LB, Esliger DW, Griew P, Cooper A. Moderate to Vigorous Physical Activity and Sedentary Time and Cardiometabolic Risk Factors in Children and Adolescents. JAMA. 2012; 307(7):704-12. Esliger DW, Tremblay MS. Physical activity and inactivity profiling: the next generation. Appl Physiol Nutr Metab. 2007; 32(S2E):S195-207. Eston RG, Rowlands AV, Ingledew DK. Validity of heart rate, pedometry, and accelerometry for predicting the energy cost of children’s activities. J Appl Physiol. 1998; 84(1):362-71. Evenson KR, Catellier DJ, Gilla K, Ondrak KS, McMurray RG. Calibration of two objective measures of physical activity for children. J Sports Sci. 2008; 26(14):1557-65. Fairweather SC, Reilly JJ, Grant S, Whittaker A, Paton JY. Using the Computer Science and Applications (CSA) activity monitor in preschool children. Pediatr Exerc Sci. 1999; 11(4):413-20. Falkner B, DeLoach S. Refining the Blood Pressure Phenotype in Children. Hypertension. 2009; 53(6):905-6. Fang J, Zhang JP, Luo CX, Yu XM, Lv LQ. Carotid Intima-media thickness in childhood and adolescent obesity relations to abdominal obesity, high triglyceride level and insulin resistance. Int J Med Sci. 2010; 7(5):278-83. Feng J, Glass TA, Curriero FC, Stewart WF, Schwartz BS. The built environment and obesity: A systematic review of the epidemiologic evidence. Health Place. 2010; 16(2):175-90. Finn K, Johannsen N, Specker B. Factors associated with physical activity in preschool children. J Pediatr. 2002; 140(1):81-5. 243 References ______________________________________________________________________________________________________ Finn KJ, Specker B. Comparison of Actiwatch(R) activity monitor and Children's Activity Rating Scale in children. Med Sci Sports Exerc. 2000; 32(10):1794-7. Fisher A, Reilly JJ, Montgomery C, Kelly LA, Williamson A, Jackson DM, Paton JY, Grant S. Seasonality in Physical Activity and Sedentary Behavior in Young Children. Pediatr Exerc Sci. 2005; 17(1):31-40. Ford ES, Caspersen CJ. Sedentary behaviour and cardiovascular disease: a review of prospective studies. Int J Epidemiol. 2012; 41(5):1338-53. Foresight. Tackling Obesities: Future choices – project Report. London; 2007. Available From: http://www.bis.gov.uk/assets/foresight/docs/obesity/17.pdf. Forouhi NG, Sattar N, Tillin T, McKeigue PM, Chaturvedi N. Do known risk factors explain the higher coronary heart disease mortality in South Asian compared with European men? Prospective follow-up of the Southall and Brent studies, UK. Diabetologia. 2006; 49(11):2580-8. Francis SL, Stancel MJ, Sernulka-George FD, Broffitt B, Levy SM, Janz KF. Tracking of TV and video gaming during childhood: Iowa Bone Development Study. Int J Behav Nutr Phys Act. 2011; 8:113. Frankenfield DC. On heat, respiration, and calorimetry. Nutrition. 2010; 26(10):939-50. Freedman DS, Patel DA, Srinivasan SR, Chen W, Tang R, Bond MG, Berenson GS. The contribution of childhood obesity to adult carotid intima-media thickness: the Bogalusa Heart Study. Int J Obes. 2008; 32(5):749-56. Freedson PS. Electronic motion sensors and heart rate as measures of physical activity in children. J Sch Health. 1991; 61(5):220-3. Freedson P, Pober D, Janz K. Calibration of Accelerometer Output for Children. Med Sci Sport Exerc. 2005; 37(Suppl 11):S523-30. 244 References ______________________________________________________________________________________________________ Fulton JE, Burgeson CR, Perry GR, Sherry B, Galuska DA, Alexander MP, Wechsler H, Caspersen CJ. Assessment of physical activity and sedentary behavior in preschoolage children: priorities for research. Pediatr Exerc Sci. 2001; 13(2):113-26. Gebel K, Bauman AE, Sugiyama T, Owen N. Mismatch between perceived and objectively assessed neighborhood walkability attributes: Prospective relationships with walking and weight gain. Health Place. 2011; 17(2):519-24. Gerstein HC. Glucose: a Continuous Risk Factor for Cardiovascular Disease. Diabet Med. 1997; 14(Suppl 3):S25-31. Gill JMR, Bhopal R, Douglas A, Wallia S, Bhopal R, Sheikh A, Forbes JF, McKnight J, Sattar N, Murray G, Lean MEJ, Wild SH. Sitting Time and Waist Circumference Are Associated With Glycemia in U.K. South Asians. Diabetes Care. 2011; 34(5):1214-8. Global Advocacy for Physical Activity. NCD Prevention: Investments that Work for Physical Activity; February 2011. Available From: www.globalpa.org.uk/investmentsthat work. Gluckman PD, Hanson MA. The developmental origins of the metabolic syndrome. Trends in Endocrinology & Metabolism. 2004; 15(4):183-7. Goggin JE. Sex Differences in the Activity Level of Preschool Children as a Possible Precursor of Hyperactivity. J Genet Psychol. 1975; 127(1):75-81. Goldfield GS, Harvey A, Grattan K, Adamo KB. Physical Activity Promotion in the Preschool Years: A Critical Period to Intervene. Int J Environ Res Public Health. 2012; 9(4):1326-42. Goodman R, Ford T, Simmons H, Gatward R, Meltzer H. Using the Strengths and Difficulties Questionnaire (SDQ) to screen for child psychiatric disorders in a community sample. Br J Psychiatry. 2000; 177(6):534-9. Goran MI. Application of the Doubiy Labeied Water Technique for Studying Total Energy Expenditure in Young Chiidren: A Review. Pediatr Exerc Sci. 1994; 6(1):11-30. 245 References ______________________________________________________________________________________________________ Gould AL, Davies GM, Alemao E, Yin DD, Cook JR. Cholesterol reduction yields clinical benefits: meta-analysis including recent trials. Clin Ther. 2007; 29(5):778-94. Griffiths LJ, Hawkins SS, Cole TJ, Dezateux C. Risk factors for rapid weight gain in preschool children: findings from a UK-wide prospective study. Int J Obes. 2010; 34(4):624-32. Gu Q, Burt VL, Paulose-Ram R, Yoon S, Gillum RF. High Blood Pressure and Cardiovascular Disease Mortality Risk Among U.S. Adults: The Third National Health and Nutrition Examination Survey Mortality Follow-up Study. Ann Epidemiol. 2008; 18(4):302-9. Gubbels JS, Van Kann DH, Jansen MW. Play equipment, physical activity opportunities, and children's activity levels at childcare. J Environ Public Health. 2012:326520. Gubbels JS, Kremers SPJ, Stafleu A, Dagnelie PC, de Vries SI, de Vries NK, Thijs C. Clustering of Dietary Intake and Sedentary Behavior in 2-Year-Old Children. J Pediatr. 2009; 155(2):194-8. Gubbels JS, van Assema P, Kremers SPJ. Physical Activity, Sedentary Behavior, and Dietary Patterns among Children. Curr Nutr Rep. 2013; 2(2):105-12. Guh DP, Zhang W, Bansback N, Amarsi Z, Birmingham CL, Anis AH. The incidence of co-morbidities related to obesity and overweight: A systematic review and meta-analysis. BMC Public Health. 2009; 9:88. Gupta R, Misra A, Pais P, Rastogi P, Gupta VP. Correlation of regional cardiovascular disease mortality in India with lifestyle and nutritional factors. Int J Cardiol. 2006; 108(3):291-300. Gustafson SL, Rhodes RE. Parental Correlates of Physical Activity in Children and Early Adolescents. Sports Med. 2006; 36(1):79-97. Hale DE. Type 2 diabetes and diabetes riskfactors in children and adolescents. Clin Cornerstone. 2004; 6(2):17-27. 246 References ______________________________________________________________________________________________________ Hallal PC, Matsudo S, Farias Jr. JC. Measurement of Physical Activity by Self-Report in Low- and Middle-Income Countries: More of the Same Is not Enough. J Phys Activ Health. 2012; 9(Suppl 1):S88-90. Hancox RJ, Milne BJ, Poulton R. Association between child and adolescent television viewing and adult health: a longitudinal birth cohort study. Lancet. 2004; 364(9430):25762. Hanson MA, Gluckman PD. Developmental Origins of Health and Disease: New Insights. Basic Clin Pharmacol Toxicol. 2008; 102(2):90-3. Hanson M, Godfrey KM, Lillycrop KA, Burdge GC, Gluckman PD. Developmental plasticity and developmental origins of non-communicable disease: Theoretical considerations and epigenetic mechanisms. Prog Biophys Mol Biol. 2011; 106(1):27280. Hardy LL, Hills AP, Timperio A, Cliff D, Lubans D, Morgan PJ, Taylor BJ, Brown H. A hitchhiker's guide to assessing sedentary behaviour among young people: Deciding what method to use. J Sci Med Sport. 2013; 16(1):28-35. Haskell WL, Lee I, Pate RR, Powell KE, Blair SN, Franklin BA, Macera CA, Heath GW, Thompson PD, Bauman A. Physical Activity and Public Health: Updated Recommendation for Adults from the American College of Sports Medicine and the American Heart Association. Med Sci Sports Exerc. 2007; 39(8):1423-34. Haugen HA, Chan L, Li F. Indirect Calorimetry: A Practical Guide for Clinicians. Nutr Clin Pract. 2007; 22(4):377-88. He J, Whelton PK. Elevated systolic blood pressure and risk of cardiovascular and renal disease: Overview of evidence from observational epidemiologic studies and randomized controlled trials. Am Heart J. 1999; 138(Suppl 3):S211-9. Health and Social Care Information Centre, Lifestyles Statistics. Statistics on Obesity, Physical Activity and Diet: England, 2013 . London; 2013. Available From: http://www.hscic.gov.uk/catalogue/PUB10364. 247 References ______________________________________________________________________________________________________ Healy GN, Dunstan DW, Salmon J, Cerin E, Shaw JE, Zimmet PZ, Owen N. Breaks in Sedentary Time - Beneficial associations with metabolic risk. Diabetes Care. 2008; 31(4):661-6. Healy GN, Wijndaele K, Dunstan DW, Shaw JE, Salmon J, Zimmet PZ, Owen N. Objectively Measured Sedentary Time, Physical Activity, and Metabolic Risk: The Australian Diabetes, Obesity and Lifestyle Study (AusDiab). Diabetes Care. 2008; 31(2):369-71. Henry C. Basal metabolic rate studies in humans: measurement and development of new equations. Public Health Nutr. 2005; 8(7A):1133-52. Hillman CH, Kamijo K, Scudder M. A review of chronic and acute physical activity participation on neuroelectric measures of brain health and cognition during childhood. Prev Med. 2011; 52(Suppl 1):S21-8. Hills AP, King NA, Armstrong TP. The Contribution of Physical Activity and Sedentary Behaviours to the Growth and Development of Children and Adolescents: Implications for Overweight and Obesity. Sports Med. 2007; 37(6):533-46. Hinkley T, O'Connell E, Okely AD, Crawford D, Hesketh K, Salmon J. Assessing Volume of Accelerometry Data for Reliability in Preschool Children. Med Sci Sports Exerc. 2012a; 44(12):2436-41. Hinkley T, Salmon J, Okely AD, Crawford D, Hesketh K. Influences on preschool children's physical activity: exploration through focus groups. Fam Community Health. 2011; 34(1):39-50. Hinkley T, Crawford D, Salmon J, Okely AD, Hesketh K. Preschool Children and Physical Activity: A Review of Correlates. Am J Prev Med. 2008; 34(5):435-41. Hinkley T, Salmon J, Okely AD, Hesketh K, Crawford D. Correlates of Preschool Children's Physical Activity. Am J Prev Med. 2012b; 43(2):159-67. 248 References ______________________________________________________________________________________________________ Hinkley T, Salmon J, Okely AD, Trost SG. Correlates of sedentary behaviours in preschool children: a review. Int J Behav Nutr Phys Act. 2010; 7:66. Hislop JF, Bulley C, Mercer TH, Reilly JJ. Comparison of Epoch and Uniaxial Versus Triaxial Accelerometers in the Measurement of Physical Activity in Preschool Children: A Validation Study. Ped Exerc Sci. 2012; 24(3):450-60. Hnatiuk J, Ridgers ND, Salmon J, Campbell K, McCallum Z, Hesketh K. Physical Activity Levels and Patterns of 19-Month-Old Children. Med Sci Sports Exerc. 2012; 44(9):1715-20. Holter NJ. New method for heart studies. Science. 1961; 134(3486):1214-20. Hussain-Gambles M, Atkin K, Leese B. South Asian participation in clinical trials: The views of lay people and health professionals. Health Policy. 2006; 77(2):149-65. Inoue M, Tsuji I, Wakai K, Nagata C, Mizoue T, Tanaka K, Tsugane S, Research Group for the Development and Evaluation of Cancer Prevention Strategies in Japan. Evaluation Based on Systematic Review of Epidemiological Evidence Among Japanese Populations: Tobacco Smoking and Total Cancer Risk. Jpn J Clin Oncol. 2005; 35(7):404-11. Jago R, Baranowski T, Baranowski JC, Thompson D, Greaves KA. BMI from 3–6 years of age is predicted by TV viewing and physical activity, not diet. Int J Obes. 2005; 29:557-64. Janssen I, LeBlanc A. Systematic review of the health benefits of physical activity and fitness in school-aged children and youth. Int J Behav Nutr Phys Act. 2010; 7(1):40. Janz KF, Letuchy EM, Eichenberger Gilmore JM, Burns TL, Torner JC, Willing MC, Levy SM. Early physical activity provides sustained bone health benefits later in childhood. Med Sci Sports Exerc. 2010; 42(6):(6):1072-8. Johnson CF. Hyperactivity and the Machine: The Actometer. Child Dev. 1971; 42(6):2105-10. 249 References ______________________________________________________________________________________________________ Jolin EM, Weller RA. Television Viewing and Its Impact on Childhood Behaviors. Curr Psychiatry Rep. 2011; 13(2):122-8. Jones RA, Okely AD. Physical Activity Recommendations for Early Childhood. In: Tremblay RE, Barr RG, Peters RDV, Boivin M, editors. Encyclopedia on Early Childhood Development. Montreal, Quebec: Centre of Excellence for Early Childhood Development; 2011, p.1-9. Available From: http://www.child-encyclopedia.com/ documents/Jones-OkelyANGxp1.pdf Jones PJH, Winthrop AL, Schoeller DA, Swyer PR, Smith J, Filler RM, Heim T. Validation of Doubly Labeled Water for Assessing Energy Expenditure in Infants. Pediatr Res. 1987; 21(3):242-6. Katzmarzyk PT, Pérusse L, Malina RM, Bergeron J, Després J, Bouchard C. Stability of indicators of the metabolic syndrome from childhood and adolescence to young adulthood: the Québec Family Study. J Clin Epidemiol. 2001; 54(2):190-5. Katzmarzyk PT. Physical Activity, Sedentary Behavior, and Health: Paradigm Paralysis or Paradigm Shift? Diabetes. 2010; 59(11):2717-25. Keen M. Early Development and Attainment of Normal Mature Gait. J Prosthet Orthot. 1993; 5(2):35-8. Kelly LA, Reilly JJ, Fairweather SC, Barrie S, Grant S, Paton JY. Comparison of two Accelerometers for Assessment of Physical Activity in Preschool Children. Pediatr Exerc Sci. 2004; 16(4):324-33. Kelly LA, Reilly JJ, Fisher a, Montgomery C, Williamson a, McColl JH, Paton JY, Grant S. Effect of socioeconomic status on objectively measured physical activity. Arch Dis Child. 2006; 91:35-38. Kelly LA, Reilly JJ, Jackson DM, Montgomery C, Grant S, Paton JY. Tracking Physical Activity and Sedentary Behavior in Young Children. Pediatr Exerc Sci. 2007; 19(1):5160. 250 References ______________________________________________________________________________________________________ Kesaniemi YK, Danforth EJ, Jensen MD, Kopelman PG, Lefèbvre P, Reeder BA. Doseresponse issues concerning physical activity and health: an evidence-based symposium. Med Sci Sports Exerc. 2001; 33(Suppl 6):S351-58. Khunti K, Samani NJ. Coronary heart disease in people of south-Asian origin. Lancet. 2004; 364(9451):2077-8. Kim Y, Beets MW, Pate RR, Blair SN. The effect of reintegrating Actigraph accelerometer counts in preschool children: Comparison using different epoch lengths. J Sci Med Sport. 2012; 16(2):129-34. Kohl HW, Fulton JE, Caspersen CJ. Assessment of Physical Activity among Children and Adolescents: A Review and Synthesis. Prev Med. 2000; 31(Suppl 2):S54-76. Kwon S, Janz K. Tracking of accelerometry-measured physical activity during childhood: ICAD pooled analysis. Int J Behav Nutr Phys Act. 2012; 9(1):68. Lanningham-Foster L, Jensen TB, McCrady SK, Nysse LJ, Foster RC, Levine JA. Laboratory measurement of posture allocation and physical activity in children. Med Sci Sports Exerc. 2005; 37(10):1800-05. LaPorte RE, Kuller LH, Kupfer DJ, McPartland RJ, Matthews G, Caspersen C. An objective measure of physical activity for epldemlologic research. Am J Epidemiol. 1979; 109(2):158-68. LaPorte RE, Montoye HJ, Caspersen CJ. Assessment of physical activity in epidemiologic research: problems and prospects. Public Health Rep. 1985; 100(2):13146. Laukkanen RMT, Virtanen PK. Heart rate monitors: State of the art. J Sports Sci. 1998; 16(Suppl 1):S3-7. Le J, Zhang D, Menees S, Chen J, Raghuveer G. "Vascular Age" Is Advanced in Children With Atherosclerosis-Promoting Risk Factors. Circ Cardiovasc Imaging. 2010; 3(1):8-14. 251 References ______________________________________________________________________________________________________ Leal C, Chaix B. The influence of geographic life environments on cardiometabolic risk factors: a systematic review, a methodological assessment and a research agenda. Obes Rev. 2011; 12(3):217-30. Lear SA, Chockalingam A, Kohli S, Richardson CG, Humphries KH. Elevation in Cardiovascular Disease Risk in South Asians Is Mediated by Differences in Visceral Adipose Tissue. Obesity (Silver Spring). 2012; 20(6):1293-300. LeBlanc AG, Spence JC, Carson V, Gorber SC, Dillman C, Janssen I, Kho ME, Stearns JA, Timmons BW, Tremblay MS. Systematic review of sedentary behaviour and health indicators in the early years (aged 0–4 years). Appl Physiol Nutr Metab. 2012; 37(4):753-72. Levine JA. Measurement of energy expenditure. Public Health Nutr. 2005; 8(7A):112332. Levitan EB, Song Y, Ford ES, Liu S. Is Nondiabetic Hyperglycemia a Risk Factor for Cardiovascular Disease?: A Meta-analysis of Prospective Studies. Arch Intern Med. 2004; 164(19):2147-55. Liese AD, Ma X, Maahs DM, Trilk JL. Physical activity, sedentary behaviors, physical fitness, and their relation to health outcomes in youth with type 1 and type 2 diabetes: A review of the epidemiologic literature. J Sport Health Sci. 2013; 2(1):21-38. Lin LI. A Concordance Correlation Coefficient to Evaluate Reproducibility. Biometrics. 1989; 45(1):255-68. Lin LI. Corrections. Biometrics. 2000; 56(1):324-5. Lobstein T, Baur L, Uauy R. Obesity in children and young people: a crisis in public health. Obes Rev. 2004; 5(Suppl 1):S4-85. Loo C, Wenar C. Activity level and motor inhibition: their relationship to intelligence-test performance in normal children. Child Dev. 1971; 42(3):967-71. 252 References ______________________________________________________________________________________________________ Loprinzi PD, Lee H, Cardinal BJ, Crespo CJ, Andersen RE, Smit E. The relationship of actigraph accelerometer cut-points for estimating physical activity with selected health outcomes: results from NHANES 2003-06. Res Q Exerc Sport. 2012; 83(3):422-30. Loprinzi PD, Cardinal BJ. Measuring Children's Physical Activity and Sedentary Behaviors. J Exerc Sci Fit. 2011; 9(1):15-23. Loprinzi PD, Trost SG. Parental influences on physical activity behavior in preschool children. Prev Med. 2010; 50(3):129-33. Lubans DR, Hesketh K, Cliff DP, Barnett LM, Salmon J, Dollman J, Morgan PJ, Hills AP, Hardy LL. A systematic review of the validity and reliability of sedentary behaviour measures used with children and adolescents. Obes Rev. 2011; 12(10):781-99. Maccoby EE, Dowley EM, Hagen JW, Degerman R. Activity level and intellectual functioning in normal preschool children. Child Dev. 1965; 36(3):761-70. Mackay LM, Schofield GM, Oliver M. Measuring Physical Activity and Sedentary Behaviors in Women with Young Children: A Systematic Review. Women Health. 2011; 51(4):400-21. Malina RM. Adherence to Physical Activity From Childhood to Adulthood: A Perspective From Tracking Studies. Quest. 2001; 53(3):346-98. Matarese LE. Indirect Calorimetry: Technical Aspects. J Am Diet Assoc. 1997; 97(Suppl 10):S154-60. Matheson GO, Klügl M, Dvorak J, Engebretsen L, Meeuwisse WH, Schwellnus M, Blair SN, van Mechelen W, Derman W, Börjesson M, Bendiksen F, Weiler R. Responsibility of sport and exercise medicine in preventing and managing chronic disease: applying our knowledge and skill is overdue. Br J Sports Med. 2011; 45(16):1272-82. Matthews CE, Freedson PS. Field trial of a three-dimensional activity monitor: comparison with self report. Med Sci Sports Exerc. 1995; 27(7):1071-1078. 253 References ______________________________________________________________________________________________________ McBride GB. A Proposal for Strength-of-Agreement Criteria for Lin's Concordance Correlation Coefficient. HAM2005-062; Hamilton, New Zealand: 2005. McClain JJ, Abraham TL, Brusseau TAJ, Tudor-Locke C. Epoch length and accelerometer outputs in children: comparison to direct observation. Med Sci Sports Exerc. 2008; 40(12):2080-2087. McClain JJ, Tudor-Locke C. Objective monitoring of physical activity in children: considerations for instrument selection. J Sci Med Sport. 2009; 12(5):526-33. McKee DP, Murtagh EM, Boreham CAG, Nevill AM, Murphy MH. Seasonal And Annual Variation in Young Children's Physical Activity. Med Sci Sports Exerc. 2012; 44(7):131824. McKeigue PM, Shah B, Marmot MG. Relation of central obesity and insulin resistance with high diabetes prevalence and cardiovascular risk in South Asians. Lancet. 1991; 337(8738):382-6. McLeroy KR, Bibeau D, Steckler A, Glanz K. An ecological perspective on health promotion programs. Health Educ Q. 1988; 15(4):351-77. McPartland RJ, Gordon Foster F, Kupfer DJ, Weiss BL. Activity Sensors for Use in Psychiatric Evaluation. IEEE Trans Biomed Eng. 1976; 23(2):175--178. McPartland RJ, Kupfer DJ, Gordon Foster F. An objective measure of physical activity for epldemlologic research. Behav Res Meth Ins. 1976; 8(4):357-60. McWilliams C, Ball SC, Benjamin SE, Hales D, Vaughn A, Ward DS. Best-Practice Guidelines for Physical Activity at Child Care. Pediatrics. 2009; 124(6):1650-9. Metz CE. Basic principles of ROC analysis. Semin Nucl Med. 1978; 8(4):283-98. Mielke RT, Kaiser D, Centuolo R. Interconception Care for Women With Prior Gestational Diabetes Mellitus. J Midwifery Womens Health. 2013; In Press. 254 References ______________________________________________________________________________________________________ Misra A, Khurana L, Vikram NK, Goel A, Wasir JS. Metabolic syndrome in children: current issues and South Asian perspective. Nutrition. 2007; 23(11-12):895-910. Mistry KB, Minkovitz CS, Strobino DM, Borzekowski DLG. Children's Television Exposure and Behavioral and Social Outcomes at 5.5 Years: Does Timing of Exposure Matter? Pediatrics. 2007; 120(4):762-9. Moore LL, Gao D, Bradlee ML, Cupples LA, Sundarajan-Ramamurti A, Proctor MH, Hood MY, Singer MR, Ellison RC. Does early physical activity predict body fat change throughout childhood? Prev Med. 2003; 37(1):10-7. Moore LL, DA Lombardi, MJ White, JL Campbell, South Asian Oliveria, RC Ellison. Influence of parents' physical activity levels on activity levels of young children. J Pediatr. 1991; 118(2):215-9. Morrison JA, Glueck CJ, Woo J, Wang P. Risk factors for cardiovascular disease and type 2 diabetes retained from childhood to adulthood predict adult outcomes: the Princeton LRC Follow-up Study. Int J Pediatr Endocrinol. 2012; 2012:6. Mushtaq MU, Gull S, Mushtaq K, Shahid U, Shad MA, Akram J. Dietary behaviors, physical activity and sedentary lifestyle associated with overweight and obesity, and their socio-demographic correlates, among Pakistani primary school children. Int J Behav Nutr Phys Act. 2011; 8:130. Nader PR, Huang TT, Gahagan S, Kumanyika SK, Hammond RA, Christoffel KK. Next steps in obesity prevention: altering early life systems to support healthy parents, infants, and toddlers. Child Obes. 2012; 8(3):195-204. Napoli C, Glass CK, Witztum JL, Deutsch R, D'Armiento FP, Palinski W. Influence of maternal hypercholesterolaemia during pregnancy on progression of early atherosclerotic lesions in childhood: Fate of Early Lesions in Children (FELIC) study. Lancet. 1999; 354(9186):1234-41. National Association for Sport and Physical Education. Active Start: A Statement of Physical Activity Guidelines for Children Birth to Age 5, 2nd Edition. Reston, VA; 2009. 255 References ______________________________________________________________________________________________________ Available From: http://www.aahperd.org/naspe/standards/nationalGuidelines/ActiveStart. cfm. National Institute for Health and Clinical Excellence. Promoting Physical Activity, Active Play and Sport for Pre-School and School-Age Children and Young People in Family, Pre-School, School and Community Settings. London: PH17; 2009. Available From: http://www.nice.org.uk/ph17. Navas-Acien A, Silbergeld EK, Pastor-Barriuso R, Guallar E. Arsenic exposure and prevalence of type 2 diabetes in US adults. JAMA. 2008; 300(7):814--822. Nichols JF, Morgan CG, Sarkin JA, Sallis JF, Calfas KJ. Validity, reliability, and calibration of the Tritrac accelerometer as a measure of physical activity. Med Sci Sports Exerc. 1999; 31(6):908-12. Nightingale CM, Krishnaveni GV, Rudnicka AR, Owen CG, Veena SR, Hill JC, Cook DG, Fall CHD, Whincup PH. Cardiometabolic Risk Markers in Indian Children: Comparison with UK Indian and White European Children. PLoS One. 2012; 7(4):e36236. Nocon M, Hiemann T, Müller-Riemenschneider F, Thalau F, Roll S, Willich SN. Association of physical activity with all-cause and cardiovascular mortality: a systematic review and meta-analysis. Eur J Cardiovasc Prev Rehabil. 2008; 15(3):239-46. Nyberg GA, Nordenfelt A, Ekelund U, Marcus C. Physical Activity Patterns Measured by Accelerometry in 6- to 10-yr-Old Children Med Sci Sports Exerc. 2009; 41(10):1842-8. O’Dwyer MV, Foweather L, Stratton G, Ridgers ND. Physical activity in non-overweight and overweight UK preschool children: Preliminary findings and methods of the Active Play Project. Sci Sport. 2011; 26(6):345-9. Office for National Statistics. Ethnicity and National Identity in England and Wales 2011. [Internet] 2012. Available from: http://www.ons.gov.uk/ons/dcp171776_290558.pdf. Office for National Statistics. Resident Population Estimates by Ethnic Group (Percentages); 2011. Available From: http://www.neighbourhood.statistics.gov.uk/ 256 References ______________________________________________________________________________________________________ dissemination/LeadTableView.do?a=3&b=276807&c=Bradford&d=13&e=13&f=27655& g=379237&i=1001x1003x1004x1005&l=1812&o=322&m=0&r=1&s=1328661739203& enc=1. Okely AD, Jones RA. Sedentary Behaviour Recommendations for Early Childhood. In: Tremblay RE, Barr RG, Peters RDV, Boivin M, editors. Encyclopedia on Early Childhood Development. Montreal: Quebec: Centre of Excellence for Early Childhood Development; 2011, p. 1-5. Oliver M, Schofield GM, Kolt GS, Schluter PJ. Pedometer accuracy in physical activity assessment of preschool children. J Sci Med Sport. 2007; 10(5):303-10. Oliver M, Schofield GM, Kolt GS. Physical Activity in Preschoolers: Understanding Prevalence and Measurement Issues. Sports Medicine. 2007; 37(12):1045-70. Oliver M, Schofield GM, Schluter PJ. Accelerometry to Assess Preschooler's Free-Play: Issues with Count Thresholds and Epoch Durations. Meas Phys Educ Exerc Sci. 2009; 13(4):181-90. Omran AR. The epidemiologic transition. A theory of the Epidemiology of population change. Milbank Mem Fund Q. 1971; 49(4):509-38. Owen N, Healy GN, Matthews CE, Dunstan DW. Too Much Sitting: The Population Health Science of Sedentary Behavior. Exerc Sport Sci Rev. 2010a; 38(3):105-13. Owen CG, Nightingale CM, Rudnicka AR, Cook DG, Ekelund U, Whincup PH. Ethnic and gender differences in physical activity levels among 9-10-year-old children of white European, South Asian and African-Caribbean origin: the Child Heart Health Study in England (CHASE Study). Int J Epidemiol. 2009; 38(4):1082-93. Owen CG, Nightingale CM, Rudnicka AR, Sattar N, Cook DG, Ekelund U, Whincup P. Physical activity, obesity and cardiometabolic risk factors in 9- to 10-year-old UK children of white European, South Asian and black African-Caribbean origin: the Child Heart And health Study in England (CHASE). Diabetologia. 2010b; 50(9):1832-1840. 257 References ______________________________________________________________________________________________________ Panagiotakos D, Pitsavos C, Chrysohoou C, Palliou K, Lentzas I, Skoumas I, Stefanadis C. Dietary patterns and 5-year incidence of cardiovascular disease: A multivariate analysis of the ATTICA study. Nutr Metabol Cardiovasc Dis. 2009; 19(4):253-63. Pate RR, O’Neill JR. Physical activity guidelines for young children: An emerging consensus. Arch Pediatr Adolesc Med. 2012; 166(12):1095-6. Pate RR, O'Neill JR, Lobelo F. The evolving definition of "sedentary". Exercise and Sport Sci Rev. 2008; 36(4):173-8. Pate RR, Almeida MJ, McIver KL, Pfeiffer KA, Dowda M. Validation and Calibration of an Accelerometer in Preschool Children. Obesity. 2006; 14(11):2000-6. Pate RR, O'Neill JR, Mitchell J. Measurement of Physical Activity in Preschool Children. Med Sci Sports Exerc. 2010; 42(3):508-12. Pate RR, Pratt, Michael: Blair, Steven N., Haskell WL, Macera CA, Bouchard C, Buchner D, Ettinger W, Heath GW, Kriska, Andrea: Leon, Arthur S., Marcus BH, Morris J, Paffenbarger J, Ralph S., Patrick K, Rippe, James M.: Sallis, James, Wilmore JH. Physical Activity and Public Health -- A Recommendation from the Centers for Disease Control and Prevention and the American College of Sports Medicine. JAMA. 1995; 273:402-7. Pate RR, Trilk JL, Byun W, Wang J. Policies to Increase Physical Activity in Children and Youth. J Exerc Sci Fit. 2011; 9(1):1-14. Patel KCR, Bhopal R. Diabetes epidemic in the South Asian Diaspora: action before desperation. J R Soc Med. 2007; 100(3):115-6. Pearson N, Salmon J, Campbell K, Crawford D, Timperio A. Tracking of children's bodymass index, television viewing and dietary intake over five-years. Prev Med. 2011; 53(45):268-70. 258 References ______________________________________________________________________________________________________ Phillips LRS, Parfitt G, Rowlands AV. Calibration of the GENEA accelerometer for assessment of physical activity intensity in children. J Sci Med Sport. 2013; 16(2):124-8. Pollard TM, Guell C. Assessing physical activity in Muslim women of South Asian origin. J Phys Act Health. 2012; 9(7):970-6. Popkin BM. Global nutrition dynamics: the world is shifting rapidly toward a diet linked with noncommunicable diseases. Am J Clin Nutr. 2006; 84(2):289-98. Prentice AM, Jebb SA. Obesity in Britain: gluttony or sloth? BMJ. 1995; 311(7002):4379. Prentice A, Jebb S. TV and Inactivity Are Separate Contributors to Metabolic Risk Factors in Children. PLoS Med. 2006; 3(12):e481. Probst-Henscha N, Tannera M, Kesslera C, Burria C, Künzlia N. Prevention ‒ a costeffective way to fight the noncommunicable disease epidemic. Swiss Med Wkly. 2011; 141:w13266. Puhl J, Greaves K, Hoyt M, Baranowski T. Children's Activity Rating Scale (CARS): description and calibration. Res Q Exerc Sport. 1990; 61(1):26-36. Quigg R, Gray A, Reeder AI, Holt A, Waters DL. Using accelerometers and GPS units to identify the proportion of daily physical activity located in parks with playgrounds in New Zealand children. Prev Med. 2010; 50(5-6):235-40. Raghuveer G. Lifetime cardiovascular risk of childhood obesity. Am J Clin Nutr. 2010; 91(5):1514S-9S. Rahman T, Cushing RA, Jackson RJ. Contributions of built environment to childhood obesity. Mt Sinai J Med. 2011; 78(1):49-57. Raynor P, Born in Bradford CG. Born in Bradford, a cohort study of babies born in Bradford, and their parents: Protocol for the recruitment phase. BMC Public Health. 2008; 8(1):327. 259 References ______________________________________________________________________________________________________ Reilly JJ. Descriptive epidemiology and health consequences of childhood obesity. Best Pract Res Clin Endocrinol Metab. 2005; 19(3):327-41. Reilly JJ, Penpraze V, Hislop J, Davies G, Grant S, Paton JY. Objective measurement of physical activity and sedentary behaviour: review with new data. Arch Dis Child. 2008; 93(7):614-9. Reilly J, Jackson D, Montgomery C, Kelly L, Slater C, Grant S, Paton J. Total energy expenditure and physical activity in young Scottish children: mixed longitudinal study. Lancet. 2004; 363(9404):211-2. Reilly JJ, Okely AD, Almond L, Cardon G, Prosser L, Hubbard J. Making the Case for UK Physical Activity Guidelines for Early Years: Recommendations and draft summary statements based on the current evidence. Working paper. Department of Health; London, UK: 2009. Available From: https://www.gov.uk/government/uploads/system/ uploads/attachment_data/file/135118/dh_128256.pdf.pdf Reilly JJ, Coyle J, Kelly L, Burke G, Grant S, Paton JY. An Objective Method for Measurement of Sedentary Behavior in 3- to 4-Year Olds. Obes Res. 2003; 11(10):1155-8. Reilly JJ. Physical activity, sedentary behaviour and energy balance in the preschool child: opportunities for early obesity prevention. Proc Nutr Soc. 2008; 67(03):317-25. Rey-López JP, Vicente-Rodríguez G, Biosca M, Moreno LA. Sedentary behaviour and obesity development in children and adolescents. Nutr Metab Cardiovasc Dis. 2008; 18(3):242-51. Rich C, Griffiths LJ, Dezateux C. Seasonal variation in accelerometer-determined sedentary behaviour and physical activity in children: a review. Int J Behav Nutr Phys Act. 2012; 9:49. Ridgers ND, Stratton G, McKenzie TL. Reliability and validity of the System for Observing Children's Activity and Relationships during Play (SOCARP). J Phys Act Health. 2010; 7(1):17-25. 260 References ______________________________________________________________________________________________________ Robusto KM, Trost SG. Comparison of three generations of ActiGraph™ activity monitors in children and adolescents. J Sports Sci. 2012; 30(13):1429-35. Rolland-Cachera MF. Childhood obesity: current definitions and recommendations for their use. Int J Pediatr Obes. 2011; 6(5-6):325-31 Rolland-Cachera MF, Deheeger M, Bellisle F, Sempé M, Guilloud-Bataille M, Patois E. Adiposity rebound in children: a simple indicator for predicting obesity. Am J Clin Nutr. 1984; 39(1):129-35. Romanzini M, Petroski EL, Reichert FF. Accelerometers thresholds to estimate physical activity intensity in children and adolescents: a systematic review. Rev Bras Cineantropom Desempenho Hum. 2012; 14(1):101-13. Rothney MP, Neumann M, Béziat A, Chen KY. An artificial neural network model of energy expenditure using nonintegrated acceleration signals. J Appl Physiol. 2007; 103(4):1419-27. Routen AC, Upton D, Edwards MG, Peters DM. Discrepancies in accelerometermeasured physical activity in children due to cut-point non-equivalence and placement site. J Sports Sci. 2012; 30(12):1303-10. Rowlands AV. Accelerometer assessment of physical activity in children: an update. Pediatr Exerc Sci. 2007; 19(3):252-66. Rowlands AV, Eston RG, Ingledew DK. Measurement of Physical Activity in Children with Particular Reference to the Use of Heart Rate and Pedometry. Sports Med. 1997; 24(4):258-72. Rowlands AV, Eston RG. The measurement and interpretation of children’s physical activity. J Sports Sci Med. 2007; 6(3):270-6. Saelens BE, Sallis JF, Black JB, Chen D. Neighborhood-Based Differences in Physical Activity: An Environment Scale Evaluation. Am J Public Health. 2003; 93(9):1552-8. 261 References ______________________________________________________________________________________________________ Sallis JF, Saelens BE. Assessment of physical activity by self-report: status, limitations, and future directions. Res Q Exerc Sport. 2000; 71(Suppl 2):S1-S14. Salmon J, Tremblay MS, Marshall SJ, Hume C. Health risks, correlates, and interventions to reduce sedentary behavior in young people. Am J Prev Med. 2011; 41(2):197-206. Salmon J. Novel Strategies to Promote Children’s Physical Activities and Reduce Sedentary Behavior. J Phys Activ Health. 2010; 7(Suppl 3):S299-306. Salois MJ. The built environment and obesity among low-income preschool children. Health Place. 2012; 18(3):520-7. Sasaki JE, John D, Freedson PS. Validation and comparison of ActiGraph activity monitors. J Sci Med Sport. 2011; 14(5):411-6. Saunders TJ, Larouche R, Colley RC, Tremblay MS. Acute sedentary behaviour and markers of cardiometabolic risk: a systematic review of intervention studies. J Nutr Metab. 2012; 2012:712435. Scarborough P, Bhatnagar P, Wickramasinghe KK, Allender S, Foster C, Rayner M. The economic burden of ill health due to diet, physical inactivity, smoking, alcohol and obesity in the UK: an update to 2006–07 NHS costs. J Public Health. 2011; 33(4):52735. Schoeller DA. Measurement of Energy Expenditure in Free-Living Humans by Using Doubly Labeled Water. J Nutr. 1988; 118(11):1278-89. Schoeller DA, Ravussin E, Schutz Y, Acheson KJ, Baertschi P, Jequier E. Energy expenditure by doubly labeled water: validation in humans and proposed calculation. Am J Physiol. 1986; 250(5):R823-30. Sedentary Behaviour Research Network. Standardized use of the terms “sedentary” and “sedentary behaviours". Appl Physiol Nutr Metab. 2012; 37(3):540-2. 262 References ______________________________________________________________________________________________________ Sen K, Bonita R. Global health status: two steps forward, one step back. Lancet. 2000; 356(9229):577-82. Sirard JR, Pate RR. Physical activity assessment in children and adolescents. Sports Med. 2001; 31(6):439-54. Sirard JR, Trost SG, Pfeiffer KA, Dowda M, Pate RR. Calibration and Evaluation of an Objective Measure of Physical Activity in Preschool Children. J Phys Act Health. 2005; 2(3):345-57. Sisson SB, Church TS, Martin CK, Tudor-Locke C, Smith SR, Bouchard C, Earnest CP, Rankinen T, Newton RL, Katzmarzyk PT. Profiles of sedentary behavior in children and adolescents: The US National Health and Nutrition Examination Survey, 2001–2006. Int J Pediatr Obes. 2009; 4(4):353-9. Skouteris H, Dell'Aquila D, Baur LA, Dwyer GM, McCabe MP, Ricciardelli LA, FullerTyszkiewicz M. Physical activity guidelines for preschoolers: a call for research to inform public health policy. Med J Aust. 2012; 196(3):174-6. Speakman JR, Nair KS, Goran MI. Revised equations for calculating CO2 production from doubly labeled water in humans. Am J Physiol. 1993; 264(6):E912-7. Stamatakis E, Hamer M, Primatesta P. Cardiovascular medication, physical activity and mortality: cross-sectional population study with ongoing mortality follow-up. Heart. 2009; 95(6):448-53. Stamatakis E, Wardle J, Cole TJ. Childhood obesity and overweight prevalence trends in England: evidence for growing socioeconomic disparities. Int J Obes. 2010; 34(1):417. Stamler J, Daviglus ML, Garside DB, Dyer AR, Greenland P, Neaton JD. Relationship of Baseline Serum Cholesterol Levels in 3 Large Cohorts of Younger Men to Long-term Coronary, Cardiovascular, and All-Cause Mortality and to Longevity. JAMA. 2000; 284(3):311-318. 263 References ______________________________________________________________________________________________________ Stary HC, Chandler AB, Glagov S, Guyton JR, Insull W, Rosenfeld ME, Schaffer SA, Schwartz CJ, Wagner WD, Wissler RW. A definition of initial, fatty streak, and intermediate lesions of atherosclerosis. A report from the Committee on Vascular Lesions of the Council on Arteriosclerosis, American Heart Association. Arterioscler Thromb. 1994; 14(5):840-56. Strazzullo P, D'Elia L, Cairella G, Garbagnati F, Cappuccio FP, Scalfi L. Excess Body Weight and Incidence of Stroke. Stroke. 2010; 41(5):e418-26. Sui X, Lavie CJ, Hooker SP, Lee D, Colabianchi N, Lee C, Blair SN. A Prospective Study of Fasting Plasma Glucose and Risk of Stroke in Asymptomatic Men. Mayo Clin Proc. 2011; 86(11):1042-9. Swedish National Institute of Public Health. Physical Activity in the Prevention and Treatment of Disease. Sweden: 2010. Available From: http://www.fyss.se/wpcontent/uploads/2011/02/fyss_2010_english.pdf. Takken T, Stephens S, Balemans A, Tremblay MS, Esliger DW, Schneiderman J, Biggar D, Longmuir P, Wright V, McCrindle B, Hendricks M, Abad A, van der Net J, Feldman BM. Validation of the Actiheart activity monitor for measurement of activity energy expenditure in children and adolescents with chronic disease. Eur J Clin Nutr. 2010; 64(12):1494-500. Tanaka C, Tanaka S, Kawahara J, Midorikawa T. Triaxial Accelerometry for Assessment of Physical Activity in Young Children[ast]. Obesity. 2007; 15(5):1233-41. Taveras EM, Gillman MW, Kleinman K, Rich-Edwards JW, Rifas-Shiman SL. Racial/Ethnic Differences in Early-Life Risk Factors for Childhood Obesity. Pediatrics. 2010; 125(4):686-95. Taylor RW, Murdoch L, Carter P, Gerrard DF, Williams SM, Taylor BJ. Longitudinal Study of Physical Activity and Inactivity in Preschoolers: The FLAME Study. Med Sci Sports Exerc. 2009; 41(1):96-102. 264 References ______________________________________________________________________________________________________ Taylor R, Brown D, Dawson A, Haszard J, Cox A, Rose E, Taylor B, Meredith-Jones K, Treacy L, Ross J, Williams S. Motivational interviewing for screening and feedback and encouraging lifestyle changes to reduce relative weight in 4-8 year old children: design of the MInT study. BMC Public Health. 2010; 10(1):271. te Velde SJ, van Nassau F, Uijtdewilligen L, van Stralen MM, Cardon G, De Craemer M, Manios Y, Brug J, Chinapaw MJM, ToyBox-study group. Energy balance-related behaviours associated with overweight and obesity in preschool children: a systematic review of prospective studies. Obes Rev. 2012; 13 (Suppl 1):56-74. Telama R, Yang X, Viikari J, Välimäki I, Wanne O, Raitakari O. Physical Activity from Childhood to Adulthood: A 21-Year Tracking Study. Am J Prev Med. 2005; 28(3):267-73. The ActiGraph. GT3X+ and wGT3X+ Device Manual. Pensacola, FL: 2012. Available From: http://www.actigraphcorp.com/. Theodore K. Chronic non-communicable diseases and the economy. West Indian Med J. 2011; 60(4):392-6. Thompson PD, Buchner D, Pina IL, Balady GJ, Williams MA, Marcus BH, Berra K, Blair SN, Costa F, Franklin B, Fletcher GF, Gordon NF, Pate RR, Rodriguez BL, Yancey AK, Wenger NK. Exercise and Physical Activity in the Prevention and Treatment of Atherosclerotic Cardiovascular Disease: A Statement From the Council on Clinical Cardiology (Subcommittee on Exercise, Rehabilitation, and Prevention) and the Council on Nutrition, Physical Activity, and Metabolism (Subcommittee on Physical Activity). Circulation. 2003; 107(24):3109-16. Thorp AA, Owen N, Neuhaus M, Dunstan DW. Sedentary Behaviors and Subsequent Health Outcomes in Adults: A Systematic Review of Longitudinal Studies, 1996–2011. Am J Prev Med. 2011; 41(2):207-15. Timmons BW, LeBlanc AG, Carson V, Connor Gorber S, Dillman C, Janssen I, Kho ME, Spence JC, Stearns JA, Tremblay MS. Systematic review of physical activity and health in the early years (aged 0–4 years). Appl Physiol Nutr Metab. 2012; 37(4):773-92. 265 References ______________________________________________________________________________________________________ Trost SG, Pate RR, Freedson PS, Sallis JF, Taylor WC. Using objective physical activity measures with youth: how many days of monitoring are needed? Med Sci Sports Exerc. 2000; 32(2):426-31. Trost SG, Fees BS, Haar SJ, Murray AD, Crowe LK. Identification and Validity of Accelerometer Cut-Points for Toddlers. Obesity (Silver Spring). 2012; 20(11):2317-9. Trost SG, Loprinzi PD. Exercise – Promoting healthy lifestyles in children and adolescents. J Clin Lipidol. 2008; 2(3):162-8. Trost SG, Loprinzi PD. Parental Influences on Physical Activity Behavior in Children and Adolescents: A Brief Review. Am J Lifestyle Med. 2011; 5(2):171-81. Trost SG. State of the Art Reviews: Measurement of Physical Activity in Children and Adolescents. Am J Lifestyle Med. 2007; 1(4):299-314. Tucker P. The physical activity levels of preschool-aged children: A systematic review. Early Child Res Q. 2008; 23(4):547-58. Tudor-Locke C, McClain JJ, Hart TL, Sisson SB, Washington TL. Pedometry Methods for Assessing Free-Living Youth. Res Q Exerc Sport. 2009; 80(2):175-84. Vale S, Santos R, Silva P, Soares-Miranda L, Mota J. Preschool Children Physical Activity Measurement: Importance of Epoch Length Choice. Pediatr Exerc Sci. 2009; 21(4):413-20. Vale S, Santos R, Soares-Miranda L, Silva P, Mota J. The importance of physical education classes in pre-school children. J Paediatr Child Health. 2011; 47(1-2):48-53. Vale S, Silva P, Santos R, Soares-Miranda L, Mota J. Compliance with physical activity guidelines in preschool children. J Sports Sci. 2010; 28(6):603-8. van Cauwenberghe E, Gubbels JS, De Bourdeaudhuij I, Cardon G. Feasibility and validity of accelerometer measurements to assess physical activity in toddlers. Int J Behav Nutr Phys Act. 2011; 8:67. 266 References ______________________________________________________________________________________________________ Vandewater EA, Bickham DS, Lee JH. Time Well Spent? Relating Television Use to Children's Free-Time Activities. Pediatrics. February 2006; 117(2):e181-91. Vaynman S, Gomez-Pinilla F. Revenge of the Sit: How lifestyle impacts neuronal and cognitive health through molecular systems that interface energy metabolism with neuronal plasticity. J Neurosci Res. 2006; 84(4):699-715. Venn A, Britton J. Exposure to Secondhand Smoke and Biomarkers of Cardiovascular Disease Risk in Never-Smoking Adults. Circulation. 2007; 115(8):990-5. Wadhwa PD, Buss C, Entringer S, Swanson JM, Developmental Origins of Health and Disease: Brief History of the Approach and Current Focus on Epigenetic Mechanisms. Semin Reprod Med. 2009; 27(5):358–68. Ward DS, Evenson KR, Vaughn A, Rodgers AB, Troiano RP. Accelerometer Use in Physical Activity: Best Practices and Research Recommendations. Med Sci Sports Exerc. 2005; 37(Suppl 11):S582-8. Ward DS. Physical Activity in Young Children: The Role of Child Care. Med Sci Sports Exerc. 2010; 42(3):499-501. Warren JM, Ekelund U, Besson H, Mezzani A, Geladas N, Vanhees L. Assessment of physical activity – a review of methodologies with reference to epidemiological research: a report of the exercise physiology section of the European Association of Cardiovascular Prevention and Rehabilitation. Eur J Cardiovasc Prev Rehabil. 2010; 17(2):127-39. Welk GJ. Principles of Design and Analyses for the Calibration of Accelerometry-Based Activity Monitors. Med Sci Sports Exerc. 2005; 37(Suppl 11):S501-11. Whincup PH, Gilg JA, Papacosta O, Seymour C, Miller GJ, Alberti KGMM, Cook DG. Early evidence of ethnic differences in cardiovascular risk: cross sectional comparison of British South Asian and white children. BMJ. 2002; 324(7338):635. 267 References ______________________________________________________________________________________________________ Whincup PH, Nightingale CM, Owen CG, Rudnicka AR, Gibb I, McKay CM, Donin AS, Sattar N, Alberti KG, Cook DG. Early Emergence of Ethnic Differences in Type 2 Diabetes Precursors in the UK: The Child Heart and Health Study in England (CHASE Study). PLoS Med. 2010; 7(4):e1000263. WHO Multicentre Growth Reference Study Group. WHO Motor Development Study: windows of achievement for six gross motor development milestones. Acta Paediatr. 2006; 450:86-95. Williams ED, Stamatakis E, Chandola T, Hamer M. Assessment of physical activity levels in South Asians in the UK: findings from the Health Survey for England. J Epidemiol Community Health. 2011; 65(6):517-21. Williams HG, Pfeiffer KA, O'Neill JR, Dowda M, McIver KL, Brown WH, Pate RR. Motor Skill Performance and Physical Activity in Preschool Children. Obesity. 2008; 16(6):1421-6. World Health Organization. Global Status Report on Noncommunicable Diseases 2010. Geneva; 2011. Available From: http://www.who.int/nmh/publications/ncd_report2010/en/. World Health Organization. Global health risks: mortality and burden of disease attributable to selected major risks. Geneva; 2009a. Available From: http://www.who.int/healthinfo/global_burden_disease/GlobalHealthRisks_report_full.pdf World Health Organization. 2008-2013 Action plan for the global strategy for the prevention and control of noncommunicable diseases. Geneva; 2009b. Available From: http://www.who.int/nmh/publications/9789241597418/en/ World Health Organization. Global Strategy on Diet, Physical Activity and Health. . Geneva; 2004. Available From: http://www.who.int/dietphysicalactivity/strategy/eb11344/ strategy_english_web.pdf. World Health Organization. The World Health Report 1999: Making a Difference. Geneva; 1999. Available From: http://www.who.int/whr/1999/en/. 268 References ______________________________________________________________________________________________________ World Health Organization Regional Office for South-East Asia. The Growing Crisis of Noncommunicable Diseases in the South-East Asia Region – Fact Sheet. New Delhi; 2011. Available From: http://www.searo.who.int/entity/noncommunicable_diseases/media/non_communicable_ diseases_fact_sheet.pdf Yajnik CS, Lubree HG, Rege SS, Naik SS, Deshpande JA, Deshpande SS, Joglekar CV, Yudkin JS. Adiposity and Hyperinsulinemia in Indians Are Present at Birth. J Clin Endocrinol Metab. 2002; 87(12):5575-80. Yates T, Wilmot EG, Davies MJ, Gorely T, Edwardson C, Biddle S, Khunti K. Sedentary Behavior: What's in a Definition? Am J Prev Med. 2011; 40(6):e33-4. Yusuf S, Reddy S, Ounpuu S, Anand S. Global Burden of Cardiovascular Diseases: Part I: General Considerations, the Epidemiologic Transition, Risk Factors, and Impact of Urbanization. Circulation. 2001a; 104(22):2746-53. Yusuf S, Reddy S, Ôunpuu S, Anand S. Global Burden of Cardiovascular Diseases: Part II: Variations in Cardiovascular Disease by Specific Ethnic Groups and Geographic Regions and Prevention Strategies. Circulation. 2001b; 104(23):2855-64. Zappalla FR. Childhood obesity and future cardiac risk: what should physicians be looking for? Pediatric Health. 2010; 4(3):255-65. Zecevic CA, Tremblay L, Lovsin T, Michel L. Parental Influence on Young Children's Physical Activity. Int J Pediatr. 2010; 2010:468526. Zhang Y, Hu G. Dietary Pattern, Lifestyle Factors, and Cardiovascular Diseases. Curr Nutr Rep. 2012; 1(2):64--72. Zimmerman FJ, Christakis DA. Children's Television Viewing and Cognitive Outcomes: A Longitudinal Analysis of National Data. Arch Pediatr Adolesc Med. 2005; 159(7):61925. 269 References ______________________________________________________________________________________________________ Znaor A, Brennan P, Gajalakshmi V, Mathew A, Shanta V, Varghese C, Boffetta P. Independent and combined effects of tobacco smoking, chewing and alcohol drinking on the risk of oral, pharyngeal and esophageal cancers in Indian men. Int J Cancer. 2003; 105(5):681-6. 270 Appendices ______________________________________________________________________________________________________ Appendices 271 Appendices ______________________________________________________________________________________________________ APPENDIX 1 – Questioning guide used in the focus groups. A series of questions for a separate study (irrelevant to the feasibility of using the activity monitors) were asked for the first half of the focus groups – only the questions relevant to the present study are presented below in the questioning guide. INTRODUCTION 1. Thank you all for taking part in this talk, we really appreciate your help. My name is XXX, and this is XXX, and we are working with the Born in Bradford study and Loughborough University. 2. This study is a part of a bigger project which aims to look at the activity habits of 2 to 3 year olds and their parents in Bradford, and to do that the best way possible, we need to use some devices designed for measuring activity. I have brought them with me, and will show them to you at the end of our discussion to hear your opinions about them. This will help us to decide whether the devices would be a good way of measuring activity in 2 to 3 year olds before we proceed with our bigger study. 3. Our discussion will last between 45 minutes to 1 hour, and will involve you answering some questions, giving your opinions on some topics, and completing some activities. 4. We will need to use a tape recorder to make sure we can remember all the valuable information that we discuss during this meeting, I hope that is alright with you. If anyone has any objections to this could they please make them known now? We will use our first names throughout the meeting, but once the discussion is transferred to written documents there will be no names mentioned, and no way for other people to find out who was present in the meeting. The results of the research will be used in academic publications and presentations, but no names will be used in such reports. 5. [Run through F.G. guidelines] 272 Appendices ______________________________________________________________________________________________________ 5.1. Your accompanying persons can either stay and watch our discussion, or they are welcome to move to the room next door, where we have some snacks and refreshments, and they can wait comfortably for the end of our meeting. 5.2. Do you have any questions before we start? 5.3. [Sign informed consent forms and fill in questionnaires] WARM-UP QUESTION 6. To get us all warmed up and ready to go, can we each say our name and the name of your 2 to 3 year old child. You can also say how many brothers and sisters your child has and their ages into the tape recorder. I will start – As I have said, my name is XXX and I have XXX children. DISCUSSION Questions regarding the feasibility and preference of the 3 activity monitors: 7. As we have said before, we have some activity monitors to show you, and we would really like to hear your opinion about how easy or hard it would be to use them with your children, with yourselves and your husbands/partners. We would like families to wear one monitor for 8 days. 8. This is the Actigraph [show monitor], it is used below the waist line with the red case in line with your right thigh, and it measures the movements that you do during the day. It is very light, no electric current passes through it, and it can easily be worn under any clothing. It can be taken off before going to bed and put back on when you get up. If you want to pass it around to see and feel how light it is, feel free! [Pass monitor to mothers] 273 Appendices ______________________________________________________________________________________________________ 9. This is the Actiheart [show monitor], it is used on the top part of the chest with the help of 2 sticky pads, and it measures your heart rate and the movements you do during the day. It is also very light and no electric current passes through the body. In most cases the electrodes and the device stay in the body for the entire duration of the day. You can bathe and sleep with it. In case the electrodes start to peel off they can be easily replaced and we will teach you how to do this. [Pass monitor to mothers] 10. This is the activPAL [show monitor], it is used on the middle point of the thigh with the help of a sticky pad or band, and it measures the amount of time you spend lying, sitting or standing and the steps you do during the day. It is light, and like the Actiheart it can be used during sleep. [Pass monitor to mothers] 11. From your experience as mothers of 2 to 3 year olds, is there any device that you think would be best for the children to wear? Can you tell me why? [Probe for detail] 11.1. Is there any device that you think your child would not be able to wear, or would have problems wearing it? Can you tell me why? [Probe for detail] 12. And for yourselves, is there any device that you think you would prefer to wear? Can you tell me why? [Probe for detail] 12.1. Is there any device that you would not wear, or would have problems wearing it? Can you tell me why? [Probe for detail] 13. And for your husbands or partners, is there any device that you think they would prefer to wear? Can you tell me why? [Probe for detail] 13.1. Is there any device that you think they would not wear, or would have problems wearing it? Can you tell me why? [Probe for detail] 14. So, if you had to choose one for your child to wear, which one would you prefer? 274 Appendices ______________________________________________________________________________________________________ 14.1. And if you had to choose one for yourself, which one would you prefer to wear? 14.2. And for your husband, which one do you think he would prefer to wear? 14.3. [Revise and confirm preferences for children, mothers and fathers] CONCLUDING REMARKS 16. Is there anything else you would like to add? Or any questions you would like to ask? 17. This was very helpful! We thank you very much for all your valuable information, and hope that you will have a good day! 275 Appendices ______________________________________________________________________________________________________ Appendix 2 – Triaxial equation model build (Empty model) Model m1: regress cars_n (Simple linear regression approach) Model m2: regress cars_n axis1 Model m3: regress cars_n axis1 axis2 Model m4: regress cars_n axis1 axis2 axis3 (Development into mixed-effects linear regression) Model m5: xtmixed cars_n axis1 || id: , cov(unstructured) mle Model m6: xtmixed cars_n axis1 axis2 || id: , cov(unstructured) mle Model m7: xtmixed cars_n axis1 axis2 axis3 || id: , cov(unstructured) mle (Test of a non-linear relationship with ^0.5 terms) Model m8: xtmixed cars_n axis1 axis1_05 || id: , cov(unstructured) mle Model m9: xtmixed cars_n axis1 axis2 axis1_05|| id: , cov(unstructured) mle Model m10: xtmixed cars_n axis1 axis2 axis2_05|| id: , cov(unstructured) mle Model m11: xtmixed cars_n axis1 axis2 axis1_05 axis2_05 || id: , cov(unstructured) mle Model m12: xtmixed cars_n axis1 axis2 axis3 axis1_05 || id: , cov(unstructured) mle Model m13: xtmixed cars_n axis1 axis2 axis3 axis2_05 || id: , cov(unstructured) mle Model m14: xtmixed cars_n axis1 axis2 axis3 axis3_05 || id: , cov(unstructured) mle Model m15: xtmixed cars_n axis1 axis2 axis3 axis1_05 axis2_05 || id: , cov(unstructured) mle 276 Appendices ______________________________________________________________________________________________________ Model m16: xtmixed cars_n axis1 axis2 axis3 axis1_05 axis2_05 axis3_05 || id: , cov(unstructured) mle (Testing for covariates in the best mixed-effects linear regression model) Model m161 (age): xtmixed cars_n axis1 axis2 axis3 axis1_05 axis2_05 axis3_05 age || id: , cov(unstructured) mle Model m162 (height): xtmixed cars_n axis1 axis2 axis3 axis1_05 axis2_05 axis3_05 height || id: , cov(unstructured) mle Model m163 (weight): xtmixed cars_n axis1 axis2 axis3 axis1_05 axis2_05 axis3_05 weight || id: , cov(unstructured) mle Model m164 (bmi): xtmixed cars_n axis1 axis2 axis3 axis1_05 axis2_05 axis3_05 bmi || id: , cov(unstructured) mle Model m165 (sex): xtmixed cars_n axis1 axis2 axis3 axis1_05 axis2_05 axis3_05 sex || id: , cov(unstructured) mle (Testing for interactions of sex with Axis1, Axis2 and Axis3, in model m165) Model m1655 (sex x Axis1): xtmixed cars_n axis1 axis2 axis3 axis1_05 axis2_05 axis3_05 sex sex_axis1 || id: , cov(unstructured) mle Model m1656 (sex x Axis2): xtmixed cars_n axis1 axis2 axis3 axis1_05 axis2_05 axis3_05 sex sex_axis2 || id: , cov(unstructured) mle Model m1657 (sex x Axis3): xtmixed cars_n axis1 axis2 axis3 axis1_05 axis2_05 axis3_05 sex sex_axis3 || id: , cov(unstructured) mle Model m1658 (sex x Axis1 + sex x Axis2): xtmixed cars_n axis1 axis2 axis3 axis1_05 axis2_05 axis3_05 sex sex_axis1 sex_axis2 || id: , cov(unstructured) mle 277 Appendix 3 – Example of the memory, time-discrepancies and connectivity issues of the activPAL3. 278 Appendices ______________________________________________________________________________________________________ Appendix 4 – Scatterplots of 5-second Axis1, 2, and 3 acceleration counts by CARS-scores 279 Appendices ______________________________________________________________________________________________________ 280 Appendices ______________________________________________________________________________________________________ Appendix 5 – Bland-Altman plots for differences in sedentary behaviour time 50 0 -50 -100 -150 Difference between 15- and 5-second epochs estimates, between 5-, 10-, and 15-second epochs 100 200 300 400 500 600 Mean of 15- and 5-second epochs regression line -60 -40 -20 0 95% LOA -80 Difference between 10- and 5-second epochs 20 observed average agreement 0 200 400 600 95% LOA regression line -50 0 50 observed average agreement -100 Difference between 15- and 10-second epochs Mean of 10- and 5-second epochs 0 200 400 600 Mean of 15- and 10-second epochs observed average agreement 95% LOA regression line 281 Appendices ______________________________________________________________________________________________________ Appendix 6 - Bland-Altman plots for differences in light physical activity time 150 100 50 1000 200 300 400 500 600 80 Mean of 15- and 5-second epochs 95% LOA regression line 100 0 20 40 60 observed average agreement 200 300 400 500 600 Mean of 10- and 5-second epochs 95% LOA regression line 0 50 observed average agreement -50 Difference between 15- and 10-second epochs Difference between 10- and 5-second epochs Difference between 15- and 5-second epochs estimates, between 5-, 10-, and 15-second epochs 200 300 400 500 600 Mean of 15- and 10-epochs observed average agreement 95% LOA regression line 282 Appendices ______________________________________________________________________________________________________ Appendix 7 - Bland-Altman plots for differences in moderate-to-vigorous physical activity time estimates, between 5-, 10-, and 15-second 20 0 -20 -40 -60 Difference between 15- and 5-second epochs epochs 0 50 100 150 200 Mean of 15- and 5-second epochs regression line -40 -20 0 20 95% LOA -60 Difference between 10- and 5-second epochs observed average agreement 0 50 100 150 200 Mean of 10- and 5-second epochs observed average agreement 95% LOA regression line 283 10 0 -10 -20 -30 -40 Difference between 15- and 10-second epochs Appendices ______________________________________________________________________________________________________ 0 50 100 150 Mean of 15- and 10-second epochs observed average agreement 95% LOA regression line 284


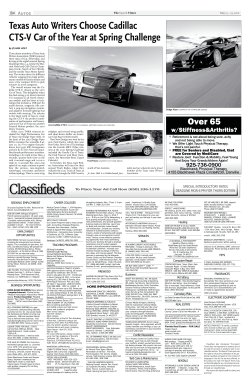


© Copyright 2026