
Wood Resource Quarterly - 3Q/2011 Wood Resource Quarterly
Wood Resource Quarterly - 3Q/2011
Wood Resource
Quarterly
The global forest industry this quarter ........................................................................ 3
World pulpwood price review by region ............................................................................. 4
Global delivered pulpwood prices ...................................................................................... 6
Global wood fiber price indices (SFPI and HFPI) .............................................................. 7
Relative fiber costs for major pulp grades .......................................................................... 8
Special Report: North American log and lumber exports to China .......................................10
Pulp market update .......................................................................................................... 11
Lumber market update ..................................................................................................... 12
Biomass market update .................................................................................................... 14
Sawlog market update and price indices ............................................................................ 16
Sawlog and Pulpwood Markets - USA ..........................................................................19
US South ............................................................................................................ 20
US Northwest ..................................................................................................... 21
Sawlog and Pulpwood Markets - Canada .................................................................... 22
Canada West ...................................................................................................... 23
Canada East ....................................................................................................... 24
Sawlog and Pulpwood Markets - Europe and Russia .................................................. 25
Finland ................................................................................................................ 26
Norway .............................................................................................................. 27
Sweden ............................................................................................................... 28
France ................................................................................................................ 29
Austria ................................................................................................................ 30
Germany ............................................................................................................. 31
Spain .................................................................................................................. 32
Estonia, Latvia, Poland and the Czech Republic ......................................................33
Northwest Russia ................................................................................................ 34
Sawlog and Pulpwood Markets - Latin America ..........................................................35
Brazil .................................................................................................................. 36
Chile ................................................................................................................... 37
Sawlog and Pulpwood Markets - Asia and Oceania .................................................... 38
Australia ............................................................................................................. 39
New Zealand ...................................................................................................... 40
China ................................................................................................................. 41
Indonesia ............................................................................................................ 43
Japan, Domestic and Imported Sawlog Prices ....................................................... 44
Japan, Conifer Pulpwood Prices and Imports ......................................................... 45
Japan, Non-Conifer Pulpwood Prices and Imports ................................................. 46
Pacific Rim Wood Chip Trade and Japan chip import prices ................................................47
Major pulp and conifer sawnwood producing countries ...................................................... 49
Pulpwood Fiber Consumption and Principal Species ........................................................... 50
Recent Articles in the WRQ and List of Conference Presentations ..................................... 51
Sources, Subscription Information, Disclaimer and Copyright Laws ..................................... 52
© 2011 Wood Resources International
3Q/2011
1
Wood Resource
Quarterly
Wood Resource Quarterly
Global Wood Fiber Market Update - 3rd Quarter 2011
October 25, 2011
Seattle, USA
Dear subscriber,
Lumber markets weakened in many countries around the world in the 3Q, resulting in lower demand for
sawlogs. As a consequence, the Global Conifer Sawlog Price Index (GSPI) fell for the first time in almost
three years.
North America’s exports of logs and lumber to China will reach new highs this year. Exports for 2011 are
predicted to reach an estimated value of 2.6 billion dollars, almost a doubling from last year (see special
report). Given the increased importance of China’s imports of forest products, we decided to include
Chinese import statistics for lumber, logs and wood chips in the Wood Resource Quarterly, which we
believe adds further value to your WRQ subscription.
Please do not hesitate to contact us if you have other markets you would like us to cover.
Global wood raw-material indices for the 3Q/2011 are as follows:
Global Sawlog Price Index (GSPI)
US$90.18/m3
Change
Q/Q
Y/Y
-1.8 % +12.1 %
Softwood Wood Fiber Price Index (SFPI)
US$108.90/odmt
-0.5 %
+9.1 %
Hardwood Wood Fiber Price Index (HFPI)
US$117.91/odmt
+1.3 %
+12.4 %
Happy reading.
Sincerely,
Håkan Ekström, Editor-in-Chief
2
3Q/2011
© 2011 Wood Resources International
Wood Resource
Quarterly
The Global Forest Industry this Quarter
Global timber markets
decline since 2Q/10. In addition to
the exchange rate adjustments,
With weaker demand for lumber
prices also fell in the local currenaround the world, sawlog prices fell
cies in Russia, France and Spain.
in a majority of the 21 markets
tracked by the WRQ. The Global
The Hardwood Wood Fiber Price
Conifer Sawlog Price Index
Index (HFPI) rose for the fifth
(GSPI) declined in the 3Q for the
quarter in a row, reaching
first time since the 1Q/09 to
$117.91/odmt, an increase of 14
$90.18/m3. With a few exceptions,
percent since early last year. The
prices fell in both local currencies
biggest increases from the 2Q/11
and in US dollar terms. The only
occurred in Chile, Japan, Indoneregion that saw any substantial price
sia and Brazil. The premium of
increase in the 3Q was British Co$9.01/odmt for HFPI over the
lumbia, where prices were up 5-7
SFPI has never been higher than in
percent from the 2Q. This region
the 3Q/11.
has benefited from higher lumber
exports and production has gone
Global pulp markets
up during 2011.
The global demand for market pulp
Global conifer sawlog price index 1995 - 2011
has been weakening the past four
months, particularly that of hardwood pulp. Pulpwatch reports that
global shipment of BHKP pulp fell
from 1.76 million tons in June to
1.41 million tons in July. Although
shipments picked up slightly in August, the outlook for the next six
Global pulpwood price
months is for lower demand and
reduced pulp production.
A strengthening of the US dollar
against many currencies resulted in
The NBSK pulp price has fallen from
lower wood fiber costs for the pulp its record high in June earlier this
industry in the 3Q. The Softwood year. In just four months, the price
Wood Fiber Price Index (SFPI) has come down almost $100/ton to
fell by less than one percent to $928/ton as of mid-October.
$108.90/odmt, which was the first
Global lumber markets
tries in Europe. In addition, a number of the largest lumber-consuming countries in the world imported
less lumber in July and August than
they did in the previous months.
Some of these countries included
the US, the UK and Germany. Even
the fast increase in imports to China
seen earlier in the year slowed
down during the summer months.
In British Columbia, sawmills
have been running at an 83 percent
utilization rate thanks to continued
strong exports to Asia. Production
during the first seven months
reached 7.2 million m3, or 6.5 percent higher than the same period
last year.
100
90
80
US$/m3
70
60
50
40
30
20
10
1
0
/1
/1
1q
8
/0
/0
6
9
1q
1q
/0
5
/0
/0
7
1q
1q
1q
4
3
/0
/0
1q
1q
2
9
1
/0
/0
1q
1q
/0
8
/9
7
/9
/9
/9
0
1q
1q
1q
1q
1q
1q
1q
/9
5
6
0
Softwood lumber imports to Japan
are up 11 percent so far this year
and total imports for the year may
reach close to seven million m3, the
highest import volumes since 2006
Source: Wood Resource Quarterly
140
Global Wood Fiber Price Indices 1988 - 3Q/2011
120
US$/odmt
100
80
60
Softwood
Hardwood
40
20
Source: Wood Resource Quarterly
1q
8
1q 8
8
1q 9
9
1q 0
9
1q 1
9
1q 2
9
1q 3
9
1q 4
9
1q 5
9
1q 6
9
1q 7
9
1q 8
9
1q 9
0
1q 0
0
1q 1
0
1q 2
0
1q 3
0
1q 4
0
1q 5
0
1q 6
0
1q 7
08
1q
0
1q 9
1
1q 0
11
0
Although there is limited production
data available for the full quarter,
there are early reports indicating
lower production levels in the US,
Eastern Canada, the Nordic countries, Russia and a number of coun-
© 2011 Wood Resources International
3Q/2011
Global biomass markets
Prices for woody biomass, whether
it was sawmill byproducts, forest
residues or urban wood waste,
were lower in 2011 than in 2009 in
most regions throughout the US.
The expansion of pellet capacity in
Europe over the past five years has
been much faster than demand.
Pellet prices in Sweden fell for
the first time in almost three years.In
Germany and Austria pellet prices
only changed a few Euros.The price
discrepancy between the three largest markets in Europe is currently
the widest since 2007.
3
Wood Resource
Quarterly
World Pulpwood Price Review
Delivered Prices
Third Quarter 2011
Product
US South
4
Domestic Price
Per m3
Per odmt
Avg
Range
Avg Range
Price in US dollars
Per m3
Per odmt
Avg Range
Avg Range
Rwd, conifer
Rwd, non-con
Chips, conifer
Chips, non-con
37
35
37
34
33-43
34-43
30-42
31-38
72
69
72
67
59-84
58-83
59-83
53-76
37
35
37
34
33-43
34-43
30-42
31-38
72
69
72
67
59-84
58-83
59-83
53-76
US Northwest Rwd, conifer
Rwd, non-con
Chips, conifer
Chips, non-con
(a) 48
27
56
40
25-68
22-32
40-84
36-47
111
72
129
107
57-156
59-86
92-193
96-126
48
27
56
40
25-68
22-32
40-84
36-47
111
72
129
107
57-156
59-86
92-193
96-126
Canada, East Rwd, conifer
Rwd, non-con
Chips, conifer
Chips, non-con
61
46
48
40
46-69
37-54
38-57
35-46
153
92
121
81
115-174
73-108
96-144
70-91
62
47
49
41
47-71
38-55
39-59
36-47
156 117-178
94 75-111
124 98-147
83
72-93
Canada, West Rwd, conifer
Rwd, non-con
Chips, conifer
Chips, non-con
(a) 48
(b)
43
(b)
36-60
(b)
37-50
(b)
121
(b)
109
(b)
91-152
(b)
93-127
(b)
49
(b)
44
(b)
37-62
(b)
38-51
(b)
124
(b)
111
(b)
93-155
(b)
95-130
(b)
Norway
Rwd, conifer
Rwd, non-con
Chips, conifer
Chips, non-con
412
(b)
(b)
(b)
395-424
(b)
(b)
(b)
1067 1023-1098
(b)
(b)
(b)
(b)
(b)
(b)
75
(b)
(b)
(b)
72-77
(b)
(b)
(b)
195 186-201
(b)
(b)
(b)
(b)
(b)
(b)
Sweden
Rwd, conifer
Rwd, non-con
Chips, conifer
Chips, non-con
470
465
459
(b)
419-482
405-490
420-520
(b)
1216 1085-1248
911
794-960
1189 1088-1347
(b)
(b)
73
72
71
(b)
66-73
64-74
63-83
(b)
188 172-189
141 126-146
184 164-215
(b)
(b)
Finland
Rwd, conifer
Rwd, non-con
Chips, conifer
Chips, non-con
49
51
(c)
(b)
47-51
46-56
(c)
(b)
127
99
(c)
(b)
120-131
89-109
(c)
(b)
69
72
(c)
(b)
65-73
68-75
(c)
(b)
179 168-189
141 133-146
(c)
(c)
(b)
(b)
France
Rwd, conifer
Rwd, non-con
Chips, conifer
Chips, non-con
52
44
49
(b)
37-65
35-50
39-55
(b)
112
82
120
(b)
85-134
66-93
96-134
(b)
73
62
69
(b)
53-91
49-70
55-78
(b)
159 121-190
116 93-132
169 135-189
(b)
(b)
Germany
Rwd, conifer
Rwd, non-con
Chips, conifer
Chips, non-con
47
62
54
(b)
38-64
50-72
48-59
(b)
126
122
134
(b)
102-172
98-141
118-146
(b)
66
88
77
(b)
54-91
71-102
68-84
(b)
178 144-243
172 139-200
190 167-207
(b)
(b)
3Q/2011
© 2011 Wood Resources International
Wood Resource
Quarterly
World Pulpwood Price Review
Delivered Prices
Third Quarter 2011
Region
Product
Domestic Price
Per m3
Per odmt
Range
Avg
Range
Avg
Price in US dollars
Per m3
Per odmt
Avg Range
Avg Range
Spain
Rwd, conifer
Rwd, non-con
Chips, conifer
Chips, non-con
36
62
(b)
(b)
27-45
56-68
(b)
(b)
83
104
(b)
(b)
61-104
93-114
(b)
(b)
51
88
(b)
(b)
38-64
79-97
(b)
(b)
117
146
(b)
(b)
87-147
132-161
(b)
(b)
Russia, NW
Rwd, conifer
Rwd, non-con
1069
883
356-1458
339-1441
2778
1777
924-3790
682-2900
37
30
12-50
12-50
96
61
32-131
24-100
Brazil
Rwd, conifer (f)
Rwd, non-con (f)
Chips, conifer
Chips, non-con
95
104
123
(b)
87-111
98-117
108-130
(b)
189
209
247
(b)
174-222
196-234
215-260
(b)
58
64
76
(b)
54-68
60-72
66-80
(b)
116
129
152
(b)
107-137
121-144
132-160
(b)
Chile
Rwd, conifer
Rwd, non-con
Chips, conifer
Chips, non-con
36
53
(c)
(b)
25-44
41-60
(c)
(b)
91
89
(c)
(b)
63-109
68-100
(c)
(b)
17184 11897-20490
25161 19350-28390
(c)
(c)
(b)
(b)
42961 29742-51220
41935 32260-47310
(c)
(c)
(b)
(b)
New Zealand Rwd, conifer
Rwd, non-con
Chips, conifer
Chips, non-con
51
(b)
62
(b)
39-80
(b)
45-79
(b)
129
(b)
154
(b)
96-200
(b)
111-198
(b)
43
(b)
51
(b)
32-67
(b)
37-66
(b)
107
(b)
129
(b)
80-167
(b)
93-165
(b)
Australia
Rwd, conifer
Rwd, non-con
Chips, conifer
Chips, non-con
41
72
38
81
31-67
55-91
24-77
55-106
98
131
88
146
74-160
100-166
56-179
100-192
43
76
40
85
33-71
58-96
25-81
58-111
103
138
93
154
78-168
105-175
58-188
105-202
Japan
Chips (dom), con
Chips (dom), non-c
Chips (imp), con (d)
Chips (imp), non-c (d)
12000
17350
17200
17730
8800-16100
15200-19000
16900-17860
13210-21670
70
51-94
131 115-144
101 99-104
134 100-164
154
223
221
228
113-207
195-244
217-230
170-279
Indonesia
Rwd, conifer
Rwd, non-con
Chips, conifer
Chips, non-con
(b)
880
(b)
(b)
(b)
580-1180
(b)
(b)
(b)
51
(b)
(b)
(b)
103
(b)
(b)
(b)
68-138
(b)
(b)
(e)
5455 4000-7318
10206 8940-11180
7818 7680-8120
10429 7770-12750
(b)
440
(b)
(b)
(b)
290-590
(b)
(b)
(b)
34-69
(b)
(b)
Notes.
Prices in above table represent wood fiber traded in the open market and do not include internal transfer pricing.
(a) Primarily utility grade roundwood.
(d) CIF port in Japan.
(b) Insufficient volume to obtain open market prices. (e) Domestic prices in 1000 Rupiah
(c) Transfer priced on local market
(f) Open market volume for Eucalyptus est 15-20%, pine 35-45%
© 2011 Wood Resources International
3Q/2011
5
6
Fr
an
c
3Q/2011
G
er
n
m
an
y
Sp
ai
zi
l
A
us
tra
lia
Fi
nl
an
d
Sw
ed
en
e
Chips
Br
a
t
ia
as
th
ne
s
a,
E
In
do
na
d
Chips
So
u
200
Ca
ile
200
U
S,
So
ut
h
C
Ru
h
s s ile
ia
,N
A W
u
N str a
ew
lia
U Zea
S,
N land
or
th
w
es
t
Br
az
il
Sp
Ca
a
na
da in
,
Ca W
es
na
da t
,E
as
t
Fr
an
G ce
er
m
an
Fi y
nl
an
Sw d
ed
e
N n
or
Ja
w
ay
pa
n
(d
om
)
U
S,
US$/odmt
175
Ch
Ru
ss
ia
,N
U
S,
W
N
or
th
w
es
t
US$/odmt
Wood Resource
Quarterly
Global Delivered Pulpwood Prices
Conifer Wood Fiber Prices - 3Q/2011
Roundwood
150
125
100
75
50
25
0
Non-Conifer Wood Fiber Prices - 3Q/2011
175
150
Roundwood
125
100
75
50
25
0
© 2011 Wood Resources International
Wood Resource
Quarterly
Global Wood Fiber Price Indices
A strengthening of the US dollar against many currencies resulted in lower wood fiber costs for the pulp
industry in the 3Q. The Softwood Wood Fiber Price Index (SFPI) fell by less than one percent to
$108.90/odmt, which was the first decline since 2Q/10. In addition to the exchange rate adjustments, prices
also fell in the local currencies in Russia, France and Spain.
The Hardwood Wood Fiber Price Index (HFPI) rose for the fifth quarter in a row, reaching US$117.91/
odmt, an increase of 14 percent since early last year. The biggest increases from the 2Q/11 occurred in
Chile, Japan, Indonesia and Brazil. The premium of $9.01/odmt for HFPI over the SFPI has never been
higher than in the 3Q/11.
Note. The Global Average Wood Fiber Price Index is a weighted average of delivered wood fiber prices for the pulp
industry in all regions tracked by the publication Wood Resource Quarterly. These regions together account for 85-90%
of the world’s wood-based pulp production capacity. The price is based on current quarter average prices, and country/
regional wood fiber consumption data. The global average for softwood and hardwood is calculated in nominal US$ per
oven-dried metric ton of wood fiber.
Softwood Fiber Price Index (SFPI)
120
1q/2009
2q
3q
4q
1q/2010
2q
3q
4q
1q/2011
2q
3q
100
80
US$/odmt
Softwood Fiber Price Index
(SFPI)
60
40
20
89.00
90.01
93.12
98.34
99.55
98.29
99.80
103.66
105.60
109.52
108.90
120
9
1q 1
92
1q
93
1q
94
1q
95
1q
96
1q
9
1q 7
98
1q
99
1q
00
1q
01
1q
02
1q
03
1q
04
1q
05
1q
06
1q
07
1q
08
1q
09
1q
10
1q
11
1q
89
90
1q
1q
1q
88
0
Hardwood Fiber Price Index (HFPI)
1q/2009
2q
3q
4q
1q/2010
2q
3q
4q
1q/2011
2q
3q
100
80
US$/odmt
Hardwood Fiber Price Index
(HFPI)
60
40
20
91.99
94.92
99.15
106.19
105.90
103.37
104.88
108.28
110.33
116.44
117.91
1q
8
1q 8
89
1q
9
1q 0
9
1q 1
92
1q
9
1q 3
9
1q 4
95
1q
96
1q
9
1q 7
98
1q
9
1q 9
0
1q 0
01
1q
02
1q
0
1q 3
0
1q 4
0
1q 5
06
1q
0
1q 7
08
1q
0
1q 9
10
1q
11
0
© 2011 Wood Resources International
3Q/2011
7
Wood Resource
Quarterly
Relative Fiber Costs for Major Pulp Grades
Prices fell for most grades of market pulp in the 3Q, less for NBSK than for SBSK and EuBKP. Wood
fiber costs trended upward in a number of markets covered by the WRQ. However, there were exceptions,
particularly in the NBSK-producing regions.
The NBSK price fell to an average of $992/ton in the 3Q, so with wood costs declining by the same
percentage, the wood cost share of the total pulp price remained basically unchanged at 35.3 percent from
the previous quarter. The wood cost percentage for Southern bleached softwood kraft pulp (SBSK) rose
from 16.8 percent in the 2Q to 17.7 percent in the 3Q/11. This rise was both because of higher wood fiber
costs and lower market price for SBSK.
The relative wood cost for Eucalyptus pulp (EuBKP) has gone up steadily for five consecutive quarters to
reach 32.2 percent in the 3Q. The major reason for the latest increase was the reduced price for Eucalyptus
market pulp, which was down over five percent quarter-over-quarter.
Notes. Wood fiber costs remain the single largest cost component in the manufacture of wood pulp. The following graphs
depict the relationship between market pulp prices (in US$ cif Europe), and average wood fiber costs. For each grade, an
average wood fiber cost was calculated using an average kraft pulp yield factor, current quarterly wood fiber prices, and
the average volume of wood consumed by each WRQ region manufacturing that particular grade of pulp (e.g. SBSK is
produced by Spain, the U.S. South, Brazil, Chile, New Zealand, and Australia). The resultant average wood fiber price is
charted as a percentage of the average market pulp price as reported by FOEX Indexes and the publication Pulpwatch
(Hawkins Wright).
Relative Wood Fiber Cost for NBSK Pulp
1000
50
800
40
600
30
400
20
200
10
1q
1q
9
1q 1
92
1q
93
1q
9
1q 4
95
1q
96
1q
9
1q 7
98
1q
9
1q 9
0
1q 0
01
1q
0
1q 2
03
1q
/0
4
1q
/0
1q 5
/0
6
1q
/0
1q 7
/0
1q 8
/0
9
1q
/1
1q 0
/1
1
0
90
0
Weighted Fiber Cost
8
60
Percentage
US$/Tonne of Pulp
1200
NBSK cif Europe
3Q/2011
Fiber Cost % (Right Axis)
© 2011 Wood Resources International
Wood Resource
Quarterly
Relative Wood Fiber Cost for SBSK Pulp
60
1000
50
800
40
600
30
400
20
200
10
9
1q 4
95
1q
96
1q
9
1q 7
98
1q
9
1q 9
00
1q
01
1q
0
1q 2
03
1q
04
1q
0
1q 5
06
1q
0
1q 7
08
1q
09
1q
1
1q 0
11
1q
1q
1q
1q
1q
92
93
0
90
91
0
Weighted Fiber Cost
1000
Percentage
US$/Tonne of Pulp
1200
SBSK cif Europe
Fiber Cost % (Right Axis)
Relative Wood Fiber Cost for EucBK Pulp
60
900
50
700
40
600
500
30
400
Percentage
US$/Tonne of Pulp
800
20
300
200
10
100
0
1q
9
1q 0
91
1q
9
1q 2
93
1q
9
1q 4
9
1q 5
96
1q
9
1q 7
98
1q
9
1q 9
0
1q 0
01
1q
02
1q
0
1q 3
0
1q 4
0
1q 5
06
1q
07
1q
0
1q 8
0
1q 9
1
1q 0
11
0
Weighted Fiber Cost
© 2011 Wood Resources International
EucBK cif Europe
3Q/2011
Fiber Cost % (Right Axis)
9
Wood Resource
Quarterly
Special Report: North American log and lumber exports to China
Exports of logs and lumber from the US and
Canada to China are on pace to reach a record
2.6 billion dollars in 2011
It interesting that since last year, the average value for
lumber exported to China has increased while the value
of US destined lumber has declined. In the second
quarter last year there was hardly any difference in the
Shipments of softwood lumber and logs from the US
average value for lumber going to China as compared
and Canada to China will reach a new record high in
to the US, while in the second quarter this year, lum2011. In 2010, the two countries exported 1.3 billion
ber for China was $30/m3 higher than for lumber for
US dollars worth of softwood products; if the pace
the US market.
seen in the first seven months of 2011 continues, the
two countries’ exports will more than double from last US will ship logs to China worth one billion dolyear, reaching a record 2.6 billion US dollars.
lars in 2011
Despite the disappointing developments in the US
housing sector the past year, lumber production in both
the US and Canada has been higher in 2011 than in
2010. Many sawmills in the Western US and Canada
have benefitted from the dramatic increase in demand
from Chinese lumber consumers and some sawmills
are exporting up to 30 to 40 percent of their production to the fast developing market in Asia.
While Canada has drastically raised lumber shipments
to China in recent years, the US has instead substantially expanded exportation of logs to Chinese lumber
manufacturers. This year, US west coast log exporters are projected to ship logs valued at close to one
billion dollars, which is up from only 42 million dollars
just four years ago. By volume, it is estimated that log
shipments will reach six million m3 in 2011, up from
only 260,000 m3 in 2007 year.
Softwood lumber from the province of British Columbia in Canada has seen the biggest increase in shipments the past year. Much of this lumber comes from
sawmills in the Interior of the province, which are utilizing the massive supply of timber that has been killed
by the pine beetle over the past 15 years. The BC
government estimates that as much as 700 million m3
of wood have been infected and are dying. However,
much of this volume is outside the reach of the forest
industry and will never be logged.
US lumber shipments to China have also gone up dramatically percentagewise the past few years, but they
started at very low levels. For example, as late as in
2008, only 70,000 m3 of lumber was exported to
China. This year it is expected that almost one million
m3 will leave the US west coast for China. As long as
the US domestic market continues to be weak, more
sawmills are exploring the opportunities to send their
products to the rapidly expanding Chinese market.
North American wood products exporters are
Average value of Canadian lumber destined for
gaining market shares in China
China higher than lumber destined for the US
The US and Canada have not only increased shipThe value of lumber shipments from Canada has inment volumes of logs and lumber to China the past
creased from just 55 million dollars in 2005 to an esfive years; the countries have also expanded their imtimated 1.2 billion dollars this year. By volume, the
portance in the Chinese wood market. In 2005, only
growth has risen from 250,000 m3 six years ago to
four percent of all softwood logs and lumber imported
slightly over seven million m3 this year. Both the BC
to China originated from North America. Last year,
Government and the forest industry are optimistic that
this share had gone up to 18 percent. Many North
China will continue to be a major consumer of CanaAmerican log and lumber suppliers have the opportudian lumber and that opportunities for shipments will
nity to expand their export sales in the coming years
continue to increase in the coming years.
and it is likely that their presence in the Chinese market will grow.
10
3Q/2011
© 2011 Wood Resources International
Wood Resource
Quarterly
Pulp Market Update 3Q/11
Reduced demand for market pulp in the 3Q
The global demand for market pulp has been weakening the past four months, particularly that of hardwood
pulp. Pulpwatch reports that global shipment of BHKP
pulp fell from 1.76 million tons in June to 1.41 million
tons in July. Although shipments picked up slightly in
August, the outlook for the next six months is for lower
demand and reduced pulp production.
Production of market pulp Jan-July (million tons)
North America
West Europe
Latin America + NZ
Rest of the world
Total, world
2010
8.3
5.4
8.4
4.1
26.2
2011
8.9
5.7
9.1
4.1
27.8
Chg (%)
+7
+6
+8
0
+6
Pulp mills in Latin America and New Zealand saw the
biggest decline in shipments, while North American and
European shipments stayed flat during the summer.
NBSK prices in Europe, the US and China ($/ton)
During the first seven months of this year, global production of market pulp increased six percent compared
to the same period in 2010. However, it is likely that
pulp output for the remainder of the year will be less
than last year, so that total production for 2011 will be
just slightly higher than in 2010.
3Q/10
2Q/10
3Q/11
Sep
W. Europe 950-980 1010-1040 950-1025 950
US
990-1020 1020-1040 970-1020 970
China
780-830
850-930
810-840 830
Market pulp prices have fallen over 10 percent
from their peak in June
The NBSK pulp price has fallen from its record high in
June earlier this year. In just four months, the price has
come down almost $100/ton to $928/ton as of October
15, according to FOEX. There are no indications that
the price slide will stop anytime soon. Most observers
in the industry agree that prices will continue downward for the rest of the year; the question is only how
long will it take until markets turn around later in 2012.
BHKP prices in Europe, the US and China ($/ton)
3Q/10
W. Europe 870-920
US, South 860-930
China
780-850
2Q/10
850-880
850-860
730-780
3/11
750-850
840-900
630-730
Sep
780
850
655
Benchmark prices for market pulp in Europe
2003 - 2011
1100
1000
900
US dollars/ton
NBSK prices in both North America and Europe were
at, or slightly higher than, the price in the third quarter
this year as compared to the same quarter last year,
ranging between $950/ton and $1025/ton. These historically high prices started to slide towards the end of
the third quarter. Currently Western European pulp
prices are slightly lower than in North America.
800
700
600
As of October 18, 2011:
NBSK: $928/ton
BHKP: $745/ton
500
400
Source: FOEX
Ja
n03
Ju
l-0
3
Ja
n04
Ju
l-0
4
Ja
n05
Ju
l-0
5
Ja
n06
Ju
l-0
6
Ja
n07
Ju
l-0
7
Ja
n08
Ju
l-0
8
Ja
n09
Ju
l-0
9
Ja
n10
Ju
l-1
0
Ja
n11
Ju
l-1
1
300
Softwood Pulp (NBSK)
Hardwood pulp prices have fallen much faster than
softwood pulp prices the past quarter. This has particularly been the case for BHKP going to China. Prices
for Eucalyptus pulp shipped to China were around $650/
ton in September. During October, Chinese buyers have
been delaying their orders in an attempt to push prices
down even further. The strategy seems to have worked
because there has recently been pulp reportedly going
for between $550-600/ton.
© 2011 Wood Resources International
Hardwood Pulp (BHKP)
________________________________________
Note.
Prices and production data are from the market
newsletter Pulpwatch, courtesy of Hawkins Wright
in the UK (www.pulpwatch.com).
3Q/2011
11
Wood Resource
Quarterly
Lumber Market Update 3Q/11
Lumber markets weakened throughout the world This was down from $175/m3 in the 1Q, but up from
during the 3Q.
$147/m3 one year ago (see graph).
Lumber Prices in Canada 2004 - 2011
350
300
SPF, West (FOB)
SPF, East (del US)
250
Douglas-fir
200
150
100
50
11
l-1
1
Ju
Ja
n-
10
l-1
0
Ju
Ja
n-
09
l-0
9
Ju
Ja
n-
08
l-0
8
Ju
Ja
n-
07
l-0
7
Ju
Ja
n-
06
l-0
6
Ju
Ja
n-
05
l-0
5
Ju
Ju
Ja
n-
l-0
4
0
04
Despite the weak housing market in the US, lumber
production was up a surprising nine percent the first
half of 2011 as compared to the same period last year,
according to the WWPA. The increases were about
eleven percent in the South and six percent in the West.
Much of the increase in production has been because
of higher exports to China, but there has also been a
three percent increase in domestic demand for lumber
this year. In July, US production fell eight percent from
June, but this was probably a temporary decline.
WWPA reports that sawmills in Western US increased
their production again by 17 percent in August because of a jump in exports to China.
Sawmills in Western Canada and Eastern Canada face
two different realities. Lumber producers in the provinces of Quebec and Ontario have few choices other
than selling their products into the domestic market or
to the US. With both markets being in decline this year,
many sawmills have been forced to reduce production or close their operations. So far, this year’s production has been down two percent compared to last
year’s level, and the operating rate has been the lowest in North America at 73 percent. In British Columbia, sawmills have been running at an 83 percent utilization rate thanks to continued strong exports to Asia.
Production during the first seven months reached 7.2
million m3, or 6.5 percent higher than the same period
last year.
Ja
n-
US lumber prices in September lower than last
year
Sawmill operating rates higher in BC than in Eastern Canada
US $/m3
Although there is limited production data available for
the full quarter, there are early reports indicating lower
production levels in the US, Eastern Canada, the Nordic countries, Russia and a number of countries in
Europe. In addition, a number of the largest lumberconsuming countries in the world imported less lumber in July and August than they did in the previous
months. Some of these countries included the US, the
UK, Germany and France. Even the fast increase in
imports to China seen earlier in the year slowed down
during the summer months.
Lumber Prices in the US 2004 - 2011
300
Prices for SPF lumber have not moved much the past
six months, in either in Eastern or Western Canada.
SPF from Quebec delivered to the US averaged
US$200/m3 this September, down from US$240/m3
in September 2010, according to Madison’s Lumber
Reporter. SPF and Douglas-fir prices in BC have seen
a similar price decline the past year (see graph).
250
US $/m3 (FOB)
200
150
Southern yellow pine
100
Random Length Index
50
1
Ju
l-1
0
11
Ju
l-1
Ja
n-
9
10
Ju
l-0
Ja
n-
8
09
Ju
l-0
Ja
n-
7
08
Ju
l-0
Ja
n-
6
07
Ju
l-0
Ja
n-
5
06
Ju
l-0
Ja
n-
4
05
Ju
l-0
Ja
n-
Ja
n-
04
0
Stable lumber prices and production in the Nordic countries
Lumber prices have trended upward the past few
months but are still lower than earlier this year. The RL Lumber production levels in both Sweden and FinIndex, which tracks the most common lumber grades land have been fairly stable this year, with production
in North America, stood at $154/m3 in September. averaging 1.4 million m3 and 800,000 m3 per month,
12
3Q/2011
© 2011 Wood Resources International
Wood Resource
Quarterly
Lumber Market Update 3Q/11 continued
respectively. Production in both counties is likely to
be higher this year than in both 2009 and 2010, but
lower than in 2008 before the financial crises. Lumber
exports have been slightly stronger so far this year,
and the total 2011 shipments for the two Nordic countries may reach the highest level since 2007.
graph). The substantial price increase the past two
years is not only the result of higher costs for the lowergrade lumber which has been the dominant product
segment for Canadian lumber, but also a reflection of
an increased share of higher quality lumber being exported to China.
With the steady demand for lumber both domestically
and in the export market, lumber prices have not
changed much in US dollar terms for almost a year
(see graph). There was reportedly a slight increase in
the Swedish export price for both pine and spruce
lumber in August because of higher export volumes.
Higher lumber imports to Japan in 2011
400
Lumber Prices in the Nordic Countries 2005 - 2011
Housing starts of wooden houses in Japan have gone
up by 5.4 percent during the first eight months this
year as compared to the same period last years. There
has actually been a steady increase in housing starts
over the summer and fall, from 34,000 starts in May
to 47,000 starts in August. Year-to-year the rise has
been 11.5 percent.
350
Softwood lumber imports to Japan are up 11 percent
so far this year and total imports for the year may reach
close to seven million m3, the highest import volumes
since 2006. Canada continues to be the largest supplier followed by Russia, Sweden and Finland. The
biggest changes from last year are that Austria, Russia
and Finland have increased shipments by over 25 percent this year, and that Canada may export less to
Japan this year than in 2010. Both domestic and imValue of Canadian lumber in China up over 50
port prices have trended upward the past 12 months
percent in two years
(see graph).
The average value of imported softwood lumber to
China has steadily trended upward for over two years,
Lumber Prices in Japan 2006 - 2011
reaching a new record high of US$212/m3 in August,
according to Customs data. Prices for lumber from
Canada, which is the largest supplier to China, have
gone up the fastest, from an average of $135/m3 in
May 2009 to $205/m3 in August of this year (see
US $/m3
300
250
Finland
200
Sweden
150
100
50
1
Ju
l-1
0
11
Ju
l-1
Ja
n-
9
10
Ju
l-0
Ja
n-
8
09
Ju
l-0
Ja
n-
7
08
Ju
l-0
Ja
n-
6
07
Ju
l-0
Ja
n-
5
06
Ja
n-
Ju
l-0
Ja
n-
05
0
1200
Sugi, Japan
1000
Pine, Russia
Whitewood, Europe
Douglas-fir, US
US$/m3
800
Hemlock, Canada
600
400
250
Lumber Import Prices in China 2006 - 2011
200
0
11
l-1
1
Ju
10
l-1
0
Ja
n-
Ju
Ja
n-
09
l-0
9
Ju
Ja
n-
08
l-0
8
Ju
07
06
l-0
7
Ja
n-
Ju
Ja
n-
Ju
Ja
nUS $/m3
l-0
6
200
150
Sources: Japan Lumber Journal (Japan), Madison Lumber Reporter (SPF and Douglas-fir in North America), Random Lengths
(pine in Southern US), Metla (Finland) and SCB (Sweden). Additional sources are customs statistics and the WRI’s database.
100
Total
50
Canada
Russia
1
Ju
l-1
11
0
© 2011 Wood Resources International
Ja
n-
Ju
l-1
10
Ja
n-
9
09
Ju
l-0
Ja
n-
8
08
Ju
l-0
Ja
n-
7
6
07
Ju
l-0
Ja
n-
Ju
l-0
Ja
n-
06
0
Notes. All prices are for kiln-dried lumber, except for Sugi and
Russian pine pre-2009.
3Q/2011
13
Wood Resource
Quarterly
Biomass Market Update 3Q/11
North American pellet exports to Europe on pace
to a new record in 2011
The European Union has stated that by 2020, at least
20 percent of total energy consumption should be supplied by renewable energy resources. In an effort to
reach this target, many countries have increased their
consumption of woody biomass in the form of both
wood chips and pellets over the past few years. In
2010, almost 12 million tons of wood pellets were
consumed on the continent, which was about 20 percent higher than the previous year.
Demand for wood pellets in some European countries, including Sweden, the Netherlands, Belgium, Italy,
Denmark, and the UK has outpaced domestic production in these countries over the past few years. This
has resulted not only in increased imports from neighboring countries, but also from North America. Over
the past ten years, Canada has been the major overseas supplier of pellets to Europe, reaching about one
million tons in shipments in 2010.
lower in both 2010 and 2011 than in 2009 in most
regions throughout the US, but were higher in most
regions of the US than they were five years ago. This
drop seen in 2010 and 2011 was mainly the result of
low prices for fossil fuels, which reduced the interest
in switching to more expensive green energy. In the
major biomass-consuming regions of the US, forest
biomass prices ranged between $40-60/odmt in the
3Q, while mill biomass were $10-20/odmt less, according to our sister publication, the North American
Wood Fiber Review.
As long as natural gas and oil prices are relatively low,
there will not much increase in demand for biomass
and prices will not move up much short-term. Longterm, however, the increased competition for wood
chips and smaller logs between pulp mills, composite
board manufacturers and energy producers are likely
to push wood costs, including biomass, upward.
Low operating rates in the European pellet industry
The US did not start exporting pellets until 2008 when
85,000 tons were shipped to the Netherlands, but
exports have since taken off, reaching almost 600,000
tons in 2010. In fact, total shipments from the US and
Canada have almost doubled in just two years. During the first six months of 2011 overseas imports to
Europe reached over 700,000 tons, it is likely that
2011 will prove to be a new record year in pellet trade
over the Atlantic.
The expansion of pellet capacity in Europe over the
past five years has been much faster than demand. In
both 2009 and 2010, operating rates have been at
approximately 60 percent, so there are ample opportunities to increase production should the demand and
price structure permit. Interestingly, pellet consumption increased by over two million tons (+21 percent)
from 2009 to 2010, according to data from AEBIOM.
Much of this increased demand has been for industrial
pellets, and the higher demand has, to a large extent,
The majority of North American pellets have been been met by imported pellets from North America and
shipped to the Netherlands, the United Kingdom and Russia rather than with in EU.
Belgium, with occasional shipments to Sweden and
Denmark. In 2010, almost 50 percent of the Atlantic Pellet production in Austria likely to reach a
trade was destined for the Netherlands, while one- record high in 2011.
third landed in ports in the UK.
Pellet production in Austria was up by nine percent
US woody biomass prices lower than two years the first six months of the year compared the first half
of 2010, according to proPellets Austria. With the same
ago
pace expected in the coming months, it is estimated
Prices for woody biomass, whether it was sawmill that total production will reach over 900,000 tons for
byproducts, forest residues or urban wood waste, were
14
3Q/2011
© 2011 Wood Resources International
Wood Resource
Quarterly
Biomass Market Update 3Q/11 continued
the year, which would be a record high, and an almost
50 percent increase in just three years. A majority of
the production is consumed domestically, with about
20 percent being exported to neighboring Germany
and Italy.
Wood Pellet Prices in Europe 2003 - 3Q/2011
350
Euro/ton (residental, bulk)
300
Over the past five years, the pellet industry in Austria
has expanded rapidly, much faster than the demand
for pellets both domestically and in the export market.
As a result, the operating rate in the industry has fallen
from over 95 percent in 2006 to less than 70 percent
this year.
150
Austria
100
Germany
Sweden
/1
1
1Q
/1
0
1Q
/0
9
1Q
/0
8
1Q
/0
7
1Q
/0
6
1Q
/0
5
1Q
1Q
1Q
/0
3
/0
4
0
Wood Pellet Prices (CIF Rotterdam)
145
It is estimated that at least five million tons of wood
debris, which can be used for energy, were generated
from the earthquake and tsunami that hit Japan earlier
this year. There are therefore now plans in consideration to utilize this resource by building biomass power
plants adjacent to sawmills and plywood plants which
are being rebuilt northeast of Tokyo. The plan is to
generate both electricity to the processing plants and
heat to the surrounding house developments.
In the 3Q, pellet prices in Sweden fell for the first time
in almost three years. The average price for residential
pellets (bulk) was €281/ton, down from €296/ton in
the 2Q. In Germany and Austria, pellet prices only
changed a few Euros in the 3Q, averaging €228/ton in
both countries. The price discrepancy between the
three largest markets in Europe is currently the widest
it has been since 2007.
200
50
Large quantities of wood debris from the earthquake in Japan may be turned into energy
Big price discrepancy between the three major
pellet markets in Europe
250
€/ton (industrial pellets)
140
135
130
125
120
115
N
ov
-1
1
1Q
/1
2
2Q
-1
2
20
13
M
D
ec
-0
8
ar
-0
9
Ju
n0
Se 9
p0
D 9
ec
-1
M 0
ar
-1
0
Ju
n1
Se 0
p1
D 0
ec
-1
M 0
ar
-1
1
Ju
n1
Se 1
p11
110
Source: Endex
Sources: Endex (Netherlands), ProPellets (Austria),
DEPV (Germany), Energimyndigheten (Sweden) and
ÄFAB (Sweden). Additional sources are industry contacts and the WRI’s database.
For more detailed price and market information for
the biomass market in the US and Canada, please
refer to our sister publication, the North American
The price for industrial pellets delivered to Rotterdam, Wood Fiber Review.
the Netherlands, was €132/ton in September, according to Endex. Future contracts are moving upward,
and will likely be closer to €135/ton in 2013.
© 2011 Wood Resources International
3Q/2011
15
Wood Resource
Quarterly
Sawlog Market Update 3Q/11
16
0
9
8
7
1
1q
/1
1q
/1
1q
/0
1q
/0
1q
/0
5
4
6
1q
/0
1q
/0
1q
/0
2
1
0
9
3
1q
/0
1q
/0
1q
/0
1q
/0
1q
/9
7
6
8
1q
/9
1q
/9
1q
/9
1q
/9
5
US$/m3
Global sawlog price index fell for the first time On the BC coast, sawlog prices were not much more
since early 2009
expensive than pulplog prices, an indication of the competition for roundwood between Canadian sawmills
With weaker demand for lumber around the world,
and pulpmills for certain grades. The piles of logs at
sawlog prices fell in a majority of the 21 markets
export docks have spurred some political opposition
tracked by the WRQ. The Global Conifer Sawlog
stating these represent value-added jobs being shipped
Price Index (GSPI) declined in the 3Q for the first
overseas. The argument however, is somewhat blunted
time since the 1Q/09 to $90.18/m3. With a few exby the fact that a number of sawmill in the province,
ceptions, prices fell in both local currencies and in US
particularly on the coast, have reopened or expanded
dollar terms. The only region that saw any substantial
production hours in the past 18 months as a result of
price increase in the 3Q was British Columbia, where
increased lumber demand from China.
prices were up 5-7 percent from the 2Q. This region
has benefited from higher lumber exports and proLog costs in Eastern Canada remain high
duction has gone up during 2011.
Eastern Canadian log prices have been very steady
Global conifer sawlog price index 1995 - 2011
100
this year despite declining lumber production. The
90
region’s sawmills continue to have among the highest
80
wood costs in all of North America, which is partly a
70
60
reflection of continued uncertainties of future log sup50
ply constraints. Practically all of the provincial gov40
ernments in Eastern Canada forecast lower Annual
30
Allowable Cuts in the future. Other problems making
20
10
it difficult for sawmills in this region to benefit from
0
competitive wood costs are low timber volumes per
hectare, small average stem size, and relatively long
Source: Wood Resource Quarterly
transportation distances, all of which are factors that
The biggest price declines the past quarter have oc- will keep log costs relatively high.
curred in Sweden, Poland, Russia and Japan, ranging
between 6-12 percent down from the 2Q/11. The Global trade of softwood logs estimated to be up
three ladder countries are major exporters of lumber, about 15 percent this year
and shipments to European markets and Northern
Global trade of softwood logs in 2011 is on track to
Africa have fallen this summer and fall.
be the highest it has been in four years. Based on trade
data for the period January through July, it could very
Western Canadian sawlog prices impacted by
well be that total log trade could reach over 85 million
lumber demand in Asia
m3 this year. This would be almost 15 percent higher
In Canada, sawlog prices continued to rise, less in the than last year and 35 percent more than in 2009. Not
eastern provinces than in the west. In British Colum- surprisingly, demand in China is the key reason for this
bia, the price for Coastal Hemlock rose over three dramatic surge in log shipments. An estimated 31 perpercent to US$60/m3 in the 3Q, while the price for cent of the world’s softwood log imports are to China,
spruce-pine-fir (SPF) logs in the Interior BC rose followed by Germany, Austria and South Korea, with
nearly seven percent to US$46/m3. Prices in both re- each country accounting for less than ten percent of
gions were the highest they have been since the global global trade. The biggest decline in imports over the
financial crisis in 2008.
past five years has been to South Korea, Japan and
Finland, which all are likely to import less than half of
the log volume this year as compared to 2006.
3Q/2011
© 2011 Wood Resources International
Wood Resource
Quarterly
Conifer Sawlog Price Index 1995-2011
(1q/1995=100, Based on US dollars)
It is important to note that sawlog prices presented in the graphs and tables in this publication should be used as
indicators when comparing price trends in different regions rather then for absolute price comparisons. Sawlog
qualities and properties of conifer species vary in different parts of the world and therefore they are not always
directly comparable. Also bear in mind that log grades and volume/weight measurements do differ between
regions. Factors used to convert to cubic meter under bark are estimates made by WRI and regional contacts.
North America
(1q/1995=100)
Conifer Sawlog Price Index 1995 - 3Q/2011
North America
1q/1995=100 (Based on price in US$)
200
180
160
140
120
100
80
60
40
20
1q
/9
5
1q
/9
6
1q
/9
7
1q
/9
8
1q
/9
9
1q
/0
0
1q
/0
1
1q
/0
2
1q
/0
3
1q
/0
4
1q
/0
5
1q
/0
6
1q
/0
7
1q
/0
8
1q
/0
9
1q
/1
0
1q
/1
1
0
US South - Pine
BC Interior - SPF
US NW - Hemlock
Quebec
BC Coast - Hemlock
2002
2003
2004
2005
2006
2007
2008
2009
2010
US S US W BC C
99
71
50
100
66
42
103
77
45
107
88
42
107
88
47
104
73
57
105
64
49
94
52
41
97
74
45
Europe
1q/1995 = 100 (Based on price in US$)
200
150
100
50
1q
/9
5
1q
/9
6
1q
/9
7
1q
/9
8
1q
/9
9
1q
/0
0
1q
/0
1
1q
/0
2
1q
/0
3
1q
/0
4
1q
/0
5
1q
/0
6
1q
/0
7
1q
/0
8
1q
/0
9
1q
/1
0
1q
/1
1
0
Finland - pine
Austria - spruce
Sweden - pine
Czech R - spruce
Germany - spruce
2002
2003
2004
2005
2006
2007
2008
2009
2010
1q/1995 = 100 (Based on price in US$)
Latin America, Asia & Oceania
250
200
150
100
50
Brazil - pine
Japan - Douglas-fir (US)
© 2011 Wood Resources International
1q
/1
1
1q
/1
0
1q
/0
9
1q
/0
8
1q
/0
7
1q
/0
6
1q
/0
5
1q
/0
4
1q
/0
3
1q
/0
2
1q
/0
1
1q
/0
0
1q
/9
9
1q
/9
8
1q
/9
7
1q
/9
6
1q
/9
5
0
New Zealand - pine
Japan - Sugi
Fin
84
100
108
105
113
155
154
122
132
Swe
71
88
98
91
103
122
134
110
130
Aus
72
81
89
92
102
116
113
107
116
Ger
50
74
78
85
98
124
120
103
119
Cze
91
103
121
139
163
160
160
139
169
Latin America & Asia
(1q/1995=100)
Conifer Sawlog Price Index 1995 - 3Q/2011
300
Que
106
125
141
152
154
161
164
151
154
Europe
(1q/1995=100)
Conifer Sawlog Price Index 1995 - 3Q/2011
250
BC I
73
75
81
89
93
89
76
62
68
Chile - pine
3Q/2011
2002
2003
2004
2005
2006
2007
2008
2009
2010
Bra
66
88
124
169
193
211
226
196
219
Chl
92
94
104
108
114
119
124
115
111
NZ
63
74
84
86
79
95
88
78
97
Jpn S Jpn Df
46
66
51
69
52
77
47
75
45
75
46
78
48
88
48
90
55
90
17
Wood Resource
Quarterly
Conifer Sawlog Price Index 1995-2011
160
North America
(1q/1995=100)
Conifer Sawlog Price Index 1995 - 3Q/2011
North America
140
120
2002
2003
2004
2005
2006
2007
2008
2009
2010
100
80
60
40
20
0
1q
/9
5
1q
/9
6
1q
/9
7
1q
/9
8
1q
/9
9
1q
/0
0
1q
/0
1
1q
/0
2
1q
/0
3
1q
/0
4
1q
/0
5
1q
/0
6
1q
/0
7
1q
/0
8
1q
/0
9
1q
/1
0
1q
/1
1
1q/1995=100 (Based on price in local currency)
(1q/1995=100, Based on local currency)
US South - Pine
BC Interior - SPF
US NW - Hemlock
Quebec
BC Coast - Hemlock
US S US W BC C
99
71
50
100
66
42
103
77
42
107
88
37
107
88
38
104
73
44
105
64
37
94
52
33
97
74
33
140
2002
2003
2004
2005
2006
2007
2008
2009
2010
120
100
80
60
40
20
0
1q
/9
5
1q
/9
6
1q
/9
7
1q
/9
8
1q
/9
9
1q
/0
0
1q
/0
1
1q
/0
2
1q
/0
3
1q
/0
4
1q
/0
5
1q
/0
6
1q
/0
7
1q
/0
8
1q
/0
9
1q
/1
0
1q
/1
1
1q/1995 = 100 (Based on price in local currency)
Europe
Ger
85
82
80
86
99
114
103
94
113
Cze
123
121
129
138
153
135
113
109
133
160
Finland - pine
Austria - spruce
Sweden - pine
Czech R - spruce
Germany - Spruce
.
180
Latin America, Asia & Oceania
160
140
2002
2003
2004
2005
2006
2007
2008
2009
2010
120
100
80
60
40
20
1q
/9
5
1q
/9
6
1q
/9
7
1q
/9
8
1q
/9
9
1q
/0
0
1q
/0
1
1q
/0
2
1q
/0
3
1q
/0
4
1q
/0
5
1q
/0
6
1q
/0
7
1q
/0
8
1q
/0
9
1q
/1
0
1q
/1
1
0
New Zealand - pine
Japan - Sugi
Fin
115
115
112
110
117
147
135
113
129
Swe
94
96
98
92
103
112
118
113
126
Aus
101
95
95
97
108
112
102
102
116
Latin America & Asia
(1q/1995=100)
Conifer Sawlog Price Index 1995 - 3Q/2011
1q/1995 = 100 (Based on price in local currency)
Que
119
124
130
131
124
122
124
122
117
Europe
(1q/1995=100)
Conifer Sawlog Price Index 1995 - 3Q/2011
180
BC I
81
75
75
77
75
68
57
50
50
Chile - pine
Japan - Douglas-fir (US)
Bra
230
326
438
493
508
496
492
469
466
Chl
143
140
140
140
130
133
140
140
129
NZ
86
82
81
78
78
82
79
79
86
Jpn S Jpn Df
60
87
62
83
58
86
53
86
55
91
56
96
51
95
47
87
51
83
Notes.
Three main criteria were used to choose geographical regions and conifer log grades for presentation in the WRQ:
1) Conifer lumber production in the region is among the twenty-five top producing regions in the world.
2) Conifer log grade/grades are commonly processed in the region.
3) Log species and grades are mainly average logs being processed into construction and better grades lumber in the
region. The intention is to not include pruned logs or logs typically used to produce low-grade products such as
pallets and packaging components.
18
3Q/2011
© 2011 Wood Resources International
Wood Resource
Quarterly
Sawlog and Pulpwood Markets 3Q/11 - USA
US exported an estimated 1.2 billion dollars worth
of logs to Asia last year
sawmills in the region that are predominantly selling
their products domestically, since US lumber prices
are hovering at historic lows and are close to, or beThe flow of log trade in the Pacific Rim has changed
low, production cost for many sawmills.
both in value, volume and direction the past five years.
The total value of logs exported from North America
Wood fiber prices in US NW unchanged for now
to Asia rose from 790 million dollars in 2006 to almost 1.2 billion dollars in 2010. The total volume The rise in softwood chip prices during the past 18
shipped in 2010 to Asia was 10.6 million m3, which months in the Northwest came to a halt in the 3Q/11.
was over 70 percent higher than in 2006.
The average price for residual chips was $129/odmt,
which was unchanged from the previous quarter but
Log exports from the US have been surprisingly stable 43 percent higher than early 2010.
at approximately 10 million m3 from 2005 through
2009. However, this changed in 2010 when shipments Increased access to forest stands over the summer
jumped 52 percent to 16 million m3, of which ap- months expanded the supply of both sawlogs and pulpproximately 60 percent was softwood logs. For many logs in the 3Q. However, a number of sawmills were
years, Canada has been the major destination for ex- still taking additional downtime in late August due to
ported logs and accounted for approximately 40% of the lack of logs priced to match the low lumber pricthe total shipments in 2009. In 2010, this share fell to ing. The reduced operating rates at some sawmills,
about 30 % because of the change in demand in Asia. which resulted in lower supplies of residuals, forced
some pulpmills to source higher volumes of roundA record 70 percent of all logs from the US to wood chips.
Asia is now unloaded in China
Sawlog and pulp log prices in the US South have
A majority of the trade five years ago was that of Doubeen flat most of the year
glas-fir sawlogs shipped from Western US to Japan.
Although Japan is still an important market for US log In the US South, there were no dramatic events that
exporters, China has become the number one desti- had an impact on log prices. Both sawlog and pulplog
nation, surpassing Japan in 2010. In 2011, this trend prices remained unchanged from the 2Q. Pine sawlog
continued and a record 70% of all Asia-bound logs prices averaged $60/m3 in the 3Q, which is the same
have gone to China. During the first eight months of as most of the year but four dollars down from a year
this year, US shipped 4.2 million m3 of logs to China ago. Both hardwood and softwood pulplog prices have
and a total of 6.4 million m3 was leaving for Asian hovered around $70/odmt during much of 2011. April’s
destinations. This was slightly more than the total ship- tornado caused widespread damage to forest stands
ments in 2010 and over 50 percent more than in 2009. in Mississippi and Alabama, but this wood has largely
been salvaged, and Tropical Storm Lee in early SepSubstantial increases in sawlog prices in West- tember only temporarily slowed affected operations.
ern US the past two years
While sawmill production in the South has risen in
As a result of the increase in log exports, prices for
2011, the additional residual chip supplies have not
both Douglas-fir and hemlock logs have steadily gone
noticeably moved chip prices this year.
up the past two years. In the 3Q/11, Douglas-fir averaged $87/m3 up from $53/m3 in mid-2009 and the Note.
average hemlock log price have gone from $43/m3 to For more detailed market information for the US, in$76/m3 over the same time period. The dramatic in- cluding biomass markets, please refer to our sister pubcrease in wood costs has not been good news for lication, the North American Wood Fiber Review.
© 2011 Wood Resources International
3Q/2011
19
Wood Resource
Quarterly
US South - Sawlog and Pulpwood Prices
Pine Sawlog Prices
(US$/m3)
Conifer Sawlog Prices - US South
90
80
70
1q/2010
2q
3q
4q
1q/2011
2q
3q
US$/m3ub
60
50
40
30
20
10
1q
/2
01
1q
/2
00
1
9
7
5
1q
/2
00
1q
/2
00
3
1
1q
/2
00
9
1q
/2
00
1q
/1
99
1q
/1
99
1q
/1
99
5
7
0
Conifer Pulpwood Prices
(US$/odmt)
Conifer Wood Fiber Prices in the U.S. South
100
65
64
65
62
61
61 r
60
90
US$/odmt - Delivered
80
1q/2010
2q
3q
4q
1q/2011
2q
3q
70
60
50
Roundwood
40
Chips
30
20
10
10
08
1q
1q
06
1q
04
02
1q
1q
00
1q
96
98
1q
94
1q
1q
92
90
1q
1q
1q
88
0
Non-Conifer Pulpwood Prices
(US$/odmt)
Non-Conifer Wood Fiber Prices in the U.S. South
90
Chips Rdwd
79
79
74
76
72
72
71
73
72
73
72
71
72
72
80
Chips Rdwd
US$/odmt - Delivered
70
60
50
Roundwood
40
Chips
30
20
10
10
Wood costs of total cash costs - pulp industry
(Source: Fisher International)
1q/2010
2q
3q
4q
1q/2011
2q
50
Percent of total cost (%)
84
79
75
74
72
71
69
Wood costs of total cash costs - pulp (%)
US South
60
71
67
66
66
66
67
67
1q
08
1q
06
1q
04
1q
02
1q
00
1q
96
98
1q
94
1q
1q
92
1q
90
1q
1q
88
0
1q/2010
2q
3q
4q
1q/2011
2q
3q
40
30
20
54.8
54.9
52.8
53.4
54.1
53.8
10
20
/1
1
1Q
/1
0
1Q
/0
9
1Q
/0
8
1Q
/0
7
1Q
/0
6
1Q
1Q
/0
5
0
3Q/2011
© 2011 Wood Resources International
Wood Resource
Quarterly
US Northwest - Sawlog and Pulpwood Prices
Conifer Sawlog Prices
(US$/m3)
Conifer Sawlog Prices - US NW
140
120
Douglas-fir
Hemlock
73
83
74
75
90
88
87
60
71
65
65
76
75
76
US$/m3ub
100
1q/2010
2q
3q
4q
1q/2011
2q
3q
80
60
Douglas-fir
40
Hemlock
20
11
09
1q
/2
0
1q
/2
0
07
05
1q
/2
0
1q
/2
0
1q
/2
0
03
01
99
1q
/1
9
1q
/2
0
97
1q
/1
9
1q
/1
9
95
0
Conifer Pulpwood Prices
(US$/odmt)
Conifer Wood Fiber Prices in the U.S. Northwest
180
160
Roundwood
US$/odmt - Delivered
140
Chips
Rdwd
91
89
94
103
107
129
129
75
72
77
84
101
109
111
Chips
120
1q/2010
2q
3q
4q
1q/2011
2q
3q
100
80
60
40
20
1q
10
08
1q
06
1q
04
02
1q
1q
1q
00
98
1q
1q
96
94
1q
92
1q
90
1q
1q
88
0
Non-Conifer Pulpwood Prices
(US$/odmt)
Non-Conifer Wood Fiber Prices in the U.S. Northwest
180
160
Roundwood
US$/odmt - Delivered
140
Chips
120
1q/2010
2q
3q
4q
1q/2011
2q
3q
100
80
60
40
20
10
1q
08
1q
06
1q
1q
04
02
1q
00
1q
96
98
1q
1q
94
1q
92
1q
90
1q
1q
88
0
Rdwd
125
115
110
109
109
108
107
81
79
84
77
77
72
72
Wood costs of total cash costs - pulp industry
Wood costs of total cash costs - pulp (%)
Western US
(Source: Fisher International)
60
50
Percent of total cost (%)
Chips
1q/2010
2q
3q
4q
1q/2011
2q
40
30
20
48.8
49.5
48.6
54.9
54.3
60.7
10
© 2011 Wood Resources International
1Q
/1
1
1Q
/1
0
1Q
/0
9
1Q
/0
8
1Q
/0
7
1Q
/0
6
1Q
/0
5
0
3Q/2011
21
Wood Resource
Quarterly
Sawlog and Pulpwood Markets 3Q/11 - Canada
Softwood chip prices, which are tied to market pulp
prices, were essentially unchanged in the both the
Coastal and Northern Interior regions in British Columbia in the 3Q. While market pulp prices have fallen
recently, the formula calculations defer the influence
on chip prices, therefore any prices reductions will
most likely occur in the 4Q/11.
In contrast, BC Southern Interior softwood prices rose
nearly eight percent from the 2Q and they are currently 20 percent higher than a year ago. The recent
price increases reflect a “leveling” between the higher
prices found in the North Interior and Coast regions,
as well as the severe shortage of available fiber from
the bush due to wet weather. The drop in chip inventories and subsequent increases in prices attracted
some chip volumes from the US during the summer.
The wet weather that plagued the late spring and early
summer across British Columbia has kept inventories
of sawlogs tight. Several sawmills in the province took
downtime due to log shortages. This reduced residual
chip supplies and pulp mills had to purchase addition
volumes of the more expensive roundwood chips. The
Province saw both sawmills and pulpmills taking downtimes in the late 2Q and early 3Q as a mechanism to
address these temporary fiber supply shortages.
BC pulplog prices stabilized in the 3Q, albeit at
high levels
year. Conditions remain essentially the same, with the
region’s sawmills historically focused on the US domestic market, and not in position to easily participate
in the hot Chinese lumber market. Lumber production
fell during the 2Q and into the summer, resulting in
lower demand for logs. In US dollar terms, sawlog
prices have trended upward from just over $60/m3 in
2009 to $73/m3 in the 3Q/11.
Roundwood prices continue to rise in New Brunswick and Nova Scotia
Softwood roundwood prices in the Maritime Provinces of New Brunswick and Nova Scotia rose nearly
six percent in the 3Q from the previous quarter. The
delivered price of C$54/m3 represents a 35 percent
increase from one year ago. Hardwood roundwood
prices rose another two dollars from the previous quarter to C$44/m3. The wood fiber price increases reflect the continued uncertainty of wood supplies from
private woodland owners along with concerns over
possible regulatory changes on Crown wood tenures.
However, the shutting of New Page’s Port
Hawkesbury plant in September is likely to take the
steam out of further rises, at least in Nova Scotia.
Exchange Rate: Canadian $/US$
1.8
1.6
1.4
1.2
C$/US$
Wood chip prices stabilize in British Columbia
1.0
0.8
0.6
0.4
Wood fiber prices level in Quebec and Ontario
Softwood and hardwood chip and roundwood prices
remained level into 3Q/11 from the beginning of the
22
0.2
10
08
1q
1q
04
02
00
98
96
94
06
1q
1q
1q
1q
1q
1q
90
92
1q
1q
1q
88
0.0
1q
Improved weather conditions in the 3Q finally saw
wood flows increasing. The increased availability meant
that prices, already at record high levels, did not rise
further, and pulplog prices rose only marginally. Conifer pulplogs were averaging C$50/m3 at the Coast.
Douglas-fir pulplogs, though a much smaller component of the fiber supply and historically priced significantly lower, rose 15 percent.
Canadian $/US$
1q/2010
2q
3q
4q
1.041
1.028
1.040
1.014
1q/2011
2q
3q
0.986
0.967
0.978
Note.
For more detailed price and market information for
Canada, please refer to our sister publication, the North
American Wood Fiber Review.
3Q/2011
© 2011 Wood Resources International
Wood Resource
Quarterly
Canada West - Sawlog and Pulpwood Prices
Conifer Sawlog Prices - Coast
(US$/m3)
Conifer Sawlog Prices - BC Coast
140
Douglas-fir
Hemlock
120
Douglas-fir
Hemlock
57
69
60
72
70
79r
75
46
46
47
50
54
58r
60
US$/m3ub
100
1q/2010
2q
3q
4q
1q/2011
2q
3q
80
60
40
20
/2
01
1
1q
1q
/2
00
9
/2
00
7
1q
/2
00
5
1q
/2
00
3
1q
1q
/2
00
1
/1
99
9
1q
/1
99
7
1q
1q
/1
99
5
0
Conifer Sawlog Prices - Interior
Conifer Sawlog Prices - BC Interior
70
(US$/m3)
60
Spruce/pine/fir
US$/m3ub
50
1q/2010
2q
3q
4q
1q/2011
2q
3q
40
30
20
10
11
1q
/2
0
09
1q
/2
0
07
1q
/2
0
05
1q
/2
0
03
1q
/2
0
1q
/2
0
99
1q
/1
9
97
95
1q
/1
9
1q
/1
9
01
0
Conifer Pulpwood Prices
(US$/odmt)
Conifer Wood Fiber Prices In Western Canada
160
Roundwood
Chips
140
US$/odmt - Delivered
120
100
1q/2010
2q
3q
4q
1q/2011
2q
3q
80
60
40
20
0
88
1q
90
1q
9
1q
2
94
1q
96
1q
9
1q
8
00
1q
02
1q
1q
04
06
1q
08
1q
1q
10
Chips
Rdwd
84
101
104
103
106
110
111
89
92
91
94
102
122
124
Wood costs of total cash costs - pulp industry
Wood costs of total cash costs - pulp (%)
Western Canada
(Source: Fisher International)
60
50
Percent of total cost (%)
35
37
37
39
41
43
46
1q/2010
2q
3q
4q
1q/2011
2q
40
30
20
47.5
47.0
51.2
51.5
52.7
54.3
10
© 2011 Wood Resources International
1Q
/1
1
1Q
/1
0
1Q
/0
9
1Q
/0
8
1Q
/0
7
1Q
/0
6
1Q
/0
5
0
3Q/2011
23
Wood Resource
Quarterly
Canada East - Sawlog and Pulpwood Prices
Conifer Sawlog Prices
(US$/m3)
Conifer Sawlog Prices - Quebec
80
70
Mixed
60
US$/m3ub
50
1q/2010
2q
3q
4q
1q/2011
2q
3q
40
30
20
10
1q
/2
0
11
09
07
1q
/2
0
1q
/2
0
1q
/2
0
05
03
01
1q
/2
0
1q
/1
9
1q
/2
0
99
97
1q
/1
9
1q
/1
9
95
0
Conifer Pulpwood Prices
(US$/odmt)
Conifer Wood Fiber Prices - Eastern Canada
180
69
70
69
71
73
74
73
160
US$/odmt - Delivered
140
1q/2010
2q
3q
4q
1q/2011
2q
3q
100
Roundwood
80
Chips
60
20
10
1q
08
1q
06
04
1q
1q
02
1q
00
1q
98
96
1q
1q
94
1q
92
1q
90
1q
1q
88
0
127
122
121
124
123
125
124
150
148
147
151
155
158
156
Non-Conifer Pulpwood Prices
(US$/odmt)
Non-Conifer Wood Fiber Prices - Eastern Canada
140
120
Chips
Roundwood
US$/odmt - Delivered
Rdwd
120
40
100
1q/2010
2q
3q
4q
1q/2011
2q
3q
80
60
40
0
88
1q
Rdwd
Chips
20
1q
90
9
1q
2
9
1q
4
1q
96
1q
98
0
1q
0
1q
02
1q
04
1q
06
0
1q
8
1q
10
79
81
80
82
82
84
83
89
90
89
92
94
95
94
Wood costs of total cash costs - pulp industry
Wood costs of total cash costs - pulp (%)
Eastern Canada
(Source: Fisher International)
60
50
Percent of total cost (%)
Chips
1q/2010
2q
3q
4q
1q/2011
2q
40
30
20
48.5
48.8
49.4
50.3
49.2
51.7
10
24
1Q
/1
1
1Q
/1
0
1Q
/0
9
1Q
/0
8
1Q
/0
7
1Q
/0
6
1Q
/0
5
0
3Q/2011
© 2011 Wood Resources International
Wood Resource
Quarterly
Sawlog and Pulpwood Markets 3Q/11 - Europe & Russia
Falling sawlog prices throughout Europe but still Log exports from Russia is picking up
higher than 12 months ago
Log exports from Russia have been in sharp decline
Wood costs have gone down for many sawmills from 2006 to 2010, falling from 51 million m3 to 22
throughout the continent in the 3Q, mostly due to slow- million m3 during the five-year period. This year howing lumber sales and an expectation of lower produc- ever, the trend has turned and the total shipments may
tion levels in the coming six months.
reach close to 24 million m3. The log export market is
still very important to many companies and their emIn the Nordic countries, there were a number of an- ployees in the Russian Federation, as about 20 pernouncement of curtailments for the fourth quarter. Al- cent of the softwood and 10 percent of the hardwood
though sawlog prices fell in a majority of the ten coun- harvests are shipped out of the country.
tries covered by the WRQ in the third quarter, they
were still higher than the same quarter last year. For This recent upward trend can be expected to continue
most markets, log prices have come up between $15- in 2012 as Russian log export taxes are likely to be
25/m3 during the past 12 months, with only NW Rus- reduced. During discussions between Russian and EU
sia and Norway seeing lower price increases.
representatives in December last year, it became apparent that Russia has been pressured to reduce log
Many of the continent’s sawmills are currently paying export taxes if the country wants to join the World
close to the highest sawlog prices seen in at least 17 Trade Organization (WTO). However, it was still not
years, and this is occurring at a time when lumber prices clear as of late October exactly what the new log exare far from any record highs, and are even in decline port taxes may be and when they will be implemented.
in some markets. Because of the weakening lumber
demand it can be expected that log prices will soften Softwood log taxes may fall to somewhere between
during the winter months.
5-10 percent of the value of the logs, and hardwood
log taxes will probably be lower than those for softWood fiber costs in France close to all time highs wood. Even if log export taxes do decline, it is not
likely that log buyers from other countries will subIn Northeastern France, log prices have long been
stantially increase their sourcing of logs from Russia.
higher than in the Southern region of the country beLog export volumes will probably never come back
cause of the influence of competition from sawmills
to the high levels seen in 2005 before the higher taxes
and pulp mills in Belgium and Germany. Both softwere implemented.
wood and hardwood pulplog prices in the northeast
have moved up substantially the past few years. SoftHigher supply and lower demand reduces sawlog
wood pulplog prices averaged about $100/odmt in
and pulplog prices in Russia in the 3Q
2009 and were close to an all-time-high of US$160/
odmt in the 3Q/11.
Sawmills in Northwest Russia have cut back production levels in the 3Q because of reduced domestic
Pine log prices in Southern France have been about demand for lumber. Higher harvesting activities during
ten percent lower both because of less competition the summer months have also contributed to lower log
but also because of large volumes of damaged timber costs both for Russian sawmills and pulpmills. Sawlog
from the storm “Klaus” last year. The lower pulplog prices fell about 12 percent to an average of $61/m3
and chip prices in the South has meant that some pulp in the 3Q. Pulplog prices fell about ten percent to $37/
mills and board mills in Northern France have been m3 for softwood and $30/m3 for hardwood pulplogs.
hauling wood from this region.
Russian pulp mills currently have some of the lowest
wood fiber costs in the world.
© 2011 Wood Resources International
3Q/2011
25
Wood Resource
Quarterly
Finland - Sawlog and Pulpwood Prices
Conifer Sawlog Prices
(US$/m3)
Conifer Sawlog Prices - Finland
140
120
Pine
Spruce
101
99
103
107
104
117
116
102
101
105
109
106
119
118
US$/m3ub
100
1q/2010
2q
3q
4q
1q/2011
2q
3q
80
60
Pine
Spruce
40
20
1q
/2
01
1
1q
/2
00
9
1q
/2
00
7
1q
/2
00
5
1q
/2
00
3
1q
/2
00
1
1q
/1
99
9
1q
/1
99
7
1q
/1
99
5
0
Pulplog Prices
(US$/odmt)
Wood Fiber Prices - Finland
250
225
Conifer Roundwood
US$/odmt - Delivered
200
Conifer
Non-Conifer Roundwood
Non-Con
175
1q/2010
2q
3q
4q
1q/2011
2q
3q
150
125
100
75
50
25
1q
10
08
06
1q
04
1q
1q
02
1q
00
98
1q
1q
1q
96
94
1q
92
90
1q
1q
1q
88
0
123
115
122
129
128
143
141
Wood costs of total cash costs - pulp industry
Wood costs of total cash costs - pulp (%)
Finland
(Source: Fisher International)
70
60
Percent of total cost (%)
155
146
154
162
163
181
179
1q/2010
2q
3q
4q
1q/2011
2q
50
40
30
20
63.2
64.1
61.1
61.9
62.3
64.6
10
1Q
/1
1
1Q
/1
0
1Q
/0
9
1Q
/0
8
1Q
/0
7
1Q
/0
6
1Q
/0
5
0
Exchange Rate: Finnish Markka/EURO per US$
8.0
Fim/US$
7.0
Exchange Rate (Euros/US$)
1.4
1q/2010
2q
3q
4q
1q/2011
2q
3q
1.2
US$/Euro
6.0
FIM/US$
0.8
4.0
0.6
EURO/US$
1.0
5.0
3.0
0.4
2.0
08
10
1q
1q
06
1q
02
04
1q
1q
00
1q
98
1q
96
1q
1q
1q
1q
1q
26
94
0.0
92
0.0
90
0.2
88
1.0
0.722
0.785
0.776
0.736
0.732
0.694
0.707
3Q/2011
© 2011 Wood Resources International
Wood Resource
Quarterly
Norway - Sawlogs and Pulpwood Prices
Conifer Sawlog Prices
(US$/m3)
Conifer Sawlog Prices - Norway
140
120
US$/m3ub
100
1q/2010
2q
3q
4q
1q/2011
2q
3q
80
60
Pine
Spruce
40
20
1q
/2
01
1
1q
/2
00
9
1q
/2
00
7
1q
/2
00
5
1q
/2
00
3
1q
/2
00
1
1q
/1
99
9
1q
/1
99
7
1q
/1
99
5
0
1q/2010
2q
3q
4q
1q/2011
2q
3q
200
US$/odmt - Delivered
Spruce
93
90
92
97
95
99r
98
Conifer Pulpwood Prices
(US$/odmt)
Conifer Wood Fiber Prices - Norway
250
Pine
92
92
92
100
98
102r
99
150
100
50
145
153
154
161
186
196
195
10
1q
06
04
08
1q
1q
1q
02
1q
00
98
1q
1q
96
1q
94
92
1q
1q
1q
1q
88
90
0
Wood costs of total cash costs - pulp industry
Wood costs of total cash costs - pulp (%)
Norway
(Source: Fisher International)
70
60
1q/2010
2q
3q
4q
1q/2011
2q
Percent of total cost (%)
50
40
30
20
51.1
50.6
50.8
50.8
54.3
55.1
10
1Q
/1
1
1Q
/1
0
1Q
/0
9
1Q
/0
8
1Q
/0
7
1Q
/0
6
1Q
/0
5
0
Exchange Rate (Kroner/US$)
Historical Exchange Rate: Norwegian Krone/US$
10
1q/2010
2q
3q
4q
1q/2011
2q
3q
9
8
Nkr/US$
7
6
5
4
3
2
5.86
6.22
6.18
5.93
5.73
5.43
5.49
1
10
1q
08
06
© 2011 Wood Resources International
1q
1q
04
1q
02
1q
98
00
1q
1q
96
1q
92
90
94
1q
1q
1q
1q
88
0
3Q/2011
27
Wood Resource
Quarterly
Sweden - Sawlog and Pulpwood Prices
Conifer Sawlog Prices
(US$/m3)
Conifer Sawlog Prices - Sweden
120
100
1q/2010
2q
3q
4q
1q/2011
2q
3q
US$/m3ub
80
60
Pine
Spruce
40
20
/2
01
1
9
1q
/2
00
7
1q
/2
00
1q
/2
00
Conifer Roundwood
Conifer Chips
Non-Conifer Roundwood
200
150
1q/2010
2q
3q
4q
1q/2011
2q
3q
100
50
10
1q
08
1q
06
1q
04
02
1q
1q
00
1q
98
1q
96
1q
1q
94
92
1q
90
1q
1q
88
0
159
151
163
175
183
190
184
150
151
158
174
186
195
188
114
114
119
131
139
145
141
Wood costs of total cash costs - pulp industry
Wood costs of total cash costs - pulp (%)
Sweden
(Source: Fisher International)
70
60
1q/2010
2q
3q
4q
1q/2011
2q
50
Percent of total cost (%)
Spruce
90
88
100
109
113
112r
108
Pulpwood Prices
(US$/odmt)
Chips
Roundwood
Con
Con Non-c
Wood Fiber Prices - Sweden
250
US$/odmt - Delivered
5
3
1q
1q
1q
/2
00
/2
00
1
9
/1
99
1q
1q
1q
/1
99
/1
99
7
5
0
Pine
93
90
100
111
113
114r
110
40
30
20
59.6
60.8
59.7
60.6
61.4
66.3
10
1Q
/1
1
1Q
/1
0
1Q
/0
9
1Q
/0
8
1Q
/0
7
1Q
/0
6
1Q
/0
5
0
Exchange Rate (Kronor/US$)
Exchange Rate: Swedish Krona per US$
12
1q/2010
2q
3q
4q
1q/2011
2q
3q
10
Skr/US$
8
6
4
2
7.20
7.57
7.28
6.78
6.49
6.25
6.46
28
10
1q
08
1q
06
1q
02
04
1q
1q
00
1q
98
1q
94
96
1q
1q
92
1q
90
1q
1q
88
0
3Q/2011
© 2011 Wood Resources International
Wood Resource
Quarterly
France - Pulpwood Prices
Conifer Pulplog Prices
(US$/odmt)
Conifer Wood Fiber Prices - France
200
180
Roundwood
US$/odmt - Delivered
160
Chips
1q/2010
2q
3q
4q
1q/2011
2q
3q
140
120
100
80
60
40
20
0
8
1q
8
1q
90
1q
98
1q
96
1q
94
1q
92
00
1q
02
1q
0
1q
4
1q
06
1q
08
1q
Roundwood
125
131
138
146
157
165
159
10
Non-Conifer Pulplog Prices
(US$/odmt)
Non-Conifer Wood Fiber Prices - France
140
Chips
132
137
141
146
163
172
169
US$/odmt - Delivered
120
1q/2010
2q
3q
4q
1q/2011
2q
3q
100
80
60
40
20
90
88
97
106
112
118
116
0
1q
88
1q
90
9
1q
2
9
1q
4
1q
96
1q
98
0
1q
0
0
1q
2
1q
04
1q
06
1q
08
1
1q
0
Wood costs of total cash costs - pulp (%)
Wood costs of total cash costs - pulp industry
(Source: Fisher International)
France
70
Percent of total cost (%)
60
1q/2010
2q
3q
4q
1q/2011
2q
50
40
30
20
52.5
54.2
55.8
56.6
57.9
58.8
10
8.0
1Q
/1
1
1Q
/1
0
1Q
/0
9
1Q
/0
8
1Q
/0
7
1Q
/0
6
1Q
/0
5
0
Historical Exchange Rate: French Franc/EURO per US$
Exchange Rate (Euro/US$)
1.2
FF/US$
7.0
1.0
EURO/US$
6.0
FF/US$
0.6
4.0
EURO/US$
0.8
5.0
3.0
0.4
2.0
0.2
1q/2010
2q
3q
4q
1q/2011
2q
3q
0.722
0.785
0.776
0.736
0.732
0.694
0.707
1.0
10
08
06
© 2011 Wood Resources International
1q
1q
1q
02
00
98
96
94
04
1q
1q
1q
1q
1q
1q
92
1q
90
0.0
1q
1q
88
0.0
3Q/2011
29
Wood Resource
Quarterly
Austria - Sawlog and Pulpwood Prices
Conifer Sawlogs
(US$/m3)
Conifer Sawlog Prices - Austria
160
140
Spruce
120
1q/2010
2q
3q
4q
1q/2011
2q
3q
US$/m3ub
100
80
60
40
20
01
1
1q
/2
00
9
1q
/2
00
7
1q
/2
1q
/2
00
5
00
3
1q
/2
00
1
1q
/2
99
9
1q
/1
1q
/1
1q
/1
99
7
99
5
0
Pulpwood Prices
(US$/odmt)
Pulpwood Prices - Austria
250
Conifer
US$/odmt - Delivered
200
1q/2010
2q
3q
4q
1q/2011
2q
3q
150
100
50
11
10
1q
1q
09
1q
08
07
1q
1q
1q
06
05
1q
04
03
1q
1q
02
01
1q
1q
00
1q
99
1q
98
97
1q
96
1q
1q
1q
95
0
162
151
161
174
190
203
199
Wood costs of total cash costs - pulp (%)
Wood costs of total cash costs - pulp industry
(Source: Fisher International)
Austria
80
70
Percent of total cost (%)
120
117
129
137
141
150r
149
1q/2010
2q
3q
4q
1q/2011
2q
60
50
40
30
20
64.1
65.2
63.5
66.6
69.5
71.2
10
1Q
1Q
/1
1
/1
0
/0
9
1Q
1Q
/0
8
/0
7
1Q
1Q
1Q
/0
5
/0
6
0
Exchange Rate: Austria Shillings/EURO per US$
18
Exchange Rate (Euro/US$)
1.2
1q/2010
2q
3q
4q
1q/2011
2q
3q
Shilling/US$
16
1.0
EURO/US$
14
0.8
10
0.6
8
6
EURO/US$
Shillings/US$
12
0.4
4
0.722
0.785
0.776
0.736
0.732
0.694
0.707
0.2
2
11
10
1q
1q
09
08
1q
1q
07
06
1q
1q
05
04
1q
1q
03
1q
02
01
1q
1q
00
99
1q
1q
98
1q
97
1q
1q
1q
30
96
0.0
95
0
3Q/2011
© 2011 Wood Resources International
Wood Resource
Quarterly
Germany - Sawlog and Pulpwood Prices
Conifer Sawlogs
(US$/m3)
Conifer Sawlog Prices - Germany
180
160
Spruce
140
US$/m3ub
120
1q/2010
2q
3q
4q
1q/2011
2q
3q
100
80
60
40
20
1q
/2
01
1
1q
/2
00
9
1q
/2
00
7
Pulpwood Prices
(US$/odmt)
Chips Roundwood
Con
Con Non-c
Pulpwood Prices - Germany
250
Conifer pulplogs
Conifer chips
Non-conifer pulplogs
200
US$/odmt - Delivered
1q
/2
00
5
1q
/2
00
3
1q
/2
00
1
1q
/1
99
9
1q
/1
99
5
1q
/1
99
7
0
150
1q/2010
2q
3q
4q
1q/2011
2q
3q
100
50
10
1q
08
06
1q
1q
04
1q
02
1q
00
98
1q
96
1q
1q
94
1q
92
90
1q
1q
1q
88
0
163
157
169
171
172
182
178
144
137
144
160
166
175
172
(Source: Fisher International)
Germany
60
Percent of total cost (%)
159
159
170
179
193
192
190
Wood costs of total cash costs - pulp (%)
Wood costs of total cash costs - pulp industry
70
133
131
140
154
150
166
166
1q/2010
2q
3q
4q
1q/2011
2q
50
40
30
20
57.7
60.2
60.0
58.1
61.8
61.2
10
/1
1
1Q
/1
0
1Q
/0
9
1Q
/0
8
1Q
/0
7
1Q
/0
6
1Q
1Q
/0
5
0
Exchange Rate: German Marks/EURO per US$
2.5
DM/US$
2.0
Exchange Rate (Euro/US$)
1.2
1.0
EURO/US$
0.6
1.0
EURO/US$
DM/US$
0.8
1.5
0.4
0.5
10
08
© 2011 Wood Resources International
1q
1q
06
1q
02
04
1q
1q
00
1q
96
94
98
1q
1q
1q
92
1q
90
0.0
1q
88
0.722
0.785
0.776
0.736
0.732
0.694
0.707
0.2
0.0
1q
1q/2010
2q
3q
4q
1q/2011
2q
3q
3Q/2011
31
Wood Resource
Quarterly
Spain - Pulpwood Prices
Conifer Pulpwood Prices
(US$/odmt)
Conifer Wood Fiber Prices - Spain
150
135
Rdwd
US$/odmt - Delivered
120
105
1q/2010
2q
3q
4q
1q/2011
2q
3q
90
75
60
45
30
15
10
08
1q
1q
06
04
1q
02
1q
1q
00
98
1q
1q
96
94
1q
1q
92
90
1q
1q
1q
88
0
Non-Conifer Pulplog Prices
(US$/odmt)
Non-Conifer Wood Fiber Prices - Spain
180
96
88
96
109
136
123
117
160
1q/2010
2q
3q
4q
1q/2011
2q
3q
US$/odmt - Delivered
140
120
100
80
60
40
20
134
123
130
144
148
156
146
08
10
1q
06
1q
04
1q
1q
1q
02
00
1q
98
1q
1q
96
94
92
1q
1q
90
1q
1q
88
0
Wood costs of total cash costs - pulp (%)
Wood costs of total cash costs - pulp industry
(Source: Fisher International)
Spain
80
Percent of total cost (%)
70
1q/2010
2q
3q
4q
1q/2011
2q
60
50
40
30
20
66.6
67.2
65.7
69.3
70.4
71.6
10
11
1Q
/
/1
0
1Q
1Q
/0
9
08
1Q
/
/0
7
1Q
1Q
1Q
/0
5
/0
6
0
Exchange Rate: Spanish Pesetas/EURO per US$
200
180
Pts/US$
160
EURO/US$
Exchange Rate (Euro/US$)
1.2
1.0
140
Pts/US$
100
0.6
80
0.4
60
40
EURO/US$
0.8
120
1q/2010
2q
3q
4q
1q/2011
2q
3q
0.722
0.785
0.776
0.736
0.732
0.694
0.707
0.2
20
32
08
10
1q
1q
06
1q
04
1q
02
1q
00
1q
98
1q
96
1q
92
94
1q
1q
90
0.0
1q
1q
88
0
3Q/2011
© 2011 Wood Resources International
Wood Resource
Quarterly
Estonia, Latvia, Czech Republic & Poland - Sawlog Prices
Conifer Sawlog Prices
(US$/m3)
Conifer Sawlog Prices - Estonia
160
140
Spruce
120
US$/m3ub
Pine
1q/2010
2q
3q
4q
1q/2011
2q
3q
100
80
60
40
20
1q
/1
1
1q
/0
9
1q
/0
7
1q
/0
5
1q
/0
3
1q
/0
1
1q
/9
9
1q
/9
7
1q
/9
5
0
Pine
76
75
80
85
77
83
84
Conifer Sawlog Prices
(US$/m3)
Conifer Sawlog Prices - Latvia
140
Spruce
72
71
75
80
84
88r
90
120
Spruce
1q/2010
80
2q
76
3q
81
4q
89
1q/2011
92
2q
96
3q
96
US$/m3ub
100
80
60
40
Spruce
Pine
20
140
1q
/1
1
1q
/1
0
1q
/0
9
1q
/0
8
1q
/0
7
1q
/0
6
1q
/0
5
1q
/0
4
1q
/0
3
1q
/0
2
1q
/0
1
1q
/0
0
0
Pine
73
70
74
81
85
88
86
Conifer Sawlog Prices
(US$/m3)
Conifer Sawlog Prices - Czech Republic
120
US$/m3ub
100
1q/2010
2q
3q
4q
1q/2011
2q
80
60
40
20
120
1q
/1
1
1q
/0
9
1q
/0
7
1q
/0
5
1q
/0
3
1q
/0
1
1q
/9
9
1q
/9
7
1q
/9
5
0
Conifer Sawlog Prices
(US$/m3)
Conifer Sawlog Prices - Poland
100
1q/2010
2q
3q
4q
1q/2011
2q
3q
US$/m3ub
80
60
40
20
1q
/9
8
1q
/9
9
1q
/0
0
1q
/0
1
1q
/0
2
1q
/0
3
1q
/0
4
1q
/0
5
1q
/0
6
1q
/0
7
1q
/0
8
1q
/0
9
1q
/1
0
1q
/1
1
0
© 2011 Wood Resources International
Spruce
95
96
104
119
123r
127
3Q/2011
Pine
70
66
69
77
91
101
95
33
Wood Resource
Quarterly
Northwest Russia - Sawlog and Pulpwood Prices
Conifer Sawlog Prices
(US$/m3)
Conifer Sawlog Prices - Northwest Russia
90
80
70
US$/m3ub
60
50
40
30
Pine
Spruce
20
10
/1
1
Spruce
54
57
59
55
59
70
61
Pulplog Prices
(US$/odmt)
Wood Fiber Prices - Northwest Russia
160
Pine
54
57
59
55
59
70
61
1q
/1
0
/0
9
1q
1q
/0
7
/0
8
1q
1q
/0
5
/0
6
1q
1q
/0
4
1q
/0
3
/0
2
1q
1q
1q
/0
1
0
1q/2010
2q
3q
4q
1q/2011
2q
3q
140
Conifer roundwood
US$/odmt - Delivered
120
Non-conifer roundwood
1q/2010
2q
3q
4q
1q/2011
2q
3q
100
80
60
40
20
Wood costs of total cash costs - pulp industry
60
Percent of total cost (%)
Wood costs of total cash costs - pulp (%)
(Source: Fisher International)
Russia
70
Non-Con
56
60
60
54
60
66
61
1q
/1
1
1q
/1
0
1q
/0
9
1q
/0
8
1q
/0
7
1q
/0
6
1q
/0
5
1q
/0
4
1q
/0
3
1q
/0
2
1q
/0
1
0
Conifer
81
94
94
96
94
110
96
1q/2010
2q
3q
4q
1q/2011
2q
50
40
30
20
53.8
53.9
57.5
54.9
54.4
59.5
10
1Q
/1
1
1Q
/1
0
1Q
/0
9
1Q
/0
8
1Q
/0
7
1Q
/0
6
1Q
/0
5
0
Historical Exchange Rate: Russian Rouble per US$
40
1q/2010
2q
3q
4q
1q/2011
2q
3q
35
30
RUB/US$
Exchange Rate (Roubles/US$)
25
20
15
10
29.91
30.36
30.71
30.74
29.28
27.94
29.00
5
34
1q
/1
1
1q
/1
0
1q
/0
9
1q
/0
8
1q
/0
7
1q
/0
6
1q
/0
5
1q
/0
4
1q
/0
3
1q
/0
2
1q
/0
1
0
3Q/2011
© 2011 Wood Resources International
Wood Resource
Quarterly
Sawlog and Pulpwood Markets 3Q/11 - Latin America
million tons
Wood chips exports from Latin America on track and China. There are expectations that Chile will inof reaching a new record in 2011
crease its shipments to China in the coming years because of higher demand from new pulp mills in the
Wood chip exports from Latin America are on track
country.
to reach a record high of almost eight million tons in
2011. This would be an increase of seven percent from
Pulp exports from Brazil leveling off for the first
last year and of almost 60 percent higher from 2006
time in many years
(see graph). Chile is by far the biggest exporter, accounting for two-thirds of the total shipments from the After many years of steady expansion of pulp capaccontinent, while Brazil and Uruguay both account for ity and higher exports, this year’s exports appear to
about 16 percent each. In the 3Q/11, for the first time, be leveling out with pulp export volumes practically
Chile was the largest supplier of hardwood chips to the same the first nine months as last year. However,
Japan, pushing Australia down to the second place.
the total export revenues from pulp and paper from
Brazil grew by 8.8 percent to $4.8 billion during the
first eight months of 2011, according to Bracelpa. In
Wood chip export from Latin America
6
the coming years, it can be expected that exports of
5
Eucalyptus pulp will increase again. There are currently plans for another four to five new large-scale
4
Chile
market pulp projects in Brazil, all Eucalyptus pulp, with
Brazil
3
Uruguay
start-ups targeted for 2012-14. A majority of the fiber
2
for these plants will be sourced from company-owned
1
plantations established over the past few years.
0
2004
2005
2006
2007
2008
2009
2010
2011e
With only a small increase in demand for wood fiber
this fall, prices for pulpwood have gone up just a few
percent. In the 3Q/11, wood prices reached new
record highs - the average pine pulplog price was
US$116/odmt and Eucalyptus logs averaged US$129/
odmt. Current price levels are about 20 percent higher
than a year ago.
Historically, between 80-90 percent of the exported
wood chips from Latin America have been destined
for Japanese pulp mills but during the past few years
there has been a diversification of consumers. Although
shipments to Japan have gone up by over 30 percent
from 2006, the share of total exports has declined and
is currently around 70 percent.
Record exports of chips push Eucalyptus pulplog
prices upward in Chile
The biggest change from five years ago is that pulp
Chip exports from Chile are expected to reach a new
mills in Europe have been buying much more Eucarecord of around 4.6 million tons this year, or almost
lyptus chip, particularly from Chile and Uruguay. This
30 percent higher than in 2009. The higher demand
year, total shipments to Europe may reach over 1.8
for Eucalyptus logs at chipping facilities at the ports
million tons, which is about the same as last year but
has pushed pulplog prices upward the past year. In
more than a doubling from 2009. The three major imthe 3Q/11, average hardwood log prices for the doporting countries in Europe are Spain, Portugal and
mestic market were around US$89/odmt, up from
Norway, In addition, there have also been a few shipUS$65/odmt a year ago. Although a strengthening
ments to Finnish pulp mills lately.
Peso has contributed to higher costs in US dollar terms,
log costs have also gone up over 25 percent in the
New destinations for Eucalyptus chips from Latin
local currency since last fall.
America the past five years include Morocco, Turkey
© 2011 Wood Resources International
3Q/2011
35
Wood Resource
Quarterly
Brazil - Sawlog and Pulpwood Prices
Conifer Sawlog Prices - Pine
(US$/m3)
Conifer Sawlog Prices - Brazil
90
80
1q/2010
2q
3q
4q
1q/2011
2q
3q
US$/m3ub
70
60
50
40
30
20
10
64
65
67
71
74
78
76
1q
/1
99
1q 5
/1
99
1q 6
/1
99
1q 7
/1
99
1q 8
/1
99
1q 9
/2
00
1q 0
/2
00
1q 1
/2
00
1q 2
/2
00
1q 3
/2
00
1q 4
/2
00
1q 5
/2
00
1q 6
/2
00
1q 7
/2
00
1q 8
/2
00
1q 9
/2
01
1q 0
/2
01
1
0
Pulpwood Prices - (US$/odmt)
Wood Fiber Prices - Brazil
180
160
US$/odmt - Delivered
140
Conifer Roundwood
Conifer Chips
Non-Con Roundwood
120
100
1q/2010
2q
3q
4q
1q/2011
2q
3q
80
60
40
20
80
Roundwood
Con Non-c
127
128
132
138
144
153
152
94
95
98
103
107
115
116
100
101
105
112
116
126
129
1q
1q
10
08
06
1q
1q
1q
04
02
00
98
1q
1q
96
94
1q
1q
1q
1q
92
90
0
Chips
Con
Wood costs of total cash costs - pulp industry
Wood costs of total cash costs - pulp (%)
Brazil
(Source: Fisher International)
70
1q/2010
2q
3q
4q
1q
2q
Percent of total cost (%)
60
50
40
30
20
68.6
68.5
67.8
69.6
70.9
72.7
10
1
/1
1Q
1Q
1Q
/1
0
/0
9
8
1Q
/0
7
1Q
/0
/0
6
1Q
1Q
/0
5
0
Exchange Rate (Reais/US$)
Exchange Rate: Brazilian Reais per US$
4.0
1q/2010
2q
3q
4q
1q/2011
2q
3q
Brazilian Reais per US$
3.5
3.0
2.5
2.0
1.5
1.0
1.809
1.800
1.759
1.702
1.660
1.593
1.625
0.5
36
10
11
1q
1q
09
1q
07
08
1q
06
1q
1q
04
05
1q
1q
02
03
1q
01
1q
1q
99
00
1q
1q
97
98
1q
1q
95
96
1q
1q
1q
94
0.0
3Q/2011
© 2011 Wood Resources International
Wood Resource
Quarterly
Chile - Sawlog and Pulpwood Prices
Conifer Sawlog Prices
(US$/m3)
Pine
Conifer Sawlog Prices - Chile
60
50
1q/2010
2q
3q
4q
1q/2011
2q
3q
US$/m3ub
40
30
20
10
1q
/
19
9
1q 5
/1
99
1q 6
/1
99
1q 7
/1
99
1q 8
/1
99
1q 9
/2
00
1q 0
/2
00
1q 1
/2
00
1q 2
/2
00
1q 3
/2
00
1q 4
/2
00
1q 5
/2
00
1q 6
/2
00
1q 7
/2
00
1q 8
/2
00
1q 9
/2
01
1q 0
/2
01
1
0
40
42
43
45
46
47
45
Pulplog Prices
(US$/odmt)
Conifer Non-Con
Wood Fiber Prices - Chile
100
90
US$/odmt - Delivered
80
1q/2010
2q
3q
4q
1q/2011
2q
3q
70
60
50
40
30
Conifer Roundwood
20
Non-conifer Roundwood
10
08
10
Wood costs of total cash costs - pulp (%)
Wood costs of total cash costs - pulp industry
70
61
63
65
73
79
80
89
1q
06
1q
1q
04
02
1q
00
1q
1q
98
94
96
1q
1q
92
1q
1q
1q
90
0
69
67
70
78
87
88
91
(Source: Fisher International)
Chile
Percent of total cost (%)
60
1q/2010
2q
3q
4q
1q/2011
2q
50
40
30
20
58.8
58.5
57.0
59.0
61.3
61.4
10
/1
1
1Q
/1
0
1Q
/0
9
1Q
/0
8
1Q
/0
7
1Q
/0
6
1Q
1Q
/0
5
0
Exchange Rate (Pesos/US$)
Historical Exchange Rate: Chilean Peso/US$
800
1q/2010
2q
3q
4q
1q/2011
2q
3q
Chilean Peso/US$
700
600
500
400
300
200
529
541
522
485
476
468
471
100
0
9
1q
0
92
1q
94
1q
1q
96
98
1q
0
1q
0
1q
02
04
1q
0
1q
6
© 2011 Wood Resources International
1q
08
10
1q
3Q/2011
37
Wood Resource
Quarterly
Sawlog and Pulpwood Markets 3Q/11 - Asia & Oceania
Log exports from New Zealand up by 25 percent sia were the major suppliers to China, together accounting for almost 90 percent all imports. Chip imLog exports from New Zealand picked up in Sepports in just the first eight months of 2011 already equal
tember after a few months of slower activity. The deto total volume of imports in all of 2010. This upward
cline in shipments occurred mainly because of very
trend is expected to continue in 2012 because the
high log inventories in China during the early summer
Chinese pulp industry is in expansion mode.
months. Between May and June, exports from New
Zealand to China were down by almost 50 percent,
The average value for imported wood chips has steadily
but have since picked up to levels close to early in the
increased, reaching $168/ton in the 2Q/11, or about
year.
18 percent higher than the same quarter last year. Vietnam is the lowest-cost supplier ($156/ton in the 2Q),
Despite the slowdown in sales to the export market in
while the cost for Eucalyptus chips from Australia were
June and July, this year will still be a record-year for
at the high-end, averaging US$218/ton in the 2Q.
the log exporters in the country. During the first eight
months, total shipments were 25 percent higher than
The forest plantation in Australia is falling
the same period last year (54 percent higher by value)
and total exports for 2011 may reach as high as 13 Only 23,500 hectares of new forest plantations were
million m3, which is more than a doubling from just established in Australia in 2010, the smallest area since
three years ago. It is worth noting that practically half the early 1990’s. Because some older plantations
of the timber harvest in the 2Q was shipped overseas where not replanted, the total plantation area fell slightly
in log form. While log exports have increased sub- last year. There are currently about two million ha of
stantially this year, lumber shipments have been lower forest plantations in the country, of which conifer spethan in 2010. This highlights the concern in the indus- cies account for just over half of the area. Compared
try that domestic sawmills have difficulty competing to ten years ago, the newly established plantations have
for logs with the log export market, and may therefore fallen by over 80 percent. Looking ahead ten years, it
have to reduce production and layoff employees.
is likely that the plantation area will continue to decline
and that most of the reduction will be that of EucalypThe steady increase in log exports the past five years tus plantations.
could very well continue the coming 15 years as the
theoretical harvest level in New Zealand is set to double Softwood chip imports to Japan up, hardwood
to 55 million m3 by 2024. Most observers in the in- imports down in the 2Q
dustry agree that, for a number of reasons, this timber
Softwood chip imports to Japan were up 25 percent
harvest scenario is less likely. Depending on market
quarter-to-quarter reaching 540,000 tons in the 2Q.
conditions, a more realistic level of annual timber harThe US, New Zealand and Australia all increased their
vests in 15 years would be between 30 and 40 million
shipments, while Canadian volumes were down 26
m3 annually. Even this lower harvest outlook alternapercent. The delivered cost in US dollar terms was
tive would increase available log supply from the curalso up, with an average of $218/ton compared to
rent levels by over 50 percent.
$186/ton in the 2Q/10. Hardwood chip imports to
Japan were down four percent in the 2Q/11, with the
Record imports of wood chip to China
biggest decline in Australian chips, which fell from
With the lack of sufficient quality and quantity of do- 754,000 tons in the 1Q to 538,000 tons in the 2Q this
mestic fiber supply, new pulp mills in China are look- year. In contrast, Chile has steadily increased shiping to expand imports of wood chips from plantation- ments of Eucalyptus to Japan and was, for the first
rich countries in Southeast Asia to meet their growing time, the largest chip supplier to Japanese pulp mills in
needs. In the 2Q/11, Vietnam, Thailand and Indone- the 2Q/11.
38
3Q/2011
© 2011 Wood Resources International
Wood Resource
Quarterly
Australia - Pulpwood Prices
Conifer Pulpwood Prices
(US$/odmt)
Conifer Wood Fiber Prices - Australia
135
120
Chips
US$/odmt - Delivered
105
Roundwood
Chips
90
1q/2010
2q
3q
4q
1q/2011
2q
3q
75
60
45
30
15
10
1q
1q
08
06
02
04
1q
1q
1q
98
00
1q
94
96
1q
1q
92
1q
1q
1q
90
0
81
81
86
91
94
102
103
Non-Conifer Pulpwood Prices
(US$/odmt)
Non-Conifer Wood Fiber Prices - Australia
180
85
81
85
92
92
93
93
Rdwd
160
Roundwood
Chips
US$/odmt - Delivered
140
1q/2010
2q
3q
4q
1q/2011
2q
3q
100
80
60
40
20
1q
10
08
1q
06
04
1q
1q
02
1q
98
00
1q
96
1q
1q
94
1q
92
1q
1q
90
0
Rdwd
140
134
139
147
146
156
153
119
114
118
130
132
140
138
Wood costs of total cash costs - pulp (%)
Wood costs of total cash costs - pulp industry
(Source: Fisher International)
Australia
60
1q/2010
2q
3q
4q
1q/2011
2q
50
Percent of total cost (%)
Chips
120
40
30
20
52.4
53.2
52.2
52.3
57.6
60.1
10
1Q
/1
1
1Q
/1
0
1Q
/0
9
1Q
/0
8
1Q
/0
7
1Q
/0
6
1Q
/0
5
0
Exchange Rate (Aus $/US$)
Exchange Rate: A$ per US$
2.5
1q/2010
2q
3q
4q
1q/2011
2q
3q
Australian$/US$
2.0
1.5
1.0
0.5
1.080
1.133
1.109
1.013
1.000
0.940
0.951
© 2011 Wood Resources International
10
1q
08
04
06
1q
1q
1q
00
98
02
1q
1q
1q
96
1q
94
1q
92
1q
1q
90
0.0
3Q/2011
39
Wood Resource
Quarterly
New Zealand - Sawlog and Pulpwood Prices
Conifer Sawlog Prices
(US$/m3)
Conifer Sawlog Prices - New Zealand
90
80
Pine
70
US$/m3ub
60
1q/2010
2q
3q
4q
1q/2011
2q
3q
50
40
30
20
10
1q
/1
99
1q 5
/1
99
1q 6
/1
99
1q 7
/1
99
1q 8
/1
99
1q 9
/2
00
1q 0
/2
00
1q 1
/2
00
1q 2
/2
00
1q 3
/2
00
1q 4
/2
00
1q 5
/2
00
1q 6
/2
00
1q 7
/2
00
1q 8
/2
00
1q 9
/2
01
1q 0
/2
01
1
0
Conifer Pulpwood Prices
(US$/odmt)
Conifer Wood Fiber Prices - New Zealand
140
62
64
67
72
75
83
85
120
Roundwood
Chips
US$/odmt - Delivered
100
1q/2010
2q
3q
4q
1q/2011
2q
3q
80
60
40
20
10
80
82
84
93
99
104
107
(Source: Fisher International)
New Zealand
50
Percent of total cost (%)
103
104
107
113
117
123
129
Wood costs of total cash costs - pulp (%)
Wood costs of total cash costs - pulp industry
60
Rdwd
1q
07
1q
04
1q
01
1q
98
1q
95
1q
92
1q
1q
89
0
Chips
1q/2010
2q
3q
4q
1q/2011
2q
40
30
20
10
45.7
45.6
46.8
48.2
49.4
52.9
1Q
/1
1
/1
0
1Q
1Q
1Q
/0
9
/0
8
/0
7
1Q
/0
6
1Q
1Q
/0
5
0
Exchange Rate (NZ $/US$)
Exchange Rate: NZ$/US$
2.50
1q/2010
2q
3q
4q
1q/2011
2q
3q
2.25
2.00
NZ$/US$
1.75
1.50
1.25
1.00
0.75
0.50
1.412
1.427
1.395
1.320
1.323
1.249
1.200
0.25
40
09
11
1q
1q
07
1q
03
05
1q
1q
01
1q
97
99
1q
1q
95
1q
91
93
1q
1q
1q
89
0.00
3Q/2011
© 2011 Wood Resources International
Wood Resource
Quarterly
China - Sawlog and Pulpwood Prices
Conifer Sawlog Prices
(US$/m3)
Conifer Sawlog Prices - China
250
US$/m3ub
200
150
100
50
3q
/1
1
1q
/1
1
3q
/1
0
1q
/1
0
3q
/0
9
1q
/0
9
3q
/0
8
1q
/0
8
20
03
20
04
20
05
20
0
1q 6
/0
7
3q
/0
7
0
US$/odmt - Delivered
250
1q/2010
2q
3q
4q
1q/2011
2q
3q
200
150
100
50
09
2q
/1
0
3q
/1
0
4q
/1
0
1q
/1
1
2q
/1
1
3q
/1
1
Wood costs of total cash costs - pulp (%)
Wood costs of total cash costs - pulp industry
(Source: Fisher International)
China
70
Percent of total cost (%)
Eucalyptus
193
221
215
231
234
246
285
10
1q
/
4q
/
09
09
3q
/
2q
/
09
08
1q
/
08
4q
/
3q
/
08
07
06
05
04
08
2q
/
1q
/
20
20
20
20
20
03
0
80
Chinese fir
131
150
154
165
170
187
195
Non-Conifer Pulpwood Prices
(US$/odmt)
Eucalyptus Pulpwood Prices - China
300
1q/2010
2q
3q
4q
1q/2011
2q
3q
1q/2010
2q
3q
4q
1q/2011
2q
60
50
40
30
20
68.3
67.8
70.2
71.8
74.9
74.3
10
1
1Q
/1
0
1Q
/1
9
1Q
/0
8
1Q
/0
7
1Q
/0
6
1Q
/0
1Q
/0
5
0
Exchange Rate (Yuan/US$)
Exchange Rate: Yuan/US$
9
8
1q/2010
2q
3q
4q
1q/2011
2q
3q
7
Yuan/US$
6
5
4
3
2
6.84
6.83
6.78
6.67
6.57
6.49
6.40
1
© 2011 Wood Resources International
/1
1
3q
/1
1
1q
/1
0
3q
/1
0
1q
/0
9
3q
/0
9
1q
/0
8
3q
/0
8
1q
/0
7
3q
20
03
20
04
20
05
20
06
1q
/0
7
0
3Q/2011
41
Wood Resource
Quarterly
China - Forest Products Imports
Conifer Sawlog Imports
(million m3)
Softwood log imports to China
9
8
7
million m3
6
Russia
New Zealand
US
Canada
Others
Total
5
4
3
2
1
New Zealand
2Q
4Q
1Q
/1
1
3Q
2Q
4Q
1Q
1Q
Russia
/1
0
3Q
2Q
4Q
/0
9
3Q
2Q
/0
8
4Q
1Q
1Q
3Q
2Q
/0
7
0
Other
Total
Conifer Sawlog Average Value
(US$/m3)
Softwood log imports to China
250
Average value
US$/m3
200
1q/2010
2q
3q
4q
1q/2011
2q r
3q est
150
100
50
Source: Customs data
New Zealand
US
e
3Q
2Q
1Q
/1
1
4Q
3Q
2Q
/1
0
4Q
1Q
1Q
3Q
2Q
/0
9
4Q
3Q
2Q
1Q
/0
8
0
Russia
Total
1600
1400
1000 odmt
1200
Vietnam
Indonesia
Australia
Thailand
Others
Total
1000
800
600
400
200
250
Indonesia
Thailand
Total
2Q
/1
1
1Q
4Q
3Q
2Q
/1
0
1Q
4Q
3Q
2Q
/0
9
1Q
4Q
3Q
2Q
4Q
/0
8
1Q
3Q
2Q
1Q
/0
7
0
Vietnam
Australia
NZ
128
141
128
137
145
155
146
150
Vietnam
Indonesia
Australia
Thailand
Total
100
50
0
Indonesia
2Q/10
42
3Q
Australia
4Q
Thailand
1Q/11
Total
121
135
135
142
145
161
164
2008 2009 2010 1-8/11
0.7
1.2
2.5
2.2
0.1
0.4
0.6
0.6
0.2
0.6
0.6
0.5
0.1
0.4
0.7
0.8
0
0
0.1
0.1
1.0
2.7
4.4
4.2
2Q/11
Vietnam
US
156
175
168
168
174
197
202
Hardwood Chip Values
(US$/odmt)
Hardwood chip import prices in China 2010-11
200
US$/odmt (port)
Russia
116
128
129
134
138
150
153
Hardwood Chip Imports
(million odmt)
China hardwood chip imports
1800
2008 2009 2010
15.7 13.8 13.1
1.9
4.4
5.9
0.2
0.6
2.6
0.2
0.4
1.2
0.4
0.7
1.0
18.4 19.9 23.8
Total
156
168
218
169
168
Change (%)
Q/Q Y/Y
6.8 18.2
5.7 11.3
6.9 22.5
-2.9 13.4
3.7 18.3
2Q
3Q/2011
© 2011 Wood Resources International
Wood Resource
Quarterly
Indonesia - Pulpwood Prices
Non-Conifer Pulpwood Prices
(US$/odmt)
Non-Conifer Wood Fiber Prices in Indonesia
110
100
90
US$/odmt - Delivered
80
70
60
50
40
30
20
10
11
09
10
1q
1q
07
08
1q
1q
06
1q
05
1q
03
02
01
04
1q
1q
1q
1q
00
1q
99
1q
1q
1q
98
0
(Source: Fisher International)
Indonesia
80
1q/2009
2q
3q
4q
1q/2010
2q
3q
4q
1q/2011
2q
70
60
50
40
30
20
10
56.6
59.0
59.5
67.4
70.3
70.0
70.8
70.9
73.5
75.6
1Q
/1
1
1Q
/1
0
1Q
/0
9
1Q
/0
8
1Q
/0
6
1Q
/0
7
0
1Q
/0
5
60
66
70
74
81
82
83
83
91
100
103
Wood costs of total cash costs - pulp (%)
Wood costs of total cash costs - pulp industry
Percent of total cost (%)
1q/2009
2q
3q
4q
1q/2010
2q
3q
4q
1q/2011
2q
3q
Exchange Rate (Rupiah/US$)
Historical Exchange Rate: Indo. Rupiah/US$
14000
12000
Indo. Rup/US$
10000
8000
6000
4000
2000
11
10
09
08
11637
10621
9993
9492
9273
9153
9048
9037
8832
8559
8552
1q
1q
1q
07
© 2011 Wood Resources International
1q
05
04
03
02
01
00
99
06
1q
1q
1q
1q
1q
1q
1q
1q
1q
1q
98
0
1q/2009
2q
3q
4q
1q/2010
2q
3q
4q
1q/2011
2q
3q
3Q/2011
43
Wood Resource
Quarterly
Japan - Domestic and Imported Sawlog Prices
400
Japan - Sugi
US - Douglas-fir
Russia - Pine
Japan - Pine
350
300
US$/m3ub
Conifer Sawlog Prices
(US$/m3)
Conifer Sawlog Prices - Japan
Sugi
Japan
1q/2010
2q
3q
4q
1q/2011
2q
3q
250
200
150
100
50
2Q/2010-2Q/2011
450
400
US
Canada
Russia
New Zealand
Others
Total
350
300
1000 m3
242
246
262
262
267
291
287
147
140
146
157
187r
191r
186
Conifer Sawlog Imports
(1000 m3)
Conifer sawlog imports to Japan
500
284
285
305
308
308
317r
328
1q
/2
01
1
1q
/2
00
9
1q
/2
00
7
1q
/2
00
5
1q
/2
00
3
1q
/2
00
1
1q
/1
99
9
1q
/1
99
7
1q
/1
99
5
0
127
128
134
146
153
148r
152
D-f
Pine Pine
US Russia Japan
250
200
150
100
2008 2009 2010
1937 1639 1670
773
759 1279
1780
666
437
840
521
737
32
16
10
5362 3601 4139
50
0
US
Russia
2q/10
NZ
3q/10
4q/10
Canada
1q/11
Other
2q/11
Sawlog imports, total
(million m3)
Log Imports to Japan 1995 - 2010
8
Softwood and hardwood
7
million m3
6
5
4
3
2
1
US
SE Asia
44
Russia
New Zealand
09
20
07
20
05
20
03
20
01
20
99
19
97
19
19
95
0
Canada
Other
3Q/2011
2000
2001
2002
2003
2004
2005
2006
2007
2008
2009
2010
15.95
13.91
12.66
11.65
12.68
10.65
10.58
8.97
6.22
4.13
4.67
© 2011 Wood Resources International
Wood Resource
Quarterly
Japan - Conifer Pulpwood Prices
Conifer Chip Prices
(US$/odmt)
Conifer Wood Fiber Prices in Japan
250
225
Domestic Imported
US$/odmt - Delivered
200
1q/2010
2q
3q
4q
1q/2011
2q
3q
175
150
125
100
Chips: Imported
75
Chips: Domestic
50
25
140
139
148
154
155
151
154
186
186
192
197
204
213
221
1q
/1
0
/0
8
1q
/0
6
1q
/0
4
1q
/0
2
1q
1q
/0
0
/9
8
1q
/9
6
1q
/9
4
1q
/9
2
1q
1q
1q
/8
8
/9
0
0
Conifer Chip Imports
(1000 odmt)
Conifer Wood Chip Imports to Japan
1200
2008
1000
Australia
USA
New Zealand
Canada
Fiji
Others
Total
1000 odmt
800
600
400
200
2009
2010
1088
560
731
684
369
660
310
185
280
195
166 192
117
70
136
58
56
18
2452 1406 2017
0
Australia
USA
New Zealand
2007
2008
Canada
2009
Fiji
Others
2010
Exchange Rate (Yen/US$)
Exchange Rate: Japanese Yen/US$
180
1q/2009
2q
3q
4q
1q/2010
2q
3q
4q
1q/2011
2q
3q
160
140
Yen/US$
120
100
80
60
40
20
© 2011 Wood Resources International
0
1q
/1
8
/0
1q
1q
/0
6
4
/0
1q
2
1q
/0
0
/0
1q
1q
/9
8
6
/9
1q
1q
/9
4
2
/9
1q
0
/9
1q
1q
/8
8
0
93.51
97.49
93.69
89.82
90.75
92.17
85.92
82.58
82.25
81.56
77.77
3Q/2011
45
Wood Resource
Quarterly
Japan - Non-Conifer Pulpwood Prices
Non-Conifer Chip Prices
(US$/odmt)
Non-Conifer Wood Fiber Prices in Japan
250
225
Domestic Imported
US$/odmt - Delivered
200
1q/2010
2q
3q
4q
1q/2011
2q
3q
175
150
125
100
Chips: Imported
75
Chips: Domestic
50
25
196
191
204
212
210
217
223
204
199
206
211
213
216
228
1q
/1
0
1q
/0
8
1q
/0
6
1q
/0
4
1q
/0
2
1q
/0
0
1q
/9
8
1q
/9
6
1q
/9
4
1q
/9
2
1q
/9
0
1q
/8
8
0
Non-Conifer Chip Imports
(1000 odmt)
Non-Conifer Wood Chip Imports to Japan
5000
4500
2008
4000
1000 odmt
3500
3000
2500
2000
1500
1000
500
0
Australia
Chile
S. Africa Vietnam
2007
Brazil Thailand Malaysia Uruguay Others
2008
2009
2010
3148 3590
2229 2378
1404 1468
809 1063
581
556
344
617
291
251
265
177
9071 10100
(Source: Fisher International)
Japan
1q/2009
2q
3q
4q
1q/2010
2q
3q
4q
1q/2011
2q
70
Percent of total cost (%)
4464
2351
2161
1071
689
472
357
708
12273
2010
Wood costs of total cash costs (%)
Wood costs of total cash costs - pulp industry
80
Australia
Chile
South Africa
Vietnam
Brazil
Thailand
Malaysia
Others
Total
2009
60
50
40
30
20
10
67.2
69.2
63.5
69.1
67.7
67.9
69.2
69.3
68.0
69.5
46
1
1Q
/1
0
1Q
/1
9
1Q
/0
8
1Q
/0
7
1Q
/0
6
1Q
/0
1Q
/0
5
0
3Q/2011
© 2011 Wood Resources International
Wood Resource
Quarterly
Woodchip import prices to Japan - 2010/2011
(US$ per odmt, CIF)
Conifer wood chips (US$/odmt)
3Q/10
4Q/10
1Q/11
2Q/11
3Q/11e
Australia
193
196
201
223
223
USA
180
190
210
216
237
Canada
201
202
205
223
227
NZ
207
193
207
215
227
Fiji
182
184
192
221
230
Total
192
197
202
218
230
Chg Y/Y (%)
15.5
31.7
12.9
9.7
26.4
19.8
Non-conifer wood chips (US$/odmt)
3Q/10
4Q/10
1Q/11
2Q/11
3Q/11 e
Chg Y/Y (%)
Australia S. Africa
227
201
238
206
247
214
264
215
273
230
20.3
Chile
208
212
216
224
244
14.4
Vietnam Brazil Malaysia Thailand
168
214
155
157
166
217
127
163
164
220
139
167
172
213
158
178
183
237
167
192
17.3
8.9
10.7
7.7
22.3
Total
206
211
210
217
231
12.1
Pacific Rim Wood Fiber Trade - 2Q/2011
(1000 odmt)
Japan
Source
Japan
Taiwan S. Korea
China
China
Total
Softwood Hardwood Hardwood Hardwood Softwood Hardwood
Change (%)
Q/Q
Y/Y
Vietnam
Australia
Chile
Thailand
S. Africa
Indonesia
USA
Brazil
New Zealand
Malaysia
Canada
Fiji
Other
--127
--------224
--105
--54
28
2
440
538
775
168
313
----163
28
51
----11
28
58
--118
--28
---------------
122
----24
-------------------
--41
--------------------9
866
179
--387
--199
------21
----15
1456
943
775
697
313
227
224
163
133
72
54
28
37
49
-23
10
32
-12
-13
93
11
99
-27
-26
-3
-18
48
-28
43
64
-35
21
14
23
71
-15
-4
-33
-46
TOTAL
540
2487
232
146
50
1667
5122
11
12
Change Q/Q
Change Y/Y
25
4
-4
-4
-12
-19
29
0
-7
67
45
63
11
12
Sources: Japan Pulp & Paper Association and Customs data
© 2011 Wood Resources International
3Q/2011
47
Wood Resource
Quarterly
Major Pulp Producing Countries
Top 20 wood-based pulp producing countries in 2009 (million tons):
1.
2.
3.
4.
5.
USA
Canada
Brazil
Sweden
Finland
47.7
17.2
13.3
11.5
8.7
6.
7.
8.
9.
10.
Japan
China
Russia
Chile
Indonesia
8.5
8.0
6.8
5.2
4.9
11.
12.
13.
14.
15.
Germany
Portugal
France
Norway
Spain
2.5
2.5
1.7
1.7
1.7
16.
17.
18.
19.
20.
South Africa
Austria
NZ
India
Australia
1.7
1.5
1.5
1.5
1.2
Note. Countries listed in bold are tracked by the Wood Resource Quarterly and together account for an
estimated 87% of global wood-based pulp production.
Major Conifer Sawnwood Producing Countries
Top 20 conifer sawnwood producing countries in 2009 (million m3):
1.
2.
3.
4.
5.
USA
Canada
Germany
Russia
Sweden
39.6
32.0
19.7
17.1
16.1
6.
7.
8.
9.
10.
China
India
Brazil
Japan
Austria
13.6
9.9e
9.5
9.3
8.3
11.
12.
13.
14.
15.
Finland
France
Chile
Czech R.
S. Korea
8.0
7.7
5.7
4.4
4.2
16.
17.
18.
19.
20.
Turkey
Australia
NZ
Poland
U.K.
3.8
3.7
3.6
2.9
2.8
Note. Countries listed in bold are tracked by the Wood Resource Quarterly and together account for an
estimated 75% of global conifer sawnwood production.
48
3Q/2011
© 2011 Wood Resources International
Wood Resource
Quarterly
Estimated wood fiber consumption by WRQ regions in 2009
(1000 odmt)
Region
Conifer
Chips
Rdwd
US, South
12100
41300
3800
15400
72600
US, Northwest
3610
3170
150
370
7300
Canada, East
6500
1500
1150
2400
11550
Canada, West
6700
1400
min
200
8300
Norway
339
1426
0
90
1855
Sweden
4200
10464
0
2854
17518
Finland
2902
6074
266
4625
13867
France
784
1097
71
585
2537
1358
1972
min
450
3780
Spain
111
296
0
2189
2596
Russia, NW
380
4040
min
3200
7620
Brazil
558
3158
min
20973
24689
Chile
1750
4700
min
3774
10224
New Zealand
850
1550
min
120
2520
Australia
308
1180
100
350
1938
4692
167
min
10411
15270
0
min
0
12500
12500
47142
83494
5537
80491
216664
21.8
38.5
2.6
37.2
100.0
Germany
Japan
Indonesia
Total
Total %
© 2011 Wood Resources International
3Q/2011
Non-Conifer
Chips
Rdwd
Total
49
Wood Resource
Quarterly
Principal Wood Fiber Species and Average Regional Densities
(kg per m3 oven dry wood)
Region
Principal Species
U.S., South
Conifer
Non-Con
U.S., Northwest Conifer
Non-Con
Pinus taeda, elliottii
Quercus, Acer, Nyssa, Liriodendron
Pseudotsuga M., Tsuga spp.
Alnus spp.
509
500
435
370
Canada, East
Picea spp., Abies spp., Pinus banksiana
Betula spp., Populus spp.
Pseudotsuga M., Tsuga spp., Abies spp.,
Pinus contorta, Picea spp.
400
500
Conifer
Conifer
Non-Con
Conifer
Non-Con
Conifer
Non-Con
Conifer
Non-Con
Conifer
Non-Con
Picea spp., Pinus silvestris
Picea spp., Pinus silvestris
Betula spp.
Picea spp., Pinus silvestris
Betula spp.
Picea spp., Pinus spp., Abies spp., Pseudotsuga M.
Quercus spp., Fagus spp.
Picea spp., Abies spp., Larix spp., Pinus silvestris
Fagus spp.
Pinus pinaster., Pseudotsuga M.
Eucalyptus globulus
385
385
510
385
510
410
475
373
510
435
600
Russia, NW
Conifer
Non-Con
Picea spp., Pinus silvestris
Betula spp., Populus tremula
385
500
Brazil
Conifer
Non-Con
Conifer
Non-Con
Pinus taeda, elliottii, Araucaria
Eucalyptus grandis & clones, Acacia spp.
Pinus radiata
Eucalyptus globulus, nitens
500
495
400
600
New Zealand
Australia
Conifer
Conifer
Non-Con
Pinus radiata
Pinus radiata, pinaster, Pseudotsuga M.
Eucalyptus spp.
400
420
550
Japan
Conifer
Non-Con
Mixed
Mixed
455
595
Indonesia
Non-Con
MTH, Acacia spp., Eucalyptus spp.
500
Canada, West
Norway
Sweden
Finland
France
Germany
Spain
Chile
50
Conifer
Non-Con
Conifer
3Q/2011
Density
395
© 2011 Wood Resources International
Wood Resource
Quarterly
Featured articles in the Wood Resource Quarterly
Biomass Market Update - North America
Global Sawlog Market Update
Forest Resource and Industry Profile - Germany
Wood raw-material markets in Europe 2006 - 2007
The global pulp industry is on a roll: an industry sector update
Vol 20 (2007), No. 1
Vol 20 (2007), No. 1
Vol 20 (2007), No. 2
Vol 20 (2007), No. 3
Vol 20 (2007), No. 4
Global trade of wood chips and biomass reach new records in 2007
Russia - From log exporter to forest productz manufacturer
Vietnam - The fourth largest hardwood chip exporter in the world
The global wood pellet market is expanding rapidly
Vol 21 (2008), No. 1
Vol 21 (2008), No. 2
Vol 21 (2008), No. 3
Vol 21 (2008), No. 4
Dramatic decline in Russian logs imported to Japan in 2008
Lumber and Biomass Market Update in Europe
Pellet markets in Europe and North America
Biomass usage by global pulp and paper millls
Vol 22 (2009), No. 1
Vol 22 (2009), No. 2
Vol 22 (2009), No. 3
Vol 22 (2009), No. 4
Biomass markets in the US
Global trade of sawlogs
Global wood chip trade
Global wood pulp production 2005-2015
Imports of forest products to China in 2010
Vol 23 (2010), No. 1
Vol 23 (2010), No. 2
Vol 23 (2010), No. 3
Vol 23 (2010), No. 3
Vol 23 (2010), No. 4
Partial List of Conference lectures given by WRI staff
(Country where presentation was given is noted in parentheses)
China as Wood Products Exporter (USA)
Competition from Southern Hemisphere Plantation Forests (USA)
China’s Future Role in the Pacific Rim Trade of Forest Products (USA)
Outlook and Price Trends for Pulpwood and Wood Chips (Uruguay)
Update of the International Wood Chip Market (USA)
The Importance of Russian Wood Products in Asian markets (China)
European Lumber Exports to the US (Canada)
Pulpwood Supply and Price Trends - Global and Regional Overview (Australia)
Global Forest Plantation Resources - End-uses and Cost Trends (Spain)
US Market for Tropical Timber Products (Papua New Guinea)
Wood raw-material markets in Europe, Russia and North America (Switzerland)
North American Wood Fiber Markets and Global Wood Fiber Trends (Canada)
Global Forest Resources - Supply and Cost Trends (Sweden)
Global Wood Fiber Markets & Price Trends (Singapore and Brazil)
Selected presentations can be viewed on our web site www.woodprices.com or subscribers can contact
us at [email protected] to receive presentations in PDF format.
© 2011 Wood Resources International
3Q/2011
51
Wood Resource
Quarterly
Sources and Subscription Information
Principal Information Sources
Sawlog market information is obtained from industry sources in the countries covered by the WRQ. In addition,
information is sourced from Ministry of Forests (Canada); Timber-Mart South (USA); Oregon Log Market
Report (USA); Forme Consulting Group (New Zealand); STCP Engenharia de Projetos (Brazil); EUWID
(Germany); Statistik Austria (Austria); Metsa (Finland); Skogsstyrelsen (Sweden); Wood Industries Federation
of NW Russia (Russia); RMK (Estonia); Ministry of Agriculture, Forestry & Fisheries (Japan), Japan Ministry of
Finance and JAWIC (Japan). Exchange rates from www.Oanda.com
Pulpwood market information is obtained in part from the following regional experts by special agreement with
Wood Resources International:
Maataloustuottajain Keskusliitto (Finland); Dr. D. Bemelmans (France); Union de Selvicultores del Sur de Europa
(Spain); Statistik Austria (Austria); Wood Industries Federation of NW Russia (Russia); “North American Wood
Fiber Review” (US, W.Canada); Gauthier, Parent & Asso. (E. Canada); STCP Engenharia de Projetos (Brazil);
Forme Consulting Group (New Zealand); Wood Grove Resources (Australia); Pulpwood Division, Japan Paper
Association (Japan). Pulp price data used in the Pulp Grade Wood Fiber Cost Analysis (pages 8 & 9) taken from
FOEX Indexes Ltd and from Pulpwatch (Hawkins Wright).
The wood cost of total cash costs for pulpmills worldwide courtesy of Fisher International.
Subscription Information
“Wood Resource Quarterly” is published quarterly by Wood Resources International, LLC. The report is published
in May, August, November and February (2012). The annual subscription rate for 2011 is US$ 2300 (single user
option) and $3800 (multi-user license), which includes both a mailed copy of the report, as well as a downloadable version of the report from our web site (www.woodprices.com).
For more information, or to initiate your subscription, please contact us at [email protected]
Disclaimer
Prices published in the Wood Resource Quarterly are collected from sources believed to be reliable and having
a good knowledge of the market place. Prices in the report are the best estimates for the published quarter and
they may vary depending on special agreements and specific conditions.
Wood Resources International LLC has made every effort to ensure accuracy and completeness of information
provided but our company is not responsible for financial losses or damages of any kind resulting from actions
taken based on the contents of this report. We disclaim responsibility for errors that may have occurred when
gathering and publishing data.
International and U.S. Federal Copyright Laws:
• All Wood Resources International LLC (WRI) printed, e-mailed, downloaded or faxed subscriptions, articles,
and reports are protected under U.S. Federal and international copyright laws as proprietary information.
• No part or total of any WRI publication may be reproduced, transmitted or retransmitted in any form, or by
any means, electronic or mechanical, including photocopy, facsimile, or any information storage and retrieval
system, including intranet, without expressly written permission. It is also illegal to share access password
with nonsubscribers.
• Violation of the US copyright law can result in fines of up to US$150,000, plus attorney’s fees (Title 17 USC,
§504).
52
3Q/2011
© 2011 Wood Resources International

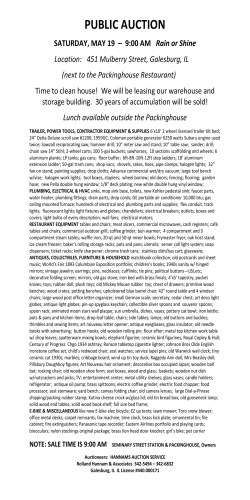


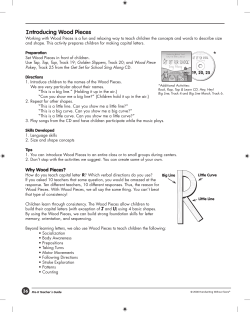


© Copyright 2026