
RJ Wagner & Assoc. Realty - Sample Plan
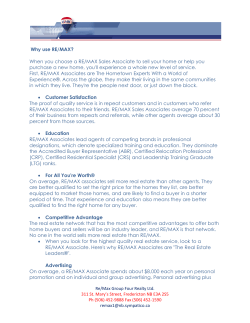
le
mp
Sa
RJ Wagner & Assoc. Realty - Sample Plan
ro
This sample business plan was created using Business Plan Pro®business planning software published by Palo Alto Software.
nP
This plan may be edited using Business Plan Pro and is one of 500+
sample plans available from within the software.
Pla
To learn more about Business Plan Pro and other planning products for
small and medium sized businesses, visit us at www.paloalto.com.
This is a sample business plan and the names, locations and numbers may have been
changed, and substantial portions of the original plan text may have been omitted to
preserve confidentiality and proprietary information.
You are welcome to use this plan as a starting point to create your own, but you do not have
permission to resell, reproduce, publish, distribute or even copy this plan as it exists here.
Bu
sin
ess
Requests for reprints, academic use, and other dissemination of this sample plan should be
emailed to the marketing department of Palo Alto Software at [email protected]. For
product information visit our Website: www.paloalto.com or call: 1-800-229-7526.
Copyright © Palo Alto Software, Inc., 1995-2007.
All rights reserved.
Confidentiality Agreement
le
The undersigned reader acknowledges that the information provided by _______________ in
this business plan is confidential; therefore, reader agrees not to disclose it without the
express written permission of _______________.
mp
It is acknowledged by reader that information to be furnished in this business plan is in all
respects confidential in nature, other than information which is in the public domain through
other means and that any disclosure or use of same by reader, may cause serious harm or
damage to _______________.
Upon request, this document is to be immediately returned to _______________.
Sa
___________________
Signature
ro
___________________
Name (typed or printed)
___________________
Date
Bu
sin
ess
Pla
nP
This is a business plan. It does not imply an offering of securities.
Table of Contents
Executive Summary . . . . . . . . . . . . . . . . . . . . . . . . . . . . . . . . . . . . . . . . . . . . . . . . 1
1.1
Objectives . . . . . . . . . . . . . . . . . . . . . . . . . . . . . . . . . . . . . . . . . . . . . . . . . . . 1
1.2
Mission . . . . . . . . . . . . . . . . . . . . . . . . . . . . . . . . . . . . . . . . . . . . . . . . . . . . . 2
2.0
Company Summary . . . . . . . . . . . . . . . . . . . . . . . . . . . . . . . . . . . . . . . . . . . . . . . . 3
2.1
Company Ownership . . . . . . . . . . . . . . . . . . . . . . . . . . . . . . . . . . . . . . . . . . . . 3
2.2
Start-up Summary . . . . . . . . . . . . . . . . . . . . . . . . . . . . . . . . . . . . . . . . . . . . . 3
3.0
Services . . . . . . . . . . . . . . . . . . . . . . . . . . . . . . . . . . . . . . . . . . . . . . . . . . . . . . . . . 5
4.0
Market Analysis Summary . . . . . . . . . . . . . . . . . . . . . . . . . . . . . . . . . . . . . . . . . . . 6
4.1
Market Segmentation . . . . . . . . . . . . . . . . . . . . . . . . . . . . . . . . . . . . . . . . . . . 7
4.2
Target Market Segment Strategy . . . . . . . . . . . . . . . . . . . . . . . . . . . . . . . . . . . 8
5.0
Strategy and Implementation Summary . . . . . . . . . . . . . . . . . . . . . . . . . . . . . . . .
5.1
Competitive Edge . . . . . . . . . . . . . . . . . . . . . . . . . . . . . . . . . . . . . . . . . . . . . .
5.2
Sales Strategy . . . . . . . . . . . . . . . . . . . . . . . . . . . . . . . . . . . . . . . . . . . . . . . .
5.2.1 Sales Forecast . . . . . . . . . . . . . . . . . . . . . . . . . . . . . . . . . . . . . . . . . . .
5.3
Milestones . . . . . . . . . . . . . . . . . . . . . . . . . . . . . . . . . . . . . . . . . . . . . . . . . . .
6.0
Management Summary . . . . . . . . . . . . . . . . . . . . . . . . . . . . . . . . . . . . . . . . . . . . . 11
6.1
Personnel Plan . . . . . . . . . . . . . . . . . . . . . . . . . . . . . . . . . . . . . . . . . . . . . . . . 12
7.0
Financial Plan . . . . . . . . . . . . . . . . . . . . . . . . . . . . . . . . . . . . . . . . . . . . . . . . . . . .
7.1
Important Assumptions . . . . . . . . . . . . . . . . . . . . . . . . . . . . . . . . . . . . . . . . . .
7.2
Break-even Analysis . . . . . . . . . . . . . . . . . . . . . . . . . . . . . . . . . . . . . . . . . . . .
7.3
Projected Profit and Loss . . . . . . . . . . . . . . . . . . . . . . . . . . . . . . . . . . . . . . . . .
7.4
Projected Cash Flow . . . . . . . . . . . . . . . . . . . . . . . . . . . . . . . . . . . . . . . . . . . .
7.5
Projected Balance Sheet . . . . . . . . . . . . . . . . . . . . . . . . . . . . . . . . . . . . . . . . .
Bu
sin
ess
Pla
nP
ro
Sa
mp
le
1.0
Copyright © Palo Alto Software, Inc. 1995-2007 All rights reserved. Not for resale, reproduction, publication, or distribution. www.paloalto.com
8
9
9
10
11
13
13
14
15
16
18
RJ Wagner & Associates Realty
1.0 Executive Summary
mp
le
RJ Wagner & Associates Realty, Inc., is an S corporation domiciled in the state of Texas. This
corporation is capitalized by one single stockholder and one principal investor, Regina Wagner.
Regina Wagner is a licensed broker and the sponsoring broker for this firm. The licensed
broker of this firm will sponsor licensed real estate agents (independent contractors) in the
state of Texas. This corporation will formalize the real estate services offered.
RJ Wagner & Associates Realty, Inc., will open its doors for operation in July 2001. The office is
located in Houston, Texas (Champions area) in the Greenwood Square Shopping Center, to
provide services to the higher income section of Metropolitan Houston.
ro
Sa
Credibility and reputation excel with the broker of this firm, with a published real estate book
and real estate organizational programs placed in the Houston Association of Realtors and the
Dallas Association of Realtors bookstores and superstores. For the past year novice licensed
agents have enjoyed the organizational tools and guidance offered in the book Texas Real
Estate/The Mobile Mentor.
nP
1.1 Objectives
The primary objectives of our organization are to:
•
•
•
•
•
•
Become a profitable organization allowing us the freedom of taking advantage of other
real estate investment opportunities as they become available.
Recruit and hire self-motivated, success-oriented, and hardworking sales agents.
Maintain an office of at least 15 sales agents who meet the previous requirements.
Develop a solid, corporate identity in our specified targeted market area.
To establish good working relationships and begin working as a team, promoting
communication and suggestions from all participants.
Become one of the top brokerage firms in operation in the Champion area by our third
year of operation, or before.
Realize a positive return on investment within the first 12 months.
Pla
•
sin
ess
We believe the above-mentioned objectives are obtainable because of the professionalism of
the manager and sales associates this corporation will hold. Individuals gaining a real estate
license leave school with the knowledge of the real estate laws and procedures. The turnover
rate in this business is high since agents have no training outside the laws and regulations of
the business itself. Once they have a license, only then, they may obtain the sales and
marketing training that is needed upon entering the profession. This training is available at a
high price to the agent. When starting out, most agents are not able to obtain this training at
the high prices set forth, and without the proper training the average earnings of a beginning
real estate agent is very low in comparison to industry standards.
Bu
The office environment we will be providing will be productively arranged yet inviting to the
agent as well as the client. There will be a location in the office each day with a daily
marketing routine/schedule to follow. Agents have the opportunity to be guided each day
through a marketing plan to gain clients. They may choose to follow the guidelines and
training provided or they may follow their own daily routines. We will be supplying a program
allowing the new agents to earn more than the average real estate agent by providing
guidance and stability.
If an agent with our company sets a goal to obtain only one seller and one buyer for the
month, on an average of $150,000 sale on each side, would earn the agent $6,750 per month
X 12 months = $81,000 per year. Regina's goal as the broker is to assist each agent in
Copyright © Palo Alto Software, Inc. 1995-2007 All rights reserved. Not for resale, reproduction, publication, or distribution. www.paloalto.com
Page 1
RJ Wagner & Associates Realty
conquering this goal.
mp
le
The same sales as noted above would profit the corporation $2,250 per month X 12 months =
$27,000 for the year X 15 agents = $405,000. This is not including sales from the active
broker of this corporation which would be $4,500 commission from each side to total $9,000
(100%) to the corporation. The broker will receive a salary from the corporation.
1.2 Mission
Sa
This plan is written as a guide for starting and managing this new business, and will also serve
as the basis for a separate, detailed marketing plan. Following is a summary of the main points
of this plan.
The objectives of RJ Wagner & Associates Realty, Inc., are to generate a profit, grow at
a challenging and manageable rate, and to live up to the ethical codes set forth by the
Texas Real Estate Commission.
•
The first mission of RJ Wagner & Associates Realty, Inc., is to first recruit Texas real
estate agents. The agents choosing this firm will receive top commission allowing them
more financial advantage for advertising in order to gain more business.
•
The ongoing mission will be to assist both homeowners selling their homes, as well as
homebuyers purchasing the home of their future, by providing professional and
personal assistance. Ensuring customer's best interest are always of the utmost
importance.
•
The keys to success for RJ Wagner & Associates Realty, Inc., are marketing and
networking, responsiveness and quality of customer service and generating repeat
customers.
•
We wish to establish a successful partnership with our clients, our staff members, and
our title companies, that respect the interests and goals of each party.
•
The local market for this business, while not new, is wide open for new and expanding
brokerage firms.
nP
Pla
ess
•
ro
•
An initial financial analysis of the viability of this venture shows outstanding promise
and results. Several sources note that the real estate business has proven to be quite
lucrative in today's fast-paced world.
sin
While so doing, the company will always continue to strengthen its position in the target
market area by providing superior customer service to clients and to sales associates.
Bu
In conclusion, as shown in the highlights chart to follow, this plan projects rapid growth, as
additional agents join, and high net profits over the next three years. Implementing this plan,
in conjunction with a comprehensive and detailed marketing plan, will ensure that RJ Wagner
& Associates Realty, Inc., rapidly becomes a profitable venture for the owner as well as for the
contracting agents.
Copyright © Palo Alto Software, Inc. 1995-2007 All rights reserved. Not for resale, reproduction, publication, or distribution. www.paloalto.com
Page 2
RJ Wagner & Associates Realty
2.0 Company Summary
mp
le
RJ Wagner & Associates Realty, Inc., is a new company that provides high-level expertise in
real estate sales in the state of Texas. It will focus initially on homesellers and homebuyers, as
well as in-house sales agents. Our customer service philosophy is unique. In a philosophic
sense, RJ Wagner & Associates Realty, Inc., has three distinct customer groups: sellers,
buyers, and agents.
Sa
Sellers of real property are our first customers. Listers of properties (sellers) pay commissions
from the sale of their property and are the direct clients of the real estate brokers. We will
never lose our focus that clients who have retained RJ Wagner & Associates Realty, Inc., to list
and sell their properties are our first obligation.
Our second real customer is the buyer of residential real estate. We will provide superior
personal services to buyers.
ro
Our third real customer is the licensed real estate sales agent. It is the agent's job to provide a
professional service to both sellers and buyers, specifically in this order. Therefore, it is the
direct responsibility of RJ Wagner & Associates Realty, Inc., to provide service to our sales
agents.
Pla
nP
As it grows, it will take on new agents providing them with a highly competitive commission
earnings, as well as providing them with a support service that will allow for more productive
time in order to gain clients at a faster pace. Hence motivating productive licensed agents in
the real estate arena. As it grows, it will look for additional marketing techniques to offer
clientele and serve the public in the high standards handed down by the Texas Real Estate
Commission.
2.1 Company Ownership
ess
RJ Wagner & Associates Realty, Inc., has been formed as an S corporation domiciled in the
state of Texas. This corporation is capitalized by one single stockholder and one principal
investor, the owner and broker of this firm, Regina J. Wagner.
2.2 Start-up Summary
sin
Our start-up costs are outlined in the following chart. Said start-up costs derive from website
design, office equipment, main computer station (complete with all realtor information for
agent usage), stationery, legal costs, furnishings, office advertising and services, and expenses
associated with opening our first office. The start-up costs are to be financed by direct owner
investment and credit. The assumptions are shown in the following table and chart.
Bu
Lease office space averages $1.10 - 1.60 per square foot to equal an approximate of $1,500
per month, plus utilities, for efficient leased office space. Commercial lease will be for a three
to five year agreement with the first month and a security deposit equal to the monthly lease
rate payable at the time of lease start date.
Copyright © Palo Alto Software, Inc. 1995-2007 All rights reserved. Not for resale, reproduction, publication, or distribution. www.paloalto.com
Page 3
RJ Wagner & Associates Realty
Table: Start-up
le
Start-up
Start-up Assets Needed
Cash Balance on Starting Date
Other Short-term Assets
Total Short-term Assets
$9,756
$20,000
$29,756
Funding
Investment
Investor 1
Investor 2
Other
Total Investment
nP
$7,000
$36,756
$60,000
Pla
Long-term Assets
Total Assets
Total Requirements
$20,000
$20,000
$10,000
$50,000
$10,000
$0
$0
$10,000
Long-term Liabilities
Total Liabilities
$0
$10,000
sin
ess
Short-term Liabilities
Accounts Payable
Current Borrowing
Other Short-term Liabilities
Subtotal Short-term Liabilities
($23,244)
$26,756
$36,756
Bu
Loss at Start-up
Total Capital
Total Capital and Liabilities
Sa
$930
$399
$2,000
$1,000
$1,000
$2,500
$1,300
$225
$200
$440
$250
$3,000
$3,000
$4,000
$1,000
$1,000
$1,000
$23,244
ro
Start-up Expenses
Legal/Incorporating
Better Business Bureau Fee
Stationery etc.
Brochures
Mailings/Postal
Advertising
Company Yard Signs
Insurance
Answering Service
Website Design
Utilities Start Up
Rent
Expensed equipment/Computer/Copier
Office Furnishings/Lease or Used
Office Supplies
Other/Miscellaneous
Business Software
Total Start-up Expense
mp
Requirements
Copyright © Palo Alto Software, Inc. 1995-2007 All rights reserved. Not for resale, reproduction, publication, or distribution. www.paloalto.com
Page 4
RJ Wagner & Associates Realty
le
Start-up
$50,000
mp
$45,000
$40,000
$35,000
$30,000
Sa
$25,000
$20,000
$15,000
$10,000
$0
Assets
Investment
Loans
nP
Expenses
ro
$5,000
3.0 Services
Pla
At RJ Wagner & Associates Realty, Inc., our principal service consists of selling residential real
estate in a targeted market area. Our services provide our clients with an international
network of buyers and sellers through the multiple listing service (MLS). Because of our
capabilities to network with other brokers, we will sell homes faster than our clients could if
they tried to market their home without the assistance of a licensed real estate agent.
ess
In addition, our customers will list their homes with our agency because of our aggressive and
highly-skilled professionals. We will continuously have an above-average sales force to
generate and close residential listings.
The owner and broker of RJ Wagner & Associates Realty, Inc., is committed to success in the
real estate market and adheres to the strict rules handed down by the Texas Real Estate
Commission. Our high level of commitment will enable the company to attract top
professionals as sales associates and clients looking to buy and sell residential real estate.
sin
Agents with this firm will be provided with the following services:
Top commissions.
24/7 hour office access.
Own Web page.
Marketing/sales guidelines to follow each day.
Personal goal setting training
Professional/commercial office setting in a highly visible and reputable location in the
city of Houston.
24-hour answering service.
Free inside/outside panoramic photography of each property listing. All photos are
placed on HAR/MLS (Multiple Listing Service) and to the Internet realty sites.
Full broker support.
Professional flyer will be furnished complete with property photos for advertisement.
Yard signs will be supplied and installed for the agent.
Bu
•
•
•
•
•
•
•
•
•
•
•
Copyright © Palo Alto Software, Inc. 1995-2007 All rights reserved. Not for resale, reproduction, publication, or distribution. www.paloalto.com
Page 5
RJ Wagner & Associates Realty
•
Flyer distribution to other broker sites/agents.
Sellers will be provided with the following services:
•
•
le
mp
•
•
•
•
•
Sa
•
•
Free CMA (Comparative Market Analysis).
Inside/outside photos in panoramic view placed on MLS (Multiple Listing System) and
real estate Internet sites. This allows potential buyers to view our seller's property
online.
Advertising in local real estate publications.
We design an attractive pamphlet with all property information, room dimensions, tax
information, a letter from the seller, and a complete history of the home for potential
buyers to read while viewing the property. This pamphlet is for the seller to keep or to
give to the new owner when the home sells.
Attractive yard signs with flyer tubes attached for potential buyers driving by.
"Just Listed Post Cards" mailed to surrounding neighborhoods.
Listing flyers distributed to other broker sites.
Circulated open house invitations (per seller approval).
Supra System Computerized Lockboxes (we know when and who entered premises at
all times).
Excellent follow-up system on each showing.
If no contract is submitted within the first listed month, we re-analyze our future
marketing procedures with the seller.
ro
•
•
nP
Buyers will be provided with the following services:
We match buyers to homes. We have an extensive questionnaire for our buyers to list
their wants and needs. We then take this questionnaire and put the supplied
information into our Passport program to match buyers to the homes matching their
criteria. (Passport is the latest software available to licensed real estate agents and
brokers in the state of Texas.)
•
We go a step further with our buyers and we go on-site for them. We visit the homes
of their choice and take inside and outside panoramic photos for their viewing. We can
email the photos or have a face to face showing with the buyer. The buyer does not
have to go on-site unless they choose to. We bring the home to them.
ess
•
Pla
•
We present their offers and comply with all negotiating for them.
sin
4.0 Market Analysis Summary
Bu
RJ Wagner & Associates Realty, Inc., will be focusing on supplying homebuyers and
homesellers professionalism and expertise in reaching a successful sale and/or purchase in
their real estate needs. Our concentration also lies with our in-house agents. We feel by
providing our in-house agents the support program they need our productivity should excel at
a rapid pace.
Due to the strengthening of the economy in Houston area, more homebuyers today are
looking to purchase homes. These changes in attitudes of homebuyers are a tremendous boost
to real estate firms.
We are poised to take advantage of these changes, and expect to become a recognized name
and profitable entity in the Houston real estate market. We chose to locate our office in the
area of most revenue potential. Our targeted market area, the Champions area, shows
Copyright © Palo Alto Software, Inc. 1995-2007 All rights reserved. Not for resale, reproduction, publication, or distribution. www.paloalto.com
Page 6
RJ Wagner & Associates Realty
stability and growth. We have a beautiful office, centered in the Champions area. This location
will enable our sales associates to work in an area that will allow them to make more money in
a shorter period of time.
mp
le
The first quarter home values were up 8.8% from the same period in 2000, the Office of
Federal Housing Enterprise Oversight says. The gain reflects an increase from the previous
quarter, when residential real estate values saw year-over-year growth of 8.1%.
As stated in the Objectives section--we outline the profits to be gained with each agent striving
for one seller and one buyer each month. We also state the extensive marketing plans, goal
setting and training provided by this corporation to assist each agent in reaching this goal.
Sa
As stated in the Services section--we outline the services we will be supplying to the agents,
sellers and buyers (all of which this corporation considers to be our customer).
ro
As the outline following will indicate--our agents will earn top commissions, be supplied with
the latest in marketing and advertising assistance, and have on-site broker assistance at all
times. This coupled with the teamwork and excellent marketing programs provided, we feel we
have a recipe for success.
3.
4.
Bu
sin
5.
Pla
2.
Our most important market segment is the homeseller. The seller will be calling upon
RJ Wagner & Associates Realty, Inc., for our excellent marketing strategies and
techniques, and our ability to deliver personal consulting, professionalism and a follow
up system.
As important would be the homebuyer. These buyers will be calling on RJ Wagner &
Associates Realty, Inc., to "match" their criteria selections. This corporation will be
previewing matching criteria homes for the buyer, thus providing the buyer with on-site
viewing capabilities without actually visiting the home site.
Individuals desiring to lease will also be guided to lease properties of their matching
criteria needs.
When referring a client outside our expertise range, we would search for a reputable
and knowledgeable agent to assist them at their destination. When this corporation is
the recipient of a referral--we would match the buyer to homes meeting his/her criteria
specifications.
Last, but not least, would be the corporation in-house agents. We view each one as a
customer and are sensitive to their needs. Tools, training, marketing techniques and
strategies, and guidance needed is available at all times. Each agent will have the
opportunity to be assisted in designing a work schedule that adheres to their work
style, hence allowing greater productivity. All agents will receive on-site guidance in all
areas needed.
ess
1.
nP
4.1 Market Segmentation
Copyright © Palo Alto Software, Inc. 1995-2007 All rights reserved. Not for resale, reproduction, publication, or distribution. www.paloalto.com
Page 7
RJ Wagner & Associates Realty
mp
le
Market Analysis (Pie)
Home Buyers
Property Photography
nP
ro
Sa
Home Sellers
Market Analysis
Potential Customers
Home Sellers
Home Buyers
Property Photography
Total
Growth
3%
3%
3%
3.00%
2001
153,819
145,412
48,334
347,565
Pla
Table: Market Analysis
2002
158,434
149,774
49,784
357,992
2003
163,187
154,268
51,278
368,732
2004
168,082
158,896
52,816
379,794
2005
173,125
163,662
54,400
391,187
CAGR
3.00%
3.00%
3.00%
3.00%
4.2 Target Market Segment Strategy
ess
We cannot survive just waiting for the customer to come to us. Instead, we must get better at
focusing on the specific market segments whose needs match our offerings. Focusing on
targeted segments is the key to our future.
sin
Therefore, we need to focus our marketing message and our services offered. We need to
develop our message, communicate it, and make good on it.
5.0 Strategy and Implementation Summary
Bu
RJ Wagner & Associates Realty, Inc., will focus on the real estate needs in the Houston and
surrounding areas. Our target customer will be, and our concentration will focus on the
representation of, homesellers, homebuyers, relocation clientele.
To be the success we are striving to become this corporation realizes it must place a
tremendous concentration on its in-house licensed agents. The agents with this firm will be
supported and assisted to the best of our ability.
Copyright © Palo Alto Software, Inc. 1995-2007 All rights reserved. Not for resale, reproduction, publication, or distribution. www.paloalto.com
Page 8
RJ Wagner & Associates Realty
5.1 Competitive Edge
mp
le
The corporate broker of this firm has a published real estate book (Texas Real Estate/The
Mobile Mentor). This book and the accompanying organizational programs, are distributed
throughout the state of Texas in real estate book stores and associations. This book was
written for the novice agent which will be provided to oncoming agents as a reference tool,
therefore, allowing a fast start program.
Sa
This firm allows "Top Commissions" to the agents allowing for more agent advertising and
marketing promotions. This firm is highly supportive to the agent it sponsors in the respect of
compliance with agent listing tasks. All of which free the agent's time to do what the agent is
trained to do and that is to sell and gain clients.
This firm has a marketing plan in place for agents to utilize. The company will be assisting all
agents in goal setting/planning and in their marketing techniques/strategies. Even though the
agents are independent contractors, this firm will run as a team. The open door policy will be
in place at all times inviting new ideas and suggestions.
nP
ro
In addition, please reference the Services section for an outline of our services offered to inhouse agents, our sellers and our buyers. All services offered to each provide this corporation
with a competitive edge, for we know of no other firm offering the extensive services we
provide.
5.2 Sales Strategy
•
•
•
Pla
•
•
Sales in our business is gaining property listings and utilizing a marketing plan that
works best for the client.
We locate and match homes to buyers according to the criteria submitted by the buyer.
We assist in relocating clients to their new destinations and/or assist clients relocating
to our area in their home search. We offer an excellent referral service anywhere in the
United States.
We search for lease properties for individuals wishing to lease versus purchasing.
We allow above-standard commission percentage rates, then provide excellent
marketing and advertising programs.
We provide our selling agents with an excellent support program as well as guidance.
ess
•
Bu
sin
Each potential seller listing or buyer representation we receive should be treated as an
individual mission. Each client and client property must be analyzed to ensure our marketing
program supplied fits their particular property and promotes it in the best possible way.
Copyright © Palo Alto Software, Inc. 1995-2007 All rights reserved. Not for resale, reproduction, publication, or distribution. www.paloalto.com
Page 9
RJ Wagner & Associates Realty
5.2.1 Sales Forecast
Table: Sales Forecast (Planned)
mp
le
The following table and chart give a run-down on forecasted sales. We expect sales to be
slowest during September through December, building between January through March and
the most growth during the months of March through August.
2002
$83,625
$44,245
$5,280
$2,244
$135,394
2003
$205,000
$45,000
$5,760
$3,750
$259,510
2004
$405,000
$45,000
$5,760
$3,750
$459,510
Direct Cost of Sales
Agent Sales - 25% To Company
Broker Sales - 100% To Company
Photo Service - 100% To Company
Referrals - 25% Agent/25% Company
Subtotal Direct Cost of Sales
2002
$8,363
$10,837
$440
$330
$19,970
2003
$67,650
$40,500
$440
$400
$108,990
2004
$187,500
$40,500
$440
$400
$228,840
ro
Sa
Sales Forecast
Sales
Agent Sales - 25% To Company
Broker Sales - 100% To Company
Photo Service - 100% To Company
Referrals - 25% Agent/25% Company
Total Sales
nP
Sales Monthly (Planned)
$20,000
$15,000
$10,000
Pla
$25,000
Broker Sales - 100% To Company
Photo Service - 100% To Company
Referrals - 25% Agent/25% Company
ess
$5,000
Agent Sales - 25% To Company
Bu
sin
$0
Copyright © Palo Alto Software, Inc. 1995-2007 All rights reserved. Not for resale, reproduction, publication, or distribution. www.paloalto.comPage
10
RJ Wagner & Associates Realty
5.3 Milestones
le
The accompanying table lists important program milestones, with dates and managers in
charge, and budgets for each. The milestone schedule indicates our emphasis on planning for
implementation.
mp
What the table doesn't show is the commitment behind it. Our business plan includes complete
provisions for plan-vs.-actual analysis, and we will hold monthly follow-up meetings to discuss
the variance and course corrections.
End Date
6/15/01
6/15/01
6/15/01
6/15/01
6/15/01
Budget
$2,000
$500
$500
$2,000
$500
Manager
RJW
RJW
RJW
RJW
RJW
Department
Owner
Owner
Owner
Owner
Owner
5/15/01
1/1/01
5/15/01
3/15/01
1/1/01
6/15/01
6/15/01
6/15/01
6/15/01
12/31/02
$1,300
$390
$200
$930
$300
RJW
RJW
RJW
RJW
RJW
Owner
Owner
Owner
Owner
Owner
1/1/01
12/31/02
$300
RJW
Owner
1/1/01
1/1/01
12/31/02
12/31/01
$1,080
$300
RJW
RJW
Owner
Owner
RJW
Owner
RJW
Owner
RJW
Owner
nP
ro
Start Date
6/1/01
6/1/01
6/1/01
6/1/01
6/1/01
Pla
Milestones
Milestone
Business Plan
Logo Design
Website Design/Placement
Company Stationary Design/Print
Co.Docs (CD-Rom/Disk) Agent
Distribution
Company Signs/Advertising
BBB Membership/Yearly
Photo Merchant Account Charge
Incorporating Charges
Nat'l Realtor Assoc.
Membership/Yearly
TX Realtor Assoc.
Membership/Yearly
Houston Assoc.Corp. MLS/Yearly
Montgomery Assoc.
Membership/Yearly
Purchased Office
Equipment/Computer,etc.
Office Utilities
Commercial Office Lease
Answering Service
Commercial Phone Lease
Name me
Totals
Sa
Table: Milestones (Planned)
7/1/01
$3,000
6/15/01
6/15/01
6/15/01
6/15/01
6/15/01
7/30/01
7/30/01
7/30/01
7/30/01
7/30/01
$200
$3,000
$200
$200
$1,150
$18,050
ess
5/30/01
6.0 Management Summary
Bu
sin
The initial management team is the owner/licensed broker. The broker of this firm has the only
authority to sponsor oncoming licensed real estate agents under the corporate broker license.
Upon joining this firm agents will receive a complete training program to include the broker's
published book, Texas Real Estate: The Mobile Mentor, a complete library to include all
company documents and marketing correspondence furnished on CD-RW and/or Diskette, free
inside/outside photography of all listings, marketing plan/goal setting guidance and counseling.
This firm and their agents will experience on-site broker guidance and on-site mortgage
advisory at all times.
At this time, this broker is an active listing broker. Recruiting licensed agents is now in
process in the Houston and surrounding areas. This firm estimates to add a total of three
licensed agents in 2001, with a minimum of 12 agents to be added throughout the year of
2002. (A minimum of one agent per month gain in 2002). This firm strives to obtain a
minimum total of 15 licensed real estate agents contracting under this sponsored broker.
Agents with this firm have the option to work in-house or out of a home-based office.
In addition to the real estate services provided by this corporation to homesellers and to
Copyright © Palo Alto Software, Inc. 1995-2007 All rights reserved. Not for resale, reproduction, publication, or distribution. www.paloalto.comPage
11
RJ Wagner & Associates Realty
homebuyers, this firm offers inside/outside photography services in-house as well as to other
broker firms. This service is free to in-house agents and a service fee is charged to other
broker sites and agents utilizing this service.
le
As RJ Wagner is a sole proprietorship, the principal's personal net worth is given below.
mp
Table: Personal Net Worth
Personal Net Worth
Assets
Notes:
ro
nP
Long-term Assets
Main Residence
Improvements
Account
All Other
Total Long-term Assets
Total Assets
Pla
Liabilities
Current Borrowing
Credit Card
Credit Card
Credit Card
Auto Loan
Other Current Debt
Other Current Debt
All Other
Subtotal Current Borrowing
sin
ess
Long-term Borrowing
Mortgage
Other Long-term Loans
All Other
Subtotal Long-term Borrowing
Total Liabilities
Net Worth
Balance
$1,500
$6,000
$58,000
$24,000
$6,300
$0
$0
$95,800
Sa
Current Assets
Checking
Savings
Investment
Household Goods
Auto
Auto
All Other
Total Current Assets
$150,000
$0
$0
$20,000
$170,000
$265,800
Balance
$3,000
$350
$58
$3,681
$1,500
$0
$0
$8,589
$64,000
$0
$0
$64,000
$72,589
$193,211
6.1 Personnel Plan
Bu
This firm will not have employees but rather independent contractors. Therefore, the firm will
not be issuing payroll to employees. Payroll will be issued to the broker of the corporation
alone. All reception/secretarial needs will be complied with by the on-site/on duty agents on
any given day. There will be two licensed agents on duty at all times.
Licensed agents will receive 3% commission on "one" side (seller or buyer side) of the sale
spectrum. Of that 3% commission earned, 25% is awarded to the company. If an agent
performs the act of the selling agent and also the buyer agent of the same property sale, then
this agent would gain the full 6% commission (both sides of the agency), therefore, the
corporation would be awarded 25% from each agency side.
Copyright © Palo Alto Software, Inc. 1995-2007 All rights reserved. Not for resale, reproduction, publication, or distribution. www.paloalto.comPage
12
RJ Wagner & Associates Realty
le
We believe this plan is a fair compromise between fairness and expedience, and meets the
commitment of our mission statement. The detailed monthly personnel plan for the first year is
included in the appendices.
Personnel Plan
2002
$36,000
Payroll
2003
$60,000
2004
$100,000
Sa
7.0 Financial Plan
mp
Table: Personnel (Planned)
We want to finance growth mainly through cash flow. We recognize that this means we
will have to grow more slowly than we might like.
•
The most important factor for R.J. Wagner & Associates Realty is the closing sales
days. These dates will be determined ultimately by the seller and the buyer and a move
out/move in schedule will be complied with. Immediately following the closing sale
commission will be disbursed by the title company conducting the closing.
7.1 Important Assumptions
nP
ro
•
Pla
The financial plan depends on important assumptions, most of which are shown in the
following table as annual assumptions. The monthly assumptions are included in the
appendices. From the beginning, we recognize that collection days are critical, but not a factor
we can influence easily. At least we are planning on the problem, and dealing with it. Interest
rates, tax rates, and personnel burden are based on conservative assumptions.
Some of the more important underlying assumptions are:
We assume a strong economy, without major recession.
We assume that there are no unforeseen changes in the economy that would change
our estimations.
ess
•
•
Table: General Assumptions
General Assumptions
2002
10.00%
10.00%
25.00%
10.00%
10.00%
15.00%
2003
10.00%
10.00%
25.00%
10.00%
10.00%
15.00%
2004
10.00%
10.00%
25.00%
10.00%
10.00%
15.00%
Bu
sin
Short-term Interest Rate %
Long-term Interest Rate %
Tax Rate %
Expenses in Cash %
Sales on Credit %
Personnel Burden %
Copyright © Palo Alto Software, Inc. 1995-2007 All rights reserved. Not for resale, reproduction, publication, or distribution. www.paloalto.comPage
13
RJ Wagner & Associates Realty
7.2 Break-even Analysis
le
The following table and chart will summarize our break-even analysis.
mp
Most of our cost of fulfillment is actually the sales of the agents as well as the sales of the
active broker.
We don't expect to reach break-even until a few months into the business operation.
Break-even Analysis:
Monthly Units Break-even
Monthly Sales Break-even
Sa
Table: Break-even Analysis
3
$3,658
Assumptions:
Average Per-Unit Revenue
Average Per-Unit Variable Cost
Estimated Monthly Fixed Cost
ro
$1,125.00
$1.00
$3,655
nP
Break-even Analysis
$10,000
$8,000
$6,000
$2,000
$0
($2,000)
($4,000)
$0
Pla
$4,000
$2,250
$4,500
$6,750
$9,000
$11,250
ess
Monthly break-even point
Bu
sin
Break-even point = where line intersects with 0
Copyright © Palo Alto Software, Inc. 1995-2007 All rights reserved. Not for resale, reproduction, publication, or distribution. www.paloalto.comPage
14
RJ Wagner & Associates Realty
Our projected profit and loss is shown on the following table.
le
7.3 Projected Profit and Loss
mp
As with the break-even, we are projecting very conservatively regarding cost of sales and
gross margin. Initially, we will depend on our associates for most fulfillment, which is why
costs should be lower than shown. We prefer to project conservatively so that we make sure
we have enough cash.
Sa
We are spending less on marketing expenses due to our paid memberships with the
associations. This broker has a published real estate book and organizational programs placed
in the Houston Association of Realtors and also the Dallas Association of Realtors. The
associations advertise these marketing tools free to this broker.
The detailed monthly projections are included in the appendices.
ro
Table: Profit and Loss (Planned)
Pro Forma Profit and Loss
Pla
ess
Total Cost of Sales
Gross Margin
Gross Margin %
Operating Expenses:
Advertising/Promotion
Travel
Miscellaneous
Payroll Expense
Payroll Burden
Depreciation
Depreciation
Depreciation
Depreciation
Office Supplies
Business Software
Leased Equipment
Other
2002
$135,394
$19,970
$0
-----------$19,970
$115,425
85.25%
2003
$259,510
$108,990
$0
-----------$108,990
$150,520
58.00%
2004
$459,510
$228,840
$0
-----------$228,840
$230,670
50.20%
$4,700
$2,400
$0
$36,000
$0
$1,270
$1,800
$15,600
$0
$2,900
$1,000
$3,000
$1,000
-----------$69,670
$45,755
$325
$0
$11,357
$0
$34,072
25.17%
$0
$0
$0
$60,000
$0
$970
$1,950
$15,600
$0
$3,200
$1,000
$3,000
$1,000
-----------$86,720
$63,800
$831
$0
$15,742
$0
$47,227
18.20%
$0
$0
$0
$100,000
$0
$970
$1,950
$15,600
$0
$3,200
$1,000
$3,000
$1,000
-----------$126,720
$103,950
$1,220
$0
$25,683
$0
$77,048
16.77%
nP
Sales
Direct Cost of Sales
Other
Bu
sin
Total Operating Expenses
Profit Before Interest and Taxes
Interest Expense Short-term
Interest Expense Long-term
Taxes Incurred
Extraordinary Items
Net Profit
Net Profit/Sales
Copyright © Palo Alto Software, Inc. 1995-2007 All rights reserved. Not for resale, reproduction, publication, or distribution. www.paloalto.comPage
15
RJ Wagner & Associates Realty
7.4 Projected Cash Flow
Cash (Planned)
Sa
$50,000
mp
le
Cash flow projections are critical to our success. The monthly cash flow is shown in the
illustration, with one bar representing the cash flow per month, and the other the monthly
balance. The annual cash flow figures are included here and the more important detailed
monthly numbers are included in the appendices.
$40,000
ro
$30,000
$20,000
Cash Balance
nP
$10,000
Net Cash Flow
$0
($10,000)
Jul Aug Sep Oct Nov Dec Jan Feb Mar Apr May
Bu
sin
ess
Pla
Jun
Copyright © Palo Alto Software, Inc. 1995-2007 All rights reserved. Not for resale, reproduction, publication, or distribution. www.paloalto.comPage
16
RJ Wagner & Associates Realty
Table: Cash Flow (Planned)
2003
Cash Received
Cash from Operations:
Cash Sales
From Receivables
Subtotal Cash from Operations
$121,855
$10,142
$131,996
$233,559
$22,836
$256,395
$413,559
$40,932
$454,491
Additional Cash Received
Extraordinary Items
Sales Tax, VAT, HST/GST Received
New Current Borrowing
New Other Liabilities (interest-free)
New Long-term Liabilities
Sales of other Short-term Assets
Sales of Long-term Assets
New Investment Received
Subtotal Cash Received
$0
$0
$6,000
$0
$0
$0
$0
$0
$137,996
$0
$0
$4,620
$0
$0
$0
$0
$0
$261,015
$0
$0
$3,150
$0
$0
$0
$0
$0
$457,641
2002
2003
2004
$6,405
$36,000
$59,390
$101,796
$15,131
$60,000
$124,934
$200,065
$28,149
$100,000
$236,563
$364,712
$0
$0
$0
$0
$0
$0
$0
$0
$101,796
$0
$0
$0
$0
$0
$0
$0
$0
$200,065
$0
$0
$0
$0
$0
$0
$0
$0
$364,712
$36,200
$45,956
$60,950
$106,906
$92,929
$199,835
Sa
nP
Pla
Bu
sin
ess
Net Cash Flow
Cash Balance
ro
Expenditures
Expenditures from Operations:
Cash Spent on Costs and Expenses
Wages, Salaries, Payroll Taxes, etc.
Payment of Accounts Payable
Subtotal Spent on Operations
Additional Cash Spent
Sales Tax, VAT, HST/GST Paid Out
Principal Repayment of Current Borrowing
Other Liabilities Principal Repayment
Long-term Liabilities Principal Repayment
Purchase Other Short-term Assets
Purchase Long-term Assets
Dividends
Adjustment for Assets Purchased on Credit
Subtotal Cash Spent
2004
le
2002
mp
Pro Forma Cash Flow
Copyright © Palo Alto Software, Inc. 1995-2007 All rights reserved. Not for resale, reproduction, publication, or distribution. www.paloalto.comPage
17
RJ Wagner & Associates Realty
7.5 Projected Balance Sheet
Table: Balance Sheet (Planned)
Pro Forma Balance Sheet
Assets
Short-term Assets
Cash
Accounts Receivable
Other Short-term Assets
Total Short-term Assets
Long-term Assets
Long-term Assets
Accumulated Depreciation
Total Long-term Assets
Total Assets
2003
$106,906
$6,513
$20,000
$133,419
$7,000
$1,270
$5,730
$75,084
$7,000
$2,240
$4,760
$138,179
Accounts Payable
Current Borrowing
Other Short-term Liabilities
Subtotal Short-term Liabilities
2002
$8,256
$6,000
$0
$14,256
2003
$19,504
$10,620
$0
$30,124
2004
$36,284
$13,770
$0
$50,054
Long-term Liabilities
Total Liabilities
$0
$14,256
$0
$30,124
$0
$50,054
ro
Pla
$50,000
($23,244)
$34,072
$60,828
$75,084
$60,828
$50,000
$10,828
$47,227
$108,055
$138,179
$108,055
$50,000
$58,055
$77,048
$185,103
$235,157
$185,103
Bu
sin
ess
Paid-in Capital
Retained Earnings
Earnings
Total Capital
Total Liabilities and Capital
Net Worth
$7,000
$3,210
$3,790
$235,157
nP
Liabilities and Capital
2004
$199,835
$11,532
$20,000
$231,367
Sa
2002
$45,956
$3,398
$20,000
$69,354
mp
le
The balance sheet in the following table shows managed but sufficient growth of net worth,
and a sufficiently healthy financial position. The monthly estimates are included in the
appendices.
Copyright © Palo Alto Software, Inc. 1995-2007 All rights reserved. Not for resale, reproduction, publication, or distribution. www.paloalto.comPage
18
Appendix
Appendix Table: Sales Forecast (Planned)
Sales Forecast
Sales
Agent Sales - 25% To Company
Broker Sales - 100% To Company
Photo Service - 100% To Company
Referrals - 25% Agent/25% Company
Total Sales
Jun
$0
$3,389
$0
$187
$3,576
Jul
$2,375
$3,731
$480
$187
$6,773
Aug
$8,125
$6,750
$480
$187
$15,542
Sep
$11,250
$0
$480
$187
$11,917
Oct
$4,500
$3,375
$480
$187
$8,542
Nov
$4,500
$3,375
$480
$187
$8,542
Dec
$4,500
$3,375
$480
$187
$8,542
Jan
$3,375
$0
$480
$187
$4,042
Feb
$3,375
$0
$480
$187
$4,042
Direct Cost of Sales
Agent Sales - 25% To Company
Broker Sales - 100% To Company
Photo Service - 100% To Company
Referrals - 25% Agent/25% Company
Subtotal Direct Cost of Sales
Jun
$0
$339
$0
$0
$339
Jul
$238
$373
$40
$30
$681
Aug
$813
$675
$40
$30
$1,558
Sep
$1,125
$1,350
$40
$30
$2,545
Oct
$450
$675
$40
$30
$1,195
Nov
$450
$1,350
$40
$30
$1,870
Dec
$450
$675
$40
$30
$1,195
Jan
$338
$1,350
$40
$30
$1,758
Feb
$338
$1,350
$40
$30
$1,758
u
B
n
i
s
s
e
P
s
n
la
r
P
S
o
Copyright © Palo Alto Software, Inc. 1995-2007 All rights reserved. Not for resale, reproduction, publication, or distribution. www.paloalto.com
m
a
e
l
p
Mar
$12,375
$4,500
$480
$187
$17,542
Apr
$14,625
$7,875
$480
$187
$23,167
May
$14,625
$7,875
$480
$187
$23,167
Mar
$1,238
$1,350
$40
$30
$2,658
Apr
$1,463
$675
$40
$30
$2,208
May
$1,463
$675
$40
$30
$2,208
Page 1
Appendix
Appendix Table: Personnel (Planned)
Personnel Plan
Jun
$3,000
Payroll
u
B
n
i
s
Jul
$3,000
s
e
Aug
$3,000
P
s
Sep
$3,000
Oct
$3,000
n
la
Nov
$3,000
r
P
Dec
$3,000
Jan
$3,000
S
o
Copyright © Palo Alto Software, Inc. 1995-2007 All rights reserved. Not for resale, reproduction, publication, or distribution. www.paloalto.com
Feb
$3,000
m
a
e
l
p
Mar
$3,000
Apr
$3,000
May
$3,000
Page 2
Appendix
Appendix Table: General Assumptions
General Assumptions
Jun
10.00%
10.00%
25.00%
10.00%
10.00%
15.00%
Short-term Interest Rate %
Long-term Interest Rate %
Tax Rate %
Expenses in Cash %
Sales on Credit %
Personnel Burden %
u
B
Jul
10.00%
10.00%
25.00%
10.00%
10.00%
15.00%
n
i
s
Aug
10.00%
10.00%
25.00%
10.00%
10.00%
15.00%
s
e
Sep
10.00%
10.00%
25.00%
10.00%
10.00%
15.00%
Oct
10.00%
10.00%
25.00%
10.00%
10.00%
15.00%
P
s
Nov
10.00%
10.00%
25.00%
10.00%
10.00%
15.00%
n
la
Dec
10.00%
10.00%
25.00%
10.00%
10.00%
15.00%
Jan
10.00%
10.00%
25.00%
10.00%
10.00%
15.00%
r
P
Feb
10.00%
10.00%
25.00%
10.00%
10.00%
15.00%
Mar
10.00%
10.00%
25.00%
10.00%
10.00%
15.00%
S
o
Copyright © Palo Alto Software, Inc. 1995-2007 All rights reserved. Not for resale, reproduction, publication, or distribution. www.paloalto.com
Apr
10.00%
10.00%
25.00%
10.00%
10.00%
15.00%
m
a
e
l
p
May
10.00%
10.00%
25.00%
10.00%
10.00%
15.00%
Page 3
Appendix
Appendix Table: Profit and Loss (Planned)
Pro Forma Profit and Loss
Sales
Direct Cost of Sales
Other
Total Cost of Sales
Gross Margin
Gross Margin %
Operating Expenses:
Advertising/Promotion
Travel
Miscellaneous
Payroll Expense
Payroll Burden
Depreciation
Depreciation
Depreciation
Depreciation
Office Supplies
Business Software
Leased Equipment
Other
Total Operating Expenses
Profit Before Interest and Taxes
Interest Expense Short-term
Interest Expense Long-term
Taxes Incurred
Extraordinary Items
Net Profit
Net Profit/Sales
u
B
n
i
s
Jun
$3,576
$339
$0
-----------$339
$3,237
90.52%
Jul
$6,773
$681
$0
-----------$681
$6,093
89.95%
Aug
$15,542
$1,558
$0
-----------$1,558
$13,985
89.98%
Sep
$11,917
$2,545
$0
-----------$2,545
$9,372
78.64%
Oct
$8,542
$1,195
$0
-----------$1,195
$7,347
86.01%
Nov
$8,542
$1,870
$0
-----------$1,870
$6,672
78.11%
Dec
$8,542
$1,195
$0
-----------$1,195
$7,347
86.01%
$0
$200
$0
$3,000
$0
$150
$150
$1,300
$0
$0
$0
$250
$0
-----------$5,050
($1,813)
$4
$0
($454)
$0
($1,363)
-38.11%
$0
$200
$0
$3,000
$0
$150
$150
$1,300
$0
$100
$0
$250
$0
-----------$5,150
$943
$8
$0
$234
$0
$701
10.34%
$200
$200
$0
$3,000
$0
$150
$150
$1,300
$0
$200
$0
$250
$200
-----------$5,650
$8,335
$13
$0
$2,081
$0
$6,242
40.16%
$500
$200
$0
$3,000
$0
$150
$150
$1,300
$0
$200
$0
$250
$0
-----------$5,750
$3,622
$17
$0
$901
$0
$2,704
22.69%
$500
$200
$0
$3,000
$0
$125
$150
$1,300
$0
$300
$0
$250
$300
-----------$6,125
$1,222
$21
$0
$300
$0
$901
10.55%
$500
$200
$0
$3,000
$0
$90
$150
$1,300
$0
$300
$0
$250
$0
-----------$5,790
$882
$25
$0
$214
$0
$643
7.52%
$500
$200
$0
$3,000
$0
$75
$150
$1,300
$0
$300
$0
$250
$0
-----------$5,775
$1,572
$29
$0
$386
$0
$1,157
13.55%
s
e
P
s
n
la
r
P
S
o
Copyright © Palo Alto Software, Inc. 1995-2007 All rights reserved. Not for resale, reproduction, publication, or distribution. www.paloalto.com
e
l
p
Jan
$4,042
$1,758
$0
-----------$1,758
$2,285
56.52%
Feb
$4,042
$1,758
$0
-----------$1,758
$2,285
56.52%
Mar
$17,542
$2,658
$0
-----------$2,658
$14,885
84.85%
Apr
$23,167
$2,208
$0
-----------$2,208
$20,960
90.47%
May
$23,167
$2,208
$0
-----------$2,208
$20,960
90.47%
$500
$200
$0
$3,000
$0
$75
$150
$1,300
$0
$300
$0
$250
$200
-----------$5,975
($3,691)
$33
$0
($931)
$0
($2,793)
-69.10%
$500
$200
$0
$3,000
$0
$75
$150
$1,300
$0
$300
$0
$250
$0
-----------$5,775
($3,491)
$38
$0
($882)
$0
($2,646)
-65.46%
$500
$200
$0
$3,000
$0
$75
$150
$1,300
$0
$300
$0
$250
$0
-----------$5,775
$9,110
$42
$0
$2,267
$0
$6,801
38.77%
$500
$200
$0
$3,000
$0
$75
$150
$1,300
$0
$300
$0
$250
$300
-----------$6,075
$14,885
$46
$0
$3,710
$0
$11,129
48.04%
$500
$200
$0
$3,000
$0
$80
$150
$1,300
$0
$300
$1,000
$250
$0
-----------$6,780
$14,180
$50
$0
$3,532
$0
$10,597
45.74%
m
a
Page 4
Appendix
Appendix Table: Cash Flow (Planned)
Pro Forma Cash Flow
Cash Received
Cash from Operations:
Cash Sales
From Receivables
Subtotal Cash from Operations
Additional Cash Received
Extraordinary Items
Sales Tax, VAT, HST/GST Received
New Current Borrowing
New Other Liabilities (interest-free)
New Long-term Liabilities
Sales of other Short-term Assets
Sales of Long-term Assets
New Investment Received
Subtotal Cash Received
0.00%
Jun
Jul
Aug
Sep
Oct
Nov
Dec
Jan
$3,218
$0
$3,218
$6,096
$191
$6,286
$13,988
$528
$14,516
$10,725
$1,145
$11,870
$7,688
$1,361
$9,049
$7,688
$1,012
$8,700
$7,688
$854
$8,542
$0
$0
$500
$0
$0
$0
$0
$0
$3,718
$0
$0
$500
$0
$0
$0
$0
$0
$6,786
$0
$0
$500
$0
$0
$0
$0
$0
$15,016
$0
$0
$500
$0
$0
$0
$0
$0
$12,370
$0
$0
$500
$0
$0
$0
$0
$0
$9,549
Expenditures
Expenditures from Operations:
Cash Spent on Costs and Expenses
Wages, Salaries, Payroll Taxes, etc.
Payment of Accounts Payable
Subtotal Spent on Operations
Jun
Jul
Aug
Sep
$179
$3,000
$10,054
$13,233
$292
$3,000
$1,644
$4,936
$615
$3,000
$2,727
$6,342
$606
$3,000
$5,533
$9,139
Additional Cash Spent
Sales Tax, VAT, HST/GST Paid Out
Principal Repayment of Current Borrowing
Other Liabilities Principal Repayment
Long-term Liabilities Principal Repayment
Purchase Other Short-term Assets
Purchase Long-term Assets
Dividends
Adjustment for Assets Purchased on Credit
Subtotal Cash Spent
$0
$0
$0
$0
$0
$0
$0
$0
$13,233
$0
$0
$0
$0
$0
$0
$0
$0
$4,936
$0
$0
$0
$0
$0
$0
$0
$0
$6,342
$0
$0
$0
$0
$0
$0
$0
$0
$9,139
($9,514)
$242
$1,850
$2,092
$8,674
$10,766
$3,231
$13,997
Net Cash Flow
Cash Balance
u
B
n
i
s
s
e
P
s
n
la
S
o
e
l
p
Feb
Mar
Apr
May
$3,638
$854
$4,492
$3,638
$614
$4,252
$15,788
$404
$16,192
$20,850
$1,124
$21,975
$20,850
$2,054
$22,905
$0
$0
$500
$0
$0
$0
$0
$0
$4,992
$0
$0
$500
$0
$0
$0
$0
$0
$4,752
$0
$0
$500
$0
$0
$0
$0
$0
$16,692
$0
$0
$500
$0
$0
$0
$0
$0
$22,475
$0
$0
$500
$0
$0
$0
$0
$0
$23,405
m
a
$0
$0
$500
$0
$0
$0
$0
$0
$9,200
$0
$0
$500
$0
$0
$0
$0
$0
$9,042
Nov
Dec
Jan
Feb
Mar
Apr
May
$481
$3,000
$4,073
$7,554
$431
$3,000
$4,313
$7,744
$376
$3,000
$3,862
$7,238
$361
$3,000
$3,379
$6,741
$767
$3,000
$3,373
$7,140
$896
$3,000
$6,938
$10,835
$949
$3,000
$8,083
$12,031
$0
$0
$0
$0
$0
$0
$0
$0
$8,862
$0
$0
$0
$0
$0
$0
$0
$0
$7,554
$0
$0
$0
$0
$0
$0
$0
$0
$7,744
$0
$0
$0
$0
$0
$0
$0
$0
$7,238
$0
$0
$0
$0
$0
$0
$0
$0
$6,741
$0
$0
$0
$0
$0
$0
$0
$0
$7,140
$0
$0
$0
$0
$0
$0
$0
$0
$10,835
$0
$0
$0
$0
$0
$0
$0
$0
$12,031
$687
$14,684
$1,645
$16,329
$1,298
$17,627
($2,246)
$15,380
($1,989)
$13,392
$9,552
$22,944
$11,640
$34,583
$11,373
$45,956
r
P
Oct
$452
$3,000
$5,410
$8,862
Copyright © Palo Alto Software, Inc. 1995-2007 All rights reserved. Not for resale, reproduction, publication, or distribution. www.paloalto.com
Page 5
Appendix
Appendix Table: Balance Sheet (Planned)
Pro Forma Balance Sheet
Assets
Short-term Assets
Cash
Accounts Receivable
Other Short-term Assets
Total Short-term Assets
Long-term Assets
Long-term Assets
Accumulated Depreciation
Total Long-term Assets
Total Assets
Starting Balances
$9,756
$0
$20,000
$29,756
Jun
$242
$358
$20,000
$20,599
Jul
$2,092
$844
$20,000
$22,936
Aug
$10,766
$1,870
$20,000
$32,636
Sep
$13,997
$1,917
$20,000
$35,914
Oct
$14,684
$1,410
$20,000
$36,094
Nov
$16,329
$1,253
$20,000
$37,582
$7,000
$0
$7,000
$36,756
$7,000
$150
$6,850
$27,449
$7,000
$300
$6,700
$29,636
$7,000
$450
$6,550
$39,186
$7,000
$600
$6,400
$42,314
$7,000
$725
$6,275
$42,369
$7,000
$815
$6,185
$43,767
Accounts Payable
Current Borrowing
Other Short-term Liabilities
Subtotal Short-term Liabilities
$10,000
$0
$0
$10,000
Jun
$1,556
$500
$0
$2,056
Jul
$2,542
$1,000
$0
$3,542
Aug
$5,351
$1,500
$0
$6,851
Sep
$5,275
$2,000
$0
$7,275
Oct
$3,929
$2,500
$0
$6,429
Long-term Liabilities
Total Liabilities
$0
$10,000
$0
$2,056
$0
$3,542
$0
$6,851
$0
$7,275
$0
$6,429
$50,000
($23,244)
$0
$26,756
$36,756
$26,756
$50,000
($23,244)
($1,363)
$25,393
$27,449
$25,393
$50,000
($23,244)
($662)
$26,094
$29,636
$26,094
$50,000
($23,244)
$5,579
$32,335
$39,186
$32,335
$50,000
($23,244)
$8,283
$35,039
$42,314
$35,039
$50,000
($23,244)
$9,184
$35,940
$42,369
$35,940
Liabilities and Capital
Paid-in Capital
Retained Earnings
Earnings
Total Capital
Total Liabilities and Capital
Net Worth
u
B
n
i
s
s
e
P
s
n
la
r
P
Nov
$4,184
$3,000
$0
$7,184
$0
$7,184
$50,000
($23,244)
$9,827
$36,583
$43,767
$36,583
Dec
$17,627
$1,253
$20,000
$38,880
Jan
$15,380
$803
$20,000
$36,183
S
o
Feb
$13,392
$593
$20,000
$33,984
m
a
e
l
p
Mar
$22,944
$1,943
$20,000
$44,887
Apr
$34,583
$3,135
$20,000
$57,719
May
$45,956
$3,398
$20,000
$69,354
$7,000
$1,115
$5,885
$50,772
$7,000
$1,190
$5,810
$63,529
$7,000
$1,270
$5,730
$75,084
$7,000
$890
$6,110
$44,990
$7,000
$965
$6,035
$42,218
$7,000
$1,040
$5,960
$39,944
Dec
$3,750
$3,500
$0
$7,250
Jan
$3,271
$4,000
$0
$7,271
Feb
$3,143
$4,500
$0
$7,643
Mar
$6,670
$5,000
$0
$11,670
Apr
$7,798
$5,500
$0
$13,298
May
$8,256
$6,000
$0
$14,256
$0
$7,250
$0
$7,271
$0
$7,643
$0
$11,670
$0
$13,298
$0
$14,256
$50,000
($23,244)
$10,984
$37,740
$44,990
$37,740
$50,000
($23,244)
$8,191
$34,947
$42,218
$34,947
$50,000
($23,244)
$5,545
$32,301
$39,944
$32,301
$50,000
($23,244)
$12,346
$39,102
$50,772
$39,102
$50,000
($23,244)
$23,475
$50,231
$63,529
$50,231
$50,000
($23,244)
$34,072
$60,828
$75,084
$60,828
Copyright © Palo Alto Software, Inc. 1995-2007 All rights reserved. Not for resale, reproduction, publication, or distribution. www.paloalto.com
Page 6


© Copyright 2026