
Enhancing Permanent Sample Plot System in Indonesian Forest Resource Management Emma Soraya
INAFOR 11P-001 INTERNATIONAL CONFERENCE OF INDONESIAN FORESTRY RESEARCHERS (INAFOR) Enhancing Permanent Sample Plot System in Indonesian Forest Resource Management Emma Soraya Faculty of Forestry, University of Gadjah Mada, Yogyakarta, INDONESIA Fenner School of Environment and Society, The Australian National University, Canberra Corresponding email: [email protected]; [email protected] Poster paper prepared for The First International Conference of Indonesian Forestry Researchers (INAFOR) Bogor, 5 – 7 December 2011 INAFOR SECRETARIAT Sub Division of Dissemination, Publication and Library FORESTRY RESEARCH AND DEVELOPMENT AGENCY Jl. Gunung Batu 5, Bogor 16610 702 Enhancing Permanent Sample Plot System in Indonesian Forest Resource Management Emma Soraya Faculty of Forestry, University of Gadjah Mada, Yogyakarta Fenner School of Environment and Society, The Australian National University, Canberra Corresponding email: [email protected]; [email protected] ABSTRACT Nowadays there are massive and rapid improvements of science and technology that support management of forest resources to be sustainable. The improvements are particularly in providing better information for decision makers. One important component that determines the quality of forest resource information is data from regular measured permanent sample plots (PSP). To provide meaningful information, PSP should be well established and monitored/remeasured thus resulted in a good database that able to inform forest managers. Objective of this literature study is to review why and how PSP system should be established and monitored; review how is the performance of PSP system in Indonesia in supporting forest resource management and how to enhance current performance to obtain the optimal benefit of PSP system. PSP system establishment and its monitoring are expensive. However, establishment and monitoring of PSP system is a crucial part of forest management process. Not solely important for forest management unit level, but also very essential at national level. Therefore, government could take a significant role as a facilitator in establishment and monitoring of PSP system and up to dissemination of information resulted from PSP data. Keywords: Permanent sample plots (PSP), forest resource management 1. INTRODUCTION Current massive and rapid improvements of science and technology are available widely to support management of forest resources to be sustainable. The improvements are mainly to provide better information for decision makers, such as the utilization remote sensing data and application of geographical information system, computer modeling and statistics. Despite those massive improvements, since definitions of sustainability vary in time and space as global expectations and aspirations change, so there can be no one magic answer to ensure sustainability (Sayer et al., 2005). To manage forest resources, managers need good resource information and decision support system (Sayer et al., 2005; Vanclay et al., 1995). One important component that determines the quality of forest resource information is data from regular measured permanent sample plots (PSPs). PSP is a plot that is established mainly to monitor forest resource dynamics and change over time, including its ingrowth, upgrowth, and mortality. The aims of forest resource monitoring were to collect data on the current forest status such as forest area, forest distribution, and to monitor forest changes. Whilst remote sensing is considered as the main technique to collect the data for forest resource monitoring, it still needs to refer to field data, i.e. PSP data. To provide meaningful information, PSP should be well established and monitored/ re-measured thus resulted in a good database that able to inform forest managers. Re-measured PSPs provide important basis data from the field in regulating forest yield. PSP data reflects the regeneration of forest and need periodical update to offer valid future forecast. As the ultimate, PSP is a crucial component in assuring forest resource management (Figure 1). 703 PSP system establishment and its monitoring are expensive since all cost spent in its establishment and monitoring could not increase forest products‘ selling price. This is the same case with forest inventory. However, establishment and monitoring of PSP system is a crucial part of forest management process. Not solely important for forest management unit level, but also very essential at national level. Objective of this literature study is to review the what, why and how PSP system should be established and monitored; review how is the performance of PSP system in Indonesia in supporting forest resource management and how to enhance current performance to obtain the optimal benefit of PSP system. It is timely to be reviewed PSP system in Indonesia, since there are several changes. First, technological developments ease many earlier impediments in data collection and storing as well as processing huge amount serial data; and second, more limited resources and demand on more accurate and complete data from the field (Beetson et al., 1992). Resource Inventory PSP Volume Equations Annual Increment Growth and Yield Model and Simulations Yields Estimate (Annual Allowable Cut) Future Prediction of Forest Resources Long-term Management Planning Figure 17: Position and importance of PSP system in determining sustainable forest management 2. ESTABLISHING AND MONITORING of PSP SYSTEM In order to understand what happens in forest, it is necessary to monitor the resources to measure change and to predict changes. Many ecological and management research and monitoring activities rely on data from PSP system (Sheil, 1995). This includes but not limited to development of growth models and yield simulations, to assess alternative management strategies (Beetson et al., 1992), and biomass and carbon stock changes over time. Sheil (1995) affirms that understanding of forest complex ecosystems relies on established and maintained more and larger PSP studies. Accurate and applicable PSP system should be established in an efficient manner since its importance inherits with high resources requirement in its establishment and maintenance. PSPs should be established across forest area represent all range of forest resource condition, such as species, site conditions (topoclimate), and silvicultural treatments. Thus, they are able to adequately determine the extent and nature of forest resources. This adequacy could be measured by comparing PSPs data to resource survey data (Beetson et al., 1992). Strategic plotting of PSPs shows by PSPs data equates to forest inventory data. This comparison results could be used to assess whether the existing plots cover full range of data space and thus the need on additional plots, plots that should be moved or mdified, or abandoning redundant plots would be also known (Beetson et al., 1992). Additional plots could be established on areas with high variance on its predictions (Beetson et al., 1992). 704 Further, Beetson et al. (1992) also propose criteria of efficient PSP system, and thus could obtain its optimal benefits. The criteria include: established on lands with secure tenure; based on optimal sampling strategy from prior information (e.g.: topography and vegetation maps); well mapped; offers valid future forecast/ extrapolations; measured periodically in a recorded standard techniques; and provides all information required in monitor forest changes. Plotting PSPs in strategic locations is a main issue in forestry, since reliable and well recorded long-term data determines the sustainability of forest logging. Therefore, it is essential to establish PSPs on secure lands. Further, the availability of prior information on forest resource could be use as base in plotting PSPs on the field. Prior information could be used to stratify the forest according to geography, yield (total basal area or volume) or soil type (Beetson et al., 1992). It is useless and costly to establish too many PSPs that redundant in the same strata and have no assurance on their re-measurements caused by land use change and insufficient resource to conduct re-measurements. It is critical to map locations, access, distances of PSPs to identifiable points on the ground. Is it intended that a PSP is only could be found by people who establish or monitor it. Currently, it is easier to determine and record geographical co-ordinates of PSP using Global Positioning System (GPS). Growth data can only be obtained if time elapsed. Full utilization of growth data can only be assured if the data obtained from well managed and regularly measured plots (Beetson et al., 1992). Ideal time interval to re-measured PSPs is 5 to 10 years (Ranneby and Rovainen 1995; Beetson et al., 1992). In shorter interval, it is possibly occur that measurement errors is higher than the increment over the interval; and if more than 10 year interval, plots, tags, and records may be lost and useless (Beetson et al., 1992). Bias and errors possibly occur in the utilization of PSP system data from plot establishment through data interpretation, i.e.: methodology and inappropriate analysis. Those bias and errors could be recognized and minimized as suggested by Sheil (1995) on his study on PSP system in Budongo Forest in Uganda. 3. PSP MEASUREMENT AND RECORDING PROCEDURES PSPs data is a time series data. To optimally utilize the data, its measurement technique and procedure should be standardized and recorded. Over time, the needs on information from PSP data increase. Thus, the measurement procedures in the field are changed and improved to fulfill new requested information. The improved procedures should be well recorded and assured that the new measurement data is compatible with the earlier ones. The usual variables measured in the field are: diameter at breast height (DBH), tree height, crown height, maximum branch diameter, predominant height, as well as changes in tree features, e.g.: normal living, thinned or felled, and sample height tree. 4. PSP SYSTEM IN INDONESIA In decree of minister of forestry P.10/Menhut-II/2006, stated in chapter V that any forest management unit (FMU) is obligated to establish and monitor PSP. Forest research and development agency (FORDA) is the agent that obliged to assist FMU in PSPs establishment and monitoring. FORDA also published practical manual procedure regarding of PSP establishment and monitoring. However, it is reported in an international workshop on Promoting PSP in Asia and the Pacific Region that organized by Center for International Forestry Research (CIFOR) in 2005 that since 1999, most of FMU did not establish, monitor and report their PSP monitoring data to MoF since PSP data was not obligated anymore to be used in developing their annual working plan (Imanuddin and Wahjono, 2006). Further, even in decree on concession renewal gave score of 1 out of 5 or 4 if a FMU does not establish any PSP in their concession area (decree of minister of forestry 732/Kpts-II/1998 and 307/KPTS-II/1999). 705 PSPs also have established as part of plot clusters in Indonesia‘s National Forest Inventory (NFI) since 1989-1996. There were 2,735 cluster plots established and more than 1200 PSPs have been re-enumerated since 1995. It is reported that some NFI‘s PSPs disappeared due to forest exploitation, fire, and conversion. It is expected that available PSP system is able to provide past records on management approach applied in the forests that also will help in correcting unsustainable practices in forest management. Unfortunately, whilst there are massive PSPs have been established, it is reported in international workshop on Promoting PSP in Asia and the Pacific Region that the policy in determining national level of Annual Allowable Cut (AAC) had not based on the information from PSP system (Priyadi et al., 2006). However, on the other hand, there are massive studies utilized PSPs data in Indonesia (e.g. Krisnawati et al., 2008; Wahjono and Imanuddin, 2007; Krisnawati and Wahjono, 2004). Those studies seem only as published documents, but still could not reach the policy makers as base information in determining AAC in Indonesia. Some constraints reported in managing the existing PSP system are limited budget, trained personnel, records on measurement techniques, and hard/soft-ware. Existing PSPs as a continuing observation of forest changes overtime is often neglected in Indonesia that caused by unawareness of forest managers. This unawareness is mainly due to ‗imbalance competition‘ on vision between sustainability and financial gain (Priyadi et al., 2006). 5. ENHANCING PSP SYSTEM IN INDONESIA Reflect on the important PSP system in assuring sustainable forest management, securing and reviewing existing PSP could not be neglected. Establishment of additional plots should also consider the available resources since establishment, management and re-measurement. Indonesia has abundance types of forests. To be able sustainably manage all of this diverse resources, suggested by Imanuddin and Wahjono (2006) that it is crucial to establish national growth and yield network. By establishing reliable PSP system, the information provided can be used as the base of policy in determining AAC at national level that assuring the sustainability of forest resources. More and more information on forest resources demands seems could not be avoided, it is not limited to growth and mortality data, but also information on services other than wood and forest health such as biomass and carbon stocks (Murdiyarso, 2006; Top et al., 2004). This needs follow-up and further development of PSP system in the future. This information can be provided by reliable PSP system and data shared within PSP network as well as other forest inventory schemes. The network will make possible further use and for wider purposes, e.g.: environmental services (Priyadi et al., 2006). There is a concern in the need of information sharing internationally. IUFRO since 1994 already published a guideline in establishing and monitoring PSPs. Government (in this case, Ministry of Forestry) could take a role as an active facilitator in assuring PSPs establishment and monitoring. MoF also could be as the agent of dissemination of information resulted from its analysis. The last but not least, it is also necessary that PSPs data and information resulted from data analysis should be shared for research, management, inventories, and remote sensing verification. Vanclay (1997) suggests various graphical analyses that could be done for growth data analysis. Those methods could be applied to obtain the most out of PSP system data. 6. CONCLUDING REMARKS Re-measured PSPs data is a vital field data that determine the quality of decision made in forest management practices. PSP system is one of crucial components to obtain sustainability in forest management when it is able to provide information on forest changes as well as offers future forecast. To be able provide such data efficiently, PSP system should be well maintained 706 and regularly re-enumerated, therefore a network of PSPs is a necessity. Government (Ministry of Forestry) could be an active facilitator in assuring its establishment and monitoring as well as dissemination of information resulted from its analysis. Existing PSPs should be reviewed and evaluated and also secured in term of their existing in the fields as well as resources to manage and monitor/ re-enumerate them. Existing PSPs should be managed in an improve PSP system network thus it could efficiently and accurately applied as basic information in managing forest resources in Indonesia. Establishment of additional PSPs should consider the available resources for maintenance and re-enumeration and covers all variation in forest resources conditions: sites (ecotype and site quality) and management applied. REFERENCES Beetson T, Nester M and Vanclay J (1992): Enhancing a permanent sample plot system in natural forests. The Statistician, pp.525-538. Imanuddin R and Wahjono D (2006): The utilization of growth and yield data to support sustainable forest management in Indonesia. In Permanent Sample Plots. p. 87. Krisnawati H and Wahjono D (2004): Riap Diameter Tegakan Hutan Alam Rawa Bekas Tebangan di Provinsi Jambi. Jurnal Penelitian Hutan dan Konservasi Alam, 1, pp.156-166. Krisnawati H, Suhendang E and Parthama I P (2008): Model Pertumbuhan Matrik Transisi Untuk Hutan Alam Bekas Tebangan Di Kalimantan Tengah (transition Matrix Growth Models for Logged-Over Natural Forest in Central Kalimantan). Jurnal Penelitian Hutan dan Konservasi Alam, V(2), pp.107-128. Murdiyarso, D (2006): The importance of permanent sample plot network for climate change projects. Permanent Sample Plots, p.111. Priyadi H, Gunarso P and Kanninen M (2006): Permanent sample plots. Ranneby B and Rovainen E (1995): On the determination of time intervals between remeasurements of permanent plots. Forest Ecology and Management, 71(3):195-202. Sayer J A, Vanclay J K and Byron N (2005): Technologies for sustainable forest management: challenges for the 21st Century. The Earthscan reader in forestry and development, p.264. Sheil, D (1995): A critique of permanent plot methods and analysis with examples from Budongo Forest, Uganda. Forest Ecology and Management 77(1-3):11-34. Top N, Mizoue N and Kai S (2004): Estimating forest biomass increment based on permanent sample plots in relation to woodfuel consumption: a case study in Kampong Thom Province, Cambodia. Journal of Forest Research 9(2):117-123. Vanclay, J K (1997): Getting the most out of your permanent plot data. In Growth Studies in Moist Tropical Forests in Africa. pp. 43-48. Vanclay J K, Skovsgaard J P and Pilegaard Hansen C (1995): Assessing the quality of permanent sample plot databases for growth modelling in forest plantations. Forest Ecology and Management, 71(3), pp.177-186. Wahjono D and Imanuddin R (2007): Model Dinamika Struktur Tegakan Untuk Pendugaan Hasil Di Pt. Intracawood Manufacturing, Kalimantan Timur (Stand Structure Dynamic Model for Yield Estimation in Pt. Intracawood Manufacturing, East Kalimantan). Jurnal Penelitian Hutan dan Konservasi Alam, IV(4):419-428. 707 INAFOR 11P-002 INTERNATIONAL CONFERENCE OF INDONESIAN FORESTRY RESEARCHERS (INAFOR) Ecosystem Services Provided by Birds in Different Habitats Asep Ayat1 and Hesti Lestari Tata2,3 1Burung Indonesia, Jl. Ahmad Yani, Bogor, INDONESIA Corresponding email: [email protected] 2The Center for Research and Development on Forest Conservation and Rehabilitation Jl. Gunung Batu 5, Bogor 16610, INDONESIA 3World Agroforestry Centre (ICRAF), Bogor, INDONESIA Poster paper prepared for The First International Conference of Indonesian Forestry Researchers (INAFOR) Bogor, 5 – 7 December 2011 INAFOR SECRETARIAT Sub Division of Dissemination, Publication and Library FORESTRY RESEARCH AND DEVELOPMENT AGENCY Jl. Gunung Batu 5, Bogor 16610 708 Ecosystem Services Provided by Birds in Different Habitats Asep Ayat1 and Hesti Lestari Tata2,3 1Burung Indonesia, Jl. Ahmad Yani, Bogor, INDONESIA Corresponding email: [email protected] 2The Center for Research and Development on Forest Conservation and Rehabilitation Jl. Gunung Batu 5, Bogor 16610, INDONESIA 3 World Agroforestry Centre (ICRAF), Bogor, INDONESIA ABSTRACT Birds play pivotal roles in many ecosystems and the benefits humans derive from them. Birds and their functional roles are affected by habitat change and disturbance to variable degrees. We examined bird composition in three habitats in North Sumatra: natural forests, rubber agroforests (RAF) and rubber monoculture plantations (RMP). The birds were observed using a quick biodiversity survey protocol. Changes in structure and composition of vegetation in agriculture and cleared land influenced bird species composition across feeding guilds; we discuss impacts this may have on ecosystems services. Keywords: Agroforest, guild type, plantation, rubber, quick biodiversity survey 1. INTRODUCTION Forest ecosystems in various stages of transformation and conversion provide goods and services that benefit humankind. Bird, as one of ecosystem components, contributes ecosystem services, usually discussed as provisioning, regulating, supporting and cultural services. Birds play many roles, including as pollinators, seed dispersers, predators, and providers of pest control. However, human activities alter the natural ecosystems, such as forest, into agricultural lands, plantations and development of infrastructure for industrial activities. Intensification of land management, like in monoculture plantation, increases yield and productivity. On the other hand, it affects habitats and diversity of flora and fauna. In a disturbed area, roles of birds may be limited due to changes of their habitat. Since the nineteenth century, forest cover in Sumatra has declined drastically, mainly owing to human activities, with early conversion focused on North Sumatra province. The natural vegetation in forested areas has changed to man-made ecosystems, such as agroforest, tree plantation and agriculture. For centuries, Sumatran smallholder farmers practiced traditional systems of mixed agriculture involving annual crops and perennial trees—such as food, fruit trees and resin—to form a typical forest-like structure; hence its designation as an agroforestry system. Agroforestry offered such alternative that could balance needs of generate income and ecology-friendly. Different composition of flora species and structure of vegetation in different habitat affected birds composition (Styring et al., 2011). However, little is known about ecosystem services provided by birds on different land use types in North Sumatra. This paper focused on roles of birds, which are based on foraging behavior, occurred at different habitats in North Sumatra. 2. METHODS The study was conducted in three habitats, viz. rubber monoculture plantations (RMP), rubber agroforests (RAF) and forest areas, in two districts of Simalungun and Aek Tarum, North 709 Sumatra. The birds were observed by using a descriptive survey methods by implementing a quick biodiversity survey protocol for birds, where data were collected along a line transect of 1 km and the list of 20 MacKinnon‘s (MacKinnon et al., 1993). The list of 20 MacKinnon‘s bird species is a recording method to verify the species of birds and to calculate the density of bird species. Data were tabulated and identified referred to the nomenclature (Sukmantoro et al., 2007). Birds were then grouped into foraging behaviors or guild types (Lambert and Collar, 2002). Data were analysed using descriptive analysis. 3. RESULT AND DISCUSSION 3.1 Foraging Types A total of 17 foraging types was identified in the survey: arboreal frugivore (AF), arboreal foliage gleaning insectivore (AFGI), arboreal foliage gleaning insectivore-frugivore (AFGIF), arboreal frugivore-predator (AFP), aerial insectivore (AL), bark gleaning insectivore (BGI), miscellaneous insectivor-pincifore (MIP), nectivore (N), nocturnal predator (NP), nectivoreinsectivore-frugivore (NIF), piscivore (P), raptor (R), sallying insectivore (SI), sallying substrate gleaning insectivore (SSGI), terrestrial frugivore (TF), terrestrial insectivore (TI) and terrestrial insectivore-frugivore (TIF). All feeding groups were present in forests, while in RAF and RMP the piscivore (P) and terrestrial insectivore-frugivore (TIF) feeding groups were absent. In the RMP, further losses occurred in that the frugivore-predator (AFP), nectivore (N), terrestrial frugivore (TF) were also lacking, but it included nocturnal predators (NP), not observed in RAF (Figure 1). Forest habitat had the highest species richness (122 species) compared with species richness in RAF (46 species) and RMP (30 species) (Ayat, 2010). Forests provide suitable conditions for many bird species for foraging, nesting, resting and breeding. Forest degradation and habitat loss influence bird population and composition. Within this data set bird species diversity is non-linearly associated with tree diversity. Similar evidence reported in comparison between forest and Acacia mangium plantation (Styring et al., 2011). 80% 60% RMP 40% RAF FOREST 20% 0% AF AFGI AF… AFP AI BGI MIP N NP NIF P R SI SSGI TF TI TIF Composition Percentage 100% Figure 1: Composition of bird guild types in different habitats in North Sumatra (Ayat, 2011) Remarks: RMP=Rubber monoculture, RAF=Rubber Agroforest. AF=arboreal frugivore, AFGI=arboreal foliage gleaning insectivore, AFGIF= arboreal foliage gleaning insectivore-frugivore, AFP=arboreal frugivore-predator, AI=aerial insectivore, BGI=bark gleaning insectivore, MIP=miscellaneous insectivore-piscivore, N=nectivore, NP=nocturnal predator, NIF=nectivore-insectivore-frugivore, P=piscivore, R=raptor, SI=sallying insectivore, SSGI=sallying substrate gleaning insectivore, TF=terrestrial frugivore, TI=terrestrial insectivore and TIF=terrestrial insectivore-frugivore. 710 3.2 Mutualism Association of Bird and Plant Birds through their mobility connect habitats in a landscape, involving energy transfer among ecosystems, and contribute to ecosystem functions and resilience through their foraging and seed dispersal. Bird-plant interaction of pollination and seed dispersers have large impacts on ecosystems (Lunberg and Moberg, 2003). Pollination process of some trees species is assisted by birds. Nectivorous birds (family: Nectariniidae) that only consume nectar and pollinate some trees species, were encountered in both forests and RAF, but not found in RMP. RMP was dominated by rubber trees (at all stages). Rubber trees are insect pollinated (Warmke, 1952). Four species of nectivores encountered in both forest and RAF were Anthreptes singalensis, Cinnyris jugularis, Arachnothera affinis and Anthreptes malacensis (Ayat, 2011). Birds disperse seeds through fruit consumptions. Frugivorous birds (family: Columbidae and Sturnidae) that only consume fruits as their diet, were encountered in the three habitats. Birds disperse seeds of many woody plant species with direct value to humans for timbers, medicine, food and other uses. Numbers of frugivory birds and combination of frugivory and other feedings were encountered in forests. ln RAF and RMP, on the other hand, were found less frugivory birds. Large frugivorous birds, such as Bucerotidae, were not found in either RAF or RMP. They have high susceptibility to anthropogenic and environment change. Large-bodied fruits require large frugivorous birds to carry and disperse fruits to larger distances from mother trees. Lower density and smaller size of frugivorous birds may result in seedlings being concentrated under the mother trees and less seedling dispersal (Wenny et al., 2011). In consequence, tree diversity of ecosystems is expected to decline over the longer term. Agroforests provide food for frugivorous species, but hunting pressure on the larger birds may reduce effectiveness of seed dispersal. 3.3 Pest Control Insectivorous birds provide regulating services in pest control. One species of the Apodidae family belonging to the aerial insectivore (AI) guild, Collocalia esculenta (glossy swiftlet), was encountered in the three habitats. Consumption of flying arthropods and reducing the population of herbivorous insects potentially benefits humans in improving growth and yield of agriculture commodities. Some bird species (predator and raptor guild types) benefit agriculture. Raptors (e.g. eagles, family: Accipitridae) and predators (e.g. owls, family: Strigidae) consume rats (rodents), which are considered as pest of crops and tree crops (such as oil palm). Very few study on the potential relation of birds in the natural ecosystems and agricultural ecosystems. 3.4 Nutrient Cycling Birds contribute in nutrient cycling of ecosystems. Aquatic and marine birds produce guano, which is beneficial as phosphor fertilizer (Wenny et al., 2011) Aquatic birds belongs to piscivore type consume fish. Ardea spp. and Egretta garzetta (Ardeidae) were encountered in forest only. Landscape of the study area consisted of hilly mountains, valleys, lowlands laid along rivershed of Aek Tarum and Sigura-gura. Although Piscivores are considered as a predator, they contribute to nutrient cycling in the habitats. All birds contribute in maintaining the equilibrium of food chain in the ecosystems. 4. CONCLUSION Birds provide many ecosystem services, especially regulating and supporting services, that are directly and indirectly benefit for human life. Shifting in natural ecosystems to man-made ecosystems affected bird species composition and population. Habitat loss reduces bird 711 composition and birds with specialist role have the highest risk of extinction. Rubber monoculture plantation did not provide suitable condition for all bird species. Enrichment planting of bird‘s food-tree species may attract more bird species in the plantation area for foraging and resting. Efforts to conserve habitats and bird population maintain diverse services provided by ecosystem, thus contributing to human well-being. ACKNOWLEDGEMENT This paper is based on research of ‗Towards a biodiverse rubber estate: Quick biodiversity survey of Bridgestone Sumatra Rubber Estate, North Sumatra‘. The authors gratefully acknowledge PT. Bridgestone Sumatra Rubber Estate (BSRE) Plantation for financial support of research activities. We thank Forest Research Institute Aek Nauli at Pematang Siantar for supporting facilities in the forest research station. REFERENCES Ayat, A (2011): Bird diversity in rubber plantation and its surroundings. In Tata, H.L. (ed). Recognising biodiversity in rubber plantations. World Agroforesry Centre (ICRAF) Southeast Asia Regional Program. Bogor, Indonesia. pp: 52-69. Lambert, F R, Collar, N J (2002): The Future for Sundaic Lowland Forest Birds: Long-term Effects of Commercial Logging and Fragmentation. Forktail 18:127-146. Lunberg, J, Moberg, F (2003): Mobile link organisms and ecosystem functioning: Implications for ecosytem resilience and management. Ecosystems 6:87-98. Mackinnon, J, Phillips, K (1993): A Field Guide of the Birds of Borneo, Sumatra, Java and Bali. Oxford University Press. Ningsih, H, Rahayu, S, Tata, H L (2011): Comparison of floristic composition and diversity in rubber plantations and their surroundings. In Tata, H.L. (ed). Recognising biodiversity in rubber plantations. World Agroforestry Centre (ICRAF) Southeast Asia Regional Program. Bogor, Indonesia. pp: 35-51. Styring, A R, Ragai, R, Unggang, J, Stuebing, R, Hosner, P A, Sheldon, F H (2011): Bird community assembly in Bornean industrial tree plantations: Effects of forest age and structure. Forest Ecology and Management 261:531-544. Sukmantoro, W, Irham, M, Novarino, W, Hasundungan, F, Kemp, N and Muchtar, M (2007): List of Birds Indonesia No. 2. Indonesian Ornithologist union, Bogor. Warmke H E (1952): Studies on natural pollination of Hevea brasiliensis in Brazil. Science 116(3018):474-475. Wenny, D G, DeVault, T L, Johnson, M D, Kelly D, Sekercioglu, C H, Tomback, D F and Whelan, C J (2011): The need to quantify ecosystem services provided by birds. The Auk 128(1):1-14. 712 INAFOR 11P-003 INTERNATIONAL CONFERENCE OF INDONESIAN FORESTRY RESEARCHERS (INAFOR) Enrichment Planting Technology in Timor Deer ( Rusa timorensis Blainville 1822) Captive Breeding with Mini Ranch System in Semi Arid Land Siswadi, Grace S. Saragih and Kayat Forestry Research Institute of Kupang Jl. Untung Surapati No.7 (belakang) Air Nona, Kupang 85115, INDONESIA Poster paper prepared for The First International Conference of Indonesian Forestry Researchers (INAFOR) Bogor, 5 – 7 December 2011 INAFOR SECRETARIAT Sub Division of Dissemination, Publication and Library FORESTRY RESEARCH AND DEVELOPMENT AGENCY Jl. Gunung Batu 5, Bogor 16610 713 Enrichment Planting Technology in Timor Deer ( Rusa timorensis Blainville 1822) Captive Breeding with Mini Ranch System in Semi Arid Land Siswadi, Grace S. Saragih and Kayat Forestry Research Institute of Kupang Jl. Untung Surapati No.7 (belakang) Air Nona, Kupang 85115, INDONESIA ABSTRACT East Nusa Tenggara province lies in quite extreme climate region. Climate become limiting factor for land productivity and carrying capacity is one of the main factor in timor deer captive breeding with mini ranch system. Enrichment planting is a solution to overcome limited land productivity. Carrying capacity in the mini ranch was estimated by periodic feed cutting inside 20 fenced 1x1 meter area within 1 ha area. Productivity in the mini ranch with enrichment was 72.11 kg/ha/day which can provide feed for 12.62 timor deer/ha, compared with non enrichment mini ranch area, it's carrying capacity was 2.24 timor deer/ha. Species planted for enrichment are Pennisetum purpureum, Pennisetum purpuphoides and Leucaena leucocephala. Natural grasses in the mini ranch with high palatability were Calopogiunium mucunoides, Agrantum sp, Centella asiatica, Flamengia sp., and Cyperus sp. Keywords: Carrying capacity, Timor deer, feed, grass productivity 1. INTRODUCTION 1.1 Background Potential wildlife species diversity has long been used by the community, especially animal protein-producing mammals. During its development, utilization of wildlife species were also determined to meet the needs of the animal experimental biomedicine, pharmaceuticals, industrial raw materials and commercial utilization. Wildlife trade quota is the amount determined based on the quota set by the management authorities and scientific authorities, which aim to suppress the occurrence of extinction. Timor deer (Rusa timorensis) have the potential to become an alternative source of animal protein food commodities. Meat, antlers, velvet, leather and deer have high economic value. But the International Union for Conservation of Nature (IUCN) (2009) categorize Timor deer as Vulnerable which means the animal is at high risk of extinction in the wild in the near future. One of the efforts in biodiversity conservation is the breeding activity. As stipulated in Government Regulation No. 7 and No. 8 of 1999 concerning the utilization of plant and wildlife deer can be maintained and utilized by the public, but will have to come from breeders that have legal breeding certificate. Discourse appears that in Indonesia, there should be more flexibility to breed Timor deer. In breeding activity of Timor deer or other animals can not be separated to the availability of feed. Maintenance system that exceeds the mini ranch ranch carrying capacity can lead to decreased physical condition and can lead to death. This happens due to low forage productivity. In 2001 Forest Research Institute of Kupang (Forist) had measured the carrying capacity of miniranch and obtained results that the maximum capacity during the rainy season was 3.2 deer/ha. As a follow-up, to increase the carrying capacity in the mini-ranch, in 2006 enrichment planting was done using new species of feed such as elephant grass (Pennisetum purpureum), king grass (Pennisetum purpuphoides), turi (Sesbania grandiflora) and lamtoro (Leucaena leucocephala). 714 After enrichment planting of various types of feed in the mini ranch, researchers made an assessment in order to compare the increase of carrying capacity on a mini ranch by releasing Timor deer into miniranch. The results of this activities will give an overview to the technology users that will make Timor deer breeding in smale scall or industries scale, or as a comparison of enrichment planting in semi arid area such as NTT province, which consists mostly of savanna. 1.2 Purposes The purpose of this study was to determine the carrying capacity of a mini ranch with enrichment planting on semi-arid land either during the rainy season and dry season. While the goal of this activity is to obtain information on the carrying capacity for in order to calculate the acreage needs of feed and type of feed that is planted to support the captive breeding of Timor deer. 2. METHODOLOGY 2.1 Data Collection The parameters measured in the study of the productivity of feed, palatability, carrying capacity, and nutritional value of feed. To determine the composition of plant vegetation below apart from food-producing types of feed crops, vegetation analysis was performed with a sample size of 1 m2 plots with spacing 20x20m. As for calculating the production of natural grass and other feed sources grown done by making plots 1x1m measuring which use wood and bamboo fence as high as 1 m, as was done by Alikodra in Garsetiasih (2005). The data measured by the proliferation of deer in deer weighing each end of the month, while the deer used in this trial is 5 deer consisting of one adult stag and 2 does (>18 months), 2 fawn (<18 months). The type of feed which is planted were: Leucaena leucochepala (1x1m), Sesbania grandiflora (1.5x1.5m), Pennisetum purpuphoides (30 x 100 cm), Pennisetum purpureum (30x100cm), which planted in 2006. 2.2 Feed Palatability Palatability data was collected by observing bite mark in 20 plots. The data collection technique is using a wire sized 1 m2. The feed palatability values was determined using the formula (Garsetiasih, 2005) : P= x Y where: P = Palatability X = Number of plots where bite mark observed Y = Number of plots where species can be found Carrying capacity data was collected by measuring feed productivity in 20 plots with size 1x1 m. Carrying capacity in the mini ranch was determined using the formula (Susetyo, 1980): Carrying capacity where : P = Feed productivity (kg/ha/hari) p.u = 0.70 A = Acreage which feed grows (ha) C = Timor deer feed requirement (kg/day) Timor deer feed requirements when released in the wild/ranch system is estimated only 3 kg/day (Takandjanji, 2006). Based on the results of these studies it is estimated that feed 715 consumption in mini ranch ranges from 3-4 kg/day. In order to know the difference of feed productivity in the wet season and dry season then the measurements are taken every one or two months in accordance with the growth speed of the grass/feed there. To determine the influence of the composition of feed/grass on the growth and proliferation of deer, the physical measurements were taken by weighing the deer. 2.3 Study Site Bu'at Research Station is located in the North Mollo subdistrict, approximately 7 miles southwest of the SoE city, Timor Tengah Selatan (TTS) District, with grumusol soil types, pH 6.5, elevation 840 m above sea level at the position S9o52'19" and E124o16'07. The vegetation dominated by Casuarina trees (Casuarina junghuhniana), Mahogany (Swietenia macrophylla), and Eucalyptus (Eucalyptus urophylla) while the ground cover consists of various types of natural grass. 3. RESULT AND DISCUSSION 3.1 Grass Diversity in Mini Ranch Semi-arid area have a quite extreme climate, where annual rainfall is 2352 mm/yr and the number of rainy days is 81 days, where the highest rainfall occurs in January (BPS NTT Province 2010). Dry season and rainy day caused the characteristics of groundwater supply of land is limited. This factor led to the semi sickle can not be compared with other regions in Indonesia. Vegetation analysis calculation results obtained values of 5 types of grass with the highest IVI is as shown in Table 1. Table 1. Feed with high Importance Value Index (IVI) Species Local name Hubelu Alang-alang Turi Lamtoro Kinggrass Density RD F RF IVI 156500 73000 12500 1500 24500 360.500 43.411 20.249 3.467 0.416 6.796 100.00 0.7 0.45 1.25 1.35 0.5 7.8 8.974 5.769 16.02 17.30 6.410 100 52.38 26.01 19.49 17.72 13.20 200 Scientific name Eulalia amaura Imperata cylindrica Sesbania grandiflora Leucaena eucocephalla Pennisetum purpuphoides Imperata cylindrica spread evenly in the mini-ranch, young leaf are highly preferred by deer, but the value of the protein decreases along with growth. Imperata cylindrica breed with roots and seeds are spread through the white flowers are easily carried by wind. Plant breeding is classified as very fast, while the allelophaty substance will inhibit proliferation of other grass species. 3.2 Feed Palatability In Mini Ranch Natural grass with the highest palatbility were: Nonokotkotos (Calopogiunium mucunoides), Metbesi (Agrantum sp.), Nabkaret (Centella asiatica), Nabkiu (Flamengia sp.) and Hupiok (Cyperus sp.). There are some factors that make certain feed has high palatability value, such as it‘s nutrition content (fibre & protein) and distinctive flavor. Bite marks on plants will regenerated faster when plants grow in good environmental conditions, water, climate and sufficient nutrients. 716 3.3 Timor Deer Growth in Mini Ranch Weight (kg) The results of Timor deer weighing per month in mini ranch can be seen in Figure 1. Month Figure 1: Timor deer weight growth per month Timor deer highest weight increase was in November which is 3.5 kg. Before the deer released in the mini-ranch, they are maintained in cages sized 10x12m with cut and carry feeding system. A significant weight increase was becaused they get feed from natural sources which more fresh and supply their daily feed requirement. Overall average weight increasing was 4.3 kg, where the highest increase occurred in fawn up to yearling. For deer that more than 2 years old the development does not significant, if the captive breeding purpose is to produce carcass, harvesting should be done before the deer reach aged 2 years. 3.4 Feed Productivity In Mini Ranch Kg To determine the productivity of mini-ranch, feed measurements were taken periodically in accordance with the feed growth. The results of mini ranch feed productivity measurements per month is presented in Figure 2. Month Figure 2: Annual feed productivity Rainfall is a factor that affect the productivity of feed in the mini ranch. Based on data from Central Bureau of Statistics TTS District, rainy months was from November to June, and proved to have significant impact. Based on Figure 2, feed productivity reach it‘s highest production in November 2009 to January 2010. The results of measurements of edible forage production was 72.11 kg/ha/day which means enough for 12.62 deer/ha. 717 3.5 Nutritional Role In Timor Deer Growth To determine the nutrient content of feed, the proximate analysis conducted in Laboratorium Cattle Feed Almira Kupang. To live, deer need 6-7% protein, while for optimal growth tey need protein, calcium, and phosphorus each respectively 13-16%, 0.45%, and 0.35% of the dry matter (Garsetiasih, 1990). The results of analysis of several feed in the mini-ranch is presented in Table 2. Table 2. Feed proximat analysis Local Name Alang-alang Rumput raja Hubelu Hupiok Hubikase Hukolkuna Hunaka Mepbesi Nabkaret Turi Lamtoro % Dry matter Scientific Name Dry matter Protein Imperata cylindrica Pennisetum purpuphoindes Eulalia amaura Ciperus iria Axonopus sp. Digitaria Sp. Cenchrus echinatus Agrantum sp. Centella asiatica Sesbania grandiflora Leucaena leucocephala 36.48 34.16 30.28 36.33 39.92 24.55 30.52 43.82 29.55 35.99 35.55 12.38 13.11 11.19 13.22 13.74 12.89 13.36 16.42 18.26 11.36 12.68 Fat Crude Fibre BETN Ash Ca P 1.92 2.34 2.13 1.57 2.53 1.54 1.86 2.92 3.25 1.82 2.43 32.44 29.36 30.21 29.46 29.63 25.31 31.29 30.28 31.63 31.24 30.94 46.09 45.06 45.01 43.4 43.19 50.4 43.14 37.84 36.88 47.29 43.37 7.17 10.13 11.46 12.35 10.91 9.86 10.35 12.54 9.98 8.29 10.58 0.15 0.72 0.18 0.36 0.48 0.67 0.58 1.28 1.19 0.56 0.87 0.09 0.39 0.41 0.24 0.26 0.43 0.23 0.46 0.48 0.32 0.29 Gross energy Kkal/kg 4395 3836 4207 4195 4279 4262 4268 4259 4396 4355 4276 High protein content is very influential on the of Timor deer growth. According to Susetyo (1980) forage that rich in protein, calcium, and phosphorus are good nutritious forage. Protein, calcium, and phosphorus are substances of feed that can be used as an indicator of quality of the feed. Furthermore Soegiri et al. (1981) in Garsetiasih et al. (2003) states that supplementary feeding such as corn and rice bran contains high levels of protein, palatabel, and contains vitamin B (Garsetiasih, 2007). According Semiadi (2004) minerals are inorganic elements that are generally required in small amounts compared with protein, fat or water. In body tissues, minerals function as building blocks of bones, teeth, hair, nails and antler as well as for the formation of multiple soft tissue and blood cells. The provision of manure can increase the content of crude protein in forage due to its content of N through weathering processes that occur. Protein is a complex organic material made from the amino acid composition. Excess protein consumed by the animals will overhauled and stored in the liver tissue and used by deer as energy. Timor deer needs 15 -19% protein of dry matter, where protein content is said low if it contained only (<11% Dry matter) in the feed given (Semiadi and Nugraha, 2004). All types of feed showed the protein content in sufficient quantities. Adequacy of protein content can not be separated from the growth site. In mini ranch sites, the upper layer is dominated by sandy mineral soil grumusol, while in some parts were covered by sandy rock. Fat serves as a solvent of some vitamin that will only dissolve in fat. At first the excess fat will accumulate in the digestive organs and kidneys. Fat substances in the plants produced by raw materials of carbohydrates. One element that most influence on forage digestibility is the fiber content and their relatives as selullosa, hemiselullosa and lignin. The high fiber content will tend to lower the value of the digestibility and the low digestibility reflecting the low quality of forage as a source of nutrients. In feed made from high-carbohydrate, such as bran, corn, rice and potatoes tend to have the high digestibility values, where the nutrients are easily digested (Semiadi and Nugraha, 2004). 718 4. CONCLUSION AND RECOMMENDATION 4.1 Conclusion Captive breeding with mini ranch system has some advantages and disadvantages, simple maintenance, low man power required, but it‘s establishment takes time and cost. Carrying capacity of mini ranch system in Bu‘at research station after enrichment planting is 12,62 deer/ha, it is closely related to semi arid climate in Timor island. Enrichment technology will increased carrying capacity of the mini ranch. Natural grass (feed) with highest palatability are; Nonokotkotos (Calopogiunium mucunoides), Metbesi (Agrantum sp.), Nabkaret (Centella asiatica), Nabkiu (Flamengia sp.) and Hupiok (Cyperus sp.). 4.2 Recommendation This research result may become a consideration in the development of Timor deer captive breeding and other ruminant animal species. The low carrying capacity can be enhanced with maintenance and enrichment planting of new feed species that fast growing, resistant to drought and extreme climate such as Pennisetum purpureum, Pennisetum purpuphoindes, Gliricidae sepium Stend, Sesbania grandiflora and Leucaena leucocephala. REFERENCES Garsetiasih, R (1990): Potensi lapangan rerumputan rusa di P. Menipo pada musim kemarau. Laporan Teknis. Balai Penelitian Kehutanan Kupang. Garsetiasih, R and N M Heriyanto (2003): Pemanfaatan dedak padi sebagai pakan tambahan rusa. Buletin Plasma Nutfah 9 No.2. Gersetiasih, R and N Herlina (2005): Evaluasi plasma nutfah rusa totol (Axis axsis) di halaman istana Bogor. Buletin Plasma Nutfah 11 No.1. Garsetiasih, R and M Takandjandji (2007): Model Penangkaran Rusa. Prosiding Ekspose Hasil-Hasil Penelitian. Nusa Tenggara Timur Dalam Angka (2010): BPS Provinsi Nusa Tenggara Timur. Kupang. Semiadi, G and R T P Nugraha (2004): Panduan Pemeliharaan Rusa Tropis. Puslit Biologi LIPI, Bogor. Semiadi, G (2006): Biologi Rusa Tropis. Puslit Biologi LIPI, Bogor. Susetyo, S (1980): Padang Penggembalaan. Fakultas Peternakan. IPB. Bogor. Takandjandji, M (1993): Pengaruh perbedaan manajemen terhadap pertumbuhan Rusa Timor (Cervus timorensis) di Oilsonbai dan Camplong, NTT. Santalum 12. BPK Kupang. Takandjandji, M and R Garsetiasih (2002): Pengembangan Penangkaran Rusa Timor (Cervus timorensis) dan Permasalahannya di NTT. Prosiding Seminar Nasional. Bioekologi dan Konservasi Ungulata; Puslitbang Hutan dan Konservasi Alam, Departemen Kehutanan. Bogor. Takandjandji, M and E Sutrisno (2006): Teknik Penangkaran Rusa Timor (Cervus timorensis timorensis). Balai Penelitian dan Pengembangan Kehutanan Bali dan Nusa Tenggara. Aisuli No.20. 719 INAFOR 11P-004 INTERNATIONAL CONFERENCE OF INDONESIAN FORESTRY RESEARCHERS (INAFOR) The Need to Conserve Mosaic Bamboo in Indonesia M. Charomaini Z. The Center for Research on Biotechnology and Tree Improvement Jl. Tentara Pelajar Km.15 Purwobinangun, Pakem, Sleman, Yogyakarta 55582, INDONESIA Poster paper prepared for The First International Conference of Indonesian Forestry Researchers (INAFOR) Bogor, 5 – 7 December 2011 INAFOR SECRETARIAT Sub Division of Dissemination, Publication and Library FORESTRY RESEARCH AND DEVELOPMENT AGENCY Jl. Gunung Batu 5, Bogor 16610 720 The Need to Conserve Mosaic Bamboo in Indonesia M. Charomaini Z. The Center for Research on Biotechnology and Tree Improvement Jl. Tentara Pelajar Km.15 Purwobinangun, Pakem, Sleman, Yogyakarta 55582, INDONESIA ABSTRACT Tutul bamboo (Bambusa maculata) often known by the name mosaic/ spotted bamboo because of the brown spots or mosaic appearance on the culms with green background when the culms is alive. The color becomes distinctive spotted brown with pale color background when cut and dried. The species usually are used as raw material for furniture, handicrafts, musical instruments, wall panels, flooring and popular gasings (old time kid toys in Java). Tutul bamboo could not be found in many places in Java recently. Formerly, it was easy to find product made of this species. Production center in Yogyakarta needs about 15,860 culms a year. The amount is much lower than the demand for apus (Gigantochloa apus) which is about 628,560 culms a year and wulung or black bamboo (Gigantochloa atroviolacea Widjaja) which is about 206,680 culms a year. This was evidence that demand for tutul are difficult to meet from Sleman regions or tutul culms is already depleted in Sleman region, therefore the tutul should be imported from other regions and or other provinces. Utilization of bamboo in modern times, includes the use of bamboo for composite panel material. Composite panel would be developed more beautifully using bamboo with artistic appearance such as tutul/ mosaic bamboo and wulung bamboo. Yellow bamboo would be attractive enough if there is successful effort to permanently preserve the yellow color. Tutul are considered more attractive for composite material because of the spot or mosaic appearance. Tutul bamboo grows fine in critical land Wonogiri research garden that the evidence encouraged to reproduce the tutul for conservation effort. Even though in Bali the tutul still easy to find, for the bigger island as Java, tutul would be more needed. Conservation and effort to reproduce is urgent. Keywords: Tutul/mosaic bamboo, depleted, artistic appearance, reproduce, conservation 1. INTRODUCTION Bambusa maculata or tutul bamboo is used primarily for furniture but also musical instruments, wall panels, flooring and handicrafts (Anonymous, 2009). Two of the strongest varieties of bamboo are Tutul Bamboo (Bambusa maculata) and Bamboo Duri (Bambusa blumeana) which is known to be durable and drought-resistant enough to establish a shelter-belt in dry conditions. According to Arief Rabik, Coordinator of the Environmental Bamboo Foundation (EBF), the shelter belts are to be planted in phases. Bamboo trees are also fast-growing and tall (Anonymous, 2011). Bamboo handicraft business has existed in Hamlet Sendari, Mlati, Sleman, Yogyakarta since the 1960's. The supply of bamboo is not only derived from Yogyakarta and in vicinity but also from Klaten, Wonogiri, and Magelang, Central Java. Interest on the type of furniture made from wulung bamboo is about 70%. While the 30% is on tutul bamboo, petung, and apus. 721 Figure 1: Bamboo furniture center Yogyakarta Source: Yogya-mu Figure 2: Tutul bamboo furniture Source: Tribun Manado Thirty seven bamboo species were classified as Endangered in Indonesia. A total of 1250 species of bamboo spread across the world. Of these, 159 of whom are in Indonesia and 88 are endemic bamboo species of the archipelago. Other types of bamboo that have been classified as rare is the tutul/ mosaic bamboo and black bamboo (wulung) (Anonymous, 2008). The spot on tutul bamboo has an aesthetic value. So it could be used for furniture raw materials. Even branches can be used as well, "said Jatmika (Syaiful, 2011). This bamboo diameter approximately is 9 cm. Uniquely, this bamboo has a golden yellow color and tutul (spots) in black or brown when the culm dies and dried. When the culm is still alive, the brown color is not so visible because the background is dark green. Jatmika said that the cause of scarcity is the conversion of land into residential areas. In addition, There is an assumption that bamboo is a wild plant that is free to be exploited. Everyone can exploit whenever they want. This just adds other catasthrope to rarely found bamboos. Conservation efforts should be made on bamboo. According to Jatmika, bamboo conservation would benefit not only ecological but also economical. Another assumption is that bamboo not good for building materials happened after Yogyakarta earthquake. Home made of bamboo for people affected by the earthquake was made in vain, do not pay attention to the bamboo harvesting seasons (Javanese people say should be the seventh and ninth season) so that the bamboo materials used did not last long, only 2-3 months had rotted, adds to the image that bamboo is not good for house building(Anonymous, 2010). There are bamboo grows in Papua New Guinea called New Guinea Black Bamboo (Bambusa ‗New Guinea Black‘) which is now known as ―New Guinea Brown‖. The culms have mottled appearance similar to tutul Bamboo (Bambusa maculata) from Bali (Anonymous, 2009). So far the latin name of the species is not known yet. 2. ABOUT TUTUL BAMBOO Tutul bamboo in Indonesia mostly belongs to the genus Bambusa which is B. maculata. The brown spotted or mottled are sometimes scattered or in a ring configuration with the green background on the culm. 722 Figure 3: Tutul bamboo alive in Gunung Kidul, Yogya Source: Charomaini Figure 4: Tutul bamboo as vase in Bali (Bambusa) Source: Bali spirit festival Figure 5: Mottled bamboo (center) (Phyllostachys ?) Source: INBAR Special edition In Nusa Tenggara Barat, the spotted bamboo can still be found, but for the large amount, is difficult to find. The 1990s, there was still found the spotted bamboo stools in large diameter (Subiyanto, 2009). Figure 6: Dried and alive culms Source: Bambubos.com Spotted bamboo craft products at Ternate is in demand in Dubai and Norway. Chairs, coffee table, other household appliances for a typical raw material (Mubin, 2011). The tutul came here from China when the Chinese traders came to Ternate for buying spice long years ago. In the Forest for research in Mengkendek, Tana Toraja, Sulawesi, tutul bamboo (batik bamboo) has been planted, originated from Sangir Talaud Islands. The species is Bambusa maculata Widjaja. The forest research is functioned as collection area for bamboo which will be developed as ecotourism area (Allo, 2009). In China, tutul/ spotted bamboo refers to several species of bamboo apparently within the genus Phyllostachys also known as ―teardrop‖ bamboo and as mottled bamboo. Spotted bamboo of Phyllostachys species, used for writing, paint brushes used for Chinese Calligraphy and 723 paintings in the Ming Dynasty found in China around the 300 BCE (Anonymous, 2011). Spotted Bamboo. The Phyllostachys bambusoides f. Lacrima-deae looks natural, unique effect, good for interior and exterior decorations. As a musical instrument, the spotted bamboo didgeridoo, produce a good voice, easy to use. Aboriginal tribes made the didgeridoo with spotted and decorated with pictures of animals. At the time of the Ming and Qing Dynasty, the spotted bamboo (P. Bambusoides) has been used to make a beautiful chair. There is also a nature mottled bamboo Matcha Chashaku Tea scoop offered by a trader in China (Anonymous, 2011). In conclusion, there are spotted/mottled/tutul bambu with different botanical name in Indonesia. Tutul bambu in Java belongs to Bambusa but in Ternate, belongs to Phyllostachys. 3. WHY TUTUL BAMBOO Many species of bamboo in Indonesia. Thirty seven species of bamboo were classified as Endangered in Indonesia. A total of 1250 species of bamboo spread across the world. Of these, 159 of whom are in Indonesia and 88 are endemic bamboo species of the archipelago. Wulung bamboo is considered rare as well as tutul. The wulung has the black or deep brown along the culm. The tutul has spotted brown color spread unevenly across the culm that this makes the tutul bamboo more aesthetical look. The spotted branches are also look specific when applied on the small equipment such as broom handles, chair, tables and handicraft. Figure 7: Several uses of tutul bamboo Source: Bali spirit festival The tutul bamboo as well as wulung can grow in the dry areas that this indicate that the both species are vigor enough. The drier the environments, the sharper culm colors will be (Charomaini, 2011). Tutul bamboo only be found in several places in Yogyakarta such as Klaten, and Gunung Kidul (Charomaini, 1997). The bamboo also grow in East Java, Bali Lombok dan Sulawesi (Haryoto, 1996). The acreage of the plantation is not clearly recorded yet. Probably the tutul bamboo plantation in Bali has been recorded due to Bali is famous in the handicraft industry. Tiing tutul (Balinese language for tutul bamboo), is the most popular variety for furniture in Bali. The village of Bona near Blahbatuh is specialized in manufacture of all manner of chairs, tables, and containers made of tiing tutul (Wijaya, 2007). 724 Figure 8: Flattened bamboo flooring Source: www.bambooindustry.com Bamboo panels/floors is a married of the old and new era. Bamboo as traditional material and using modern techniques becomes bamboo panels which formerly produced using wood. Using pressing techniques, bamboo could be flattened as floor (Anonymous, 2011). Tutul bamboo could be very aestethic to be bamboo floors, with the dotted appearance on the surface. 4. THE NEED TO CONSERVE Conservation by the MOU between Alstom Indonesia and KEHATI Foundation supported by Indonesia Bamboo Foundation, all three agreed to plant bamboo in several river banks in Jakarta. This type of bamboo that are rare are tutul bamboo. The tutul makes this bamboo can be classified as material for aestetic furniture. Also the branches can even to be artistic merit. The scarcity of tutul bamboo or bamboo in general is caused by the opinion that bamboo is less useful, wild plants that can be exploited haphazardly, besides of the development of human settlement. Conservation effort is necessary. According to Djatmika, conservation can be mean an ecological and economy. Bamboo Foundation of Indonesia has been actively preserve and develop the benefits of bamboo as a material component of crafts and home. More effort should be enforced to conserve tutul bamboo for pure conservation and to utilize whenever needed by applying the rules of better bamboo clump management. REFERENCE Allo, M K (2009): Koleksi Jenis-Jenis Bambu di KHDTK Mengkendek-Tana Toraja, Sulawesi Selatan. Balai Penelitian Kehutanan Makassar. Anonymous (2008): Pengembangan Usaha Bambu di Kabupaten Sleman Propinsi Daerah Istimewa Yogyakarta. Dinas Pertanian dan Kehutanan Kabupaten Sleman. Anonymous (2009): Bambusa maculata. Accessed http://www.earthcare.com.au/slides/b maculata_2.html 725 in November 9, 2011. Anonymous (2009): Black Bamboo. Accessed http://www.bamboowholesale.com.au/html/black_bamboo.html in November 2011. Anonymous (2010): Bambu Tutul. Bambu untuk Penghidupan . Accessed 28 November 2011. www.bambubos.com/news/5/30/Bambu-Untuk -Penghidupan.htm Anonymous (2011): Bali Bamboo Forest. Bali Spirit Festival. Accessed in November 9, 2011. http://www.balispiritfestival.com/bali-bamboo-forest.html Anonymous (2011): Nature mottled bamboo Matcha Chashaku Scoop.www.eBay.com/itm/Nature-Mottled-Bamboo-Matcha-Chashaku-Tea-Scoop/320561294930 Tea Anonymous (2011): Eco Bamboo Flooring-Flattened Bamboo. Bothbests Product. www.bambooindustry.com/blog/eco-bamboo-flooring.html Accessed 30 November 2011. Anonymous (2011): Spotted Bamboo. Wikipedia. en.wikipedia.org/wiki/spotted_bamboo Accessed 28 November 2011. Anonymous (2011): Spotted Bamboo. www.bambooexpressions.com/pages/spotted bamboo. Anonymous (2010): Accessed 28 November 2011. Kaleidoskope.culturalchina.com/en/12kaleidoskope798.html The Mottled Bamboo Chair Coated with black Lacquer Charomaini M (1997): Prospek pemanfaatan bambu kuning (Bambusa vulgaris var striata) sebagai bahan baku pulp ditinjau dari sudut kualitas bibit. Makalah ekspose Hasil Penelitian dan Pengembangan Pemuliaan Pohon. Yogyakarta. Charomaini, M (2011): Peninjauan ke kebun konservasi bambu dan cendana di Watusipat, Gunung Kidul. Yogyakarta. Haryoto (1996): Membuat Kursi Bambu. Teknologi Tepat Guna. Penerbit Kanisius. Yogyakarta. Jatmika (2011): Dalam Langka 37 bambu di Jawa Barat. Accessed 28 November 2011. national geographic.co.id/lihat/berita/419/langka-37-bambu-di-jawa- barat. Subianto, P (2009): Prabowo Subianto: Nasi Bambu dan Negeri Bambu. Accessed 28 November 2011. umum.kompasiana.com/2009/03/05/prabowo-subianto-nasi-bambu-dan-negeri-bambu Syaiful, D (2011): 37 Bambu Nusantara Tergolong Langka. in BIOLOGI. Lihat Langkahku. Accessed in November 9, 2011. http://lihatlangkahku.wordpress.com/ page/2/ Tribun Manado (2011): Paradise Center sediakan Furnitue bambu Bermotif Macan Tutul. manado.tribunnews.com/2011/11/27/paradise-center-sediakan-furniture-bermotif-macam-tutul. Accessed 30 November 2011. Wijaya, S (2007): Bamboo in Balinese Life.blog.www.bali.com/guides/671 Accessed in 29 November 2011. 726 INAFOR 11P-005 INTERNATIONAL CONFERENCE OF INDONESIAN FORESTRY RESEARCHERS (INAFOR) The Potency of Charcoal (BIOCHAR) as Bioconditioner and Provide Carbon-Offset for Mitigating CO2 Emission Gusmailina The Center for Research and Development of Forestry Engineering and Forest Products Processing Jl. Gunung Batu 5, Bogor, 16610, INDONESIA Corresponding Email: [email protected] Poster paper prepared for The First International Conference of Indonesian Forestry Researchers (INAFOR) Bogor, 5 – 7 December 2011 INAFOR SECRETARIAT Sub Division of Dissemination, Publication and Library FORESTRY RESEARCH AND DEVELOPMENT AGENCY Jl. Gunung Batu 5, Bogor 16610 The Potency of Charcoal (BIOCHAR) as Bioconditioner and Provide Carbon-Offset for Mitigating CO2 Emission 727 Gusmailina The Center for Research and Development of Forestry Engineering and Forest Products Processing Jl. Gunung Batu 5, Bogor, 16610, INDONESIA Corresponding Email: [email protected] ABSTRACT Biochar presents the charcoal whereby its use focuses on soil improver, known also as a biomaterial-derived product. The bio exhibits specific characteristics such as high-surface area, high volume (bulkiness), the presence of micropores as well as micropores, affording particular density, and ability to hold water. Such characteristics enable the biocharcoal to provide carbon (C), mitigate CO2 emission from the earth atmosphere by holding it deep inside earth soil. Biochar also seems more persistent in the soil thereby rendering it potential as the sink of the atmospheric carbon dioxide (CO2). Biochar provide as well the growth media favorably for various soil microbes. Besides, biochar can impart the retention of water as well as soil nutrients, thereby enhancing their availability. The effect of increasing the soil carbon content using biochar is more permanent compared to that using other organic stuffs or fertilizers. The benefit as exerted by placing biochar in the soil is the increase in soil pH and activities of soil microorganisms, thereby triggering the growth of vegetation sprouts and earns itself the term as bioconditioner. Biochar exerts its role to hold the carbon for relatively longer duration, reaching 15-20 years. Even the latest information reported that biochar could serve as carbon store for at least 100 years. Moreover, several experts stated that it could last more than 5000 years. The carbon offsets signifies as the mitigation of greenhouse gases (GHG) measured in CO2equivalent tons. The offset or saving of carbon is realized from the changes as imposed to avoid such GHG release in the atmosphere by absorbing CO2 or other GHGs (e.g. methane, nitrous oxide, hydrofluorocarbons, hexafluorocarbons, ansd sulfur-hexafluoride. Therefore, additional carbon offset in this context refers to intensifying the mitigation of CO2 emission through the use of so-called biochar. Keywords: Charcoal, biochar, bioconditioner, GHG gases, bioconditioner, carbon offset 1. INTRODUCTION Charcoal or biochar stands for bio and charcoal, and this relatively new term is used to describe that charcoal that presently serves as an alternative energy, in fact can exert other benefit, when properly used and implemented at the soil/land area. Hence, biochar presents charcoal, whereby its use focuses on soil improver. biochar has become more popular, since the discovery of black-colored soil in the Amazon Valley, often called as Terra preta which was formed more than 2000 years ago by the habit of the local community there to burn biomass and then bury it in the soil. The soil managed by the Ameridian tribe about 500-2500 years ago in fact could maintain its organic carbon tent and high fertility even for several thousand years more when it was abandoned by the local community. The source of those soil organic stuffs and the retention of such high nutrients were brought about the high charcoal content inside the soil. Meanwhile, the acidic soil in the area vicinity exhibited the low fertility levels. Biochar also known as biomaterial-detived charcoal exhibit specific cagracteristics such as high surface area, high volume (bulkiness), the presence of micropores as well as micropores, exerting particular density, and ability to hold water. Those characteristics enable the biochar to provide carbon, mitigate CO2 emission from the earth atmosphere by holding it deep inside the soil. Biochar also seems more persistent in the soil thereby signifying itself as the main alternative as the potential carbon sink of the atmospheric carbon dioxide (CO2). Other benefits 728 as acquired from the use of biochar are among others improving soil fertility; affording greater surface area of the biochar particles themselves, thereby rendering them able to hold water and prevent the soil from the erosion, and fixing nitrogen and other essential ions such as calcium (Ca2+), potassium (K+), and magnesium (Mg+). In general, the fertile soil requires the organic content as much as 2%. In this regard, biochar becomes the proper alternative in managing the soil particularly as the carbon supplier and soil-fertility enhancer (bioconditioner). Lehmann (2007) stated that all organic stuffs added into the soil significantly the various soil functions and unexceptionally the retention of various nutrients essentially beneficial for vegetation (plant) growth. Biochar turns out more effective in retaining the availability of nutrients for plants compared to other organic stuffs such as leaves, compost, or animal manure. Biochar is also able to hold phosphor elements, which can not be retained by the usual soil organics. Further, Lehmann and Roondon (2006); and Rondon et al. (2007) reported that biochar also provided favorable growth media for soil microbes. Biochar can enhance the retention of water and soil nutrients, and increase the nutrient availability. The effect of increasing the soil carbon content using biochar is more permanent compared to that using organic stuffs or other fertilizers. 2. CHARCOAL/BIOCHAR AS BIOCONDITIONER According to Ogawa (1989), charcoal, when added into the soil, can serve as soil-fertility enhancer. This is because charcoal can improve water and air circulation in the soil, thereby triggering the growth of roots and providing favorable habitats for the growth of plant seedling (nurseries). Besides increasing the soil pH, charcoal also make ease the growth of spores and increase of their number from either ecto or endomiccorhiza, thereby earning itself the term as soil conditioner. Suhardi (1998) expressed that charcoal as added to the soil besides enhancing its fertility could also function as a fixer for particular stuffs/compounds. This is closely related to the role of forest ecosystem (forest and soil) as the carbon sink in absorbing CO2 from the atmosphere. In Japan, the use of charcoal in fact could the increase of rice production as much us 50%. In addition, the charcoal use was able to increase the number of leaves, enlarge the area of tree canopy (crown) particularly at the town forests, thereby rendering it effective to mitigate and decrease the air pollution as well as temperature through the absorption of atmospheric CO2 (Japan Domestic Fuel Dealers Association, abbreviated as JDFDA, 1994). Further, results of the JDFDA experiments (1994) revealed that the addition of charcoal and calcium phosphate simultaneously to several forestry plant species could increase four times as many population of miccorhiza as that of the control (without charcoal addition). In pine trees, such addition significantly brought about the development of tree branches and leaves. Likewise, the charcoal addition to bamboo plants could increase the number of their sprouts. In Indonesia, Faridah (1996) concluded that the addition of charcoal powder as much as 10% of the media volume brought about significant effect on the initial height growth of kapur (Dryobalanops) plants. Sunarno and Faiz (1997) recommended the use of rice husk as the main seedling media in the pot tray as the alternative for peat-soil substitute. Charcoal contains numerous pores, and therefore when it is added to the soil, this proves effective to hold and retain soil nutrients. Afterwards, the nutrients will be released slowly or gradually in accordance with the amount required by the plants (slow release). In addition, charcoal exhibits hygroscopic characteristics such that he nutrients in the soil will be easily leached out, and the corresponding area is therefore ready for use. The benefits of charcoal with its use in integration with agriculture field are among others improving and enhancing soil condition, intensifying soil-water flow, triggering the growth of plant roots, adsorbing the residual pesticides and the excess of fertilizer in the soil, favoring the growth of soil bacteria as the 729 microorganism media for symbiosis activities, preventing particular plant diseases, and increasing the fruit production as well as imparting its tastes (Anonymous, 2002). In agriculture field, charcoal can be used to increase the soil pH from the acidic to neutral condition, which is usually done by using agriculture lime that contains Ca and Mg compounds, thereby reducing and neutralizing the poison behavior of Al and other negative effects due to acidic soil condition. Due to its characteristics that can be used to increase the soil pH, therefore the charcoal finds itself beneficial uses at marginal lands lie which are scattered widespread in Indonesia. Therefore, the addition of charcoal on soil can also improve physical, chemical, and biology properties of the soil. If the soil structure and textures are favorable, then it will facilitate the spore development and increase their number from either ecto or endo micorrhiza. In Kamerun, the use of biochar could increase the average harvest crops up to 240% (Biochar found, Jeremy Hance, 2010). Biochar as employed at the level of 10 tons per ha exhibit similar efficiency as those of organic or inorganic fertilizers. As such, the biochar increases the harvest crops as much as in average 240% at the poor soil. These results were similar to those as encountered in the application of biochar at 20 tons per ha. 2.1 Increasing The Soil pH and Soil-Microorganism Activities The critical condition of land area usually exhibits acidic pH, and this situation will not allow for the activity and growth of microorganisms, thereby rendering the area sooner or later dying with no nutrients available for plant growth. The use of charcoal can increase the acidic soil pH to normal, thereby favorably assisting the growth, development, and other activities of microorganisms. In Figure 1 is shown the effect of adding the charcoal to the soil that increased its pH and activities of microorganisms in the soil p 6,8 6,6 6,4 6,2 6 5,8 5,6 5,4 5,2 5 30 25 20 15 konsentrasi 10 10 20 30 40 5 50 0 AKT AKM kontrol charcoal SB NFB Figure 1: The effect of charcoal addition to the soil on the increase of soil pH (A), and the development of soil microorganisms (B) Remarks: AKT = charcoal from pine bark; AKM = charcoal from maangium bark; SB = bacteria; NFB – nitrogenfizing bacteria 2.2 Charcoal Could Trigger The Growth of Plant Sprouts The Center for Research and Development on Forestry Engineering and Forest Products Processing (CRDFEFPP, Bogor) has conducted the experiment using charcoal to enhance the soil fertility (soil conditioner) since 1996. The charcoal as employed focused more on the utilization of forestry wastes. It was preceded with the use of wood-sawdust wastes into charcoal using semi-continuous kiln. In general, the nutrient content in the wood sawdust depended on the kinds of raw materials of sawdust. In general, the charcoal as carbonized from the mixed wood sawdust exhibited the N-nutrient coantent in the range of 0.3-0.6%; total P and available P contents about consecutively 200-500 ppm and 30-70 ppm; K nutrient content about 0.9-3.0 730 meq/100 grams; Ca nutrient content about 1-15 meq/100 grams; and Mg nutrient content about 0.9-12 meq/100 grams (Gusmailina et al., 1999). The addition of charcoal as the nursery media mixture brought out significant increase in the diameter of Eucalyptus urrophylla (Figure 1). 7,86 8 6,67 6,48 6 4,51 4,43 4 3,13 2 0 k ab asg asp asr aj Figure 2: The effect of adding charcoal with various wood (lingo-cellulosic) species origin on the growth of E. urrophylla stem diameter (Gusmailina et al., 1999) Remarks: ASP = rice-husk charcoal; ASG = wood-sawdust charcoal; AB = bamboo charcoal; Kp = Compost; K = control; ASR = vegetation-litter charcoal; AJ = teak-wood sawdust charcoal The application of charcoal brought out significant responses, with respect to the diameter as well as height of 1.5 month old Acacia mangium stems. The addition of charcoal with various wood/lignocellulosic species origin as much as 20% revealed that the growth media mixed with the vegetation-litter charcoal yielded the most favorable responses, followed in decreasing order by the addition of rice-husk charcoal. Likewise, the addition of charcoal as much as 30% disclosed that the growth of plant sprouts was better on the media mixed with vegetation-litter charcoal. The application of charcoal to Eucalyptus urrophylla plants in the field revealed that when they reached 15-month age the increase in their height was higher using bamboo charcoal than using sawdust charcoal (ASG). Experiment results exhibited that the addition of charcoal either as the media mixture or in the field brought about favorable effect on the growth of Acacia mangium and Eucalyptus urrophylla plants. Wood sawdust signifies as the potential raw material and turns out very prospective suggested as charcoal for bioconditioner. In Figure can be seen the effect of charcoal application on the growth of Acacia mangium plants, when their age reached 3 months old. Figure 3: The effect of adding charcoal to the growth media on the growth of its corresponding 3-month old Acacia mangium plants 731 Michinori Nishio (1999) also reported about the effect of incorporating biochar on the growth of particular plants. In Table 1 were disclosed the experiment results done by Michinori Nishio (1999) regarding several responses exerted due to the use of chacraol/biochar. Table 1. Growth responses of particular plants due to the incorporation of charcoal/biochar Area of the plants without charcoal (control) Area of the plants that incorporated compost charcoal Area of the plants that incorporated chemical fertilizer) 64 139 71 Average length of leaf 5.76 7.68 6.04 The average width of leaf 3.25 4.08 3.26 Germination rate, (%) 80 90 85 Length of roots 22 24 25.5 14.66 17.19 18.23 Diameter of stem 1.2 1.35 1.33 Number of seeds 26 89 37 28.1 44.25 33.85 Parameter Number of leaves Length of the stem Weight of 100 seeds Source: Nishio (1999) 2.3 Bio-Active Compost Charcoal (Fermented Biochar) Bio-active compost charcoal typifies as one of the biochar items produced from the composting (fermenting) process. These biochar item have been produced and socialized to the community since 2003. There have been a lot of benefits enjoyed by the particular community group who implemented this technology product. Various kinds of wastes as available in the vicinity of community residence could be utilized as biochar raw materials, and then were implemented at various plant species with significant and satisfactory results, as shown in Figure 4. Figure 4: Application of bio-active compost charcoal (fermented biochar) at murbey, hot-pepper, and papaya plants, located at Ciobgo village, Karyasari Sub District, Leuwiliang Disctrict, Bogor Regency Figure 4 revealed the trial-test results of adding bioactive compost charcoal at the cultivation of murbey plants as the forage for silkworms. The production of bioactive compost charcoal focused on enhancing the productivity of murbey leaves for the cultivation of silkworms. In addition, such application was also done to the cultivation of nilam, papaya, and Melaeuca bracteata plants. The yields as obtained were very promising and convincing, as by only adding bio-active compost charcoal as much as 0.5 kg per cluster of murbey plants, this enabled them when reaching 10-month age to increase five times as many the number of murbey leaves 732 as those of the control (without bioactive compost charcoal). Besides, such addition also improved the qualities of silk yarns as produced from their corresponding worms. Figure 5: Application of bioactive compost charcoal to the vegetable plants that grew under the pine tree stands, located at Ciloto In Figure 5 is shown the application of bioactive compost charcoal to the agriculture plants such as broccoli pok choi. Such application was also done at Ciloto (Forestry District of Cianjur) to pok choi, broccoli, and carrot plants. The results as acquired in the unit area of 400 m square revealed that the production increased by 1500 kg, when compared to those using the regular fertilizer commonly employed by the farmers, such as bokasi fertilizer. In addition, such use of bioactive compost charcoal could also reduce the use of chemical fertilizer as much as 40%. Further, in Figure 6 is disclosed the application of biochar to the sprouts of Eucalyptus citriodora plants, while Figure reveals the biochar application to the bulian and eaglewood sprouts. Still related, Figure 8 discloses the application of biochar to several apriculture plants. The results as acquired were quite favorable and significant for the further application. Figure 6: Application of biochar to the sprouts of Eucalyptus citriodora plants Figure 7: Application of sawdust biochar to bulian and eaglewood sprouts in Jambi 733 A B C Figure 8: Application of biochar to several agriculture plants, i.e. celery in Jambi (A); red pepper (B) in Jambi; and hot red pepper (C) in Pelabuhan Ratu In 2003 was done the trial test of sawdust-biochar use on the growth of teak (Tectona grandis) sprouts until they reach 4 months old, located at the seedling area of Jembolo Sub Forestry District, administered by the State Forest Enterprise, Forestry District of Semarang (Central Java Province). Results revealed that the use of sawdust biochar and sawdust compost could increase the growth of teak sprouts and the number of their survival as much as 100% compared to those of the control. The use of biochar as much 50% brought about the most favorable portion for the growth of teak sprouts (Komarayati, 2000). Application of bioactive compost charcoal to the cabbage plants in Ciberureum, Garut (West Java Province) indicated that the use of such bioactive compost charcoal was very favorable. This is shown by the production of cabbage which was higher and more compact in its texture, which weighed about 2 kg per cabbage fruit (Figure 9). Likewise, the application of bioactive compost charcoal to the decorative (ornamental) plants (rose and algebra flowers) brought out very favorable results. The effect disclosed that that not only was the flower and leaf color brighter, but also the corresponding plants afforded high resistance (the flower and leaves of the plants not easily fallen off). Even, when the plants were left without cares, their flowers despite becoming dry were still in place firmly (not easily fallen off). Figure 9: Application of compost charcoal at the cabbage vegetable plants Figure 10: Application of compost charcoal to the flower plants 734 The application of bioactive compost charcoal to the tobacco plants brought out favorable results, yielding the leaf-cut pieces that weighed about 7.5 ounces (approximately 250 grams). Meanwhile, its corresponding weight of the control (without bioactive compost charcoal) reached only 3 ounces (about 90 grams). In this way, therefore, the tobacco trees which were planted with the addition of bioactive compost charcoal produced the tobacco leaves about 2 times as much the weight as that without the bioactive compost charcoal. In addition, the drying of tobacco leaves where their host trees incorporated the use of bioactive compost charcoal proved also more efficient, requiring only 3-4 days, while those of the control took longer days for the drying. Likewise, the aroma and smell of tobacco leaves that used bioactive charcoal were more pungent and stronger compared to those of the control. 2.4 Nutrient Components Contained in The Sawdust Charcoal The charcoal commonly is composed of water, volatile matter, tar, wood vinegar, ash, and fixed carbon. Such composition depends on the kinds of charcoal raw materials, and carbonization methods. However, in general the resulting charcoal affords a comparative superiority in each use. For example, in agriculture field, all those components are needed, but in industry its water content should be kept minimum (Anonymous, 2002). The nutrient content in the sawdust charcoal depends also on the raw material of sawdust itself. In general, the charcoal carbonized from the wood sawdust exhibit the N nutrient content in the range about 0.3-0.6%; total P and available P nutrient content about consecutively 200-500 ppm and 30-70 ppm; K nutrient content about 0.9-3 meq/1oo grams; Ca nutrient content about 1-15 meq/100 grams; and Mg nutrient content about 0.9-12 meq/100 grams (Gusmailina et al., 1999). The related details are presented in Table 2. 735 Table 2. The composition and quality of sawdust charcoal No 1. 2. 3. 4. 5. 6. 7. 8. 9. 10. 11. 12. 13. 14. 15. 16. 17. Characteristics The yield, % Water content, % The ash content, % Volatile content, % Carbon content, % acidity (pH) Nutrient content, ppm Nitrogen (N) Phosphorus (P) Potassium (K) Sodium (Na) Calcium (Ca) Magnesium (Mg) Iron (Fe) Copper (Cu) Zinc (Zn) Manganese (Mn) Sulfur (S) Total 24.5 2.78 5.74 20.10 74.16 10.20 5,397.60 1,476.0 783.13 313.69 1,506.03 1,234.0 1,617.6 103.64 62.32 112.95 528.92 3. CHARCOAL AS AN ADDITIONAL CARBON OFFSET According to experts, billions tons of carbon is separated from the rest of the decomposition of biomass agriculture, plantation and forestry can be stored in the soil in the world. Carbon stored in the pores of charcoal or is currently better known as "biochar", is an important alternative to address greenhouse gas emissions. Biochar appears to lock carbon in a longer time, up to 15 to 20 years, even recent information suggests that biochar can be store in the soil at least 100 years, even some experts say more than 5000 years (http://www.airterra.ca/ biochar). Carbon offset is a reduction in greenhouse gas emissions measured in tons of carbon dioxide (CO2) equivalent. Carbon offsets or savings resulting from changes made to avoid or absorb carbon dioxide or greenhouse gas main (methane, nitrous oxide, hydrofluorocarbons, perfluorocarbons and sulfur hexafluoride). So in this case the additional carbon offsets is the additional reduction in CO2 emissions through the use of biochar. Figure 11: Charcoal with pores on the surface that serves as adsorb and absorbent (sequester) CO2 and other greenhouse gases in the soil, and serves also as a 'soil amandement' (Source: http://www.airterra.ca/biochar) 736 As the deposits of carbon in soil biochar works by binding and storing CO2 from the air to prevent it from escaping into the atmosphere. Bonded carbon content in the soil and stored up a large amount of time, estimated at hundreds to thousands of years, but the exact calculation of the amount of CO2 that can be tied very rarely available. A scientist states that for an area 250 ha able to bind to 1900 tonnes of CO2 a year. The results Anischan Gani study, expressed biochar can increase water retention and soil nutrient and increase the availability of nutrients. Effect of increased carbon content in soil is more permanent than the addition of biochar additions of organic material forms or other fertilizer. Further noted also that the benefits of biochar in the soil was too much more than just as a soil fertility and increase crop productivity. The results of recent research proved unique biochar as a promising alternative for the improvement of agricultural land and reduce greenhouse gas emissions and other CO2 into the atmosphere. Biochar is also more persistent in the soil so that it can be a primary choice as a potential sink for atmospheric CO2. Since charcoal knew can sequester carbon in soils for hundreds to thousands of years, the subject of considerable potential as a tool to slow global warming. Burning and natural decomposition of trees and agricultural materials accounted for a large amount of CO2 released into the atmosphere. Biochar can store this carbon in the soil, potentially making significant reductions in atmospheric GHG levels, at the same presence on earth can improve water quality, improve soil fertility, increase agricultural productivity and reduce pressure on forest growth that has been advanced. Thus the use of charcoal as biochar, or arkoba (fermented biochar) its use should be disseminated to all actors of agriculture, forestry and plantations in order to be useful as a balancer in the carbon cycle in nature. A B Figure 12: A. Schematic of Biochar Solution and B. Biochar as carbon Negatif 4. CONCLUSION Biochar is charcoal focused use on soil. Because it has the characteristics: high surface area, high volume, micropores, density, macropores, and water binding as well as, then called as bio condisioner. Biochar is able to supply the carbon, reducing CO2 from the atmosphere by tying into the ground, more persistent in the soil so that it can be a primary choice as a potential 737 sink for atmospheric CO2. Biochar also provide a good growing medium for a variety of soil microbes, can increase water retention and soil nutrients and increase the availability of nutrients. Effect of increased carbon content in soil is more permanent than the addition of biochar additions of organic material forms or other fertilizer. The benefits of biochar in the soil which increases soil pH and soil microorganism activity, spurring the growth of seedlings as well as socalled bioconditioner. The series of results showed that the use of charcoal / biochar, or arkoba (biochar fermentative) in various types of forestry and agricultural crops, gave significant results on crop production. Biochar appears to lock carbon in a longer time, up to 15 to 20 years, even recent information suggests that biochar can be store in the soil at least 100 years, even some experts say more than 5000 years. Carbon offset is a reduction in greenhouse gas emissions measured in tons of equivalent carbon dioxide (CO2). Carbon offsets or savings resulting from changes made to avoid or absorb (absorb) carbon dioxide or greenhouse gas main (methane, nitrous oxide, hydrofluorocarbons, perfluorocarbons and sulfur hexafluoride). So the additional carbon offsets in this case, the additional reduction in CO2 emissions through the use of biochar. REFERENCES Nishio M (1999): National Institute of Agro-Environmental Sciences – Japan. Hance, J (2010): Dapatkah Biochar Selamatkan Dunia? Indonesia. mongabay.com. translated by Indie Banget. Acessed in 1st of September. Gusmailina (2005): Optimalisasi dan evaluasi penggunaan arang dan arang kompos bioaktif Sistesis hasil penelitian. Puslitbang Hasil Hutan, Bogor. Gusmailina, Pari G and Komarayati S (1999): Teknologi penggunaan arang dan arang aktif sebagai soil conditioning pada tanaman kehutanan. Laporan Proyek. Pusat Penelitian dan Pengembangan Hasil Hutan. Bogor. Gusmailina, Pari G and Komarayati S (2001): Teknik penggunaan arang sebagai soil conditioning pada tanaman. Laporan hasil penelitian (unpublished). Gusmailina, Pari G and Komarayati S (2001): Laporan kerjasama penelitian P3THH – JIPFRO. Bogor (unpublished). Gusmailina, Pari G and Komarayati S (2002): Laporan kerjasama penelitian P3THH – JIPFRO. Bogor (unpublished). Gusmailina, Pari G and Komarayati S (2002): Implementation study of compos and charcoal compost production. Laporan Kerjasama Puslitbang Teknologi hasil Hutan dengan JIFPRO, Jepang . Tahun ke 3. Bogor (Unpiblished). Gusmailina, Pari G and Komarayati S (2002). Pedoman Pembuatan Arang Kompos. Pusat Penelitian dan Pengembangan Teknologi hasil Hutan. Badan Penelitiandan dan pengembangan Kehutanan. Bogor. JDFDA (1994): Example of New utilization of charcoal. Association. Japan Domestic Fuel Dealers Ogawa, M (1989): Mycorrhizza and their utilization in forestry. Report of Shortterm Research Cooperation. The Tropical Rain Forest Research Project JTA-9A (137). JICA. Japan. Komarayati S, Gusmailina and Pari G (2002): Pembuatan kompos dan arang kompos dari serasah dan kulit kayu tusam. Buletin Penelitian Hasil Hutan 20(3). 738 Komarayati S, Gusmailina and Pari G (2003): Aplikasi arang kompos pada anakan tusam (Pinus merkusii). Buletin Penelitian Hasil Hutan 21 (1) : 15 – 21. Pusat Litbang Teknologi Hasil Hutan. Bogor. Gani, A (2009): Arang hayati untuk kesuburan tanah dan mengurangi emisi CO2. Tabloid SinarTani. 739 INAFOR 11P-006 INTERNATIONAL CONFERENCE OF INDONESIAN FORESTRY RESEARCHERS (INAFOR) Allometric Equations for Estimating Aboveground Biomass in Papua Tropical Forests Sandhi Imam Maulana Forestry Research Institute of Manokwari Jl. Inamberi Susweni, Manokwari 98313, INDONESIA Poster paper prepared for The First International Conference of Indonesian Forestry Researchers (INAFOR) Bogor, 5 – 7 December 2011 INAFOR SECRETARIAT Sub Division of Dissemination, Publication and Library FORESTRY RESEARCH AND DEVELOPMENT AGENCY Jl. Gunung Batu 5, Bogor 16610 740 Allometric Equations for Estimating Aboveground Biomass in Papua Tropical Forests Sandhi Imam Maulana Forestry Research Institute of Manokwari Jl. Inamberi Susweni, Manokwari 98313, INDONESIA ABSTRACT Allometric equations can be used to estimate the biomass and carbon stock of forests. However, so far the allometric equations for commercial species in Papua tropical forests have not been developed in sufficient detail. In this research, allometric equations are presented based on the genera of commercial species. Separate equations are developed for the Intsia, Pometia, Palaquium and Vatica genera, and an equation of a mix of these genera represents commercial species. The number of trees sampled in this research was 49, with diameters (1.30 m or above buttresses) ranging from 5 to 40 cm. Destructive sampling was used to collect the samples where diameter at breast height (DBH) and wood density (WD) were used as predictors for dry weight of total above-ground biomass (TAGB). Model comparison and selection were based on the values of F-statistics, R-sq, R-sq (adj), and average deviation. Based on these statistical indicators, the most suitable model is Log(TAGB) = c + Log(DBH). This research finding can be extrapolated for managing forests related to carbon balance. Additional explanatory variables such as commercial bole height (CBH) do not really increase the indicators‘ goodness of fit for the equation. An alternative model to incorporate wood density must be considered for estimating the above-ground biomass for mixed genera. Comparing the presented equations to previously published data shows that these local species-specific and generic equations differ substantially from previously published equations and that site-specific equations must be considered to get a better estimation of biomass. Keywords: Allometric, equation, biomass, sampling, Papua 1. INTRODUCTION Forest ecosystem is an important carbon sink and source-containing majority of the above ground terrestrial organic carbon. Four main carbon pools in forest ecosystem including tree biomass, nekromass, understorey, and soil organic matters. The largest carbon stock came from aboveground tree biomass, but this carbon pools was also the most vulnerable to deforestation and forest degradation. There for, the estimation of total aboveground biomass is an important step in quantifying carbon stock of tropical forest (Post et al., 1999; Brown and Masera, 2003; Pearson, 2005; IPCC, 2006; Hairiah and Rahayu, 2007). Basically, the estimation of aboveground biomass can be conducted based on two approaches, destructive and non-destructive (Samalca, 2007). Direct estimation of aboveground biomass trough destructive approach is the most accurate approach, but this approach tends to consume more cost, man-power, and time, if compared to the non-destructive approach (Lu, 2006). Destructive approach usually only used as a tool in validating the estimation result of nondestructive approach (Clark et al., 2001; De Gier, 2003; Wang et al., 2003). The estimation of aboveground biomass trough non-destructive approach conducted by using an allometric equation. This equation built based on the correlations between diameter at breast height (DBH), or other tree variables, against its total aboveground biomass (Brown, 1997). The implementation of species and site-specific allometric equations is strongly suggested, because trees from different site will grow with a different architecture, wood density 741 and other life patterns (Ketterings et al., 2001). In order to achieve the highest level of accuracy, local species and site-specific allometric equations must be established (Samalca, 2007; Basuki et al., 2009). This research aims to produce species and site-specific allometric equations to estimate total aboveground biomass of commercial species in Papua. 2. METHODOLOGY This Research conducted at four different regencies in Papua and West Papua Province. The samples in this research consist of four different genera‘s with diameter at breast height interval 5-40 cm, there are 13 tree of Intsia taken from Fak-fak Regency-West Papua, 15 tree of Pometia taken from Keerom Regency-Papua, 13 tree of Palaquium taken from Teluk Bintuni Regency-West Papua, and 8 tree of Vatica taken from Raja Ampat Regency-West Papua. Before conducting the destructive sampling, the DBH was measured. Generally the DBH was measured at 1.30 m above- ground, but for trees with enlargement or buttresses, the diameter was measured at 30 cm above the main enlargement. After felling, the tree height was measured. Diameter was measured at 2 m intervals for the stems and big branches with the diameters of more than 15 cm. In addition, the stump height and its diameter were also measured. These measurements were used to estimate the volume and dry weight. The volume of each section was calculated using Smalian‘s formula as cited by De Gier (2003). The total volume was obtained by summing the volume of each section. Due to the difference in moisture content, the tree material was partitioned into leaves, twigs (diameter <3.2 cm), small branches (diameter 3.2–6.4 cm), large branches (diameter >6.4 cm) and stem (Ketterings et al., 2001). To determine the wood density, samples were taken from the lower, middle and upper parts of the stems. The samples were taken as a pie shape or cylinder, so the inner and outer parts of thetrunks with their barks were included (Nelson et al., 1999). Wood density was measured by the water replacement method. The dry weight of the stumps, stems, and branches with the diameter of >15 cm was calculated by multiplying the fresh volume of each section by wood density. For the other partitioned trees, the dry weight was calculated through fresh weight multiplied by dry weight/fresh weight ratio of the corresponding samples. The total dry weight of a tree was obtained by summing the dry weight of the stump, stem, branches, twigs and leaves. Based on the data collected, several equations were developed. Firstly, the equations were developed for four individual genera Intsia, Pometia, Palaquium and Vatica. Secondly, these four genera were mixed to develop an equation for commercial species. Before the establishment of thus allometric equations, scatter plots were used to see whether the relationship between independent and dependent variables was linear. Furthermore, several allometric relationships between independent and dependent variables were tested. The independent variables included diameter at breast height (DBH), commercial bole height (CBH), and wood density (WD), whereas the dependent variable was the dry weight of the total aboveground biomass (TAGB). Model comparison and selection conducted using the value of standard error of the coefficient, F statistic, R-sq, R-sq (adj) based on Minitab 14.0 software, beside that the percentage (%) value of average deviation was also counted through an equation suggested in Basuki et al. (2009). 3. RESULT AND DISCUSSION 3.1 Allometric Equations The selection of independent variables as predictors in allometric equation conducted based on the correlation patterns between each independent variable (Diameter at Breast Height/DBH, Commercial Bole Height/CBH, Wood Density/WD) against its dependent variable (Total Above Ground Biomass/TAGB). Thus correlation as shown in Figure 1, which is established based on actual data. Figure 1 shows that independent variable Commercial Bole 742 Height/CBH forming random and unpredictable correlation to total aboveground biomass. There for, CBH cannot include as an independent variable in the allometric equation. Beside that, Figure 1 also shows that DBH and WD forming an exponential growth pattern to total aboveground biomass. Thus exponential growth pattern reveals that all of sampled trees were in growing time. Based on those exponential growth patterns as shown in Figure 1, there are two approaches in establishing equations in order to achieve highest level of accuracy, firstly by establishing an equation following quadratic model, or secondly by following logarithmic model based on basic equation model as suggested in Basuki et al. (2009). Figure 1: Scatter plot of each Independent Variable In the same intention, Grant et al., (1997) and Stewart (1998) also declare that the exponential growth relationship can be explained through quadratic equations, and it will raise the accuracy level of the estimation values if converted to a regression following logarithmic model. The result in establishing allometric equation shows in Table 1. Based on Table 1, the most proper equation to estimate TAGB on each genus is Log(TAGB) = c + α Log(DBH), this model uses only a single predictor of DBH and produces a range of prediction values closer to the upper and lower limits of the observed mean. Wood density is an important factor for estimating the biomass for mixed species, there for Log(TAGB) = c + α Log(DBH) + β Log(WD) is the most proper equation to estimate total aboveground biomass of mixed commercial species. In establishing the equations in this study the biggest potential sources of errors could be identified was differs of wood density among tree sections. Wood density differs among the tree sections, it is higher at breast height than at the top of bole and also higher at the base of the tree stem than that at the base of the living crown. In the current study, the samples for wood density analysis were taken from the upper, middle and lower of the main trunk. However, these data were also used to estimate the weight of the big branches that were impossible to be weighed. This causes over-estimation of the weight for individual trees. 743 Table 1. Allometric Equations Average Coefficient Species Grouping (Genera) N Equations Log TAGB = c + α Log DBH Log TAGB = c + α Log WD Intsia; Maulana and Asmoro (2010) 13 TAGB = c + α DBH + β DBH2 TAGB = c + α WD + β WD2 Log TAGB = c + α Log DBH Log TAGB = c + α Log WD Pometia; Maulana and Asmoro (2011) 15 TAGB = c + α DBH + β DBH2 TAGB = c + α WD + β WD2 Log TAGB = c + α Log DBH Log TAGB = c + α Log WD Palaquium 13 TAGB = c + α DBH + β DBH2 TAGB = c + α WD + β WD2 Log TAGB = c + α Log DBH Log TAGB = c + α Log WD Vatica 8 TAGB = c + α DBH + β DBH2 TAGB = c + α WD + β WD2 Log TAGB = c + α Log DBH Log TAGB = c + α Log WD Log TAGB= c + α Log DBH + β Log WD Commercial Species 49 TAGB = c + α DBH + β DBH2 TAGB = c + α WD + β WD2 Symbo l Vakues Standard Errort of the Coefficien [T -statistics] c -0.762 0.1097 6.95 α 2.51 0.0889 28.24 c 3.86 0.1032 37.41 α 6.92 0.4051 17.07 c 128.3 167.1 0.77 α -24.70 18.84 1.31 β 1.678 0.4188 4.01 c 3090 741.8 4.17 α -12718 2463 5.16 β 13244 1948 6.80 c -0.8406 0.102 8.21 α 2.572 0.078 33.02 c 4.267 0.066 64.43 α 7.214 0.249 28.98 c 232.5 123.5 1.88 α -40.46 12.44 3.25 β 2.131 0.269 7.90 c 4632 771.7 6.00 α -20620 2840 7.26 β 22886 2526 9.06 c -1.52 0.1899 8.01 α 2.96 0.1482 19.92 c 6.217 0.2365 26.28 α 11.59 0.6666 17.39 c 111.30 85.08 1.31 α 24.13 8.677 2.78 β 1.489 0.1887 7.89 c 6618 855.6 7.73 α 35000 3863 9.06 β 46043 4288 10.74 c -0.0975 0.1143 0.85 α 2.086 0.08742 23.86 c 6.368 0.3444 18.49 α 17.67 1.585 11.15 c 130.90 161.1 0.81 α 21.50 16.3 1.32 β 1.658 0.3507 4.73 c 51612 12972 3.98 α 182565 43019 4.24 β 161565 35504 4.55 c -0.881 0.1101 8.00 α 2.580 0.08584 30.05 c 4.065 0.155 26.23 α 6.455 0.548 11.78 c 0.205 0.2047 0.95 α 2.08 2.0840 18.59 β 1.75 1.7491 5.53 c 152.49 80.71 1.89 α -28.764 8.426 3.41 β 1.7689 0.1843 9.60 c -7 1006 0.01 α -1928 3578 0.54 β 5070 3083 1.64 R2 R2 adjusted F -statistics 98.60% 98.50% 797.51 1.70 96.40% 96.00% 291.52 3.90 94.90% 93.90% 93.03 27.65 97.60% 97.10% 204.60 46.06 98.80% 98.70% 1090.5 1.56 98.50% 98.40% 839.64 1.92 97.80% 97.40% 267.56 40.72 97.40% 97.00% 223.77 43.92 97.30% 97.10% 396.85 4.74 96.50% 96.20% 302.46 7.97 98.30% 97.90% 284.40 33.92 97.40% 97.00% 284.23 37.17 99.00% 98.80% 569.13 0.69 95.40% 94.60% 124.31 0.86 98.20% 97.40% 133.08 7.64 96.40% 94.90% 66.07 28.20 95.10% 94.90% 903.08 8.23 74.70% 74.20% 138.76 38.33 97.00% 96.90% 750.67 3.50 95.20% 95.00% 454.86 51.79 64.30% 62.80% 41.47 38.97 3.2 Comparison to Previously Published Equation From the aspect of model application, allometric equation is specific to certain site and species. There for, allometric equation is uncomparable for different species and site. But, the 744 Deviatio n (%) variable structure and the model form, various allometric equations is comparable to seek the highest level estimation accuracy (Maulana and Asmoro, 2010). In this section, allometric equation for estimating TAGB of a mixed commercial species from this study will be compare against previously published equations from Basuki et al. (2009), Brown (1997), and Ketterings et al. (2001), as shown in Table 2. Table 2. Comparison between research result and published equations No. Equations Diameter interval 1 Log(TAGB) = 0.205 + 2.08Log(DBH) + 1.75Log(WD) {research result} 2 Ln(TAGB) = -2.266 + 2.030 Ln(DBH) + 0.542 Ln(WD) {Basuki et al. (2009)} 3 TAGB = 0.139 DBH2.32 {Brown (1997)} 4 TAGB = 0.066 DBH 2.59 {Ketterings et al. (2001)} R2 adj 5-40 cm 96.90% 6-200 cm 98.50% 5-40 cm 89.00% 8-48 cm 95.40% Remarks: TAGB = Total Above Ground Biomass (Kg/Pohon); DBH=Diameter at Breast Height (cm); WD=Wood Density (gr/cm 3). Basuki et al. (2009) developed allometric equations for tropical lowland dipterocarp forest in East Kalimantan. Brown (1997) developed allometric equations for tropical forests using data collected from Kalimantan and other tropical regions. Ketterings et al. (2001) established an allometric equation in mixed secondary forest in Sumatra, but this forest was not classified as dipterocarp forest. Table 2 shows that the chosen equation in this study has the same basic form with the other three equations, which were previously published. According to Ketterings et al. (2001), the selection of DBH as independent variable will raise measuring efficiency in the field, and also reduce the uncertainty in estimation result based on established equations. The comparison of estimation value based on equations in Table 2 is shown in Figure 2. Figure 4: The comparison graph of TAGB estimation values based on published equations 4. CONCLUSION AND RECOMMENDATION 4.1 Conclusion Based data analysis, it can be concluded that the most proper equation to estimate TAGB on each genus is Log(TAGB) = c + α Log(DBH), this model uses only a single predictor of DBH and produces a range of prediction values closer to the upper and lower limits of the 745 observed mean. Wood density is an important factor for estimating the biomass for mixed species, there for Log(TAGB) = c + α Log(DBH) + β Log(WD) is the most proper equation to estimate total aboveground biomass of mixed commercial species. 4.2 Recommendation Based on the application of the proposed model to the previously published data and the application of the published equation to the current data, it can be suggested that the application of species and site-specific equation must be considered. REFERENCES Basuki, T M, Van Laake, P E, Skidmore, A K and Hussin, Y A (2009): Allometric equations for estimating the above-ground biomass in tropical lowland Dipterocarp forests. Forest Ecology and Management 257, 1684-1694 Brown, S and Masera O (2003): Supplementary methods and good practice guidance arising from the Kyoto Protocol, section 4.3 LULUCF projects Good Practice Guidance For Land Use, Land-Use Change and Forestry, Intergovernmental Panel on Climate Change National Greenhouse Gas Inventories Programme ed J Penman, M Gytartsky, T Hiraishi, T Krug,D Kruger, R Pipatti, L Buendia, K Miwa, T Ngara, K Tanabe and F Wagner (Kanagawa: Institute for Global Environmental Strategies (IGES)) pp 4.89–4.120 Brown, S (1997): Estimating biomass and biomass change of tropical forests: a primer. FAO. Forestry Paper 134, Rome, 87 pp. Clark, D A, Brown, S, Kicklighter, D W, Chambers, J Q, Thomlinson, J R, Ni, J, Holland, E A (2001): Net primary production in tropical forests: an evaluation and synthesis of existing field data. Ecological Application 11 (2), 371–384. De Gier, A (2003): In: Roy, P. (Ed.), A New Approach to Woody Biomass Assessment in Woodlands and Shrublands. Geoinformatics for Tropical Ecosystems, India pp. 161–198. Grant, William E, Pedersen, Ellen K, Marin and Sandra L (1997): Ecology and Natural Resource Management (System Analysis and Simulation). John Willey and Sons, Inc., New York. Hairiah, K and Rahayu, S (2007): Pengukuran Karbon Tersimpan di Berbagai Macam Penggunaan Lahan. ICRAF. Bogor [IPCC] Intergovernmental Panel on Climate Change (2006): IPCC Guidelines for National Greenhouse Gas Inventories. Prepared by the National Greenhouse Gas Inventories Programme ed H S Eggleston, L Buendia, K Miwa, T Ngara and K Tanabe (Japan: Institute For Global Environmental Strategies). Ketterings, Q M, Coe, R, van Noordwijk, M, Ambagau, Y and Palm, C A (2001): Reducing uncertainty in the use of allometric biomass equations for predicting aboveground tree biomass in mixed secondary forests. Forest Ecology and Management 146, 199–209. Lu, D S (2006): The potential and challenge of remote sensing-based biomass estimation. International Journal of Remote Sensing, 27(7): 1297-1328. Maulana, S I and Asmoro, J P P (2010): Penyusunan Persamaan Allometrik Genera Intsia sp. Untuk Pendugaan Biomasa Atas Tanah Pada Hutan Tropis Papua Barat. Jurnal penelitian Sosial dan Ekonomi Kehutanan Volume 7(4)Edisi Khusus. Maulana, S I and Asmoro, J P P (2011): Persamaan-persamaan Allometrik Untuk Pendaugaan Total Biomasa Atas Tanah Pada Genera Pometia Di Kawasan Hutan Tropis Papua. Jurnal penelitian Sosial dan Ekonomi Kehutanan 8(4). 746 Nelson, B W, Mesquita, R, Pereira, J L G, de Souza, S G A, Batista, G T and Couta, L B (1999): Allometric regressions for improved estimate of secondary forest biomass in the Central Amazon. Forest Ecology and Management 117, 149–167. Pearson T, Walker S and Brown S (2005): Sourcebook for land use, land-use change and forestry projects Winrock International and the BioCarbon Fund of the World Bank p 57. Post W M, Izaurralde R C, Mann L K and Bliss N (1999): Monitoring and verification of soil organic carbon sequestration Proc. Symp. Carbon Sequestration in Soils Science, Monitoring and Beyond (December) ed N J Rosenberg, R C Izaurralde and E L Malone (Columbus, OH: Batelle Press) p 41. Samalca and Irvin K., 2007. Estimation of Forest Biomass and Its Error, A Case in Kalimantan-Indonesia [Thesis]. International Institute for Geo-Information Science and Earth Observation. Enschede, The Netherlands. Stewart, J (1998): Kalkulus. Edisi Keempat. Susila I. N., H. Gunawan, penerjemah; Mahanani N., W. Hardani, editor. Penerbit Erlangga. Jakarta. Transleated from original book title: Calculus, Fourth Edition. Stewart, J L, Dunsdon, A J, Hellin, J J and Hughes, C E (1992): Wood biomass estimation of Central American dry zone species. Tropical Forestry Papers 26. Oxford Forestry Institute, Department of Plant Sciences, University of Oxford. Wang, H, Hall, C A S, Scatena, F N, Fetcher, N and Wu, W (2003): Modeling the Spatial and temporal variability in climate and primary productivity across the Luquillo mountains, Puerto Rico. Forest Ecology and Management 179: 69–94. 747 INAFOR 11P-007 INTERNATIONAL CONFERENCE OF INDONESIAN FORESTRY RESEARCHERS (INAFOR) Strategies for Developing Private Forests Around Laiwangi Wanggameti National Park in Sumba Timur District Rahman Kurniadi Forestry Research Institute of Kupang Jl. Untung Surapati No.7 (belakang) Air Nona, Kupang 85115, INDONESIA Corresponding email: [email protected] Poster paper prepared for The First International Conference of Indonesian Forestry Researchers (INAFOR) Bogor, 5 – 7 December 2011 INAFOR SECRETARIAT Sub Division of Dissemination, Publication and Library FORESTRY RESEARCH AND DEVELOPMENT AGENCY Jl. Gunung Batu 5, Bogor 16610 748 Strategies for Developing Private Forests Around Laiwangi Wanggameti National Park in Sumba Timur District Rahman Kurniadi Forestry Research Institute of Kupang Jl. Untung Surapati No.7 (belakang) Air Nona, Kupang 85115, INDONESIA Corresponding email: [email protected] ABSTRACT Development of forests around the Laiwanggi Wanggameti National Park is one solution to reduce the people pressure on the preservation of Laiwanggi Wanggameti National Park. However, the development of private forests in the region face several obstacles. Dry climate and forest fire is the main problem faced by local communities in efforts to develop private forests. This study aims to find out the potential of private forests around the Laiwanggi wanggameti National Park and obtain strategies for developing private forest. The results showed that around the national park Laiwanggi Wanggameti considerable potential for the development of private forests with the potential of 16.7 m3 per hectar per year contruction timber. The strategies made public in order to successfully plant a private forest are to do intercropping system to planting, conduct land clearing without fire, planting forests near the house, and planting forests in accordance with monitoring capabilities. Keywords: Private forest, strategies, Laiwanggi Wanggameti National Park 1. INTRODUCTION Buffer zone of Laiwanggi Wanggameti National Park is an area that great influence on sustainability of National Park. People in the buffer zone interact directly with the National Park area. Not infrequently the existence of communities in the buffer zone is a concern for the preservation of the National Park. The buffer zone can be harmful for sustainaibility of National Park if not managed properly. Buffer zone of Laiwanggi Wanggameti National Park has consisting of 16 villages. Two of them are rural enclaves. Meanwhile, local people's dependence on commodities that derived from the National Park is quite high. This led to the Laiwanggi Wanggameti National Park highly vulnerable to disturbance caused by communities. Disturbance of people living around Laiwanggi Wanggameti National Parks can be prevented if the buffer zone is able to provide the needs of communities in buffer zones. This can be done by utilizing all the potential that exists in the buffer zone of Laiwanggi Wanggameti National Park. Development of private forests around the Laiwanggi Wanggameti National Park is one solution to reduce the people pressure on the preservation of Laiwanggi Wanggameti National Parks. However, the development of private forests in the region face several obstacles. Dry Climate and forest fire are the main problems faced by local communities in efforts to develop private forests. Development of private forests around Laiwanggi Wanggameti National Park constrained forest fires and dry climate. This led causes the successful development of community forests is low. Same strategies are needed to address the development private forests. The research aims to find out the potential of private forest around Laiwanggi Wanggameti National Park. Getting strategies for developing private forest around Laiwanggi Wanggameti National Park. 749 2. RESEARCH METHOD The study was conducted in Wanggameti, Katikuwai, Ramuk, Billa, and Wudipandak Village. The five villages are around Laiwanggi Wanggameti National Park. Research carried out for two months ie August to December 2011. Data collected for this study were: name of trees, diameter of trees, trees height, age of stands, forests area, community strategy for preventing forest fires and community strategy for facing drought. The data collected consists of primary data and secondary data. Primary data were collected by interview people and measure biomass of private forests. People who were interviewed as many as 8 peoples from Ramuk Village, 7 people from Wanggameti Village, 10 people from Katikuwai Village, 10 people from Billa Village, 10 people from Wudipandak Village. The data potential of private forests obtained by measurements of forest owned by the people. Data collected from each sample tree are diameter, height, name and age of the stand. Secondary data was collected from Village Office. Potential of forests around the Laiwanggi Wanggameti National Park measured from increment growth stands. Plot size for this study is 20 m x 20 m. For each farmer made a single plot. The formula used to determine the growth increment of stands are: V MAI =------------A Where: MAI : Mean Annual Increment (m3/hectare/year) V : Volume of stand (m3) A : Age (year) Volume stands on a plot calculated using the following formula: n Σ (¼ Π.di 2. hi. fi.k) i=1 V = ---------------------------------A Where : V : Volume of stands (m3/hectare) A : Forest Π : 3.14 di : Diameter of tree (m) hi : Height of tree (m) fi : Constants (= 0.7) ki : Proportional of construction timber (=0.7) Data about developing private forest strategies were analyzed descriptively. By the way of analysis can be described the efforts made by people to face the problem of forest planting. 3. RESULT AND DISCUSSION 3.1 The Potential of Community Forests The potential of private forests can be seen from the Mean Annual Increment of the stand. Table 1 below presents the potential for private forests in the study area. 750 Table 1. Mean Annual Increment of private forest Number 1. 2. 3. 4. 5. Village Ramuk Wanggameti Wudipandak Billa Katikuwai Average Mean Annual Increment (m3/hectare/year) 26.36 7.11 16.50 14.93 18.79 16.74 Table 1 shows that the potential of private forests around the Laiwanggi Wanggameti National Park is 16,74 m3 per ha per year of construction timber. It also generated wood waste that can be used for energy purposes the local community. In this study the need for construction timber became the main subject becauf of the large demand for construction timber forest communities. Development of forests around the Laiwanggi Wanggameti National Park began in 1982. At that time there were only 6 people are interested in developing community forest. The low interest of the community to plant the forest is due to the local community felt the difficulty to plant private forests in their village. Under the guidance of Tananua NGOs, six local people conduct private forests. 8 years later the results of planting by sixth people reveals the results. Private forests can grow well in their private forest land. The local village residents started to follow in their footsteps. After seeing the success of forest planting in their village. Until the year 2011 there are 200 people having private forests in Billa Village, 50 people in Wudipandak Village, 80 people in Katikuwai Village, 100 People in Ramuk Village as well as 20 people in Wanggameti Village. The amount is likely to grow in line with the growing interest of private forests. The local community obtain construction timber from forest areas of Laiwanggi Wanggameti National Park before 1982. At that time the status of forest areas as protected forest. In 1998 the area was designated as a National Park. Communities surrounding the forest no longer allowed to take timber from the area of Laiwanggi Wanggameti National Park. Private forests are one of the alternatives to meet the needs of construction timber for the people living around the Laiwanggi Wanggameti National Park. Around the Laiwanggi Wanggameti National Park generally found in the form of pasture land. The land is potential for development as private forests. By looking at the success rate of forest planting these lands then it is possible to change the function of land. However, to obtain success in community forestry development strategies is needed. According to Nurfatriani (2007), development of private forests is now one of the alternatives in meeting the needs of logs. Private forest can be used as complementary natural forests to supply logs. In accordance with government decentralization forest management has been submitted to the District/City of coaching activities that include planting trees, maintenance, harvesting and marketing and development. Forest management involves people's participation so that development private forest has strategic opportunities and challenges in the era of regional autonomy. Various opportunities that are owned in the management of private forest on regional autonomy, including: 1) the results of public forests, either directly or indirectly be used as a source of revenue, 2) meet the needs of wood raw material, 3) as a land conservation efforts, and 4) encourage the development of forest-based business people. While the challenges faced are: 1) laws and regulations regarding the management of public forests is still weak, 2) the limited resources of forest farmers, 3) limited human resources support, and 4) institutional forests that are still not effective. 751 According to Diniyati (2004) Attitudes towards local community for developing efforts of private forests is generally positive. In some areas the level of participation of community forests is quite high. The successful planting of community forests is also high. However, Development privet forest is not success in Nusa Tenggara Province so that Interest of local people low. According to Irawati (2004) in some areas has been attempted with the help of community forest development funds. Nevertheless there are still many obstacles so that funds is less effective. While in some areas the development of community forests more successful without the help of funds. According to Sumijarto (2002) business of private forests is financially quite lucrative. In some areas of community forests can grow very well so that peole get benefits from private forest. However, around the Laiwanggi Wanggameti National Park planting forests is often a failure so that the business community forests are less profitable. Of exposure can be concluded that although around Laiwanggi Wanggameti National Park frequent forest fires, private forest could be developed with some strategies so that local communities can plant well a private forest. Local community can get benefit from the business community forests. 3.2 Strategies for Developing Private Forests The area around the Laiwanggi Wanggameti National Park has a dry area. The development of private forests in these locations is difficult. However people can plant private forest in this area. Here are the strategies of local community for developing private forests. 3.2.1 Intercropping System Most of the farmers who succeeded in developing private forest plant private forest by intercropping. Forestry crops grown between crops of corn or beans. This was done for two years. In this way growth of grass can be reduced so the land can be protected from forest fire danger. Forest fires are the main problem for developing private forest. This is caused by the culture of local people who always do the burning land to clear farmland. Forest fire is generally caused of the tall grass, so there are flammable. With intercropping, farmers clearing land so the land can be protected from fire hazards. Plants that are used commonly corn and beans. After two years, people have private forest. Furthermore the land is left by people. 3.2.2 Planting Forests Around The House People plant successful private forest near their house. They have enough land for planting private forest near home. They can keep their private forest from the danger of forest fires. Private forests are planted away from home can not grow well. In addition, forests are far from home is difficult to do maintenance. In areas where low levels of forest fires, require low maintenance level. Even without any maintenance of community forests can grow well. However, treatment can not be done for the private forest planted around Laiwanggi Wanggameti National Park. Private forests are experiencing forest fires and livestock disorders if not done maintenance. Therefore People plant private forests not far from his home with the purpose of facilitating the supervision and maintenance. 3.2.3 Grass Clearing Without Burning The dry has come and people have started burning out dry grass. The reasons for doing this are to clean land or to grow new grass. In fact there are not many advantages even regarding seeming ones. The main argument of the supporters of dry grass burning out is that such burning out warms the soil thoroughly and enriches it with ashes from burned grass as a result of what grass on the scorched areas comes up sooner and grows faster. Actually this is an apparent effect: at first dry grass hides green young sproutes and non-burned areas seem to be grey while green grass is quite visible on the blackened burned areas. Warming-up of the soil during fluent grass 752 fire is slight but buds and seeds of the herbs situated on the soil surface or by it are destroyed so "warming-up" turns to have no effect and sometimes even has negative effect. As for fertilizing the soil by ashes - grass fire adds nothing new: mineral matters contained in ashes in any case would have got into the soil as a result of dry grass decay. Owner of private forest must clear grass to avoid the danger of forest fires every years. Grass is a flammable material and cause forest fires. Private forest fire if people not clean grass. This strategy implemented by owner of private forest around Laiwanggi Wanggameti National park. People clean grass on private forest. They are motivated to do the grass clearing activities because of the sense of the forest. On state forest lands, grass clearing activities rarely performed so that the state forest is often burned. Private forests grow better than the state forest. 3.2.4 People Plant Forest in Accordance With The Supervision Capabilities Generally, people plant forest less than 0.25 ha . This is done for ease of supervision and maintenance. They do not have sufficient funds to carry out grass clearing, so that size of forest is small. The following table are presented the data area of private forests owned by people. Table 2. Private forest area of respondent No 1. 2. 3. Forest are (hectare) < 0,25 25-0,5 > 0,5 Jumlah Number of respondent 26 10 9 45 Percentage ( %) 58 22 20 100 Generally, Private forests grow well are small. From the financial side, Private forests is less efficient. Nevertheless these forests can help to provide construction timber for local communities. People can conserve Laiwanggi Wanggameti National Park Area if construction timber needs are met. Community implement these strategies in the area because of the problems facing communities in forest planting. The strategy can be applied to other regions facing similar problems. Although difficult, communities surrounding national parks laiwanggi wanggameti can plant forests well. 4. CONCLUSION From the research results can be summarized as follows: The area around the Laiwanggi Wanggameti National Park considerable potential for developing private forests. Potential of forests around the Laiwanggi Wanggameti.National Park of 16.7 m3 per hectare per year. Strategy taken farmers to planting private forests include: • Intercropping planting system • Cleaning grass • Planting near home • Size of private forests adapted to supervision capabilities. REFERENCES Nurfitriani, F (2007): Forest Management in the Era of Regional Autonomy. Forestry Research and Development Bulletin Volume 3 No 2. Bogor. 753 Diniyati, D (2004): Study of public attitudes toward the institutional empowerment of community forests (case study in the Village Pasirsalam, Sukapada and Nangewer, KabupatenTasikmalaya). Al Basia Vol 1 No 2. Ciamis. Irawati, S (2004): Effectiveness Evaluation of Distribution and Utilization of Forest People's Business Credit. Socioeconomic Info Vol.4 No. 1. Bogor. Sumijarto and Indah N D (2002): Management of Cempaka Private Forests in Minahasa District, North Sulawesi. Buletin Pengelolaan Das IBT. No.10, Solo. 754 INAFOR 11P-008 INTERNATIONAL CONFERENCE OF INDONESIAN FORESTRY RESEARCHERS (INAFOR) The Study of IBA, BAP and Kinetin Hormones Usage Towards The Buds Multiplications of Agarwood Plant (Gyrinops versteegii (Gilg) Domke) by In Vitro Oki Hidayat Forestry Research Institute of Kupang Jl. Untung Surapati No.7 (belakang) Air Nona, Kupang 85115, INDONESIA Poster paper prepared for The First International Conference of Indonesian Forestry Researchers (INAFOR) Bogor, 5 – 7 December 2011 INAFOR SECRETARIAT Sub Division of Dissemination, Publication and Library FORESTRY RESEARCH AND DEVELOPMENT AGENCY Jl. Gunung Batu 5, Bogor 16610 755 The Study of IBA, BAP and Kinetin Hormones Usage Towards The Buds Multiplications of Agarwood Plant (Gyrinops versteegii (Gilg) Domke) by In Vitro Oki Hidayat Forestry Research Institute of Kupang Jl. Untung Surapati No.7 (belakang) Air Nona, Kupang 85115, INDONESIA ABSTRACT Agarwood is one of non timber forestry product which has a high economic value. Nowadays, the demand of agarwood is still depending on natural forest. The high demand which is followed by high persecution of agarwood in natural forest make the population of agarwood highly decreased. This research aimed to know the best combination of auxin (IBA) and cytokinin (BAP and kinetin) in basic medium of Murashige and Skoog towards the multiplications of Agarwood production plant explants by in vitro. Explants was grew in MS medium with the addition of growth hormone IBA (concentration of 0.00, 0.05, 0.10 mg/l), BAP (0.00, 0.10, 0.20 mg/l) and kinetin (0.00, 0.20, 0.40 mg/l). This research was arranged using the CRD factorial with 17 of treatments in 6 times repetition. The observed parameters such as the height growth, internodes total, buds total, total of leaves, the mortality percentage, callus production process, browning and contamination. The conclusion of this research was the effect of the addition of plant growth regulator combination of IBA (0.00, 0.05, 0.10 mg/l) with BAP (0.00, 0.10, 0.20 mg/l) and IBA (0.00, 0.05, 0.10 mg/l) with kinetin (0.00, 0.20, 0.40 mg/l) give the real response in parameter number of buds and leaves. Whereas on parameter like the height growth and internodes total give real and not different response. Keywords: Gyrinops versteegii, in vitro, multiplications, auxin, cytokinin 1. INTRODUCTION Agarwood is one of non timber products which has a high economic value. Nowadays, the demand of agarwood is still depending on natural forest. The high demand which is followed by high persecution of agarwood in natural forest make the population of agarwood highly decreased. In order to straighten up the agarwood production, the government with the President decision (Keppres No 43/1978) decide that to whom the exporter who has agarwood has to have a CITES license. The conservation to some variety of agarwood is increased; Aquilaria spp. and Gyrinops spp. Was included in Appendix II CITES on Oktober 2nd until 14th 2004 at Bangkok. With the growing rare of agarwood population, it is necessary to the conserve of the species. Propagation through conventional means both generative and vegetative has not shown satisfactory results because of the low success rate and requires a relatively long time. To overcome this problem one of the methods currently developed is the multiplication of in vitro or also known as tissue culture. Through this method will produce plants with large quantities, uniform, disease-free and low freight costs. To optimize the in vitro culture of aloes in order to have buds that much then stimulated with growth regulators BAP and kinetin from the cytokinin group. The addition of cytokinins in the media in general is very necessary at this stage of bud induction and multiplication. This research aimed to know the best combination of auxin (IBA) and cytokinin (BAP and kinetin) in basic medium of Murashige and Skoog towards the multiplications of Agarwood production plant explants by in vitro. 756 2. RESEARCH METHOD 2.1 Study Site This research was doing at micropropagation laboratory of Assessment Center of Biotechnology, BPPT, Serpong, Tangerang. Research conducted over 13 months, from June 2008 to June 2009. 2.2 Tools and Materials 2.2.1 Tools - At Media Preparation Rooms, such as: Beaker, flask, culture tubes, funnels, analytical scales, spatula, microwave, pH meter, magnetic stirer, dispensers, micropipet, volumetric pipettes, ovens, refrigator, hot plate, and autoclave. - At Isolation Rooms and Planting, such as: Laminar air flow cabinet, bunsen, scissor, pinset, dan scalpel. - At Incubation Rooms (thermostatic). The rooms with temperatur control, light and moisture. 2.2.2 Material Plant materials used are buds of G. versteegii seed sterilization results obtained from Mataram. The material culture medium used was Murashige and Skoog basic medium (MS), sugar, gel, growth regulators IBA, BAP and Kinetin. 2.3 Method - Sterilization of tools, culture media, and work environment - Media preparation (stock solution, MS media, treatment media) - Planting with sterile condition - Observation - Data Analysis Calculation of qualitative parameters includes the percentage of contamination by fungi and bacteria, browning (browning) and death in explants. Experimental design used in analyzing the results of this study is the Factorial Complete Randomized Design (CRD factorial) with the number of 17 treatments with each repetition as much as six times, bringing the total plantlets were observed as many as 102 units of experimental. BAP (mg/l) (A) Table 1. Design of experimental Indole Butiric Acid IBA (mg/l) (B) 0.0 (B1) 0.05 (B2) 0.10 (B2) 0.00 (A1) A1B3 A1B1 A1B2 0.10 (A2) A2B3 A2B1 A2B2 0.20 (A3) A3B3 A3B1 A3B2 Kinetin (mg/l) (C) 0.00 (C3) 0.20 (C1) A1C3 A1C1 A2C3 A2C1 A3C3 A3C1 0.40 (C2) A1C2 A2C2 A3C2 Design model used is as follows: Yijk = + Ai + Sj + (AS)ij + ijk To determine the influence exerted on these experiments, the F test performed at the level of 5%. If the results of analysis of variance gives the real effect then conducted further tests to determine the area of Duncan difference between treatments. Processing data using SAS software (Statistical Analysis System) 6.12. 757 3. DISCUSSION 3.1 The Growth Parameters of Height, Leaves and Segments Number Provision of plant growth regulators BAP, IBA, kinetin and combination gives a different effect on the parameters of the observation. 1. 2. 3. 4. Chart Chart Chart Chart of of of of the the the the average average average average number number number number of of of of leaves. high. segments. buds. Figure 1: Growth charts Gyrinops versteegii High increment on explan not as expected, this cause maybe occur, because the ability of explants of the genetic response of plant growth regulators is different. Wattimena (1991) states that the ability of plant metabolism is highly dependent on the ability of plant genetic (endogenous factors). There are some plants that will not respond to growth regulators given (exogenous factors). In addition, the growth is also influenced by the balance between the interaction of endogenous and exogenous factors. Endogenous factors differ for each species, the explants and in the same species. The average number of segments ever produced by a combination of BAP 0.20 mg/l + kinetin 0.20 mg/l of 9 sections. Although the observations at the end of combination treatment BAP 0.20 mg/l + kinetin 0.20 mg/l produces an average value of the highest number of segments, the results of analysis of variance showed that the hormone combination did not provide a significant influence can not be used as a reference so that the combination of BAP 0.20 mg/l + kinetin 0.20 mg/l is an optimal combination to increase the number of segments on explan G. versteegii. 758 When compared between combination hormone treatment with BAP + IBA and BAP + kinetin, it can be seen that the average number of leaves will be reduced if the concentration of the hormone IBA improved on a combination of BAP + IBA. The same thing happened to the treatment of BAP + kinetin hormone combination, if the hormone concentration increased in the combination of BAP + kinetin, the average number of leaves will also be reduced. Both of these phenomena can be taken a hypothesis that the addition of hormones that affect the number of leaves is a hormone BAP. BAP hormones work in influencing the increase in the number of leaves based on the above analysis of variance showed a decrease if the added IBA and kinetin hormone. 3.2 The Buds Multiplication The success of the crops is the large number of new buds emerging. The growth of new buds begin to appear in the first week after planting. Stages of bud emergence begins with the emergence of potential bumps in the axillary buds of leaves and the base that has been callus. Buds on G. versteegii form adventitious buds and lateral buds. Based on the analysis of variance at 95% confidence interval on the provision of BAP, IBA and combinations indicates that the variable number of buds did not give a significant influence on 8 MST (Table 2). Table 2. Summary of analysis of variance accretion buds a combination of BAP and IBA hormones Hormone BAP IBA BAP + IBA Remarks: tn * ** 1 tn tn tn 2 ** tn tn Observation to - (MST)) 3 4 5 6 ** ** ** * tn tn tn tn tn tn tn tn 7 tn tn tn 8 tn tn tn : No significant effect : Significant effect on the 95% confidence interval : Very real effect on the 95% confidence interval The effect is very real look at the hormones BAP from 2 to 5 MST MST. Phenomenon indicates that hormones work optimally at 5 MST then the hormones decreased at 6 MST and so on. This is possible because the hormone levels in the media is running out because it is used by the explants. To see the difference between treatments at 2 to 5 MST conducted further tests Duncan area (Table 3). Table 3. Effect of combination hormone treatment of BAP and IBA on the average number of buds Treatment (mg/l) MS Control BAP 0.00 + IBA 0.05 BAP 0.00 + IBA 0.10 BAP 0.10 + IBA 0.00 BAP 0.10 + IBA 0.05 BAP 0.10 + IBA 0.10 BAP 0.20 + IBA 0.00 BAP 0.20 + IBA 0.05 BAP 0.20 + IBA 0.10 Observation to - (MST) 1 2 3 0.00a 0.00b 0.00d 0.00a 0.00b 0.17cd 0.00a 0.17b 0.33bcd 0.00a 1.00a 1.17ab 0.00a 0.17ab 1.50a 0.17a 0.50ab 1.17ab 0.17a 0.67ab 1.00abc 0.17a 0.17b 1.00abc 0.17a 0.33ab 0.50bcd 4 0.00d 0.33cd 0.67cd 2.17ab 3.00a 1.50bc 2.33ab 1.67abc 1.00bcd 5 0.00e 0.50de 0.83cde 2.83ab 4.00a 2.00bcd 2.67ab 2.33abc 1.67bcde 6 0.00e 0.67de 1.33cde 3.50abc 4.83a 2.67abcd 3.17abc 4.00ab 2.33bcd 7 0.00d 0.83cd 2.00bcd 5.00ab 6.50a 4.67ab 4.50ab 5.67a 3.83abc 8 0.00d 0.83cd 3.17bcd 6.33ab 7.00a 5.50ab 5.67ab 6.83ab 4.17abc Remarks: Values followed by the same letter showed no significantly different effect for the same week DMRT test at 5% Duncan's test showed up the treatment of BAP 0.10 mg/l + IBA 0.05 mg/l gives the best effect on the number of buds when compared with media controls. The average value of the largest in the number of buds present in treatment of BAP 0.10 mg/l + IBA 0.05 mg/l with a 759 value equal to 4 buds, while the lowest average value found in control media with a value of 0 buds. According to Wetherell (1989) and Hartmann et al. (1997) in small concentrations of auxin can stimulate cell division found in buds of plants and is able to reproduce new buds, while in greater concentrations likely to result in the growth of callus and inhibits the regeneration of plant buds. Herawan and Rina (1996) states that, for shoot multiplication in vitro hormone auxin is needed is a low concentration and high concentration of cytokinin. This statement is appropriate when compared with the results of analysis of variance but still need further research in this study because although higher concentrations of cytokinins from auxin, but the concentration of the two do not differ much, only a difference of 0.05 mg/l. Also according to Hartman et al. (1997) interaction of auxin and cytokinin is a primary relationship in plant growth, auxin concentration ratio higher than the cytokines will tend to form root growth, auxin and cytokinin are balanced tend to form callus, while the ratio of cytokinin concentrations higher than the growth of plants more auxin tend to the formation of buds. According to Santoso and Nursandi (1992) auxin and cytokinin has a role and differentiation of cells forming tissues. Salisbury and Cleon (1995) mentions to affect plant growth, endogenous hormones and growth regulators were added substance must be present in sufficient quantities in plant cells and must be recognized and tightly bound by a hormoneresponsive cells (target cells). Observations of the number of buds was also conducted on hormone treatment BAP, kinetin and combination. Results of analysis of variance (Table 4) shows hormone kinetin very real effect on 2 and 3 MST. But to be no significant effect on 4 MST and so on. While the BAP showed the influence of hormones were significantly different at 3, 6,7 and 8 MST. Table 4. Recapitulation of variance accretion buds a combination of BAP and Kinetin Hormone Hormone BAP Kinetin BAP + Kinetin Remarks: tn * ** 1 tn tn tn Observation to - (MST) 3 4 5 6 ** * * ** ** tn tn tn * * * * 2 * ** * 7 ** tn tn 8 ** tn tn : No significant effect : Significant effect on the 95% confidence interval : Very real effect on the 95% confidence interval To see the difference between the treatment carried out further tests Duncan area (Table 5). Table 5. Effect of combination hormone treatment BAP and Kinetin on the average number of buds Treatment (mg/l) Kontrol MS BAP 0.00 + Kinetin 0.20 BAP 0.00 + Kinetin 0.40 BAP 0.10 + Kinetin 0.00 BAP 0.10 + Kinetin 0.20 BAP 0.10 + Kinetin 0.40 BAP 0.20 + Kinetin 0.00 BAP 0.20 + Kinetin 0.20 BAP 0.20 + Kinetin 0.40 Observation to - (MST) 1 2 3 0.00a 0.00d 0.00e 0.17a 0.50cd 1.0cde 0.17a 1.33abc 1.67abcd 0.00a 0.50cd 0.83de 0.50a 1.67ab 2.00abc 0.67a 1.83a 2.17ab 0.17a 1.67abc 1.50abcd 0.67a 2.17a 2.50a 0.33a 0.67bcd 1.33bcd 4 0.00b 2.33a 2.17a 3.17a 2.33a 3.17a 3.83a 2.67a 2.00a 5 0.00b 2.83a 2.83a 3.67a 3.17a 4.00a 4.50a 2.67a 2.17a 6 0.00c 2.83b 3.33ab 4.33ab 4.33ab 6.00a 5.50ab 4.17ab 3.00ab 7 0.00c 2.83bc 3.50b 5.67ab 5.83ab 7.33a 7.33a 5.67ab 4.33ab 8 0.00c 3.83bc 3.67bc 6.50ab 7.00ab 9.17a 9.17a 7.17ab 6.17ab Remarks: Values followed by the same letter showed no significantly different effect for the same week DMRT test at 5% Duncan's test showed up the treatment of BAP 0.10 mg/l + kinetin 0.40 mg/l gives the best effect on the number of buds when compared with control media treatment. The average 760 value of the largest number of buds contained in the treatment of BAP 0.10 mg/l+ kinetin 0.40 mg/l and treatments of BAP 0.20 mg/l with respective figures of 9.17 buds. (Figure 1). The average number of buds on BAP and IBA combination treatment showed that BAP concentrations higher than the average IBA produces a large number of buds. In accordance with research conducted by Overbeek, J. V. in abidin (1985) mentions that the ratio of cytokinin concentrations greater than the concentration of auxin will stimulate the growth of buds and leaves. According to Salisbury and Cleon (1995) cytokinins was instrumental in the formation of lateral buds and synthetic cytokinins are more active than the endogenous cytokinin. Therefore, the addition of cytokinins to the shoot induction medium is more effective in high concentrations because it has a great effect in the formation of buds (Hartmann et al., 1997). 3.3 Visual Observation 3.3.1 Contamination Based on the observation of explants contaminated there are 6 of a total of 102 explants. The percentage of contaminated explants of 5.84%. Overall contamination caused by fungus. The low level of contamination caused explant is derived from the sub-culture, so that the explants grown in sterile conditions. Cause of the contamination is thought to occur due to internal factors such as fatigue that caused growers less intact sterility working conditions at the time of planting so that the fungus easily fit into the culture bottles. 3.3.2 Browning At the time of observation of the early symptoms of browning is marked by the emergence of a brown color around the base of explants. Then the brown color around the base will spread into other parts of plants that will make the explants stunted and eventually die. The brown color is formed by reaction of melamine hidrolisasi secondary O-quinone or due to excess O-difenol (Santoso and Nursandi, 2003). 3.3.3 Callus Callus on explants G. versteegii began to form in the second week. At the end of the observation of 90 explants forming callus or by 88.24%. Callus processed is thought to occur because of sliced explant at the time of planting or because of the influence of the growing influence of substances that stimulate the formation of callus. Overall there are 12 treatment of explants that do not form a callus, namely: control media (4 explants), IBA 0.05 mg/l (1 explant), IBA 0.10 mg / l (3 explants), kinetin 0.20 mg/l (1 explants), kinetin 0:40 mg/l, (3 explants). 4. CONCLUSION AND RECOMMENDATION 4.1 Conclusion The conclusion of this research was the effect of the addition of plant growth regulator combination of IBA (0.00, 0.05, 0.10 mg/l) with BAP (0.00, 0.10, 0.20 mg/l) and IBA (0.00, 0.05, 0.10 mg/l) with kinetin (0.00, 0.20, 0.40 mg/l) give the real response in parameter number of buds and leaves. Whereas on parameter like the height growth and internodes total give real and not different response. 4.2 Recommendation - Media combination of BAP 0.10 mg/l + Kinetin 0.40 mg/l and BAP 0.2 mg/l can be used for buds multiplication G. Versteegii. - Need further assessment regarding the use of the concentration of BAP + kinetin hormone combination of higher than 0.10 mg/l and 0.40 mg/l to trigger the growth of buds explant G. versteegii more optimal. 761 - Need further research by increasing the concentration of BAP + IBA combination to obtain the optimum concentration for shoot multiplication. REFERENCES Abidin Z (1985): Dasar-dasar Pengetahuan Tentang Zat Pengatur Tumbuh. Bandung: Angkasa. Hartmann, H T, D E Kester, F T Davies and R L Geneve (1997): Plant Propagation. Principles and Practices. Sixth Edition. Prentice-Hall of India Private Limeted. New Delhi. Herawan, T and Rina, L H (1996): Petunjuk Teknis Kegiatan Kultur Jaringan. Balai Litbang Kehutanan. Balai Litbang Pemuliaan Benih Tanaman Hutan. Yogyakarta. Salisbury, F B and Cleon W R (1995): Fisiologi Tumbuhan. Jilid 3. Bandung: ITB. Santoso, U and F Nursandi (2003): Kultur Jaringan Tanaman. Universitas Muhammadiyah Malang Press. Malang. Wattimena, G A, Armini, N M and Gunawan L W (1991): Perbanyakan Tanaman. In: Bioteknologi Tanaman, Pusat Antar Universitas Bioteknologi-IPB. Direktorat Jendral Perguruan Tinggi, Departemen Pendidikan dan Kebudayaan. Bogor. 762 INAFOR 11P-009 INTERNATIONAL CONFERENCE OF INDONESIAN FORESTRY RESEARCHERS (INAFOR) Genetic Diversity of Four Populations of Arenga pinnata MERR Revealed by Isozyme Markers Liliek Haryjanto, Prastyono and Burhan Ismail The Center for Research on Biotechnology and Tree Improvement Jl. Tentara Pelajar Km.15 Purwobinangun, Pakem, Sleman, Yogyakarta 55582, INDONESIA Poster paper prepared for The First International Conference of Indonesian Forestry Researchers (INAFOR) Bogor, 5 – 7 December 2011 INAFOR SECRETARIAT Sub Division of Dissemination, Publication and Library FORESTRY RESEARCH AND DEVELOPMENT AGENCY Jl. Gunung Batu 5, Bogor 16610 763 Genetic Diversity of Four Populations of Arenga pinnata MERR Revealed by Isozyme Markers Liliek Haryjanto, Prastyono and Burhan Ismail The Center for Research on Biotechnology and Tree Improvement Jl. Tentara Pelajar Km.15 Purwobinangun, Pakem, Sleman, Yogyakarta 55582, INDONESIA ABSTRACT Sugar palm or Aren (Arenga pinnata Merr) is one of bioethanol-producer which has advantages compared to other plant producing bioethanol. This study is aimed to determine the genetic diversity of Sugar palm tree populations in its natural distribution. Genetic diversity of four populations were investigated by isozyme markers with 4 enzyme systems namely Esterase (EST), Glutamate oxaloacetate transaminase (GOT), Diaphorase (DIA) and 6-Phospogluconate dehydrogenase (6Pg). The numbers of alleles identified by 9 alleles are distributed on four polymorphic loci. The research revealed that mean alleles per locus was 2.25. The mean effective number of alleles per polymorphic locus was 1.8377. All loci were of polymorphic. The mean genetic diversity within population was 0.4381and the proportion of genetic variation among populations was 0.0702. The UPGMA cluster analysis based on Nei‘s standard genetic distance reflected two main clusters. The first cluster consisted of Central Java and South Kalimantan populations; while second cluster included the populations of Bengkulu and North Sulawesi. Keywords: Arenga pinnata MERR, isozyme, genetic diversity, bioethanol 1. INTRODUCTION Sugar palm (Arenga pinnata Merr) is one of bioethanol-producing plants which has been already known traditionally in the form of alcoholic beverages. This plant is native to southeast Asia include Brunei, Cambodia, India, Indonesia, Laos, Malaysia, Myanmar, Papua New Guinea, Philippines, Singapore, Sri Lanka, Thailand, Vietnam and part of South Asia (Miller, 1964), occurring in tropical rainforest and dry forest. It usually grows close to human settlements where anthropic propagation plays a major role. Otherwise it prefers secondary forest at the border of primary rainforests. In Indonesia sugar palm found in almost all regions, especially in the 14 provinces namely Papua, Maluku, North Maluku, North Sumatra, West Sumatra, West Java, Central Java, Bali, North Sulawesi, South Sulawesi, Southeast Sulawesi, Bengkulu, South Kalimantan and NAD (Maliangkay, 2008). Genetic conservation of the species is needed to meet future demands of breeding program. However, there is no available information of genetic diversity of the species as ideally any genetic conservation efforts should be based on genetic diversity information. Therefore, this study is aimed to determine the genetic diversity of Sugar palm tree populations in its natural distribution 2. METHODS 2.1 Leaf Samples Leaf samples were collected from Central Java (Temanggung), South Kalimantan (Banjar), North Sulawesi (Bitung, Minahasa and Tomohon) and Bengkulu (Rejang Lebong). Each population was represented by 20-22 leaf samples of unrelated trees (Table 1). 764 Table 1. Detail of collected leaf sample used in this study No. 1. 2. 3. 4. Population Central Java (Temanggung) South Kalimantan (Banjar) North Sulawesi (Bitung, Minahasa and Tomohon) Bengkulu (Rejang Lebong) Geographical position S 07o07‘29,4‘‘ - 08o08‘02,2‖ ; E 110o03‘16‘‘ - 110o03‘46‘‘ S 03°25‘19‖– 03°25‘53‖ ; E114°54‘21‖– 114°54‘50‖ N 21°31‘4‖–29°50‘ 1‖; E 124°49‘20‖-125°06‘45‖ S 030 28‘ 34,4‖- 030 28‘ 46,0‖; E 1020 34‘ 26,0‖- 1020 34‘ 55,8‖ Altitude (m asl) 500-750 No. of samples 22 12-24 20 112-876 21 893-945 20 2.2 Electrophoresis Electrophoresis procedures were based on Seido (1993). Five enzyme systems, Peroxidase (POD, E.C. No 1.11.1.7.), Glutamate oxaloacetate transaminase (GOT, E.C No 2.6.1.1), Esterase (EST, E.C. No 3.1.1.), 6-Phospogluconate dehydrogenase (6Pg, E.C No 1.1.1.44) and Diaphorase (DIA, E.C. No 2.6.4.3.), were used. A popgene software was used to analyze genetic variation, include: 2.2.1 Genetic Variation Within Population The frequency of allel, percentage of polymorphic loci (P), mean of number of allel per loci (A), effective number of allel per loci (v; allelic diversity), excpected heterozigisity (He), and observed heterozigosity (Ho) of each population were counted. 2.2.2 Genetic Variation Between Population - Genetic structure of a population could be analyze by employing an F-statistics, namely FIS, FIT, FST. FIS is mean of inbreeding coefficient of the indidividual tree within sub-population, FIT is relative mean of an individual tree in a total population, and FST is relative inbreeding coefficient of a sub-population in a total population due to selection and genetic drift (Wright, 1943 as cited in Yeh, 2000). - GST (Nei, 1978), which is a relative value of genetic differentiation between sub-population. - Nei‘s standard genetic distance (DS; Nei, 1972) to estimate genetic distance of populations and, - Cluster analyzis with Unweighted Pair Group Method with Arithmatic Mean (UPGMA). 3. RESULTS 3.1 Genetic Variation Within Population Nine alleles distributed on four polymorphic loci were identified. Means of effective allel per loci (v) was less than means of actual allel per loci (Table 2). Observations on the number and percentage of polymorphic loci (P) at 0.95 significant levels showed polymorphic loci in all populations. These results are higher than other types of conifers by 67.7% (Hamrick et al., 1981), 60.9% for tropical plant from Central America (Hamrick and Loveless, 1989) and 56.3% of plants from Australia (Moran, 1992). Observed heterozygosity (Ho) ranged between 0.5263 (South Kalimantan) to 0.7384 (Bengkulu) with an average 0.6176. This value is higher than other type of Palmae such as coconut (Cocos nucifera L) which is 0.26 (Geethalakshmi et al., 2005). The high value is probably due to the occurrence of cross-pollination among individuals in the population as assisted pollination by bees (Henderson, 1986; Elberson and Oyen, 2010) that has the ability to fly away. 765 Observed heterozygosity (Ho) is higher than the value of He in all populations, which means in all populations the number of individuals heterozygous genotype is more than the number of individuals homozygous genotype. Table 2. Genetic diversity on 4 loci of 4 Sugar palm populations Population Central Java South Kalimantan Bengkulu North Sulawesi Mean A 2.25 2.25 2.25 2.25 2.25 v 1.8101 1.6612 2.0100 1.8695 1.8377 P 100 100 100 100 100 Ho 0.5912 0.5263 0.7384 0.6147 0.6176 He 0.4402 0.3565 0.4991 0.4566 0.4381 F -0.3432 -0.4764 -0.4794 -0.3461 -0.4113 3.2 Genetic Differentiation and Relationship Between Population Value of inbreeding coefficient (FIS) at all loci except locus Dia-1 with an average of 0.4100 (Table 3). This indicates that there is deviation from the Hardy-Weinberg equilibrium in which the number of individuals heterozygous genotype more than the number of individuals homozygous genotype. Inbreeding coefficient showed negative individuals did not occur inbreeding in this population. Negative inbreeding coefficient values also mean heterozygosity in the population is still quite maintained. The average FIT value of -0.3109 indicates a total population of each individual in excess of 31.09% heterozygous genotype. Table 3. Summary of HT, HS, DST and GST values of the four loci of four Sugar palm populations Locus Est-1 Got-1 Dia-1 6Pg-1 Mean FIS -0.6953 -0.4571 1.1649 -0.5167 -0.4100 FIT -0.6818 -0.4272 0.3371 -0.4424 -0.3109 FST 0.0080 0.0205 0.2063 0.0490 0.0702 Genetic difference between populations as indicated by the FST of 0.0702 is almost equivalent to the GST 0.0703 (Table 4). This result shows that the total genetic variation is derived from the genetic variation among populations (7.02%) and from genetic variation within population (92.98%). Generally woody plant species that distribute widely, outcrossed reproductive system and spread the seeds tend to have extensive genetic diversity within populations is greater than the genetic diversity between populations (Hamrick and Godt, 1989). This is possibly due to the process of adaptation to its environment (Widyatmoko et al., 2009). Average of GST of the four populations of Sugar palm is 0.0703 which can be classified as moderate (Yeh, 2000). Table 4. Summary of HT, HS, DST and GST values of the four loci of four Sugar palm populations Locus HT HS DST GST Est-1 Got-1 Dia-1 6Pg-1 Mean 0.5440 0.4387 0.4770 0.4253 0.4712 0.5397 0.4297 0.3786 0.4044 0.4381 0.0043 0.0090 0.0984 0.0208 0.0331 0.0080 0.0205 0.2063 0.0490 0.0703 766 Dendogram of genetic relationship between four populations based on Unweighted Pair Group Method Arithmatic Mean Analysis (UPGMA) cluster analysis (Nei, 1972) in Table 5 is presented in Figure 1. Table 5. Genetic distance (below diagonal) and genetic identity (above diagonal) of four populations of Sugar palm based on Nei's standard genetic distance (1972) Populasi Central Java South Kalimantan Bengkulu North Sulawesi Central Java ----0.0373 0.0693 0.0343 South Kalimantan 0.9634 ----0.1857 0.1239 Bengkulu 0.9331 0.8305 ----0.0286 North Sulawesi 0.9663 0.8835 0.9718 ----- Figure 1: Dendogram of genetic relationship between four populations of Sugar palm based on standard genetic distances (Nei, 1972) There is no clear relationship between clusterring patterns and geographical location. This is likely due to the limited occurrence of gene flow between populations due to isolation by the sea. This is most likely due to the limitation of gene flow between population as each population was isolated by sea. Research on Gyrinops verstegii (Widyatmoko et al., 2009) and Dryobalanops aromatica Gaertn. f (Lim et al., 2001) also shows that thre was no clear relationship between clusterring patterns and genetic distance. 3.3 Implication on The Genetic Conservation and Breeding Program of Sugar Palm A study of genetic diversity is important to know the level of genetic variation within and between populations in their natural distribution. The information is necessary in order to decide an appropriate sampling strategy for genetic conservation purposes. The higher genetic diversity within populations to compare with which of between populations indicates that genetic materials collection for genetic conservation purpose should be done by taking more trees in the population. 4. CONCLUSION 1. The amount of genetic diversity within populations of Sugar palm is high shown by the mean of expected of heterozygosity (He) of 0.4381. 2. The mean genetic diversity of the populations is 0.4712 which is distributed into genetic diversity within population of 0.4381 or 92.98% and the remaining 0.0331 or 7.02% is derived from inter-population. 3. Genetic relationship between the four populations of Sugar palm can be grouped into two clusters. The first cluster includes the population of Temanggung (Java island) and South 767 Kalimantan (Borneo island); The second cluster consists of Bengkulu (Sumatra island), and North Sulawesi (Sulawesi island) populations. 4. The higher genetic diversity within populations to compare with which of between populations indicates that genetic materials collection for genetic conservation purpose should be done by taking more trees in the population. REFERENCES Elberson, W and Leo, O (2010): Sugar palm (Sugar palm ga pinnata): Potential of sugar palm for bio-ethanol production. FACT Foundation Geethalakshmi, P, Parthasarathy, V A and Niral, V (2005): Genetic diversity among coconut (Cocos nucifera L) genotypes using isozymes. Asian Journal of Plant Science 4(6): 678-683. Hamrick, J L and Godt, M J W (1989): Allozyme diversity in plant species. In: Brown,A.H.D., Clegg, M.T., Kahler, A.L., Weis, B.S. (Eds). Plant Population Genetic, Breeding and Genetic Resources, Sinauer. Sunderland. Mass, USA. Hamrick, J L and Loveless, M D (1989): The genetic structure of tropical tree populations: associations with reproductive biology. In: J.H. Bock and Y.B. Linhart (Eds), The Evolutionary Ecology of Plants. Westview Press, Boulder, CO, pp. 129-146. Hamrick, J L, Mitton, J B and Linhart, Y B (1981): Level of genetic variation intrees: influenceof life history characteristics. In: M.T. Conkle (Editor), Proc. Symp. Isozymes of Northern American Forest Trees and Forest Insects, Berkeley, CA. Gen. Tech. Rep. PSW-48, USDA Forest Service, Washington, DC, pp. 35-41. Henderson, A (1986): A review of pollination studies in the Palmae. Bot. Rev. 52: 221-259. Malingkay, R B (2008): Sumber benih dan teknologi persemaian Sugar palm . Warta Penelitian dan Pengembangan Tanaman Industri 14(2). Miller, R H (1964): The versatile sugar palm. Principles 8(4): 115-147. Moran, G F (1992): Patterns of genetic diversity in Australian tree species. New Forest 6:49-66. Nei, M (1972): Genetic distance between populations. American Naturalis 106:283-292. Widyatmoko, A Y P B C, Afritanti, R D, Taryono and Rimbawanto, A (2009): Keragaman genetik lima populasi Gyrinops verstegii di Lombok menggunakan penanda RAPD. Jurnal Pemuliaan Tanaman Hutan 3(1): 1-10. Yeh, F C (2000): Population genetic. In Young, A., Boshier, D., dan Boyle, T. (Eds). Forest Conservation Genetics. Principles and Practice. CSIRO Publishing. Australia. 768 INAFOR 11P-010 INTERNATIONAL CONFERENCE OF INDONESIAN FORESTRY RESEARCHERS (INAFOR) Log Tracking of Merbau ( Intsia bijuga) using DNA Markers: Strategy and Research Status Anto Rimbawanto and AYPBC Widyatmoko The Center for Research on Biotechnology and Tree Improvement Jl. Tentara Pelajar Km.15 Purwobinangun, Pakem, Sleman, Yogyakarta 55582, INDONESIA Corresponding email: [email protected] Poster paper prepared for The First International Conference of Indonesian Forestry Researchers (INAFOR) Bogor, 5 – 7 December 2011 INAFOR SECRETARIAT Sub Division of Dissemination, Publication and Library FORESTRY RESEARCH AND DEVELOPMENT AGENCY Jl. Gunung Batu 5, Bogor 16610 769 Log Tracking of Merbau ( Intsia bijuga) using DNA Markers: Strategy and Research Status Anto Rimbawanto and AYPBC Widyatmoko The Center for Research on Biotechnology and Tree Improvement Jl. Tentara Pelajar Km.15 Purwobinangun, Pakem, Sleman, Yogyakarta 55582, INDONESIA Corresponding email: [email protected] ABSTRACT Merbau (Intsia bijuga), a dark, luxurious, and resilient red hardwood, is one of the most valuable timbers of South East Asia. The principal use of merbau is for the manufacture of exotic hardwood flooring. In Indonesia, the species is naturally distributed from Sumatera to Papua. However, nowadays, as illegal logging has been widespread for quite some time only in Maluku and Papua where the species still in abundance. The IUCN Red List of Threatened Species 2006, listed I. bijuga as Vulnerable under the category VU A1cd. The objective of the study is to establish database of natural populations of Merbau in order to verify the origin of wood material from suspected illegally harvested logs. For such database to be established, series of activities have to be carried out, including: 1) Collection of genetic materials from natural distribution (Papua, Maluku, Sulawesi); 2) Development of DNA extraction method from wood samples; 3). Development of new DNA markers (SSR, SNPs); 4) Establishment of DNA database; 5) Verification of wood origin using the database. These research activities have been initiated since 2008 and several outputs have been obtained, such as: 1) Genetic diversity and genetic distance amongst 4 populations; 2) DNA extraction method using DNAeasy kit; 3) Genetic material collection of 18 populations from Papua, Maluku and Sulawesi; 4) Sequence variation of 4 noncoding regions chloroplast DNA. The final output of the study is database of population‘s genetic structure of merbau based on developed DNA markers (chloroplast DNA, SSR and SNPs). Keywords: Instia bijuga, log tracking, data base, genetic structure, DNA markers 1. INTRODUCTION Illegal logging contributes to deforestation and by extension global warming, causes loss of biodiversity and undermines the rule of law. Illegal logging takes place when timber is harvested, transported, bought or sold in violation of national laws. These illegal activities undermine responsible forest management, encourage corruption and tax evasion and reduce the income. There are a number of points along the chain of production and supply at which enforcement efforts can be aimed. Currently, the approach to track the origin of timber is based on legal documents or barcode labeling. Unfortunately, these systems are still open to abuse. A more robust method is to use DNA markers; with DNA the identity of a piece of wood is contained within it, is carried with it, and cannot be tampered with (Degen and Fladung 2007). Merbau (Intsia bijuga), a dark, luxurious, and resilient red hardwood, is one of the most valuable timbers of South East Asia. The main utilization of merbau is for manufacture of exotic hardwood flooring. However, due to its durability and density, it is also widely used in exterior joinery, stairs and outdoor furniture, cabinet making, and exterior decking. Merbau is native to the western Pacific and Indo-Malaysian region, from New Guinea and Palau in the west to Fiji, Tonga and Samoa in the southeast, and to the Mariana, Caroline and Marshall Islands in the north and northeast in the Pacific. It is found in Madagascar, the Seychelles, Indonesia, Malaysia, 770 Thailand, Philippines, Papua New Guinea, and Australia. In Indonesia, the species is naturally distributed from Sumatera to Papua. However, nowadays, as illegal logging has been widespread for quite some time only Maluku and Papua still have large population of this species. The IUCN Red List of Threatened Species 2006, listed I. bijuga as Vulnerable under the category VU A1cd but the genus has not been reviewed since 1994. This means that this species of Intsia is threatened and is facing a risk of extinction in the wild in the medium-term future. Tracing the geographic origin of wood samples requires a priory sampling and genotyping of reference population throughout the distribution area of the target species. The ability of being able to track wood samples to geographic origin depends on sample size, number of polymorphic markers and the genetic diversity of the reference populations (Dykstra et al., 2003; Lowe, 2007). Finkeldey et al. (2007) have tried to identification of Dipterocarps by molecular genetic markers. Although it may be difficult to trace down individuals to their population of origin based only on DNA marker information, the system would be useful for controlling purpose. Therefore, objective of the analysis is to verify the origin of wood material of merbau using the database. 2. RESEARCH ACTIVITY The approach of implementing this research will be divided into a series of parallel activities. Collection of genetic materials for genetic analysis will be on the top priority. At the same time techniques for DNA extraction from woody materials has to be developed. The first challenge for using genetic markers in timber identification is to successfully isolate genomic DNA from dry wood. For most genetic study, generally genomic DNA is isolated from leaves or seeds of a species. However, since wood is the target of examination, the existing method for DNA extraction that is common for leaf material cannot be applied. Wood contains compounds that inhibit PCR technique. Furthermore, the timber products that reach the market may consist of only heartwood, which is not a good source of DNA since it contains dead cells. Fortunately, extraction of DNA from wood has been successful and reported. Essentially, the laboratory work consists of whole genomic DNA extraction and purification, PCR reaction, electrophoresis and data scoring, analysis and interpretation. DNA markers to be examined are chloroplast DNA, microsatellite and SNPs. Flowchart of the research activity is shown in Figure 1. Detail of research activities are as follows: Collection of genetic materials from natural distribution of merbau (Papua, Maluku and Sulawesi) Collection of genetic materials (leaves and wood) will be gathered from as much population as possible from 3 major islands, i.e. Papua, Maluku and Sulawesi. Much of the population will be selected from Papua areas, the main distribution of merbau in Indonesia. Leaves will be collected from at least 20 individual trees as well as wood samples from each population. Development of DNA extraction method from wood samples DNA extraction from leaves or seed is easier compared to wood as many DNA extraction methods have been developed for leaf and seed; however, the method for wood is still limited. In this study, genomic DNA extraction from wood will be conducted using both published and new methods. Development of new DNA markers DNA markers have different features that make them more or less useful for tracing origin. Some markers are universal, meaning that they amplify across species while others are speciesspecific. Universal primers have the drawback of potential amplification of non-target DNA whereas specific markers need to be developed for each species. Chloroplast and mitochondrial markers in broadleaved trees are maternally inherited and often show strong geographic structure but relatively low overall variation. In contrast nuclear markers are bi-parentally inherited and often show less geographic structure but higher variation. Specific DNA markers for 771 identification of geographic origin of merbau have not been developed. Both chloroplast and nuclear DNA will be examined and apply accordingly. Nuclear markers such as microsatellite and SNPs (single nucleotide Polymorphic DNA) will be tested because it possesses higher resolution and will be useful to assign to population. Material collection DNA markers development Data base struktur DNA (Fingerprinting) Identification population/individual of Wood origin verification DNA Analysis DNA extraction methods Wood samples Figure 1: Flowchart of the research activity Establishment of DNA data base Generating genetic database of merbau would be a prerequisite to apply DNA log tracking. The genetic database is obtained by examining the genetic profile of merbau in its natural distribution. The database will then be used as baseline for examining the genetic identity of known and unknown source of merbau. Using the markers and all samples of selected populations, database will be established. The substance of database will include name of population, location and specific-markers (genotyping). Test of log tracking using developed markers and wood/log samples Wood materials that have been collected from each natural population are extracted and analyzed using selected DNA markers. Finally, the results are compared with the database to verify the origin of the wood. 3. RESEARCH PROGRESS 3.1 Genetic Diversity of 4 Populations of Merbau Using RAPD Marker Rimbawanto and Widyatmoko (2006) have reported genetic diversity and genetic relationship among 4 population of merbau using RAPD marker. Mean genetic diversity of the 4 population 772 was high. Mean genetic distance between populations was 0.141. It means that 14.1% of the genetic between populations was different. The information is very important because it demonstrates the potential to differentiate merbau population. Based on this research, population of merbau in Papua can be divided into 6 regions (geographically different) as in Figure 2. Figure 2: Map of collected populations 3.2 Collection of Genetic Materials from Natural Distribution of Merbau (Papua, Maluku and Sulawesi) Genetic materials (leaf and wood) have been collected from eighteen (18) populations. Those populations were distributed in Papua region (13 populations), Maluku region (4 populations) and South East Sulawesi (1 population). Detail location of each population is in Table 1. Table 1. List of population No. 1 2 3 4 5 6 7 8 9 Population Manimeri Minamin Oransbari Waigo Wasior Bintuni Babo Remsiki Mandopi Location West Papua West Papua West Papua West Papua West Papua West Papua West Papua West Papua West Papua No. 10 11 12 13 14 15 16 17 18 Population Serui Kaimana Sarmi Wasur Nusajaya Haruku Seram Saumlaki Buton Location West Papua West Papua Papua Papua North Maluku North Maluku Maluku Maluku South East Sulawesi 3.3 Development of DNA Extraction Method from Wood Samples Several DNA extractions methods for wood have been carried out. However, only the method using DNEasy Plant Mini Kit could produce enough DNA for PCR amplification. The amplification of wood DNA using 4 chloroplast DNA region primers is shown in Figure 3. The wood was physically crushed into small pieces and continued crushing using liquid nitrogen. The extraction then follows the procedure of DNEasy Plant Mini Kit (Promega). 773 CS-2 CS-3 CS-4 CS-6 Figure 3: PCR profile of 4 chloroplast region using wood DNA 3.4 Development of New DNA Markers Database of genetic structure of the populations was first established using data from 4 regions of chloroplast DNA. The 4 regions are trnT-trnL (CS2), trnL-intron (CS3), trnD-trnY (CS4) and rbcL-atpB (CS6). The four chloroplast DNA regions have been used to clarify population differentiation in several species. From the 4 regions, 7 substitutions, 3 microsatellite/SSR and 3 indel (insertion/deletion) were obtained. The PCR profile of the 4 regions is in Figure 4 and the sequence variation in Table 2 (a, b and c). CS-2 CS-3 CS-4 CS-6 Figure 4: PCR profile of 4 chloroplast region using leaf DNA Tabel 2a. Sequence variation of 4 chloroplast DNA region No. Sampel 1. 2. 3. 4. 5. 6. 1: 2: 174 T/C T T T T C T CS2 (trnT-trnL) 215-226 338-3501 T (SSR) Indel 10 11 10 + 12 10 11 - 408-4252 Indel + + - TAATTTATATAACAC ATTATTATATATATGTATA Tabel 2b. Sequence variation of 4 chloroplast DNA region (continue) No. Sampel 1. 2. 3. 4. 5. 6. 1-6 T (SSR) 6 5 6 6 6 6 21 C/A C C A A C C CS3 (trnL-intron) 92 192 C/T G/T C G C G C G C T T G C G 3: TTTGTAGTAATATTAATAGTAGTA 774 228 G/A A G G G A A 382-4063 Indel + - Tabel 2c. Sequence variation of 4 chloroplast DNA region (continue) No. Sampel 1. 2. 3. 4. 5. 6. CS4 (trnD-trnY) 341 T/C T T T C T T CS6 (rbcL-atpB) 520-532 587 A (SSR) G/T 13 G 13 G 13 G 12 G 12 T 13 G REFERENCES Degen, B and Fladung, M (2007): Use of DNA-markers for tracing illegal logging. Proceedings of the international workshop ―Fingerprinting methods for the identification of timber origins‖ (Editor: Bernd Degen). pp. 6-14. Dykstra, D P, Kuru, G, Taylor, R, Nussbaum, R, Magrath, W B and Story, J (2003): Technologies for wood tracking: Verifying and monitoring the Chain of Custody and Legal Compliance in the timber industry. Workshop on Log Tracking and Chain of Custody Systems. [email protected]. Finkeldey, R, Rachmayanti, Y, Nuroniah, H, Nguyen, N P, Cao, C and Gailing, O (2007): Identification of the timber origin of tropical species by molecular genetic markers – the case of Dipterocarps. Proceedings of the international workshop ―Fingerprinting methods for the identification of timber origins‖ (Editor: Bernd Degen). pp. 20-27. Lowe, A (2007): Can we use DNA to identify the geographic origin of tropical timber? Proceedings of the international workshop ―Fingerprinting methods for the identification of timber origins‖ (Editor: Bernd Degen). pp. 15-19. Rimbawanto, A and Widyatmoko, AYPBC (2006): Keragaman genetik empat populasi Intsia bijuga berdasarkan penanda RAPD dan implikasinya bagi program konservasi genetik. Jurnal Penelitian Tanaman Hutan 3:149-154. 775 INAFOR 11P-011 INTERNATIONAL CONFERENCE OF INDONESIAN FORESTRY RESEARCHERS (INAFOR) The Influence of Growth Medium and Shading to the Growth of Seven Month’s Old of Manglid (Manglietia glauca BL) Seedlings Rina Bogidarmanti1, Rina Kurniaty2 and Ratna Uli Damayanti2 1The Center for Research and Development on Forest Productivity Improvement Jl. Gunung Batu 5, Bogor 16610, INDONESIA 2Seed Technology Research Institute of Bogor Jl. Pakuan Ciheuleut Bogor 16001, INDONESIA Poster paper prepared for The First International Conference of Indonesian Forestry Researchers (INAFOR) Bogor, 5 – 7 December 2011 INAFOR SECRETARIAT Sub Division of Dissemination, Publication and Library FORESTRY RESEARCH AND DEVELOPMENT AGENCY Jl. Gunung Batu 5, Bogor 16610 The Influence of Growth Medium and Shading to the Growth of Seven Month’s Old of Manglid (Manglietia glauca BL) Seedlings 776 Rina Bogidarmanti1, Rina Kurniaty2 and Ratna Uli Damayanti2 1The Center for Research and Development on Forest Productivity Improvement Jl. Gunung Batu 5, Bogor 16610, INDONESIA 2Seed Technology Research Institute of Bogor Jl. Pakuan Ciheuleut Bogor 16001, INDONESIA ABSTRACT Manglid belongs to family Magnoliaceae is become one of priorities species being developed especially community forest in West Java region. This species has multipurpose function such as for construction wood, pulping, boxes, poles, furniture and others. The experiment was carried out with aim to determine various kinds of growth medium and shading to support the growth of manglid seedlings. A completely randomized design arranged in factorial experiment was employed for this experiment. The factor of various kinds of growth medium was applied namely: M1 (soil), M2 (mixture of soil and cocopeat (1:2)), M3 (mixture of soil and rice husk charcoal (1:2)), M4 (mixture of soil, cocopeat and rice husk charcoal (1:2:2) and M5 (mixture of soil and compost (1:2)). Meanwhile the other factor is shading condition consisted of 3 (three) level namely N1 (0%), N2 (45%) and N3 (75%). Experimental unit consist of 3 (three) seedlings with 5 (five) replications. The total number of observation unit namely 225 seedlings. The observed parameters were survival rate percentage, height and diameter increment and also Seedling Quality Index (SQI). The research result showed that both of the treatments give significantly effects to all of the parameters. Combine of medium using mixture of soil and compost (1:2) (M5) and shading condition N3 (75%) give the best result to height increment (13.56 cm), diameter increment (4.48 cm) and SQI (0.24). Meanwhile the treatment M2N3 give the highest growth in percentage of manglid seedlings namely 75.24%. Keywords: Manglid, seedlings, growth medium, shading intensity 1. INTRODUCTION Manglid are included in the family Magnoliaceae is one type of wood mainstay of the West Java area. In Indonesia this species are generally known by the name of the timber trade Cempaka or Baros. Spread in Indonesia covers the whole of Indonesia, except for Eastern Indonesia. Specialized in Java its distribution is concentrated in West Java, whrereas this species has been used by the community, among others, for building houses, bridges, cement board, veneer, plywood, carvings and furniture. (Heyne, 1987). At present the existence of this species in the dwindling forest areas become decrease in line with the increasing demand for this species as raw material for carpentry and construction. This is a result of the imbalance between the activities of exploitation of this species with regeneration activities (Diniyati et al., 2005). In Bali, this species is also widely used as raw material for handicrafts. This can cause the timber potential of diminishing returns. The development of this species in the form of community forests conducted at several locations in West Java and Bali (Diniyati et al., 2005). Commonly propagation of this species by community is through generative propagation (seeds). The selection technique is based on experience in the event of the season is usually the fruit of conception can be obtained in large quantities. The problem facing that manglid seeds including the recalcitrant seeds, which can not be stored for a long time because the seeds will be damaged and the germination rate will decline. Under these conditions manglid seed handling should be done immediately after seeds were collected. To improve the quality of the resulting manglid seedlings, have mastered a nursery technique concerning the type and composition of 777 the appropriate growth media and shading conditions necessary arrangements to optimize the growth of the seedlings. Based on the problems encountered, then the purpose of the research conducted was to find alternative types and composition of growth media and conditions for the best shading intensity to support the growth of manglid seedlings. 2. MATERIAL AND METHOD 2.1 Time and Place Research conducted at the Greenhouse of Seed Technology Research Center (BPTP) Ciheuleut, Bogor. Research activities carried out during 7 (seven) months, namely from March 2007 to September 2007. 2.2 Materials and Equipments Materials used in this research activity namely manglid seeds, germination and weaning media (soil, sand, rice husk charcoal, cocopeat and compost), poly bag size 15 x 20 cm, paranet 40% and 75%, aqqu water and solution of EM 4. While the equipment used namely the trays, oven, analytical scales, calipers, gauges, stationery and water jug. 2.3 Methodology 2.3.1 Sowing/Seed Germination Manglid seeds newly collected then extracted to remove the flesh. The seeds then soaked in a solution of aqqu water with a concentration 1:16 (v/v) for 10 seconds. Furthermore, the seeds are sown in trays containing a mixture of soil and sand media (1:1 (v/v)). 2.3.2 Weaning Weaning is done after at least a pair of seedling leaves growth. Weaning media used is pure soil, a mixture of soil + cocopeat (1:2 (v/v)), rice husk charcoal + soil (1:2 (v/v)), soil + cocopeat + rice husk charcoal (1:2:2 (v/v/v) and soil + compost (1:2 (v/v). weaning seedlings need to be done with caution, if the roots are too long, should be cut so as not folded. Seedlings are already planted in the media weaning and then stored in nursery beds that have been given various shading intensity namely 0%, 45% and 75%. Maintenance is done by regular watering 2 days using water jug, clearing weeds and spraying pesticides do if there is pest attacked. 2.3.3 Design Research The research design used was completely randomized design and arranged in a factorial. The treatment consisted of 2 (two) factors: The first factor is the growing medium consisting of: M1 = pure soil; M2 = soil + cocopeat (1:2); M3 = soil + rice husk charcoal (1:2); M4 = soil + cocopeat + rice husk charcoal (1:2:2) and M5 = soil + compost (1:2), whereas the second factor is shading intensity namely N1 (0%), N2 ( 45%) and N3 (75%). Each treatment was tested repeated 5 times and each unit consists of 3 seedlings, so the total numbers of experiment units are 225 seedlings. 2.3.4 Parameters The parameters observed include the percentage of survival rate, height, diameter increments were observed for 7 months with observation done every 1 month intervals. At the end of the study also observed dry weight of seedlings, and Seedlings Quality Index (SQI). Observation data were analyzed by using analysis of variance, if there is a differentiation among the treatment performed Duncan's Multiple Test (DMRT) at 5% level. 778 3. RESULT AND DISCUSSION 3.1 Percentage of Survival Rate The average percentage of survival rate of manglid seedlings up the age to 7 (seven) months is presented in Table 1 below: Table 1. The average percentage of survival rate of manglid seedlings up the age to 7 months Treatments M1N1 M1N2 M1N3 M2N1 M2N2 M2N3 M3N1 M3N2 M3N3 M4N1 M4N2 M4N3 M5N1 M5N2 M5N3 1 100.0 100.0 100.0 100.0 100.0 100.0 100.0 100.0 100.0 100.0 100.0 100.0 100.0 100.0 100.0 2 66.7 90.0 63.3 66.7 70.0 90.0 56.7 73.3 60.0 50.0 83.3 86.7 66.7 76.7 76.7 3 33.3 66.7 56.7 30.0 60.0 90.0 33.3 53.3 56.7 33.3 76.7 76.7 43.3 53.3 63.3 Month 4 0 60.0 50.0 0 50.0 73.3 0 50.0 50.0 0 63.3 63.3 0 43.3 53.3 5 0 33.3 43.3 0 43.3 60.0 0 45.3 43.3 0 60.0 50.0 0 36.6 45.3 6 7 0 33.3 40.0 0 40.0 56.7 0 45.3 43.3 0 53.3 50.0 0 33.3 43.3 0 33.3 40.0 0 40.0 56.7 0 43.3 43.3 0 50.0 50.0 0 33.3 43.3 Average (%) 59.52 52.86 57.62 75.24 58.76 56.67 69.52 68.10 53.80 60.75 Based on the results the use of some types of growing media and shading intensity can be seen that the largest percentage of survival rate of manglid seedlings obtained in the treatment M2N3 (75.24%) and lowest in the treatment of M1N2 (52.86%). At the age of 5 months manglid seedlings stored in the shading intensity N1 (0%) and combination with all various media, gave result that all seedlings experienced the death of up to 100%. Thus, by the observation the age up to 7 months the treatment M1N1, M2N1, M3N1, M4N1 and M5N1 are not included in subsequent analysis. When viewed from the percentage of survival rate of manglid seedlings up to age 5 (five) months seen that with the provision of shading intensity treatments of 0% (no shading) resulting in the death of the seedlings. This relates to the nature of manglid seedlings that require shading during seedlings procurement, but when ready to be planted in the field will grow well in locations that are open or there is little shading (Sosef et al., 1998). After the age of 7 (seven) months, the best percentage of survival rate equal to 75.24% obtained in the treatment of M2N3 (soil + cocopeat 1:2 and shading by 75%). While the lowest percentage of survival rate (52.86%) found in the treatment of M1N3 (soil and shading 75%). This suggests that the type of growing medium that is used greatly affect the growth of seedlings. Basically, in the process of germination and seedling procurement, it require a medium that has a requirement to store water, good aeration and high porosity. When cocopeat used singly as media for germination or seedlings procurement based on the results obtained by Sudono et al. (2008) produces a low percent germination (33.3%). This relates to the nature of the cocopeat which has a high capacity for keeping water but lacks good porosity properties, so the media is too moist conditions. However, by mixing it with the soil can produce good media condition for growth of manglid seedlings. Using of other media such as mixture of soil + rice husk charcoal; soil+ cocopeat + rice husk charcoal or soil + compost, resulting in average of survival rate range between 53.80 % - 69.52%. In the seedlings procurement the use of shading intensity by 75% gives the results of the highest percentage of seedlings survival rate. This suggests that until the age of 7 months manglid seedlings require rather heavy shading conditions to be able to produce their optimal 779 growth. Shading conditions will affect the intensity of light to be received by the seedlings to make the process of metabolism, among others, for the process of photosynthesis. On a lighter shading condition the intensity of light to be received by the seed is relatively high. This condition will affect the process of opening and closing of stomata on the leaf cells, the inhibitory activity of transpiration will be more accelerated in which it will affect the overall growth of seedlings. Conversely, if environmental conditions with a relatively heavy shading may hamper the process of photosynthesis productivity which this will also inhibit the growth of seedlings (Gardner et al, 1991). Basically, each seedlings has a certain light intensity requirements at every phase of its growth to support its optimum growth. 3.2 Height Increment Based on the results of height increment of manglid seedlings the age up to 5 (five) months of treatment shows that use of various kinds media and shading intensities was not demonstrated significant effect. Especially for the use of shading at 0%, since all the seedlings that get treatment at the time of entering the age of 5 (five) months become death of all, so the analysis of height increment at the age of 7 months only performed for the treatment of shading intensity 40% and 75% . In Table 2 below can be seen that the highest average of height increment of manglid seedlings at the age 7 month reached on the treatment of M5N3 is equal to 13.56 cm. While the lowest height increment found in the treatment of M4N3 is equal to 8.08 cm. Table 2. The average height increment (cm) of manglid seedlings at the age of 7 months No Treatments 1. 2. 3. 4. 5. 6. 7. 8. 9. 10. M1N2 M1N3 M2N2 M2N3 M3N2 M3N3 M4N2 M4N3 M5N2 M5N3 1 3.21 3.17 3.10 3.54 3.40 3.40 3.62 3.23 3.47 3.41 2 4.31 4.63 4.68 5.14 4.41 4.89 4.45 4.08 4.56 4.88 Average of height increment (cm) Month 3 4 5 6 5.67 6.54 7.68 8.44 5.94 7.80 8.69 9.54 6.11 7.92 8.93 10.19 6.85 9.16 10.37 11.41 5.23 6.50 7.19 7.84 5.73 6.55 7.87 8.24 5.18 6.23 7.82 8.54 5.06 5.63 6.60 7.40 6.12 7.13 8.04 8.92 6.31 8.31 9.95 12.32 7 8.89 10.25 10.63 12.04 8.35 8.72 8.74 8.08 9.70 13.56 Based on the analysis of variance (Appendix Table 1) provision both of the treatments namely type of growth medium and shading intensities give a significantly effect on manglid seedling height increment. Furthermore, based on the results of Duncan test (Table 3) can be seen that the growth media M5 showed differentiation with media M1, M2, M3 and M4. As for the provision of shading intensity, treatment of N1 different with N2 and N3. Table 3. Duncan test for growth media and shading intensity effect to height increment No Media Total 1 2 3 4 5 M5N3 M2N3 M1N3 M2N2 M4N3 13 17 10 12 15 Average of height increment (cm) 9.72 7.80 7.17 6.68 5.80 780 Test result a ab bc bcd bcd 6 7 8 9 10 11 M1N2 M5N2 M3N3 M3N2 M4N3 M4N3 10 10 13 13 14 15 5.68 5.59 5.39 5.29 4.86 4.78 bcd bcd cd cd cd d Note: Numbers followed by same letter are not significantly different at 5% level Use of M5 media (soil + compost (1:2)) and M2 (soil + coocopeat (1: 2)) with shading intensity 75% were earning the highest average of manglid seedlings height increment This is possible due to the intensity of light that relatively few will spur the growth of plant height in order to obtain sunlight for physiological processes (Marjenah, 2001). The use of mixed media soil and cocopeat or soil and compost was producing the highest average height increment. This is possible because with the addition of organic material on the growth medium will help retain moisture and structure of the media, increasing nutrient availability for plants as well as increasing the activity of microorganism (Princess et al, 2009). Similar results were also found in experimental research on seedling procurement of Alnus nepalensis. DON that use a mixture of soil and compost media (1:1) yielded the highest average of height increment compared to control (medium soil) (Bogidarmanti and Mindawati, 2010). 3.3 Diameter Increment Based on the results of the use of various growth media and the shading intensity, producing an average diameter increment of manglid seedlings as shown in Table 4. The highest result of diameter increment (4.48 cm) obtained in the treatment of M5N3 while the lowest is in the treatment of M3N3 (1.66 cm) Table 4. Average diameter increment of manglid seedlings at the age of 7 months No Treatment 1. 2. 3. 4. 5. 6. 7. 8. 9. 10. M1N2 M1N3 M2N2 M2N3 M3N2 M3N3 M4N2 M4N3 M5N2 M5N3 1 0.45 0.42 0.43 0.40 0.43 0.45 0.48 0.43 0.47 0.43 2 0.67 0.72 0.70 0.69 0.68 0.74 0.73 0.69 0.73 0.73 Average of diameter increment (cm) Month 3 4 5 1.08 1.38 1.70 1.05 1.33 1.74 1.15 1.64 2.20 1.10 1.78 2.57 0.99 1.23 1.35 1.12 1.22 1.39 1.15 1.34 1.49 1.03 1.11 1.27 1.41 1.33 1.59 1.09 2.16 1.93 6 1.95 1.91 2.45 2.65 1.54 1.56 1.70 1.44 1.74 2.21 7 2.07 2.33 2.72 3.15 1.74 1.66 1.88 2.27 2.04 4.48 Furthermore, based on the results of analysis of variance (Appendix Table 2) provision of growth media and shading treatment give significant effect on diameter increment of manglid seedlings. To see which the differentiation among the treatment is performed Duncan test (Table 5). Table 5. Duncan test for type of growth media and shading intensity on diameter increment No Media Total 1 2 3 4 5 M5N3 M2N3 M2N2 M1N3 M4N3 13 17 11 10 15 Average of diameter increment (cm) 4.06 2.69 2.27 1.99 1.66 781 Test result a b b b b 6 M5N2 10 1.54 b 7 M312 10 1.52 b 8 M4N2 15 1.41 b 9 M3N3 13 1.33 b 10 M3N2 13 1.33 b Note: Numbers followed by same letter are not significantly different at 5% level Duncan test results showed that treatment of M5N3 different from other treatments in influencing the growth of seedlings manglid diameter increment. The use of soil and compost mixed media (1:2) as well as providing shading by 75% yielded the best average diameter increment of seedlings compared to other treatments. The same results manglid nurseries using shading intensity 65% and 75% turned out to produce a better diameter growth than under shading 0% (Sudono et al., 2008). Similar conditions are also found in the research results of Kurniaty et al (2007) use of soil and mixed media with rice husk charcoal combination with shading intensity by 75% able to produce the best diameter growth of mindi seedlings. Diameter increment tends to be optimum if there is a balance between the needs of light and respiration process (Simorangkir, 2000 in Sudono et al., 2008), but for every kind of plant it requires a certain intensity range for optimal growth spur. 3.4 Seedlings Quality Index (SQI) Seedling Quality Index (SQI) of 7 months old of manglid (Table 6) shows that treatment of a variety of growth media and shading intensity shade, and also the interaction between both factors are significantly affected on the manglid SQI. Table 6. Analysis of variance for manglid seedling quality index at 7 months old Source of variance Degree of freedom Media 4 Shading 1 Media*Shading 4 Error 40 Total 49 * 5% Significant level ** 1% Very significant level Sum of square Mean square F.calculate 0.082 0.043 0.079 0.173 0.377 0.021 0.043 0.019 0.004 4.72 9.97 4.53 F.table 0.05 2.61 4.08 2.61 0.01 3.83 7.31 3.83 Significantly degree ** ** ** Respect to the interaction between the two factors mentioned above are very significantly affected on the manglid SQI, then the advanced Test Duncan performed to see which the differentiation among the treatments (Table 7). 782 Table 7. Duncan test of growth media and shading intensity to manglid SQI at the age 7 Months No Treatments Total SQI Test result 1 M5N3 5 0.24 a 2 M2N2 5 0.16 ab 3 M2N3 5 0.15 ab 4 M4N3 5 0.08 bc 5 M3N3 5 0.08 bc 6 M1N3 5 0.08 bc 7 M1N2 5 0.06 c 8 M3N2 5 0.06 c 9 M4N2 5 0.04 c 10 M5N2 5 0.03 c Note: Numbers followed by same letter are not significantly different at 5% level The best manglid SQI (0.24) obtained in the treatment M5N3 using of soil and compost mixed medium and combine with shading intensity 75%. Meanwhile manglid SQI which use other media and combine with shading intensity 40% ranges from 0.03 to 0.06. SQI values illustrate how the ability of seedlings to be able to survive if planted in the field. The good seedlings that has a SQI value> 0.09 (Dickson et al, 1960 in Hendromono et al, 1995). Based on this criteria, the use of various media are given the intensity of the shade as much as 40% was not able to produce seedlings that have good quality to be planted in the field. 4. CONCLUSION AND RECOMMENDATION 4.1 Conclusion Based on research results obtained, it can be concluded some item such as following: 1. Treatment of growth media type combine with shading intensity significantly affect survival rate percentage, height and diameter increment and seedlings quality index of manglid. 2. The optimum manglid seedling growth up to the age of seven months is obtained by administering a mixture of soil and compost (1:2) (v/v). and shading intensity by 75%. 3. The best seedlings quality index (0,24) obtained on the use of soil and compost mixed media (1:2) (v/v) combine with shading intensity. 4.2 Recommendation Further research in manglid seedling procurement should be focused in using growth medium, which have organic matter composition and easy to be found in local community. REFERENCES Bogidarmanti, R and N Mindawati (2010): Pengaruh Variasi Media Sapih pada Pertumbuhan Bibit Cabutan Alnus nepalensis DON. Draft Jurnal Pusat Litbang Peningkatan Produktivitas. Bogor. (In progress of publication). Diniyati, D, Suyarno, D P, Kuswantoro, A, Badrunasar, E, Fauziyah, T, Sulistyati, E, Mulyati (2005): Teknik Perbanyakan Tanaman Manglid (Manglieta glauca Bl) dengan Biji. Loka Penelitian Dan Pengembangan Hutan Tanaman Monsoon. Ciamis. Hendromono, Masano and H Alrasjid (1996): Mutu morfologi dan pertumbuhan bibit Gmelina arborea Roxb dalam wadah yang telah disemprot Kogide 80 AS. Bull. Penelitian Hutan 602:17-24. 783 Heyne K (1987): Tumbuhan Berguna Indonesia. Jilid II. Badan Litbang Kehutanan. Departemen Kehutanan. Kurniaty, R B, Budiman, M Suartana dan R U Damayanti (2007): Pengaruh media dan naungan terhadap kualitas bibit. Laporan Hasil Penelitian BPTP, Bogor (unpublished). Putri, K P, R Kurniaty, A Muharam dan H M Sanusi (2009): Bahan organik sebagai media alternatif dalam pembibitan tanaman hutan. Disampaikan dalam Gelar Teknologi Balai Teknologi Perbenihan Bogor di Majalengka, 24 Juni. Sudomo, A, D Swestiani, Rusdi, B Rachmawan dan R D Herdyana (2008): Silvikultur Kayu Hutan Rakyat Penghasil Pulp (Manglid (Manglietia glauca BL.), Tisuk (Hibiscus macrophyllus), Mindi (Melia azedarach)). Laporan Hasil Penelitian. Balai Penelitian Kehutanan Ciamis. Badan Penelitian Dan Pengembangan Kehutanan (unpublished). 784 Appendix Table 1. Analysis of variance manglid seedlings height increment Source of variance Degree of freedom Sum of square Mean of square F.calculate 44.82 51.45 16.30 3.16 14.19 16.290 5.16 Media 4 179.26 Shading 1 51.45 Media*Shading 4 65.22 Error 118 372.70 Total 127 668.64 * = significant at 5% level ** = very significant at 1% level F.Table 0.05 2.45 3.92 2.45 Significantly level 0.01 3.48 6.85 3.48 ** ** ** Appendix Table 2. Analysis of variance of manglid seedling diameter increment Source of variance Media Shading Media*shading Error Total Degree of freedom Sum of square Mean of square F.calculate 4 1 4 46.14 14.35 24.19 11.53 14.35 6.05 4.56 5.67 2.39 118 127 298.38 383.06 2.53 F.Table 0.05 2.45 3.92 2.45 Significantly level 0.01 3.48 6.85 3.48 ** * ns * = significant at 5% level **= very significant at 1% level ns = not significant at 5 % level Appendix Table 3. Analysis of variance of manglid seedlings quality index (SQI) Source of variance Media Shading Media*shading Error Total Degree of freedom Sum of square Mean square F.calculate 4 1 4 0.082 0.043 0.079 0.021 0.043 0.019 4.72 9.97 4.53 40 49 0.173 0.377 0.004 * = significant at 5% level ** =very significant at 1% level 785 F.Tabel 0.05 2.61 4.08 2.61 0.01 3.83 7.31 3.83 Tingkat Nyata ** ** ** INAFOR 11P-012 INTERNATIONAL CONFERENCE OF INDONESIAN FORESTRY RESEARCHERS (INAFOR) Microhydro: Green Energy from Forest Area Enhancing Better Relationship Between Forest and People Hunggul Yudono Forestry Research Institute of Makassar Jl. Perintis Kemerdekaan Km. 16, Makassar, 90245, INDONESIA Poster paper prepared for The First International Conference of Indonesian Forestry Researchers (INAFOR) Bogor, 5 – 7 December 2011 INAFOR SECRETARIAT Sub Division of Dissemination, Publication and Library FORESTRY RESEARCH AND DEVELOPMENT AGENCY Jl. Gunung Batu 5, Bogor 16610 786 Microhydro: Green Energy from Forest Area Enhancing Better Relationship Between Forest and People Hunggul Yudono Forestry Research Institute of Makassar Jl. Perintis Kemerdekaan Km. 16, Makassar, 90245, INDONESIA ABSTRACT The utilization of water yield for the welfare of communities adjacent the forest is one of incentives model in forest management expected to invigorate the collective participation of the community in protecting and preserving the functions of forests. This approach is based on the understanding that instead of many benefits of forests understood today, forest function as water regulator is undeniable and vital to the livelihood of human beings. Since the year 2004 in accordance with its task and function, Makassar Forestry Research Institute has developed the concept of community-based forest management (CBFM) through the development of small scale electricity generator (micro-hydro power plant) in the form of Participatory Action Research (PAR). Micro hydro power plants are environmentally friendly, inexpensive, and highly potential to be developed in the forested upper watershed. This model has been developed by the aims to develop better relationship between forest and people and to enhance collective participation in sustaining and protecting the forest. This model has been implemented in various agencies (Regional Forestry Office, Department of Environment, BKSDA, BDK, National Park, BPDAS) at various places either through the state budget and local budget. From the observation of the effectiveness of the concept, several indicators showed that the concept run on the tracks as being planned: the high enthusiasm of the community to participate collectively spending time, money and effort in maintaining microhydro unit and protecting the forest. Keywords: Micro hydro, water yieled, forest, energy 1. INTRODUCTION The practitioners, researchers, NGOs, as well as in forestry bureaucrats believe that to achieve success in managing the forest and its benefits, accommodating the interests of the community and encourage community participation exist in and around forests are the key words. If forest managers successful in empowering community participation in forest management, then most of the problems faced is solved. The key to successful development of community participation in protecting and preserving the forest are when the forest is capable to produce and deliver real benefits for them and the communities can see and feel a strong direct relationship between social welfare and forest sustainability. One of the functions of forest that cannot be substituted, undeniable and vital to the livelihood of human beings is its function as a regulator of the water system (water regulator). Forest and water are two things that cannot be separated. If forestry feel difficult to defend themselves and arguing with other sectors in the fight over the forest area from the standpoint of economic, social, and protection of ecosystems, the ability of forests to maintain continuity of water to meet water needs for irrigation, domestic water, as well as the energy source, can be used as an argument that cannot be disputed. The question then arises: how to encourage community participation in upstream watershed management, especially in the conservation of forests? What activities should be made to ensure that public participation is maintained even if the activities (Project) is over? What activities can generate optimum impact to improve the welfare of the community and maintain 787 the quality, quantity and continuity of water? What are the benefits of forests that can be managed to make people aware about the protection and preservation of the forest? Because the water, as the main element of the watershed, naturally flow from upstream to downstream, from top to bottom, problem-solving efforts in watershed management in this concept should also begin from forest management in the upstream in both of biophysical and socio-economic institutions issues. The forests in upper watersheds should be managed to meet the needs of people in the upstream first and then the continuity of water to meet the ecological balance will be obtained as well. Associated with the effort to develop new approaches in forest management, since 2005 in accordance with its task and function, Makassar Forestry Research Institute has developed the concept of Community Based Forest Management/CBFM through the development of Microhydro power plants functioned as a ―glue‖ for better relationship between forest and people. In accordance with the ultimate goal to be achieved, by the end of 2009, Forestry Research Institute popularized micro hydro development activities by the the brand of Lestari Hutanku, Terang Desaku (My Forest is conserved, My village will be enlightened). 2. WHAT IS A MICRO-HYDRO POWER PLANT? Micro hydro power plant is a term used for small scale hydroelectric power installations that typically produce up to 100 kW of electricity and is constructed in the upper watershed by using river flow as power source. This cheap electricity is optimized to be utilized by communities around the forest. In the forestry standpoint, the objective of micro-hydro power plant development is to enhance positive relationship between forest and community and aimed to enhance collective awareness of the community in and around the forest to independently maintain and preserve the functions of forests. Forests function sustainability will ensure continuity of water that will benefit the community itself (on site) and downstream communities (off site). Micro-hydro power plant electric is a renewable energy from forests as a real form of energy savings as well as improvement of environmental quality reducing the use of nonrenewable fuels (oil, coal) commonly used in conventional power plant industry. Another advantage of mini-hydropower is in its distribution network that is easy and simple. Relatively low cost, -by developing micro-hydro-, forestry can optimize the water as forest service to enhance communities welfare and become a trigger for communities to maintain the sustainability of forest and the water supply as their energy power source. Figure 1: Penstock : Delivering Water from forest to power plant 788 3. WHY SHOULD FORESTRY DEVELOP MICRO-HYDRO POWER PLANT? Up to this now, how to manage upstream watershed environment (forest and surrounding communities), in particular in order to preserve and maintain the forest in all its constraints and limitations of the government, still a subject of interesting study. One of the "key" is the active participation of the people especially those located in and around the forest. Participation is considered as the most strategic factor in achieving sustainability of forest functions. Development of community participation in protecting and preserving the surrounding forest can be successful if the forest is able to provide real benefits for them and the communities can see and feel a strong direct relationship between their welfare and forest sustainability. This participation comes as a result of positive reciprocity of community and the forest. Micro-hydro power plant uses river flow system, only produce electricity when the water is available, so the quantity and continuity of the river discharge will affect the sustainability of electricity production. Deforestation and degradation will directly affect the continuity of quantity, quality, and continuity of river discharge and ultimately affect the sustainability of electricity production. Direct correlation between deforestation with electricity production will raise awareness and active participation of communities to protect and preserve forests. Hence, the implementation of micro-hydro power plant can be used as indirect approach in reducing deforestation and degradation of forest. Technically, the potential to develop micro-hydro power plant around the forest area is very large. if there are running water and heights, electricity can be generated. The primary key of hydropower is the force of gravity that will drain the water in the desired amount and speed. In general, the potential of water in the surrounding forest in the watershed upstream is abundantly available throughout the year, and the mountainous topography allow for different heights. To support the operation of the Micro-hydro Power Plant, it is necessary to set up user groups. In addition to ensure the continuity of the Micro-hydro Power Plant operation, the formation of this group is also intended as an "entry point" of forest protection efforts. The group was formed by the community and aimed to collectively maintain the continuity of the utilization of power plants that depend on two main factors : units of equipment, and power supply (continuity of water). Equipment units associated with the lifetime of each component such as a synchronous generator, runner wheels, bearings, and pipes. Maintenance of the equipment material is funded from membership dues and productive business units of the groups utilizing micro-hydro power plant. The operation and maintenance of micro-hydro power plant is done collectively by group members. Associated with power supply (continuity of water flow), then what is being needed is a concerted effort of the entire group to jointly participate to maintain the forest as a "water producer". These activities are carried out by a self-governing group. The role of government primarily only in coaching and mentoring, and supporting tree seeds to fulfill the needs of wood for fuel and building material. This role will be further reduced by the passage of time in line with increasing public awareness and abilities. Coaching and mentoring is given in the form of guidance through technology transfer and training and discussion and participatory learning. Coaching and mentoring provided by government agencies and non-governmental agencies (NGOs). Microhydro development activities as part of forestry activities is addressed to improve society's commitment to protect and preserve forests. With the agreement that was set up before the construction carried out, planting and maintaining forests is used as an inherent obligation as well as monthly dues set by the group. User groups have an obligation of monthly dues and planting trees per month and the nursery is facilitated by the government. Tree planting and 789 maintenance are attached for members of the group as a consumer of electricity. However, coaching, mentoring and technology transfer from the government or NGO is necessary to help the group grow. Through this project, the community‘s ability to work together collectively has been improved. 4. THE SYNERGY OF MICRO-HYDRO POWER PLANT DEVELOPMENT WITH FOREST AND LAND REHABILITATION (FLR) If the cost of Micro-hydro power plant is synergized with FLR activities, then the above concept can be used as a catalyst of success of FLR. FLR costs for an area of 1000 ha is needed Rp 5 billion (assuming a cost of FLR is 5 million/ha). If 10% (equivalent to 100 ha crop) of activity was used as micro-hydro power plant development (equivalent to Rp. 500 million) equivalent to 90% success, we can make three micro hydro unit which serves 3 villages (450 ± household. If every household to plant 5 trees/month, then within 1 (one) year will be planted 27.000 trees. Assumptions spacing 5 x 5 m (400 trees/ha) will be embedded trees covering 67,5 ha / year. Thereby increasing the success of planting through the involvement of user group to preserve and maintain the plantation. Micro hydro can also be used as part of community empowerment activities in the scheme of Corporate Social Responsibility (CSR). 5. MICRO-HYDRO POWER PLANT OF FORESTRY RESEARCH INSTITUTE OF MAKASSAR: “FOREST IS CONSERVED, VILLAGE WILL BE ENLIGHTENED” As Forestry Research and Development institutions, Forestry Research Institute of Makassar starting in 2005 has been designing Micro-hydro Power Plant and the development of whole concept as an instrument for community-based forest management. The research of micro-hydro power plant utilization units as well as efforts to improve the technical efficiency of micro-hydro as well as institutional social engineering has been carried out since 20045at two experimental micro watershed managed by Forestry Research Institute of Makassar: Mararin Micro Watershed in Tana Toraja District and Datara Micro Watershed in Gowa Disrtrict. Both district are part of South Sulawesi Province. Furthermore, since 2007 Forestry Research Institute of Makassar has facilitated and helped various agencies (Regional Government Forest Office, Department of Environment, BKSDA, BDK, BPDAS) to develop the whole concept of micro-hydro power plant at various places either through the state budget or regional government budget funds, among others, in Tana Toraja, Pangkep and Gowa (South Sulawesi), Donggala and Poso District in Central Sulawesi, Bolaang Mongondow District in North Sulawesi and North Buton in Southeast Sulawesi. The range of the cost of implementing the activities with a capacity of 10-20 KVA to enlighten approximately 80-150 KK community around the forest amounted to ± 150 million rupiah. In certain circumstances cost may increase or decrease depending on the design of the turbine unit, the physical conditions of the location/site (water discharge, height difference, the length of the channel, etc.) and network cable length (distance from the turbine unit to the settlement). 790 Figure 2: Water can light: Micro-hydro power plant in Kolori Villages, Bufferzone of TN. Lore Lindu, Central Sulawesi Construction of Micro-hydro Power Plant is a form Community Based Forest Management with the aim of enhancing and strengthening the relationship between forests and forest communities. By optimizing the direct benefits (instant benefits) of forest for community/people live in and around the forest, the effort to enhance community participation in forestry development can be realized more optimal. From the observation of the effectiveness of the concept, several indicators showed that the concept run on the tracks as being planned : the high enthusiasm of the community to participate collectively spending time, money and effort in maintaining micro-hydro unit and protecting the forest. 791 INAFOR 11P-013 INTERNATIONAL CONFERENCE OF INDONESIAN FORESTRY RESEARCHERS (INAFOR) Wood Stump: Harvesting Technique and Chemical Properties Sukadaryati and Dian Anggraini Indrawan The Center for Research and Development of Forestry Engineering and Forest Products Processing Jl. Gunung Batu 5, Bogor, 16610, INDONESIA Poster paper prepared for The First International Conference of Indonesian Forestry Researchers (INAFOR) Bogor, 5 – 7 December 2011 INAFOR SECRETARIAT Sub Division of Dissemination, Publication and Library FORESTRY RESEARCH AND DEVELOPMENT AGENCY Jl. Gunung Batu 5, Bogor 16610 Wood Stump: Harvesting Technique and Chemical Properties 792 Sukadaryati and Dian Anggraini Indrawan The Center for Research and Development of Forestry Engineering and Forest Products Processing Jl. Gunung Batu 5, Bogor, 16610, INDONESIA ABSTRACT Limitation of backup energy sources to meet future demand, encourage the development of renewable alternative energy sources that are capable to substitute the energy sources. Stump waste from plantation forest is one of the alternative feedstock for renewable energy sources that is worth to developed. Therefore, the research about potentiality, technical studies, socioeconomic, chemical properties and forest environmental impacts caused by stump waste utilization as a renewable energy source are highly required. Eventually stump waste utilization can have high economic value as one of the alternative renewable energy sources so that Indonesia's future energy demand can be supported by a forest stump waste. The purpose of this study was to obtain information of stump harvesting techniques, environmental impact and chemical properties of the stump in regard to development prospect of stump waste utilization as substitution material for renewable energy sources. The results obtained showed stump volumes varied between 0.05 to 0.66 m3, with an average of 0.204 m3 and thus the prospect of stump is 81.77 m3/ha; unplug stump productivity mechanically and manually varied between 0.091 to 3.00 m3/hr and from 0.32 to 2.56 m3/hr; based on their chemical properties, the stump will be better use as a fuel / firewood; the environmental impact caused by stump unplugging may said to be meaningless because the former stump unplugging always closed. It means the soil that unintentionally extracted out during the stump unplugging process will be use again to fill hole that caused by the unplugging process. Keywords: Wood stump, chemical properties, firewood, environmental impact 1. INTRODUCTION Today the government are faced with the limitation of non-renewable energy sources to meet energy needs in the future. Compared to 2005, energy demand in 2025 is estimated increase 3.5 times for transportation, 4-5 times for industry and 5 times for electricity. The dwindling of reserve energy sources will not be able to fulfil the more increasing community needs. Therefore, we need to consider alternative sources that could substitute non-renewable energy sources. If we look backward, all this time, the community forest use waste wood to meet domestic fuel needs. Even in large-scale, wood waste is used also for the industrial manufacture of roof tiles or bricks as a fuel sources. Lately, the high price and the scarcity of kerosene in the market, encourage people to reuse the firewood for cooking. The conversion of kerosene to LPG does not greeted positively by some people with a variety of reasons, such as the scarcity and the price of LPG is considered to be expensive, therefore increasing the consumption of firewood. On the other side, the potential of large forest certainly capable of producing an abundant wood waste. Wood waste that are generated from forest can occur due to timber harvesting activities. Difinition of waste timber harvesting (logging waste) is a remnant or part of the tree which should be exploited economically, but not utilized because there are several reasons that cause part of the tree is abandones, such as stumps, defect, cracked or broken stems, top free branches and twigs. According to Wahyudi (2000), residual biomass from felling tree of natural forests that have not been utilized are 43.5%, consisting of stump, top free branches, branches and twigs and wood bontos. Basically, wood waste include fuel derived from organic material or biomass material that is renewable and is known as ‖bio-fuel‖. Thus, forest wood waste as a 793 renewable energy source can be one of the alternative materials to substitute energy source that are non-renewable. Wood stump as one of waste timber harvesting is usually found in abandoned logging areas. Logging waste in the forest can reach more than 40%, while the stump is 2% (Anonymous, 2001). As an illustration, if the timber production in Central Kalimantan is 2.5 million m3, the waste that occurs is 1 million m3 and the stump waste that occurs is 20,000 m3. Some people already use stump for crafts feedstocks, especially certain type of valuable art wood stump so it can be sold at high prices, such as teak wood stump. Unutilized stump usually left to rot on its own in the forest areas. This decomposition process takes long enough even for months. During that time, the land can not be used again and can not be planted with tree seedlings. Therefore we need a practical stump cleaning technology with environmental friendly, so the land will be quickly re-planted. According to Matangaran et al. (2000), waste timber harvesting can be processed into several products such as refined products (acids, alcohols, acetone, charcoal and turpentine), chips for particleboard and molded product, pulp and paper product, fiberboard and fuel, while the bark waste can be utilized to filter and mulch. Simplified of wood waste utilization is for firewood, while further processing can be used as charcoal. In conjunction with energy source, charcoal producted can be utilized for the source of electricity energy through a down draft system, which converts thermal energy into electricity energy. Based on Hartoyo and Nurhayati research (1986) in Kelti Pengolahan Kimia dan Energi Hasil Hutan (2000), showed that through the gasification technology, from 50 kg of charcoal can turn on a generator for 7 hours with the electrical load 1:8 KW, 229 Volt of voltage, 2.08 Amper of electric current and calorific gas between 2600=4199 KJ/m3. Furthermore also explained that based on the field test, wood conversion into electricity through gasification system is quite successful because the electricity produced can be used for residential, office and workshop lightning, with 12 KVA for 4 months (540 hours). However, several obstacles encountered, such as the electricity generated is not stable, spare parts such as spark plungs are not available in local market because they have to import from Italy (Pari and Hendra, 1988 in Kelti Pengolahan Kimia dan Pengolahan Energi Hasil Hutan, 2000). The purpose of this study was to obtain information of stump harvesting techniques, environmental impact and chemical properties of the stump in regard to development prospect of stump waste utilization as substitution material for renewable energy sources. Eventually stump waste utilization can have high economic value as one of the alternative renewable energy source so that Indonesia‘s future energy demand can be supported by a forest stump waste. The results are expected to provide stump waste utilization policy as an alternative renewable energy source. 2. MATERIAL AND METHOD 2.1 Research Location The study was conducted on dry land and mangrove forest in the region of West Banyumas KPH, Perhutani Unit I, Central Java. On dry land forest, precisely on BKPH Bokol section 64B, used pine, sengon and teak stump. Menawhile, in the mangrove forest section 57B (Cilacap) used Bruguiera and Avicennia stump. 2.2 Materals and Devices Tools and materials used in this study: wood stump, chemicals, unplugging stump tools (hand puller, rope, chain, tape meter, meter, scales, ganny sacks, stationery). 794 2.3 Procedures a. Creating a sampling plot size 20 m x 20 m per plot cut at the former clear cut areas that has wood stump. b. Measuring and recording the height, diameter, number and type of standing stump in each sampling plot. c. Measuring and recording the amount of land evictions, land clearing and erosion due to the unlugging stump . d. Measuring and recording each observation unplugging stump activity using hand puller power, namely unplugging stump working time (second) and stump volume (kg). e. Working time of unplugging stump was measured by stop watch. f. Recorded each observation time that is wasted due to interference from either the tool or the other. g. Taking stumps samples for chemical properties analysis in the laboratory, namely ethanol content and calorific value. 2.4 Data Analysis Measurement data that have been collected in the field used as the basis calculation to obtain the mean (average). The mean value analyzed and studied further to get the appropriate goals and suggestions. The formulas used are as follows: Wood Stump Volume (standing) : V = 1/4 D2 x H Where: V = Wood Volume (m3); D = Average Diameter of wood (the base and tip) (m); H= Stump height (m) Stump Potency = Number of Stump (ton)/ha Stump Clearing Productivity : V P= T Where: P = Stump Clearing Productivity (m3/hr); V = The Number Of Wood Stump Volume (m3); T = Pruning Branches Time (hr) Calorific Value : Calorific Value (Q) = (Cpkal x dTbb)/weight of sample Where: Cpcal = Calorific Value of The Calibration Standard; dTbb = Delta T of The Appointment of Calorimeters; T = Temperature (oC) Economic feasibility is determined by the method of payback period, net present value (NPV), internal rate of return (IRR) and benefit cost ratio (B/C Ratio) 3. RESULT AND DISCUSSION 3.1 Wood Stump Harvesting Technique Wood stump harvesting technique by way of unplugging stump using hand puller power. It is an invaluable unplugging tool and driven by a human power. Stump types used are pine, sengon and teak stump. Stumps being derived from mangrove are avicennia and bruguiera. Observation on the productivity of unplugging stump is for 5 types of wood (pine, sengon, teak, avicennia and bruguiera). More results can be seen in Table 1. Table 1 contains the productivity of unplugging stump using hand puller power, and Table 2 contains the productivity of unplugging stump manually. 795 Table 1. Productivity of unplugging stump wood using hand puller power Table 2. Productivity of unplugging wood stump manually Average diameter varies depending on the type of wood stump. Pine stump varies between 57-140 cm with stump height ± 15-20 cm above ground. Sengon stump diameter 45-68 cm with stump height 17-20 cm above ground. Pine and sengon stump sample was the stump from former fire that occured in 2009 due to natural factors. Meanwhile, diameter of teak stump varies between 38-63 cm with stump height 12-15 cm. Sample of teak stump that used for this study was ex-thinning stump. The volume of 5 types stump varies between 0.05-0.66 m3 (Table 1). Average stump volume is 0.204 m3. Thus the potency of wood stump per ha as much as 0.24 m3 x 400 ha = 81.77 m3/ha. Mangrove stumps used are bruguiera and avicennia. Mangrove trees that used for this study was planted in 1978. Diameter of bruguiera stump varies between 59-62 cm with stump height 20-25 cm above ground. Diameter of avicennia stump is smaller, between 45-51 cm with average stump height 30 cm. Productivity of mechanically unplugging stump (by hand puller power) varies between 0.091 m3/hr – 3.00 m3/hr. Productivity of manually unplugging stump between 0.31 m3/hr-2.56 m3/hr. Mechanical devices carried by 3-4 people per stump, and manually carried by 1-2 people per stump. The productivity of manually unplugging stump higher than with the help of tools. This is caused by the labor time used to unplugging stump with the help of tools actually a lot more than manually. The high consumption of time is widely used in the stage of tools installation. One reason is because the workers not accustomed in using these tools. However in unplugging sengon stump with the help of tool, time needed to unplug, less than the manual. 796 Table 3. Chemical Properties of Wood Stumps Table 3 shows that the chemical properties (hemicelluloses, lignin and alcohol-benzene solubility) of bruguiera stump higher than the stem but the cellulose content of the stump lower than the stem. Chemical properties (cellulose, hemicelluloses and alcohol benzene solubility) of teak and sengon stump higher than the stem, but the lignin content lower than the stem. Chemical properties (lignin and hemicelluloses) of pine stump higher than the stem, but the cellulose and alcohol-benzene solubility lower than the stem. The results indicate a variation of the chemical properties on the stump and stem. Chemical content of wood have a role in the use of wood as a renewable energy feedstock especially bio ethanol. The higher carbohydrate content (cellulose and hemicelluloses) better used as bio ethanol feedstock because of more bioethanol obtained from the microorganism fermentation (bacteria and fungi). Other chemical component are lignin and extractives. The higher content of lignin and wood extractive, the higher calor would get. Which these properties are very important as energy source especially when the use of wood as a biopellet, charchoal or charchoal briquettes feedstock. The measurement results of other chemical properties (ash content, calorific value, volatile matter and fixed carbon), specific gravity of the stump and avicennia, bruguiera, teak, pine and sengon bark presented in Table 3. In Table 3, it can be seen that the stump ash content generally lower than the bark. But bruguiera, teak and sengon stump ash content higher than the stem. Conversely, calorific value and volatile matter of pine stump higher than the bark except for sengon. Calorific value of the bruguiera, teak and sengon stump lower than the stem, conversely for pine. The calorific value of pine higher than the other type of wood because of pine is a softwood that has resin that is flammable (Bowyer et. al., 2003). Chemical properties such as ash content, calorific value, volatile matter and fixed carbon are useful to provide technical properties of stump as a biomass source into energy feedstock which are potentially as a replacement for fossil fuels. Some alternatives renewable energy such as bio ethanol and bio pellet can be obtained from stump logged. Selection of feedstock for renewable energy include the high calorific value, high content of volatile matter, low ash content, moderate fixed carbon content and overflow feedstock. 797 According to Seng (1964), specific gravity can be devided into three groups, high (≥ 0.7), moderate (0.4-0.6) and low (≤ 0.3). Table 3 shows that Avicennia has a high specific gravity, bruguiera, teak and pine classified moderate and sengon classified low. High specific gravity produce more wood mass so that Avicennia, bruguiera, teak and pine when used as an energy feedstock can get the highest yield. 3.2 Environmental Impact The environmental impact caused by stump unplugging may said to be meaningless because the former stump unplugging always closed. It means the soil that unintentionally extracted out during the stump unplugging process will be use again to fill the hole that caused by the unplugging process. But, to know the size of the hole, measurement were taken with varying results depending on stump size that had been unplugged. The hole has a circle shape (though not completely round) with an average diameter between 75-177.5 cm with a depth 63-140 cm. The depth depends on the length of the root. Meanwhile in the mangrove, the average diameter 16-95 cm with an average depth 76-82 cm. Avicennia stump diameter smaller than bruguiera. It‘s just that it should be noted here that the mangrove stump never been taken/used by the community because it is quite difficult to do so. They only use the stem. 4. CONCLUSION AND RECOMMENDATION 4.1 Conclusion Based on the results and discussions, can be assumed up as follows: - Stump volume used in this study varied between 0.05 to 0.66 m3 with an average 0.204 m3. Thus the potency of wood stump per ha as much as 0.24 m3 x 400 ha = 81.77 m3/ha. - Mechanically and manually productivity of wood stump unplugging varied between 0.091 to 3.00 m3/hr and 0.32 to 1.56 m3/hr. - Based on chemical properties, the stump will be better use as a fuel/ firewood. - The environmental impact caused by stump unplugging may said to be meaningless because the former stump unplugging always closed. It means the soil that unintentionally extracted out during the stump unplugging process will be use again to fill hole that caused by the unplugging process 4.2 Recommendation Forest communities still depend on the existence of forest to meet their needs, especially as a producer of firewood. Therefore, it is necessary to develop the plant that can be used as firewood so it can be used for everything and the safety of the forest still remain. REFERENCES Anonymous (2001): Peluang dan Harapan. www.Kalteng.go.id. Accesed on 1 September 2007. Butarbutar, M (1991): Volume limbah pemanenan kayu dan struktur tegakan sebelum dan sesudah pemanenan dengan sistem silvikultur TPTI di areal HPH PT. Austral Byna Muara Teweh Kalimantan Tengah. Skripsi, Fakultas Kehutanan. Institut Pertanian Bogor. (Unpublished). Budiaman, A (2001): Kualitas dan kemungkinan penggunaan kayu bulat limbah pemanenan. Jurnal Hasil Hutan 14(1):332-41. Pusat Penelitian dan Pengembangan Hasil Hutan.Bogor. Hidayat, A (2000): Penelaahan tingkat efisiensi pemanenan akasia (acacia mangium) pada HTI PT INHUTANI II. Pulau Laut. Kalimantan Selatan. Skripsi. Fakultas Kehutanan. Institut Pertanian Bogor. Unpublished. 798 Kelti Pengelolaan Kimia dan Energi Hasil Hutan (2000): Teknologi Alternatif Pemanfaatan Limbah. Prosiding Lokakarya Penelitian Hasil Hutan. Tema: ‖Peningkatan Efisiensi Pemanfaatan Kayu dan Hasil Hutan Bukan Kayu‖. Pusat Penelitian Hasil Hutan. Muhdi (2001): Studi kerusakan tegakan tinggal akibat pemanenan kayu dengan teknik pemanenan berdampak rendah dan konvensional di hutan alam. Studi Kasus di PT HPH Suka Jaya Makmur, Kalimantan Barat. Thesis Pasca Sarjana Fakultas Kehutanan. Institut Pertanian Bogor. Unpublished. Matangaran, J R, Togar, L T, Tjetjep and U K Yovi (2000): Studi pemanfaatan limbah pembalakan untuk bahan baku industri dalam rangka pengembangan dan pemasaran hasil hutan. Laporan Akhir. Direktorat Pengelolaan Hutan Produksi bekerjasama dengan Fakultas Kehutanan. Institut Pertanian Bogor. Bogor. Unpublished. Puspitasari, D (2005): Limbah pemanenan dan faktor eksploitasi pada pengusahaan HTI (Studi Kasus di HPHTI PT Musi Hutan Persada, Sumatera Selatan). Skripsi. Fakultas Kehutanan. Institut Pertanian Bogor. Unpublished. Rawenda (2004): Kuantifikasi limbah pemanenan kayu pada pengusahaan HTI kayu pulp dengan metode garis transek (line intersect method). Studi kasus di HPHTI PT Inhutani II (Persero), Unit Usaha Kalimantan Selatan, Sub Unit Hutan Tanaman Semaras, Pulau Laut. Skripsi. Fakultas Kehutanan. Institut Pertanian Bogor. Unpublished. Rishadi, H (2004): Potensi limbah pemanenan kayu di HTI Pulp (Studi kasus di Unit IX Wilayah II Benakat, HPHTI PT Musi Hutan Persada, Sumatera Selatan). Skripsi. Fakultas Kehutanan. Institut Pertanian Bogor. Unpublished. Sasmita, R L (2003): Limbah pemanenan hutan alam di Indonesia. Skripsi. Fakultas Kehutanan. Institut Pertanian Bogor. Unpublished. Safitri, R (2005): Kuantifikasi limbah pemanenan pada pengusahaan hutan tanaman industri kayu pertukangan jenis mahoni (switenia macrophylla) dengan metode kayu penuh (whole tree system). Studi kasus di BKPH Gunung Kencana, KPH Banten, Perum Perhutani Unit III Jawa Barat dan Banten. Skripsi. Fakultas Kehutanan. Institut Pertanian Bogor. Unpublished. Tim Konsultan ITTO (2004): Strategi pengembangan industri perkayuan Indonesia yang lestari. Prosiding seminar Strategi pengembangan industri perkayuan Indonesia yang lestari, Jakarta, 7 Desember 2004. Hlm. 18-53. Pusat Penelitian dan Pengembangan Sosial Ekonomi. Bogor. Hariyanto (2008): Kayu bakar, bio-fuel dan kelestarian hutan. www.kabarindonesia.com. Accesed on 27 Februari 2009. Saepudin, A (2009): Kontribusi KPH Banyuwangi Utara dalam Konversi Minyak Tanah. www.kphbanyuwangi utara.com. Accesed on 27 Februari 2009. Wahyudi (2000): Biomassa Hutan Potensi yang Belum Termanfaatkan. Prosiding Konversi: Lingkungan Melalui Efisiensi Pemanfaatan Biomassa Hutan. Fakultas Kehutanan Universitas Gadjah Mada. Yogyakarta. APPENDICES 799 Figure 1: Hand puller power Figure 2: Process of unplugging stump Figure 3: Unplugging stump Figure 4: Manually unplugging stump Figure 5: Manually unplugging stump Figure 6: Hand puller power for unplugging stump INAFOR 11P-014 800 INTERNATIONAL CONFERENCE OF INDONESIAN FORESTRY RESEARCHERS (INAFOR) Agroforestry Forest Estate: Whole Rotation of Social Forestry Triyono Puspitojati Forestry Research Institute of Ciamis Jl. Raya Ciamis-Banjar Km. 4, Ciamis, 46201, INDONESIA Poster paper prepared for The First International Conference of Indonesian Forestry Researchers (INAFOR) Bogor, 5 – 7 December 2011 INAFOR SECRETARIAT Sub Division of Dissemination, Publication and Library FORESTRY RESEARCH AND DEVELOPMENT AGENCY Jl. Gunung Batu 5, Bogor 16610 Agroforestry Forest Estate: Whole Rotation of Social Forestry Triyono Puspitojati Forestry Research Institute of Ciamis Jl. Raya Ciamis-Banjar Km. 4, Ciamis, 46201, INDONESIA 801 ABSTRACT Agroforestry was viewed as a sector that differs from those of agricultural and forestry sectors, as a part of agricultural production system, or as a part of social forestry programme. The objectives of this study were (a) to analysed the rationality of agroforestry as a forest estate and (b) its role in supporting social forestry programme. Definitions of agroforestry, forest and forest product were used as tools to analyse (a), while agroforestry practiced both by forest concesions in production forest and by rural people in community forest were used to value (b). The results were as follows. First, tree based agroforestry had characteristics of forest, or can be classified as a (agroforestry) forest estate. Second, agroforestry forest estate provided income annually for rural people, or it supported social forestry programme for whole of its rotation. Therefore, it was better view tree based agroforestry as a forest estate than merely as a part of social forestry programmes. Keywords: Agroforestry, forest estate, social forestry, whole rotation 1. INTRODUCTION Since 1970‘s, forest management system in Java had been changed from timber management which priority was sustainable timber production to forest resource based management which priorities was sustainable forest for firm and rural people. The old system was not suitable to manage forest sustainably since it was not able to provide jobs needed by rural people who generally poor or landless. This stimulated rural people to do forest disturbance. The new system which was conducted based on social forestry approach was implemented through many programmes: Prosperity approach (1971–1982), Forest village community development (1982–1985), Social forestry (1985–1995), Forest village community empowerment (1995–2000) and Community Based Forest Management (2000–present). However, forest disturbances were still going on since production forest managed for timber production provided limited jobs in forest area. Moreover, efforts to create jobs outside forest area were not conducted properly since they were so costly. According to stakeholders of production forest, the problem could be solved by managing production forest for wood and NWFP products, or through whole rotation agroforestry (Puspitojati, 2008). The implementation of agroforestry in production forest had been proved to be success in minimizing forest disturbance and increasing jobs for rural people (Ediningtyas, 2007; Rachmawati, 2008). However, the implementation of agroforestry in production forest was still limited since agroforestry was viewed differently: merely as a part of social forestry programmes (MoF Decree P.01/2007), as a part of agricultural system (FAO, 2000), or even as a sector that differs from those of agricultural and forestry sectors (Hairiah et al, 2003). This study was conducted because of the problems. The aim of the study were to discuss the similarities and diffrerences characteristics between agroforestry and forest estate and the implementation of agroforestry to support social forestry programme in production forest and community forest. The objectives of the study were (a) to analysed the rationality of agroforestry as a forest estate and (b) its role in supporting social forestry programme. 802 2. METODOLOGY 2.1 Data Collection This study was conducted based on desk study. Data collected were secondary data related to definitions of forest, forest estate, forest product, agroforestry and social forestry; social forestry practice in production forest and community forest; and related references. 2.2 Analysis 2.2.1 Rationality of Agroforestry as a Forest Estate Rationality of agroforestry as a forest estate was analysed through two steps: (a) evaluate the similarities and differences characteristics between polyculture forest estate and agroforestry and (b) evaluate the support of Ministry of Forestry (MoF) in the development of agroforestry. Agroforestry was viewed as a forest estate if (a) agroforestry has similar characteristics with polyculture forest estate and (b) MoF support the development of agroforestry. 2.2.2 The Role of Agroforestry in Supporting Social Forestry The roles of agroforestry in supporting social forestry were valued based on its ability in (a) increasing jobs for rural people and (b) minimizing forest disturbance. Moreover, agroforestry was valued to support social forestry for the whole of its rotation if its roles go on continuously. 3. RESULT AND DISCUSSION 3.1 The Rationality of Agroforestry as a Forest Estate The rationality of agroforestry as a forest estate was analysed by comparing the characteristics of polyculture forest estate and the characteristics of agroforestry. Agroforestry would be viewed as a forest estate if it has similar characteristics with those of polyculture forest estate. 3.1.1 Characteristics of Forest Estate Characteristics of forest estate were identified by interpretating the definitions of forest and forest products. The characteristics identified were forest plants, forest products and type of forest estate. Non wood forest products There are many definitions of NWFPs. Two definitions of NWFPs showing the different opinion among experts are as follows. Definition 1. Non Wood Forest Products consist of biological origin other than wood, derived from forest, other wood lands and trees outside forest (FAO, 1999). Definition 2. Non Wood Forest Products (NWFPs) are biological forest products both flora and fauna, with their derivatives and cultivation, except wood, obtained from forest (MoF Decree P.35/2007). Definition 1 shows NWFPs as products of biological origin. This provides small chance to cultivate NWFP‘s plants in forest (Puspitojati, 2011). If this were used as a guideline to develop forest estate, most production forests would be managed for wood production. Definition 2 shows NWFPs can be both as products of biological origin and products of cultivation. This provide a lot of chance to cultivate NWFP plants in forest, or forest estate could be managed for wood production, NWFP or variety of forest products (Puspitojati, 2011). The second definition would be used to determined the characteristics of forest estate. 803 3.1.2 Forest Estate There were many of forest definitions. Some of them were as follows. Definition 1. Forest is a united land ecosystem consisting of biological nature resources with dominated by trees in allied with nature environment, in wich they conneted each other (Laws 41/1999) Definition 2. Private forest is a forest in a private land with area of more than 0,25 ha and tree and other plants crown cover of more than 50% (MoF Decree 88/2003). Definition 3. Forest for the clean development mechanism is an area of land of more than 0,25 ha with tree crown cover of more than 30% and the trees capable to reach minimum height of 5 m at maturity in situ (MoF Decree P.14/2004). Definition 4. Forest is a land with tree crown cover of more than 10% and an area of more than 0,5 ha, with trees capable to reach minimum height of 5 m at maturity in situ (FAO, 2000). Those definitions shows the feature of forest as follows. Definition 1 described forest as an area of land consisting a variety of plants dominated by trees in which they interact each others. Definitions 2, 3 dan 4 described forest based on parameter of minimum area and minimum percent crown cover, which were subsequently 0,25 ha and 50%, 0,25 ha and 30%, and 0,5 ha and 10%. Based on these definitions, it could be stated that forest had variety of plants dominated by trees and could produce a variety of products. Moreover, based on those definition, forest estate was defined as follows. Table 1. Characteristics of Forest Estate Items A.Plants of forest estate B.Forest Estate 1.Monoculture 2. Mixed (tree and tree) 3. Polyculture (tree and other plants) C. Products of forest estate (wood and NWFP) Description Tree, shrub, palm, bamboo, seasonal crops 1. Forest stands established by planting or/and by seeding in the process of afforestation and reforestation, with trees crown cover of more than 40% and tree height of more than 5 m. 2. planting space maksimum: 4mX4m for crown diameter trees of 3 m, or 11m X11m for crown diameter trees of 8 m. 1. forest estate for a kind of wood product 2. forest estate for a kind of non wood tree product 1. forest estate for two or more kinds of wood products 2. forest estate for two or more kinds of non wood tree products 1. Polyculture forest estate is a forest estate that combines woody forest plants with woody perennial plants, or with other plants‘ species 2. forest estate for variety of wood and non wood products 1. Biological forest products both flora and fauna, with their derivatives and cultivation obtained from forest. 2. Products of tree (wood and non wood), shrubs, palm, bamboo and seasonal crops (and animal). 804 Source of information Law 41/1999; MoF Decree P.35/2007 FAO (1999); Law 41/1999; MoF Decree 88/2003 and P.14/2004; Puspitojati (2011) MoF Decree 341/2004 and P.36/2008 MoF Decree 341/2004; 187/1996;101/1998 and P.36/2008 MoF Decree 101/1998 and P.62/2011 Law 41/1999; MoF Decree P.35/2007 Forest estate is an area of more than 0,25 ha with tree crown cover of more than 40% and the trees capable to reach a minimum height of 5 m at maturity. The new definition had consequencies: (a) all land of more than 0,25 ha with tree crown cover of more than 40% can be classified as forest, all plants in the area can be viewed as a forest plant and all products obtained form the area can be viewed as a forest product. In other word, forest estate can produce wood, NWFP, or combination of wood and NWFP. Based on the definitions of forest estate and forest products 2 above, characteristics of forest estate and polyculture forest estate were identified. The results were shown in Table 1 and 2. 3.2 Characteristics of Agroforestry Up to now, there was no agreement among experts about the definition of agroforestry, as follows. Definition 1. Agroforestry is natural resources management system which is ecologically dynamic with planting trees in agricultural land or grazing area to obtain variety of products sustainably for all user land (Huxley, 1999 In Hairiah et al., 2003). Definition 2. Agroforestry is land management system with sustainable basis which in general increases land productivity combining plant production including tree plants and forest plants and/or animal in accordance or in series in the same unit of land matching with local culture (MoF Decree 7/2007) Definition 3. Agroforestry is land use system which combine woody plants (tree, shrubs, bamboo, rattan and others) with non woody plants or pasture, sometimes with livestock or other animal (bee, fish) so that forming ecology and economic interaction among woody plant with the other components (Huxley, 1999 In Hairiah et al., 2003). Definition 1 described agroforestry as an agricultural cultivation (planting trees in agricultural land). This matched with FAO explanation in which agroforestry was included as a part of an agricultural production system (Anonym, 2006). However, FAO also did not mind with the opinion which included agroforest as a forest (Retnowati, 2003). Definition 2 described agroforestry as a forest estate. Those definition only mentioned terms attributed to forest estate (sustainable, tree and forest plants) but not mentioned terms attributed to agriculture. This definition matched with Hairiah et al. (2003) which classified agroforestry as a made forest (part of forest estate). However, Hairiah et al. (2003) preffered agroforestry as a land use system which separated with those of agriculture and forestry if there were agroforestry sector. Moreover, definition 3 did not describe whether agroforestry was part of agricultural cultivation or forest estate, but it described agroforestry consisting woody and non woody plants. According to Sinclair (1999), those definition was not accurate since not all agroforestry consisted of woody and non woody plant, but could consist of shrubs woody plant (high < 5 m) such as cacao, coffee and tea with tree woody plant (high >5 m). Although there were a lot opinion of agroforestry, experts seem to be agree with Landgren and Raintree (1982) In Hairiah et al. (2003) which mentioned that definition of agroforestry must have two main characteristics: (a) combination of plants in agroforestry should be have clear purpose and (b) there were ecology and economic interaction among the plants, or agroforestry must have 6 characteristics, as follows: - Agroforesty consists of two or more plants (and animal), at least one of them is parennial woody plant. - Agroforestry has two or more products, for example fruit and fuel wood. - Cycle of agroforestry is more than one year. - At least woody plant produces one environmental service, such as wind break. - There are economic and ecological interaction among plants. - Agroforestry is more complex than monoculture. 805 - Crown cover of agroforestry is more than 10% (WAC, 2011) 3.3 Agroforestry as a Forest Estate Agroforestry can viewed as a forest estate if : (a) agroforestry had similar characteristics with those of polyculture forest estate and (b) the development of agroforestry was supported by Ministry of Forestry. 3.3.1 Similarity of Agroforestry and Polyculture Forest Estate The similarities and differences characteristics between polyculture forest estate and agroforestry was shown by the characteristics of the two, as shown in Table 2. Table 2. Characteristics of polyculture forest estate and agroforestry Characteristics of Polyculture Forest Estate Consisting of two or more plants (and animal), at least one of them is ‗tree‘. Having two or more wood products Medium/Long rotation Producing environmental service There are economic and ecological interaction among plants Polycultur is more complex than monoculture Crown cover of polycultur is more than 40% Source: * Landgren dan Raintree (1982); **WAC (2011) Characteristics of Agroforestry* Consisting of two or more plants (and animal), at least one of them is parennial woody plant. Having two or more products Cycle of agroforestry is more than one year At least one of woody plant produces one kind of environmental service, such as wind break and shade There are economic and ecological interaction among plants Agroforestry is more complex than monoculture Crown cover of agroforestry is more than 10%** The similarities characteristics between the two were in characteristics 2 to 6, while the differences were in characteristics 1 and 7. The characteristic 1 between the two was difference since not all woody plants, such as coconut tree, could be viewed as forest plant, while the characteristic 7 was difference since forest estate had crown cover of more than 40%. In general, it could be stated that some agroforestry had characteristics of polyculture forest estate. However, agroforestry with crown cover of 10% - 40% and consisting of non ‗tree‘ plants could not be viewed as forest estate. This agroforestry could be viewed as agricultural agroforestry. Meanwhile, agroforestry with tree crown cover of more than 40% could be viewed as agroforestry forest estate. In short, tree based agroforestry could be viewed as a forest estate. 3.3.2 MoF Support in The Development of Agroforestry MoF had been supported the development of agroforestry since 1970‘s through various social forestry programmes, such as: community empowerment in production forest management, community forestry and rehabilitation of degraded lands. In those programmes, agroforestry was viewed as an activity to increase both the welfare of rural people and the succed of the programmes. The formal support in the development of agroforestry as a forest estate was provided by MoF through MoF Decree P.28/2011 Regarding The Institution of Agroforestry Research Center. The Institution, whose office is in Ciamis, had a mandate to conduct research on agroforestry, with the vision: become a national reference institution in science and technology of agroforestry in Indonesia. This indicated that MoF, implicitly, had been viewed agroforestry as a forest estate. 3.4 The Roles of Agroforestry in Supporting Social Forestry Social forestry is a forest management system which provided chances for rural people as a manager of forest management or as a partner of forest concession in managing forest. The objectives of social forestry are to increase rural people welfare and to realized sustainable forest management (MoF Decree P.01/2004). 806 The implementation of social forestry programme through agroforestry in production forest managed mainly for wood production would run well for the first few years. In this case, agroforestry was usually conducted only for 2–3 years, or before crown cover of trees closed each other. Meanwhile, in agroforestry forest estate, social forestry programme would run well for the whole rotation of forest management. In Agroforestry forest estate, tree planting was arranged wide so non tree plants could be grown for the whole rotation of foret management. In Forest District of Bandung Selatan, some forest area was managed for wood and coffee. Coffee plants with planting space of 2 m x 2.5 m were planted with Eucalypt having planting space of 4 m X 4 m. Coffee plants was productive when they were 3 – 20 year old. Coffee production provided net benefit ± Rp 6,000,000,- /ha/year, in which 90% was for rural people and 10% was for forest concesion. This had been able to reduce forest encroachment 1938 ha, from 2.673 ha in 2003 to 735 ha in 2006 (Ediningtyas, 2007). In Forest District of Sumedang, some forest area was managed for wood and vanilla. Vanilla plants with planting space of 2 m X 3 m were planted under 15 year old stand pine having space of 10 m X 5 m. Vanilla plants was productive when they were 3–10 year old. Vanilla production provided net benefit ±Rp 30,000,000,- /ha/year, in which 42,5% was for rural people, 42,5% was for forest concesion and 15% was for management fee. This had been able to eliminate illegal logging and forest encroachment (Rachmawati, 2008). 4. CONCLUSION 1. Tree based agroforestry had characteristics of forest, or can be classified as a (agroforestry) forest estate. 2. Agroforestry forest estate supported social forestry programme for whole of its rotation. It provided annual income for rural people and minimized illegal logging and forest encroachment. 3. It was suggested that tree based agroforestry was better view as a forest estate than merely as a part of social forestry programmes. REFERENCES Anonymous (2006): Defitional Issues Related to Reducing Emmission from Deforestation in Developing Countries (Draft for Discussion and Comment). Paper Persented on Workshop on Reducing Emissions from Deforestation in Developing Countries held at FAO in Rome, 30 August to 1 September. Departemen Kehutanan (2004): Peraturan Menteri Kehutanan Nomor P.14/Menhut-II/2004 Tentang Tata Cara Aforestasi dan Reforestasi Dalam Kerangka Mekanisme Pembangunan Bersih. Departemen Kehutanan (2007): Peraturan Menteri Kehutanan Nomor P.35/Menhut-II/2007 Tentang Hasil Hutan Bukan Kayu. Departemen Kehutanan (2008): Peraturan Menteri Kehutanan Nomor P.36/Menhut-II/2008 Tentang Izin Usaha Pemanfaatan Hasil Hutan Bukan Kayu Dalam Hutan Alam (IUPHHBKHA) atau Dalam Hutan Tanaman (IUPHHBK-HT). Departemen Kehutanan (2009): Peraturan Menteri Kehutanan Nomor P.21/Menhut-II/2009 Tentang Kriteria dan Indikator Penetapan Jenis Hasil Hutan Bukan Kayu Unggulan. Ediningtyas, D (2007): Kemandirian Masyarakat Desa Sekotar Hutan Dalam Melakukan Usaha Agroforestri: Studi Kasus Usaha Agroforestri Tanaman Kopi di BKPH Pangalengan, KPH 807 Bandung Selatan, Perum Perhutani Unit III Jawa barat dan Banten. Thesis (Unpublished). Sekolah Pascasarjana IPB, Bogor. Pemerintah RI (1999): Undang-Undang Nomor 41 Tahun 1999 Tentang Kehutanan. Rachmawati, E (2008): Kemitraan Antara Perum Perhutani Dengan Petani Vanili Dalam Upaya Meningkatkan Pendapatan Petani: Studi Kasus Pengelolaan Sumberdaya Hutan Bersama Masyarakat di Desa Padasari, Kecamatan Cimalaka, kabupaten Sumedang. Thesis (Unpublished). Sekolah Pascasarjana IPB, Bogor. Retnowati, E (2003): Sustainable Development Through A Complex Agroforestry System in Indonesia. The XII World Forestry Congress. Quebec City, Canada. Sinclair, F L (1999): A General Classification of Agroforestry Practice. Agroforestry System 46: 46-180. Kluwer Academic, Netherlands. Hairiah, K, M A Sardjono and S Sabarnudin (2003): Pengantar Agroforestry. World Agroforestry Centre. Bogor. Puspitojati, T (2011): Persoalan Definisi Hutan dan Hasil Hutan Bukan Kayu (HHBK) dalam Hubungannya Dengan Pengembangan HHBK melalui Hutan tanaman. A Paper (Not yet published) Puspitojati, T (2008): Preferensi Pemangku Kepentingan Dalam Pengelolaan Hutan Produksi: Studi Kasus Pengelolaan Hutan Produksi di KPH Bogor. Disertation (not published). Sekolah Pascasarjana IPB, Bogor. 808 INAFOR 11P-015 INTERNATIONAL CONFERENCE OF INDONESIAN FORESTRY RESEARCHERS (INAFOR) The Use of Natural Dye Plants in East Nusa Tenggara Siswadi, Dani S. Hadi and Soenarno Forestry Research Institute of Kupang Jl. Untung Surapati 7B, Kupang, 85115, INDONESIA Corresponding email: [email protected] Poster paper prepared for The First International Conference of Indonesian Forestry Researchers (INAFOR) Bogor, 5 – 7 December 2011 INAFOR SECRETARIAT Sub Division of Dissemination, Publication and Library FORESTRY RESEARCH AND DEVELOPMENT AGENCY Jl. Gunung Batu 5, Bogor 16610 809 The Use of Natural Dye Plants in East Nusa Tenggara Siswadi, Dani S. Hadi and Soenarno Forestry Research Institute of Kupang Jl. Untung Surapati 7B, Kupang, 85115, INDONESIA Corresponding email: [email protected] ABSTRACT Traditional fabric has historical and cultural value among East Nusa Tenggara (ENT) community livelihood. That can be seen by the uses of traditional clothes as uniform on civil servant and as important matter on traditional procession. The uses of plant as dye source still carry out by some waver group. Research on natural dye is important to support traditional waver. The research starts with identification plant species, measure density of dye plants and its spread. Etnobotanical study exploration, and vegetation analysis method was used. The result showed that There are tree species of plant that act as main ingredients which are Nila (Indigofera sp.) as blue to black color source, Mengkudu (Morinda sp.) as orange to red color source, and Loba (Symplocos sp.) as mordant source. Three species of that plant fund widespread almost in ENT region except for Loba. Loba fund only in Sumba and Flores region with trees density 15,33 tree/ha. Morinda was fund with trees density 19.67 tree/ha. While Indigofera fund almost everywhere with trees density 1000 tree/ha. The process of making fabric woven from yarn spinning to finishing takes 2-6 months, so that reasonable if the price in the local market average of 2 million rupiahs apiece, even commercially abroad and at the island of Bali prices reached 3.5 million to 6 million rupiahs/sheets. As for the needs to be pursued at the moment is to guide weaving made from natural and find solutions to the market so indirectly will help improve the welfare of the community. Keywords: Traditional fabric, natural dyes, trees density 1. INTRODUCTION East Nusa Tenggara (NTT) is an island province which has a rich variety of vegetation types typical of semi-dry climate and the potential to be developed to encourage an increase in regional income areas. Based on NTT Provincial Forestry Office report (2007), on the island of Timor there are no less 544 types of vegetation and trees and shrubs there are 29 types of nontimber forest products that includes the fruit, seeds, gums, essential oils, scented wood, honey, shellac products to medicinal plants and natural dyes. During this Kupang Forestry Research Institute has found 14 species of plants producing dyes from the area of East Sumba, Ende, and South Central Timor. Data distribution of the dyeproducing plants previously demonstrated in the three counties, four species found in East Sumba has Mengkudu, Indigo, Yellow Wood and Soga. 10 species in Ende, among others: Mengkudu, Nila, Lo'ba, Wood yellow, Maketaki, Areca nut, Ketapang, Salombo, candle nut, and pacar tree while at TTU there are 5 types, namely, Noni, Nila, Arbila, Kesambi, and Nobah. Dye above are divided into two groups seen in its usefulness. First is the group of basic dyes are producing mengkudu roots of red, yellow wood-producing skin yellow, and blue color-producing leaves Nila. Process compounding basic color components will produce different colors, including green and black. The second group is in addition to the above types of reinforcing material/color support (Handoko et al., 2004). The existence of the community fabric production unit ENT is the fact. Statistics of East Sumba in 2001 showed there were approximately 3013 units of forbic production, while 810 according to Statistics of TTU there were 357 units in 2003 and Statistics of Ende noted there were 9375 units. Given the magnitude of the potential of existing natural resources, it would require excavation potential flagship species of local plants to be able to provide alternative livelihoods for the community. The purpose of this research is to conduct a study botany study, the identification and inventory of the potential and use of various types of natural dye-producing plants in East Nusa Tenggara. Objectives of this study was obtained data and information on the types of dyeproducing plants include aspects of botany study, plant species, distribution, potential. 2. METHODOLOGY 2.1 Study Botany Study Extracting information about the type, used parts, and plant utilization by the community in an area done by way of structured interviews (with guide) and an open questionnaire. Respondents consisted of indigenous shamans and artisans/weavers of cloth and fabric sales dealer. 2.2 Exploration Estimation of potential and distribution of flora producing dyes using census and sampling methods (plot measurement). Census method used to determine the potential for other types of dye-producing plants outside the forest area and its potential is limited then made a point of recording the coordinate distribution of flora. While the sampling method used when the flora is identified in the area of forest area or if the potential distribution in the wild is estimated to spread evenly. The broad swath of each measure to the growth rate is as follows: - Seedlings is from germination to high 1.5 m Measuring Permanent Plots (MPP) 2x2m - Saplings is regeneration growth rate that reached a high of 1.5 meters with a trunk diameter of less than 10 cm MPP 5x5 m - Poles is rate of growth of young trees with a trunk diameter measuring between 10-19 cm (dbh) with MPP 10 x 10 m - Trees is level of trees with stem diameters above 20 cm dbh. 2.3 Data Analysis Qualitative data from botany study survey described in descriptive analysis, such as how to use and the parts used parts, etc. The use of dose. Vegetation data have been collected and then analyzed to determine the density of the type, relative density, dominance type, relative dominance, frequency type, relative frequency and importance value index. Vegetation data analysis results are discussed to conclude the status of the availability and characteristics of these plants in nature. 3. RESULT AND DISCUSSION 3.1 Botany Study and Potential The study botany study in the field is to gather information related to the dye-producing plant species commonly used by people either past or the type that are still used. As for the types of plants that get by district and parts used are presented in Table 1. 811 Tabel 1. Type and utilization of plants as natural dyes. Site (District) Species Used Part Color resulting Rote Ndao (S10 53.492 E122 49.297) Indigofera Morinda Tamarin Leaf Root Root and seed Orchid Stem and leaf Turmeric Indigofera Morinda Sterculia Indigofera Morinda Kashew Menggo Kenila Cactus Yello wood Sesbania Rumpang Leaf Root/root bark Shell Leaf Root/root bark Stem bark Leaf Stem bark Fruit Stem Leaf Black, green red Scarlet/ yern fasteners Adhesive and yern cleaning Yello Bleck, green Red Mordan black color Black, green Red Brown Green/black Brown Red Yello green Sabu Raijua (S10 30.019 E121 50.306) Larantuka (S8 17.441 E122 58.363) Density (per ha) 433.3 5.32 1.25 366.7 20 13.75 66.7 33.69 36 2.5 4 700 20.62 3 This type of cloth dye plants can be grouped into the main material, and material anointment mordan / amplifier, where the types of materials used to assist the process of mordanting usually contain salt, chromium hydroxide, aluminum or tin. The division of the resulting material is classified into two that is eternal and temporary/can wear off. 3.2 Utilization of Plant Material as a Natural Dyes Different types of plants usually have one part used as a source of natural dyes. As illustrated in table 1 above, parts of which can be utilized as a source of dyes in the form of leaves, bark (pepagan), fruits, stems and roots. 3.2.1 Nila Plants Nila (Indigofera tinctoria) is often known by other names Tauk (Rote) Taum (Timor, Flores), Tarum (Sunda) tom (Java) Noba (Sabu). This plant is included in the tribe of legumes or Fabaceae) is a plant producing blue / black natural. The use of clothing dyes is mainly done in the manufacture of woven rope in some districts in ENT. Tarum used for producing blue / black, indigo blue color is obtained from the marinade leaves (in quantity) for one night or more. After overnight will form a layer on top of a green or blue. Each region has different ways and methods in use and gathering of these plants to produce the desired color. On the island of Rote and Sabu to make this plant to produce the color black / blue is by soaking the leaves for 3 days and then crushed to pieces. From leaves that had been destroyed along this water will be generated which is then precipitated in the form of pasta pasta is utilized to perform soaking yarn by adding new water and whiting (oxide) for one night then wind dried for 1 day. To produce a blue color is usually soaking and draining as the above step is usually performed only dive 3 times and to be able to produce the black color is usually soaked up to 5-8 times. While people in Larantuka (East Flores) did not do that to produce pasta soaking but soaking the leaves will be done in order to produce a solution of indigo, black and of course this solution can directly be used to make yarn immersion by adding whiting by about 1 tablespoon per 5 liters of water. 812 3.2.2 Mengkudu Morinda (Morinda citrifolia L.) kelurik: Floreses, morinda Javanese: pace, kemudu, kudu. Sundanese language; cengkudu : Maduraese kodhuk. Balinese language: wengkudu) is a plant that originated from Southeast Asia. This plant grows in the lowlands to the altitude of 1,500 meters above sea permuakaan. Addition has been used as a medicinal plant, Mengkudu can also dimanfatkan also used as a dye used to give color to the fabric weaving, batik or woven from pandanus. Morinda root bark can be used as a colorant because it contains compounds that provide morindon Morindin and red and yellow. Use of material in the form of root bark for making cloth colored red or brown. Making process is also similar to that in other colors. However, the weavers usually know which ones measure used to determine the composition of color. Society typically uses noni comparison between the skin which has become a powder with a ratio of 1: 4, in which every 1 kg of Noni can be used to color the 4 kg of yarn. 3.2.3 Yellow Wood Yellow Wood (Cudrania conchinchinensis) scattered at an altitude of 100-1800 above the mean sea level (AMSL), and gather in certain locations or near sources of water. While handling a dyes is with the use of roots and stems by cutting the roots and stems. Roots and stems that have been cut and then boiled ± 2 hours / until the resulting solution was yellow, then let it cool. To do is to do a yarn dyeing yarn soaking in a solution of distillate boiling solution of the yellow wood that has been filtered and warmed again. Soaking time required for one night to produce a yellow color, while for better results can be repeated until the desired color is formed. The trees not cultivated because its growth is very slow and its utilization as natural dyes in batik / weaving is rarely even is not used anymore. 3.2.4 Cashew Cashew (Anacardium occidentale L.) commonly cultivated to take the beans, cashew Cashew trees can also be used as firewood or as low-quality building materials. This tree has also been widely planted in the garden as shade trees or plants as well as rehabilitation of marginal land. The bark of cashew tree can be used for tanning and gives a dark brown color. Cashew commonly found in East Flores Regency, where the goal is to fill cultifation sleep and less productive land or gardens residents. To use natural dyes derived from the bark of this tree is very little because according to the information society, the resulting material is not very resistant to faded and irradiation when compared with the use of mengkudu. For the process of its utilization is by boiling bark materials as much as 3/4 pot on a fully charged water for 2 hours over medium heat. Wait until warm and lift the existing timber, then enter the material of thread that will color for one night and drain. Residual water can be reused until the appropriate color as desired sharpness. 3.2.5 Knila Knila (Peltophorum inerme (Roxb.) in Larantuka (Adonara) called Laru trees, in Sabu Raijua and people of Timor island is also called the wood with Laru trees. Besides the above functions the wood bark can be used as a dyes that will produce the color orange. Here is the wood that has been used as Laru trees dyes by people in Adonara Island East Flores district. in the world of natural dyes for this piece of wood bark Laru trees in use as a producer of tanning substances, which are commonly used as Ubar (dye) nets . the colors can be produced by this the plant is brownish red or orange. On the island of Sabu the plant is also known by the name Laru trees, where the bark used as a mixture to strengthen the green or black color that is mixed together with the leaf indigofera. In Larantuka bark also used as a fabric dye which will produce a red/orange, which distinguishes its function with the use on the island of Sabu is situated on the 813 intended use. as the main raw material, in Larantuka laru trees bark used in a way to boil for 2 hours then allowed to stand for 1 night. the next step is to separate the water in the skin by filtered, filtered water is then used as material to soak the cotton yarn which has been prepared. The results of estimation are performed using a pan in diameter 40 cm and height 60 cm weavers use to boil the bark weighing 8kg, with as many as 8 lieter filled with water, after boiling for 2 hours to spare ± 3.5 liters of water. With 3.5 liters of water can be used to soak the yarn weighing 1.7 kg, soaked for 1 night. Soaking can be done 2-4 times to produce the desired color. While the rest of the bark can be boiled first boiling it back up to a maximum of 4 times. 3.2.6 Turmeric Turmeric (Curcuma longa Linn. Syn. Curcuma domestic Val.) Tuber roots older than one year is used as a substitute bright yellow color. Parts to be used should be selected sections of old and hard, resulting in optimal color. Information obtained when using a forced hiatus material that is still young so the resulting color will fade quickly and easily fade. 3.2.7 Turi Turi (Sesbania grandiflora syn.) Is a small tree (height reaches 10m). Local names in Indonesian include turi (Javanese), Scientific Classification: Kingdom Plantae Division Magnoliophyta, class Magnoliopsida, Order Fabales, Fabaceae Family, Nation Robinieae, Genus Sesbania. Part of the turi used as dyes is a leaf, which will produce a light green color. The results of studies conducted in Larantuka botany study is an innovation/or experiment conducted by a weaver, known as Mrs. Bota. There are special from the experiments performed in used turi ie if most of the utilization of a particular plant parts are supported by the use of other types, but at the leaf turi not mixed with any kind so that the resulting color is very young green or almost whitish. 3.3 The Process of Making Black How to process the leaves tauk/which will produce natural colors made by the community Ndao Rote and Sabu Larantuka and Sikka district have in common but the community in Flores prefers to thread in Indigofera soaking that has been oxidized by immersion for 3-5 days directly. First leaf separated tauk leaves and stems then immersed into ordinary water with a ratio of 1:8 (1 kg of indigo soaked in 8 liters of water) for 3-5 days with plain water in the bucket/barrel, after that squeeze/shake until frothy, remove leaves from the bucket, and the solution is ready for use as an ingredient of immersion. Prior to immersion-spun yarn, water present in the mix with lime and ash as much as each 1 tablespoon/handheld. The next process is carried out is to soak the spun yarn into the water together for 3 days. To get a good black color, proceed as above until 5 times, where the distance between the immersion done draining until the yarn in the dry state. So that staining could be more durable and does not fade due to washing or drying process, usually weavers in Rote Ndao using sand mud around the lake or reservoir sites. Sludge containing high iron levels. Usually the sludge is taken and mixed with some kind of fabric together with a choice of colors. After being mixed and stirred, with the condition of the cloth in the mud soaking is left overnight. Besides durable, the use of mud to sand is also produced visible color so bright and strong motifs depicted on the cloth clearly visible as well. 3.4 The Process of Making Green The green color can be generated from the process of Soaking the plant materials like leaves Taum / indigo. As for the manufacturing process similar to the process of making black but if the black color made in generating immersion served until 5 times then to produce a green color only takes 2-3 times of immersion. Any thread that has been soaked in drying is not done directly under the blazing sun, but the best is by the dry wind the string. There are several things 814 that affect the absorption of the color of the yarn are the type of yarn used and the viscosity of the solution used. Water used for the same amount of green staining by immersion using the color green which is 1:8. The image of indigo soaking is ready for use are as follows. 1a 1b 1c Figure 1: a. The results of the indigo soaking is ready for use; b. The thread that is ready to be soaked with a solution of indigo; c. Immersion results indigo yarn Difficulties encountered during soaking and draining is less strong rope or raffia leaves so that the solution Tarum gebang into yarn ties. Result of the the inclusion colored water into the bond would cause the pattern to be in the form of a broken and irregular which will lead to lower prices when marketing. 3.5 The Process of Making Red In the process of making red, at Sikka and East Flores Regency materials used is similar to the process undertaken by the islands of Rote and Sabu, Rote and Sabu if the people do pulverization root of Morinda citrifolia roots that is cleaned, crushed, boiled until boiling, after this process will produce a red solution. However, people in Larantuka and Maumere not using Noni roots will directly but uses skin from Morinda roots. To form the desired pattern, prepare a yarn that will be given a red color and soak in the solution for three days, after which it will be removed spun yarn spun yarns produced originally white will become red. Here is a picture of the roots of Morinda citrifolia and Laru trees skin and thread the immersion. 815 a b c d Figure 2: a. The Roots of Morinda; b. Powdered root of Morinda skin; c. Immersion of the roots of Morinda threads; d. Yarn stretching Morinda root immersion results The use of materials such as roots to make a red or brown colored fabric. Making process is also similar to that in other colors. However, the weavers usually know which ones measure used to determine the composition of color. Society typically uses Morinda comparison between the skin which has become a powder with a ratio of 1: 4, in which every 1 kg of Morinda can be used to color the 4 kg of yarn. While the use of open-mouthed as an ingredient in red mordanting with a ratio of 1: 40, where every 1kg of skin/greedy leaves can be used to mix as much as 40 kg of yarn. 3.6 The Process of Making Orange/Brown In the world of natural dyes for these plants that can produce color brown / orange is the Laru wood bark and a few relatives Legumenosaceae in use as a producer of tanning substances, which are commonly used as Ubar (dye) nets. The colors can be generated by this the plant is brownish red or orange. As the main raw material, in Larantuka Lru trees used in a way to boil for 2 hours then allowed to stand for 1 night. The next step is to separate the water with the skin to by filtered, filtered water is then used as material to soak the cotton yarn which has been prepared. The results of estimation are performed using a pan in diameter 40 cm and height 60 cm weavers use to boil the bark weighing 8kg, with as much as 8 liters of water filled, after boiling for 2 hours to spare ± 3.5 liters of water. With 3.5 liters of water can be used to soak the yarn 816 weighing 1.7 kg, soaked for 1 night. Soaking can be done 2-4 times to produce the desired color. While the rest of the bark can be boiled first boiling it back up to a maximum of 4 times. 3.7 Measuring The Quality of The Dye on The Fabric and Yarn The quality of a dye in the fabric/yarn can be assessed from several aspects, such as: resistance to sunlight (fading), flexibility and resistance to washing/response to the stains that come from other objects. The purpose of this test is to determine the extent and durability kelunturan fading in the yarn and fabric dyed using several types of plants. While the results of testing the quality of yarn is done in the Faculty of Engineering, Islamic University of Indonesia are as follows: Table 2. Test results thread to sunlight Fastness Value Against Sunlight 3-4 (quite good) 4-5 (good) 4-5 (quite good) 4-5 (good) 5 (good) 4 (good) 3-4 (quite good) Species of plant Peltophorum inerme Roxb. Morinda sp. Anacardium occidentale L. Curcuma longa Linn Indigofera sp. Woven fabric Sesbania grandiflora fade Value Against the Laundering 3-4 (quite good) 3-4 (quite good) 3-4 (quite good) 3-4 (quite good) 3-4 (quite good) 3 (rather) 3-4 (quite good) Value Defamation 4 (good) 1 (poor) 1 (poor) 1 (poor) 3 (rather) 1-2 (poor) 4 (good) The results of analysis carried out showed that Peltophorum inerme Roxb. has a value of fastness to washing and drying well against adequate good sunlight while Morinda bad at the time of leaching. Taum which is a type of dye that has a color eternity has good resistance to irradiation and washing does not cause bleeding on the other fabrics are washed together. 3.8 Chemical Content of Natural Dyes Each plant species has a different content. From a variety of active ingredients is then be used for various purposes including to dye cloth. The chemical content of the main ingredients of natural dyes contained in the the plant results in esplorasi Rote, Sabu, Sikka, and Larantuka were as follows: Table 3. Chemical content of natural dyes Species Matter Color Function Color component Indirubin Indigovera tinctoria Fresh leaf Dyes Blue, Black O H N N H O O OH OH Morindin Morinda sp. Symplocos chochichinensis Root Red Dyes Fall leaf Red Mordant Fruit Orange Dyes OH O Aluminium kelat (Al-(R)3) Dioctyl phthalate Opuntia cochientilifera C (O) O (CH 2)7 Me C (O) O (CH 2)7 Me Cycloartanyl acetate Cudrania conchinchinensis Bark Me Dyes Yello Me Aco Me Me 817 CHM e (CH2)3 CHM e 4. CONCLUSION AND RECOMMENDATION Fabrics produced from natural dyes have broad market prospects abroad, while in Indonesia itself is still used for ceremonial equipment, clothes and dress gloves, bag, sampler, accessory. If during this community using symplocos by peeling the skin, the test Gas Chromatography and Mass Spectrum showed that the levels of aluminum kalat of the Symplocos leaves as high as the skin so that the old leaves can be used as a skin substitute. Yarns and fabrics made using natural materials have properties more resistant to sunlight, discolored and stained by other material risks are better than the fabric resulting from chemical dyes. As for the needs to be pursued at the moment is to guide weaving made from natural and find solutions to the market so indirectly will help improve the welfare of the community. REFERENCES Dinas Kehutanan Provinsi NTT (2007): Statistik Kehutanan 2007.Dinas Kehutanan NTT. Kupang Handoko C, Rochayah S D M, Koeslulat E E (2004): Kajian Distribusi Ekologis Jenis-Jenis Penghasil Bahan Pewarna di Nusa Tenggara Timur. Prosiding Ekspos Hasil-Hasil Penelitian BP2KBNT. Waingapu, 4 Desember 2004. Yuliastrika, R (2008): Ekstraksi dan Karakterisasi Zat Warna dari Kulit Akar Mengkudu (Morinda citrifolia L.) dan Uji Potensinya Sebagai Pewarna Tekstil. Skripsi, Program Studi Kimia, Fakultas Matematika dan Ilmu Pengetahuan Alam Universitas Negeri Malang. 818 INAFOR 11P-016 INTERNATIONAL CONFERENCE OF INDONESIAN FORESTRY RESEARCHERS (INAFOR) The Traditional Use of Woka Palm (Livistona rotundifolia Mart.) as Non-Timber Forest Product in North Sulawesi Diah Irawati Dwi Arini Forestry Research Institute of Manado Jl. Tugu Adipura Raya Kel. Kima Atas Kec. Mapanget Kota Manado, INDONESIA Corresponding email: [email protected] Poster paper prepared for The First International Conference of Indonesian Forestry Researchers (INAFOR) Bogor, 5 – 7 December 2011 INAFOR SECRETARIAT Sub Division of Dissemination, Publication and Library FORESTRY RESEARCH AND DEVELOPMENT AGENCY Jl. Gunung Batu 5, Bogor 16610 819 The Traditional Use of Woka Palm ( Livistona rotundifolia Mart.) as Non-Timber Forest Product in North Sulawesi Diah Irawati Dwi Arini Forestry Research Institute of Manado Jl. Tugu Adipura Raya Kel. Kima Atas Kec. Mapanget Kota Manado Corresponding email: [email protected] ABSTRACT Woka palm is one of the non-timber forest products commonly used by the local people of North Sulawesi as raw materials to fulfill their daily needs. Not much data were available about the utilization of woka leaves and the actual history of when the natives started to utilize. The purpose of this research was to provide the information concerning the use of woka leaves and to identify places where producers and suppliers send them to the city of Manado and the surrounding areas. The collected data consisted of primary and secondary data through interviews with traders of woka leaves in traditional markets in the Manado city and the surrounding areas as well as based on literature studies. Because it has water resistant property, the woka leaves are mainly used as traditional food wrappers, house roofs, and it was said that the leaves were used for wrapping the dead bodies during ceremonial since time immemorial. Its specific aroma and uniqueness make the leaves remain valuable traditionally as food wrappers. The areas that have became the centre of woka suppliers were Bolaang Mongondow, North Bolaang Mongondow, Manado Tua Island, and Gorontalo Province. The high dependence of the North Sulawesi people on woka leaves and its utilization as a symbolist brings the importance of conservation and cultivation of woka to fulfill the market‘s needs. Keywords: Non Timber Forest Product, palem Serdang, culture, North Sulawesi 1. INTRODUCTION North Sulawesi is one of the provinces in Indonesia which is rich in natural resources. Moreover, this region is also blessed with a wealth of beautiful and exotic sea. In the area of maritime, the existence of North Sulawesi is undoubtful. The existence of Bunaken Marine National Park serves a panorama of nature under the sea with a variety of unique and beautiful coral reef is one of potential nature tourism. It was later made North Sulawesi are one of tourist destination, both domestic and foreign tourists, even the year 2010 is the beginning of Manado (North Sulawesi capital) as a city of world tourism. In the future, Manado is expected to become the gate of Indonesia to countries in the Asia Pacific region, and become an alternative tourism market in this country beside worldwide famous Bali. In the forestry sector, North Sulawesi province has a potential area of 1.88 million hectares of forest composing of protected forests, permanent production forest, limited production forest, converted production forest and nature reserve forest (Asriani and Kholidah, 2008). The thing that impressed and rang in minds from North Sulawesi are typical souvenirs which is yellow rice wrapped in woka leaves. Woka is a name in the area of North Sulawesi and Gorontalo for a plant species palm (Livistona rotundifolia Mart.). This palm species is widely used by people for either commercial purposes or daily needs. Lee et al., (2001) stated that non-timber forest products such as rattan (Calamus sp.), damar (Agathis lorantifolia), kayu manis (Cinamomum burmanii), sugar palm (Arenga pinata) including woka (Livistona rotundifolia) are one-third of foreign exchange income of forestry sector in North Sulawesi in 1997. 820 The purpose of this research was to examine the use of woka leaves as non-timber forest product that were widely used for daily living needs of people in North Sulawesi Province which allegedly have been carried out since ancient times and is still going on until today, and to identify the places where producers and suppliers of woka leaves to the traditional markets in Manado and its surroundings. 2. METHODS 2.1 Location and Time The study was conducted in March and June 2010 in some traditional markets in North Sulawesi and around. Karombasan and Bersehati traditional markets are located in Manado city; Tomohon traditional market is in Tomohon city; and Kawangkoan traditional market is located in Minahasa District, North Sulawesi Province. 2.2 Collection and Analysis Data The data collected consisted of primary and secondary data. The primary data were obtained through interviews with resource persons. The persons were the merchant or seller of woka leaves in traditional markets of Karombasan and Bersehati markets in Manado and Tomohon and Kawangkoan markets in Tomohon. Primary data collected consisted of price, supplier and utilization woka leaves. Analysis of secondary data analysis was conducted based on a desk study method through literature search related to woka leaves (Livistona rotundifolia Mart). The data were then analyzed descriptively. 3. RESULT AND DISCUSSION 3.1 Habitat and Morphology of Woka Leaves Woka palm (Livistona rotundifolia) belongs to Arecaceae family and are classified into Arecales ordo. Arecaceae family has a large number of species that the experts divide it into several sub-families. Shukla and Misra (2002) gave this opinion that the Arecaceae family comprises of 225 generas and 2600 species. This family, formerly known as Palmae, changes the name based on uniformity of nomenclature. Some other synonym names of woka are in Javanese language known as Serdang and at community of Ambonese it is called as Salbu. Morphologically, mature serdang palm seems sturdy with straight trunks and large, brown, and has fallen as the midrib of coconut midrib. The diameter of the trunk is about ± 38 cm with a height of 15 m, leaf midrib rough edges with long barbed spines between 1-2 cm and located on either side of midrib petiole. Woka has a half-hole round leaf shape, smooth surface and bottom of leaves, compound leaves with entire length of 130 cm. The length of young leaves is around 40-55 cm with width of 2-3 cm and the crown appears visually round. According to Witono et al., (2000) palm species can grow well on sandy soil types, peat, limestone soil and rocky ground. Beside that, palm can adapt easily to the places they grow with different slopes from the flat, hilly to steep slope. Palms require annual temperature of 25-17ºC, rainfall from 2000 to 2500 mm with an average of 120-140 rainy days a year and 80% humidity. For growth, palms requires light, and light reaching the forest floor varies so be certain to determine the growth characteristic of a palm species (Uhl and Dransfield, 1987). 821 Figure 1: The morphology of Woka (Livistona rotundifolia Mart.) leaves Woka is generally found in the forests of Sulawesi. This plant can be grown easily from lowland areas to hilltops. Natural forests of North Sulawesi are a habitat where the species is found in relatively large amount. This species can also easily be found in secondary forests. Whitmore and Sidiyasa reported that in Toraut-Dumoga there were 88 trees found in one hectare area (Whitten et al., 1987). In the observation of two seven-years-old trees with trunks more than two meters high in the Bogor Botanical Garden West Java showed that the newly leaves formed every 20 days but if it was compared with in their natural habitat in the wild, the rate of woka leaf formation was found far more slowly. 3.2 Benefit of Woka Leaves Woka leaves are non-timber forest products that are commonly used in everyday life by people of North Sulawesi. The leaves are used for wrapping food, basic materials for the huseroof or other purposes. In detail the benefits of Woka leaves for people of North Sulawesi can be explained as follows: 3.2.1 Tradition of Ancient Burial in Minahasa In the ancient times, woka leaves were used by people of Minahasa to wrap the corpse before they were buried. The habit was gradually changed from woka leaves to turn into wood or container cavity Nibung. On about IX century Minahasa‘s tribe began using stone tomb known as Waruga. People who died were placed facing north and seated with the heel of the foot attached to the buttocks with her head kissed the knee. The aim of facing to the North is said to symbolize that the Minahasa tribe ancestors came from the north. Around the year 1860, the Dutch Government began the prohibition to bury people killed in Waruga (Wikipedia, 2009). Then in 1870, Minahasa tribe began making coffins as a substitute for Waruga. This was done because it was feared would spread the germs of typhoid and cholera through the gap which existed between the agency and the cupola of Waruga. At that time, those two were both contagious and infectious diseases are endemic among the Minahasa tribe, the disease is dangerous and is not yet known the cure to it at the time, so that many people died from contracting the deadly virus. Uniquely woka leaves were used by the people of Gorontalo to wrap the placenta, (local name Dodome) before they were buried. What the meaning of these habits is 822 still unknown but it is clear that this tradition has been believed to be inherited from ancestors and has been practiced since many years ago. 3.2.2 Traditional Food Wrappers Beside as a wrapper of yellow rice, woka leaves were widely used by the Minahasa people to wrap pork before burning it in the ground. It is said that woka leaves can provide distinctive taste and aroma of barbecued meat, although the spicy flavor will still be the characteristic of Minahasa‘s cuisine. Aren (Arenga pinata) is one of the non-timber forest products that is potentially used by the people of North Sulawesi. Generally this species is used for tapping palm juice, it is then processed through natural distillation and used as a traditional liquor of Minahasa or better known as cap tikus. Beside that, palm juice is also used for the making of sugar, woka leaves are used as containers in the mintage process of the sugar. North Sulawesi is an archipelago with the potential of fish that is relatively abundant, in the year 2007 the potential of marine fish catch reached 1.8 million tons (Setneg, 2008). This is why the people of this area generally eat fish. When the fish is prepared for barbecue, woka leaves become an alternative food packaging materials, especially for pepes and kukus. Moreover, young woka leaves were also used as a typical North Sulawesi dodol cake wrapper. It seems that the leaves are widely used for its non-stick surface. In general, the use of woka leaves in North Sulawesi as a unique packaging for food, especially the yellow rice. Yellow rice is a food made of rice cooked with turmeric and coconut milk sufficiently. Resulting in yellow color with a distinctive flavor and aroma, moreover this food is combined with fried vermicelli noodles, meat, eggs, sweet potato chips with showing the spicy flavour as a characteristic of Minahasa special cuisine. Woka leaf is a character of yellow rice of North Sulawesi, on some streets in the city of Manado we could watch the parade of yellow rice wrapped in Woka leaf. Not only that, even at some grocery stores they sells only yellow rice with Woka leaf wrapping. North Sulawesi is an area that is quite unique compared to other regions in Indonesia, where we can see many people eating yellow rice every time. This makes these snacks can easily be found both in the morning, noon or night, especially in the city of Manado. In some places in Indonesia such as Java, yellow rice (tumpeng) is only used as a menu that has a sacred value for a big feast like Thanksgiving, Aqiqah, Mawlid of the Prophet Muhammad, and other big feasts. Not much different from the Javanese, the Balinese use yellow rice as one of the menu that has a value of sanctity. Tumpeng used as a special menu when the Kuningan feast day, also used as offerings when perform the ritual worship. Different things we can meet when visiting the South Sulawesi where the yellow rice is only used as a breakfast menu or for the activities of the children finished elementary school students, and this is not a necessity. 3.2.3 Traditional Glass and Plate Because of it‘s wide size and resistant to water, woka leaves are often used as media to take a drink of water or even used as a mat to eat by rural communities or people living inside the forest. 3.2.4 Crop and Quarry Wrapper Woka leaves are also used as a container to accommodate and bring crops in a relatively not much amount like langsat, duku, tomatoes and rica (chili). Quarry from forest like hunted wild boar and deer meat usually wrapped with woka leaves. 823 Figure 2: The traditional market and the use for food warpper of Woka Palm 3.2.5 House Roofs and House walls Woka leaves are also often used as a substitute for umbrella during the rainy season. Because the width of the leaf and water resistant mainly on mature Woka. In some places in the North Sulawesi region Woka leaves is a promising industry for plait as the house roofs. In rural areas there still can be seen the houses that use either woka leaves for the roof or the wall. Most of the population of North Sulawesi live as farmers, this make the agricultural potential a main item to bring foreign exchange. So it is not surprising when visiting rural areas in the fields or gardens, many shacks (daseng) are mostly made from Woka leaves. 3.2.6 Ornamental Plant Palms are popular as ornamental plants including Ravenea sp. (princess palm), Mascarena lagenicaulis or Hyophorbe lagenicaulis (bottle palm), Cyrtostachys lakka (red palm), Roystonea sp. (King Palm). This is because woka is relatively not too big with wide leaves and unique shape so it can be used as ornamental plants. Aesthetic value, shade and market demand are the consideration that makes this palm species is generally favoured as an ornamental plant. 3.3 Exploitation and Implication to Woka Population Preservation Woka leaves very intensively exploited by people of North Sulawesi as one of the nontimber forest product. Nowdays, woka leaves is in an unsafe position from the side of conservation. The need for yellow rice wrappers making woka leaves excessively exploited without concerning to principles of sustainability. Young woka leaves were sold and found in large quantities in the traditional markets such as in Karombasan and Bersehati in Manado. The survey conducted in some traditional markets of Manado showed that the purchasing price woka leaves per sheet is as follows: for small enough woka leaves varied between Rp 1,500 - Rp 2,000 while the large leaves are relatively constant in the price of Rp 3,000. The selling price of yellow rice in Manado, also varies from Rp 5,000 to Rp 12,500. Based on the results of interviews with some traders known that the woka leaves in traditional markets of Manado and the surrounding regions were imported from Poigar district Bolaang Mongondow, Boroko district North Bolaang Mongondow, Ishimu Province of Gorontalo and Manado Tua Island. In the Minahasa region woka have rarely been found, this species was found only in small quantities in the region of Likupang district of North Minahasa. To meet market demand on woka leaves, the search and exploitation of these species expand to natural forests, even down to Bolaang Mongondow Raya which is a complex area that has the largest forest area in North Sulawesi. Lingua hill area in National Parks Bogani Nani Wartabone is the place where harvesting of woka leaves conducted in large-scale. Walker and Cahill (2000) counted approximately 50 trees felled, it was raised only in road edge the logging is currently still happening. Based on the research results by 2-3 by 824 Wildlife Conservation Society (WCS), woka leaves per year can still be permissible as the growth pattern of trees that are harvested in small amounts will be similar to trees that are not harvested. However, excessive exploitation of young and old leaves will inhibit regeneration and possibly could cause death of trees (Lee et al., 2001). Woka leaves harvesting in forests throughout the North Sulawesi region is very high and it is predicted that woka tree will not be sustainable. 3.4 Alternative Handling Exploitation of woka leave without prioritizing conservation aspects will impact the destruction of this species in nature. Although there are several other species as substitution such as banana leaves and pack leaves, but most people still use Woka leaves. The reason is that the woka leaves can provide its own flavor and aroma when used as a wrapper of yellow rice and at the same time can increase the sale value. So the people dependency of Woka leaves existence is very high and will not can even be replaced by any other species as substitution. From above explanation seems clear that Woka or Serdang Palm (Livistona rotundifolia) is on the verge of collapse and extinction, so those needs for handling solutions, some methods of handling that can be offered are as follows: 1. As a non-timber forest products that have a big contribution to field of forestry this needs to be managed wisely in North Sulawesi. It is necessary to synergize between local governments with various stakeholders especially the people as consumers. 2. Given the people of North Sulawesi dependency of Serdang Palm are very high then there should be areas set aside for the cultivation of these species. It is expected that demand will be met and the benefits continue (sustainable) and more importantly minimize the process of extinction of this species in the North Sulawesi. 3. Counselling is an important knowledge transfer methods that are sometimes forgotten and neglected. Yet this activity would be beneficial, where the public will gain a deep knowledge about the benefits and characteristics of woka in nature. Final output expected from this activity is the emergence of public awareness of the importance of woka leaves, so that the people themselves who will preserve woka. 4. Empowering people to manage Woka are preventive methods that need to be developed. This was deemed necessary concerning the high exploitation by people on woka leaves for daily purposes. This species is very potential to be harvested at random, but keep in mind that woka has a long growth cycle. People-based management is necessary, hopefully the people will feel that woka is not just plants that can bring benefit to them but also need to be conserved. 5. In depth study of species of palms, especially woka is needed. So that the results of the study can be used as a basic to manage Serdang palm based on the concept of sustainable while promoting the conservation aspect. 4. CONCLUSION Woka leaves are non-timber forest products that have been used by people in North Sulawesi since before IX century as a medium to wrap corpses. Nowadays woka is more widely used for the purposes of yellow rice wrapping. Woka are getting much exploited by the people, especially the traders for various purposes. Some places become supplier and producer of the Woka leaves is Bolaang Mongondow, North Bolaang Mongondow, Manado Tua Island, North Minahasa and Gorontalo. 825 High dependence from people on woka leaves make cultivation of this species is very important to meet the needs of the people itself. So that it is necessary to study or held a research related to aspects of woka leaf cultivation. It also needs a deep-study of woka so that research data can be used as a reference for a better management wisely based on the principle of conservation for the public welfare. REFERENCES Asriani and Kholidah (2008): Profil Propinsi Sulawesi Utara Mencakup Data Penduduk, Sumber Daya Alam dan Ekonomi Makro. http://www. vivanews. com. Lee, R, J Riley and Merrill R (2001): Keanekaragaman Hayati dan Konservasi di Sulawesi Bagian Utara. Wildlife Conservation Society and Natural Resources Management. Jakarta. Sekretariat Negara (2008): Sumber Daya Alam Propinsi Sulawesi Utara. Portal Nasional Republik Indonesia. http://www. Indonesia.go.id. Shukla, P and P S Misra (2002): An Introduction to Axonomy of Angiosperm. Vikas Publishing House PUT LTD. University of Delhi. Karpur. Uhl, N W and J Dransfield (1987): Genera Palmarum, A Clasification of Palm Basic on The Work of Harold E. More Jr. Bailey hartorium and the international palm society. Allen Press. Lawrence. Kansas-USA. Walker, J S and Cahill, A J (2000): Population size and status of the Yellow-breasted Racquet-tail Parrot, Prioniturus Flavicans. Bird Conservation International. Wikipedia Indonesia (2009): Sejarah Waruga. http://www. wikipedia.org.id. Whitten, A, J F Mustafa and G S Hendersen (1987): Ekologi Sulawesi. Gadjah Mada Press Yogyakarta. Witono, J, R A Suhatman, N Suryana and R S Purwantoro (2000): Koleksi Palem Kebun Raya Cibodas. Seri Kebun Raya Lembaga Ilmu Pengetahuan Indonesia (LIPI) Vol II No 1 Sindang Laya. Cianjur. 826 INAFOR 11P-017 INTERNATIONAL CONFERENCE OF INDONESIAN FORESTRY RESEARCHERS (INAFOR) Assessing FTA Cards for DNA Capture from Different Types of Fungal Material Purnamila Sulistyawati The Center for Research on Biotechnology and Tree Improvement Jl. Tentara Pelajar Km.15 Purwobinangun, Pakem, Sleman, Yogyakarta 55582, INDONESIA Poster paper prepared for The First International Conference of Indonesian Forestry Researchers (INAFOR) Bogor, 5 – 7 December 2011 INAFOR SECRETARIAT Sub Division of Dissemination, Publication and Library FORESTRY RESEARCH AND DEVELOPMENT AGENCY Jl. Gunung Batu 5, Bogor 16610 827 Assessing FTA Cards for DNA Capture from Different Types of Fungal Material Purnamila Sulistyawati The Center for Research on Biotechnology and Tree Improvement Jl. Tentara Pelajar Km.15 Purwobinangun, Pakem, Sleman, Yogyakarta 55582, INDONESIA ABSTRACT The FTA card (Whatman International Ltd) used to get a direct capture of plant pathogen DNA in the field, achieved by squashing pathogen structures or fungal materials onto cards, will facilitate the detection and identification of the plant pathogen. DNA sampling with these cards provides many advantages for a plant pathologist such as increasing the number of samples, easy stored and transported in the field, especially in remote locations; also reducing any biosecurity risk associated with transport of viable cultures. Although several samples used in this study were not directly related to forest diseases, the card still can be used to investigate the applicability of FTA cards as a new method for DNA sampling from fungal pathogen and mycorrhizal fungi associated with forestry. After DNA sampling and capture on the card, the DNA extractions were subjected to PCR, DNA sequencing and species-specific PCR. There were three main sources of fungal material squashed onto the FTA cards i.e. cultures, fruitbodies (sporocarp of common fungal pathogen and mycorrhizal fungi) and spores (spore prints of common Basidiomycete, urediniospore and teliospore). These preliminary results clearly demonstrate that DNA from fungal materials such as cultures, agaricoid sporocarps and their basidiospores can be reliably captured on FTA cards designed for plant DNA. Material such as the more resistant urediniospores and teliospores may require additional procedures for efficient disruption and release of DNA such as grinding of samples in buffer prior to FTA card application but primer mismatch is likely to offer a better explanation for lack of PCR amplification. Keywords: FTA cards, PCR, DNA (deoxyribonucleicacid) 1. INTRODUCTION Identification of fungi causing disease traditionally depends on examination of fruiting structures such as fruit bodies and spores. If these structures are not present, costly delays in treatment or response may occur. Faster and more reliable identification may be assisted by DNA techniques, as all cell types of the one organism contain the same DNA and there is no requirement for morphological distinctiveness. Whatman International Ltd from Flinders Technology Associates (Moscoso et al., 2004) have patented FTA Card which provides a simple and rapid method for the room temperature collection, transport and storage of DNA. FTA card developed for capture of plant DNA directly from leaves has been successfully used for some fungal cultures, but has not been tested on a broader range of fungal cell types (Borman et al., 2006, Gitaitis et al., 2005, Suzuki et al., 2006). The first step in the capture of DNA by the FTA card is the spotting or squashing the sample onto the FTA card, which contains chemicals that can lyse the cells and bind the DNA. Squashing materials onto the card involves breaking the cell walls of the fungal material or plant material. The effective use of FTA cards could be influenced by the particular cell wall composition and structure of fungi. Structures with thickened cell walls could be difficult to crush without some kind of pre-treatment and contaminants introduced by the medium in which disease propagules are supported (e.g. soil, leaf tissue) could inhibit DNA extraction and analysis. This study describes the testing of FTA card suitability for capturing DNA from various types of fungal structures. Some of the fungal structures commonly employed for the identification of 828 forest diseases i.e. pure fungal cultures; macro-fungal sporocarps and their spore prints, rust spores and mildew spores were tested in this study. 2. MATERIAL AND METHODS 2.1 Material Pure fungal cultures; a wide collection of pure fungal cultures (Table 1) inclusive of Oomycetes, Ascomycetes and Basidiomycetes were made available for testing with FTA cards. Figure 1: Examples of fungal pure cultures used to test FTA cards; (A) cultures from a black lesion on stem of Acacia mangium seedling (B) Culture (to the right) and the basidiomycete (Phellinus sp.) sporocarp (E 8809) from which it was isolated Table 1. Fungal cultures tested with FTA cards (age of culture is in weeks) No 1. Code FF-24 Species Classis Age (week) No. Aleurodiscus Basidiomycota 18 42. Code Species Classis Age (week) 8 T 201 A15 Ganoderma philippii Basidiomycota 13 Basidiomycota 10 2. FF-59 - Basidiomycota 6 43. Co 2275 Unknown basidiomycete 3. FF-76 - Basidiomycota 16 44. E 8809 A15 Phellinus sp. Basidiomycota 19 4. FF-120 - Basidiomycota 3 45. E 8812 A15 Ganoderma sp. Basidiomycota 19 5. FF-144 - Basidiomycota 15 46. E 8822 C15 Unknown basidiomycete Basidiomycota 19 6. FF-188 Hypoxylon crocopeplum Ascomycota 2 47. E 8823 A25 Ganoderma sp. Basidiomycota 19 7. FF-214 - Basidiomycota 16 48. E 8828 C15 Formitopsis feei Basidiomycota 13 8. FF-264 - Basidiomycota 91 49. E 8831 A15 Ganoderma philippii Basidiomycota 17 9. FF-265 - Basidiomycota 18 50. E 8831 B15 Gymnopilus sp. Basidiomycota 17 10. FF-266 - Basidiomycota 16 51. E 8832 A15 Ganoderma philippii Basidiomycota 17 11. FF-268 - Basidiomycota 18 52. E 8832 B15 Ganoderma phiippii Basidiomycota 18 12. FF-269 - Basidiomycota 107 53. E 8842 C15 Basidiomycota 17 13. M-U02 - Basidiomycota 7 54. E 8851 A15 Basidiomycota 17 14. T-1394 Postia subcaesia Basidiomycota 7 55. E 8852 B15 Ganoderma philpipii Ganoderma aff. australe Amauroderma rugosum Basidiomycota 20 15. T-1399 Postia subcaesia Basidiomycota 7 56. E 8861 C25 Ganoderma sp. Basidiomycota 19 Basidiomycota 7 57. FB 1 A25 Phlebia sp. Basidiomycota 13 Basidiomycota 7 58. FB 16 B15 Ganoderma philippii Basidiomycota 17 59. FB 17 A15 Ganoderma sp. Basidiomycota 17 60. FB 20 A25 Pycnoporus sp. Basidiomycota 16 16. T-1400 A Ganoderma. australe Ganoderma. australe aff. aff. 17. .T-1400 B 18. W-25 (iii) Gymnopilus tyallus Basidiomycota 16 W-163 Chondrostereum purpureum. Basidiomycota 8 19. 829 20. W-190 Crepidotus sp. Basidiomycota 107 61. FB 4 A15 Ganoderma philippii Basidiomycota 17 21. W-225 Postia dissecta Basidiomycota 13 62. FB1 B2? 5 Antrodia sp. Basidiomycota 19 22. W-234 Ryvardenia crustacea Basidiomycota 39 63. T 19 A15 Trametes sp. Basidiomycota 17 23. W-276 Trametes hirsuta Basidiomycota 2 64. T 57 A15 Fomes sp. Basidiomycota 19 24. W-344 Panellus ligulatus Basidiomycota 7 65. T 42 B15 19 Armillaria luteobubalina Basidiomycota 43 66. T 72 B15 Fomes sp. Amauroderma rugosum Basidiomycota Armillaria Cas Cyclaneusm a SN 815 Cyclaneusm a3 Basidiomycota 13 Cyclaneusma sp. Ascomycota 43 67. T 75 A25 Fomes sp. Basidiomycota 17 Cyclaneusma sp. Ascomycota 43 68. 2A-16 - Ascomycota 7 28. IPC 10 Penicillium sp. Ascomycota 39 69. 2A-26 - Ascomycota 7 29. IPC 20/1 - Ascomycota 99 70. 2A-36 - Ascomycota 7 30. IPC (32) Lophodermium pinastri Ascomycota 16 71. 2B-16 - Ascomycota 7 31. M-U013 Cyclaneusma minus Ascomycota 17 72. 2B-26 - Ascomycota 7 Mycospherella sp. Ascomycota 18 73. 2B-36 - Ascomycota 7 Mycospherella sp. Ascomycota 16 74. 2B-46 - Ascomycota 7 Ganoderma sp. Basidiomycota 17 75. P6 - Ascomycota 7 Phlebia sp. Basidiomycota 17 76. Q6 - Ascomycota 7 Ganoderma sp. Basidiomycota 14 77. R6 - Ascomycota 7 Ganoderma sp. Basidiomycota 17 78. S6 possible Fusarium sp. Ascomycota 7 Phanerochaete sp. Basidiomycota 17 79. T6 possible Fusarium sp. Ascomycota 7 Phlebia sp. Basidiomycota 17 80. U6 possible Fusarium sp. Ascomycota 7 Ganoderma sp. Basidiomycota 17 81. Isolate A7 Phytophthora sp. Oomycota 2 Ganoderma mastoporum Basidiomycota 17 25. 26. 27. 32. 33. 34. 35. 36. 37. 38. 39. 40. 41. Mycosphae rella St. Marys Mycosphae rella 80/14 10 B T 2055 12 T 175 B15 5 T 160 A215 5 T 168 A25 6 T 172 A25 6 T 200 A215 7 T 170 A25 8 T 169 A25 Sporocarps (Figure 2); the majority were identified to species or genus level but not all of the sporocarps could be identified. These sporocarps have been stored as herbarium material. Table 2. Basidiomycete sporocarp material No. Code Species No. Code Species 1 NE01 * 39 T 1259 Hydnum umbilicatum 2 NE02 * 40 T 1260 Basidiomycete sp. A 3 NE03 * 41 T 1261 Cortinarius sp. D 4 NE04 * 42 T 1262 Lactarius sp. B 5 NE03 * 43 T 1261 Cortinarius sp. D 6 NE04 * 44 T 1262 Lactarius sp. B 7 T 1245 * 45 T 1263 Laccaria sp. E 8 T 1246 Lactarius eucalypti 46 T 1264 Russula sp. B 9 T 1247 Lactarius eucalypti 47 T 1265 Cortinariaceae sp. B 830 10 T 1248 Laccaria sp. B 48 T 1266 Lactarius eucalypti 11 T 1249 * 49 T 1267 * 12 T 1250 Lactarius eucalypti 50 T 1268 * 13 T 1251 Lactarius sp. B 51 T 1269 Boletaceae sp. C 14 T 1252 Descomyces sp. A 52 T 1270 Cortinarius sp. E 15 T 1253 * 53 T 1271 * 16 T 1254 * 54 T 1272 Laccaria sp. E 17 T 1255 Lycoperdon sp. A 55 T 1273 Cortinarius sp. F 18 T 1256 Laccaria sp. C 56 T 1275 Cortinarius schlerophyllarum 19 T 1257 * 57 T 1276 Laccaria sp. D 20 T 1258 * 58 T 1277 Cortinarius sp. C 21 T 1278 Lactarius eucalypti 59 T 1301 Russula sp. A 22 T 1279 Thaxterogaster sp. A 60 T 1358 Galerina sp. 23 T 1280 Thaxterogaster sp. 61 T 1359 Mycena spp. 24 T 1281 Laccaria sp. A 62 T 1360 Hygrocybe astatogala 25 T 1282 Lactarius eucalypti 63 T 1361 Mycena subgalericulata 26 T 1284 Cortinarius sp. A 64 T 1362 Tremella fuciformis 27 T 1286 * 65 T 1363 Gymnopilus feruginosus 28 T 1287 Dermocybe sp. A 66 T 1364 Panellus longinquus 29 T 1289 Cortinarius sp. B 67 T 1365 Laccaria spp. 30 T 1290 * 68 T 1366 Ryvardenia campyla 31 T 1291 Cortinariaceae sp. A 69 T 1367 Cortinarius spp. 32 T 1292 * 70 T 1368 Clavariaceae 33 T 1293 Boletaceae sp. A 71 T 1369 Collybia eucalyptorum 34 T 1295 Lactarius sp. A 72 T 1372 * 35 T 1297 Boletaceae sp. B 73 T 1373 * 36 T 1298 Thaxterogaster sp. B 74 T 1374 * 37 T 1299 Lactarius eucalypti 75 T 1375 * 38 T 1300 Inocybe sp. A 76 T 1376 * A aff. B Figure 2: Examples of mycorrhizal sporocarps fungi (A) Cortinarius sp. (B) Dermocybe sp. 831 Spore-prints (Figure 3); these were made from sporocarps of gilled basidiomycetes Sporeprint samples SP5 and SP6 (Table 3) were obtained from sporocarps that could not be formally identified. Rust urediniospores and teliospores; these were obtained from common garden plants infected with fungal pathogens that cause rust diseases. A B C Figure 3: Spore prints of (A) Laccaria sp. ; (B) Psathyrella sp. ; (C) Cortinarius sp. Table 3. Spore-print material Sample number SP1 SP2 SP3 SP4 SP5 SP6 SP7 SP8 SP9 SP10 Species Cortinarius sp. Cortinarius sp. Cortinarius sp. Agaricus bisporus Unidentified Unidentified Cortinarius sp. Cortinarius sp. Psathyrella sp. Psathyrella sp. 2.2 Methods All samples were scraped and the material squashed onto the card. Spore-prints were obtained by placing the sporocarps, gill side down, onto the FTA card overnight and then squashed. FTA sample preparation (procedure provided in the kit) conducted followed by PCR amplification with the use of the primer ITS1-F (5‘-CTTGGTCATTTAGAGGAAGTAA-3‘ (Gardes and Bruns, 1993) and the universal primer ITS4 (5‘- TCCTCCGCTTATTGATATGC3‘ (White et al., 1990). Triplicate samples were subjected to PCR. 3. RESULTS PCR amplification of rDNA ITS from fungal cultures DNA capture of cultures onto FTA card was successful for 62 of the samples taken from cultures as demonstrated by a positive PCR in at least one of three replicates using the fungal-specific primer combination ITS1-F/ITS4 (Figure 4). PCR amplification was unsuccessful for all three replicate PCRs for 20 samples. All 14 samples from cultures isolated from acacia nursery seedlings did not amplify in PCR. 832 A A B Figure 4: One of rDNA ITS PCR amplification from fungal cultures applied to FTA cards using primers ITS1-F/ITS4.A Lanes contain: 1 and 20, DNA size marker (lambda DNA cut with EcoR1 and HindIII); 2, W190; 3, FF188; 4, FF59; 5, W25(iii); 6, Phytophthora; 7, T1394; 8, Armillaria Cas; 9, Mycosphaerella 80/1; 10, Cyclaneusma SN 815; 11, Mycosphaerella St. Marys; 12, Cyclaneusma; 13, FF214; 14, FF24; 15, FF120; 16, W225; 17, W276; 18, FF144; 19, positive control (FF269 from glassmilk DNA extraction method). B. Lanes contain: 1 and 20, DNA size marker (lambda DNA cut with EcoR1 and HindIII); 2, W163; 3, W234; 4, M-U01; 5, FF76; 6, W344; 7, T1400B; 8, T1400A; 9, T1399; 10, M-U02; 11, FF264; 12, FF265; 13, IPC(32); 14, IPC10; 15, IPC20/1; 16, FF266; 17, FF268; 18, FF269; 19, negative control (water) 3.1 PCR Amplification of DNA from Sporocarps DNA capture of basidiomycete sporocarps onto FTA cards was successful for 65 out of 72 samples, as demonstrated by amplification in at least one of three replicate PCRs using fungalspecific primers, ITS1-F/ITS4 (Figure 5). A A B Figure 5: One of rDNA ITS PCR amplification from sporocarps applied to FTA cards using primers ITS1-F/ITS4. A. Lanes contain: 1 and 20, DNA size marker (lambda DNA cut with EcoR1 and HindIII); 2, T1298; 3, T1297; 4, T1295; 5, T1301; 6, T1373; 7, T1374; 8, T1375; 9, T1376; 10, T1287; 11, T1292; 12, T1293; 13, T1290; 14, T1289; 15, T1277; 16, T1278; 17, T1281; 18, T1282; 19 ,T1284. B. Lanes contain: 1 and 10, DNA size marker (lambda DNA cut with EcoR1 and HindIII); 2, T1279; 3, T1280; 4, T1300; 5, T1299; 6, T1291; 7, T1286; 8, positive control (FF 269 from glassmilk DNA extraction method); 9, negative control (water). 3.2 PCR Amplification of DNA from Spore-Print of Basidiospore, Rust Urediniospores and Mildew Conidia DNA was successfully captured and amplified from basidiospores, with only one sample negative in all three replicates (Figure 6). PCR amplification was successful with only one of nine urediniospore samples. Positive PCR amplification results were obtained for the two samples of mildew conidia but for only one out three replicates for each sample. 833 Figure 6: PCR amplification of the rDNA ITS from spore-prints applied to FTA cards using primers ITS1-F/ITS4. Lanes contain: 1 and 14, DNA size marker (lambda DNA cut with EcoR1 and HindIII); 2, SP1; 3, SP2; 4, SP3; 5, SP4; 6, SP5; 7, SP6; 8, SP7; 9, SP8; 10, SP9; 11, SP10; 12, Positive control (FF269 from glassmilk DNA extraction method); 13, negative control (water). 3.3 Sequencing of PCR Products and Identification Based on Sequence Similarity Public DNA databases (GenBank, EMBL and DDBJ) were searched using BLAST (Altschul et al., 1990) (Table 4). Table 4. Comparison of morphological identification and BLAST Search results Code Morphological identification Identification based on BLAST results SP1 Spore-print of Cortinarius sp. Cortinarius sp. SP4 Spore-prints of Agaricus bisporus Agaricus sp. SP9 Spore-prints of Psathyrella sp. Psathyrella sp. Gr1 Grass rust Eudarluca aff. caricis FF59 unknown Hypholoma fasciculare W25 (iii) Gymnopilus tyallus Ganoderma sp. Cu7 Armillaria Cas Armillaria luteobubalina Cu8 Mycosphaerella sp. Mycosphaerella cryptica Cu10 Mycosphaerella sp. Mycosphaerella nubilosa FF214 Creamy flat fungi Pichia sp. FF 120 white cords fungi Verticillium sp. W225 Postia dissecta Verticillium sp. W276 Trametes hirsuta Trametes hirsuta FF144 tiny, cottony rods Hypholoma aff. fasciculare Cu21 Unknown Xylariaceae sp. FF76 white polypore Basidiomycota sp. W344 Panellus ligulatus Hypholoma sp. T1400 Ganoderma australe Ganoderma sp. T1399 Postia pelliculosa Postia sp. Isolate A Possible Phytophthora Zygomycete sp. U Possible Fusarium Fusarium oxysporum 2A-2 Possible Fusarium Phoma sp. 2B-2 Possible Fusarium Phoma sp. P Possible Fusarium Fusarium oxysporum S Possible Fusarium Fusarium oxysporum U Possible Fusarium Fusarium oxysporum T Possible Fusarium Fusarium oxysporum 4. DISCUSSION It can be seen from the results that most of the fungal DNA from cultures and sporocarps can bind easily onto FTA card. In the case of cultures, PCR amplification using 834 ITS1-F/ITS4 primers appeared marginally more successful because the cultures used in this study were the young cultures which were easier to squash; the mycelium still fresh and soft, with high moisture content. The cell walls of young cultures are also not thickened, are actively dividing mycelium and most likely to have a higher DNA content to promote better DNA capture. Nearly all the rust urediniospores applied to FTA card gave negative PCR amplification results using ITS1-F/ITS4 primers and there was also low success rate for mildew conidia. Poor amplification of mildew and rust spore samples squashed onto FTA cards probably because rust spores (urediniospores) has thicker and melanised cell walls which more resistant to adequate cell disruption, so that the DNA cannot be bound onto the FTA card. The method of grinding material with buffer and application of the buffer onto the card should be tried for more resistant spores. In addition fungal spores may require harsher treatments such as sonication (Kennedy et al., 2000, Nirmala et al., 2006, Thines et al., 2004). Other reasons that may contribute significantly to poor amplification of DNA captured from spores (or any other material) are primer mismatch and PCR inhibition. There could be many reasons for PCR inhibition such as the presence of inhibitory substances in thickened spore walls. Understanding the role of inhibitors in the substrate (plant or fungal) could be improved by conducting further tests incorporating an IAC (Glen et al., 2007). PCR inhibition can be reduced by adding a reagent such as BSA (bovine serum albumin) as was used in this study or increasing the amount of polymerase. The dilution of the DNA sample sometimes improves PCR amplification because inhibitors are diluted as well as the DNA (O'brien, 2008). A dilution effect can be achieved with FTA card by using a smaller punch or increasing the volume of the PCR reaction. Other steps to overcome PCR inhibition or low target DNA could include the use of nested PCR or selection of primers to amplify a smaller fragment. DNA captured from rust spores may not be efficiently amplified with the primers selected here (Langrell et al., 2008) and alternative primers could be tested. 4.1 Identification of Isolates Using DNA Sequences DNA sequence success is related to the starting material squashed onto the FTA card. With a good starting material, e.g. a clean culture or sporocarp, and the correct matching of primers, fungal DNA was easily amplified and a legible DNA sequence obtained. DNA sequences from the young and clean cultures isolated from black lesions on root collars of Acacia mangium seedlings were identified as Phoma sp., Cylindrocladium/Calonectria sp. and Fusarium oxysporum. All these cultures belong to fungal pathogens capable of causing root and foot rot in Acacia mangium seedlings. Good sequence results were obtained from spore-print samples, allowing identification of the fungal DNA as Cortinarius sp., Agaricus bisporus, and Psathyrella sp. The successful amplification of fungal DNA from spore-prints using FTA card indicates the potential for further applications such as environmental spore-trapping. A hyperparasite of rust was identified from the rust leaf sample (Eudarluca aff. caricis) but the rust fungal pathogen was not itself identified. Poor amplification of rust fungi with primers ITS1-F/ITS4 may have contributed to this result and as previously discussed the choice of primers with higher specificity for rust fungi would possibly improve PCR amplification and sequence quality as well as the efficiency of DNA extraction. 5. CONCLUSION Overall, DNA from fungal materials such as cultures, agaricoid sporocarps and their basidiospores can be reliably captured on FTA cards designed for plant DNA if sufficient material is available to be squashed and adequate penetration of the card is achieved. Material such as the more resistant urediniospores and teliospores may require additional procedures for efficient disruption and release of DNA such as grinding of samples in buffer prior to FTA card 835 application but primer mismatch is likely to offer a better explanation for lack of PCR amplification. ACKNOWLEDGEMENT This study is part of a thesis written by the author in completing education at the University of Tasmania, Hobart, Australia. Gratefully thanks to Dr. Caroline Mohammed and Dr. Morag Glen as thesis supervisor; Bryony Horton and Genevieve Gates for providing cultures and fruitbodies samples; the co-researchers and engineers at CSIRO Forestry office in Hobart Tasmania Australia, School of Agricultural Science University of Tasmania, Center for Forest Biotechnology and Tree Improvement Yogyakarta, especially all colleagues in Molecular Genetics Laboratory for providing facilities and help in conducting research. REFERENCES Adams, D J (2004): Fungal Cell Wall Chitinases and Glucanases. Microbiology, 150, 2029-2035. Altschul, S. F., Gish, W., Miller, W., Myers, E. W. & Lipman, D. J. (1990) Basic Local Alignment Search Tool. Journal of Molecular Biology 215, 403-410. Borman, A M, Linton, C J, Miles, S J, Campbell, C K and Johnson, E M (2006): Ultra-rapid Preparation of Total Genomic DNA from Isolates of Yeast and Mould Using Whatman FTA Filter Paper Technology - A Reusable DNA Archiving System. Medical Mycology, 44, 389-398. Gardes, M and Bruns, T D (1993): ITS Primers With Enhanced Specificity for Basidiomycetes Applications to The Identification of Mychorriza and Rusts. Molecular Ecology, 1, 113-118. Gitaitis, R, Martinez, N, Seebold, K, Stevenson, K, Sanders, H and Mullis, S (2005): PCR Amplification of Nucleic Acids of Bacteria, Fungi and Viruses Recovered and Stored on FTA Cards. Phytopathology 95, S35. Glen, M, Smith, A H, Langrell, S R H and Mohammed, C L (2007): Development of Nested Polymerase Chain Reaction Detection of Mycosphaerella spp. and Its Application to the Study of Leaf Disease in Eucalyptus Plantations. Phytopathology 97, 132-144. Kennedy, R, Wakeham, A J, Byrne, K G, Meyer, U M and Dewey, F M (2000): A New Method To Monitor Airborne Inoculum of the Fungal Plant Pathogens Mycosphaerella brassicicola and Botrytis cinerea. Applied And Environmental Microbiology 66, 2996-3000. Langrell, S R H, Glen, M and Alfenas, A C (2008): Molecular diagnosis of Puccinia psidii (guava rust) - a quarantine threat to Australian eucalypt and Myrtaceae biodiversity. Plant Pathology, 57, 687-701. Moscoso, H, Thayer, S G, Hofacre, C L and Meven, S H (2004): Inactivation, Storage, and PCR Detection of Mycoplasma on FTAR Filter Paper. Avian Diseases 48, 841-850. Nirmala, J, Brueggeman, R, Maier, C, Clay, C, Rostoks, N, Kannangara, C G, Wettstein, D v., Steffenson, BJ and Kleinhof, A (2006): Subcellular Localization and Functions of The Barley Stem Rust Resistance Receptor-like Serine/Threonine-specific Protein Kinase Rpg1. PNAS 103, 7518-7523. O'Brien, P A (2008): PCR Primers for Specific Detection of Phytophthora cinnamomi. Australasian Plant Pathology 37, 69-71. Suzuki, S, Taketani, H, Kusumoto, K I and Kashiwagi, Y (2006): High-throughput Genotyping of Filamentous Fungus Aspergillus oryzae Based on Colony Direct Polymerase Chain Reaction. Journal of Bioscience and Bioengineering 102, 572-574. Thines, E, Anke, H and Weber, R W S (2004): Fungal Secondary Metabolites As Inhibitors of Infection-related Morphogenesis in Phytopathogenic Fungi. Mycological Research 108, 14-25. 836 White, T J, Bruns, T D, Lee, S and Taylor, J (1990): Analysis of Phylogenetic Relationships by Amplification and Direct Sequencing of Ribosomal RNA Genes. PCR Protocols: A Guide to Methods and Applications, New York, Academic Press. 837 INAFOR 11P-018 INTERNATIONAL CONFERENCE OF INDONESIAN FORESTRY RESEARCHERS (INAFOR) Pest and Disease Attack on Nyamplung (Calophyllum inophyllum ) Seedling in the Nursery Eritrina Windyarini and Burhan Ismail The Center for Research on Biotechnology and Tree Improvement Jl. Tentara Pelajar Km.15 Purwobinangun, Pakem, Sleman, Yogyakarta 55582, INDONESIA Poster paper prepared for The First International Conference of Indonesian Forestry Researchers (INAFOR) Bogor, 5 – 7 December 2011 INAFOR SECRETARIAT Sub Division of Dissemination, Publication and Library FORESTRY RESEARCH AND DEVELOPMENT AGENCY Jl. Gunung Batu 5, Bogor 16610 838 Pest and Disease Attack on Nyamplung (Calophyllum inophyllum ) Seedling in the Nursery Eritrina Windyarini and Burhan Ismail The Center for Research on Biotechnology and Tree Improvement Jl. Tentara Pelajar Km.15 Purwobinangun, Pakem, Sleman, Yogyakarta 55582, INDONESIA ABSTRACT Nyamplung (Calophylum inophyllum) has potential ability to be plant protectors of shore and sea wave, abrasion, and alternative biofuel. These characteristic impacts on the growing needs of seedlings to be planted in the field. The availability of quality seedlings of C. inophyllum currently constrained by the presence of damages in the nursery. This study aims to determine the type and cause of damage on C. inophyllum seedlings. Observations made on July – Oktober to all the C. inophyllum seedlings in the CFBTI (Centre Forest Biotechnology and Tree Improvement) nursery (100% sampling intensity) including the type of damages (symptoms and signs), the intensity of their attacks and its control. The results showed that the C. inophyllum seedlings in the nursery CFBTI at the age of 2 months has begun to damage on leaves and stems which caused by attacked of various pest and disease. This type of pest and disease is dominated by aphids (25.11%), thrips (1.27%), black mildew (0.75%), leaf spot (0.43%), and chlorosis (0.07%). Mechanical and chemical control with insecticides containing profenopos active matter (2 ml/L of dose) can decrease the total intensity of damage from 27.64% to 5.31% after 3 months application. Keywords: Pest and disease, C. inophyllum, seedling, control 1. INTRODUCTION A new paradigm of forestry sector viewed the forest as the system resources that are multi-use, multifunctional, and multi of interest for optimalizied people welfare. This paradigm aware us that forest product have comparative excellences to people, exspeciallly people around the forest. One of its kind is Nyamplung (Calophyllum inophyllum) which are currently being favourited now. This condition caused by C. inophyllum characteristic that can be plant protectors of shore and sea wave, abrasion, and alternative biofuel. C. inophyllum is essentially a littoral tree of the tropics, occurring above the high-tide mark along sea coasts of northern Australia and extending throughout Southeast Asia and southern India. It is common on sandy beaches of the seashore but is sometimes found inland on sandy soils. It generally grows on the detritus brought down by rivers and on the sand and shingles banked up by wind and waves. The soil is generally dry at the surface, but the water table is usually only a few decimetres down, although the water it taps is often brackish. It is also found higher up the rivers along river margins. The tree demands light; temperatures where it grows are moderated by the proximity of the sea and by the breezes. The sandy soil, exposed situation, radiation of heat from the sand, and salt-laden winds make the habitat pronouncedly xerophytic (Anonymous, 2011a). The tree usually moderately easy to propagate by seed, provided the seed is sown soon after ripening, and complete removal of the seed shell. Germination and initial growth is slow, however, and seedlings should be started 6 months before they are required. The potential of C. inophyllum impact on the growing needs of seedlings to be planted in the field. Availability of quality seedlings of C. inophyllum currently constrained by the presence of damages in the nursery. 839 2. MATERIAL AND METHOD 2.1 Time and Location This research was conducted on July to Oktober 2011 in CFBTI nursery Yogyakarta. Geographically researce location were on 7040‘30‖ south latitude and 110023‘23‖ east longitude, while administratively in Purwobinangun village, Pakem subdistrict, Sleman Regency, DIY Province. Research located at an altitude of 287 m below sea level, 1.878 mm/year rainfall precipitation, 270C of temperature, and 73% relatively humidity (Mashudi, 2009). 2.2 Research Materials and Tools Research materials used C. inophyllum seedlings from population of Gunung Kidul, profenopos insecticide and plastic cap. Research tools used scissors cuttings, sprayer, handcounter, stationery and camera. 2.3 Methods Obsevations was made to all C. inophyllum seedlings in CFBTI nursery (100% sampling intensity). observed parameters were type of damage (by descriptive-qualitative), attack percentage, and dominant damage control. Attack Percentage = Number of attacked plants x 100% Totally plant observed 3. RESULT AND DISCUSSION 3.1 Type of Damage Several damages was found on Nyamplung (C. inophyllum) seedlings in CFBTI nursery at age of two months. Based on observations the damage caused by various pest and disease as follows: 3.1.1 Aphids Aphids caused the most dominant damaged on C. inophyllum seedlings. Leaves and shoot curling and wilt was the initial symptoms for aphids attacked. Eggs of aphids were found inside the curling leaves. Further damage, leaves and shoots become brownish and fall. Aphids are roughly 1/10th of an inch long. The most common colors are green and black, though brown, reddish-brown, and gray aphids inhabit some parts of the country.Aphids suck the sap out of tender plant shoots and leaves. They suck the sap in through their beak-like mouths, while injecting leaves with their saliva. Drinking the sap can weaken the plant, and injecting their saliva can spread diseases from plant to plant. In addition, aphids excrete a sticky, clear substance called "honey dew" which commonly develops sooty mold. Sooty mold is unsightly and interferes with the plant's ability to photosynthesize. Aphids can weaken a plant, stunt its growth, cause leaves to curl or wilt, and delay fruit or flower production (Vanderlinen, 2011). Damage by aphids on C. inophyllum also reported in Lombok Tengah, NTB (Anonymous, 2007). Damage by aphids is shown in Figure 1. 840 a b c Figure 1: Damage by aphids; a. white aphids, b. black aphids, c. adult aphids 3.1.2 Thrips Thrips are very tiny insects (about 1/50th of an inch), but signs of their feeding are very noticeable. Thrips are mainly plant feeders, sucking up fluids from leaves, flowers, and fruits, though same may feed on pollen, fungal spores, or are predatory. Thrips (nymphs and adults) scrape plant tissue to induce the flow of plant juices. This scraping causes the tissue to desiccate and gradually enlarge to form a ‗window‘. The greenhouse thrips causes rind blemish problems on developing citrus fruit (i.e., ring spotting or irregular russeting), on immature and mature clustered fruit, or where a leaf or twig is in direct contact with a fruit. Thrips also pose a serious threat to crops by virus transmission. Thrips can transmit TOSPO viruses. Fully-grown nymphs drop to the growing media (some reports indicate 90% - 95% of the Western Flower Thrips drop to the growing media - the remainder pupate on the plants) and go through a pre-pupae and pupae stage before emerging as an adult and climbing up the plant to feed, mate and repeat their life cycle. Adult thrips are capable of flying. Thrips are capable of pupating and multiplying most rapidly during periods of warm, dry weather. Young leaves and twigs on C. inophyllum seedlings attacked by thrips (Figure 2.) Young leaves are susceptible to attack from thrips, but trees usually outgrow infestations (Friday and Okano, 2006). Figure 2: Damage by thrips on leaf and twigs 841 3.1.3 Black mildew (by Capnodium sp., Meliola sp.) Black mildew is the charcoal-black fungus that appears as a black coating on the surface of leaves, fruits, twigs and branches of many deciduous and evergreen trees and shrubs. Black mildew is not pathogenic to plants but this fungus gets its nourishment from insect honeydew. Honeydew is a clear and sticky substance produced by insects and is dropped on the leaves and twigs. The mold spores are wind-blown to the plants and stick to the honeydew giving them a suitable medium for growth. Once these spores germinate, they send out black fungal strands which cover the plant tissue and cause the discoloration. This results in a heavy coat of black mold that may build up on needles and twigs (Figure 3). The black mildew on plant leaves acts as a shield against the sunlight which diminishes the plant's capacity to produce food (Anonymous, 2011b). Figure 3: Damage by black mildew 3.1.4 Leaf Spot Leaf spot disease caused by several fungus such as Pestalotia sp., Curvularia sp., Lasidiplodia sp., Cercospora sp. and Helminthosporium sp. A leaf spot disease creates spots on foliage. The spots will vary in size and color depending on the plant, the organism involved and the stage of development. Spots are most often brownish, but may be tan or black. Concentric rings or a dark margin around the spot may be present. Over time the spots may combine to enlarge and form blotches (Figure 4). Spots or blotches that are angular and located around the veins are generally referred to as anthracnose. Leaves may yellow and drop prematurely. Like in CFBTI nursery, Pestalotia sp also caused leaf spot on C. inophyllum in Kiribati and Tonga (Ramsden et al., 2002). Figure 4: Damage by leaf spot 842 3.1.5 Chlorosis Chlorosis is a symptom of plant disease in which normally green tissue is pale, yellow, or bleached (Figure 5). It results from failure of chlorophyll to develop because of infection by a virus; lack of an essential mineral or oxygen; injury from alkali, fertilizer, air pollution, or cold; insect, mite, or nematode feeding; gas main leaks; compaction or change in soil level; and stem or root rot. Severely chlorotic plants are stunted, and shoots may die back to the roots. Figure 5: Damage by chlorosis 3.2 Attack Percentage Type of damage Attack percentage is the proportion of plants in a population afflicted by plant without attack level calculate. C. inophyllum pest and disease has various attack percentage in the CFBTI nursery (Figure 6) and caused several damages. Those attack begin at 2 months of C. inophyllum seedlings. Damage by aphids rapidly increased in the nursery. Attack percentage of aphids raise from 10.93% to 25.11 % only on 3 weeks after the first attacked. This is the main pest caused dominant damage on C. inophyllum seedlings. Another damages with less attack percentage caused by thrips (1.27%), black mildew (0.75%), leaf spot (0.43%), and chlorosis (0.07%). Chlorosis Leaf Spot Black Mildew Thrips Aphid 0,00 10,00 20,00 30,00 Attack Percentage (%) Figure 6: Graphic of attack percentage for each type of damage 3.3 Control Control is done with a combination of chemical and mechanically. Mechanically control with seedlings separated, between those healty and damaged. Further control is cutting all of attacked part from the C. inophyllum seedlings with slips scissors. Chemical control done with spraying the profenopos active matter of insecticide 2 ml/L of water dose. Those control done once a week frequently for 3 months. At the end of observation, chemical and mechanically combination control can decrese totally attack percentage from 27.64% to 5.31%. 843 4. CONCLUSION There are various pest and disease attacked on 2 months C. inophyllum seedlings in CFBTI nursery. This type of pest and disease is dominated by aphids (25.11%), thrips (1.27%), black mildew (0.75%), leaf spot (0.43%) and chlorosis (0.07%). Mechanical and chemical control with insecticides containing profenopos active matter (2 ml/L of dose) can decrease the intensity of damage from 27.64% to 5.31% after 3 months application. REFERENCES Anonymous (2007): Buku Statistik Dinas Kehutanan Provinsi Nusa Tenggara Barat Tahun 2007. page 104. Anonymous (2011a): PROSEA: Agroforestry tree http://www.worldagroforestrycentre.org, at 28th November. Anonymous (2011b): Removing black mildew http://www.doityourself.com, at 29th November. on database. Downloaded from plants. Downloaded from Mashudi (2009): Daya trubus pangkasan pulai darat (Alstonia angustiloba Miq.) dari populasi Lubuk Linggau Sumatera Selatan melalui aplikasi variasi media tumbuh dan dosis pupuk NPK. Prosiding Ekspose Hasil Penelitian: Status Terkini Pemuliaan Hutan. BBPBPTH Jogjakarta. Vanderlindeen, C (2011): Aphids. Downloaded from http://organicgardening.about.com at 29th November. Friday, J B and Okano, D (2006): www.traditionaltree.org at 28th November. Calophyllum inophyllum. Downloaded from Ramsden, M, Mc Donald, J and Wylie, F R (2002): Forest Pest in the Sout Pasific Region: A review of the major causal agents of tree disorders. ACIAR Project FST/2001/045 Development of Forest Health Surveillance Systems for South Pasific Countries and Australia. 844 INAFOR 11P-019 INTERNATIONAL CONFERENCE OF INDONESIAN FORESTRY RESEARCHERS (INAFOR) Growth and Proliferation of Embryogenic Callus of Sandalwood (Santalum album L.) Toni Herawan The Center for Research on Biotechnology and Tree Improvement Jl. Tentara Pelajar Km.15 Purwobinangun, Pakem, Sleman, Yogyakarta 55582, INDONESIA Poster paper prepared for The First International Conference of Indonesian Forestry Researchers (INAFOR) Bogor, 5 – 7 December 2011 INAFOR SECRETARIAT Sub Division of Dissemination, Publication and Library FORESTRY RESEARCH AND DEVELOPMENT AGENCY Jl. Gunung Batu 5, Bogor 16610 845 Growth and Proliferation of Embryogenic Callus of Sandalwood (Santalum album L.) Toni Herawan The Center for Research on Biotechnology and Tree Improvement Jl. Tentara Pelajar Km.15 Purwobinangun, Pakem, Sleman, Yogyakarta 55582, INDONESIA ABSTRACT Sandalwood (Santalum album L.) is a tropical tree of importance for its scented heartwood and sandalwood oil. The increase population, poverty, poor management of natural resources, and natural disaster cause some species , according to IUCN (The International Union for Conservation Nature and Natural Resources) Sandalwood is one of the tree species classified in both category admission/VU A1D1 and critical/EN A1A2, this means that there is a serious need to save guard those species and to do mass regeneration. One of solution which can be done is the application of biotechnology in particularly somatic embryogenesis. Somatic embryogenesis, the formation and development of embryos from somatic (vegetative) tissues under in-vitro condition. This research was conducted to determine the procedure for callus proliferation up to somatic embryo germination of Sandalwood (Santalum album). Somatic embryogenesis sandalwood was obtained from select only young, partially expended, light green, ±2 cm long leaves for explant tissue. Surface disinfest the leaves first by immersing in 70% ethanol for 30 sec, following by gently agitating in 2% sodium hypochlorite for 10 min and finally rinsing three times with sterile distilled water. Callus proliferation was conducted on solid medium in the dark culture room with 5mg/l 2,4-D and 0.1 mg/l kinetin. The treatment for somatic embryo maturation were kinetin (0.1; 0.2; and 0.3) mg/l. Whereas for somatic embryo germination half strength MS without plant growth regulators (PGR). Somatic embryo maturation and germination were incubated at 24o±2oC in light cycle of 16/8 hours (1,700 – 2,000 lux by fluorescent lamp). Within 12 weeks, small and yellowish clumps of compactly packed cell developed on cultured explant. These cell clumps differentiated numerous globular embryos when to sub-culture monthly on the MS medium containing 5 mg/l 2.4-D and 0.3 mg/l Kinetin. The addition of 0.1 mg/l kinetin improved somatic embryo maturation of Sandalwood. The addition half strength MS without PGR enhanced significantly the germination of somatic embryos. Well developed cotyledons were separated and sub-cultured to same medium for germination. From 1569 plantlets obtained, 462 (29%) of them were normal. Keywords: Santalum album, somatic embryogenesis, callus proliferation, plant growth regulators 1. INTRODUCTION Sandalwood tree yield very saleable sandal wood oil in international market. According to Vernes (2003) estimate request to sandalwood heartwood about 20000 ton per year. Indonesia, Fiji, Australia, and India is nations having big contribution in accomplishment of request to sandalwood. Sandalwood oil to extract from sandalwood heartwood and exported to USA, Singapore, Taiwan, and European Countries for cosmetic and perfume according Rohadi et al. (2000). According to Rohadi et al. (2000) beside marketed out country, sandalwood also marketed locally especially sold to Bali. In this area of sandalwood oil is applied at religious event. For local marketing, commodity coming from sandalwood in the form of prayer beads, rosary, woodcarving, incensed, and sandal wood oil. 846 For local marketing, request of the biggest sandalwood come from is industrial of wood processor in Kupang. In the year 2000 noted there is 4 is industrial processing of sandal wood oil, 24 is industrial of souvenir and 14 is industrial incensed. Total the industrial capacities about 4000 ton (Rohadi et al., 2000). Sandalwood which exploited in East Nusa Tenggara (NTT) come from natural stand ( Rohadi et al., 2000). So in this time there is no readily forest plantation supplied requirement of sandalwood. Sandalwood is forest product non wood which emergence naturally in Province NTT disseminating naturally in Sumba Island, Timor, Solor, and Alor (Surata, 2001). Natural sandalwood potency these days have been is decline because various problems especially imbalances between exploitations and plantations establishment. Degradation of this sandalwood potency happened among : degradation of amount of sandalwoods trees populations equal to 53.95% since range of time of 1987 - 1997 ( Forest Service, 1998), degradation of oil rate santalol is previous 5 - 7% (Haffner, 1993) now become 1.75 – 2.5% (Hartono, 2000), degradation of heartwood production per tree where in the year 1987 - 1990 mean equal to 100 kg/trees present become 35 kg/trees (Susila, 2000), and degradation of previous sandalwood seed germination 60 - 80% now become 30 - 40% (Surata, 2000). In Sumba Island sandalwood plant come near destruction and in Timor Island also if no effort for doing saving. Upgrading of sandalwood potency through establishment of forest plantation truely have often executed by Forest Service of Province NTT. Even establishment of forest plantation is done long time, that is since year 1924 in Timor Tengah Selatan (Machmud, 1975). Still year 1997 noted by is effort of establishment forest plantation have reached 2,264.85 ha (Forest Service of Province NTT). However, growth of sandalwood stands which have established up still now (quantitative data) is mostly not yet been known. This possibility of forest stands have many experiencing failure of evaluated from the emergences gratuities. So that stand which remains this time, don't flatten and disseminate sporadically. Failure of development of forest plantation of sandalwood we is prediction because until so far unprecedented cropping of sandalwood legally coming from forest plantation establishment. Sandalwood is tree with a long period to harvest. According to Venkatesan (1979) heartwood (contain sandal wood oil) newly formed at the age of 20 year with a period of cutting away about 60 year. At the age of the contents of sandal wood oil about 10 % from heartwood weight. From the aspect of economic entrepreneurship of sandalwood is solution for lessening level of unemployment and increase level of economic matter of public. Sandalwood tree producers species have big potency to be made by pledge commodity in NTT, Bali, and Special Region Yogyakarta ( DIY), because this tree suitable with condition of climate in this areas. With good management enabling sandalwood becoming source of main earnings for public there. Sandalwood plant propagation techniques through cuttings, and cuttings root buds have long done, but until now its success is still low, so that can not resolve the procurement of high quality sandalwood seedlings in large numbers. We have developed a technique of axillary bud culture, but its success can not overcome the problem of seed supply in large quantities. To overcome these problems need to be developed a combination of vegetative propagation techniques both conventional and tissue culture to support the quality of sandalwood seedlings in large numbers. Some of these propagation techniques are rejuvenation by using branch soaked in water; aksiler axillary bud culture; somatic embryogenesis techniques; and techniques minicuttings. The third propagation technique described above indirectly attempted to support the propagation techniques of somatic embryogenesis. The research objectives to determine the procedure for callus proliferation up to somatic embryo germination of Sandalwood (Santalum album). 847 2. MATERIAL AND METHOD 2.1 Explant Source Branchs were taken from 6 Years old of superior trees Sandalwood were grown in the genetic conservation area of CFBTI in Watusipat, Playen-Gunungkidul, Yogyakarta, Indonesia (Figure 1). Leaves explant were taken from new sprouting branches of mature trees of Sandalwood were soaked in tap water (Figure 2), select only young, partially expended, light green, ±2 cm long leaves for explant tissue. Surface disinfest the leaves first by immersing in 70% ethanol for 30 sec, following by gently agitating in 2% sodium hypochlorite for 10 min and finally rinsing three times with sterile distilled water and placed individually in 10 ml of MS (Murashige and Skoog, 1962) basal medium. To determine if the explant from tissue culture would response similarly to explants from the field, leaves were taken from axillary shoots multiplied in basal MS media (Murashige and Skoog, 1962) supplemented with 0.5 mg/l BAP (benzyl-amino-purine) and 0.01 mg/l NAA (naphthalene-acetic-acid) and alternately sub-cultured into same basal medium to increase the leaf size. 2.2 Somatic Embryo Induction All basal media contained MS salts and vitamins, 40 g/l sucrose and 10 g/l commercial agar. The pH was adjusted to 5.6 – 5.8 before autoclaving at 121oC, 15 psi for 20 min. Callus proliferation in leaf explant from mature trees was conducted on solid medium with 5 mg/l 2,4D and 0.1 mg/l kinetin. Cultures was maintained at 24o ± 2oC and 60 – 70 % humidity in the dark condition during somatic embryo induction and multiplication. Sub-cultures were routinely performed at 6 week intervals during somatic embryo induction. Somatic embryos were classified as direct or yellowish clumps somatic embryos and friable embryogenic tissue based on their morphology. 2.3 Embryo Maturation and Repetitive Somatic Embryos Sandalwood for somatic embryos and friable embryogenic tissue were transferred to embryo multiplication medium which consisting of basal medium supplemented with 5 mg/l 2,4-D and the effect of Kinetin (0.1; 0.2; and 0.3) mg/l, either for maintenance of embryogenic tissue or further development and maturation of somatic embryos. 2.4 Germination and Plant Development Sandalwood for embryos germination and plant development, somatic embryos at the cotyledon stage were separated and transferred individually to plantlet development medium half strength MS without plant growth regulators (PGR). Somatic embryo maturation and germination were incubated at 24o ± 2oC in light cycle of 16/8 hours (1,700 – 2,000 lux by fluorescent lamp). After 8 weeks, embryo germination were separated and identivyed to two type abnormal and normal germination. The normal germination when the root had elongated and two green cotyledons were present. 3. RESULTS 3.1 Somatic Embryo Induction All basal media contained MS salts and vitamins, 40 g/l sucrose and 10 g/l commercial agar. Callus proliferation in leaf explant from mature trees was conducted on solid medium with 5 mg/l 2,4-D and 0.1 mg/l kinetin. On culture, the frequency of direct somatic embryogenesis and white embryogenic tissue (Figure 3A). Within 12 weeks, small and yellowish clumps of compactly packed cell developed on cultured explant (Figure 3B). These cell clumps 848 differentiated numerous globular embryos when to sub-culture monthly on the MS medium containing 5 mg/l 2,4-D and 0.3 mg/l Kinetin. Various types of calli were observed 12 weeks after culture initiation on the callus induction medium. They were watery, mucilaginous, friable or compact, and their color was palegreen, gray or translucent (Figure 3C). Yellowish white and granular calli appeared secondary on the surface of translucent or mucilaginous callus 8 to 12 weeks after culture initiation. When the callus was transferred by sub-culture to regeneration medium containing 1% commercial agar, globular structures were formed and developed into grain-shaped, club shaped and bananashaped structure (Figure 3D). 3.2 Multiplication of Repetitive Embryogenesis and Maturation When Somatic embryos are mostly in the white globular embryos transferred to maturation medium with 2,4-D 5 mg / l and addition with various concentrations of kinetin, based on morphologic observations further phase of somatic embryos (torpedo and cotyledon) after 8 weeks showed that kinetin 0.1 mg / l allegedly gave a good response to the development of somatic embryos Sandalwood (Figure 3E). 3.3 Germination and Plantlet Development When shoot and root apices of somatic embryos reached up to 5 mm, they were separated and germinated in half strength MS medium without plant growth regulators (PGR). The absence PGR in the medium caused higher abnormal germination, usually lack of root or fused cotyledone. Germination 1569 of buds and shoots to the germination medium of half strength MS without PGR to gave results that 462 (29.4%) plantlet were developed (Figure 3F), and the other caused abnormal germination. Figure 1: Six years old mature trees of Sandalwood 849 Figure 2: Branches of mature trees of Sandalwood were soaked in tap water A B C E D F F Figure 3: Somatic embryogenesis and plantlet formation of Sandalwood (Santalum album) Remarks: (A) Somatic embryo of S. album growing directly on leaf segments cultured in MS medium with 2,4-D; (B) Small and yellowish clumps of compactly packed cell developed on cultured explants; (C) Various stages of repetitive somatic embryos of Sandalwood cultured in medium containing 2,4-D and kinetin; (D) Friable embryogenic tissue growing on top of leaf explant of Sandalwood cultured in MS medium with 0.1 mg/l Kinetin; (E) Germinated somatic embryos of Sandalwood obtained by choosing mature, uniform- sized cotyledonary somatic embryos before transferring to germination medium; (F) Plantlet formation derived from somatic embryos of Sandalwood, the plant on the right has been cultured in solid medium. REFERENCES Anonymous (1998): Dinas Kehutanan Propinsi NTT. Lopran Inventarisasi Cendana (Santalum album L.) di Pulau Timor. Dinas Kehutanan Propinsi NTT. Anonymous (2006): Pusat Penelitian dan Pengembangan Hutan Tanaman. Data Base Jenis-jenis Prioritas (untuk konservasi genetik dan pemuliaan). Buku 2. P3HT, Yogyakarta. Bonga, J M and Durzan, J D (1987): Cell and Tissue Culture in Forestry. Martinus Nijhoff Publishers, Netherlands. Hirimburegawa, K and N Gamage (1994): In-vitro Callus and Cell Cultures of Gossypium Hirsutum L. (Cotton). Jurnal of Natn. Sci. Coun. Sri Lanka 22(4): 305-312. 850 Pierik, R L M (1987): In-Vitro Culture of Higher Plant. Martinus Nijhoff Publisher. Netherland. Street, H S (1977): Plant Tissue Culture and Cell Culture. University of California Press. 1977- p 614. Surata, I K and M M Idris (2000): Status Penelitian Cendana di Propinsi Nusa Tenggara Timur. Berita Biologi. Edisi Khusus Vol. 5 No. 5. Pusat Penelitian Biologi-LIPI. Jakarta. Wetter, L R and F Constabel (1982): Metode Kultur Jaringan Translated by Widianto M. B dan S. Achmadi. 1991. Penerbit ITB, Bandung 851 INAFOR 11P-020 INTERNATIONAL CONFERENCE OF INDONESIAN FORESTRY RESEARCHERS (INAFOR) Identification for Some Rattan Species on Region Ingkwosi Forest Area Manokwari District Titi Kalima1 and Jasni2 1The 2The Center for Research and Development on Forest Conservation and Rehabilitation Jl. Gunung Batu 5, Bogor 16610, INDONESIA Center for Research and Development of Forestry Engineering and Forest Products Processing Jl. Gunung Batu 5, Bogor, 16610, INDONESIA Poster paper prepared for The First International Conference of Indonesian Forestry Researchers (INAFOR) Bogor, 5 – 7 December 2011 INAFOR SECRETARIAT Sub Division of Dissemination, Publication and Library FORESTRY RESEARCH AND DEVELOPMENT AGENCY Jl. Gunung Batu 5, Bogor 16610 852 Identification for Some Rattan Species on Region Ingkwosi Forest Area Manokwari District Titi Kalima1 and Jasni2 1The 2The Center for Research and Development on Forest Conservation and Rehabilitation Jl. Gunung Batu 5, Bogor 16610, INDONESIA Center for Research and Development of Forestry Engineering and Forest Products Processing Jl. Gunung Batu 5, Bogor, 16610, INDONESIA ABSTRACT Being an important non wood forest product, rattan has to be managed in a sustainable fashion. In Indonesia there are about 300 species of rattan grow naturally. While accurate species identification is very important in rattan management, it is still a major problem at present due to lack of identification for some rattan species found in Ingkwosi forest area Manokwari District. Keywords: Identification, rattan, Manokwari District 1. INTRODUCTION Rattans are spiny climbng palms. The stems of some species are used to make furniture, mats, baskets etc.commercially and for household use. Classified into Divisio Spermatophyta, Sub Divisio angiosperms, Class Monocotyledonae, Spacadiciflorae Order, Family or Family Palmae (Arecaceae), with Marga Calamus, Daemonorops, Korthalsia, Caratolobus, Plectocomia, Calospatha, Myrialepis, Plectocomiopsis, Pogonotium and Retispatha (Uhl and Dransfield, 1987). The Indonesia island can be devided into seven groups, those are Sumatera, Kalimantan, Sulawesi, Maluku, Java, Nusa Tenggara (including Bali and Timor), and Irian. The rattan species in each island is defferent. Rattan is one of the important minor products found abundant in Manokwari forests. It usually grows at low and medium elevations in the virgin forest and occasionally in thickets or in the second-growth forest but never in the open field. Manokwari is located in a north coast of the Bird‘s Head area of Papua Island, the area is administratively belong to the District Manokwari, West Papua Province. Manokwari is one area which has large enough of natural forests and overgrown of rattan species. In this area, Ingkwoisi sites were observed for the present of the rattan species. In this report, the observation at the Ingkwoisi site is the data of rattan species found (Baker and Dransfield, 2006). Unfortunately, knowledge about the morphology characteristic of rattan species is still very limited. 2. MATERIAL AND METHODS 2.1 Location Research. Exploration activity was conducted on 30 May - 8 June 2011 at Manokwari District locations namely Ingkwoisi forest area. The forets condition in this area remains good. Study site has a wet tropical climate with minimum air temperature 21.5°C (August and November) and a maximum temperature of 33.1°C (January and March). Rainfall is quite high, about 2,283 mm/year (in March). Topography flat to undulating. While the existing soil types generally consist of ground limestone kemerahaan, alluvial soil deposits and young alluvial soil, coordinate 0°52′S 134°05′E (http://id.wikipedia.org/ wiki/Kabupaten_ Manokwari). 853 2.2 Materials Materials needed are alcohol, plastic bags (40 cm x 60 cm), Sacks raffia, etc. The equipment required include: working map scale 1:10,000, twigs scissors, gloves, knife, compass, GPS, altimeter, helling meters, thermohygrometer, camera, stationery, meter roll, tally sheet, etc. 2.3 Methods In this study, to obtain the primary data from rattan species, a thorough exploration and collection of all rattan species material both fertile and sterile were executed. The sampling plot method was used. Each sample plot measure 200 m by 10 m (Muller-Dombois and Ellenberg, 1974). The observation parameters used are habitus, morphology characteristics. Also doing well in measuring the diameter of stem, the material of rattan herbarium of each species recorded were collected and identified in Research and Development Center for Conservation and Rehabilitation, Bogor. 3. RESULT AND DISCUSSION 3.1 Diversity of Rattan Species Based on exploration results at Ingkwoisi sites in lowland primary, Manokwari District, has identified four rattan species of two genera, Calamus aruensis Beccari, C. warburgii K.Schum, C. pachypus WJ Baker & al. and Korthalsia zippelii Blume . The following are botanical notes of the genera which are present in the Table 1. Table 1. List of rattan species at the Ingkwoisi forest area in Manokwari District No Species Grow 1. 2. 3. Calamus aruensis Beccari Calamus pachypus WJ Baker & al. Calamus warburgii K. Schum. cluster 4. Korthalsia zippelii Burret Solitary cluster cluster Diam.of stem without sheaths (mm) Diam.of stem with sheaths (mm) Internodes lengths (cm) climbing to ols 9.82 – 22.27 15 - 20.11 9.65 – 19.61 24 – 26.46 25.32 – 46.11 20.12 – 26.32 12 - 18 10 - 25 16 - 35 Cirus Cirus Cirus 16.81 – 33.27 52.57 – 57.56 16 - 25 Cirus 3.1.1 Calamus Calamus is a genus of rattans of the climbing palms, the main use of this plant is its cane. The cane mainly use for rattans furniture. New Guinea consists of about 50 species of Calamus (Essig, 1977). Among them 15 species occur is Papua. In the area of study, there were four species distributed in Ingkwoisi (Manokwari) forest area, Calamus aruensis, C. pachypus and C.warburgii. 3.1.2 Korthalsia In New Guinea Island the genus consists of two species, widespread in the lowland. In Ingkwoisi (Manokwari) namely K. zippelii. 3.2 Morphological Characteristics 3.2.1 Calamus aruensis Beccari Synonim: C.hollrungii Beccari, Calamus latisectus, Palmijuncus aruensis, Local name: Distribution: Kepulauan Aru, Kepulauan Solomon dan Australia, New Guinea, Manokwari (Papua Barat), Sumatra. 854 Description Stems clustering high climbing rattan with stems up to 25 m. Stem with sheaths of 24 mm – 26.46 mm in diameter, without sheaths 10.90 mm – 22.27 mm in diameter, internodes between 12 cm - 18 cm lengths. Stem green - grayish-white. Leafsheaths dark green, and armed with short black irregularly arranged spines, to 20 mm length by 3 mm width at the base,flat triangular shape. Knee conspicuous, green, no spines. Leaves cirrate included cirrus, cirrus up to 153 cm length with black claws; petiole about 2 cm length. Leaflets 17 on each side of the rachis, irregularly arranged, lanceolate, apex acuminate, base acute, middle longest about 32 cm - 35 cm length by 7 cm - 8 cm width, the surfaces green colours, leaflets hugging the base of the stem. Venation longitudinal and parallel with 8 – 10 parallel veins. Inflorescence to 2.7 m long, branched. Staminate flowers 2-3.2 x 1-1.5 mm in bud, opening to 2-4 mm wide; sepals 1-1.2 mm long, 0.8-1 mm wide, basally connate, lobes triangular, light green, glabrous;petals 1.8-2 mm x 0.9-1 mm, light green; stamens 1.8-2 mm long, anthers; pistillode present. Pistillate flowers 2-2.7 x 1-1.2 mm, green glabrous. Sterile staminate flowers also present. Fruit large, about 2 m long. Individual fruits about 9-11 x 9-12 mm, clothed in overlapping diamond-shaped, shingle-like scales. Stalks about 2-2.5 mm long, perianth persistent at the base of the fruit. Seeds globular, about 7-8 mm diam. a b c d Figure 1: Calamus aruensis Beccari, a. Young fruit, b. Leafsheath, c. Old fruit, d. stem (Photo by Titi Kalima) 855 3.2.2 Calamus pachypus WJ Baker &al. Local name : Hele bu (Yali), Kour (Biaru), kur (Karkar), mambile (Yali), meya (Arfak Plains), tendu Mundu (Berap) ( Baker, et al., 2003 ) Distribution : Manokawari, Irian Jaya, Papua New Guinea, Bismarck Archipelago Description Stems solitary high climbing rattan with stems up to 25 m. Stem with sheaths 30 mm – 50 mm in diameter, without sheaths 14,81 mm – 27,36 mm in diameter, internodes between 10 cm - 38 cm lengths. Stem cream or whitish yellow. Leafsheaths green, and armed short with redish brown arranged like a comb, slender spines, to 5 mm – 25 mm length. Knee conspicuous, green, no spines, 7 cm length. Ocrea conspicuous. Leaves cirrate included cirrus, cirrus up to 132 cm 152 cm length with black claws; petiole about 5 cm length. Leaflets 20 on each side of the rachis, irregularly arranged, lanceolate, apex acuminate, base acute, middle longest about 9 cm - 33 cm length by 2 cm - 8 cm width, the surfaces green colours, leaflets hugging the base of the stem. Inflorescence to 1,64 m long, branched 5. Fruit large, oval, green. a b c Figure 2: Calamus pachypus WJ Baker & al.: a.Leafsheath; b.fruit, c. wet rattan stems (Photo by Titi Kalima) 3.2.3 Calamus warburgii K. Schum. Local name: 856 Distribution: Papua New Guinea (Provinci Madang), Manokwari (Papua Barat), Australia, Maluku Description Stems clustering high climbing rattan with stems up to 20 m. Stem with sheaths 20 mm – 25 mm in diameter, without sheaths 9,65 mm – 19,61 mm in diameter, internodes between 16 cm 35 cm lengths. Stem yellowish green. Leafsheaths green, and armed short with brown arranged like a comb, slender spines, to 30 mm – 60 mm length, the mouth leafsheath spiny to 60 mm. Knee conspicuous, green, no spines. Ocrea conspicuous. Leaves to 147 cm length, cirrus up to 111 cm length with black claws; petiole about 5 cm – 7 cm length. Leaflets 57 – 60 , on each side of the rachis, regularly arranged, lanceolate, apex acuminate, base acute, No fruit. b a C Figure 3: Calamus warburgii K.Schum; a.Leaf sheath; b.fruit, c. wet rattan stems (Photo by Titi Kalima) 3.2.4 Korhalsia zippelii Burret Synonim : Ceratolobus plicatus; Ceratolobus zippelii; 857 Local name : Inuwai Distribution : Irian Jaya, Timika, Fak-Fak, Maokwari, Papua New Guinea (Madang, Popondetta, Markham, Gunung Bosavi, Kantobo, Danau Kutubu) Description: Stems clustering high climbing rattan with stems up to 25 m. Stem with sheaths 52,57 mm – 57,56 mm in diameter, without sheaths 16,81 mm – 33,27 mm in diameter, internodes between 16 cm - 25 cm lengths. Stem cream. Leafsheaths green - grayish-white, and armed with short black irregularly arranged spines, flat triangular shape. No knee. Ocrea very large and conspicuous, expanded, funnel-shaped, net-like, enclosing the stem. Leaves to 287 cm length, cirrus up to 180 cm length with black claws; petiole about 16 cm length. Leaflets 14 on each side of the rachis, broad diamond-shaped, bright green on the upper surface, whitish on the undersurface, irregularly arranged. Inflorescence with branched 5. a b c d Figure 4: Korthalsia zippelii Burret; a.Habitus; b. Leaf and ocrea; c. Herbarium material; d. wet rattan stems (Photo by Titi Kalima) 858 4. CONCLUSION AND RECOMENDATION 1. The lowland forest areas Ingkwoisi is found four rattan species, Calamus aruensis Beccari, C. warburgii K. Schum. and Korthalsia zippelii Burret are clumps growing and solitary growing is Calamus pachypus WJ Baker & al. 2. The morphological properties on climbing device Calamus aruensis Beccari is cirus equipped with thorn sarrayed spread climbing when compared with other namely thorns on climbing equipment arranged in groups 2-4. 3. With abundant of rattan species in the forest area ingkwoisi, Manokwari District, it is necessary to continue research for the future. REFERENCES Baker, W J and J Dransfield (2006): Field guide to the palms of New Guinea. Kew. 108 pp. Essig, F B (1977): A preliminary analysis of the palm flora of New Guinea and Bismarck Archipelago. Papua New Guinea Botany Bulletin 9. Mueller-Dombois, D and Ellenberg (1974): Aims and Methods of Vegetation Ecology. New York: John Willey and Sons. Uhl, N W and J Dransfield (1987): Genera Palmarum : A clasification of palms based on the work of Harold E.Moore,Jr.Allen Press.Kansas. 859 INAFOR 11P-021 INTERNATIONAL CONFERENCE OF INDONESIAN FORESTRY RESEARCHERS (INAFOR) Puccinia meibomiae (Uredinales) of Erythrina crista-galli in Indonesia Dono Wahyuno Indonesian Medicinal and Aromatic Crops Research Institute Indonesian Agency for Agricultural Research and Development (IAARD) Jl. Tentara Pelajar No.3, Bogor, 16111 INDONESIA Corresponding email: [email protected] Poster paper prepared for The First International Conference of Indonesian Forestry Researchers (INAFOR) Bogor, 5 – 7 December 2011 INAFOR SECRETARIAT Sub Division of Dissemination, Publication and Library FORESTRY RESEARCH AND DEVELOPMENT AGENCY Jl. Gunung Batu 5, Bogor 16610 860 Puccinia meibomiae (Uredinales) of Erythrina crista-galli in Indonesia Dono Wahyuno Indonesian Medicinal and Aromatic Crops Research Institute Indonesian Agency for Agricultural Research and Development (IAARD) Jl. Tentara Pelajar No.3, Bogor, 16111 INDONESIA Corresponding email: [email protected] ABSTRACT Erythrina crista-galli is South American original tree. The tree is fast growing type and adapted to various agrecological zone. In Indonesia, the tree commonly planted in yard or along the high way as ornamental tree due to its beautiful shape and color of the flower. Recently leaf spot disease was found from leaves of E. crista-galli collected from various areas in Indonesia, and there is no report the occurence of the rust species of this tree in Indonesia. The present study aimed to identify the rust species based on its morphological characteristics. Thin section of the sample of diseased leaf placed in glass slide with a drop of lactophenol solution for observation under light microscope. Shape, size, color, surface structure of the spores and the fruiting bodies were recorded. The obtained data was compaired with references and other rust species of Erythrina of Indonesian origin for identification. The results indicated that the rust of E. crista-galli is Phakopsora meibomiae, and the uredinial state only exists in Indonesia. P. meibomiae was found from the leaf samples of E. crista-galli collected from West Java, East Kalimantan, North Sulawesi and Bengkulu. Keywords: Erythrina crista-galli, Phakopsora meibomiae, rust fungus, uredinales 1. INTRODUCTION Erythrina spp. (Coral tree) are light-weight hard wood tree, grow perennially and distributed widely from South America, Asia, Africa and Australia. Among 110 species of Erythrina, 70 species have been reported in South America and six to eight species are Malesia origin (Yusuf 1998). that present in Indonesia. In Indonesia, farmers do not use the timber of the Erythrina tree for commercial purposes, but they use this plant as shading tree due its botanical nature of the plant, i.e. relatively drought resistant and growing quickly. Two species of Erythrina, Erythrina fusca L. and E. variegata K&V are common trees that planted in black pepper garden as live post, especially in areas where black pepper is source of income of farmers in Lampung and Bangka-Belitung and Province. While in other areas the plant are used as shading tree for coffee, piper betle, piper retrofractum and others. Leaves of E. fusca also reported to be used against varicella and pruritus (EISAI, 1986); to heal cough, toothache, or relief fever of children (Yusuf, 1998). In Indonesia, there are no serious pests and diseases has been reported attacking E. fusca except the occurrence of wasp (Hymenoptera) which caused gall on young shouts and defoliated wide areas of Erythrina spp in Lampung in 2006 (Mardiningsih and Wahyuno, 2006). Two fungal species of rust fungi, Ravenelia erythrinae Gäum and Phakopsora pachyrhizi H. Sydow and Sydow (Phakopsora erythrinae Gäum) had been reported on Erythrina spp. In Indonesia (Boedijn 1960; Semangun 1992). Recently, an introduced Erythrina crista-galli L. has been planted widely in Indonesia as shading tree or ornamental, from garden to side road of highway, due its exotic ornamental flower. However, some samples of E. crista-galli collected from several areas in Indonesia show 861 consistency the presence of rust disease on its abaxial surface. The aims of the present paper are identify the rust species on E. crista-galli and discussing the identity of the rust species on other Erythrina species in Indonesia based on its morphological characteristics. 2. MATERIAL AND METHODS The observation was conducted in plant pathology laboratory of Indonesian Medicinal and Aromatic Crops Research Institute (IMACRI) in Bogor from March to October 2011. The observed samples were the rust fungi naturally infected leaves of E. crista-galli and the rust of Erythrina spp. (Table 1). The samples of E. crista-galli collected from various areas of Indonesia. The samples were preserved as dry material (herbarium) prior observed, and the specimens were deposited in Herbaria of IMACRI (HBI-Bal). Table 1. List of observed specimens No. Code Host Location Date 1. 2. 3. 4. 5. 6. 7. 8. 9. 10. 11. 12. 13. 14. 15. 16. HBI-Bal 513 HBI-Bal 518 HBI-Bal 520 HBI-Bal 523 HBI-Bal 525 HBI-Bal 526 HBI-Bal 527 HBI-Bal 529 HBI-Bal 530 HBI-Bal 531 HBI-Bal 532 HBI-Bal 533 HBI-Bal 534 HBI-Bal 514 HBI-Bal 515 HBI-Bal 516 E. crista-galli E. crista-galli E. crista-galli E. crista-galli E. crista-galli E. crista-galli E. crista-galli E. crista-galli E. crista-galli E. crista-galli E. crista-galli E. crista-galli E. crista-galli E. variegata E. fusca E. fusca Bogor, West Java Lembang, West Java Bogor, West Java Cibinong, West Java Samarinda, E. Kalimatan Samarinda, E. Kalimatan Manado, North Sulawesi Jambi, Sumatera Bandung, West Java Cigombong, Sukabumi, West Java Pakuwon, Sukabumi, West Java Semarang-Central Java TMII, Jakarta Cahaya Negeri, Lampung Cahaya Negeri, Lampung Cahaya Negeri, Lampung Dec 7, 2010 Nov 28, 2010 Nov 28, 2010 Oct 26, 2010 Feb 22, 2011 Feb 22, 2011 March 23, 2011 March 25, 2011 April 15, 2011 March 15, 2011 March 9, 2011 July 28, 2011 Oct 9, 2011 Nov 28, 2010 Nov 28, 2010 Nov 28, 2010 Observation was carried out by scraping the fungal structures from the leaf surface and providing hand free section of the fruiting body of the respective samples. The obtained sections were put in slide glass and mounted in a drop of lacthophenol solution, then observed under compound light microscopes (Nikon AFX 2A). The existing morphological characteristic i.e. fungal stage of life cycle, spore size, wall thickness, germ-pore number and its distribution patterns, the presence of paraphysis and its length were measured. The germ pore number and distribution pattern was observed by applying an aniline blue squash technique (Jennings et al., 1989). The existing rust fungal state was named following ontogenic systems of Cummins and Hiratsuka (2003). The surface structure pattern was named based on categories as proposed by Cummins and Hiratsuka (2003) and Lee et al. (1999) 3. RESULTS In the field, at the infected leaves minute yellow spots uredinia sori of the rust noticed on abaxial, and no uredinia on adaxial surface (Figure 1B and 1C). The infected leaves mostly leaves that present at the lower part of the plant, either young and mature leaves. The uredinia are not seen on leaves of petiole nor stem. In general, the infected leaves vary from 0 up to less than 10%. The infected leaves fall prematurely and the uredinia of the fungus still persist on fallen leaves. 862 Microscopic observation revealed that the uredinia globose to subglobe, 73-(112)-153 µm in diameter, the cell wall dark to light brown in color and consist 3 to several layers, and ostiolet (Figure 1D). Urediniospores pedicellate, oblong, obovoid to globose to ellipsoid, light brown to hyaline, echinulate, 18-(23)-29 x 16-(19)-24 µm, cell wall uniform and 0,8-(1)-1,3 µm thick (Figure 1D). Germ pore obscure, 4-(6)-8 and distributed randomly (scattered) or close to equatorial zone (Figure 1E). Paraphysis exists, hyaline, clavate to and 23-(29)-38 x 5-(7)-10 µm (Figure 1D). The uredinial state only exists and no telial state and other states were found from all the observed samples. Based on the obtained morphological data, especially the germ pore number, distribution pattern and the existing the life cycle. The rust fungus on E. crista-galli in Indonesia was identified as Phakopsora meibomiae (Arthur) Arthur. Figure 1: P. meibomiae of E. crista-galli. (A) Flower of E. crista-galli, (B) Infected leaf with the uredinial mass (→) on abaxial, (C) Mass of uredinia (→) (HBI-Bal 530), (D) Uredinia, urediniospores and paraphyses of P. meibomiae (HBI-Bal 530), and (E) Germ pore distribution pattern of urediniospore P. meibomiae (HBI-Bal 530). 863 4. DISCUSSION Ravenalia and Phakopsora are two common fungi attacking of many species Erythriae world wide. These two genera of rust fungus clearly distinguished from the morphological characteristics of their teliospore. In tropical areas the uredinial state only present. Therefore, the identification of the fungus really on the characteristics of uredinia and urediniospore and supplied by the host range, and their geographic distribution and symptom appearance. Ravenelia platensis Speg has been reported attacking E. crista-galli in Argentina (Lindquist 1982; Deschamps and Wright, 2001; Hernandez and Hennen, 2002). Hypertrophied area often seen on the infected leaves, petioles and young stem. The spermogonial and aecial state often seen on the hypertrophied areas (Hernandez and Hennen, 2002; 2003). Therefore, the Ravenelia is excluded form the suspect as agent of rust disease of E. crista-galli in Indonesia. Two species of Phakopsora, namely P. pachyrizi and P. meibomiae are the rust species of Erythrina spp. (Ono et al., 1992). These two species of Phakopsora are different in their host ranges, beside its telial morphological characteristic and geographic distribution (Ono et al., 1992). The observation of the specimens show that urediniospore germ pore pattern of P. meibomiea of E. crista-galli is different with those of P. pachyrhizi of Eryhtrina spp.; The germ pore of P. meibomiea is randomly distributed (scattered) and close to equatorial zone; and equatorial zone distributed for P. pacyrhizi . P. pachyrhizi is well known rust fungus that attacking many species of legumes in South East Asia. Thaung (2005) reported that uredinial state only of P. pachyrhizi presents on Erythrina spp., Pachyrhizus angulatus Rich. and Glycine max Merrill in Burma. Coomaraswamy (1979) also reported that only uredinial state of P. pachyrhizi (Uredo erythrinae P. Henn) attacking Erythrina spp. velutina in Sri Lanka. Phakopsora is heteroecious rust fungi. Up to present there is no any record considering the alternate host of the P. meibomiea in Indonesia and this is the first record of the fungus in Indonesia. The future study is needed to confirm the host specificity of the fungus with other Erythrina spp. of Indonesian origin. 5. CONCLUSION Phakopsora meibomiea is the causal agent of rust disease in Indonesia and the fungus is widely distribute already in Indonesia. REFERENCES Boedijn, K B (1960): The Uredinales of Indonesia. Nova Hedwigia 1(3,4); 463-495. Coomaraswamy, U (1979): Fungi parasitic on the plants of Sri Lanka. Dept Bot of University Colombo, Sri Lanka. National Council of Sri Lanka. Maitland Place, Sri Lanka. 169 p. Cummins, G B and Y Hiratsuka (2003): Genera of rust fungi. Third Edition. The American Phytopathol. Soc. St Paul Minnesota. 225 pp. Deschamps, J R and J E Wright (2001): Micosis de importancia forestall en el Cono Sur de América. Documento de Trabajo No 74. Universidad de Belgrano. Disponinle en la red: http://www.ub.edu.ar/investigaciones/dt_nuevos/74 _deschamps.pdf. EISAI P T (1986): Medicinal Herb Index in Indonesia. PT EISAI Indonesia. Hernandez, J R and J F Hennen (2002): The genus Ravenelia in Argentina. Myc Res. 106:954-974. Hernandez, J R and J F Hennen (2003): Rust fungi causing galls, witches‘ brooms, and other abnormal plant growths in northwestern Argentina. Mycologia 95:728-755. 864 Jennings, D M, B V Fordlloyd and G M Butler (1989): An aniline blue squash technique for observation of urediniospore germ pores. Mycol Res 92:230-251. Lee, S K and M Kakishima (1999): Aeciospore surface structure of Gymnosporangium and Rostelia (Uredinales). Mycoscience 40:109-120. Lidnquist, J C (1982): Royas de la Republica Argentia y zonas limitrofes. Inst. Nac. Tecnol Agropec., Buenos Aries. Colecc Cient 20. 574 p. Mardiningsih, T L and D Wahyuno (2006): Serangan organisme pembentuk puru pada tanaman dadap (Erythrina spp. ) tajar lada (Piper nigrum) di Lampung. Prosiding Pengembangan Pertanian di Lahan Kering. Ono, Y P Buritica and J F Hennen (1992): Delimitation of Phakopsora, Physopella and Cerotelium and their species on Leguminosae. Mycol Res 96:825-850. Semangun, H (1992): Host Index of Plant Diseases in Indonesia. Gadjah Mada Univ Press. Thaung, M Y (2005): Rust, smuts and their allies in Burma. Australasian Mycologist 24:29-46. Yusuf, U K (1998): Eryhtrina L. Timber trees: Lesser known timbers. In. Plant Resources of South-East Asia. (Eds). M.S.M Sosef , L.T. Hong, S. Prawirohatmodjo. PROSEA, 220-224. 865 INAFOR 11P-022 INTERNATIONAL CONFERENCE OF INDONESIAN FORESTRY RESEARCHERS (INAFOR) Optimation of Somatic Embryos Formation of Shorea pinanga Scheff. Through Suspension Culture Yelnititis The Center for Research on Biotechnology and Tree Improvement Jl. Tentara Pelajar Km.15 Purwobinangun, Pakem, Sleman, Yogyakarta 55582, INDONESIA Poster paper prepared for The First International Conference of Indonesian Forestry Researchers (INAFOR) Bogor, 5 – 7 December 2011 INAFOR SECRETARIAT Sub Division of Dissemination, Publication and Library FORESTRY RESEARCH AND DEVELOPMENT AGENCY Jl. Gunung Batu 5, Bogor 16610 866 Optimation of Somatic Embryos Formation of Shorea pinanga Scheff. Through Suspension Culture Yelnititis The Center for Research on Biotechnology and Tree Improvement Jl. Tentara Pelajar Km.15 Purwobinangun, Pakem, Sleman, Yogyakarta 55582, INDONESIA ABSTRACT Shorea pinanga (Scheff.) is a member of Dipterocarpaceae, that has an important role as a timber product source and tengkawang. Plant multiplication through suspension culture to mass produced of somatic embryo was conducted. The friable callus was used as explant. Murashige and Skoog (MS) medium supplemented with vitamin of B group, 30 gr/l sucrose and 8 gr/l agar, was used as basal medium. The experiment was conducted in two stages i.e embryogenic callus induction and somatic embryos induction. The embryogenic calli was initiated by the treatment of 4.0 – 5.0 mg/l 2,4-D. For induction of somatic embryo, the embryogenic callus was cultured on the medium supplemented with 1.0 – 3.0 mg/l kinetin. The observation was made on period of embryogenic induction, percentage of embryogenic callus, texture and colour of embryogenic calli resulted, number and performance of somatic embryos resulted. The experimental Designed used was Complete Randomized (CRD) with ten replicates. The results showed that the medium supplemented with 2,4-D 5.0 mg/l was the best for embryogenic callus induce. The embryogenic callus inducted was 100% on 10 weeks cultured, friable on performance and yellowish and whitish on colour. The medium supplemented with 1.5 mg/l kinetin was the best treatment to induce somatic embryo and embryo somatic is normal. Keywords: Embryogenic callus, Shorea pinanga Sheff., somatic embryo 1. INTRODUCTION Dipterocarps are predominant species in major tropical forest in Indonesia, that have a high export value. As it is know already the problem of biodiversity lost in Indonesia, Dipterocarps forest has reached on alarming stage. Therefore, the establishment forest Dipterocarps in Indonesia needed to reach. Shorea spp. is one of the most important Dipterocarps genera. The genus Shorea has a large number of species, with more than 180 species identified, most of which are indigenous species that are very important to be conserved as well as needed to support of the rehabilitation programme in their natural habitats. Shorea pinanga Scheff. is one of the species belonging to Dipterocarpaceae family that has an important role as timber product source and also non forest timber product (tengkawang). The wood can be used for various purpose such as pulp materials, construction, plywood, furniture, joinering and flooring. This species is also called as red meranti or ―meranti merah‖ and categorized as fast growing species. The increase of wood demand every year cause the decrease of production of natural forest, since there was no sufficient effort to balance between harvesting/logging and regeneration. Considering some aspects mentioned above this species is highly recommended for industrial forest plantation, reforestation and other plantation program. The industrial forest plantation (HTI) program using meranti has not showed consirable success for various reasons, and mainly because there has not enough and continuous provision of planting stocks especially when genetically improved planting stocks are required. Artificial regeneration of this species pose many problems such as: (a) it‘s seed characteristic that is recalcitrant or can not to be stored for a long period, and (b) the irregularity period of fruiting every four or five year. 867 Tissue culture as a relatively new technique offering possibility in tackling some problems in plant propagation to supply of planting stocks. Plant propagation by tissue culture can be done in three ways namely: adventive shoot formation, lateral shoot formation and somatic embryogenesis. Somatic embryogenesis is one of the tissue culture techniques that has advantage compare to other two techniques such as planting stocks obtained originated from single cell, have bipolar structure that are one polar in this structure into shoot and the other polar into root. And so planting stocks obtained through somatic embryogenesis will be more than the other two techniques because from one cell of callus will be somatic embryo and the end can be planting stoks. Suspension culture is somatic embryogenesis technique that conducted with use liquid medium. The purpose of this study is to obtain the most appropriate somatic embryos proliferation methode of Shorea pinanga Scheff. through suspension culture, that can be useful for further application. 2. MATERIAL AND METHODS The experiment was conducted at Biotechnology of Tissue Culture Laboratory, Centre for Forest Biotechnology and Tree Improvement, Yogyakarta, Indonesia. Materials used for this study are friable callus-derived immature embryo from young fruit which collected from The Forest Research Arboretum, Forestry Department, Darmaga, Bogor, West Java. Murashige and Skoog (MS) medium supplemented with vitamin of B groups and 30 gr/l sucrose was used as basal medium. Aspects in somatic embryogenesis to be included in this study are: callus multiplication, embryogenic callus induction and somatic embryos induction or maturation of embryogenic callus. MS medium with 8.0 gr/l agar supplemented with 4.0 – 5.0 mg/l 2,4-D was used for callus multiplication, embryogenic callus induction. For maturation of embryogenic callus to somatic embryo formation or that can be converted into plantlet was used MS liquid medium supplemented with 1.0 – 3.0 mg/l kinetin. The observation was made on period of embryogenic induction, percentage of embryogenic callus, texture and color of embryogenic callus, number and performance of somatic embryos resulted. The experimental Designed used was Complete Randomized (CRD) with ten replicates. 3. RESULT AND DISCUSSION The results showed that friable callus (Figure 1) can be propagated on the medium supplemented with 2,4-D and can develop to nodular callus. Plant growth regulator 2,4-D was necessary for callus initiation, callus proliferation and or embryogenic callus formation. According to George and Sherrington (1987) and Nagasawa and Finer (1988) 2,4-D is one of the auxins that very effective used for callus proliferation. Different with the experiment of Zhou et al., (1994) describing for callus proliferation were used two kinds of plant growth regulator. Figure 1. The friable callus In this study, proliferation of friable callus used 4.0 – 5.0 mg/l 2,4-D treatment. Callus friable was observed from all the treatment. The best treatment for callus proliferation was 5.0 868 mg/l 2,4-D and callus develop to nodular callus. Friable nodular callus was induce at high frequency 95% for 12 weeks without subculture or subculture was conducted three times 4 weeks intervals. Nodular callus obtained was friable and white in color. Nodular callus formation normally used single plant growth regulator and sometime needed two or more plant growth regulator that acted synergistically. Te-chato and Lim (1990) and Yelnititis and Bermawie (2000) reported that for nodular callus formation used BA and thidiazuron most effective. 3.1 Induction Embryogenic Callus The treatment of 5.0 mg/l 2,4-D is the best to induction of embryogenic callus. The embryogenic callus obtained was friable for eight weeks after inoculation. Similar to Yelnititis studies (2007) describe the embryogenic callus inducted after two times subculture four weeks intervals. Figure 2: The embryogenic callus from different 2,4-D treatment According to Guohua (1998) 2,4-D is auxin that very effective to embryogenic callus induction than NAA or IBA. Furthermore, Massabo and Ruffoni (1993), Gastaldo et al., (1994) and Rao and Bapat (1995) describing for embryogenic callus induction required of 2,4-D alone. In this study 100 % of callus embryogenic were produced. 869 Figure 3: Development of embryogenic callus to somatic embryos through suspension culture The embryogenic callus obtained was friable in texture (Fig.2) and yellowish and whitish in color. Similar to studies of Shimizu et al. (1997) and Ortiz et al. (2000) that obtain yellowish embryogenic callus of Iris germanica plant. And this callus can develop to follow somatic embryogenesis design. 3.2 Induction of Somatic Embryo In this stages, the embryogenic callus cultured on the liquid medium regeneration supplemented with plant growth regulator 1.0 – 3.0 mg/l kinetin. The result showed that development of the embryogenic callus to somatic embryo induction showed. For the first time this callus to be proliferated and greenish and than somatic embryos formation will start. Friable embryogenic callus will be compact and globular. The color change of callus showed after subculture. a b c a e f Figure 4: Stages of somatic embryos 870 4. CONCLUSION The treatment supplemented with 3.0 mg/l kinetin is the best treatment to somatic embryos induction. Number of somatic embryos produce was 160 for five weeks. Kirby (1997) describing that using of sitokinin alone effective to somatic embyos induction. This result the best than Yelnititis studies (2007) that obtain 110 somatic embryos at the same species. On the other hand, Nanda and Rout (2003) obtain 72.6 somatic embryo on the treatment BA and 2,4-D from Abies fraseri plant. Cotyledon stage of somatic embryos obtained in this study has two cotyledone and somatic embryo is normal. REFERENCES George, E F and P D Sherrington (1984): Plant propagation by tissue culture. Handbook and directory of commercial laboratories. Excegeticts Lim. England. Nagasawa, A and J J Finer (1988): Induction of morphogenic callus from leaf garlic. Hort Science 23(6) : 1068 – 1070. Shimizu, K, N Nagaike, T Yobuya and T Edachi (1997): Plant regeneration from suspension culture of Iris gemanica. Plant Cell Tissue and Organ Culture 50:27 – 31. Te-chato, S and M Lim (1999): Plant regeneration of mangosteen via nodular callus formation. Plant Cell Tissue and Organ Culture 59:89 – 93. Yelnititis and N Bermawie (2000): Embryogenesis somatic of black pepper (Piper nigrum L.) Panniyur. Proceeding of the Result of the Research and Development Seminar of Biotechnology. Centre for Biotechnology Research and Development. Centre of Indonesia Science (LIPI). Bogor. pp 431 – 437. Zhou, J, H Ma, F Guo and X Luo (1994): Effect of thidiazuron on somatic embryogenesis of Cayratia japonica. Plant Cell Tissue and Organ Culture 36: 73 – 79. INAFOR 11P-023 INTERNATIONAL CONFERENCE OF INDONESIAN FORESTRY RESEARCHERS (INAFOR) Landslide Hazard Mapping to Support the Handling of Landslide Hazard in the Upstream Deli Watershed Rahmawaty1, Bejo Slamet1, Abdul Rauf2 and Anita Naomi1 1Department of Forestry, Faculty of Agriculture, Sumatera Utara University, Jl. Tri Dharma Ujung No. 1, Kampus USU, Medan, North Sumatra, 20155, INDONESIA Corresponding email: [email protected] 2Department of Soil Science, Faculty of Agriculture, Sumatera Utara University, 871 Jl. Tri Dharma Ujung No. 1, Kampus USU, Medan, North Sumatra, 20155, INDONESIA Poster paper prepared for The First International Conference of Indonesian Forestry Researchers (INAFOR) Bogor, 5 – 7 December 2011 INAFOR SECRETARIAT Sub Division of Dissemination, Publication and Library FORESTRY RESEARCH AND DEVELOPMENT AGENCY Jl. Gunung Batu 5, Bogor 16610 Landslide Hazard Mapping to Support the Handling of Landslide Hazard in the Upstream Deli Watershed Rahmawaty1, Bejo Slamet1, Abdul Rauf2 and Anita Naomi1 1Department of Forestry, Faculty of Agriculture, Sumatera Utara University, Jl. Tri Dharma Ujung No. 1, Kampus USU, Medan, North Sumatra, 20155, INDONESIA Corresponding email: [email protected] 2Department of Soil Science, Faculty of Agriculture, Sumatera Utara University, Jl. Tri Dharma Ujung No. 1, Kampus USU, Medan, North Sumatra, 20155, INDONESIA ABSTRACT Natural disasters landslides as one natural phenomenon is one of the environmental problems that often occur in the province of North Sumatra, Indonesia. Landslides usually occur in the watershed upstream. The upstream of Deli Watershed is located in Karo Regency. Karo Regency is an area that has the potential for landslides; this region is mostly located in the highlands. This research aimed to identifying and mapping of landslide prone areas in Karo Regency and provided advice to the government in an effort to support the handling of dangerous landslides. This research used data such as: earth feature of Indonesia map/Peta Rupa Bumi Indonesia (RBI) or what is called as basic map with scale 1:50000, slope map, geological map and land cover/land use map. Processing was done with overlaid each parameter to determine landslide hazard using Geographic Information System. The results showed that in the upstream region DAS Deli, landslide hazard was dominated by high-class, followed by a very 872 high grade, medium, low and very low. The Class which very high landslide hazard contained in the Sub-district of Tiga Binanga, there was a high grade in the Sub-district Mardinding, while other classes (medium, low and very low) spread over several districts in Karo Regency. The main causes of landslides in this area mainly due to the slope factor, type of rock, soil, and land use. Keywords: Landslide, mapping, Deli watershed, environmental, Karo Regency 1. INTRODUCTION 1.1 Background Landslides usually occur in the watershed upstream. Natural disasters landslides as one natural phenomenon are also one of the environmental problems that often occur in the province of North Sumatra, Indonesia. The upstream watershed Deli is located in Karo Regency. Karo Regency is an area that has the potential for landslides; this region is mostly located in the highlands. Many factors can affect the stability of slopes that lead to the occurrence of landslides. These factors include: geological and hydrological conditions, topography, climate and weather changes. According to Priyono et al. (2006), the potential for soil erosion can be minimized by empowering communities to identify typologies of landslide prone slope lands, the early symptoms of the slope will move, and efforts should be done early anticipation. Effective early warning system should be made based on predictions, when and where landslides will occur also actions that should be done when disaster strikes. Geographic information systems can be used in determining the priority areas for disaster relief. According to Burrough (1986), a geographic information system (GIS) is a powerful set of tools for collecting, storing, retrieving, transforming and displaying spatial data from the real world for a particular set of purpose. GIS technology integrates common database operations such as query and statistical analysis with the unique visualization and geographic analysis benefits offered by maps (ESRI, 2007). An area most vulnerable to disasters is a main priority in conducting mitigation measures. By this research, it is known that areas prone to landslides, so early prevention can be done. If the anticipation is not immediately done, losses due to landslides would not be inevitable. 1.2 Objective This study generally aimed to identifying and mapping of landslide prone areas in Karo Regency and provided advice to the government in an effort to support the handling of dangerous landslides. 2. MATERIAL AND METHODS 2.1 Description of the Study Area The research was conducted in Karo Regency (the upstream of Deli Watershed). Geographically, it is located between 2050‘ - 3019‘ LU dan 97055‘ - 98038‖ BT (Figure 1). This research was conducted during January to July 2010. Data analysis and processing were performed at the Laboratory of Integrated Forest Management, Department of Forestry, University of Sumatera Utara. 873 Figure 1: Map of study area 2.2 Data Collection This research used data such as: earth feature of Indonesia map/Peta Rupa Bumi Indonesia (RBI) or what is called as basic map with scale 1:50.000, slope map, geological map and land cover/land use map. Processing was done with overlaid each parameter to determine landslide hazard using Geographic Information System. 3. RESULT AND DISCUSSION Based on the district in Karo Regency, the distribution of landslide prone consists of five classes, namely: very low, low, medium, high, and very high. Distribution of landslide hazard based on the district was not evenly distributed in each sub-district as is presented in Figure 2. (based on analysis on the map and checking in the field). Each class of landslide hazards was marked with different colors. Landslide e hazard Very low Low Medium High Very high Figure 2: Map of landslide hazard class in Karo Regency 874 Source: Analysis result (2010) Characteristics of landslides are most commonly found in Indonesia is the type of landslide translational and rotational (KESDM, 2008). There are characteristics of landslides was found in the area, namely: translational landslides, landslides of rotation, and movement of the block. Characteristics of landslides in areas of research have different extents in each sub-district (Table 1). Based on Table 1, the characteristics of landslides were most commonly found, namely: the Sub-district of Tiga Binanga (very high), Sub-district Mardingding (high, low, and very low). Table 1. Landslide hazard class based on sub-district in Karo Regency Landslide hazard class (Ha) Sub-district Barusjahe Berastagi Juhar Kabanjahe Kutabuluh Laubaleng Mardingding Merek Munthe Payung Simpang Empat Tiga Binanga Tiga Panah Ha Total % Total 69.53 38.05 101.87 263.96 543.37 8.08 - 2.03 4.84 89.21 131.79 4.04 93.46 2.40 167.39 153.52 12.30 26.73 28.21 120.18 214.28 268.45 857.79 169.00 1,661.15 144.36 1,841.40 1,218.39 2,476.73 1,826.77 1,009.01 958.83 Very High 241.76 32.74 160.79 324.77 21.75 23.96 153.68 52.27 107.24 80.18 - 335.96 1,025.86 251.89 1,693.91 146.93 1,252.01 6.21 4.06 19.81 349.49 1.73 182.28 307.16 1,818.91 9.02 925.93 780.15 14,895.43 73.87 477.27 2.15 1,849.83 9.18 1,589.56 7.88 1,256.21 6.23 20,165.69 100 100 Very low Low Medium High Ha % 1,099.55 275.72 2,032.24 399.76 2,178.48 1,620.06 3,203.82 2,112.77 1,275.56 1,427.99 5.45 1.37 10.08 1.98 10.80 8.03 15.89 10.48 6.33 7.08 8.40 Tiga Binanga Sub-district has the very high landslide in Karo District with an area of 477.27 ha, because of the soil was dominated by Dystropepts, Tropudults, Humitropepts, land cover was agricultural land, dry slopes above 45%, and the type of rock is a Mixed-Sediment (silt/mudstone). The most influential in the level of landslide hazard in the Tiga Binanga SubDistrict was slope. Mardingding Sub-district, an administrative district that has the greatest area when compared with other Sub-districts in Karo Regency. The extent of 3.203,82 hectares and is a district that has a high level of landslide hazard in the Karo district with an area of 2.476,73 ha. The types of soil were Tropudults and Dystropepts, land cover was dominated by secondary forest of dry land, the type of rock was a sediment-mixture, and the slope was above 45%. Landslide conditions are depicted in Figure3. 875 a. b. Figure 3: Landslide conditions: a. in Tiga Binanga Sub-district b. in Mardingding Sub-district According to Marwanto et al. (2007), an area determined to have potential for landslides if it meets three requirements, namely: the slope is quite steep, has a glide plane of the surface soil layer beneath the semi-permeable and soft and there is enough ground water to meet the above fields the sliding. With a high percent slope, then the incidence of landslides are only waiting for the trigger factor is rainfall or earthquakes. Based on the results, the higher the percent slope of the land, the greater the potential for landslide. It is also clarified by Wahyunto et al. (2003) and Arsyad (2006). Soil type is one of the parameters determining the level of erosion. According Haifani (2008), the occurrence of landslides is generally caused by the presence of a large thickness of loose soil. With the rain, the rate of erosion will be higher. Furthermore, according Budiono (2003), soil texture also affects the absorptive capacity of a soil. 4. CONCLUSION The class which very high landslide hazard contained in the Sub-district of Tiga Binanga, there was a high class in the Sub-district Mardinding, while other classes (medium, low and very low) spread over several Sub-districts in Karo Regency. The main causes of landslides in this area mainly due to the slope factor, type of rock, soil, and land use. REFERENCES Arsyad, S (2006): Soil and Water Conservation (Konservasi Tanah dan Air). IPB Press. Bogor. Budiono (2003): Potensi Pengembangan Tanaman Pangan Berdasarkan Zona Agroekosistem: Kasus di Playen dan Wonosari, Yogyakarta. Buletin Teknik Pertanian 8:41-46. http://www.pustakadeptan.go.id/publikasi/bt082031.pdf [10 Mei 2010]. Burrough, P A (1986): Principles of Geographic Information Systems for Land Resources Assessment. Oxford, Clarendon Press. 193p. ESRI (2007): What is GIS? http://geography.about.com/gi/dynamic/offsite.htm?site=http://www.esri.com/library/gis/abt gis/what%5Fgis.html Haifani, A M (2008): Aplikasi Sistem Informasi Geografi untuk Mendukung Penerapan Sistem Manajemen Resiko Bencana di Indonesia. Prosiding. Seminar Nasional Sains dan Teknologi-II 2008. 17-18 November 2008. Universitas Lampung. V-163-176. http://lemlit.unila.ac.id/file/arsip%202009/SATEK%202008/VERSI%20PDF/bidang%205/5-19.pdf [18 Maret 2010]. Kementrian Energi dan Sumber Daya Mineral (KESDM) (2008): Pengenalan Gerakan Tanah. http://www.esdm.go.id/publikasi/lainlain/doc_download/489-pengenalan-gerakan-tanah.html [18 Maret 2010]. Marwanto, S, A Dariah, D Subardja and Y Hadian (2007): Indentifikasi Lahan Rawan Longsor dan Indeks Bahaya Erosi di Kabupaten Solok, Provinsi Sumatera 876 Barat. Solok. http://balittanah.litbang.deptan.go.id/dokumentasi/prosiding2008pdf/setiari_longsor.pdf [1 Agustus 2010]. Priyono, K D, Y Priyana and Priyono (2006): Analisis Tingkat Bahaya Longsor Tanah di Kecamatan Banjarmangu Kabupaten Banjarnegara. Forum Geografi 20: 175-189. http://eprints.ums.ac.id/253/1/6._KUSWAJI_DWI_P.pdf [18 Maret 2010]. Wahyunto, H Sastramihardja, W Supriatna, W Wahdini and Sunaryo (2003): Kerawanan Longsor Lahan Pertanian di Daerah Aliran Sungai Citarum, Jawa Barat. Prosiding Seminar Nasional Multifungsi dan Konversi Lahan Pertanian : 99-112. Badan Litbang Pertanian. Jakarta. INAFOR 11P-024 INTERNATIONAL CONFERENCE OF INDONESIAN FORESTRY RESEARCHERS (INAFOR) Study of Traditional Agroforestry System in West Nusa Tenggara: Finding the Alternative of DA REDD Site Based on Carbon Stock Ryke Nandini Forestry Research Institute of Mataram Jl. Dharma Bhakti 7, Lombok Barat, NTB 83371, INDONESIA Corresponding email: [email protected] 877 Poster paper prepared for The First International Conference of Indonesian Forestry Researchers (INAFOR) Bogor, 5 – 7 December 2011 INAFOR SECRETARIAT Sub Division of Dissemination, Publication and Library FORESTRY RESEARCH AND DEVELOPMENT AGENCY Jl. Gunung Batu 5, Bogor 16610 Study of Traditional Agroforestry System in West Nusa Tenggara: Finding the Alternative of DA REDD Site Based on Carbon Stock Ryke Nandini Forestry Research Institute of Mataram Jl. Dharma Bhakti 7, Lombok Barat, NTB 83371, INDONESIA Corresponding email: [email protected] ABSTRACT West Nusa Tenggara (NTB) has limited forest land cover. It causes NTB being a target of Reducing Emission from Degradation and Deforestation Demonstration Activity (DA REDD). One of important requirements for being a DA REDD is the status certainty of management area. Beside of forest area, a potential DA REDD is the traditional agroforestry system that has been managed by community for centuries from generation to generation. Counting of carbon stock in existing traditional agroforestry systems is one way to choose an alternative location of the DA REDD. This research aimed to study the existed traditional agroforestry system in NTB, and to analyze its carbon stock on four carbon pools. Field survey was used to study traditional agroforestry system. The plot sampling method was used for inventory of vegetation and soil sampling in every agroforestry system. Carbon stock was analyzed using Vademicum Kehutanan allometric method, Hairiah et al. method and MacDicken equation (1997). Comparative method was used to determine the best traditional agroforestry system in terms of carbon stock. The result showed that the existed traditional agroforesty system in NTB were silvopasture, Sesbania glandiflora fallow land, alley cropping, ―Rau‖, ―Kebon‖, and ―Forest Kebon‖. Kebon was the best system on carbon stock with average total carbon stock of 401.89 ton/ha. The carbon pool which had the largest carbon stock was vegetation carbon of ―Rau‖ system (191.09 ton/ha). Based on the result, ―Kebon‖ and ―Rau‖ could be an alternative of DA REDD site. Keywords: Traditional agroforestry, carbon, DA REDD 1. INTRODUCTION Forest land cover in West Nusa Tenggara (NTB) decrease year by year. According to the land cover map for 2006-2009 periods, its declining was approximately 14.3%. On the other 878 hand, there are many succesful community forest (HKm) and increasing of forest people in NTB. There were at least 14 HKm until year of 2009 and 32,659.13 ha forest people during 2004-2008 in NTB (Dinas Kehutanan Propinsi NTB, 2011). It cause NTB being a target of Reducing Emission from Degradation and Deforestation Demonstration Activity (DA REDD). Target of REDD site is not only inside of forest area but also outside of forest area, as long as it has a certain management status. In NTB, there are many agroforestry traditional system outside of forest area that might be a site of DA REDD. It has been managed by community for centuries from generation to generation. According to Roshetko and Mulawarman (2001, in Iskandar, 2008), at least there were eight traditional agroforestry systems in NTB, such as ―Rau‖, Sesbania glandiflora fallow land, alley cropping, ―Kebon‖, ―Nggaro‖, ―Ngerau‖, ―Forest kebon‖, and silvopastura. Counting of carbon stock of existing traditional agroforestry systems is important as consideration to choose an alternative location of the DA REDD. Carbon stock in existing traditional agroforestry systems could be a baseline for counting of carbon stock in the next periode of carbon stock counting. This research aimed to study the existed traditional agroforestry system in NTB, and to analyze its carbon stock on four carbon pools. 2. EXPERIMENTAL METHOD This research was conducted in NTB, including Lombok Island and Sumbawa Island (Figure 1). Six districts were selected as sample area, such as West Lombok, Central Lombok, North Lombok, East Lombok, Sumbawa and West Sumbawa. Field survey was used to identify and study the existing traditional agroforestry system. Figure 1. West Nusa Tenggara Map Carbon stock was analyzed from 4 carbon pool (vegetation, soil, necromass and understorey). Sample location was determined using purpossive sampling for every traditional agroforestry system. Nested plot sampling was used for inventory of vegetation, soil sampling, necromass and understorey measurement (Figure 2). 879 Figure 2: Nested plot sampling layout used in the research Carbon stock analysis used Vademicum Kehutanan allometric method (1976), Hairiah et al. method (2001) and MacDicken equation (1997). Comparative method was used to determine the best traditional agroforestry system in terms of carbon stock. 3. RESULT AND DISCUSSION According to Nandini et al. (2009), physiography of the research area are volcanic and fluvial landform with volcanic igneous such as basalt, andesite and breccia; and sedimentary rock such as alluvium, colluvium and alluvial fan deposit as well. Average Annual rainfall of the research area for 1985-2008 periods is 475-1980.7 mm/year. There were six traditional agroforesry systems in NTB that still existed when the research was conducted (Table 1). Table 1. The existing traditional agroforestry systems in NTB No 1. Traditional Agroforestry System Kebon 2. Forest kebon 3. Silvopastura 4. Alley cropping 5. Rau Characteristic Mix planting system between wood, multi purpose tree species (MPTS), and food production crops. It locates around resettlement. Area of 0,25 – 2 hectares Income from fruits Rp 3-4 milion/year Mix planting system between wood , MPTS, annual crop as food production and animal feed on land owned . It is far from home and near forest area. Area of 0,5 – 3 hectares. Uncertain and incontinuous income except from fruits, food and animal feed Combination of trees and animal feed plant such as Gliricidia sepium and Pennisctum purpureum Area of 0,25 – 2 hectares Using variety of legume as alley crop for nitrogen fixing and annual crops and fruits in between. Area of 0,25 – 2 hectares Land use system on sloping land for annual crops (Gora paddy, corn, and bean) Using terrace and cover crops for retaining rain water. Area of 0,25 – 2 hectares Plantation production on one planting season are 3-4 ton/ha dry grain equivalent. 880 No 6. Traditional Agroforestry System Sesbania glandiflora fallow land Characteristic Most of them are in arid area Sesbania glandiflora as boundary annual crop land. Sesbania glandiflora is utilized for nitrogen fixing, animal feed, vegetable and firewood. Area of 0,5 – 2 ha The highest carbon stock of the existed traditional agroforestry system was ―Kebon‖ (401.89 ton/hectare). Base on the research, Kebon was dominated by vegetation such as jackfruit (Artocarpus heterophyllus), coconut (Cocos nucifera), mahagony (Swietenia mahagoni), rambutan (Nephelium lappaceum) coffee (Coffea arabica), cashew (Anacardium occidentale), acid (Tamarindus indica) and teak (Tectona grandis) with average diameter of 10.9-54 m and height of 6.49-14.3 m. The result of each carbon stock is presented in Figure 4. Total carbon (ton/ha) Total carbon; K; 401,9 Total carbon; Total carbon; R; Total carbon; KH; 365,0 Total carbon; WP; 336,3 359,6 BL; 326,3 Total carbon; PT; 160,2 Traditional agroforestry Remarks: KH = forest kebon, BL = alley cropping, WP = silvopastura, K = kebon, R = rau, PT = Sesbania glandiflora fallow land Figure 4: The result of carbon stock counting The highest carbon pool was vegetation of ―Rau‖ (191.09 ton/ha). Rau was dominated by coconut (Cocos nucifera), mahagony (Swietenia mahagoni), dadap (Erythrina lithosperma), cashew (Anacardium occidentale) and cottonwoods (Ceiba petandra) with average diameter of 10.5-35.1 m and height of 4.33-21.95 m. Carbon stock of carbon pools in the existed traditional agroforestry system is showed in Figure 5. 881 Total carbon (ton/ha) C-veg KH 125,89 BL 108,90 WP 108,07 K 110,41 R 191,09 PT 9,63 C-so 123,71 110,40 99,86 146,15 92,35 60,02 C-nec 78,39 61,22 83,48 102,76 29,03 23,98 C-und 36,99 45,73 44,91 42,58 47,16 66,53 Remarks : KH = forest kebon, BL = alley cropping, WP = silvopastura, K = kebon, R = rau, PT = Sesbania glandiflora fallow land, C-veg = carbon from vegetation, C-so = carbon from soil, C-nec = carbon from necromass, C-und = carbon from understorey Figure 5: Carbon stock of four carbon pools in each traditional agroforestry system 4. CONCLUSION Carbon stock is the one of parameter that can be a consideration to determine DA REDD site. Base on stock carbon analysis, ―Kebon‖ and ―Rau‖ could be an alternative of DA REDD site. REFERENCES Dinas Kehutanan Propinsi NTB (2011): Buku Statistik Dinas Kehutanan Propinsi NTB Tahun 2010. Mataram. Nandini, R, I W Susila and AG Salim (2009): Analisis Stok Karbon Pada Barbagai Sistem Agroforestri Tradisional di NTB. Laporan Penelitian Program Intensif Riset DIKTI TA. 2009. Mataram. Unpublished. Hairiah, K, S M Sitompul, M van Noordwijk and C Palm (2001): Methods for sampling carbon stock above and belowground. Dalam M. van Noordwijk, S. Williams and B. Verbist, editors. Towads integrated natural resources management in forest margins of the humid tropics:local action and global concerns. ICRAF. ABS Lecture Note 4A. Bogor. Iskandar, U (2008): Kelola Ekosistem Pulau Kecil: Refleksi dan Pembelajaran Kehutanan Indonesia. Penerbit Wana Aksara. Jakarta. 882 INAFOR 11P-025 INTERNATIONAL CONFERENCE OF INDONESIAN FORESTRY RESEARCHERS (INAFOR) Four Types of New Record for Diospyros in Tangkoko Nature Reserve in North Sulawesi Julianus Kinho Forestry Research Institute of Manado JL. Raya Adipura, Kel. Kima Atas, Kec.Mapanget, Manado, 95119, INDONESIA Poster paper prepared for The First International Conference of Indonesian Forestry Researchers (INAFOR) Bogor, 5 – 7 December 2011 INAFOR SECRETARIAT Sub Division of Dissemination, Publication and Library FORESTRY RESEARCH AND DEVELOPMENT AGENCY Jl. Gunung Batu 5, Bogor 16610 883 Four Types of New Record for Diospyros in Tangkoko Nature Reserve in North Sulawesi Julianus Kinho Forestry Research Institute of Manado JL. Raya Adipura, Kel. Kima Atas, Kec.Mapanget, Manado, 95119, INDONESIA ABSTRACT Ebony trees were from Diospyros have been known as the trees of high economic value. The trees of Diospyros can be found in virgin forest generally, especially in lowland forest to mountain in 900 asl and sometimes in the slope area. It is rarely growth in secondary forest, exactly planted by human. Some of them can be found in the mountain to 1700 asl, swamp forest, kerangas forest, and ultrabasic area. Tangkoko Nature Reserve is one of conservation area in North Sulawesi. This is one of tourist destination in North Sulawesi with many flora potential but less known. Research about Diospyros diversity is important to support bioecology data. This research aim to know Diospyros types which growth naturally in Tangkoko. Exploration methode were used to collect data, and literature study to know the types of Diospyros which not recorded by Tangkoko Nature Reserve. The result show that four new records of Diospyros were found in Tangkoko Nature reserve. The species namely Diospyros ebenum Koenig., D.pilosanthera Blanco., D.hebecarpa A.Cunn., dan D. malabarica (Desr.) Kostel. The number of list Tangkoko plants has added by fourth new records of Diospyros in Ebenaceae. Eight types have been reported before consist of 7 species were reported by Lee et al. (2001) and 1 species reported by Wirdateti et al., (2006). Nowadays 12 species of Diospyros has been known from Tangkoko Nature Reserve in North Sulawesi. Keywords: Diospyros, conservation, bioecology, diversity, marga 1. INTRODUCTION Diospyros is a genus of family Ebenaceae and has more than 300 species spread throughout tropical forests in Asia, Australia, Pacific Islands and Africa. In Malesia was found about 170 species and especially in Indonesia there are about 100 species of trees from the Highways Diospyros L. (Hiern, 1873 in Bakhuizen van den Brink, 1936; Riswan, 2002). The types of the genus Diospyros commonly found in natural forests or primary lowland until height of 900 m in hilly areas and tropical rain. They are rarely found in secondary forests. Several types of Diospyros may grow in the forests of the mountains in altitude of 1700 m asl, peat swamp forest, heath forest, and forests on limestone soil and ultra-alkaline soil (Riswan, 2002). Ebony tree derived from the genus Diospyros has long been recognized as a type of tree that produces high quality wood. Tree species which is known as a tree of genus Diospyros namely ebony are Diospyros celebica Bakh., D.ebenum Koenig., D.ferrea Bakh., D.lolin Bakh., D.macrophylla Bl., D.pilosanthera Blanco., And D.rumphii Bakh. The types of ebony trees are most important and least known among the seven types of tree namely Diospyros celebica because this type have brown striped wooden and D.rumphii with black color and not striped while in world market known as Makassar ebony (Soenaryo, 2002; Riswan, 2002). Sulawesi Island is known to have a unique flora, because the island is located in Wallacea lines, which is the convention centre spread of plants from Asia and Australia, and is thought to have a very high diversity of plants (Steenis, 1950 in Sulistiarini, et al., 2007). Tangkoko Nature Reserve is one of area conservation in Sulawesi, which is located in the Bitung regency in North Sulawesi, and the area approximately 3,196 Ha. Geographically located in 12503' CA.Tangkoko884 125015' and 103'-1034 BT' LU. The area has mountainous topography sloping up from the coastal forest to mossy forest with the highest mountain 1.109 m above sea level (BKSDA Sulut, 2009). There are many research was conduct in Tangkoko Nature Reserve. It is mostly done by domestic researchers and foreign researchers. Most of the research was done about animals such as Sulawesi black monkey (Macaca nigra), tangkasi (Tarsius spectrum) and hornbills (Aceros cassidix), whereas information about the diversity of flora is still very lacking. Therefore, the study aims to collect data and information of plant species diversity in Tangkoko nature reserve. This article is a part of the research results in Tangkoko Nature Reserve. This artice focused on four types of new records for genus Diospyros in Tangkoko Nature Reserve. 2. MATERIAL AND METHODS Collection was conducted in June and August of 2010. Exploration and collection of samples was done in July while in the begining of flowering and fruiting. Data collection was done in altitude of 000-200 m above sea level. Exploration and collection of samples plants are continue in August 2010 for the types of the genus Diospyros is detected or will flower and bear fruit for the month. Vegetation sampling methods follow Balgooy (1987); Rugayah et al., (2004); Ward et al., (2004), namely as a collection of higher plants in general. Each plant has collected cultivated flowers or fruit. Collection of plant samples from the genus Diospyros in the subsequent identification of the Herbarium Research and Development Center (Research) of Forest and Nature Conservation, Bogor. Based on the collection and identification of fresh herbs and a description of the types of Diospyros collected and supported by the literature. 3. RESULT AND DISCUSSION Infrafamili classification for Ebenaceae was introduced first by de Candolle (1844) which classified the family Ebenaceae into eight genera, namely: Cargillia, Diospyros, Euclea, Gunisanthus, Maba, Macreightia, Rospidios and Royena. Then Hiern (1873) classify 249 species into five genera, namely: Diospyros, Euclea, Maba, Royena, and Tetraclis. Furthermore Bakhuizen (1936-1955) in the revision of regional Malayensium Maba was combine with Diospyros and breaks it into four genera, namely: Diospyros, Euclea, Royena and Tetraclis. White (1980; 1983) combines Royena and Tetraclis synonymous with Diospyros and only classified into two genera, namely: Diospyros and Euclea. Duangjai, et al., (2006) make a classified based on the results of a study supported by the results of data analysis from the separation from six DNA regions, and they clssifies Ebenaceae into four genera, namely: Lissocarpa, Euclea, Royena, and Diospyros. Nowadays, we know that family Ebenaceae consist of four genera. According to Whitemore, et al., (1989), the number of species from genus Diospyros in Sulawesi approximately 26 species. Five types of which species are endemic to Sulawesi, namely; Diospyros celebica Bakh., D.eburnea Bakh., D.greshoffiana Kds.ex.Bakh., D.polita Bakh., and D.venenosa Bakh. The spread of Diospyros species endemic Sulawesi is not explained further, is only mentioned a place to grow in lowland forest or mountains. According to Keββler et al., (2002) were data collected from various sources mentioned that the number of species for genus Diospyros in Sulawesi, approximately 19 species. This amount is more or less 7 types bellow when we compared to those previously reported by Whitemore et al., (1989), does this mean there has been a reduction in the type of the genus Diospyros in Sulawesi, given the number of reported or recorded according to Keββler et al., (2002) is the result of recording data 13 years later after Whitemore et al., (1989). The result showed that based on field data collection by exploration, specimen herbarium identification and supporting by the literature on genera Diospyros in Sulawesi (Whitemore et al., 1989; Keββler et al., 2002; Lee, et al., 2001). Four types of the genus Diospyros has identified as new recordings in Tangkoko Nature Reserve, namely; Diospyros ebenum Koenig., D.pilosanthera Blanco., 885 D.hebecarpa A.Cunn., and D. malabarica (Desr.) Kostel. Those types has added list of plant species in Tangkoko Nature Reserve, specifically list of family Ebenaceae. The list plants previously of the genus Diospyros in some conservation areas in North Sulawesi (Lee, et al., 2001), shown in Table 1. Table 1. The number of list plants for Diospyros in North Sulawesi No Name of type Vernacular name 1 Diospyros buxifolia (Blume) 2 3 4 5 6 7 8 D. celebica Bakh. D. hebecarpa Cunn ex Benth. D. javanica D.korthalsiana Hiern. D. macrophylla Bl. D. maritima Bl. D. minahassae Bakh. Pamapegun, Kujangran Heade, Ameade Oloitoma 9 D.rumphi Bakh. Location Tk * Mb Ga * Bn Pn * * * Bk Krkg * Bengkoal,Pambesian, Pombasian Hitam (Peremp), K,Mojodin, K.Mojondi, Mojodiu * * * * * * * * * * * * * * * * * * Number 7 4 3 8 Source: Lee et al. (1999; 2000), Kinnaird dan O'Brien (1996), Lee et al. (2001); 10 Pym * * * * Diospyros sp. Remark Tk Mb Ga Bn Pn Pym Bk Kk 3 1 0 2 : CA.Tangkoko (Tangkoko Nature Reserve) : SM.Manembonembo (Manembonembo Nature Reserve) : CA.Gunung Ambang (Gunung Ambang Nature Reserve) : TN. Bogani Nani Wartabone (Bogani Nani National Park) : CA.Panua (Panua Nature Reserve) : Paguyaman (Paguyaman Nature Reserve) : Bunaken (Bunaken National Park) : SM.Karakelang (Karakelang Nature Reserve) Table 1 shown that list of plant species in Tangkoko Nature Reserve made by Lee, et al., (2001) based on data compilation from various sources (Lee, et al., 1999; Kinnaird and O'Brien, 1996; WWF, 1980) mentioned that in Tangkoko Nature Reserve there are seven types of genus Diospyros whereas in this study found eight species of genus Diospyros. Three types of which have been previously reported by Lee, et al. (2001), namely; Diospyros minahassae Bakh., D.korthalsiana and D.maritima Bl. Then, in five years later (2001-2006) the addition of the number of species plant in Tangkoko Nature Reserve about one type is Diospyros cauliflora Bl., reported by Wirdateti et al. (2006). Furthermore, in four years later (2006-2010) the addition of four types of the genus Diospyros in this study. List of plants for genus Diospyros in Tangkoko Nature Reserve were found in this study, shown in Table 2. 886 Table 2. Number of list plants for Diospyros were found in Tangkoko Nature Reserve No Name of Type 1 2 3 4 5 6 7 8 Diospyros ebenum Koenig. Diospyros cauliflora Bl. Diospyros pilosanthera Blanco. Diospyros hebecarpa A.Cunn. ex Benth. Diospyros korthalsiana Hiern. Diospyros minahassae Bakh. Diospyros malabarica (Desr.) Kostel. Diospyros maritima Bl. Number Tangkoko Nature Reserve ( ) * * ( ) * ( ) * * * ( ) * * 8 Remark : (*) New record of Diospyros in Tangkoko Nature Reserve The results showed that Diospyros species contained in Tangkoko NR more dominant in lowland forest on altitude 0-500 m asl. Two main characteristics distinguish lowland forest with other terrestrial biomes is the high density of trees and vegetation conservation status of most of categorized rare locally (Clark et al., 1999 in Kurniawan, et al., 2008). Species composition and diversity of plants in the forest depends on several environmental factors such as moisture, nutrients, sunlight, topography, parent rock, soil characteristics, canopy structure and history of land use (Hutchincson et al., 1999 in Kurniawan, 2008). Description four types of new records for Diospyros in Tangkoko NR as follows: 3.1 Diospyros pilosanthera Blanco. Synonym: Diospyros cubica Bakh., Diospyros elmeri Merr., Diospyros nidus-avis Kosterm, Diospyros plicata Merr., Diospyros polyalthioides Korth. ex Hiern., Diospyros polyalthioides var. polyalthioides (Korth. ex Hiern.) Ng., Diospyros hiernii Koord. & Valeton ex Koord. Distribution: Naturally Diospyros pilosanthera Blanco., has a fairly wide distribution area ranging from Indonesia to the central part of eastern Indonesia. Diospyros species can be found naturally in Borneo (Kutai, Bulungan, Berau, Tarakan, Tidung), Sulawesi (Poso, Bolaang Mongondow, Gorontalo in Minahasa, Banggai, Muna), Moluccas (Morotai, Buru, Tanimbar, Halmahera) and Irian Jaya (Alrasyid, 2002) Morphology: Trees with a height of 30 meters, diameter of 73.2 cm. Stem smooth, pared bark, black, trunk does not buttress. Single leaf, seated alternating leaves, leaf base rounded, tapered tip of the leaf, the leaf surface is not shiny slippery. Leaf length 20.1 cm, and width 9.4 cm, petiole length of 1.5 cm. Average new leaf edges branching out from the armpit leaves. Tangkoko Nature Reserve, Bitung, North Sulawesi. 010 33'55 "N / 1250 09'53" E, Alt: 34 m asl. Collection on July 8, 2010. (Kinho, J. 346). 887 Figure 1: Diospyros pilosanthera Blanco. 3.2 Diospyros ebenum Koenig. Synonym: Distribution: India and Sri Lanka. Spread in Indonesia is naturally found in Sulawesi (Minahasa, Poso, Buton), Moluccas (Halmahera, Tanimbar, Aru,) and Nusa Tenggara (Sumbawa and Flores). Morphology: Trees with a height of 15 m, 25 cm diameter. Branching centralized (circular), stratified. Trunk cylindrical, not pared or exfoliate, smooth skin texture, dark brown somewhat sunny, coastal forest. Single leaf, leaf length of 20.5 cm, 10.3 cm wide leaves, 1 cm long petiole, leaf surface smooth, glossy dark green, beneath light green leaves behind bright. Flat base of the leaves, rounded leaf tips, leaf edges flat, seated alternating leaves. Fruit is round, smooth, sheath 1.95 cm diameter, hugging the base of the petals of fruit, single fruit, fruit located in the armpit leaves, fruit have two locus. Tangkoko Nature Reserve, White Stone Park, Bitung Regency. Coordinat 010 33 '56 "N / 1250 10' 13" E, Alt: 2 m asl, Collected on July 7, 2010. (Kinho, J. 336). Figure 2: Diospyros ebenum Koenig. 3.3 Diospyros hebecarpa A.Cunn ex Benth. Synonym: 888 Distribution: India, Sri Lanka, Autralia, Papua New Guniea Morphology: Trees, height 8 m and 63 cm diameter. Bark black, circular branching pattern in intervals of 2 meters. Black stem smooth, grooved shallow, small buttress, not gummy. Wood is shiny white. Leaf is single, seated in alternating arrange, length 12.1 cm, width 3.4 cm. Petiole 0.4 cm long, small size, pointed leaf tips. Surface slick glossy leaves, beneath of leaves pale green, young stems leaf out in the armpit. Young green fruit, the fruit surface slick, smooth, fluffy, Peduncle 0.76 cm length and 1.3 cm diameter. Tangkoko Nature Reserve, White Stone Park Area, in Bitung Regency, North Sulawesi. Coordinat 01033'45"N /125009'55" E, Alt: 45 m asl. Collected on July 8, 2010 (Kinho, J. 349). Figure 3: Diospyros hebecarpa A.Cunn ex Benth. 3.4 Diospyros malabarica (Desr.) Kostel. Synonym: Diospyros embryopteris Pers., Diospyros embryopteris var. siamensis (Hochr.) Phengklai, Diospyros glutinosa Koenig. & Roxb., Diospyros malabarica var. malabarica., Diospyros melanoxylon Hassk., Diospyros peregrina Guerke., Diospyros peregrina f. javanica (Gaert.) Guerke., Diospyros siamensis Hochr., Diospyros siamensis Ridl., Garcinia malabarica Desr. Vernacular name: River ebony, Indian persimmon, Mountain ebony, Malabar ebony (E), Komoi, Kumun (Mal.), Culiket, Klega, Kleca, Toyokuku, Tako suan (Thai). Makusi (Ind.), Klicung (Nusa Tenggara Barat). Distribution: From India and Sri Lanka through Southeast Asia. In Southeast Asia have been reported in Myanmar, Thailand, Cambodia, Malaysia (Peninsular) and Indonesia (Java, Sulawesi). Morphology: Trees with a height of 90-10 m, diameter 10-12 cm. Growth in flat area and sandy soil as the habitat. The trunk silindris with smooth black. Leaf single in alternating arrange, leaf base rounded, pointed leaf tips, leaf edges flat, length 18 cm and width 6 cm, petiole length 1 cm. Fruits oval, brown with 4.7 cm diameter, clearly gum, somewhat sticky. The fruits have soft hairs on surface, feed by Sulawesi monkeys (Macaca nigra). Tangkoko Nature Reserve, Coordinat 010 33'56 "N / 1250 09'51" E, Alt: 57 m, August 28, 2010. (Kinho, J. 393) 889 Figure 4: Diospyros malabarica (Desr.) Kostel. The trees including of slow growing species, but the wood is a luxury wood with striped pattern and black mottled with brown combined. Diospyros malabarica tree can reach up to 25 m high, leafy green rather thick and stiff, branch-free height of about 10-20 m, with 30-45 cm diameter. It is generally straight-trunked tree, and round the outer skin color is black, rough and scaly. Flesh-colored leather in a little red. The texture of the trunk smooth to some what smooth. Fiber direction straight or some what integrated, shiny wood surface slippery. Wood brown reddish color and has a gradation with a wooden terrace. Wood patio colored mottled black, has a specific gravity of 1.05. This type of wood is widely used as furniture, carvings and household appliances. In Tangkoko Nature Preserve, the fruits has been feeding by Sulawei monkey (Macaca nigra) and fruit bats (Pteropus indicus). Flowering season is expected around January to February and ripes in July to September. The seeds including recalsytrant so its can not be stored in long time. Fruit obtained should be planted. The longer kepts could make less of the viability. These species was reported to grow in altitude 300-650 m asl, in range temperate regions C and D with rainfall aproximatelly 1300 to 2750 mm /year (MoF, 2007). 4. CONCLUSION AND RECOMMENDATION The number of plant species in Tangkoko Nature Resrve be increased by the addition of four new species of the genus Diospyros recordings that were previously known that only have 8 types, and nowadays by this research they are 12 types. Four kinds are new records, namely; Diospyros ebenum Koenig., D.pilosanthera Blanco., D.hebecarpa A. Cunn., and D. malabarica (Desr.) Kostel. Further research is needed in potency and distribution analysis of Diospyros species, especially those included in Ebony group as wood timber which high economic value. REFERENCES Bakhuizen Van Den Brink, R C (1936-1955): Revisio Ebenacearum Malayensum. Bulletin du Jardin Botanique de Buitenzorg, serie 3, 15 (1-5): 1-515. Candolle, A De (1844): Ordo CXXV. Ebenaceae. In A.P.de Candolle and A.de Candolle (eds.), Prodromus Systematis naturalis regni vegetabilis, 8:209-243. Ministry of Forestry (2007): Klicung (Diospyros malabarica) & Duabanga (Duabanga molucanna Blume.). Forestry Information Center. Department of Forestry. Jakarta. Hiern, W P (1873): A Monograph of Ebenaceae. Transactions of the Cambridge Philosophical Society 12:27-300. 890 Keβler, P J A, M M Bos, S E C Sierra Daza, A Kop, L P M, Willemse, R Pitopang, S R Gradstein (2002): Checklist of Woody Plants of Sulawesi, Indonesia. Blumea. Journal of Plant Taxonomy and Plant Geography. Supplemment 14. National Herbarium Nederland. Universiteit Leiden Branch. The Netherlands. Lee, R J, J Riley and Merrill, R (2001): Biodiversity and Conservation in Northern Sulawesi. WCSIP and NRM. Prima Centra. Jakarta. Rugayah and Widjaja, E A, Praptiwi (2004): Flora Diversity Data Collection Guidelines. Research Center for Biology, Indonesian Institute of Sciences. Bogor. Sultana, M, M O Rahman, M Begum and M A Hassan (2010): Disopyros albiflora Alston. (Ebenaceae); A New Angiospermic Record for Bangladesh. Journal Botanical 39(2); 249-251. Bangladesh. Van Steenis, C G G J (1987): Checklist of Generic Names in Malesian Botany (Spertamtophytes). Flora Malesiana Foundation. Rijksherbarium. Leiden, The Netherlands. Wallnofer, B (2001): The Biology and Systematics of Ebenaceae: A Review. Annalen des Naturhistorischen Museums 103:485-512. Wardani, M, U Sutisna and T Kalima (2004): Technical Guide Herbarium Flora Collection Tree Forest. Forest Info I(1). Agency for Forestry Research and Development. Center for Forest Research and Development and Nature Conservation. Bogor. Whitemore, T C, I G M Tantra and U Sutisna (1989): Tree Flora of Indonesia. Check List for Sulawesi. Ministry of Forestry. Agency for Forestry Research and Development. Forest Research & Develepment Centre. Bogor. 891 INAFOR 11P-026 INTERNATIONAL CONFERENCE OF INDONESIAN FORESTRY RESEARCHERS (INAFOR) Utilization of Palm Plants ( Arenga Pinnata Merr.) by People Around The Forest in a National Park Halimun-Salak Mountain Yelin Adalina Poster paper prepared for The First International Conference of Indonesian Forestry Researchers (INAFOR) Bogor, 5 – 7 December 2011 INAFOR SECRETARIAT Sub Division of Dissemination, Publication and Library FORESTRY RESEARCH AND DEVELOPMENT AGENCY Jl. Gunung Batu 5, Bogor 16610 892 Utilization of Palm Plants ( Arenga Pinnata Merr.) by People Around The Forest in a National Park Halimun-Salak Mountain Yelin Adalina ABSTRACT National Park Halimun-Salak Mountain (NPHSM) defined as an effort to maintain the function of the region while enhancing the benefits to the communities in and around forest. Socioeconomic improvement around the park will have a positive impact on the environment that supports the preservation of national park ecosystem. To improve the socioeconomic conditions surrounding forest plants including through utilization of various plants products palm plants. Purpose of this study was to determine the types of utilizations of palm plants by people around the forest. Research sites were in Majasari Village, Sobang sub-district, Lebak Regency, Banten province. Research approached was carried out by surveys and in-depth interviews with respondents. Data were analyzed descriptively. Result of research are: a) the number of trees that are tapped by farmers varied, ranging from 2-8 trees per day depending on the ability of farmers to conduct wiretaps; b) the production of palm sugar 30180/konjor/month/farmer with a selling price of Rp 15,000/konjor. Palm sugar production per farmer varies depending on the number of trees being tapped, the characteristics of trees, and tapping technique. Net income of farmers in the utilization of palm trees Rp 260,000 - Rp 2,390,000 million. Number of farmers‘ income varies greatly depending on the ability of farmers in maximizing the utilization of palm plants. Keywords: Utilization, palm plants (Arenga Pinnata Merr), Halimun Salak Mountain 1. INTRODUCTION Utilization of forest resources on the basis of national park is expected to further ensure the preservation of natural resources and can increase welfare benefits to local communities with more real. Existence of National Park Halimun Salak Mountain can not be separated from the community within and around the area that has a high degree of dependence on natural resources that exist in the region (Sudarmadji, 2001). National Park Halimun Salak Mountain designated as a National Park by a Forestry Ministerial Decree number 175/Kpts-II/200, situated in the Province of West Java and Banten Province include Sukabumi Regency, Bogor and Lebak with an area of ± 113,357 Ha. Seen from the destination management is one of the efforts to preserve the function of the region while enhancing its benefits to society. Expected by society around forest will increase welfare, while the integrity and preservation of natural resources in the parks maintained so that a balance between conservation efforts with efforts to increase the welfare of forest communities (Suhaeri, 1994). To improve the economics of forest communities, among other things through the utilization of various palm plant products, namely palm juice is processed into palm sugar. Palm sugar commodity has long been recognized and highly prospective Indonesian people as a commodity export. Palm plants grow and spread almost all over Indonesia, among others in Banten Province. Palm crop acreage in the Province of Banten in 2003 reached 1,633 hectares (ha) or 11 % of the total area of palm plants in the island of Java which reached 15,025 ha. Largest centers of palm plants in the province of Banten, namely in the Lebak Regency with an area 0f 1,348 ha (Directorate General of Plantations (2003) in Burhanudin (2005). 893 Palm tree is a plant that contains many benefits for society, because all parts of the plant can be used. The majority of people around the area of NPHSM precisely in Majasari village, Lebak Regency uses palm tree as a raw material processing sugar obtained from the result of tapping sap from the tree. Majasari Village is one of the villages in the Lebak Regency as palm sugar production center. But until now have not pursued the development of palm utilization optimally, due to various technical and non technical constraints. In addition to the limited knowledge of the community in the development of sugar plant products. Public knowledge of the utilization and processing of palm was traditionally a hereditary nature, so that as the development of the knowledge era will lead to crisis. People also still rely on palm which grows naturally, through the role of weasel/ferrets (Paradoxurus Hermaphroditus) and have not thought about planting seeds directly or selection. When the plant is giving high enough economic contribution when used optimally in-sufficient household. Therefore the use of palm research by community around the area of NPHSM needs to be done, so hopefully people can better optimize the utilization of palm. Purpose of this study was to determine the type of plant utilization of palm products on the surrounding community around National Park of Halimun Salak Mountain. 2. METHODOLOGY 2.1 Place and Time of Research Research was conducted in Majasari Village, Sobang District, Lebak Regency, Banten Province. Site selection study is based on the people in this village generally utilize palm tree, palm juice is processed into plam sugar. Majasari village is one of the village as the center of palm sugar production from three other villages in the Sobang District, Lebak Regency, Banten. Research was conducted in October 2011. Lebak Regency known as one of the largest palm sugar producing area in Indonesia. Production capacity reached 2,249.4 tons per year spread over 44 production centers. (Department of Industry and Trade Lebak Regency, 2005). 2.2 Material and Methods Material needed in this study are palm trees growing on private land and palm trees that grow on the forest area NPHSM, namely the Endut Mountain. Necessary equipment consist of: Thermometer, Thermohigrometer, meter, raffia and other materials supporting research. Done with descriptive method of research through a survey approach, observations and interviews using questionnaires or in-depth interviews with selected respondents, namely palm sugar producers. Data collection techniques using field observation techniques, which is by direct observation on the palm sugar producers. Necessary data in this study are: 1. 2. 3. 4. Potential of palm plants. The types of utilization of palm tress by people around NPHSM. Level of palm sugar production and palm sugar producers income. Permanent ways of harvesting of palm trees and sap processing into palm sugar. 3. RESULTS AND DISCUSSION Palm (Arengga pinnata Merril) or synonyms Arenga saccarifera Labill, family Arecaceae is one type of potential palm plants and can grow well in the tropics, including Indonesia. Palm in Indonesia were given different names among regions, among others, palm tree called tangkal kawung in Sunda language, Bakjuk (aceh), Onau (Toraja, Sulawesi/Celebes), Anau or neluluk or anggong (Java), Mana or Nawa-nawa (Ambon, Maluku) and Hanau (Dayak, Borneo) (Hastuti, 2000). 894 Palm or palm plant (Arengga pinnata) can reach heights of up to 20 meters with trunk diameters reaching 65 Cm. Palm tree can grow at an altitude of about 500-800 meters above sea level (asl). This tree can grow in any soil conditions such as clay, calcareous soil and sandy soil, but not resistant to the soil with too acidic conditions with rainfall about 1,200 Mm per year with moderate-to-wet climate. Depth of 1-3 meters of water needed by an average temperature of 25oC. Palm plants that grow in the region of NPHSM especially Endut mountain and grown on land owned by villagers in the Majasari Village is a plant that‘s not cultivated, in other words wild plant with the spread of growth by raccoons or badgers (Paradoxurus Hermaphroditus). Undigested sugar palm fruit seeds are discharged through the ‗back door‘ and then germinate and grow become palm tree with an irregular distribution. Palm tree that grows in the region NPHSM (G. Endut) as well as on private land tends to spread and irregular. Based on field observation conducted in the region of NPHSM precisely in the Endut mountain Cimangkok block, which lies about 3 Km from the Majasari village, suggesting that the spread pattern of palm trees are not regular, as well as palm trees growing on private land. Potential measurements palm plants that exist around the foot of Mount Endut with area 400 M2 (measuring 20 x 20 meters) showed that the palm tree that grows as much as seven trees, and the number of palm trees that can be tapped as many as three trees. Potential measurements palm plant at the foot of the mountain Endut amounted to 29 trees, and plants that could be tapped had totaled five trees. This suggest that at least the potential of palm plants are ready to be tapped by communities around the forest for which the sap can be utilized that can be made palm sugar. Besides many palm trees growing around the cliff so that people can use it less because of a very high risk if fallen from the tree while climbing palm trees. (1) (2) (3) Figure 1: Measurement of palm trees at the foot of the mountain Endut 2. and 3. Palm trees that grow on private land Table 1. Measurement of height and diameter of the palm trees in the mountain region Endut, Cimangkok block, Majasari village, subdistrict Sobang Plot 1 No. Height Diameter Explanation (m) (cm) 1. 6 32 Number of 2. 8 15 palm trees 7, 3. 11 25 trees that can 4. 3 7 be tapped 3 5. 4 24 trees, 2 trees 6. saplings 7. 8. Plot 2 Height Diameter Explanation (m) (cm) 16 80 Number of 13 47 palm trees 29, 6 55 trees that can 2 35 be tapped 5 6 47 trees, 21 trees 12 57 saplings 8 58 6 35 895 3.1 The Types of Products Palm Tree Use In Majasari Village In general community/farmer in the Majasari village utilize palm tree limited to the utilization of sap is then processed into palm sugar. Farmers are not optimizing the utilization of palm plants due to the terms of marketing. Other than that tapping work is generally done by an old farmer, while young people prefer to work outside the village or work in the farm. The average ownership of productive palm plants in the Lebak Regency about 11 trees. Palm plants which include the productive age between 7-23 years, while plants that can be tapped or dideres aged between 7-8 years with intercepts tapping ranging from 7-15 years old (Forestry and plantation office Lebak Regency(2005) in Rachman (2009)). Number of farmers done palm wire tapping in Majasari village about 45 farmer. Most farmers in conducting wiretaps of palm tree is as a side job, so the number of trees tapped were not many, which is an average of two trees. This is because the wiretapping does not require a considerable outpouring of time, which is about one hour in the morning or late afternoon. In general the main job they worked on farms. Number of palm trees that are tapped by farmers/penderes which is the main job, which is an average of five to seven trees. Outpouring of their time in doing this work more, i.e. from morning to evening while waiting for cooking palm sugar that they do in the area/region. Palm tree is a plant that has many benefits. When calculated, the tree is able to provide income for their owners to 12 million rupiah over three years. However, not many tapper (penderes) and the owner of the palm tree that can maximize the benefits. The types of utilization of palm trees by farmers/penderes in Majasari Village, include: Palm juice to be processed into palm sugar Fibers Palm fruit as kolang kaling Young palm leaves as a tobacco wrapper Palm trunk as firewood Table 2. Types of palm trees utilization in Majasari village No. Farmer‘s Name 1. Sadropi Number of palm trees on private land/region 10 2. 3. Sarbani Adik 30 100 4. 5. 6. Jumadi Hasan Komarudin 50 10 20 7. Sapri 15 Number of Type of utilization of palm trees palm that are tapped 2 Palm juice, kolang kaling, young plam leaves, firewood, fibers 2 Palm juice, kolang kaling 8 Palm juice, kolang kaling firewood, fibers 6 Palm juice, fibers 7 Palm juice, kolang-aling 4 Palm juice, fibers, kolang kaling 4 Palm juice Location of the utilization of palm In NPHSM area In NPHSM area Private land Private land Private land In NPHSM area In NPHSM area 3.2 Palm Juice Palm trees produce sap or palm juice that can be made into palm sugar, beverages (lahang) and also can be made into ethanol (ethyl alcohol), which is an alternative fuel to replace kerosene, LPG, and gasoline. Besides palm juice can be used for drugs such as constipation, irregular 896 menstruation, dysentery, pneumonia and inhibits absorption of cholesterol. Economically, palm trees serves as a source of income for most people, especially in Majasari village, Lebak regency of Banten. In general people in this village take advantage by taking the palm trees juice to serve as a printed palm sugar. Manufacture of palm sugar made by penderes/farmer in the Majasari village are still traditionally and process of manufacture/production done in the private land or in the forest area. Raw material for making palm sugar derived from sugar juice or called sap, the male flower stalks that can be tapped when the palm was five years old with peak production at the age of 15-20 years. Characteristic of each palm trees different, and tapping technique every penderes/farmer on generally different, so not all tapper succeed in tapping palm juice. Results of tapping palm juice is usually only processed into printed palm sugar. 3.3 Palm Fruit Palm fruits can be processed into food called kolang kaling. Farmers generally do not use palm fruit by process them into kolang kaling by itself, because the manufacturing process is rather difficult, to perseverance, need perseverance and prudence in the processing process because the palm fruit sap causing itching on the skin. Therefore, farmers prefer to sell the palm fruit is still on the tree to the kolang kaling craftsmen with an average price of IDR 20,000.00IDR 25,000.00 per hand. Number of hands in a single tree varied, ranging from two to six hands palm fruit. Figure 4: Palm fruit as an ingredient of kolang kaling 3.4 Palm Leaves In general, farmers in the Majasari village exploit the young palm leaves to be rolled cigarette which is then filled by tobacco. Some residents in the Majasari village used old palm leaves as a house roof or gazebo. Figure 5: Palm leaves as roof 3.5 Palm Fibers Farmers in the majasari village generally less utilize palm fibers. This was due to marketing problems that do not exist so they are less interested in making fibers. As for the use of palm fibers are actually immigrants from Sukabumi who had come to the Majasari village every three months. Fibers that they get can reach two or three trucks each retrieval. This they do because the fibers marketing in the area of Sukabumi very prospect. Almost all the buildings store along the road between Ciawi until Sukabumi sell fibers, which was the source of the fiber mostly from Majasari village areas. Farmers who have palm trees on private land only rewarded minimally 897 entrants collector of fibers. Whereas when farmers in the Majasari village itself utilize this palm fibers, it can increase household income, there should be no entrants in the decision-palm fibers into this region. Figure 6: Palm fibers 3.6 Palm Sugar Production Average number of palm trees that are tapped by farmers/penderes in Majasari village varied, that is two to four trees per day. Tapping sap was done by the farmer in the morning and afternoon. This depends on the ability of farmers in the wiretapping, because in general the tapping done by old farmers, while young farmers generally less interested in doing this work. This is because the risk is too high in a climbing palm trees with an average height of trees reach 8-12 feet. Average production of printed palm sugar that produced by penderes in Majasari village as much as two konjor/day from two to four palm trees are tapped. Farmers produce printed palm sugar into two types/qualities. Low sugar quality/quality number two which are sold to middlemen at a price IDR 7,500.00/konjor or IDR 15,000.00/head, while the good quality sugar/number one, the farmers sell directly to the people around/direct buyers at a price of IDR 15,000.00/konjor or Rp 3,000.00/head. One konjor sugar consists of five printed sugar head that arranged and wrapped in banana leaves or bark that has been dried. Middlemen sell printed palm sugar to the shop/market price of IDR 10,000.00-IDR 12,500.00/konjor or IDR 2,000.00- IDR 2,500.00/head to quality printed palm sugar quality number two, while the price sold in the shop/market IDR 15,000.00 – IDR 20,000.00/konjor or IDR 3,000.00 – IDR 4,000.00/head. Selling price of printed palm sugar quality level number one in market/shops in Lebak Regency, the average IDR 22,500.00- IDR 25,000.00/konjor or IDR 4,500.00- IDR 5,000.00/head. Middleman profits earned an average of IDR 2,500.00- IDR 5,000.00/konjor, while the rate of profit in the shop or on the market an average of IDR 5,000.00- IDR 7,500.00/konjor. Benefits for farmers are very small, and in general they do not take into account the energy that they have sacrificed/are doing. If their wages labor is taken into account in the process of tapping the sap until it becomes printed palm sugar does not match with what they‘ve done/sacrificed with a very high risk if it falls from a tree while wiretapping. Palm sugar become a source of live hood for farmers in the production centers of palm sugar. One palm sugar production centers in Indonesia are in the Lebak regency. Lebak regency as one of the largest palm sugar producing area in Indonesia. Palm sugar industry in these regency absorb the workforce 5,406 through 2,982 micro and small units. Production capacity reaches 2,249 tons per year spread over 44 production centers (Department of Industry and Commerce, Lebak Regency, 2005). 898 Figure 7. Palm sugar that sell in the shops Figure 8. One konjor of palm sugar Income of each farmer in the use of palm products vary widely, ranging from IDR 260,000.00 – IDR 2,390,000.00/month. This depends on the ability of farmers in optimizing the utilization of palm trees. Revenues are spread in the utilization of palm, from palm juice products are processed into printed palm sugar. Size of the income of farmers from the number of trees being tapped, but it depends on the technique of tapping palm sap. Other products such as sugar palm fruit and palm fiber selling prices are very cheap, not as good as the selling price of printed palm sugar and tend to be seasonal. Table 3. Sugar palm farmers‘ income in Majasari village, Sobang Regency Name Number of trees that are tapped Palm sugar production (konjor/3 months Palm sugar income/3 months (IDR x 1,000) Palm fruit (hand) sadrap 2 90 Sarban 2 90 Adik 8 450 Jumadi 6 540 Hasan 7 360 Komarudin 4 180 Sapri 4 360 1,350 1,350 6,750 8,100 5,400 2,700 5,400 2 1 5 - 6 200 liter kolang kaling 600 - Palm fruit income/3 months (IDR 50 25 100 300 x 1,000) Fibers (thread) 5 24 9 15 Fibers income/3 months (IDR x 5 72 9 15 1,000) Gross Income/3 months (IDR x 1,405 1,375 6,922 8,109 5,700 3,315 5,400 1,000) Gross Income/year (IDR x 1,000) 2,810 2,750 13,844 16,218 11,400 6,630 1,800 Production costs/year (IDR x 1,175 1,175.5 1,827.5 1,863.5 1,366.5 1,211 949 1,000) Net income/year (IDR x 1,000) 1,635 1,574.5 12,016.5 14,354.5 10,033.5 5,419 9,851 Net Income/month (IDR x 1,000) 270 260 2,000 2,390 1,670 900 1,640 Caption: Palm sugar price IDR 15,000.00/konjor, Palm fruit price IDR 20,000.00- IDR 25,000.00/hand, Kolang kaling price IDR 3,000.00/liter, Fiber price IDR 1,000.00- IDR 3,000.00/thread. Palm sugar production in a year counted for 6 months 899 3.7 Processing of Palm Juice Into Printed Palm Sugar Palm sugar production process at the farm level is done using very simple equipment. Equipment needed in the production process of palm sugar consists of: lodong or bamboo to hold the sap, pot, stirrer, stove, firewood, sieve sap, tapper‘s machetes, bats (paninggur), konjor or palm sugar molds made of wood. Production process starting from tapping palm sugar sap, sap cooking, stirring and printing of palm sugar. Sap tapping done in the morning and afternoon. Before doing the tapping lodong or bamboo cleaned using fibers and water. If lodong bamboo less clean then sap will ferment quickly and the resulting printed sugar taste a bit sour because of the fermentation. Sap is collected in bamboo rod with a length of one meter and storage process can take up to three months continuously without stopping. Each tree can produce 10-15 liters of juice per day by tapping twice on the morning of the day and evening. The morning leads sap filtered, and poured into the pot and cooked until done in order to half-finished printed sugar then stored. Result leads sap should be cooked as soon as possible because the palm juice only stand for about three hours. If not immediately processed into sugar it will turn into a palm wine to drink or vinegar with ethanol content of up to 4% (Burhanudin, 2005). The lead late sap is mixed with the sap in the morning leads that has been cooked, then the mixture is cooked again. On the ripening process sap added a little cooking oil or coconut oil as much as 10 grams for 25 liters of sap. Cooking is done until the liquid sap becomes concentrated and must often be stirring. Scum and dirt are washed away. Then the concentrated sugar liquid is printed in the mold made of wood, and cooled. Before use, the mold wood is cleaned by using lime water and soak them with water to facilitate the release of palm sugar. The cooking of palm juice or sap until the liquid become concentrated until ready to be molded into printed palm sugar approximately 4-6 hours, depending on the amount of sap is cooked. Figure 9: Location of printed palm sugar manufacture 900 3.8 The Process Stages of Making Print Palm Sugar (1) (2) (11) (3) (4) (10) (9) (5) (8) (6) (7) Pictures caption: 1. 2. 3. 4. 5. 6. 7. 8. 9. 10. 11. Lodong bamboo cleaning Lodong fumigation Lodong storage in palm tree Beating the palm tree with paninggur Finished climbing lodong storage The result of tapping palm juice to be processed Ripening process of sap Thick palm sugar which is ready to be printed Palm sugar that has been printed Production of palm sugar Palm sugar ready for market 4. CONCLUSION Palm plants that grow in the NPHSM region, especially in mountain Endut and growing on private land in the Majasari village is a plant that is not cultivated/wild plants growing spread by raccoons or badgers (Paradoxurus hermaphroditus). Farmer/penderes in Majasari Village utilize of use palm tree limited on utilization of sap which then processed into palm sugar, not to optimize the utilization of palm trees yet. Printed palm sugar production produced by penderes in Majasari Village on average 2 konjor/day from 2-4 palm trees are tapped. Size of the income of farmers depend on the ability of farmers from the amount of trees that are tapped and sap tapping technique. REFERENCES Burhanudin, R (2005): Prospek Pengembangan Usaha Koperasi Dalam Produksi Gula Aren. arenindonesia.wordpress.com/berita-aren. Dinas Perindustrian, Perdagangan dan Penanaman Modal Kabupaten Lebak (2005): Profil Potensi Komoditi Gula Aren, Lebak. Hastuti, J (2000): Etnobotani Aren pada Masyarakat Baduy di Banten. Skripsi pada Jurusan Manajemen Hutan. Fakultas Kehutanan, Institut Pertanian Bogor. Unpublishhed. 901 Rachman, B (2009): Karakteristik Petani dan Pemasaran Gula Aren di Banten. Forum Penelitian Agro Ekonomi 27(1). Sudarmadji (2001): Peran Serta Masyarakat Sekitar Daerah Penyangga Dalam Upaya Pengelolaan Keanekaragaman Hayati TNGH. Disampaikan pada Workshop Pengelolaan Keanekaragaman Hayati Melalui Optimalisasi Peran Masyarakat Daerah Penyangga TNGH, di Caringin Bogor, Tanggal 24-25 November. Suhaeri (1994): Pengembangan Kelembagaan Taman Nasional Gunung Halimun. Thesis Program Pasca Sarjana Institut Pertanian Bogor. Unpublished. Yogi, K (2009): Satu Pohon Aren Mampu Hasilkan Rp 12 Juta. http://m.suaramerdeka.com. [1] 902 INAFOR 11P-027 INTERNATIONAL CONFERENCE OF INDONESIAN FORESTRY RESEARCHERS (INAFOR) Structure and Composition of Vegetation in Northern Part of Mount Gede and Their Implication for Conservation Sudarmono Centre for Plant Conservation, Bogor Botanical Garden, Indonesian Institute of Sciences Jl. Ir. H. Juanda No. 13 Bogor, 16122, INDONESIA Corresponding email: [email protected] Poster paper prepared for The First International Conference of Indonesian Forestry Researchers (INAFOR) Bogor, 5 – 7 December 2011 INAFOR SECRETARIAT Sub Division of Dissemination, Publication and Library FORESTRY RESEARCH AND DEVELOPMENT AGENCY Jl. Gunung Batu 5, Bogor 16610 903 Structure and Composition of Vegetation in Northern Part of Mount Gede and Their Implication for Conservation Sudarmono Centre for Plant Conservation, Bogor Botanical Garden, Indonesian Institute of Sciences Jl. Ir. H. Juanda No. 13 Bogor, 16122, INDONESIA Corresponding email: [email protected] ABSTRACT Mount Gede-Pangrango National Park (MGPNP) is located in Cianjur regency, West Java. It lies on Northern Part of Mt. Gede and is close to Cibodas village and tea plantation. This forest as water catchment and has floral species richness which has a role to sustain the function of such a national park. The objective of this study was to explore the plant species structure and composition in Northern Part of Mount Gede and their implication for conservation. Data were collected from the plots established on study site and analyzed descriptively – quantitatively using Important Value Index (IVI). The results showed that, Villebrunea rubescens was dominant (IVI=45.15%) in the tree stage with the diameter of 16-20 cm, followed by Altingia excelsa (39.77%) and Schima walichii (21.92%). Altingia excelsa was the dominant species in tree stage. Seedling stage was dominated by Villebrunea rubescens. Plant species richness in the sapling stage could guarantee the sustainability of forest in the future of Northern Part of Mt. Gede, including flora and fauna conservation in the ecosystem of Mt. Gede. Keywords: Dominant species, flora, sustainability, Mt. Gede 1. INTRODUCTION Mount Gede or Gunung Gede is a stratovolcano in West Java, Indonesia. The volcano contains two peaks with Mount Gede as one peak and Mount Pangrango for the other one. Historical volcanic activity has been recorded since the 16th century. Gunung Gede and Pangrango are the first five parks that had distinction of launching Indonesias National Park Program. Located on Bogor, Cianjur and Sukabumi districts with cover area around 15,196 ha. It is the most accessible mountain to climb from Jakarta. By only 2 hours drive south of Jakarta and 5 " 6 hours trekking, you will find a tranquil rainforest, self guided trail and a spectacular view of West Java from the peak. The national park consists of twin volcanoes: Gede 2,958 m above sea level (asl) and Pangrango 3,019 asl. The two summits are connected by a high saddle known as Kandang Badak, 2,400 m asl. The mountain slopes are very steep and are cut info rapidly flowing stream, which carve deep valleys and long ridges. For those fortunate enough to stand on the summit of Mount Gede in clear conditions the view is spectacular. The sub-montane ecosystem is characterized by many large, tall trees like jamuju (Dacrycarpus imbricatus) and puspa (Schima wallichii). The sub-alpine ecosystem, meanwhile, is characterized by grassy meadows of Isachne pangerangensis, edelweiss flower (Anaphalis javanica), violet (Viola pilosa), and sentigi (Vaccinium varingiaefolium). The objective of this study was to explore the plant species structure and composition in Northern Part of Mount Gede and their implication for conservation. 904 2. MATERIAL AND METHOD 2.1 Location and Time Ecological research will be carried out in the National Park of Mount Gede Pangrango, West Java. Research was carried out in the resort for Cibodas. Research carried out for a month, i.e. in June 2011. 2.2 Data Collection Research The Plot is made to six lanes within the forested buffer around the Lake. The spread of the population in some areas in West Java, according to data dissemination of observations at the Herbarium Bogoriense herbarium sheets that had been done before (activities 2009). In every region, conducted sampling by making observations based on the difference in height of plot where appropriate divisions of the riparian vegetation. Steenis (1972), that is under 1000 m above sea level, 1000-1500 m above sea level, 1500-2500 m above sea level and above 2500 m above sea level. At any height made sampling data retrieval with vegetation sampling methods for the parallel systematic (Cropper, 1993) which fitted cut contours, in a number of plots that are built with rectilinear plot nesting along transect technique. For the seedling stage plot that was built for, size 2 x 2 m, sapling stage of 5 x 5 m, pole stage 10 x 10 m, and the tree of 20 x 20 m. The Data collected is the number of individuals, species, and the diameter of the breast for tall trees, poles and sapling stages (Indriyanto, 2006). High stem and the diameter of a heading is also measured. Plant vegetation down or are stuck in the trunk (liana, herbaceous, fern, orchids, palms, pandanus, and others) observed qualitatively. All identified specimens in the Herbarium Bogoriense carefully, Biology Research Center, Cibinong, LIPI. 3. MATERIAL AND METHODS The material and the tools used that is Global Positioning System (GPS), hygrometer, the altimeter, the meter (50 metre), the meter (especially the diameter gauge), the pH metre, cutting scissors, big plastic, the field book, the label, the pencil, newsprint, alcohol, the rope and the digital camera. 3.1 Data Analysis Descriptive data took the form of the name of plants, it was identified the scientific name et cetera then was processed to get the important value index (IVI). This important value index was the number of the relative densities (RDs), the relative dominance (RD) and the relative frequency (RF) cited from Soerianegara and Indrawan (1978) formula: IVI = RF + RDs + RD. Where: RF = the number of plot was filled up by a species : the total number of all plot x 100 %; RDs = the number of individuals of a species: the density of all the species x 100 %; RD = the domination of a species : the domination of all the species. Especially the level of the seedling of IVI = RF + RDs. Furthermore this important value index was made the basic in determining the level of the domination of a tree species in Mount Gede. 3. RESULT AND DISCUSSION 3.1 Tree Structure and Composition At the northern part of Mount Gede location, stands the most widely encountered and the dominant species is Villebrunea rubescens with the largest diameter class 20 cm and less. In this plot, the area is rather open because the stands are already much diminished, especially in the 30905 50 cm diameter class. In general, fallen trees, and the succession has not reached a climax, especially with invasive plant Passiflora suberosa disorders. In the plot transect an area of 4 hectares with a size of 200x200 m2 recorded 9,394 trees or 2,348 trees/ha. Wijaya (1999) observed in the same area that on 1999 recorded 787 trees or density 394 trees/ha in area of 2 hectares with a size 20 x 1000 m2. So for 10 years (1999-2011) in the north slope of the Gede Mountain had the density twice the fold and his diversity were also high with increasingly the width of the observation plot (Table 1). Table 1. Comparative tree density in southern part and northern part of Mount Gede No. Location 1 Southern part Mt. (Bahrudin 1997) Southern part Mt. (Soeliestyadewi 1993) Northern part Mt. (Wijaya 1999) Northern part Mt. (recent studied 2011) 2 3 4 Plot size (m2) Gede Altitude (m asl) 1,700. 100x100 Wide (ha) 1 Tree density 553 Species number 43 Gede 1,350 100x100 1 655 43 Gede 1,500 20x1000 2 394 106 Gede 1393 1450 200x200 4 2,348 232 – Stands that have important value index (IVI) high on the Northern part Mount Gede for the tree level, ie Villebrunea rubescens (45.15%), Altingia excelsa (39.77%), Schima walichii (21, 92%), and others are presented in Table 2. It appears from the common plant species on the northern slope is composed of trees having a diameter below 30 cm, while the trees that have a diameter greater than 51 cm is dominated by Altingia excelsa and Schima walichii (Tabel 3). Table 2. Results of vegetation analysis of tree category at Northern part of Mount Gede No. 1. 2. 3. 4. 5. 6. 7. 8. 9. 10. Scientific name Villebrunea rubescens Altingia excelsa Schima walichii Macropanax dispermum Saurauia blumeriana Persea rimosa Castanopsis argentea Saurauia pendula Ficus ribes Laportea stimulans RDs (%) 16.81 9.05 6.03 7.33 7.33 5.60 4.31 4.74 4.74 3.02 RF (%) 19.5 10.50 7 8.5 8.5 6.5 5 5.5 5.5 3.50 RD (%) 8.85 20.22 8.89 5.09 4.82 5.33 5.34 3.30 2.71 1.49 IVI (%) 45.15 39.77 21.92 20.92 20.64 17.44 14.65 13.54 12.96 8.01 Notes: RDs = Relatives Density; RD = Relatives Dominant; RF = Relatives Frequency; IVI = Important Value Index Table 3. Species dispersal based on diameter class of Mount Gede, West Java No 1 2 3 4 5 Tree species Villebrunea rubescens Altingia excelsa Schima walichii Macropanax dispermum Saurauia blumeriana 16-20 20 0 1 6 7 34 21-30 17 0 1 6 8 32 Diameter class (cm) 31-40 41-50 0 1 1 3 1 1 2 3 1 0 5 8 906 Total > 51 0 17 10 0 1 28 38 21 14 17 17 107 3.2 Conservation Implication The tree with the diameter below 30 cm in five main tree species in the north part of the Gede Mountain totalling 61,7% (66 trees) showed the process of the succession of proceeding vegetation well (the Table 1). However the existence of the old tree or trees with diameter more than 50 cm totalling 26% (28 trees) that was dominated by two species, there are Altingia excelsa and Schima walichii then was worried when the strong wind happening then fell and died like that happened during 2006. The pattern of conservation could be done by protecting the seedling from to two big trees and when must be carried out by the distance away to the seedling from Altingia excelsa and Schima walichii as well as monitored his growth. 4. CONCLUSION Seedling stage was dominated by Villebrunea rubescens. Plant species richness in the sapling stage could guarantee the sustainability of forest in the future of Northern Part of Mt. Gede, including flora and fauna conservation in the ecosystem of Mt. Gede. REFERENCES Anonymous (2008): Cibodas Biosphere Reserve Species of Flora. http://www.conservation.or.jp/partners/NEC.files/CAPBUILD/UNESCO/ASIA/CIBODAS 2/CIBODAS5.HTM Burkill I H (1966): A Dictionary of Economic Product of Malay Peninsula. London Cropper S C (1993): Management of Endangered Plants. East Melbourne: CSIRO Publications. hlm.32. Indriyanto (2006): Ekologi Hutan. Jakarta: Bumi Aksara. 210 hlm. Soelistyadewi (1993): Fitososiologi hutan pegunungan bawah di lereng selatan Gunung Gede Taman Nasional Gunung Gede Pangrango, Jawa Barat. Skripsi Fakultas Biologi Universitas Jendral Soedirman, Purwokerto. Unpublished. Sunaryo B and Rugayah (1992): Flora Taman Nasional Gede Pangrango. Bogor: Herbarium Bogoriense. Steenis CGGJ (1972): The Mountain Flora of Java. E.J. Brill, Leiden. Soerianegara, I and A I Indrawan (1978): Ekologi Hutan Indonesia. Fakultas Kehutanan IPB, Bogor. Whitten T, RE Soeriaatmadja and SA Afiff (1996): The Ecology of Java and Bali. Periplus Editions, Singapore. Hal. 497-538. Wijaya O (1999): Dinamika populasi pohon di pegunungan atas lereng utara Gunung Gede Taman nasional Gunung Gede Pangrango, Cibodas, Jawa Barat. Skripsi Jurusan Biologi FMIPA Universitas Pakuan, Bogor. Unpublished. 907 INAFOR 11P-028 INTERNATIONAL CONFERENCE OF INDONESIAN FORESTRY RESEARCHERS (INAFOR) Medicinal Plants of Pangelekan Coastal Forest, Ciamis, West Java, Indonesia Marfuah Wardani and Titik Setyawati The Center for Research and Development on Forest Conservation and Rehabilitation Jl. Gunung Batu 5, Bogor 16610, INDONESIA Corresponding email: [email protected]; [email protected] Poster paper prepared for The First International Conference of Indonesian Forestry Researchers (INAFOR) Bogor, 5 – 7 December 2011 INAFOR SECRETARIAT Sub Division of Dissemination, Publication and Library FORESTRY RESEARCH AND DEVELOPMENT AGENCY Jl. Gunung Batu 5, Bogor 16610 908 The Establishment of Nyamplung (Calophyllum inophyllum) Based Forest Plantation in Coastal Areas as Source of Potential Biofuel Energy to Support Sustainable Forest Management M.Yamin Mile and Encep Rahman Agroforestry Technology Research Institute 1. INTRODUCTION Nyamplung (Calophyllum inophillum) is one of tree speciens of gutterseae, growth ini low land especially in coastal fegion. The geographical distributions are South India, Malaysia, Indonesia and Australia. Nyamplung have a high tolerant to the extream conditions such sandy and degredation areas (Stiven, 1998). The tree has 15- 30 meter high and have a great number of branches with 25 cm size of flower. Fruiting available almost along the year consist of two fruiting period of April- Auguast and October- March. Nyamplung produce a hard wood for forfurniture. The most interesting is the used of nyamplung to produce potential energy biofuel besides other use such as medical for a certain desieses. ( Dirk HR, 2008;Yindjo et al., 2005; Mataka et al., 2004). Research activities on nyamplung In Indonesia just recently started but still in limit number. This is the reason of still limitation in using nyamplung for bioful energy. 2. NYAMPLUNG AS GREEN ENERGY POTENTIAL Nyamplung recognized is one of the most possible anternatif biofuel energy plant because of a number of adventages such as: to replace other no compotition with food High adaptation to grow even in marginal soil condition easy in regeneration produce a great number of fruit in almost the whole year -have other used such as medical for a certain desieses the stand can be used as winbreak and filter for a high saline water pavour from the sea Have a high oil rendamen (73 %) compare with other biofuel energy plant such as jarak 50 %, sawit 50 % oil produced suitable for the international biodiesel standard quality double flameable ability compare with petroleum Based on above advantages, nyamplung will be the ultimate choice for renewable source of energy. However this ultimate choice will never have positif impact if no supporting from the National policy in supporting nyamplung as source of biofuel energy . The government play an importen role in arranging, rule making and marketing the biofuel oil from nyamplung. 909 3. RESEARCH ON FRUIT PRODUCTION POTENTIAL AND PLANTATION PROJECTION OF NYAMPLUNG 3.1 Nyamplung Fruit Production at Batukaras Figure 1: Nyamplung in natural condition of coastal forest 910 Figure 2: Observation on fruit production of nyamplung in Batukaras on May- August 2010 in different diameter class) The chart show that fruit production of nyamplung vary based on diameter class 3.2 Total Fruit Production Total nyamplung fruit production during flowering periode April-August in Batukaras, Ciamis Figure 3: Research on potential fruit production 911 Fgure 4: The Total Fruit Production in fruiting period of April-Agustus in Batukaras Both chart show the total fruit froduction from every sample of trees. The chart show t a trend that the more diameter the more fruit production. Nyamplung with >40 cm diameter produce 160-200 kg seeds per years. Based on this observation can be estimeted for one ha nyamplung with 400 trees may produce 64 ton seeds.. From these estimation it can be predicted the total production from a certain farm areas. Based on biofuel demand proyection, the nasional demand of biofuel arround 2-5 % from nasional fuel cosumtion have been planned by the Indonesian government. The biofuel need in 2012 estemeted about 720 kiloliter. If all of the biofuel demand will be supplied by nyamplung (assumption 2.5 kg nyamplung seeds for one liter biofuel). Information abaut production potential of nyamplung is usueful to improve slvicultural techniques. Plantation nyamplung in coastal region some time facing some silvicultural problems. By improving silvikultural techniques will support the plantation nyamplung in larger areas especially in improving environmental condition in coastal regions. 912 4. CURRENT SILVICULTURAL RESEARCH ON NYAMPLUNG 4.1 Nursery Techniques The treatmen using media consist of top soil and manure (1:1) become the best, germinate average 13 day after planted with the growth reach 97 % Figure 5: Nyamplung seedling in nursery 4.2 Growth Ability The tratment using media top soil with manure (1:1) after 3 month growth reach 28.42 cm will be the best performance compare other treatments. 4.3 Plantationn Plantation nyamplung in coastal areas need a certain techniques because of extreme condition of both sandy soil and other environment condition such as temperature, humidity and wind with high content of salt. One of the sucsseesful technique is using bronjong made by bamboo 1.5 cm high and 60 cm of diameter to protect from an ectreme wind blowing, tempersatur and humidity. 913 Figure 5: Treatments on nyamplung plantation techniques in Batukaras using bronjong Figure 6: Mix plantation of nyamplung in coastal areas of Batukaras Ciamis 914 5. NYAMPLUNG BASED SUSTAINABLE COASTAL FOREST MANAGEMENT Currently arround three million nyamplung seddling have been planted in various places in Indonesia. The plantation will cover 400,000 ha in different location.. Ministry of forestry get that task as supplayer of standard materials of biofuel energy. This step is part of national energy policy which put the target in 2025 , biofuel used of 5 % of the total nasional energy needed. The developmen of nyamplung plantation in coastal area will support sustsinable forest management with some adventage such as: play importend role on reducing emission of carbon protected coastal areas from tsunami disaster, abrasion and other environmetal destruction create pavorable micro climate increased famer income 915 INAFOR 11P-029 INTERNATIONAL CONFERENCE OF INDONESIAN FORESTRY RESEARCHERS (INAFOR) Medicinal Plants of Pangelekan Coastal Forest, Ciamis, West Java, Indonesia Marfuah Wardani and Titik Setyawati The Center for Research and Development on Forest Conservation and Rehabilitation Jl. Gunung Batu 5, Bogor 16610, INDONESIA Corresponding email: [email protected]; [email protected] Poster paper prepared for The First International Conference of Indonesian Forestry Researchers (INAFOR) Bogor, 5 – 7 December 2011 INAFOR SECRETARIAT Sub Division of Dissemination, Publication and Library FORESTRY RESEARCH AND DEVELOPMENT AGENCY Jl. Gunung Batu 5, Bogor 16610 Medicinal Plants of Pangelekan Coastal Forest, Ciamis, West Java, Indonesia 916 Marfuah Wardani and Titik Setyawati The Center for Research and Development on Forest Conservation and Rehabilitation Jl. Gunung Batu 5, Bogor 16610, INDONESIA Corresponding email: [email protected]; [email protected] ABSTRACT Pangelekan is a coastal forest in Ciamis, West Java, Indonesia. This forest is an interesting site for medicinal plants research due to its flora richness. Thorough exploration was carried out in the study areas during July 2010. There were 15 species of traditional plants identified during the study, Barringtonia asiatica (L.) Gaertn., Caesalpinia crista Linn., Calophyllum inophyllum L., Cayratia trifolia (L.) Domin, Crataeva magna (Lour.) DC., Desmodium heterophyllum DC., Dodonaea viscosa Jacq., Hernandia nymphaeifolia (Presl.) Kubitzki, Hibiscus tiliaceus L., Ipomoea pescaprae (L.) R.Br., Lantana camara L., Mallotus blumeanus Muell. Arg., Pongamia pinnata (L.) Pierre, Terminalia catappa L., Thespesia populnea (L.) Sol. ex Correa. Keywords: Medicinal plants, uses, coastal forest 1. INTRODUCTION Natural forest in Indonesia have a diversity plant species is relatively high. It is estimated that there are 250,000 to 400,000 species of flowering plants, including species of plants important in medicinal. Zuhud (2009) estimated that there are 2,039 species of medicinal plants occurring in Indonesia forest areas, and 65 species of them grown in coastal forest ecosystems. Pangelekan coastal forest is one area that predicted to have a diversity of medicinal plants prospected to be developed. It is not only important as a source of timber, but also produce non timber product such as medicinal plants. The communities around the forest area are still utilizing some plants species to treat a disease. A study carried out to get information about the medicinal plants in that coastal forest area. It seems important to take management and to protect them. Data on the medicinal plants is also important for research on pharmacology and the coastal forest management. This paper present the results of a study of the plants in the Pangelekan coastal forest, Ciamis, West Java that are used for medicinal. 2. METODOLOGY 2.1 Location Pangelekan coastal forest is located at near Batukaras Village, Cijulang District, Ciamis Regency, West Java. This location is between 1080 30' 007" - 1080 30' 143" E and 070 43' 650"- 070 43' 923‖ N. The area consists of lowland with an undulating topography at 0 to 29 m above sea level. The soils type is Sandy and Alluvial sediments (Institute Soil and Fertilization Research, 1965). According to Schmidt and Ferguson (1951), the climate at the location is type B; with the average annual rainfall is around 3,196 mm per year. Temperatures between 250 C to 300C, and humidity 80% to 90%. 2.2 Data Collection 917 The observation was carried out during July 2010. We used the explorative method for the inventory of traditional medicinal plants using local people as guide. The identifications were carried out at the Herbarium of Rehabilitation and Conservation Research and Development Centre Bogor. 3. RESULT AND DISSCUSSION 3.1 Medicinal Plants We identified 15 species of medicinal plants belonging to 15 genera‘s and 12 families (see Table 1.). Tabel 1. List of medicinal plants in Pangelekan coastal forest No. Species Local Name (Javanese) Family Habit Uses for Medicinal 1. Barringtonia asiatica (L.) Gaertn. Butun Lecythidaceae Tree Leaves, seed oil 2. Caesalpinia crista Linn. Bongseng Leguminosae Liana Roots, leaves, seeds 3. Calophyllum inophyllum L. Nyamplung Guttiferae Tree 4. Cayratia trifolia (L.) Domin Galing Vitaceae Climber Latex, barks, seeds Leaves. 5. Crateva magna (Lour.) DC. Barunday Capparidaceae Tree Roots, barks, leaves 6. Desmodium heterophyllum Dc. Dodonaea viscosa Jacq. Ki mules Leguminosae Slender herb, Roots, twigs, leaves Cantigi pantai Sapindaceae Hernandia nymphaeifolia (Presl.) Kubitzki Hibiscus tiliaceus L. Borogondolo Hernandiaceae Shrub to small Wood charcoal, barks, tree leaves Tree Roots, leaves, fruits Waru limit Malvaceae Shrub to tree Roots, leaves 10. Ipomoea pescaprae (L.) R.Br. umbian Convolvalaceae Slender herb, Roots, leaves, seeds 11. Lantana camara L. Cente, tai kotok Verbenaceae Shrubs, herb Leaves Tree Leaves 7. 8. 9. 12. Mallotus blumeanus Muell. Arg. Waru laut, calik Euphorbiaceae angin 13. Pongamia pinnata (L.) Pierre Binong, ki pahang Leguminosae laut 14. Terminalia catappa L. Ketapang Combraetaceae 15. Thespesia populnea (L.) Sol. ex Waru lot Correa Malvaceae 918 Tree leaves, Roots, Leaves, barks, seeds Tree Roots, latex of bark, leaves, seeds Shrub or small Heartwood, tree leaves, fruits, seed oil In table 1 shows that there are 12 species of plants have more than one part of an organ that can be used for medicine, and three species can only be used leaves. Seven trees species other than as a drug producer is also useful timber. Two species of medicinal trees which of them are known to produce seed oil as a bioenergy, ie Calophyllum inophyllum L. (nyamplung) and Pongamia pinnata (L.) Pierre (binong). One species of trees have leaves and bark as a cure for cancer that is Hernandia nymphaeifolia (Presl.) Kubitzki (borogondolo). The results of Petit et al. (2004), inform about six agents of lignin derived from H. nymphaeifolia identified inhibitory activities of cancer cell. The morphology characters of that fifteenth species are presented in the field description. 3.2 Field Description 3.2.1 Barringtonia asiatica (L.) Gaertn. Synonym: Barringtonia speciosa J.R. Foster & J.G. Foster A tree, 7 to 30 m tall, bole up to 100 cm in diameter. Twig with large leaf scars, 6-10 mm in diameter. Leaves in whorls with petiole very short, simple leaves; blade glabrous, leathery, obovate-oblong or obovate, 15-38(50) cm x 7- 18(21) cm, apex emarginatet or mucronet, base cuneate, entire, marginal vein disting. Distribution : Madagascar to Sri Langka, India, Burma to throughout the Malesian region toward northern Australia and into the Pascific, and often planted. Uses: The leaves are used to treat hernia, heated and externally applied for stomach-ache. The seed oil used to treat scabies, mixed with water and drunk to treat influenza and bronchitis. Young fruits are also consumed as a vegetable (Yalipto, 2001;Floracafe, 2001, Heyne, 1987). 919 3.2.1 Caesalpinia crista Linn. Synonym: Caesalpinia nuga (L.) W.T. Aiton A Liana up to 15 m long. Leaves paripinnate, rachis 10 – 30 cm long with 2-5 pairs of pinnae, pinna 2-12 cm long, stipules trianguler; leaflets opposite, 1-5 pairs, base acute,margin curved, apex acute to obtuse. Distribution : India, Sri Langka, throughout South-East Asia to Queensland and New Caledonia. In Indonesia it is not found in East Sumatera and East Borneo. Uses : The extrack root and leaves are used to externaly applied for stomach-ache, menstruation and after childbirth. The root also is considered adiuretic, a tonic and useful in the treatment of bladder stones. The decoction of crushed seed used to treat cough and antidysenteric (Utomo, 2001; Heyne, 1987). 3.2.3 Calophyllum inophyllum L. A medium tree, up to 35 m tall, bole up to 50 cm in diameter. Leaves simple, decussately opposite; blade leathery, entire, glabrous, closely parallel secondary venation with 4-10 veins per 5 mm; leaves elliptic, ovate, obovate or oblong, 5.5 – 23 cm long. Stipules absent. Distribution : Eastern Africa, from Madagascar to Taiwan, throughout Malesia, northern Australia and the island of the Pacific Ocean; often planted. Uses : The latex and bark are used internally as a purgative, to treat gonorrhoea and after childbirth. The water soaking of leaves to compresses the eyes. The seed oil is applied externally for rheumatism, scabies, ulcers, boils and itch (Lemmens, 2003; Heyne, 1987). 920 3.2.4 Cayratia trifolia (L.) Domin Synonyms: Vitis trifolia L., Cissus trifolia (L.) K. Schum., Cayratia carnosa (Lamk) Gagnep. A climber, 2-20 m long, stem angular, pubescent when young, ending in adhesive disks, roots tuberous. Leaves 3-foliolate, petiole 2-4 cm long; leaflet oblongovate to ovate, 3-8 cm x 2-5 cm, margins toothed, lateral leaflet often lobed, both surfaces pubescent, often becoming sparseluy so when old. Distribution : From India to southern China, Indo-China, through Malesia(not common in Peninsular Malaysia), and the Pacific Island. Uses : A decoction of the stem and leaves are used to treat high fever, and a decoction of young leaves can also be eaten with salt to cure fevers. The fresh juice of leaves mixed with the fresh juice of young pineapple are used to treat dandruff (Rahayu, 2001; Heyne, 1987). 3.2.5 Crateva magna (Lour.) DC. Synonyms: Crateva religiosa Blume, Crateva nurvala Buch. Ham. A tree, 8 to 20 m tall, bole up to 30 cm in diameter; branchlets zigzag, yellow-brown. Leaves compound, spirally arranged, 3-foliolate, petiole up to 10 cm long, on top bearing numerous gland like appendages; stipules minute, late caduceus; leaflet lanceolete or oblong, 4-15 (28) cm x 2 – 7 cm, central leaflet broadest about or below the middle, lateral ones more or less symmetrical, apex acuminate, base acute; veins 10 –22 pairs. Distribution: India, Burma, southern China, Hainan, Indo China, Thailand, Peninsular Malaysia, Sumatera, Java, Kalimantan, cultivated for ornamental tree. Uses: The juice from root or stem is used to treat fevers and convulsions. It is also used in decoction for stimulating the appetite, and as a febrifuge. The fresh leaves are applied as a tonic and skin irritant against high fever (Schmelzer, 2001; Heyne, 1987). 921 3.2.6 Desmodium heterophyllum Dc. Synonyms: Desmodium triflorum (L.) DC. var. majus Wight & Arn., Hedysarum heterophyllum Willd. A terrestrial perennial herb, up to 150 cm long, multi branching, strongly stem, rooting freely from stolons and lower nodes of aerial stem. Stem roundend, solid, reddish, tomentose, with the brown hairs. Stolons become woody, glabrous. Leaves compound, trifoliate, alternate or spiral, stalked, leaflet obovate or elliptic, glabrous on both sides, margin entire, apex obtuse, emarginated, base rounded. Distribution : Mascarene Islands to India, Southeast Asia, Taiwan, Philippines, widely naturalized in the Pacific Island to Hawaii. Uses : The roots are reportedly are used to tonic and diuretic. The twigs and leaves are used to treat urinary retention and digestive complaints, include diarrhea and dysentery. Liquid extract of the leaves is used for ear drops (Oswalda, 2011, Kham, 2004; Heyne, 1987). 3.2.7 Dodonaea viscosa Jacq. Synonyms: Dodonaea burmanniana DC., Dodonaea repanda Schumach. & Thonn., Dodonaea candolleana Blume. A shrub to small tree, 1.5-8 m tall with up to 20 cm in diameter; branches spreading or erect. Leaves simple, elliptical to obovate, 5-15 cm x 2-5 cm, thin, base decurrent in to petiole, apex rounded, entire, smooth, veins 4-8 mm, ending free; stipules absent. Distribution : Throughout South-East Asia. Uses: The powder of wood charcoal mixed with water is drunk to treat as a remedy for flatulence. A decoction of the leaves or bark is drunk to treat diarrhea or dysentery. The juice from heated leaves is rubbed on nipples of breastfeeding women. The fresh, dried or powdered of leaves are applied as a poultice to treat wounds, swelling, burns, to ripen boils, and sores (van Welzen, 2001; Heyne, 1987). 922 3.2.8 Hernandia nymphaeifolia (Presl.) Kubitzki Synonyms: Hernandia peltata Meissn., Hernandia ovigera Auctt. A tree, up to 30 m tall, bole up to 100 cm in diameter, some time with buttresses. Leaves arranged spirally, simple, entire, glabrous, 15-30 cm x 9-20 cm, palmately veined, base rounded to slightly heart shape, peltate or basifixed, exstipulate, petiole 10-25 cm long. Distribution : From eastern Africa, Madagascar to Sri Langka, India, Burma to throughout the Malesian region toward Queensland or Australia and into the PascificIsland. Uses : The leaves are used for cure cancer. The six agents derived from lignin H. nymphaeifolia identified inhibitory activities of cancer cell. An extract of the leaves has also been applied as a painless depilatory. The core root for the drug vomiting blood. The medicinal of purgatives have been made from the leaves and the fruits. In February 2007 for Hernandia nymphaeifolia research presents almost 600 entries and many of them are medically orientated. (Irwanto, 1998; Heyne, 1987). 3.2.9 Hibiscus tiliaceus L. Synonyms: Hibiscus hastatus L.f., Hibiscus similis Blume, Hibiscus celebicus Koord. A shrub to small tree, up to 15-30 m tall. Leaves simple, alternate, blade suborbicular, or the upper ones ovate, 10-15 cm long, base deeply cordate, apex cuspidate, margin finely toothed, beneath 1-5 centra veins with a nectar, upper surface shiny; stipules large, spreading. Distribution : Throughout the tropics on or near sandy shores. Uses : The leaves are taken for sore throat, pneumonia, cough, tuberculosis and diarrhea. The leaves are also used as a laxative. The leaves and root are crushed in water and drunk to ease labor. Decoction of root is to cure fever. An extract of the leaves has been applied as a compress boils, and can be used to nourish hair (Dasuki, 2001; Heyne, 1987). 3.2.10 Ipomoea pescaprae (L.) R.Br. Synonyms: Convolvulus pescaprae L., Ipomoea biloba Forssk., Ipomea maritima (Desr.) R.Br. A perennial herb, glabrous vine, stem prostate, some times twining, 5-30 m long, often rooting at the nodes, taproot thick. Leaves simple, alternate, often pointing to one side, variable, ovate, elliptical, circular, reniform, 3-10 cm x 3-10 cm, base broadly cuneate to truncate, apex emarginate or deeply 2 lobed, 2 abaxial glands at the base of midrib, blade thick; petiole up to 17 cm long. 923 Distribution : All tropical beaches, including South East Asia. Uses : A decoction of the root is considered diminishes the irritation caused by bladder infections. Extracx of the leaves is spread on ulcers and then to ripen. The seed is chewed and swallowed as a remedy for cramp and stomach-ache. (Dibiyantoro and Schmelzer, 2001; Heyne, 1987). 3.2.11 Lantana camara L. Synonym: Lantana aculeata L. A shrub or herb, up to 2 m long, stem hairy and with spiked, much branches. Leaves simple, opposite, blade ovate, apex acuminate, margins toothed, roughly, upper surface hairy, rarely feels rough to touching the lower surface. Distribution : India, Srilangka, throughout the Malesian region, United States, South Africa, Mexico, and Australia. Uses: The extract leaves can be taken to cure vomiting due to food poisoning, and relieve swelling. The leaves are used in a water bath relieve arthritic pain (Wikipedia, 2011; Heyne, 1987). 3.2.12 Mallotus blumeanus Muell. Arg. A tree, up to 30 m tall, almost completely glabrous. Leaves simple, decussately opposite, blade ovate- oblong, entire, often whitish and with glandular granules below, not peltate; stipule small. Distribution: Sumatera, Java, Flores (the Lesser Sunda Islands), Sulawesi Uses: Leaves eaten by women after childbirth and the liquid leaves the collision for eye drops (Lugt, 2003; Heyne, 1987). 924 3.2.13 Pongamia pinnata (L.) Pierre Synonyms: Pongamia glabra Ventenat, Millettia novo-guineensis Kanehira & Hatusima, Derris indica (Lamk) JJ Bennett . A small to large tree, 6-15 m tall, 20-60 cm in diameter. The trunk is generally short with thick branches spreading into a dense hemispherical crown of dark green leaves, branchlets with pale stipule scars. The leaves will fall off when ripe fruit. Leaves compound, imparipinnate, pinkishred when young, glossy dark green above and dull green with prominent veins beneath when mature; leaflets 5-9, ovate, elliptical or oblong, 5-25 cm x 2.5-15 cm, obtuseacuminate at apex, rounded to cuneate at base. Distribution : Along coasts from India to China, Malesia and Pasific islands, Mascaras. It has been introduced in Egypt and Florida and Hawaii Uses: The extracts from the leaves, bark and seed are applied as anti- septic against skin diseases and rheumatism. A decoction of root for neutralizing the toxic food. The roots and bark to heal wounds caused by poisonous fish puncture. The seed oil to treat rheumatic drugs, drugs of human and animal skin diseases (Oyen, 2006; Heyne, 1987). 3.2.14 Terminalia catappa L. Synonyms: Terminalia mauritiana Blanco, Terminalia moluccana Lamk., Terminalia procera Roxb. A large tree, 15-25 m tall, up to 150 cm in diameter. The trunk is slightly ascending branches spaced 1-2 m apart in tiers, or storeys. Leaves simple, alternate, obovate with short petioles, spirally clustered at the branch tips, 15-36 cm long, 8-24 cm wide, dark green above, paler beneath, leathery and glossy. They turn bright scarlet, dark red, dark purplish-red, or yellow. Distribution: India, Cambodia, Laos, Vietnam, Thailand, through throughout the Malesian region, Japan, Australia, has been introduced. Uses: The latex and bark are used internally as a purgative, to treat gonorrhea and after childbirth. The water soaking of leaves to compresses the eyes. The seed oil is applied externally for rheumatism, scabies, ulcers, boils and itch (Valkenburg and Waluyo, 1991; Heyne, 1987). 925 3.2.15 Thespesia populnea (L.) Sol. ex Correa Synonyms: Hibiscus bacciferus populneus (L.) Gaertn. J.G.Forster, Hibiscus populneus L., Malvaviscus A shrub to small tree, up to 30 m tall, up to 60 cm in diameter, without buttresses. Leaves simple, alternate, entire or palmately lobed, palmately veined, stipulate. Distribution : Along sea coasts, occasionally planted. Uses: The heartwood is used to treat pleurisy and cholera. A decoction of wood can be taken to cure fever. Young leaves are eaten as a vegetable. The leaves and fruit are crushed to treat head aches and scabies. The seed oil can be used to kill lice on the head. (Perumal, 1998; Heyne, 1987). 4. CONCLUSION AND SUGGESTION There are 15 species, 15 generas and 12 families of traditionally medicinal plants in Pangelekan coastal forest. Rresearch on Pharmacology need to be conducted to examine the chemicals content of medicinal plants. Research collaboration network on medicinal plants should be established to support the development and coastal forest management. REFERENCES Dasuki, U A ( 2001): Hibiscus tiliaceus L. Medicinal and poisonous plants. PROSEA 12(2):302303. Dibiyantoro, A L H and Schmelzer, G H (2001): Ipomoea pescaprae (L.) R.Br. Medicinal and poisonous plants. PROSEA 12(2):318-319. Floracafe (2001): ImageofBarringtonia asiatica (L.) 21 Oktober 2011. Gaertn. www.floracape.com. Accessed on Heyne (1987): Importance Flora of Indonesia. FORDA, Jakarta. I: 248; II:829,839,931,943,989,1005,1159;III:1266,1277,1312,1317,1375,1480,1502,1662,1668,1780. Institute Soil and Fertilization Research (1964): Map of soil of West Kalimantan exploration, scale 1:1000.000. Soil and Fertilization Research Center, Bogor. Irwanto, R R P (1998): Hernandia nymphaeifolia (Presl.) Kubitzki. Timber trees, Lesser-known timbers. PROSEA 5(3):289. Kham, L (2004): Desmodium heterophyllum Dc. Medicinal www.tropalforage.info. Accessed on 2 November 2011. Lemmens, R H M J (2003): Calophyllum inophyllum PROSEA 12 (3):104-105. L. Medicinal Plants of Cambodia. and poisonous plants. Lugt, Ch B (2003): Mallotus blumeanus Muell. Arg. Medicinal and poisonous plants. PROSEA 12 (3):289. Oyen, L P A (2006): Pongamia pinnata Merr. Auxiliary plants. PROSEA 11:209-211. Oswaldasia (2011):Leaves on 2 November 2011. of Desmodium heterophyllum Image. www.oswaldasia.org. Accessed 926 Perumal, B ( 1998): Thespesia populnea (L.) Sol. ex Correa. Timber trees, Lesser-known timbers. PROSEA 5(3):557-558. Pettit, G R, M Yanhui, G R Patrick, D L Herald, R K Pettit, D L Doubek, J C Chapuis and Tackett L P (2004): Antineoplastic agents Hernandia peltata (Malaysia) and Hernandia nymphaeifolia (Republic of Maldives). Journal of Natural Products 67(2):214-20. Rahayu, S S B (2001): Cayratia trifolia (L.) Domin. Medicinal and poisonous plants. PROSEA 12 (2):146-147. Schimdt, F H and J H A Ferguson (1951): Rain fall type based on wet and dry period ratios for Indonesia with Western New Guinea. Verh No.42. Direktorat Metereologi dan Geofisika Jakarta. Schmelzer, G H (2001):Crateva magna (Lour.) PROSEA 12 (2):190. DC. Medicinal and poisonous plants. Utomo, B I (2001): Caesalpinia crista Linn. Medicinal and poisonous plants. PROSEA 12(2):127. van Valkenburg, J L C H and Waluyo, E B (1991): Terminalia catappa L. Dye and tanninproducing plants. PROSEA 3:120-122. van Welzen, P C ( 2011): Dodonaea viscosa Jacq. Medicinal and poisonous plants. PROSEA 12 (2):234-237. Wikipedia (2011): Lantana camara L. www.wikipedia.org. Accessed on 2 November 2011. Yalipto, M A (2011): Barringtonia asiatica (L.) PROSEA 12 (2):104-105. Gaertn. Medicinal and poisonous plants. Zuhud and Ervizal A M (2009): The Indonesian Tropical Forest as Buffer of Natural Medicine Product for Nation Healthy. Jurnal Bahan Alam Indonesia 6(6):227-232. 927 INAFOR 11P-030 INTERNATIONAL CONFERENCE OF INDONESIAN FORESTRY RESEARCHERS (INAFOR) Application of Seed Encapsulation Technology for Critical Land Reforestation Harmastini S, Sylvia J R L, Rumella S, Tiwit W, Liseu N and Nuriyanah Research Center for Biology, Indonesian Institute of Sciences (LIPI), Jl. Raya Jakarta-Bogor, Km.46 Cibinong Science Center, Cibinong 16911, INDONESIA Poster paper prepared for The First International Conference of Indonesian Forestry Researchers (INAFOR) Bogor, 5 – 7 December 2011 INAFOR SECRETARIAT Sub Division of Dissemination, Publication and Library FORESTRY RESEARCH AND DEVELOPMENT AGENCY Jl. Gunung Batu 5, Bogor 16610 928 Application of Seed Encapsulation Technology for Critical Land Reforestation Harmastini S, Sylvia J R L, Rumella S, Tiwit W, Liseu N and Nuriyanah Research Center for Biology, Indonesian Institute of Sciences (LIPI), Jl. Raya Jakarta-Bogor, Km.46 Cibinong Science Center, Cibinong 16911, INDONESIA ABSTRACT Recovery efforts and increasing productivity of critical lands require the seed that have adaptation capability and high viability. Seed encapsulation technology is one of effort to improve forestry plant seed germination by physical protection to the seeds. Encapsulation technology is giving potentially nitrogen-fixing and phosphate-solubilizing microbes on encapsulated seed. Providing potential microbial on encapsulation seed give opportunity to improve of quality forest seeds. Microbes that used in encapsulation materials are expected to support growth of plant when the seed is planted on critical land. The purpose of this study was to obtain an encapsulation materials formula that easy, inexpensive and can support microbial growth during encapsulated. In addition, to determine the influence of microbes on the growth and survival rate of plants in the greenhouse. The result of seed encapsulation from various materials showed that agar and YEMA medium are potential to be developed as an encapsulation material. Moreover, the addition of nitrogen-fixing and phosphate-solubilizing microbes influence on growth of sengon plant. Keywords: Sengon, encapsulation, nitrogen-fixing and phosphate-solubilizing microbes. 1. INTRODUCTION Critical land is heavily damaged land due to the closure of vegetation loss, so that its function as water and erosion controller, nutrient cycling, microclimate controller and carbon retention to be lost or diminished. This condition is characterized by the availability of water and plant nutrients are very low. More than 15 million hectares of critical tropical forests in Indonesia require revegetation (Betty, 2011). Reforestation is a program for critical land in Indonesia that is undertaken by the government through the Department of Forestry programs. Implementation of revegetation activities (reforestation) is an effort to reclaim degraded lands. The goal is to improve the unstable and unproductive land and reduce surface erosion. In addition, is expected to improve the microclimate, restore biodiversity and improve the condition of land in order to more productive. The reforestation program is in accordance with increased awareness and knowledge of human about the advantages of environmentally friendly microorganisms. The potential of soil microorganisms can be used as biofertilizer to improve and enhance soil fertility, increase grow capacity and crop productivity and subtitute chemical fertilizers. The effort to restore and improve critical land productivity requires a seed that have adaptation capability and high viability after the planted on the land. The survival of forest seedlings usually are still very low about 30-50%. This is due to many factors including the ability of seedlings to adapt to extreme environments. The unfavorable environmental factors such as availability of water, heat and diseases caused the survival of seedling very low (Anonymous, 1998). Preparing of high quality forestry seeds in order to realize the revegetation program is a challenge for the forestry farmers. The seed encapsulation technology is one effort to improve forestry seed germination. Target of seed encapsulation activity is to protect the seeds physically in order to anticipate the influence of various external factors that would interfere with integrity 929 of the seed. The encapsulation materials of seeds is very diverse and the selection of materials is determined by the texture that can keep an encapsulated seed in order to the growth capacity does not lose. The involvement of potential microbes is a prospective opportunities for the provision of high quality forestry seeds. The potential microbes is used to support growth and quality of crops so that plants are able to adapt toward a variety of extreme conditions. Sengon (Paraserianthes falcataria) is a Leguminoceae family. Sengon started to develop as society forest because it can grow on an extensive climate conditions and not require high location to grow. Sengon has many benefits such as building materials, pulp, paper raw materials, containers, and its leaves as fodder. Development of fast-growing Sengon has an impact on the improvement of soil fertility on a fast scale. Besides that, the requirement for Sengon wood that reached 500,000 m3 per year and the prices increased rapidly on the market in recent years led the development of Sengon was needed to support reforestation program. The requirement for this wood is not equal with Sengon production in Indonesia per year. The demand for high quality Sengon seed also increase along with the development of Sengon forest area that planted by the public and private companies (Yayan, 2010). The purpose of this study was to obtain an encapsulation material formula for forestry seeds that easy, inexpensive and can support microbial growth during encapsulated. In addition, to determine the influence of microbes on the growth and survival of plants in the greenhouse. 2. MATERIAL AND METHODS 2.1 Place and Time Research The study was conducted on March 2011 at Laboratory of Soil Microbiology and Green House, Research Center for Biotechnology, LIPI, Cibinong. 2.2 Material Materials consist of Sengon seeds, planting media, encapsulation materials and potential microbes. Sengon seed was obtained from Experiment Garden of Haurbentes, Jasinga, Bogor. The planting media consist of soil, sand, soil: sand in the ratio of 1:1, soil: sand: compost in the ratio 1:1:1. The encapsulation materials are rice flour, cassava starch, agar and selective media (YEMA). The potential microbes are nitrogen-fixing and phosphate solubilizing bacteria. 2.3 Methods The study began with selection of normally seed, followed by germination test to determine the precentage of seeds germination that will be encapsulated. Germination test carried out by soaking the seeds in hot water on temperature ± 80oC, then allowed for 24 hours. The seed were grown in petri dishes containing sterile tissue paper that has been moistened with sterile distilled water. Petri dishes were incubated at room temperature for 3-4 days until all the seeds growth. Percentage of germination was calculated by comparing the number of seeds that grow normally from a total of 100 seeds. Furthermore, produce biomass of nitrogen-fixing bacteria and plant growth hormone-producing bacteria. Production of bacterial cells biomass were made by growing bacteria in liquid medium and incubated shaked for 3 days. Biomass of bacterial cells were used as material is mixed with the encapsulation material. Preparation of encapsulation materials made by mixing ingredients encapsulate namely cassava starch, rice flour, and agar approximately 0,5 grams in 50 ml of distilled water mixed with 10 ml of nitrogen-fixing and 100 grams of phosphate solubilizing inoculum. After mixed, the materials is used as sengon seed encapsulation. For YEMA material, 50 ml of media was heated to boiling then cooled until the temperature 40oC. After that, the material mixed with nitrogenfixing and phosphate solubilizing inoculum as sengon encapsulation material. After encapsulated, the seeds are cultivated in polybags contains ± 250 grams of the planting medium. The planting medium are soil, sand, soil + sand (1:1), soil + compost + sand 930 (1:1:1). As a control, use the seed without encapsulation. Each treatment was made 50 replications. The parameters were observed every month are the germination and plant height. 2.4 Data Analysis Data of germination percentage calculated based on the number of growing seeds divided by the total number of planting seeds multiplied by 100%, while data of plant height were tested with a variety of one-way analysis of variance. 3. RESULT AND DISCUSSION 3.1 Influenced of Encapsulation Materials 3.1.1 Percentage of Survival The result of seed germination test (DB) that had been treated with a variety of encapsulation materials and cultivated in the greenhouse can be seen in Table 1. Table 1. Percentage of Sengon Seed Germination with Encapsulation No 1. 2. 3. 4. 5. Treatment of encapsulation materials YEMA + microbes Agar + microbes Cassava starch + microbes Rice flour + microbes Control Percentage of Germination (%) on Variation of Growing Media Average soil + soil + sand + of DB soil sand sand compost 80 88 86 92 86.5 86 94 94 94 92 84 80 70 64 74.5 86 88 84 72 82.5 96 90 92 86 91 Based on the observations showed that the percentage of Sengon seed germination after 3 months planting on each treatment is still high, ranging between 74.5% -92%. Seeds which encapsulated with agar and seeds without encapsulate (control) have germination capability higher than seeds with YEMA, cassava starch and rice flour encapsulate materials. These results indicate that encapsulation treatment did not influence significantly to the growth or viability of seeds. Besides, the seeds with agar encapsulation material show the growth better than control. Because of these plants are still young and the environmental conditions in the greenhouse is not extreme like the field level, so the percentage of survival are still be able to change in the future. According to Sadjad (1980), seed germination is influenced by internal and external factors. Germination of encapsulation seeds with YEMA, rice flour and cassava starch materials are lower than control. Its caused the materials encapsulation give a little influence to restrain seeds for germination. The encapsulation seeds have many advantages compared with control in improving plant quality such as faster growing, better height and bigger diameter and more resistant to pests and diseases). However, the encapsulation seeds influence to decrease germination although is not very significant. 3.1.2 Height of Plant After encapsulated treatment, the seeds are cultivated on some of the planting medium in the greenhouse. After 3 months planting, it can be seen that treatment of encapsulation influenced to plants performance. Figure 1show that growth of Sengon with YEMA treament after 3 months planting indicate the best result compared with agar, rice flour, cassava starch 931 treaments and control. This is caused YEMA media can maintain seed moisture. According Hendromono (1996), moisture is a factor that influence the growth of plant. The reaction of plant to moisture depends on the type of plant itself. Sengon require moisture about 50-75%. The growth of Sengon seed after 3 months planting with variation of the encapsulation material can be seen in Graph 1. Figure 1: The growth of encapsulation sengon seed after 3 months planting in the greenhouse YEMA medium (Yeast Extract Mannitol Agar) as an encapsulation material has a composition as follows: 0.5 g K2HPO4, 0.2 g MgSO4, 0.1 g NaCl, 3 g CaCO3, 10 g Mannitol, 3 g Yeast Extract, 20 g agar, 1 liter of distilled water (Vincent, 1970). This media consist of nutrients that needed by the nitrogen-fixing microbes. When the seeds are encapsulated by YEMA then planted, nitrogen-fixing microbes will be more active because these microbes have been obtained nutrients from the media. The presence of nitrogen-fixing microbes on the seed that encapsulated by YEMA is estimated much more than the other encapsulation material. It can be indicated by the average height of Sengon is higher than other treatments. The Sengon seeds that encapsulated by agar also indicate good performance. The agar media can also maintain the seed moisture which one of factors that influence the growth of plant. The agar media is also a good candidate for encapsulation media, it caused by this material is more economic than YEMA materials. Performance of encapsulation Sengon seed after 3 months planting can be seen in Figure 2. 932 Figure 2: The growth of encapsulation Sengon seed after 3 months planting in the greenhouse 3.2 Influence of Growing Media Treatment of growing media variations has a purpose to determine the growth capability of encapsulation seed before applying in the critical land. The growth of Sengon on the soil + compost + sand medium showed the best growing, then followed growth of Sengon on the soil, soil + sand and sand media. The growth of encapsulation Sengon seed after 3 months planting on the variation of growing media can be seen in Figure 3. Figure 3: The growth of encasulation Sengon seed after 3 months planting on the variation of growing media Based on the research, the mixture media consist of soil + compost + sand is the best medium that used in the nursery before planted on marginal lands or other. The addition of compost to the planting medium has influence significantly on plant growth. Compost is an organic media are derived from plant or organic waste fermentation, such as straw, husk, leaves, grass and trash. The advantage of using compost as a planting medium is able to restore soil 933 fertility through improvement of soil characteristics as physical, chemical or biological. Besides that, the compost is also a facilitator to absorb nitrogen (N) that is needed by plants. Based on this study, treatment of planting media variation indicates the growth of Sengon on the sand medium look not good enough. The growth of plant is slower and leaf colours look rather pale compared with the growth of Sengon on the other media. However, Sengon be able to grow on the medium and have the growth capability is good enough at around 88%. The sand and sand + soil medium may represent a condition in the critical land. The results of this study indicate that the encapsulation seed that supplied with potential microbe is still able to grow in unfavourable environmental conditions. According to Hendromono (1996), the size of seed and seedling media affect greatly to the viability of Sengon seeds. The sand media have a measurement of large pores (macro pores) then it becomes easy to wet and dry quickly by evaporation process. Water evaporates more quickly while water and humidity is a decisive factor of plant growth. Then, the sand media requires irrigation and fertilization more intensive. This causes the sand is rarely used as a single growing media. The sand is often used as an alternative growing media to replace the function of the soil. Because of the sand is considered adequate and appropriate when used as a medium for seedling and growing seeds and rooting of plants stem cutting. Its quick-drying will facilitate the removal process of seedlings that are considered old enough to other media. While the weight of sand is heavy enough to facilitate a stand of stem cuttings. Besides that, the advantage of the sand media is easy to use and can improve aeration and drainage system of the planting medium. Performance of Sengon after 3 months planting on the variation of growing media can be seen in Figure 4. Figure 4: The growth of encapsulation Sengon sees after 3 months planting on the variation of growing media 4. CONCLUSION The results of sengon growth that encapsulated with material variations and cultivated in variations of growing medium, it can be concluded as follows: 1. Percentage of life sengon seed encapsulation generally is good. 2. Materials such as YEMA and agar can be used as an encapsulat candidate for superior seed, especially sengon seed. 3. The advantage of using YEMA is able to maintain the seed moisture that needed to germinate and provide nutrition for nitrogen-fixing microbes. But, the disadvantage of material is more expensive. 934 4. The advantage of using agar is able to maintain the seed moisture that needed to germinate and material is more economic. But, the disadvantage of material does not provide nutrition for the nitrogen-fixing microbes. 5. The encapsulation seed that provided a potential microbial and cultivatedd in variations of growing media indicate that is still able to grow in unfavorable environmental conditions. REFERENCES Anonymous (1998): Program Nasional Sistem Pembenihan Kehutanan. Balai Teknolog Perbenihan. Badan Penelitian dan Pengembangan Kehutanan dan Perkebunan. Departemen Kehutanan dan Perkebunan. Betty, N F (2011): Prospek Pemanfaatan Mikroba Potensial dalam Rehabilitasi Lahan Kritis di Indonesia. Skripsi Jurusan Ilmu Tanah, Fakultas Pertanian, UNPAD. Unpublished. Hendromono (1996): Kapasitas dan Kecepatan Berkecambah Benih Eucalyptus deglupta Blume pada Berbagai Ukuran Butir Medium. Buletin Penelitian Hutan. No. 603/1996. Pusat Litbang Hutan dan Konservasi Alam, Bogor. ISTA (2006): International Rules for Seed Testing: Edition 2006. The International Seed Testing Association. Bassersdorf. CH-. Switzerland Nurhasybi (1997): Media Kecambah dan Cara Penaburan Benih Damar (Agathis loranthifolia Salisb). BuletinTeknologi Perbenihan. Balai Teknologi Perbenihan Vol. 4 No.2. Bogor. Purwaningsih, S (2005): Isolasi, Enumerasi, dan Karakterisasi Bakteri Rhizobium dari Tanah Kebun Biologi Wamena, Papua. Jurnal Biodiversitas ISSN: 1412-033X.Volume 6. Nomor 2 April 2005. h 82-84. Sadjad, S (1994): Kuantifikasi Metabolisme Benih. PT. Gramedia Grasindo. Jakarta. Sadjad, S (1980): Panduan Pembinaan Mutu Benih Tanaman Kehutanan di Indonesia. Dit. Jen. Kehutanan-Institut Pertanian Bogor Somasegaran, P and Hoben, H J (1985): Method in Legume Rhizobium Technology. University of Hawaii. USA. Scholer, E and F Stubsgaard (1994): Seed Testing. Lecture Note No. C8. Danida Forest Seed Centre. Humlebaek. Denmark. Yayan, H (2010): Evaluasi Pertumbuhan Awal Kebun Benih Semai Uji Keturunan Sengon (Paraserianthes falcataria) umur 4 bulan di Cikampek, Jawa Barat. Jurnal Penelitian Hutan tanaman, vol 7, No. 2. April 2010. H 85-91. 935 INAFOR 11P-031 INTERNATIONAL CONFERENCE OF INDONESIAN FORESTRY RESEARCHERS (INAFOR) Sandalwood (Santalum album ) Foliage Morphological Variation of Various Provenances Ari Fiani and Yuliah The Center for Research on Biotechnology and Tree Improvement Jl. Tentara Pelajar Km.15 Purwobinangun, Pakem, Sleman, Yogyakarta 55582, INDONESIA Poster paper prepared for The First International Conference of Indonesian Forestry Researchers (INAFOR) Bogor, 5 – 7 December 2011 INAFOR SECRETARIAT Sub Division of Dissemination, Publication and Library FORESTRY RESEARCH AND DEVELOPMENT AGENCY Jl. Gunung Batu 5, Bogor 16610 Sandalwood (Santalum album ) Foliage Morphological Variation of Various Provenances 936 Ari Fiani and Yuliah The Center for Research on Biotechnology and Tree Improvement Jl. Tentara Pelajar Km.15 Purwobinangun, Pakem, Sleman, Yogyakarta 55582, INDONESIA ABSTRACT The research of Santalum album foliage morphological variation had been conducted by Research Center of Plantation Forest, Yogyakarta, in November 2011. Leaves‘ samples were collected from an ex-situ conservation plot of Santalum album in Watusipat, Gunung Kidul. Observation was done toward 14 sandalwood provenances, of which five individual trees were chosen. The next step was to choose ten fully-developed pieces of leaves of each individual tree. The morphological observation of the leaves included the following dimensions: length of the leaf, length of the leaf base (petiole), wide of the leaf, shape of the leaf, edge shape of the leaf, shape of the leaf base, shape of the leaf end, and leaf color, both up and down sides. The result indicated that there were differences in the foliage morphology among the provenances. The biggest size of leaf was in Provenace P5, while the smallest one was in provenance P10. The shape variations were between ovalis and oblongus. The leaf colors were between bright-green, green, old-green, and yellowish green. The edge of the leaf varied between flat and wavy, while their colors were between yellowish green and brownish red. Keywords: Sandalwood (Santalum album), leaves, morphology, provenance 1. INTRODUCTION Sandalwood (Santalum album) is a plant that grows naturally in Indonesia, especially in East Nusa Tenggara. Sandalwood scent that has wood paneling on many craft used as raw materials, cosmetics industry, medicine and used in traditional ceremonies. Excessive exploitation of sandalwood and the lack of rehabilitation causing decreasing population. IUCN red list defined sandalwood as a species that is Vulnerable A1d ver 2.3 (IUCN, 2011). One of the research activities conducted at the Center for Forest Biotechnology and Tree Improvement Yogyakarta is the construction and maintenance of ex situ conservation of sandalwood that aims to provide the genetic material for breeding. Selection is a basic activity of plant breeding programs. The success of plant breeding efforts is highly dependent on the availability of a genetic basis with a wide variety. Variation within species of plant can be caused by different geographical circumstances. Species obtained from areas that are separated by long distances often show a different morphology. Observers can identify the source of the seed of a species based on morphological special characteristics (Zobel, B., and Talbert, 1984). Although it is difficult to find a relationship between genotype and phenotype with morphological markers, but the morphological characters of plants is one of the factors to be considered in the selection of plants. Morphological markers are usually using the properties of expressed in the phenotype of a species such as form, location, size and color of the vegetative and generative plant. Phenotype is an expression of the interaction between the genotype with the environment in which it grows. Morphological traits are generally controlled by multiple genes and environmental factors that are complex. But then the recessive gene is not expressed in heterozygous individuals. This observation aims to determine the morphological diversity of sandalwood leaves collected from different provenances that have been planted in the ex- situ conservation of sandalwood at Watusipat, Gunung Kidul. 937 2. MATERIAL AND METHODS 2.1 Time and Location Sampling was conducted on sandalwood leaves in the Forest Research Watusipat, Gunungkidul. Observations were conducted during October 2011 at the Center for Forest Biotechnology and Tree Improvement, Purwobinangun, Yogyakarta. 2.2 Material Observations made of sandalwood plant population were 9 years old in the Watusipat Forest Research, Gunungkidul. Population representing 14 provenances of sandalwood from different distribution in East Nusa Tenggara and Java. The information about the 14 provenances was as follows: Table 1. Provenance (origin source of sandalwood seed) No. 1 2 3 4 5 6 7 8 9 10 11 12 13 14 Provenances Omtel, Teluk Mutiara, Alor, dpl 690 m Aen Ut, South Mollo , South Center Timor, Timor, 700 m dpl Hambala, Kopeta, Waingapu, East Sumba District, Sumba, 210 mdpl Katikutana, West Sumba District, Sumba. Waisika, Northeast Alor, Alor, 30 m dpl Pailelang, Southwest Alor, Alor, 55 m dpl Kuma‘, South Mollo, South Center Timor, Timor, 710 m dpl Polen, South Mollo , South Center Timor, Timor, 480 m dpl Karang Mojo, Gunung Kidul, Yogyakarta Oenlasi, South Amanatun, South Center Timor, Timor, 850 m dpl Haumeni, South Amanatun, South Center Timor, Timor, 930 m dpl Snok, North Amanatun, South Center Timor, Timor, 240 m dpl Noemuti, Easth Miomafo, North Center Timor, Timor, 320 m dpl Bu‘at, South Mollo, South Center Timor, Timor, 810 m dpl 2.3 Research Methods Sampling was done by purposive sampling plants based on differences in leaf phenotype. Of each provenance selected 5 trees, and then from each selected tree was taken 10 leaves which have developed perfectly. The observed leaf morphology including the length of the leaf, leaf width, long leaf stalk (petiole), leaf form, leaf edge form, the form of the tip, the base of the leaf, the leaf color on the top and bottom surface. Determination of leaf form, form the edge, tip and base of the leaf based on guidelines from the determination of plant morphology in Tjitrosoepomo (1999). Observational data presented in the form of leaf morphological descriptions of sandalwood from different provenances. 3. RESULT AND DISCUSION The results of observations of measured data from sandalwood leaves presented in table 2. 938 Table 2. The average of length, width, and length of petioles of sandalwood leaves Provenance Leaf Lenght (cm) Leaf Widht (cm) 2.458 6.122 5.748 6.336 7.23 7.798 6.218 5.998 6.69 5.184 5.472 6.114 6.022 5.482 5.328 Omtel Aen Ut Hambala Katikutana Waisika Pailelang Kuma` Polen Karang Mojo Oenlasi Haumeni Snok Noemuti Bu`at Petiole Lenght (cm) 0.938 0.866 1.008 1.132 0.958 1.00 0.92 0.87 0.947 0.882 0.80 0.926 0.856 0.79 2.408 2.594 2.828 3.524 2.782 2.500 2.604 2.182 2.404 2.674 2.494 2.450 2.268 While the shape and color of the leaves presented in Table 2. Tabel 2. shape and colour of sandalwood leaves. Form Provenance Whole Edge Leaf tip Color Base leaf Top surface Bottom surface Edge leaf Omtel Ov-ob FW pointed pointed Lg-G-Dg Lg-G-Dg Gy-Br Ane Ut Ov-ob FW pointed pointed G-Dg G-Dg Gy-Br Hambala Ov-ob F pointed pointed G-Dg-Yg G-Dg Gy-Br Katikutana Ov-ob FW pointed pointed G-Yg G-Dg Gy-Br Waisika Ov-ob FW pointed pointed Lg-G-Dg-Yg Lg-G-Dg Gy-Br Pailelang Ov-ob FW pointed pointed G-Dg-Yg G-Dg-Yg Gy-Br Kuma` Ov-ob FW pointed pointed G-Dg-Yg G-Dg Gy-Br Polen Ov-ob FW pointed pointed Lg-G-Yg Lg-G Gy-Br Karang Mojo Ov-ob FW pointed pointed G-Yg G-Yg Gy Oenlasi Ov-ob F pointed pointed G-Yg G-Yg Gy-Br Haumeni Ov-ob FW pointed pointed Lg-G-Dg-Yg Lg-G-Dg-Yg Gy-Br Snok Ov-ob FW pointed pointed Yg G-Yg Gy-Br Noemuti Ov-ob FW pointed pointed G-Yg Lg-G-Yg Gy Bu`at Ov-ob F pointed pointed G-Ga-Yg Ga-G-Yg Gy-Br Notes: Ov = Ovals; Ob = Oblongs; F = Flate; W= Wavy; Lg = Light green; G = Green; Dg = Dark green; Yg = Yellowish green; Gy = Greenish yellow; Br = Brownish red. Table 1 and 2 show the differences between 14 provenances of sandalwood, each provenance has own characteristic appearance viewed from the leaves. The measurement results indicate that leaf size varies, where the length of the leaves ranged between 5.184 to 7.798 cm and the width of leaves ranged between 2.182 to 3.524 cm. Provenance with the smallest leaf size is Karang Mojo with 5.184 cm (length) and 2.182 cm (width), while the provenance with the greatest leaf size is Waisika with 7.798 cm (length) and 3.524 cm (width). The length of petiole varies from 0.79 cm (Polen) up to 1.132 cm (Katikutana). Comparison between length and width 939 of leaves will determine the form of the leaves of each provenance. For all provenances there are variations in leaf form ovals to oblongs. Variation occurs both among leaves within each individual and between individuals within provenances. Variations in leaf form and size presented in Figure 1. Figure 1: Variation of form and size of sandalwood leaves Table 2 shows there is no variation in the structure of the leaves, especially on the tip and base of leaf form. Observations show that all provenance have pointed leaf on tip and base. While the form of leaves varies between flat and wavy. Variations also occur both among leaves in a single individual, among individuals within provenances and among provenances. Hambala, Haumeni and Bu`at have the form of flat leaf edges, whereas the other provenances have the edge leaves that vary from flat to wavy. Variations in leaf color and form of the leaf edges presented in Figure 2. 940 Figure 2: Variations in colors and form of the leaves edges of sandalwood A Variation that can be immediately seen other than the size of the leaf is the leaf color. Some provenances have dark-green leaves while the others have yellowish-green leaves. Observations of variations in leaf top and bottom surface color showing the variation of light green, green, dark-green or yellowish-green. Katikutana, Oenlasi, Haumeni, Snok and Neomuti have a yellowish-green leaf color, which is different then the others provenances. Figure 3: Color variation on the leaves edge The edge of sandalwood leaf has a different color from the center of the leaf. The leaf edge formed line around leaf (Fig 3). Observations show that the edge of the leaf color varies from greenish-yellow to brownish-red. In the same leaf, encountered the different color of edge leaf, such as red-brownish, reddish in leaf tip but greenish-yellow in base leaf, or totally yellow. Although there are variations in the individual, but there are two provenances (Karang Mojo and Noemuti) have greenish-yellow edge color leaf, while the others have red-brownish color. In term of color variation, it needs to analyze soil nutrient content in which the plant grows. Deficiency or excess of certain elements will affect the colors of the leaves. 4. CONCLUSION There are variations in leaf size between provenances. Karang Mojo has a size of the smallest leaf length (5.184 cm) and width (2.182 cm). While the Waisika has the largest leaf size with a length of 7.798 cm and 3.524 cm in width. The length of petiole ranged between 0.79 cm (Bu`at) to 1.132 cm (Katikutana). All provenances have the form of leaves varied between ovals and oblongs. There are three provenances (Hambala, Oenlasi, and Bu`at), which have flat leaf edges form; whereas the others have the form flat to wavy. There is no variation between provenances in the character of the tip and base of the leaf. The color of the top and bottom surfaces of leaves varies from light- green, green, dark-green and yellowish green. The edges of the leaves on two provenances (Karang Mojo and Noemuti) are yellowish-green, while others provenances have a yellowish-green to brownish-red. REFERENCES IUCN, (2011): The IUCN Red List of Treatned Species. www.iucnredlist.org/apps/redlist/search. Downloaded at November, 29, 2011. 941 Tjitrosoepomo, G (1999): Morfologi Tumbuhan. Gadjah Mada University Press. Yogyakarta. Zobel, B and Talbert, J (1984): Applied Forest Tree Improvement. John Wiley and Sons, Canada. 942 INAFOR 11P-032 INTERNATIONAL CONFERENCE OF INDONESIAN FORESTRY RESEARCHERS (INAFOR) Towards Collaboratively-Managed Protected Area in Indonesia: The Case of Sebangau National Park, Central Kalimantan Tri Wira Yuwati Forestry Research Institute of Banjarbaru Jl. Ahmad Yani Km 28.7 Landasan Ulin, Banjarbaru, South Kalimantan, 70711, INDONESIA Corresponding email: [email protected] Paper prepared for The First International Conference of Indonesian Forestry Researchers (INAFOR) Bogor, 5 – 7 December 2011 INAFOR SECRETARIAT Sub Division of Dissemination, Publication and Library FORESTRY RESEARCH AND DEVELOPMENT AGENCY Jl. Gunung Batu 5, Bogor 16610 Towards Collaboratively-Managed Protected Area in Indonesia: 943 The Case of Sebangau National Park, Central Kalimantan Tri Wira Yuwati Forestry Research Institute of Banjarbaru Jl. Ahmad Yani Km 28.7 Landasan Ulin, Banjarbaru, South Kalimantan, 70711, INDONESIA Corresponding email: [email protected] ABSTRACT Protected area management in less-developed areas is a complex matter because, being driven by poverty, local human populations often rely primarily on natural resources that are found in protected areas. Sebangau National Park is an area of 568,700 ha that holds one of the largest known remaining orangutan (Pongo pigmaeus) populations; located in the southern part of Central Kalimantan Province; and serves as one of the last remaining peat swamp forests in Kalimantan. Managing Sebangau is a complex matter due to the high dependency of local people in 46 villages surrounding Sebangau to the resources as their livelihood. Collaborative management is seen as a mechanism to overcome overlapping land use in protected areas. This paper presented the experiences of Sebangau national park management in implementing community development programs towards local people and pictured responses of the people towards the programs carried out by the park authority and NGOs working in the area. Keywords: Collaborative management, protected area, Sebangau, national park, Central Kalimantan 1. INTRODUCTION Forest area of Sebangau was appointed as National Park through The Ministry of Forestry Decree No. 423/ Menhut-II/2004; covers an area of 568,700 ha that holds one of the largest known remaining orangutan populations in the world and was gazette by the government of Indonesia in October 2004. It is located in the southern part of Central Kalimantan Province, between the Sebangau and Katingan rivers, and serves as one of the last remaining peat swamp forests in Kalimantan. Administratively, Sebangau national park is part of Katingan district (52%), Pulang Pisau (38%) and City of Palangkaraya (10%). There are 46 villages surrounding Sebangau. The park designation was supported by Pulang Pisau district alone; the other two districts are waiting for the Central Kalimantan Provincial Spatial Planning to be agreed. Box 1.The reason of Sebangau designation as national park (MoF-WWF, 2004) “The failure of the “million hectares peat land for paddy field” gave us a tough lesson: we should opt for sustainable development strategies that put the environmental issues up front in importance. Saving Sebangau is important for both local community livelihoods and orang utan conservation; the two are linked” Drs. H. Asmawi Agani Former Governor of Central Kalimantan, Indonesia Even after 6 years of its designation, there are still disagreement and different perceptions regarding the park boundary and park existence among stakeholders. The designation as a National Park has altered the livelihood of population surrounding Sebangau. In order to decrease the pressures of the local people who have high dependency on natural resources inside the park, the park manager and NGO‘s working in the area have conducted community development programs for the population surrounding Sebangau. This paper 944 presented the experiences of Sebangau national park management in implementing community development programs towards local people and pictured responses of the people towards the programs carried out by the park authority and NGOs working in the area 2. METHODS The data was collected from traditional village of Baun Bango, Katingan district. The community development programs implementation towards local people in this village and the responses of those people to the programs were asked through participant observations, personal semi structured interviews and focus group discussion. 3. RESULTS 3.1 The History of Sebangau National Park The history of Sebangau designation as national park was closely related to many aspects and interests in Central Kalimantan. Sebangau area was known for one of the remaining tropical peat swamp forest in the world with very important function as habitat of orang utan (Pongo pigmaeus) and unique peat swamp forest plant species. According to a study commissioned by WWF-Indonesia, carried out by Center for International Cooperation in Management of Tropical Peat Land), the peat swamp forest in Sebangau is a home to at least 106 species of birds, 35 species of mammals, and several sub-types of forest such as riparian forest, mixed swamp forest, transition forest, tall interior forest, and mixed forest from granite and low pole forest. The peat swamp forest functions as a giant sponge where it can absorb water in the rainy season and supply water in dry season. In the 1990‘s during Soeharto era there was The Mega Rice project aimed at converting one million hectares of peat swamp forest into paddy fields in Central Kalimantan. Unfortunately, the project was a big failure, resulting in high input yet low output result. Moreover, the degraded peat swamp forest was causing new problem to escalate: forest fire in dry season and flood in rainy season due to the irreversible character of peat soil. Lesson learned from the failure of mega rice project in Central Kalimantan has increased people‘s awareness not to convert peat swamp forest into another land use. Unfortunately, habitat fragmentation, illegal logging, forest conversion into palm oil plantation and forest fires continued to threaten the survival of the park. These threats and illegal trade have contributed to the decline of orangutan population in Sebangau National Park from almost 13,000 to 6,900 individuals between 1996 and 2003. Before designated as national park, the status of Sebangau forest was production forest and limited production forest (Central Kalimantan Provincial Spatial Planning 2003). Inside this park, there are hundreds of canals which were made when logging was still operating. Those canals were made by people whom then sold them or rent them to the logging companies as logging transportation. As a result, water level could not be controlled and the peat was easily got burnt. The designation of the park was supported by the head of Katingan district (district government decree No. 522.51/696/EK 1 October 2003, the head of Pulang Pisau district (district government decree No. 119/520/EK January 2003). Although given a legalized support, the head of Katingan district did not state the wide of the park in his area. The government of Kota Palangkaraya has not given support due to the overlapping land use and demanded to resolve the problem. The governor of Central Kalimantan and Central Kalimantan house of representatives had given their support for the conservation of Sebangau forest through decree No. 050/33/IV/Bapp (20 January 2004) and No.162/522/DPRD/2004 (25 March 2004), respectively. 945 3.2 Baun Bango, A Traditional Village Bordering with Sebangau The village of Baun Bango has officially become the capital city of Kamipang sub district through Indonesian Government decree no 5/2002, which legalized the formation of eight new districts of Central Kalimantan since 10 April 2002. The territory of Baun Bango village covers an area of 625 km2 bordering on the north with Asam Kumbang village, on the west with Telaga village, on the east with Palangkaraya city and on the south with Tumbang Ronen village. The village is located approximately 24 km from the city of Kasongan (the capital city of Katingan district). It used to be reached only by river transportation; however since the beginning of 2011 the village can be reached within 3 hours by car from the city of Palangkaraya, the capital city of Central Kalimantan province. In 2010, the village had 835 residents spread out in 230 households. The majority of the people of Baun Bango is Dayak Ngaju followed by Banjarese and Javanese. Perez (2010), who carried out research at Baun Bango village during 2003-2005, found a high intensity of logging activities along the Katingan River, especially at Baun Bango village. However, since this research started in 2009, there was no illegal logging happening near Baun Bango village. Officially logging is considered illegal through the Presidential Instruction year 2005 on combating illegal logging. After the presidential instruction, the law enforcement regarding illegal logging has been stopped up by the local government. Several illegal loggers have been caught during recent years and sent to prison. During fieldwork I observed that the police stations at sub-district and district level were involved in combating illegal logging. These actions have increased the fear of villagers to conduct logging illegally. Due to this condition, the majority of people along the Katingan River have switched their livelihood into their traditional livelihood: fishing, rattan gardening and practicing swidden agriculture, especially in Baun Bango village. However, the majority of livelihood activities of Baun Bango villagers were seasonal. In dry season, they fish or harvest rattans. During the wet seasons, they start planting rubber. The changes of livelihood in Baun Bango are presented in Table 1. Table 1. The changes of the main livelihood-activities in Baun Bango village during 2008-2011 LIVELIHOOD <1980 - fishing - swidden agriculture 1980-1990 - fishing - swidden agriculture - rattan gardening -collecting jelutung and dammar latex 1990-2000 - fishing - swidden agriculture - rattan gardening -collecting jelutung and dammar latex - logging 2000-2010 - fishing - swidden agriculture (up to 2006) - rattan gardening -collecting jelutung and dammar latex - logging (up to 2007) - rubber gardening - fish farming - oil palm (started in 2010) 2011 - fishing - rattan gardening -collecting jelutung and dammar latex - rubber gardening - fish culture - oil palm Source (primary data, 2011) Nevertheless, the primary livelihood at Baun bango village is fishery up to present. Before the park was designated and before the logging era, they depended on traditional fishery which were catching fishes at rivers and lakes. Hence, since the park authority and NGOs came to them, they have been shifting their livelihood into a more fish farming near their houses. The objective of these intervention programs/ the community development programs from the park authority and NGOs working in the area is decreasing the high dependency of the local people to the Sebangau natural resources inside the park. 946 3.3 The Community Development Programs in Baun Bango The list of community development program carried out by the Balai Taman Nasional Sebangau, local governments and NGOs working in the area such as WWF Central Kalimantan and Yayasan Cakrawala Indonesia is presented in Table 2. Table 2. The community development progams for traditional village carried out by the Sebangau management: Balai Taman Nasional Sebangau (BTNS), local governments, WWF Central Kalimantan and Yayasan Cakrawala Indonesia INSTITUTION PROGRAM CONSTRAINTS WWF Fish nugget and dried fish - capitals (equipments, money) home industry - marketing for fish nuggets - preservation techniques for fish nuggets Rattan handicraft home - product quality industry - period of production (manual vs machine) - equipments -lack of skill Fish farming - lack of fish juvenile availability -lack of fish fodder - price fluctuation -fish species preferences Agroforestry plots: rubber, - slow growth of plants fruiting trees - Wrong location for planting (rambutan,mango,pineapple) YCI - environmental education -no programs for drop outs students for students - low availability of raw material - training of fish fodder making -the plants could not grow due to the -paddy field plots at Kereng wrong location of plots Belawan continuously flooding, plants died establishing vegetable plots Local government Sebangau national authority - irrigation installation - never harvest , continuously flooding - assisting the rattan seedlings - long period of flooding, could not be planted - pamswakarsa (forest patrol - not continuing park involving local people) - agroforestry - wrong location/ not suitable for agriculture Provincial social KuBe : assisting 100 fish - lack of fish fodder office cages (caramba) District fishery -assisting carambas and fish No constraints office juveniles - juvenile restocking -rivers cleaning District - assisting paddy seedlings - flooding, could not be planted 947 Agriculture office - assisting cows for farmer - lack of grazing area groups District forestry - Reforestation: mahoni, Wrong location, the plants could not office jelutung, rubber and sukun grow well (Artocarpus communis) Source: primary data (2011) Most of the programs on planting trees, paddy or vegetables were not successful due to flooding or the wrong location in establishing plots. Flooding happened periodically since hundred years ago, however after logging era, the flooding happened more often and longer. This has made it difficult for the people of Baun Bango to conduct agriculture activities. For this reason, the program implementers were asking a higher area (Dayak Ngaju= Kereng) for establishing plots, however due to the unsuitable plant species and a layer of granite underneath the area, they were also a total failure. Most of the community development programs conducted at Baun bango have no sustainability. Those programs stopped after the training stopped, except for fishery due to their main livelihood nowadays. Fish farming were now seen as promising alternative livelihood for the people Baun bango despite of their difficulties in obtaining fish fodders. Baun Bango village is bordering directly with Sebangau national park. Therefore, accelerating alternative livelihood and increasing the economy of the people are very crucial so that their pressure to the natural resources inside the park can be decreased. The village of Baun bango could function as a guard to this conservation forest because after appointed as national park, the people mainly utilized fish and have not logged since. The village of Baun bango could be categorized as poor village due to its limited access to development and natural resource use. In the future, to increase the welfare of people around conservation forests, an –ecosystem-based comprehensive model is needed. Developing the knowledge and skill of the people in management of the natural resources surrounding them hopefully could decrease their dependency to the resources inside the conservation forest. Alternative strategy for collaboration between Sebangau national park and the village of Baun bango is the appointing of special zones for their fish farming livelihood. Salafsky et al (2000) stated three relationships between livelihood and conservation, one of them is buffer zone strategy/ economic substitution. The main character of this strategy was that a zoning could be used to create a spatial compromise which enabling the local people to practice their livelihood while at the same time protecting key species and its habitat. The theory is to decrease the dependency of the people to natural resources inside the park by focusing the alternative livelihood inside the bufferzone. Another strategy of collaboration between the park and the people could be accommodating in a special zone (zona khusus). The current Sebangau tentative zoning has not accommodated the interest and needs of the local people who have high dependency on the Sebangau natural resources. The people of Baun Bango with the main livelihood in fishery have a high interest in this zoning revision. Lakes as a location for fishing are located inside the park. The park manager shall consider lakes as special zones to be utilized for local people in practicing fishing. 3.4 Baun Bango as a Conservation Village Ministry of Forestry decree No. P. 16/2011 on General Guidelines of National Program for Forestry Community Empowerment and Development (Program Nasional Pemberdayaan Masyarakat Mandiri Kehutanan/ PNPM Mandiri Kehutanan) stated that the implementation of this program in conservation forests is in the form of Desa Konservasi (Conservation Village). Conservation Village is a village located inside or around a conservation forest. The main activities in this program were community development, village spatial planning based on conservation and the development of village economy based on conservation. Baun Bango 948 village could be promoted as Conservation village as a strategy of collaboration between the park authority and the local people by 1) enhancing the knowledge and skill of local people in increasing the economic value of fish (changing raw fish into fish products such as fish nuggets, fish chips, dried fish, fish floss, etc.), 2) promoting the fish product, 3) finding and opening the market for the fish product, 4) shifting traditional fishing into more fish farming, 5) promoting Baun bango for ecotourism. Box 2. The importance of the quality of co-management process “There is no “right process” to develop a ”right management partnership” but the quality of the process is extremely important, as a partnership is generally as strong, or as weak, as the process that generated it”. Borrini-Feyerabend et al (2007) 4. CONCLUSION Fishery was the only community development programs that considered as successful in Baun Bango because fishing is the dominant Dayak Ngaju traditional livelihood. Converting raw fish into fish products were promising to gain a more economic value of fish. Fish farming is seen as a promising alternative livelihood for people of Baun Bango and it could also decrease the dependency of local people to the natural resources inside the park. Alternative strategy for collaboration between Sebangau national park and the village of Baun bango is appointing special zones for their fish farming livelihood and the development of Model Desa Konservasi (Conservation Village Model). REFERENCES Borrini-Feyerabend, G, Pimbert, M, Farvar, M T, Kothari, A and Renard, Y (2007): Sharing Power. A global guide to collaborative management of natural resources. Earthscan, UK. Perez (2010): Deep Rooted Hopes and Green Entanglements. Implementing Indigenous Peoples Rights and Nature-Conservation in The Philippines and Indonesia. PhD dissertation. Leiden: Leiden University. Salafsky, N and Wollenberg E (2000): Linking Livelihood and Conservation: A Conceptual Framework and Scale for Assessing the Integration of Human Needs and Biodiversity. World Development 28, No. 8. 949 INAFOR 11P-033 INTERNATIONAL CONFERENCE OF INDONESIAN FORESTRY RESEARCHERS (INAFOR) Response of Kapur Naga ( Callophylum soulattri ) Cuttings to Arbuscular Mycorrhiza Inoculation in The Nursery Tri Wira Yuwati, Purwanto Budi Santosa, Budi Hermawan and Sudin Panjaitan Forestry Research Institute of Banjarbaru Jl. Ahmad Yani Km 28.7 Landasan Ulin, Banjarbaru, South Kalimantan, 70711, INDONESIA Corresponding email: [email protected] Poster paper prepared for The First International Conference of Indonesian Forestry Researchers (INAFOR) Bogor, 5 – 7 December 2011 INAFOR SECRETARIAT Sub Division of Dissemination, Publication and Library FORESTRY RESEARCH AND DEVELOPMENT AGENCY Jl. Gunung Batu 5, Bogor 16610 950 Response of Kapur Naga ( Callophylum soulattri) Cuttings to Arbuscular Mycorrhiza Inoculation in The Nursery Tri Wira Yuwati, Purwanto Budi Santosa, Budi Hermawan and Sudin Panjaitan Forestry Research Institute of Banjarbaru Jl. Ahmad Yani Km 28.7 Landasan Ulin, Banjarbaru, South Kalimantan, 70711, INDONESIA Corresponding email: [email protected] ABSTRACT Arbuscular mycorrhiza fungi is very potential to assist degraded peat swamp forest rehabilitation due to its ability to increase the survival rate and plant growth. In order to prove this statement, arbuscular mycorrhiza spores namely: Glomus clarum, Gigaspora decipiens and Enthrophospora sp. were inoculated to Kapur Naga (C. soulattri) seedlings in the nursery. The result showed that G. clarum was able to increase the height (p=0,00) and diameter (p=0,004) growth of C. soulattri 5 months after inoculation in the nursery. Seedling age, the compatibility between mycorrhiza and its host plant and period of arbuscular mycorrhiza structure formulation were several factors determining the effect of inoculation on plant growth and survival rate. Keywords: Arbuscular mycorrhiza, Callophylum soulattri, Kapur Naga, peat swamp forest 1. INTRODUCTION Peat swamp forests in Central Kalimantan are facing problems due to forest fires, illegal logging, conversion into other land use and the wrong drainage technique. Rehabilitation efforts in degraded peat swamp forest are facing constraints due to low soil pH, acidic soil reaction and low content of available nutrients for plants. The peat soil also has a specific character called ―irreversible drying‖; degrading its capacity to absorb water after burnt; which makes it more difficult to grow plants. The irreversible drying characteristic has made the peat soil lost its function as a sponge: absorbs water in rainy season and supply water in dry season. The presence of mycorrhizal associations in in the roots of peat swamp forest species was reported. Mycorrhizal associations on roots of Shorea balangeran (Balangeran), Gonistylus bancanus (Ramin), Cratoxylum arborescens (Gerunggang) and Calophyllum soullattri (Kapur Naga) were confirmed (Tawaraya et al., 2003; Yuwati, 2003). Turjaman et al. (2006) investigated the effect of Glomus clarum and Gigaspora decipiens inoculation on Dyera polyphylla and Aquilaria filaria under greenhouse conditions. The result showed that plant height, diameter and shoot and root dry weights of D. polyphylla and A. filaria increased after inoculation with G. clarum and G. decipiens. Arbuscular mycorrhiza fungi is very potential to assist degraded peat swamp forest rehabilitation due to its ability to increase the survival rate and plant growth by increasing Phosphorus uptake and protecting plant roots from critical condition. In order to prove this statement, indigenous arbuscular mycorrhiza spores-isolated from degraded peat swamp forest of Central Kalimantan namely: Glomus clarum, Gigaspora decipiens and Enthrophospora sp. were inoculated to Kapur Naga Callophylum. soulattri) cuttings in the nursery. 2. MATERIAL AND METHODS 2.1 The Experimental Set-up The experiment and mycorrhizal assessment were conducted at the nursery and Forest microbiology lab of Banjarbaru Forestry Research Institute of South Kalimantan. The isolation and mass-production of the mycorrhiza inoculum was conducted by Forest Microbiology Lab, Forest and Nature Conservation Research and Development Center Bogor. The spores of 951 Glomus clarum, Gigaspora decipiens and Entrosphospora sp. were isolated from degraded peat swamp forest at Kelampangan, Palangkaraya, Central Kalimantan (2o13' LS, 113o56' BT) by trap culture. The spores of G. clarum, G. decipiens and Entrosphosphora sp. were mass-produced by Pueraria javanica host plant in a pot culture with zeolite as the medium (Turjaman et al., 2006). The cuttings were surface sterilized with H2O2 5% for 5 minutes and rinsed with tap water before sowing. The root stimulating hormone was applied on cuttings before sowing. The application of arbuscular mycorrhiza fungal inoculum G. clarum, G. decipiens and Entrosphospora sp. were conducted on cuttings of C. soulattri. Before sowing, 10 g of inoculums was applied. In total there were 4 treatments and 10 replications per-tretament. The cuttings were daily watered using tap water. The growth performance and survival were recorded periodically. After 20 weeks, roots were sampled for mycorrhizal assessment. The remaining root and shoot of the seedlings were sampled, oven dried (70oC, 48 hours) and weighed to acquire the data of total biomass. sent to the laboratory of Swamp Plant Research Institute of Banjarbaru to determine the nutrient content on shoots. 2.2 Mycorrhizal Assessment Mycorrhizal assessment was conducted according to Brundrett et al. (1996). The fine roots collected were cleared, stained and examined under dissecting microscope. Roots were cleared in 10% KOH and then were rinsed with tap water. Cleared roots were stained for 3 minutes in a 5% tryphan blue lactoglycerol. The roots were distained by rinsing in tap water (acidified with a few drops of vinegar) for 1 minute. Roots fragments were checked for mycorrhizal infection under 400-x magnification. The mycorrhiza infection rate was determined using Gridline Intersection Method (Giovannetti and Mosse, 1980). All data obtained (height, diameter, total dry weight and the mycorrhizal colonization) were checked for normality before performing groups differences analysis using SPSS program. 3. RESULTS AND DISCUSSION 3.1 Height, Diameter and Number of Leaves Figure 1 showed that the height of C. soulattri cuttings were significantly different with inoculation treatments compared with control. Thus, no significant difference could be seen from the diameter of cuttings (Figure 2). The number of leaves of C. Soulattri cuttings were also significantly different between inoculation treatments compared with control (Figure 3). 952 Figure 1. Mean height of Callophylum soulattri cuttings 5 months after inoculation in the nursery with inoculation treatments compared with control. Bars showed the mean height ± standard of deviation for height (F3,40=7,553; p=0,00<0,05). The same character showed no significant differenceses for C. soulattri height with degree of freedom 95%. Figure 2. Mean diameter of Callophylum soulattri cuttings 5 months after inoculation in the nursery with inoculation treatments compared with control. Bars showed the mean diameter ± standard of deviation for diameter (F3,40=0,717; p=0,547<0,05). The same character showed no significant differenceses for C. soulattri diameter with degree of freedom 95%. 953 Figure 3. Mean number of leaves of Callophylum soulattri cuttings 5 months after inoculation in the nursery with inoculation treatments compared with control. Bars showed the number of leaves ± standard of deviation for number of leaves (F3,40=8,663; p=0,00<0,05). The same character showed no significant differences for C. soulattri number of leaves with degree of freedom 95%. 3.2 Total Dry Weight The total dry weight of C. soulattri cuttings are presented in Table 1. C. soulattri cuttings inoculated with Enthrophospora sp. performed the highest total dry weight. Table 1. The total dry weight (gram) of Callophylum soulattri for control and AMF inoculation treatments Treatments Dry weight (gram) Control Entrosphospora sp. Gigaspora decipiens Glomus clarum 0.338 0.483 0.320 0.343 3.3 Nutrient Content of C. soulattri Shoots The average percentage of nutrient content on shoots of C. soulattri cuttings is presented in Table 2. Table 2. The nutrient content (N, P, K, Ca and Mg) of C. soulattri shoots for control and AMF inoculation treatments Treatments Control Enthrospospora sp. Gigaspora decipiens Glomus clarum Content (%) N P 0.90 0.19 0.82 0.22 0.85 0.26 0.84 0.18 K 0.57 0.31 0.73 0.54 Ca 0.10 0.12 0.19 0.39 Mg 0.11 0.06 0.08 0.14 3.4 AMF Colonization AMF colonization on the roots of C. soulattri cuttings is presented in Table 3. Cuttings inoculated with Enthrophospora sp. showed the highest colonization rate while cuttings without inoculation showed no AMF colonization. Table 3. The AMF colonization on the roots of C. soulattri for control and AMF inoculation treatments Treatments AMF colonization (%) 954 Control Enthrosphospora sp. Gigaspora decipiens Glomus clarum 0 14.35 8.33 6.66 3.5 MR and MPR The value of Mycorrhizal responsiveness and Mycorrhizal phosphorus responsiveness are presented in Table 4. The highest value of mycorrhizal responsiveness is Enthrophospora sp while the highest mycorrhizal phosphorus responsiveness obtained by Gigaspora decipiens. This result is in line with the highest P content in the shoots of C.soulattri inoculated with Gigaspora decipiens (Table 2). Table 4. MR value (Mycorrhizal responsiveness) and MPR value (Mycorrhizal phosphorus responsiveness) Treatments MR MPR Enthrosphospora sp. 0.300 0.137 Gigaspora decipiens -0.056 0.259 Glomus clarum 0.015 -0.062 3.6 Discussion The early height growth and number of leaves of C. soulattri increased after inoculated with G. clarum, G. decipiens and Enthrophospora sp, thus not for diameter growth. This result was supported by Turjaman et al. (2006), who investigated the effect of G. clarum and G. decipiens on D. polyphylla and A. filaria. The result of the experiment was that the AM fungi inoculation gave positive effect in increasing the height, diameter, shoot and root dry weight of both plant species 180 days after inoculation (Turjaman et al., 2006). The diameter was not significantly different between inoculation treatments and control because the plant material was from cuttings. In the initial growth of cutting, the energy was directed to root growth and then continue with shoot growth. The observation in this experiment took 5 months (150 days) which considered a shortperiod for peat swamp species. A longer observation period was needed to determine the effect of AMF inoculation treatments on the diameter growth of C. soulattri cuttings. Colonization with G. clarum, G. decipiens and Enthrophospora sp. increased the height and number of leaves of C. soulattri cuttings because of their benefit in increasing P uptake and other nutrients (Brundrett et al., 1996). Muthukumar et al. (2001) reported that AMF inoculation on Azadirachta indica increased the plant growth compared with control. Onguene (2005) also confirmed that mycorrhizal inoculation has a potential for improving Terminalia superba, Distemonanthus benthamianus, and Entandrophragma utile seedlings establishment on deforested land at Cameroon. Due to the rehabilitation of the degraded peat swamp forest in Indonesia, the utilization of AMF was needed to be applied for C. soulattri in the nursery. Miller and Jastrow (1992) and Requena et al. (2001) in Oehl et al. (2003) stated that AM fungi application was needed for the reclamation and revegetation of degraded lands, especially in the tropics. The compatibility between AMF and its host plant should also be taken into consideration. The compatibility of AMF to the host plant was crucial (Suhardi et.al., 1997). The AMF which was not compatible to the host plant would not result in positive symbiosis. Indigenous mycorrhiza exploration and field trials of inoculated peat swamp plant species were needed to support the rehabilitation of degraded peat swamp forest especially in Central Kalimantan. It was proved that the mycorrhiza application increased the growth of C. soulattri cuttings in the nursery. 955 4. CONCLUSION AMF inoculation showed significant different on the height and number of leaves of C. soulattri cuttings five months after inoculation compared with control, thus not for diameter. The compatibility between AMF and plant host is a very crucial factor to ensure the effectiveness of AMF in assisting the plant growth and survival rate of the plant. Callophylum soulattri cuttings inoculated with AMF could be a potential species for rehabilitation of degraded peat swamp forest in Central Kalimantan. REFERENCES Brundrett, M, Bougher, N, Dell, B, Grove, T and Malajczuk, N (1996): Working with mycorrhiza in forestry and agriculture, ACIAR. Giovannetti M and Mosse B (1980): An evaluation of techniques for measuring vesicular arbuscular mycorrhizal infection in roots. NewPhytologist 84:489–500. Muthukumar, T K Udaiyan and V Rajeshkannan (2001): Response of neem(Azadirachta indica) to indigenous arbuscular mycorrhiza fungi, phosphate solubilizing and asymbiotic nitrogen-fixing bacteria under tropical nursery conditions. Bio Fertil Soils 34 (2001):417-426. Oehl, F, Sieverding, E, Ineichen, K, Ma¨der, P, Boller, T and Wiemken, A (2003): Impact of land use intensity on the species diversity of arbuscular mycorrhizal fungi in agroecosystems of Central Europe. Applied and Environmental Microbiology 69(5): 2816–2824. Onguene N A and T W Kuyper (2005): Growth response of three native timber species to soils with different arbuscular mycorrhizal inoculum potentials in South Cameroon Indigenous inoculum and effect of additionof grass inoculum. Forest Ecology and Management 210:283–290. Suhardi, M Naim, B Radjagukguk, O Karyanto, J Widodo, W Wienarni and T Herawan (1997): Interaction among progenies/provenances of sengon, arbuscular mycorrhiza fungi and rhizobial isolates growth on ultisol. Pages 217 in F A Smith, K Kramadibrata, R D M Simanungkalit., N Sukarno and S T Nuhamara (eds.). Proceedings of International Conference on Mycorrhizas in Sustainable Tropical Agriculture and Forest Ecosystems. Bogor, 27-30 October. Tawaraya K, Takaya Y, Turjaman M, Tuah S J, Limin S H, Tamai Y, Cha J Y, Wagatsuma T and Osaki M (2003): Arbuscular mycorrhizal colonization of tree species grown in peat swamp forests of Central Kalimantan, Indonesia. Forest Ecology and Management 6258: 1-6. Turjaman, M, Y Tamai, E Santoso, M Osaki and K Tawaraya (2006): Arbuscular mycorrhizal fungi increased early growth of two nontimber forest product species Dyera polyphylla and Aquilaria filaria under greenhouse conditions. Mycorrhiza 16: 459-464. Yuwati, T W (2003): Keberadaan mikorisa asli setempat pada hutan rawa gambut pasca kebakaran, Tumbang Nusa, Kalimantan Tengah. Buletin Tekno Hutan Tanaman. Balai Penelitian dan Pengembangan Hutan Tanaman Indonesia Bagian Timur. Banjarbaru. Vol 1 No.1 Oktober 2003. 956 INAFOR 11P-034 INTERNATIONAL CONFERENCE OF INDONESIAN FORESTRY RESEARCHERS (INAFOR) Review of Food Security System Based on Forest Community Knowledge Syamsul Hidayat Centre for Plant Conservation, Bogor Botanical Garden, Indonesian Institute of Sciences Jl. Ir. H. Juanda No. 13 Bogor, 16122, INDONESIA Poster paper prepared for The First International Conference of Indonesian Forestry Researchers (INAFOR) Bogor, 5 – 7 December 2011 INAFOR SECRETARIAT Sub Division of Dissemination, Publication and Library FORESTRY RESEARCH AND DEVELOPMENT AGENCY Jl. Gunung Batu 5, Bogor 16610 Review of Food Security System Based on Forest Community Knowledge 957 Syamsul Hidayat Centre for Plant Conservation, Bogor Botanical Garden, Indonesian Institute of Sciences Jl. Ir. H. Juanda No. 13 Bogor, 16122, INDONESIA ABSTRACT Food is a part of human rights. Food security ultimately determines the dignity of the nation itself. Indonesia has diverse tribes who living around the forest, each of which allegedly has its own food security. The purpose of this paper is to study the regional food security system which can be used as the basis to develop a national food security system. Through literature review of several scientific and popular articles, obtained several examples of traditional community food security system in Indonesia. This paper describes the food security system of the tribes that could sustainable manage forest ecosystem. Keywords: Tribes, food security, sustainable manage forest 1. INTRODUCTION Food is a major requirement for human life wherever they are. Availability of food becomes an important issue for every state in advance what the poor countries and underdeveloped. The availability of food determines the food security status of a nation that ultimately determines a nation's dignity. According to the UU No.7/1996 food security is defined as the fulfillment of the conditions of food for the household as reflected in the availability of adequate food, both quantity and quality, safe, equitable and affordable. The current definition, agreed during the 1996 World Food Summit, is a broad one: ‗Food security exists when all people, at all times, have physical and economic access to safe and nutritious food which meets their dietary needs and food preferences for an active and healthy life’. The important thing is often forgotten in the family, food needs a balanced nutrition. According to Winarno (2004), well-balanced nutrition is a daily menu structure that is able to provide nutrients for the body to be healthy, food ingredients consisting of a group of proteins, energy and protector (vitamins and minerals). Definition food itself according to PP RI No.28 / 2004 is anything that comes from biological sources and water, whether treated or untreated, which is applied as a food or beverage for human consumption, including food additives, food materials, and other materials used in the process of preparing, processing, and or manufacture of food and beverages. According to Saparianto et al (2006) food can be distinguished to fresh food and processed food. 1. Fresh Food is food that has not undergone processing, can be consumed directly or used as raw materials of food processing. 2. Processed food is a food or beverage process results in a way or a certain method with or without additional materials. Whether fresh food or processed food are needed in everyday life of society. Traditional food very closely with rituals (Winarno, 2007). This will be very visible, especially on people's lives around the forest. Forests for society is not new, especially for people who still have values and traditional culture. Since ancient times, they not only see the forest as a source of potential power only, but it is a source of food, medicine, energy, clothing, environment and some of them believed that the forest has a spiritual value (Susatijo. 2008). However, although the eating habits of a society are largely determined by tradition and family background, they are easily changed by the influence of a new lifestyle. With the increasing socio-economic status and the increasing number of women entering the workforce in the various strata of society plus the swift exposure to information media and advertising, the 958 ever increasing number of foreign food that penetrates and urgent family and replaces the daily menus. In a further development of civilization, traditional societies are no longer made the source of food, clothing, and medicine from the forest directly. But they made the forest as a source of economic activity. Forest products which they obtained no longer oriented to the needs of their consumption, but also traded as the source of their livelihood. With the increasing population and globalization, then the food should have become an essential part of any government program. The limited land for farming, the loss of local crop seeds, should be the main focus of attention as well as being important for the government, as well as for other community groups. This paper aims to open up horizons of food security systems that are in some traditional societies; especially they are living around the forest. The results of this study are expected to be a foundation that leads to national food security system. 2. METHODS The information obtained is described in a narrative about the forest community food security system which is supposed to represent the larger islands in Indonesia. In this case some tribes are considered to represent the ethnic groups in Indonesia and has a unique lifestyle, they are Baduy in Java, Dayak in Kalimantan, Sakai in Sumatra, Kajang in Sulawesi, and Kanum in Papua. 3. DISCUSSION In an effort to protect and revive the food self-sufficiency, the local food security system should be on the agenda of development, both at the provincial and district level. It's time the provincial government and local governments look and learn the culture and the local system in meeting food needs. Things are good and true in a traditional system of food security should be rewarded and used as a basis in the development of food security in the higher strata. Frame of mind should no longer just chasing a target rate of growth alone but also must bear a policy to protect the area of productive people, mainly agricultural land (agricultural), land and food reserves and areas of cultural-religious, so that local communities will still be able to survive. In general, indigenous communities have a "traditional knowledge" in managing the land. In principle, there are three important things contained in it. First, the religious values and social ethics underlying agricultural practices. Second, customary norms and rules, which regulate the relationship between communities and the natural environment. Third, local knowledge and skills gained from empirical experience of many decades and even hundreds of years managing the farm. These are integral system that underlies the order of social life, cultural, economic and political community of indigenous communities. As an example of an indigenous community food security system which needs to be appreciated and can be used as a cornerstone in the development of food security in a higher level, among others, will be outlined as follows: 3.1 Sakai Community (Sumatra) Sakai, who now have their existence threatened local wisdom in maintaining the ecological balance for centuries, far beyond the modern man who claimed more civilized. Evidently, before the arrival of industrial machines, Sakai community remains able to maintain their forests sustainably. According to Sulistywati and Arif (2007), one of the ways in which to maintain the ecology of the forest is to apply strict land zonation. Their customary forests are divided into several categories, including indigenous forests (hutan adat), ban forest (hutan larangan), and forest for farming (hutan perladangan). Indigenous forests should only be taken rattan, resin, and honey bees, but the main trees should not be felled. While the ban forests, which are usually located on the banks of the river, should not be disturbed at all. Forests may be cleared for agricultural fields with a rotation 959 system. In addition to applying zonation, Sakai tribe also forbids its citizens to cut down some tree species, including sialang trees (beehive), kapur, labuai, and fruits. The trees around the beehive tree, up to a radius of 1-2 kilometers, are also prohibited to cut because of the trees was assessed as a habitat for honey bees. Their way of farming is done by moving or shifting cultivation, rotating precisely. However, they will only open fields in the forest that is for farming. After a few rounds, they will return to the land that was opened first or so-called tail of land. The displacement is in groups with a number of member‘s 10-20 people. In one place, these groups settled 1 to 3 years. It takes up to 10 years to get around going back into place. During that time, a land farm (forest) has time to recover before it can be used again. 3.2 Baduy Community (Banten) Baduy society is a community of people who in their daily lot of philosophy of life. In the Baduy community has never recognized the nature in which they live as his own, but managed and enjoyed together. In the difficult circumstances they are fasting or reducing their best food. If the situation is no longer possible for it, then people will turn to leuit. Leuit is a building similar to a house but smaller in size, containing ngahuma rice results (rice from dry farming). Leuit prepared to anticipate the occurrence of famine, drought, pest‘s aphis or other rice diseases. Every family has a leuit. The higher of socioeconomic status, the more leuit owned by the family. According to Pristiyanto (2005) leuit a symbol of food security for the Baduy. Food security is very important, considering the fact the relationship with the outside world is very limited. Therefore, the Baduy people trying to meet their needs independently. Rice produced from the dry paddy field is a major food source of the Baduy. For them leuit is a significant savings. Baduy man making leuit as food supply facing the possibility of their worst in the economy. If the content is no longer leuit full, it addresses not good for them. There will be instability in the lives of Baduy citizens. Therefore, the number leuit continues to increase and more than the amount of their homes. Besides individually owned, there are also leuit owned communally. Approximately equal to the cooperative system. Leuit specifically designed to be able to store grain for long periods of time and hassle free mice. Leuit able to store grain until a hundred years. In addition to physical care, leuit protected by puun (traditional elders) with spells. Under the floor is usually hanged perupuyan (a kind of furnace is made from coconut shells filled with ash from cooking stoves to burn gaharu (sandalwood)). Baduy population does not use rice seeds from the outside. They only use seed from their previous crop. To take care of rice plants, they use a mixture of ingredients such as plant tamiang, cangkudu, gempol, laja, and pacing. These plants are crushed and mixed with palm wine and then stocked into the mature plant. Its function is similar to the pesticide. 3.3 Dayak Community (Kalimantan) Forests are one part of the circle of life Dayak community, as well as soil, water, fields, crops, and living things around it (Fatah & Tio. 2004). Talking about forests and other natural resources in the context of the Dayak community cannot be separated from discussions about the land. Land in the indigenous Dayak is the origin of man, so he gets a very high respect and is a property that cannot be treated arbitrarily. This relationship creates certain procedures to achieve the balance of life in human interaction with nature, which the Dayak community called Aruh. They rely on local natural resources (resource-based activity) and take just enough that they need. They used cash crops such as rubber, cinnamon, bamboo or wood straight, palm, and rivers as borders of their land owned. People recognize distinctions shape the earth's surface, mainly related to the division of the allotment of land management. Based on community consensus, indigenous territories are 960 divided into several groups of land use. Katuan larangan is a ban forest that should not be used for bahuma (farming) because it is believed as the ancestral residence hall community. This forest is located in the mountains at an altitude of 700 meters above sea level, and is a protected area for plants and animals, as well as a regional provider of water resources for the community. Besides the ban forest, forest area which can be used by the Dayak community is katuan adat. These forests belong to the majority indigenous and can be opened to the public, should take advantage of wood in it to meet the needs of building houses and firewood. This area can also be planted with crops or hardwood plantations by all members of the community after they did not bahuma (farming). There are also Katuan keramat. This region is the burial place for the ancestors and cannot be used for anything other than as a tomb. Katuan keramat is usually located in the mountains. Another division is gatah orchard area (rubber). Gatah garden is a special area planted with rubber to meet the economic needs of society while the field is the area planted with shortterm crops (rice, peppers, cucumbers, crops, etc.). The fields are usually opened in the flat area. Only a small proportion of the indigenous village which is a residential area, including Hall of People, covering an area of less than 2 hectares. Villages are usually situated in the flat (valley) or taniti (hills) which is an area is relatively gentle. There are five basic principles of natural resource management that can be observed in Dayak culture, namely: sustainability, togetherness, biodiversity, subsistence, and adherence to customary law. If these five principles are carried out consistently it will produce a sustainable development environment that includes beneficial in economically, ecologically and culturally. 3.4 Kajang Community (Sulawesi) Manage forest resources sustainably has become part of their lives, despite the geographical territory not far from the center of economic activity and government. This is caused by the relationship of indigenous peoples with the forest environment based on the wise philosophy of life, namely to treat the forest as a mother who must be respected and protected. They have strong life principles, holding fast to the messages ancestors called Pasanganga Ri Kajang where the authenticity of cultural and natural only survives. They have a hereditary message: Nurture the world and its contents, as well as the sky, humans and forests. This is seen as a philosophy of life that puts the heavens, the earth, humans and forests, as an inseparable unity in an ecosystem that must be kept in balance. Human is just one component of the macrocosmos that always depends on other components. This is implemented in everyday life, such as the uniform appearance of their house, both in terms of materials, the magnitude and direction of the building. This is intended to avoid mutual envy among those that can result in a desire to obtain more results by damaging the forest. In addition, the ban on building houses with bricks of raw materials. Although somewhat related to their beliefs. But if examined further, the fuel needed to quite a lot of wood for burning bricks. This means providing protection at the source of fuel wood mainly comes from the forest. So that the exploitation of forests for any commercial purposes are eliminated. Kajang also has forest areas (Budiman, 2010), such as Barong Karamaka (sacred and forbidden forest), and Borong Luara (community forests). As an example for the Barong Batasayya (forest border), cutting tree must have permission from Ammatoa as traditional leaders. That is, only certain types of wood allowed to cut and only used it for public facilities. The main requirement when people want to chop down a tree is the person required to plant trees as a replacement. If the tree is growing well, then cutting tree can be done. Cutting down a tree species, then the person shall be plant two similar trees in locations that have been determined by Ammatoa. Felling trees is also only be done by using traditional tools in the form of an ax or machete. How to remove the wood that has been felled should also be carried or carried way and should not be withdrawn because it can damage other plants in the vicinity. 961 Ammatoa is much respected and very believable, especially to keep Pasangnga Ri Kajang. The belief that the most important is to maintain the forests, because forests are the spirit and lives of Kajang. Being an Ammatoa require great sacrifices. People believe that the Ammatoa was the last to feel the prosperity when people prosperity, but became the first person to be experiencing poverty. 3.5 Kanum Community (Papua) Papua agro ecosystem conditions strongly support the development of agricultural commodities, particularly for specific food commodities. However, the development of these commodities are not evenly distributed in the Papua, except sweet potatoes, which can be found in various regions, both in the lowlands and highlands, especially in the central mountain region. There are four ways agro ecosystem based on the cultivation of sweet potato. Papuan type, namely wen hipere, waganak Yabu, Yabu enaifpipme, and Yabu Lome. Wen hipere is sweet potato cropping systems by making permanent gullies in the watery areas. Yabu is a system of sweet potato cultivation in dry land. Yabu system is divided into a number of ways of planting, depending on the slope of the land. Yabu waganak, for slopes 15-25% with poor drainage systems, Yabu enaifpipme, for steep slopes 30-50%, and Yabu Lome to the slopes without tillage. Both systems have been practiced cultivation in Jayawijaya society for generations. In addition to sweet potatoes, gembili spread over several regions of Papua, especially in Merauke. Kanum Tribe in Merauke as one tribe that inhabit in the Wasur National Park, consumes gembili hereditary as a staple food. When a bad season or not yet entered a period of gembili harvest, they do hunting activities. Sago and bananas became alternative foods for local people (Rauf & Lestari. 2009). 4. CONCLUSION Each indigenous people have a system of environmental management and different food production. The study has revealed that non-wood forest products are of vital importance as tools for coping with food shortage. The nutritive value of most wild foods is good and sometimes better than domesticated expensive foods. Agro ecology provides the scientific basis to address production of local food. Local food security system should be used wisely and tested examples and good study materials for building a national food security. REFERENCES Budiman, A (2010): Meneropong "Si Hitam" Sang http://www.mediaindonesia.com/webtorial/klh/index.php?ar_id=NzA0Ng Enviromentalis Fatah,Y A and B Tio (2004): Menggali Kearifan di Kaki Pegunungan Meratus. Intip Hutan. Pristiyanto,D (2005): Leuit, Lumbung Padi Orang Baduy. http://www.kompas.com/kompas/17/daerah/1258925.htm. Downloaded at 3rd of May, 2010. Rauf, A W and M S Lestari (2009): Pemanfaatan Komoditas Pangan Lokal Sebagai Sumber Pangan alternative di Papua. Jurnal Litbang Pertanian, 28(2). Saparianto, C and D Hidayati (2006): Bahan Tambahan Pangan. Kanisius. Yogyakarta. Sulistyawati, A R and A Arif (2007): Runtuhnya Kearifan http://kompas.com/kompas-cetak/0704/25/humaniora/3482158.htm Lokal Suku Sakai. Susatijo (2008): Hutan Sebagai Salah Satu Alternative Lumbung Pangan. Majalah Surili 45(2). Winarno, F G (2004): Keamanan Pangan jilid I. M-Brio Press. Bogor. Winarno, F G (2007): Teknologi Pangan.Mario Press. Bogor. 962 INAFOR 11P-035 INTERNATIONAL CONFERENCE OF INDONESIAN FORESTRY RESEARCHERS (INAFOR) Role of Forest Cover in Providing Environmental Services: A Case Study of Cisadane Watershed Edy Junaidi and Mohamad Siarudin Forestry Research Institute of Ciamis Jl. Raya Ciamis-Banjar Km. 4, Ciamis, 46201, INDONESIA Paper prepared for The First International Conference of Indonesian Forestry Researchers (INAFOR) Bogor, 5 – 7 December 2011 INAFOR SECRETARIAT Sub Division of Dissemination, Publication and Library FORESTRY RESEARCH AND DEVELOPMENT AGENCY Jl. Gunung Batu 5, Bogor 16610 963 Role of Forest Cover in Providing Environmental Services: A Case Study of Cisadane Watershed Edy Junaidi and Mohamad Siarudin Forestry Research Institute of Ciamis Jl. Raya Ciamis-Banjar Km. 4, Ciamis, 46201, INDONESIA ABSTRACT Forest resource exists as one of biotic components in a watershed area. Its existence provides environmental services in form of direct economic values including water resource conservation (providing water for irrigation, clean water for industries and households). Forest also gives indirect benefits in form of water cycle regulation, flood and drought mitigation, sedimentation control, water filter, and carbon sequestering. This paper aims to examine these benefits of forest in providing environmental services in various scales of watershed area. Using SWAT (Soil and Water Assesment Tool) hydrological model, three scales of watershed area (large, medium and small area with case study of Cisadane watershed, Cikaniki watershed, and Cikaniki sub-watershed) and two land cover scenarios (existing forest cover and all forest changes into farm land) was simulated in environmental services quantification. Result shows that The existence of forest is proven to have important role in providing environmental services in all scales of watershed area. Role of forest cover in providing environmental services is more significant in a small scale watershed area than the larger scales. This argument is in line with the claim that factors influencing the hydrological system are more numerous where forest cover is only one of the subsystems. Keywords: Environmental services, forest, watershed area, Cisadane, Cikaniki 1. INTRODUCTION A natural resource can provide environmental services when its functions have a real economic value for the users and give production inputs. The total economic value of a resource is divided into use value and non use value. The use value itself is divided into direct benefit, indirect benefit and optional benefit. Meanwhile, non use value can be categorized into existence value and intrinsic value (FAO, 2006). Forest is a natural resource which exists as one of biotic components in a watershed area. Nonetheless, economic values of the forest are usually seen only from the tangible benefit of wood products, while othher benefits are neglected. Forests in fact have a lot of benefit as environmental services, especially in a watershed area. Based on literature review, a forest in a watershed area gives direct economic values in form of water resource conservation (providing water for irrigation, clean water for industries and households. Forest also gives indirect benefits in form of water regulation, flood and drought mitigation, sedimentation control, water filter, and carbon sequestering. Planology agency of Ministry of Forestry reported that forest cover in Java Island during 1999 to 2000 was onlu 4%. This condition contributes to the damage of watershed area in Java Island, shown from the extrem floods and droughts. The percentage of these disasters increase by the decrease of forest cover. In a damaged watershed area, the proportion of surface flow from rainwater increases while the infiltration of water to soil decreases. This condition will reduce the water table and the water supply to river will deccrease accordingly. The capacity of a watershed area to infiltrate 964 rainwater into ground water and to drain them in form of base flow in dry season depends on the biophysical condition. One of biophisical factors contributing in that process is land cover. Forest is one of the best land covers for its function in regulating the hydrological system in a watershed area. Eventhough the total water yield decreases in a watershed area, the difference of water yield in dry and rainy season is not too far. Forest can maintain the continuity of water yield in a watershed area. On the contrary, deforestation causes the decrease of soil infiltration capacity, so that the surface flow and soil erosion increase. This paper aims to examine the benefits of forest in providing environmental services in various scales of watershed area (large, medium and small). This paper basically quantifies the environmental services both in form of direct and indirect benefits, with Cisadane watershed area as the case study. 2. METHODOLOGY This study tries to use SWAT (Soil dan Water Assessment Tool) model to simulate the environmental services in Cisadane watershed area. According to Junaidi (2007), SWAT model can be used in predicting the hidrology of Cisadane watershed based on criteria of Santi et al (2001) in Elief (2005). It is based on the fact that the average of predicted river flow is within the range of -15 % to +15 % from the average of observed river flow, and the value of E NS ≥ 0,5 and R2 ≥ 0,6. 107 -6 -6 CILEGON TELUKNAGA ·# KETERANGAN : BABELAN SERANG ·# ·# Sub Sub DAS Cikaniki DAS Cisadane JAKARTA TANGERANG ·# ·# Sungai BEKASI LEUWILIANG ·# Kota Kabupaten LEGOK ·# CIPUTAT ·# ·# PONDOKGEDE ·# ·# · # ·# CIBITUNG KARAWANG Sub DAS Cikaniki ·# SERPONG RANGKASBITUNG ·# CIKARANG ·# ·# SAWANGAN CIGOMBONG ·# ·# ·# ·# ·# CIMANGGIS DEPOK PARUNG Sub sub DAS Cikaniki ·# CILEUNGSI CIBARUSAH ·# ·# RUMPIN JONGGOL ·# ·# CIBINONG U LEUWILIANG JAWA BARAT BOGOR ·# ·# SKALA 1 : 500.000 CIAWI ·# CISARUA ·# CIGOMBONG ·# 9000 0 9000 Meters 107 Figure 1: Spacial location of Cisadane watershed, Cikaniki watershed and Cikaniki sub-watershed The hydrological model in this study tested three scale of watershed area, which are large area (total area 100 – 500 km2), medium area (total area = 100 – 500 km2) and small area (total area < 100 km2) (shown in Figure 1). Cisadane watershed (total area 1,372.3 km2), Cikaniki watersed (total area 199.6 km2), and Cikaniki sub-watersed (total area 77.5 km2) were taken as case study to represent the large, medium and small area respectively. The estimation of environmental services were simulated using two scenarios: the existing forest cover; and if the forest cover changes into a lea area. In the existing condition, the forest cover in Cisadane watershed, Cikaniki watershed, and Cikaniki sub-watershed is 22.9 %, 20.8 % and 82.8 % respectively. 965 3. RESULT AND DISCUSSION 3.1 Forest Role as Water Yield Resources The forest potency as water yield resources in a watershad area can be approached through measuring the dependable flow (the daily minimum flow that can be exploited in the dry season) and maximum flow. At Cisadane watershad with total area + 1,372.3 km2 and forest cover about 22.9 % of watershad area, the dependable flow that can be exploited is about 16,560 liter/second and the maximum flow in the rain season is about 262,700 liter/second. In the scenario-2, (when forest cover is converted to become the farm), the dependable flow slightly decrease into 16,420 liter/second; while the maximum flow increase to 278,000 liter/second. At medium scale watershed area, Cikaniki watershad (total area 199.6 km2) where the forest cover area is about 20.8 %, the dependable flow is about 4,371 liter/second and the maximum in the rain season is 40,420 liter/second. In the scenario-2, the dependable flow decreases to 3,057 liter/second, while the maximum flow increases to 41,990 liter/second. A similar trend also occurs in the water yield simulation in the small watershed area. In the case of Cikaniki watershad with forest cover about 82.8 % of the total watershad area (77.5 km2), the dependable flow which can be exploited is 2,718 liter/second and the maximum flow in the rains season is 14,820 liter/second. In the scenario-2, the the dependable flow decreases to 888 liter/second while the maximum flow increases to 19,730 liter/second. Based on that estimation, the result of dependable flow is still higher in the case of existing forest cover than that of scenario-2. This trend is consistent for all scale of watershed area. However, the role of forest cover as water yield resources is more sizeable in the case of small and medium scale of watershed area compare to the large area. 3.2 Forest Role as Water Cycle Regulator The approach to estimate the forest role as water cycle regulator is by measuring the percentage of annual rainfall at every watershad which becomes evapotranspiration, and also by measuring the percentage of annual water yield which comes from the surface flow and the base flow. At the Cisadane watershad, about 18.5 % of the 4,133.8 mm of annual rainfall becomes evapotranspiration. The percentage of evapotranspiration slightly decreases to 17.9 % at the scenario-2. Meanwhile the water yield at the scenario-1 (existing forest cover) is about 2,063 mm which consists of 50.45 % of surface flow and 46.72 % of base flow. In the scenario-2, the water yield slightly increases which consists of 57.33% of surface flow and 40.22 % of base flow. In the case of Cikaniki Watershad, about 19% of 4,074.3 mm of annual rainfall becomes evapotranspiration. This evapotranspiration decreases to 17% of rainfall in the scenario-2. In the existing forest cover condition, water yields is about 3,119.1 which consist of about 39.64% surface flow and about 57.34% base flow. In the scenario-2, this forest yield will increase to 3,225.3 mm consisting of 53.02% surface flow and 44.67% base flow. The trend in the previous cases is consistent in the case of Cikaniki sub-watershad. The percentage of evapotranspiration decreases from 20% to 18% of 3,744.1 mm of rainfall, if the existing forest cover is converted into farm area. Meanwhile, the water yield increases from 2,783.2 mm (consisting of 29.16% surface flow and 66.49 % base flow) to 2,928.67 mm (consisting of about 49.79% surface flow and 47.13% base flow), in the same land cover change. Those figures shows that the change of the existing forest cover into farm land will decreases percentage of evapotranspiration and will increase water yield. More importantly, the increase of surface flow in that land cover change will be followed by the increase of surface flow. 3.3 Forest Role as Floods and Droughts Mitigation The role of forest as floods and droughts mitagation at some watershad area can be estimated by measuring C value (runoff coefficient) and the CRR (coefficient of river regime). 966 The c value shows the level of rainfall potency becoming surface flow. The flood potency will increase by the increase of c value. Meanwhile, the CRR value shows the comparison between daily maximum flow and daily minimum flow. A higher RRC value will shows a better continuity of river flow along seasons. At the Cisadane watershad, the c value is about 0.25 and the CRR value is 16. This c value and CRR value slightly increases to 0.29 and 16.61 respectively in the scenario-2. In the case of Cikaniki watershed, the c value is about 0.3 and the CRR value is 9.25. This c value and CRR value also increases to 0.42 and 13.74 respectively in the scenario-2. A same trends occurs in Cikaniki sub-watershed where the c value and CRR value is increases from 0.22 and 5.45 to 0.39 and 18.89 by the change of existing forest cover to farm land. Those figures show that the forest cover has an important role in controlling floods and drought. In the case of small scale watershed area (Cikaniki sub-watershed), the role of forest to control floods and droughts apparently more significant compared to the larger scales of watershed area. 3.4 Forest Role as Sedimentation Control The role of forest as sedimentation control can be estimated by simply measuring the sediment yield in a watershed area. In Cisadane watershed, the value of sediment is about 12,136.75 ton in the existing forest cover. It is estimated to increase to 12,538.75 ton if the forest cover changes into farm land. In the case of Cikaniki watershed and Cikaniki sub-watershed, the sediment value also increase by that land cover change, from 100,369.57 ton and 219,360.99 ton to 271,728.33 ton and 576,605 ton respectively. Those figures indicates that forest cover have a sizeable role in controlling rate of sedimentation. As shown in the case of Cisadane watershed, the rate of sedimentation increases by the decrease of forest cover. This trend is more significant in the case of Cikaniki watershed and watershed area where the increase of sedimentation is more than twice as before if the forest cover changes into farm land. 3.5 Forest Role in Carbon Sequestering Estimation of carbon stock at Cisadane watershad is about 4,231.25 ton/ha. The carbon stock estimation slightly increases to 3.547 ton/ha in the scenario-2. In the case of Cikaniki watershed, the carbon estimation is far lower than Cisadane case, where the value is only about 537,07 ton/ha. It also will decrease to 440.32 ton/ha in the scenario-2. Meanwhile in Cikaniki sub-watershed, the carbon stock decrease from 205.85 ton/ha to 157.52 ton/ ha when the forest cover changes into farm land. 3.6 Forest Role as Water Filter The role of forest as water filter in a watershad area can be approached through measuring the amount of organic N and organic P in the sediment. A high value of organic N and organic P shows a low ability in water filtering in the sedimentation process. In the existing forest cover, the organic N and organic P at sediment is estimated about 3.13 kg/ha and 0.389 kg/ha at Cisadane watershed. The estimation of organic N and organic P slightly increases to 0.399 kg/ha in the scenario-2. In the case of Cikaniki watershed, the estimation of organic N and P also increases from 0.212 kg/ha and 0.029 kg/ha to 4.125 kg/ha and the 0.505 kg/ha. This trend is still consistent in the case of Cikaniki sub-watershed, where the organic N and P increases from 0.055 kg/ha and 0.009 hg/ha to 4.125 kg/ha and 0.505 hg/ha when the existing forest cover changes into farm land. 4. CONCLUSION The forest existence in a watershed area undoubtedly gives an important roles in providing environmental services in all scales of watershed area. The hydrological model using SWAT proves that the change of existing forest cover into farm land will contribute to the 967 decrease of environmental services. The simulation also shows that the role of forest cover in providing environmental services is more significant in a small scale watershed area than the larger scale. This argument is in line with the claim that factors influencing the hydrological system are more numerous where forest cover is only one of the subsystems. REFERENCES Arsyad (2006): Konservasi Tanah dan Air. IPB Press. Bogor. Balai Pengelolaan DAS Ciliwung – Cisadane (2002): RTL RLKT DAS Cisadane. Dirjen RLPS. Departemen Kehutanan. Unpublished. Arnold J G, Kiniry J R and Williems, J R (2005): Soil and Water Assessment Tool Theoretical Documentation version 2005. Agricultur Research Servic US. Texas. http://www.http.brc.tamus.edu/swat/document. html [31 Oktober 2008]. Junaidi, E (2009): Kajian Berbagai Alternatif Perencanaan Pengelolaan DAS Cisadane Menggunakan Model SWAT. Thesis Pascasarjana IPB. Bogor. Unpublished. Luis F and Leon (2007): Map Window Interface http://www.waterbase.org/document.html [5 Mei 2008]. for SWAT (MWSWAT). Mulyana, N (2000): Pengaruh Hutan Pinus (P. merkusii) terhadap Karekteristik Hidrologi di sub DAS Ciwulan Hulu KPH Tasikmalaya Perum Perhutani Unit III Jawa Barat. Thesis Pascasarjana IPB. Bogor. Unpublished. Purwanto, E and J Ruitjer (2004): Hubungan antara Hutan dan Fungsi DAS. Dampak Hidrologi Hutan, Agroforestri dan Pertanian Lahan Kering sebagai Dasar Pemberian Imbalan Kepada Penghasil Jasa Lingkungan. Prosiding Lokakarya di Padang, Singkarak, Sumatera Barat, Indonesia. World Agroforestry Center. Puslitbang Perhutani (2002): Hutan Pinus dan Hasil Air. Ekstraksi Hasil-Hasil Penelitian Tentang Pengaruh Hutan Pinus terhadap Erosi dan Tata Air. Cepu. Neitsch S R, J G Arnold, J R and Kiniry, R Srinivasan and J R Williems (2005): Soil and Water Assessment Input/Output File Documentation version 2005. Agricultur Research ervic US. Texas. http://www. http.brc.tamus.edu/swat/document. Html [31 Oktober 2008]. Suryatmojo, H (2004): Peran Hutan Pinus sebagai Penyedia Jasa Lingkungan Melalui Penyimpan Karbon dan Penyedia sumberdaya Air. Hasil Penelitian. Yogyakarta. Vertessy, R A (2000): Impacts of Plantation forestry on Catchment Runoff. Proceeding of a National Workshop, 20-21 JULY 2000, Melbourne. RIIRDC Publication No 01/20. 968 INAFOR 11P-036 INTERNATIONAL CONFERENCE OF INDONESIAN FORESTRY RESEARCHERS (INAFOR) Somatic Embryogenesis Induction in Suren Merah ( Toona sinensis ) Micropropagation Asri Insiana Putri Paper prepared for The First International Conference of Indonesian Forestry Researchers (INAFOR) Bogor, 5 – 7 December 2011 INAFOR SECRETARIAT Sub Division of Dissemination, Publication and Library FORESTRY RESEARCH AND DEVELOPMENT AGENCY Jl. Gunung Batu 5, Bogor 16610 969 Somatic Embryogenesis Induction in Suren Merah ( Toona sinensis ) Micropropagation Asri Insiana Putri ABSTRACT Toona sinensis, an important multipurpose – including medicine value – tree, belongs to the Meliaceae that are almost the most commercially important tropical timber species, dominating international trade in those areas where they are native. Natural regeneration occurs in this specie by seed diffusion and grafting, such propagation is limited. Another vegetative propagation technique developed in the effort to reduce the problems associated with physiological ageing and selection of superior genotypes is somatic embryogenesis (SE). Only a few Meliaceae plant micropropagation studies have been carried out. There is a lack of reference material concerning T. sinensis from somatic tissue culture. Plant regeneration from a tissue culture system is often the most critical step in the success of various biotechnological techniques of any tree improvement program. SE is also the foundation of genetic transformation in several economically important tree species.The object of this paper was to promote T. sinensis embryogenic callus formation, in order to establish clonal propagate this on in vitro condition. Callus was established from both young leaves and petioles on full strength MS basal medium, vitamins, supplemented with BAP (1 mg/l), NAA (0.5 mg/l) and various concentration of 2,4-D (1 mg/l; 2.5 mg/l; 5 mg/l; 7.5 mg/l and 10 mg/l). Freshly-formed embryogenic callus was subculture on ESDM. This medium consists of full strength MS salts and vitamins with BAP (0.5 mg/l), NAA (1 mg/l). Mature somatic embryos were subculture to obtain synchronous and normal germination on full strength MS salts and vitamins with BAP (0.5 mg/l) and GA4 (1 mg/l). Somatic embryos developed indirectly over the surface of embryogenic callus that heterogeneous, light brown to green in color and friable. All tissues responded to high concentration 2,4-D (10 mg/l) in MS media with highest callus multiplications were 0.7 g/30 days subculture. To understand the developmental aspect of T. sinensis SE, hystology of the SE was investigated. The globular and heart stage were observed after 30 days on ESDM. In this study have shown that the ES have great potential as an alternative for propagation and conserving this species. More research is needed for developing an effective method for regenerating into planlet. Keywords: Embryogenic induction, suren merah, micropropagation Abbreviations: 2,4-D, 2,4 diclorophenoxyacetic acid; BAP, N6-benzylaminopurine; GA4, giberrelic acid-4; NAA, -naphthaleneacetic acid; ESDM, Embryogenesis Subculture and Development Medium 1. INTRODUCTION Toona sp. (Chinese: xiang chun, Hindi: Daaraluu; Malay & Indonesia: Suren; Vietnamese Tông dù) is native to eastern and southeastern Asia, from North Korea south through most of eastern, central and southwestern China to Nepal, northeastern India, Myanmar, Thailand, Malaysia, and Indonesia. Scientific classification of Toona sinensis and Toona sureni were Plantae (Kingdom), Magnoliophyta (Division), Magnoliopsida (Class), Sapindales (Order), Meliaceae (Family) and Toona (Genus) (Rushforth, 1999). The tree is fast growing (Huxley, 1992) and is said to resist all insects and diseases (Anonymous, 1987). It is also long-lived (Genders, 1994). Wood - very durable, easily worked, takes a good polish. It is a very valuable timber, resembling mahogany, and is used for making 970 furniture, window frames etc. (Heyne, 1987). The leaves and stems of this plant have been used for the treatments of enteritis, dysentery, and itch in oriental medicine (Ming-Mu et al., 2006). The 80 % aceton extract of Toona sinensis exhibited considerable antioxidant activity in the 1,1diphenyl-2-picryldydrazyl (DPPH) radical-scavenging assay (Wang et al., 2007). With future generations of seed breeding traits separation, cutting propagation rooting difficulties induced by burying root division of propagation, propagation coefficient of low, slow and because of the speed of conventional propagation methods, it is difficult to promote and develop rapidly (Bingkun et al., 2002; Zhang et al., 1999). Somatic embryogenesis of Toona sinensis has been seen as an attractive alternative to traditional propagation methods. This is due to its potential for high multiplication rates and rejuvenation, as well as its compatibitity with molecular techniques. To date no commercial production of somatic embryos has been undertaken for direct planting, but field trials are currently being conducted for a combination of propagation methods utilising somatic embryos (Susan, 2002). The aims of this study were to provide a greater understanding of the factors that influence the initiation within the somatic embryogenesis process, in order to promote T. sinensis embryogenic callus formation and establish clonal propagate this on in vitro condition. The initiation of T. sinensis embryogenic tissue was achieved in this study. Many factors influenced the frequencies of initiation. The main three factors were explants development (providing the greatest influence) and media/component type. The research highlighted the complexities of obtaining consistent and reliable initiation of embryogenic tissue. Somatic embryogenesis is a process by which embryos develop from a single cell or a small group of vegetative cells. The normal developmental pathway of zygotic embryogeny is maintained whereby embryogenic tissue consisting of immature somatic embryos resembles immature zygotic embyros. The somatic embryo closely resembles the zygotic embryo with its polarized structure comprising of an embryogenic region (head) with elongated suspensor cells (Attree & Fowke 1993; Gupta 1988). Williams and Maheswaran (1986) also described somatic embryogenesis as "the process by which haploid or diploid somatic cells develop into whole plants through characteristic embryological stages without the fusion of gametes". The somatic embryogenic technique involves the in vitro capture of embryogenic tissue to produce a high number of somatic embryos. These can then be matured into somatic plantlets capable of growth in the field (Smith et al., 1994). 2. MATERIAL AND METHODS Leaves and petioles were obtain from one-year-old of T. sinensis plantlets, that explant of the planlets were from branch shoot cutting (Putri, 2010). Transverse incisions, 2 mm apart, were made on the leaves and petioles, which were then placed with the abaxial side down (Linacero and Vazquez, 1986) in culture bottles containing 25 ml callus medium. In the first experiment to determined optimal 2,4D concentrations (1; 2.5 ; 5 ; 7.5; 10 mg/l) were tested in the medium consisted of a combination of full strength Murashige and Skoog, 1962 (MS) basal medium; supplemented with vitamins, BAP (1 mg/l), NAA (0.5 mg/l), sucrose (40 g/l) and GelriteTM (2 g/l). Two replicate tests were conducted, each with 25 leaves and 25 petioles per treatment. After four weeks incubation, freshly-formed embryogenic callus was subculture on ESDM (Embryogenesis Subculture and Development Medium). This medium consists of full strength MS salts and vitamins with BAP (0.5 mg/l), NAA (1 mg/l). Four weeks after the transfer of calli to development medium, the fresh weight were determined (W1) and for the following four weeks (W2) as cumulative weight. Finally, the highest weight of calli from the development medium was used to mature somatic embryos subculture to obtain synchronous and normal germination on full strength MS salts and vitamins with BAP (0.5 mg/l) and GA4 (1 mg/l). Various types of calli were observed 2 to 3 weeks after cultur initiation on the callus 971 development medium. All cultures were kept at 270C in the dark for the first four weeks, and at a 16 h photoperiod (40 µEm-2S-1) for the following four weeks. 3. RESULTS AND DISCUSSION Successful induction of callus tissue was observed in both leave and petiole explants of T. sinensis. Embryogenic calli were induced on embryogenic callus induction medium consisted of full strength (salts and vitamins) MS medium containing auxin 2,4 diclorophenoxyacetic acid (2,4D); -naphthaleneacetic acid (NAA); and cytokinin: N6-benzylaminopurine (BAP). In general, somatic embryogenesis consists of callus formation on a medium containing auxins and then subculture to hormone-free medium (Reinert, 1967), but the presence of an auxins is usually required in the medium in order to maintain the growth of subculture (Halperin, 1995). Moreover, the type and concentration of auxin employed are critical for the induction and formation of somatic embryos. The auxin, 2,4D has been the most efficient plant growth regulator for the induction of somatic embryogenesis (Merkle, 1995) even though in some cases, this auxin was not necessary in the development of somatic embryos (Smith and Krikorian, 1990). In our work, it is clear that 2,4D has a positive effect on callus formation and callus weight cumulative. All tissues responded to high concentration 2,4-D (10 mg/l) in MS media with highest callus multiplications were 0.7 g/4 weeks subculture (Table 1). The largest number of embryogenic calli were obtain in the explants from petioles with 10 mg/l 2,4D; 12 weeks after the induction of culturing. The explants neither from leaves nor petioles did not product embryogenic callus within 12 weeks on media with 1 mg/l 2,4D. Table 1. Somatic embryogenesis of T. sinensis from leaves and petioles explants on media with different 2,4D concentration Explant 2,4D (mg/l) No. of explants culture Contamin a tion or no callusing No. of explants producing callus Mean (± SE) of cumulative Callus weight after 4 weeks (g) Leaves 0 1 2,5 5 7,5 10 0 1 2,5 5 7,5 10 50 50 50 50 50 50 50 50 50 50 50 50 2 5 15 11 9 12 7 18 15 15 13 7 0 5 17 18 29 38 0 11 20 21 30 43 0 0,16 ± 1,87 0,12 ± 2,66 0,49 ± 0,78 0,44 ± 1,54 0,72 ± 1,67 0 0,09 ± 2,04 0,16 ± 1,56 0,20 ± 2,55 0,66 ± 1,78 0,78 ± 1,82 Petioles No. of explants producing embryogenic callus at indicate weeks after the induction of culturing 4 8 0 0 0 0 1 0 5 2 9 7 17 13 0 0 0 0 8 5 12 10 10 10 17 20 On the other hand, cytokinin is very important for somatic embryogenesis development, important for somatic embryo differentiation and BAP was the most suitable cytokinin (Sharry & Teixera da Silva, 2006). This inductive effect of cytokinin in somatic embryogenesis was also reported by Kavathekar et al. (1978), Jha et al. (1981) and Desai et al. (1986). In this study, 972 induction of T. sinensis calli occurred with a very low concentration of BAP (0.5 mg/l). Cytokinin N6- benzylaminopurin (BAP) particularly stimulates protein synthesis and participate in cell cycle control. They can promote the maturation of chloroplast and delay the senescence of detached leaves (Makunga and van Staden, 2008). Auxin α-naphtalene acetic acid (NAA) promote, mainly in combination with cytokinins, the growth of calli, cell suspensions and organs, and also regulate the direction of morphogenesis. They are involved in the formation of maristems giving rise to organs (Machakova, 2008). Tissues started to de-differentiated at 7 culture days. After 8 weeks induction of culturing, embryogenic calli had formed from leaves in 78.95 % (Figure 1) and from petioles in 86,05 % (Figure 2) of the explants. Various types of calli were observed 3 to 4 weeks after culture initiation on the callus induction medium. They were watery, mucilaginous, friable or compact, and their colour was brown or translucent. Figure 1: T. sinensis calli from leaves Figure 2: T. sinensis calli from petioles Figure 3: T. sinensis embryogenic calli Embryogenic callus (Figure 3) was indirect homogeneous, light brown to green in color, friable and with a high number of calli separable on its surface after subculture to ESDM medium for callus development. Yelowish white and granular calli appeard secondarily on the surface of translucent or mucilaginous callus 8 to 12 weeks after culture initiation. After subculture to mature somatic embryos medium with GA4, to obtain synchronous and normal germination, globular and heart structures were formed and developed. Growth regulator GA4 are involved in a wide range of developmental responses. These include promotion of elongation in stems and leaves, due in part to activation of the intercalary meristem. Another important role of GA4 is the induction of hydrolytic enzymes and the control of juvenility (Moshkov et al., 2008). In this experiment T. sinensis calli development occurred with a low concentration of GA4 (1 mg/l). To understand the induction of T. sinensis, hystology of the somatic embryogenesis was investigated. T. sinensis plant tissues before callogenesis and after (Figure 4.1) with the different 973 stages of somatic embryogenesis – globular (Figure 4.2) and heart (Figure 4.3) – were easily observe after 30-40 days on ESDM media. a b a a Fig. 4.1 Fig. 4.2 Fig. 4.3 Figure 4: Histology of T. sinensis somatic embryogensis, plant tissues before callogenesis (4.1.a) and after (4.1.b), globular stage (4.2.a) and heart stage (4.3.a) Globular stage somatic embryos isolated from friable callus can be a useful tissue for enriched the target cell population with totipotent cells by removing nonregenerable callus cells. Increasing the probability of recovering transgenic plants following particle accelerationmediated DNA introduction. By not requiring additional time for the establishment of embryogenic suspension cultures, the accumulation of somatic mutations would be minimized (Bregitzer et al., 1991). 4. CONCLUSION In this study have shown that the have great potential as an alternative for propagation and conserving this species. More research is needed for developing an effective method for regenerating into planlet. REFERENCES Anonymous (1987): Wonder Crops, Natural Food Institute. Attre, S M (1993): Embryogenesis of Gymnosperms: Advances in Synthetic Seed Technology of Conifers. Plant Cell Tissue Organ Culture 35:1-35. Bingkun, T, W Pengcheng, Y Mei, T Xiao and Y Yu-yun (2002): Study on Cutting Propagation of Toona sinensis. Bregitzer, P, W R Bushnell, H W Rines and D A Somers (1991): Callus Formation and Plant Regeneration from Somatic Embryos of Oat (Avena sativa L.). Plant Cell Reports 10:243-246. Desai, H, P Bhat and A Mehta (1986): Plant Regeneration of Sapindus trifoliatus L. (Soapnut) through Somatic Embryogenesis. Plant Cell Reports 3:190-191. Genders, R (1994): Scented Flora of the World. London. ISBN 0-7090-5440-8. Gupta, P K and D J Durzan (1985): Shoot Multiplication from Mature Trees of Douglas-fir and Sugar pine. Plant Cell Reports 4:177-179. Halperin, W (1995): In Vitro Embryogenesis: Some Historical Issues and Unresolved Problems In Thorpe T. A. (ed) In Vitro Embryogenesis in Plants. Current Plant science and Biotechnology in Agriculture (vol 20). Kluwer Academic Pub. Netherlands, pp 1-15. 974 Heyne (1987): Tumbuhan Berguna Indonesia. Jilid III. Departemen Kehutanan. Jakarta. Huxley, A (1992): The New RHS Dictionary of Gardening. MacMillan Press 1992 ISBN 0-33347494-5. Jha, T, S Roy and C Mitra (1981): A Brief Review of In Vitro Studies on Umbelliverous Spice Plants: In Rao AN (ed) Proc. COSTED Symp. Tissue Cult. Economically Important Plants. Singapore, pp 94-97. Kavathekar, A P Ganapathi and B Johri (1978): In Vitro Response of Embryoids of Eschcholzia. Biologia Plantarum 20:98-106. Machakova, I, E Zazimalova and E F George (2008): Plant Growth Regulators I: Introduction; Auxins, their Analogues and Inhibitors In Plant Propagation by Tissue Culture 3rd Edition. E.F. George, M.A. Hall and Geert-Jan de Klerk (eds). Volume 1. The Backforund. Springer Pub., Netherland. Makunga, N P and van Staden (2008): An Efficient System for the Production of Clonal Planlets of the Medicinally Important Aromatic Plant: Salvia Africana-lutia L. Plant Cell Tissue and Organ Culture 92:63-72. Merkle, A S (1995): Strategies for Dealing with Limitation of Somatic Embryogenesis in Hardwood Trees. Plant Tissue Culture and Biotechnology 1: 112-121. Ming-Mu H, Chung-Yi C, Shu-Ling H, Sung-Fei H, Pak-Hing B L, Cheng-Ta L and Tian-Jye H (2006): Separation of phenols from the leaves of Toona sinensis (Meliaceae) by Capillary Electrophoresis. Journal of the Chinese Chemical Society, 53:1203-1208. Moshkov, I E, G V Novikova, M A Hall and E F George (2008): Plant Growth Regulator III: Gibberellins, Ethylene, Abscisic Acid, their Analogues and Inhibitors; Miscellaneous Compounds In Plant Propagation by Tissue Culture 3rd Edition. E.F. George, M.A. Hall and GeertJan de Klerk (eds). Volume 1. The Backforund. Springer Pub., Netherland. Murashige, T and F Skoog (1962): A Revised Medium for Rapid Growth and Bioassays with Tobacco Tissue Culture. Physiol. Plant 15:473-497. Putri, A I (2010): Axillary Bud Initiation of Toona sinensis and Toona sureni in Tissue Culture Propagaton. Proceeding International Seminar. Research on Plantation Forest Management. Chalenges and Opportunities. Ministry of Forestry, FORDA, CPFRD. Bogor. Indonesia. Reinert, J (1967): Some Aspect of Embryogenesis in Somatic Cells of Daucus carota. Phytomorphology 17:510-518. Rushforth, K (1999): Trees of Britain and Europe. Collins ISBN 0-00-220013-9. Sharry, S E and J A Teixera da Silva (2006): Effective Organogenesis. Somatic Embryogenesis and Salt Tolerance Induction In Vitro in the Persian Lilac Tree (Melia azadarach L.) Smith, D L and A Krikorian (1990): Somatic Embryogenesis of Carrot in Hormone-Free Medium: External pH Control of Morphogenesis. American Journal of Botany 77:1643-1647. Smith, D R, A Warr, L Grace, C Walter and C Hargreaves (1994): Somatic Embryogenesis Joins the Plantation Forestry Revolution in New Zealand In Proceeding of TAPPI 1994, Biological Sciences Symp. Pp 19-24. Susan, P B (2002): Somatic Embryogenesis in Pinus Radiata. A thesis submitted in total fulfillment of the requirements for the degree of Doctor of Philosophy. School of Life Sciences and Technology, Faculty of Engineering and Science Victoria University. Victoria. Unpublished. Wang K J, C R Yang and Y J Zhang (2007): Phenolic Antioxidants from Fresh Young Leaves and Shoots of Toona sinensis. Food Chemistry 101(1):365-371. 975 Williams, E G and G Maheswaran (1986): Embryogenesis in Higher Plants: An Overview. Plant Cell 5:1361-1369. Zhang Xi A, Yan-Sheng, Chen A, Wei T, Yang B K and Yang H (1999): Toona sinensis In Vitro Propagation Technology. Northwest Plant Journal 19 No. 4. China. 976 INAFOR 11P-037 INTERNATIONAL CONFERENCE OF INDONESIAN FORESTRY RESEARCHERS (INAFOR) Phytochemical Analysis and Habitat of Akar Kuning Plant (Coscinium fenestratum ) from East Kalimantan Ibnu Hajar Paper prepared for The First International Conference of Indonesian Forestry Researchers (INAFOR) Bogor, 5 – 7 December 2011 INAFOR SECRETARIAT Sub Division of Dissemination, Publication and Library FORESTRY RESEARCH AND DEVELOPMENT AGENCY Jl. Gunung Batu 5, Bogor 16610 977 Phytochemical Analysis and Habitat of Akar Kuning Plant (Coscinium fenestratum ) from East Kalimantan Ibnu Hajar ABSTRACT Akar Kuning (Coscinium fenestratum (Gaertn.) Colebr.) is one of the type of forest herbs. Traditional societies, including in the areas of East Kalimantan has utilized it for the treatment. The growing conditions of habitat from one species of plant can affect the growth of these species. Besides, habitat conditions can affect the outcome of secondary metabolites from various plant species. The components of the alkaloid class of compounds, steroids triterpenoids, flavonoids, and saponins. The presence of active chemical ingredients can be discovered through a test of phytochemical. Habitats or growing places influence fitokokimia existing content that evidenced by the different phytochemical content between the roots of yellow in the Wood River Wain Protection Forest. Keywords: Akar kuning, phytochemical, habitat, East Kalimantan 1. INTRODUCTION Indonesia is a country with high plant biodiversity. This potential biodiversity conclude the potential of forest herbs. In chemical, plants contain a variety of active chemical drugs are efficacious. The components of the alkaloid class of compounds, steroids triterpenoids, flavonoids, and saponins. The presence of active chemical ingredients can be discovered through a test of phytochemical. Akar Kuning with the scientific name Coscinium fenestratum (Gaertn.) Colebr, is one of the type of forest herbs. Traditional societies, including in the areas of East Kalimantan has utilized it for the treatment. The growing conditions of habitat from one species of plant can affect the growth of these species. Besides, habitat conditions can affect the outcome of secondary metabolites from various plant species. 2. RESEARCH METHOD This research was conducted by survey method through direct observation technique known as the spaciousness of the locations which is the habitat for Akar Kuning (Coscinium fenestratum) and experimental in the laboratory. Field observations made to make observations and measurements of habitats aspects from akar kuning and to take the akar uning material to be used for phytochemical analysis in the laboratory. Vegetation data collection is done by identifying the types of trees and other plants that are all around (+ 20 m) akar kuning plants. Subsequently made voucher specimens to be identified in the herbarium. Vegetation type and forest cover is determined based on the observation, measured using the altimeter altitude, while the temperature and humidity were measured with higrotermometer. Soil samples taken at three points in the observation plots to a depth of 20 cm (Noorhidayah, 2006) and is made of composites. Akar kuning material obtained from the field in the form of leaves and stems in a qualitative phytochemical tests carried out to determine the levels of the chemical potential of a test with the reagent Dragendorf alkaloids, saponins test (test foam), steroid-triterpenoid with test reagents Liberman Bouchard, phenolic test with a reagent solution of FeCl3 1% and the test reagents flavonoids with Mg / HCl. Tests performed at the Laboratory. 978 2.1 Analysis and Data Processing 2.1.1 Phytochemical Aspect Based on the results of akar kuning phytochemical screening test from different variety of habitats will be tabulated and analyzed descriptively chemical compounds contained in it whether there are significant differences or different habitat does not affect the levels of the chemical (the same chemical content) 2.1.2 Aspects of Habitat Habitat data collected will be classified, tabulated and analyzed descriptively. Soil analysis done to determine the physical and chemical properties of soil and then analyzed descriptively.. 3. RESULT AND DISCUSSION 3.1 Phytochemical Content of Akar Kuning Akar Kuning has been known and used for traditional medicine community. As the medicinal plant species, certainly akar kuning contains chemical compounds that are useful for the treatment. The results of phytochemical screening conducted on the stems and leaves of akar kuning are performed on two different habitats are shown in Table 1. Tabel.1. Phytochemical content of the Akar Kuning No. 1 2 3 4 Sample CBSW CDSW CBWK CDWK Flavonoid - Fenolik + + + + Saponin + + + + Steroid + + Alkaloid + + + + CBSW= Stem Coscinium of Wain River ; CDSW= Leaves Coscinium of Wain River CBWK= Stem Coscinium Wartono Kadrie; CDWK= Leaves Coscinium Wartono Kadrie Source : Primer data Viewed from the phytochemical contents of akar kuning in Wartono Kadrie forest research, it is found that the secondary metabolites have relatively more compared to those in the Sungai Wain Protection Forest. Akar Knuning in Wartono Kadrie strongly detected contain 4 main elements namely phenolic, saponins, steroids and alkaloids, while in HLSW detected only contains three main elements namely phenolic, saponins and alkaloids. The results of this study indicate that the growth habitat factors affect to the content of phytochemicals that exist at the akar kuning. The content of this phytochemicals indicates that the akar kuning is one of the forest plants that potential to be developed as a medicinal plant. The groups of chemical compounds, namely alkaloids, saponins, phenolic, flavonoids and steroids are known as the largest group of chemical compounds from plants that have more treatment functions. For example alkaloids, in the medical world and organic chemistry, the term alkaloids have long been an important and integral part in the research that has been done so far, either to seek a new alkaloid compounds or for tracking bioactivity. Alkaloid compounds are the most organic compounds found in nature. Almost all alkaloids derived from plants and are widespread in many types of plants. In organoleptic, leaves a bitter taste and pahit, usually identified contain alkaloids. Besides leaves, the alkaloid compound can be found in the roots, seeds, twigs, and bark. Almost all the alkaloids in nature have biological activity and provide specific physiological effects on living things. So the human from the beginning until now always look for drugs of various plant extracts. Function in plants as far as the alkaloid itself is not known for certain, some experts have revealed that the alkaloid is estimated as the protector of 979 plants from pests and diseases, growth regulators, or as alkaline minerals to maintain ion balance (Son, 2008). Flavonoids are one of the largest classes of natural phenols. Flavonoid pigments include many of the most common and found in plants worldwide ranging from fungus to angiosperms. Flavonoid compounds can be described as a series of C6-C3-C6 carbon skeleton that is composed of two groups C6 (tersubtitusi benzene rings) connected by three aliphatic carbon chain. Flavonoids have a distinctive trait is a very sharp odor, is largely a yellow pigment, soluble in water and organic solvents, easy to decompose at high temperatures. Flavonoid have a number of usability. First, for plants this is as a plant regulator, regulator of photosynthesis, and antiviral antimiroba work. Second, for humans, as an antibiotic against cancer and kidney disease, inhibit bleeding. Third, for insects, this is used as the attraction of insects for pollination. Fourth, the other uses are as an active ingredient in the manufacture of vegetable sweet insecticide insecticide. As vegetable peels, here flavonoids come into the mouths of insects (house fly) through the respiratory system of spiracles located on the surface of the body and cause withered on the nerve, and damage to the spiracles consequently could not breathe and eventually die (Dinata, 2008). 3.2 Habitat of Akar Kuning 3.2.1 Physical and Chemical Properties of Soil Factor of soil (edaphic) can affect plant growth. A type of plant will grow well on suitable edaphic conditions. Medicinal plants found in forest habitats by physical and chemical properties of soil as presented in Table 2. Tabel 2. Soil physical and chemical properties in Akar Kuning habitus Habitat & Wain River Physical Chemical Texture Sand (%) Dust (%) Tough (%) Ph H20 KCL Organic C (%) N (%) P suitable (ppm) K suitable (ppm) KTK (cmol(+)/kg) AL+++(cmol(+)/kg) H+ (cmol(+)/kg) Source : Primer Data Wartono Kadrie 51 30 19 46 27 27 4,1 3,7 4,4 3,9 1,33 0,11 4,4 57 7,86 3,24 0,39 1,20 0,11 3,8 69 10,51 3,58 0,30 In Table 2 found that at the habitat of akar kuning dominated by sand fraction. The texture of the soil indicates the level of roughness and smoothness of land is determined based on the constituent grains. Thus it can be said of akar kuning can grow well in soil with a slightly rough texture due to the dominance of the sand fraction. 3.2.2 Altitude and Slope 980 The results showed that the akar kuning found at altitudes of different places and the same slope. Elevation to the habitat in HLSW is 40 meters above sea level and slopes ranging from 0 to 10% whereas in Wartono Kadrie 20 masl and slope ranges between 0 -10% as well. This shows that the roots grow well on the yellow lowland forest area is relatively flat. 3.2.3 Temperature and Humidity Observations shows that akar kuning have habitat with a range of temperatures and humidity ranges between 29ºC-30ºC for temperature and humidity between 78%-83%. Temperature and humidity is one of the important factors that affect plant growth. According Noor Hidayah (2006), the types of forest medicinal plants commonly found in habitat conditions with temperatures between 25ºC - 30ºC with humidity between 68% - 84%. 3.2.4 Vegetation Cover Feature and Type Akar kuning which is studied had a place to grow with the condition of forest canopy cover almost the same, namely the forest cover in the open, slightly open and dense forest. While the type of vegetation still found in disturbed primary forest, old secondary and primary forest. Forman, 1986; Lemmens and Bunyaprahatsara, 2003 also mentions that this species can be found in lowland primary forest. 3.2.5 Vegetation Conditions on Akar Kuning Habitat Akar kuning is a liana vine growing. Based on observations at the study site, this species grows to climb and form groups in an area about 400 m2 (20 mx 20 m) in Rintis Wartono Kadri and Wain River Protection Forest. Akar kuning grow through trees and other plants around it to a height of 20 m. Based on Herbarium collections in the Wanariset Herbarium, this type grows to climb to a height of 10-30 m. This species is mentioned as a large liana (Forman, 1986) and classified as cauliflorous plant (Balgoy, 1987). 4. CONCLUSION 1. Yellow roots proved contain alkaloids, phenolics, saponins and steroids that are potential chemical compounds to be used and developed as a natural medicine. 2. Habitats or growing places influence fitokokimia existing content, this is evidenced by the different phytochemical content between the roots of yellow in the Wood River Wain Protection Forest. ACKNOWLEDGEMENT The research was funded by the Higher Education Research through the Young Lecturer in 2008 Budget. REFERENCES Arda D (2008): Basmi Lalat dengan http://www.litbang.depkes.go.id/lokaciamis/artikel/lalat-arda.htm Jeruk Manis. Balgooy, M M J V (1997): Malesian Rijksherbarium/Hortus Botanicus. Leiden. 1-Spot characters. Seed plants. Volume Forman, L L (1986): Menispermaceae. Flora Malesiana Series I – Spermatophyta Flowering Plants. Vol. 10, Part 2. P : 157 – 253. Martinus Nijhoff Publishers . Netherlands. 981 Lemmens, R H M J and N Bunyapraphatsara (2003): Plant Presources of South-East Asia 12(3) Medicinal and Poisonous Plants 3. Prosea, Bogor. Noorhidayah (2006): Habitat Tumbuhan Obat Hutan Asli Kalimantan. Karya Tulis Ilmiah Diklat Peneliti Tingkat Pertama LIPI Angkatan XXXV. Cibinong. Unpublished. Putra, S E (2008): Alkaloid : Senyawa Terbanyak di Alam. http://www.chem-istry.org/?sect=artikel&ext=125 982

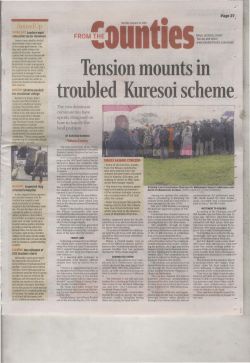

© Copyright 2026