
Document 289703
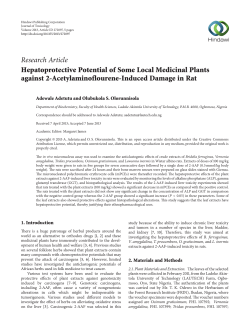
Hindawi Publishing Corporation
Journal of Analytical Methods in Chemistry
Volume 2012, Article ID 298217, 5 pages
doi:10.1155/2012/298217
Research Article
A Green Analytical Method Using Ultrasound in
Sample Preparation for the Flow Injection Determination of
Iron, Manganese, and Zinc in Soluble Solid Samples by
Flame Atomic Absorption Spectrometry
M. Carmen Yebra
Department of Analytical Chemistry, Nutrition and Bromatology, Faculty of Chemistry, University of Santiago de Compostela,
Santiago de Compostela 15782, Spain
Correspondence should be addressed to M. Carmen Yebra, [email protected]
Received 10 November 2011; Accepted 16 January 2012
Academic Editor: Xiu-Ping Yan
Copyright © 2012 M. Carmen Yebra. This is an open access article distributed under the Creative Commons Attribution License,
which permits unrestricted use, distribution, and reproduction in any medium, provided the original work is properly cited.
A simple and rapid analytical method was developed for the determination of iron, manganese, and zinc in soluble solid samples.
The method is based on continuous ultrasonic water dissolution of the sample (5–30 mg) at room temperature followed by flow
injection flame atomic absorption spectrometric determination. A good precision of the whole procedure (1.2–4.6%) and a sample
throughput of ca. 25 samples h−1 were obtained. The proposed green analytical method has been successfully applied for the
determination of iron, manganese, and zinc in soluble solid food samples (soluble cocoa and soluble coffee) and pharmaceutical
preparations (multivitamin tablets). The ranges of concentrations found were 21.4–25.61 μg g−1 for iron, 5.74–18.30 μg g−1 for
manganese, and 33.27–57.90 μg g−1 for zinc in soluble solid food samples and 3.75–9.90 μg g−1 for iron, 0.47–5.05 μg g−1 for
manganese, and 1.55–15.12 μg g−1 for zinc in multivitamin tablets. The accuracy of the proposed method was established by a
comparison with the conventional wet acid digestion method using a paired t-test, indicating the absence of systematic errors.
1. Introduction
Trace metal ions have important roles in our life because of
involving a wide spectrum of activities. Iron, manganese, and
zinc are essential trace elements, having several roles in many
body functions [1].
Sample preparation is a key procedure in modern chemical analysis because it is one of the most time consuming
and error-prone portions of any analytical scheme. In spite of
major advances in the instrumentation used in determinative
steps, many laboratories use sample preparation techniques
that are time consuming and labor intensive. Sample dissolution is one of the most common operations in analytical
chemistry. Because most quantitative techniques require that
samples are introduced in liquid form, thousands of sample
dissolutions are performed every working day in analytical
laboratories. However, most conventional digestion procedures involving inorganic acids are tediously labor intensive,
and a number of them are hazardous to laboratory workers
and to the wider environment [2–4].
In order to avoid these drawbacks, sample introduction
as slurry for different techniques can be an interesting
approach. However, the use of chemical modifiers is required
for slurry analysis by electrothermal atomic absorption spectrometry to obtain interference-free determinations, which
increases the analysis cost and can cause sample contamination. However, the main drawback of this technique is the
nonhomogeneity of the suspensions formed [5–7]. Ultrasound-assisted sample pretreatments offer an alternative approach to sample preparation prior to analysis. This energy
facilitates and accelerates some analytical steps, decreasing
the analysis time and the cost per analysis, increasing accuracy and precision (above all in a continuous mode) [8–12].
These methodologies have been applied to water insoluble
samples, using a diluted inorganic acid (usually nitric acid)
as extraction solution. Nevertheless, only three works were
2
Journal of Analytical Methods in Chemistry
W
DS
SV1
P1
M
SS
SV2
MC
SV3
B
W
UB
P2
C
IV
FAAS
Figure 1: Experimental setup used for the continuous ultrasoundassisted dissolution step and FI determination of iron, manganese,
and zinc in soluble samples. P1 and P2, peristaltic pumps; DS,
dissolving solution; W, waste; UB, ultrasonic bath; M, minicolumn
containing the sample (dissolution cell); SS, standard solution; B,
blank; IV, injection valve; SV1–SV3, switching valves; MC, mixing
coil; C, carrier (ultrapure water); FAAS, flame atomic absorption
spectrometer.
found in the literature reporting the use of continuous ultrasound-assisted approaches for dissolution of water soluble
samples. These works were developed by our investigation
team and are based on continuous milk powder water reconstitution for determination of zinc and iron, and on calcium
and magnesium determination in soluble pharmaceutical
tablets [13–15].
The food and pharmaceutical industry needs simple,
accurate, and green analytical methods that can be routinely
and safely used in the companies’ own quality control laboratories. This work was focused on the study of the continuous ultrasound-assisted dissolution of water soluble foods
and pharmaceutical samples. The continuous ultrasound
dissolution system used is connected to a flow-injection
(FI) manifold, which allows the continuous determination
of trace metals by flame atomic absorption spectrometry
(FAAS). The proposed method is based on the use of
nontoxic reagents that makes it friendly both for the operator
and the environment.
2. Experimental
2.1. Apparatus. The FI manifold used (Figure 1) has two
sections: Section 1 where the solid sample is continuously
dissolved, and Section 2 where the dissolved sample is led
to the detector (FAAS) where the metals are continuously
monitored. This manifold comprises two Gilson Minipuls-3
peristaltic pumps (Gilson, Villiers Le Bel, France) fitted with
PVC tubes, an ultrasonic bath with an ultrasound power of
40 KHz (Selecta, Barcelona, Spain), and a glass minicolumn
used as sample container (50 mm × 3 mm i.d., bed volume
350 μL) (Omnifit, Cambridge, UK). The ends of the minicolumn were plugged with filter paper (Whatman 541). Four
Rheodyne injection or switching valves models 5041 and
5301 (Rohnert Park, USA). A Perkin Elmer Model 5000
atomic absorption spectrometer (Perkin Elmer, Shelton, CTUSA) with a deuterium lamp as background correction
system was used for iron, manganese, and zinc measurements. Hollow cathode lamps (Perkin Elmer) operating at
recommended current were used. The instrument was set
at 248.3, 279.5, and 213.9 nm for Fe, Mn, and Zn determination, respectively. The spectrometer output was connected to a Perkin Elmer Model 50 Servograph Recorder with
a range of 5 mV. The signals measured were the heights of
the absorbance peaks. Numerical analyses of experimental
designs were performed by means of the statistical package
Statgraphics Plus 5.1 (Manugistic, Inc. Rockville, MD, USA).
2.2. Reagents and Solutions. All chemicals were of analyticalreagent grade. Iron, manganese, and zinc standard solutions, 1000 μg mL−1 , were supplied by Merck (Darmstad,
Germany). Nitric acid 65% and hydrochloric acid 30% were
obtained from Merck (Darmstad, Germany). All glassware
used were cleaned in aqueous 4 mol L−1 nitric acid for four
days and rinsed with ultrapure water before use. Ultrapure
water with a resistivity of 18.2 MΩ cm−1 was obtained from
a Milli-Q purification system (Millipore Co., Bedford, MA,
USA).
2.3. Procedure. Soluble solid samples were purchased from
local markets and pharmacies. Pharmaceutical samples were
grinded to a fine powder in a mortar, blended and homogenized, and finally sieved through a 0.1 mm pore diameter
plastic sieve. All samples were kept in clean dry containers.
Solid soluble samples (5–30 mg) were directly weighed
into the glass minicolumn (dissolution cell). Then, each
minicolumn was assembled to the continuous ultrasoundassisted dissolution system, and immersed into the ultrasonic
bath. After, the dissolution circuit was loaded with the
dissolving solution (1 mL of ultrapure water). The dissolving
solution is then circulated at 6 mL min−1 through the
dissolution cell under ultrasonic irradiation during 2 min at
room temperature. The direction of the flow was changed
each 30 s to facilitate sample dissolution avoiding sample
accumulation in the minicolumn ends. Once the sample
is dissolved, the SV2 is switched to its other position, and
the sample is led to the mixing coil where the solution is
homogenized. Then, the loop of the injection valve (IV) is
filled with a volume of 250 μL of the sample solution, which is
injected into an ultrapure water carrier stream that transport
it at 3.5 mL min−1 to the detector.
3. Results and Discussion
3.1. Optimization of the Continuous Dissolution Step. Six
variables, namely, nitric acid concentration, hydrochloric
acid concentration, temperature of the ultrasonic waterbath (dissolution temperature), ultrasound exposure time,
dissolving solution volume, and flow-rate of the continuous
dissolution manifold were selected to be examined. The
studied variables as well as the values for each level (low and
high) are shown in Table 1.
The consequence of changing a variable from low to high
level value was examined on a selected response such as
Journal of Analytical Methods in Chemistry
3
Table 1: Factor levels in the Plackett-Burman factorial design with their optimum values and analytical features of the method.
Factor
Low
High
HNO3 concentration (mol L−1 )
0
3
Optimum
0
HCl concentration (mol L−1 )
0
3
0
Ultrasound exposure time (min)
0.5
5
2
Ultrasonic water-bath temperature (◦ C)
Flow rate of the continuous ultrasound
dissolution system (mL min−1 )
20
70
20
3.5
6
6
3
1
Dissolving solution volume (mL)
1
Analytical features of the method
Fe
Calibration
Correlation coefficient
Mn
−4
A = 0.03C + 4.8 × 10
grapha
(r 2 )
Zn
−4
A = 0.062C + 2.2 × 10
A = 0.21C + 5.2 × 10⁻⁴
0.9997
0.9998
0.9998
0.02
0.01
0.03
LOQ (μg mL )
0.06
0.05
0.1
Relative standard deviation (%)
2.4
4.6
1.2
LOD (μg mL−1 )
−1
a
A, absorbance signal; C, concentration expressed as μg mL−1 .
percentage dissolution efficiency, according to the following
equation:
% dissolution efficiency =
A
B
× 100,
(1)
where A is the concentration of the metal obtained with the
proposed procedure and B the metal concentration obtained
by a manual dissolution using a conventional digestion
procedure with concentrated nitric acid and off-line FAAS
detection [16].
A Plackett-Burman 2∧ 6∗ 3/16 factorial design with a
center point (13 nonrandomized runs) was used to find
the main factors affecting the continuous dissolution step.
This factorial design was applied to a soluble cocoa sample
and to a pharmaceutical preparation (soluble multivitamin
tablet). The conclusions of the screening studies reflected
that only the ultrasound exposure time was a statistically
influential factor, and it was affected by a positive sign.
The other variables were not statistically influential factors
in the ranges studied at the 95% confidence level and all
of them were affected by a positive sign. Although the
concentration of the acids used as dissolving solution (nitric
and hydrochloric acids) had a positive influence on the
dissolution efficiency, a run of the experimental design
achieved a quantitative % dissolution efficiency with the
minimum value of these variables (0 mol L−1 ). Thus, this
minimum value was selected for subsequent experiments
for the both factors, and ultrapure water was selected as
dissolving solution. The dissolving solution volume and the
ultrasonic water-bath temperature had a positive estimated
effect, but these parameters yield small values for the main
effects. Aiming to increase the analytical sensitivity and
to make easy and rapid the sample dissolution step, was
chosen as optimum the minimum value of these variables
(1 mL and room temperature, 20◦ C). Likewise, as the flow
rate of the continuous ultrasound dissolution system had
a positive sign, the maximum value tested for this variable (6 mL min−1 ) was chosen for subsequent experiments.
According to the results, a new experimental design shifted
in the direction of higher ultrasound exposure times would
be desirable. However, this variable was fine tuning outside
the framework of the design because a minor number of
experiments were required. Then, several experiments were
carried out in order to optimize the ultrasound exposure
time, resulting in that the optimum value was 2 min for the
two kinds of samples studied. All the optimum operational
conditions are shown in Table 1.
The sample particle size was studied by a univariate
method. For this were tested particle sizes between 0.03–
0.1 mm. The results obtained indicated that this variable does
not affect to the dissolution process within the range studied.
Other flow parameters involving iron, manganese, and
zinc determination were also optimized. Thus, it was verified
that with a mixing coil length of 199 cm (equivalent to
1.0 mL, which is the volume of the dissolving solution)
was obtained a complete homogenization of the sample
solution. The carrier flow rate and the injected sample
volume were also studied. The carrier flow rate was tested
between 3–6 mL min−1 , and the injected volume of the
sample solution between 100–300 μL. The aspiration flow
rate of the nebulizer was adjusted to be the same as the flow
rate of the carrier solution. Although the highest aspiration
flow rate provides the best sensitivity, a high dispersion takes
place because at the same time was increased the carrier
flow rate. Therefore, a carrier flow rate of 3.5 mL min−1
(dispersion equal to 1.1) was chosen as a compromise to
obtain the minimum dispersion in the flow system. With
regard to the injected sample volume, it was verified that
when the volume was increased, the sensitivity was also
increased. Therefore, a volume of 250 μL was chosen as
optimum, which in addition allows to inject several times the
sample solution to verify its homogeneity.
4
Journal of Analytical Methods in Chemistry
Table 2: Determination of Fe, Mn, and Zn in soluble foods and pharmaceutical samples and paired t-test.
Concentration, mean ± standard deviation (n = 3) (μg g−1 )
Samples
Soluble food sample
Fe
Official method
Mn
Present method
Official method
Zn
Present method
Official method
Present method
Soluble cocoa
20.31 ± 1.63
21.42 ± 0.65
5.31 ± 0.55
5.74 ± 0.21
55.41 ± 2.91
57.90 ± 1.00
Soluble coffee 1
43.77 ± 1.75
44.71 ± 0.71
17.14 ± 0.55
18.30 ± 0.34
54.14 ± 1.87
53.18 ± 0.68
Soluble coffee 2
25.61 ± 0.65
15.07 ± 0.80
14.11 ± 0.34
32.22 ± 1.45
24.16 ± 1.00
Concentration, mean ± standard deviation (n = 3) (mg per tablet)
Nominal
Nominal
Nominal
Present method
Present method
concentration
concentration
concentration
33.27 ± 0.68
Pharmaceutical
preparations
Present method
Multivitamin tablet 1
10.0
9.90 ± 0.01
5.0
5.05 ± 0.02
15.0
15.12 ± 0.03
Multivitamin tablet 2
3.6
3.75 ± 0.02
0.5
0.47 ± 0.01
3.0
2.84 ± 0.02
Multivitamin tablet 3
5.6
5.61 ± 0.03
1.4
1.35 ± 0.02
1.4
1.55 ± 0.02
Critical value of t (P = 0.05) = 2.57; experimental value of t: 2.20 for Fe, 0.35 for Mn, and 0.92 for Zn.
3.2. Analytical Figures of Merit. As can be seen in Table 1,
calibration curves were obtained by using a linear plot of
the peak height as a function of the standard concentrations
of each analyte (n = 7). In order to evaluate matrix interferences, the slopes obtained from analytical and analyte
addition curves were compared. For this, a cocoa soluble
sample and a pharmaceutical preparation (soluble multivitamin tablet) were spiked with several concentrations of the
analytes, which were added as dissolving solution into the
continuous ultrasound dissolution system. The addition
calibration graphs were run (n = 7) under the optimal chemical and flow conditions for the whole process. These equations and their corresponding calibration graphs have the
same slope, demonstrating that the determination of iron,
manganese, and zinc is free of matrix interferences. The
limits of detection (LOD) and quantification (LOQ) were
calculated as the mass of analyte which gives a signal 3σ
or 10σ, for LOD and LOQ, respectively, above the mean
blank signal (where σ is the standard deviation of the blank
signal, n = 30). The values obtained for LOD and LOQ are
shown in Table 1. The precision of the continuous analytical
method was checked using a sample containing 21.42 μg g−1
Fe, 5.74 μg g−1 Mn, and 57.90 μg g−1 Zn (soluble cocoa),
and the results expressed as relative standard deviation (n =
11) are also shown in Table 1. The sample throughput of
the proposed methodology, taking into account the whole
process, was ca. 25 samples per hour.
3.3. Analysis of Real Samples. The method was applied to the
determination of iron, manganese, and zinc in water soluble
food samples and pharmaceutical preparations (soluble
multivitamin tablets). The results obtained expressed as
μg g−1 dry weight and their standard deviation (n = 3)
are shown in Table 2. The results obtained for food samples
were compared with those obtained by employing a wet acid
digestion method [16] on same samples by using the paired
t-test. As is reported in Table 2, both groups of results do
not give significantly different values, thus the agreement
between them is satisfactory at 95% confidence level.
4. Conclusions
The use of a continuous ultrasound-assisted dissolution
system coupled to an FI manifold using ultrapure water as
dissolving solution is confirmed to be an interesting tool for
the automatic dissolution of soluble solid samples of different
nature. This continuous manifold allows the dissolution of a
sample in a time shorter than that required by a batch sample
dissolution procedure. Furthermore, this methodology provides accurate results with high precisions, because there are
not sample losses as result of its manipulation, and does not
present random errors associated to glassware calibration.
The proposed method can be considered as environmentally
friendly at every step of the analytical procedure. All these
characteristics make the method easy to apply to quality
control in industry.
Acknowledgment
This work has been funded by Spain’s Ministry of Science
and Innovation, within the framework of Project CTQ200912282.
References
[1] A. Kocyigit, F. Armutcu, A. Gurel, and B. Ermis, “Alterations
in plasma essential trace elements selenium, manganese, zinc,
copper, and iron concentrations and the possible role of
these elements on oxidative status in patients with childhood
asthma,” Biological Trace Element Research, vol. 97, no. 1, pp.
31–41, 2004.
[2] J. Sastre, A. Sahuquillo, M. Vidal, and G. Rauret, “Determination of Cd, Cu, Pb and Zn in environmental samples:
microwave-assisted total digestion versus aqua regia and nitric
acid extraction,” Analytica Chimica Acta, vol. 462, no. 1, pp.
59–72, 2002.
[3] M. Ghaedi, A. Shokrollahi, A. H. Kianfar et al., “Preconcentration and separation of trace amount of heavy metal
ions on bis(2-hydroxy acetophenone)ethylendiimine loaded
on activated carbon,” Journal of Hazardous Materials, vol. 162,
no. 2-3, pp. 1408–1414, 2009.
Journal of Analytical Methods in Chemistry
[4] Y. Luo, B. Zhang, M. Chen et al., “Rapid and simultaneous determination of essential minerals and trace elements in human
milk by improved flame atomic absorption spectroscopy
(FAAS) with microwave digestion,” Journal of Agricultural and
Food Chemistry, vol. 58, no. 17, pp. 9396–9400, 2010.
[5] G. A. Zachariadis and A. F. Olympiou, “Use of slurry suspension sample introduction technique in fast multielement analysis of multimineral and multivitamin formulations by inductively coupled plasma atomic emission spectrometry,” Journal
of Pharmaceutical and Biomedical Analysis, vol. 47, no. 3, pp.
541–546, 2008.
[6] G. A. Zachariadis and E. Sahanidou, “Multi-element method
for determination of trace elements in sunscreens by ICPAES,” Journal of Pharmaceutical and Biomedical Analysis, vol.
50, no. 3, pp. 342–348, 2009.
´ E. G. P. Da Silva et al., “Slurry
[7] S. L. C. Ferreira, M. Miro,
sampling-an analytical strategy for the determination of metals and metalloids by spectroanalytical techniques,” Applied
Spectroscopy Reviews, vol. 45, no. 1, pp. 44–62, 2010.
[8] M. C. Yebra-Biurrun and S. Cancela-P´erez, “Continuous approach for ultrasound-assisted acid extraction-minicolumn
preconcentration of chromium and cobalt from seafood samples prior to flame atomic absorption spectrometry,” Analytical Sciences, vol. 23, no. 8, pp. 993–996, 2007.
´
[9] M. C. Yebra-Biurrun and R. M. Cespon-Romero,
“Fast ultrasound-assisted extraction of copper, iron, manganese and zinc
from human hair samples prior to flow injection flame atomic
absorption spectrometric detection,” Analytical and Bioanalytical Chemistry, vol. 388, no. 3, pp. 711–716, 2007.
´ “Automatic deter[10] M. C. Yebra, S. Cancela, and R. M. Cespon,
mination of nickel in foods by flame atomic absorption spectrometry,” Food Chemistry, vol. 108, no. 2, pp. 774–778, 2008.
[11] N. Jalbani, T. G. Kazi, M. K. Jamali et al., “Application of fractional factorial design and doehlert matrix in the optimization
of experimental variables associated with the ultrasonic-assisted acid digestion of chocolate samples for aluminum determination by atomic absorption spectrometry,” Journal of AOAC
International, vol. 90, no. 6, pp. 1682–1688, 2007.
[12] T. G. Kazi, M. K. Jamali, M. B. Arain et al., “Evaluation of
an ultrasonic acid digestion procedure for total heavy metals
determination in environmental and biological samples,”
Journal of Hazardous Materials, vol. 161, no. 2-3, pp. 1391–
1398, 2009.
´
[13] M. C. Yebra, A. Moreno-Cid, S. Cancela, and R. M. Cespon,
“Flow injection AAS determination of zinc in milk powder and
infant formula using continuous ultrasound-assisted dissolution for soluble solid sample preparation,” Atomic Spectroscopy, vol. 24, no. 6, pp. 218–221, 2003.
´ and S. Cancela, “Pre[14] M. C. Yebra, A. Moreno-Cid, R. Cespon,
paration of a soluble solid sample by a continuous ultrasound
assisted dissolution system for the flow-injection atomic absorption spectrometric determination of iron in milk powder
and infant formula,” Talanta, vol. 62, no. 2, pp. 403–406, 2004.
[15] M. C. Yebra, “Flow injection determination of calcium and
magnesium in soluble pharmaceutical tablets by flame atomic
absorption spectrometry using ultrasound for sample preparation,” Atomic Spectroscopy, vol. 32, no. 2, pp. 80–84, 2011.
[16] Association of Official Analytical Chemists, in Official Methods
of Analysis: Lead, Cadmium, Zinc, Copper, and Iron in Foods
Sec. 999.10, AOAC, Arlington, Va, USA, 17th edition, 2002.
5
International Journal of
Medicinal Chemistry
Hindawi Publishing Corporation
http://www.hindawi.com
Volume 2014
Photoenergy
International Journal of
Organic Chemistry
International
Hindawi Publishing Corporation
http://www.hindawi.com
Volume 2014
Hindawi Publishing Corporation
http://www.hindawi.com
Volume 2014
International Journal of
Analytical Chemistry
Hindawi Publishing Corporation
http://www.hindawi.com
Volume 2014
Advances in
Physical Chemistry
Hindawi Publishing Corporation
http://www.hindawi.com
Volume 2014
International Journal of
Carbohydrate
Chemistry
Hindawi Publishing Corporation
http://www.hindawi.com
Journal of
Quantum Chemistry
Hindawi Publishing Corporation
http://www.hindawi.com
Volume 2014
Volume 2014
Submit your manuscripts at
http://www.hindawi.com
Journal of
The Scientific
World Journal
Hindawi Publishing Corporation
http://www.hindawi.com
Journal of
International Journal of
Inorganic Chemistry
Volume 2014
Journal of
Theoretical Chemistry
Hindawi Publishing Corporation
http://www.hindawi.com
Hindawi Publishing Corporation
http://www.hindawi.com
Volume 2014
Spectroscopy
Hindawi Publishing Corporation
http://www.hindawi.com
Analytical Methods
in Chemistry
Volume 2014
Hindawi Publishing Corporation
http://www.hindawi.com
Volume 2014
Chromatography Research International
Hindawi Publishing Corporation
http://www.hindawi.com
Volume 2014
International Journal of
Electrochemistry
Hindawi Publishing Corporation
http://www.hindawi.com
Volume 2014
Journal of
Hindawi Publishing Corporation
http://www.hindawi.com
Volume 2014
Journal of
Catalysts
Hindawi Publishing Corporation
http://www.hindawi.com
Journal of
Applied Chemistry
Hindawi Publishing Corporation
http://www.hindawi.com
Bioinorganic Chemistry
and Applications
Hindawi Publishing Corporation
http://www.hindawi.com
Volume 2014
International Journal of
Chemistry
Volume 2014
Volume 2014
Spectroscopy
Volume 2014
Hindawi Publishing Corporation
http://www.hindawi.com
Volume 2014


© Copyright 2026