
Determination of Heroin and Its Main Metabolites in
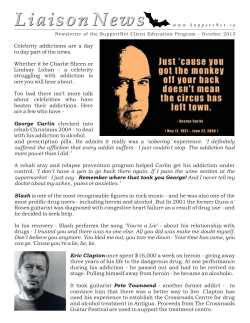
Journal of Analytical Toxicology, Vol. 33, September 2009
Determination of Heroin and Its Main Metabolites in
Small Sample Volumes of Whole Blood and Brain Tissue
by Reversed-Phase Liquid Chromatography–
Tandem Mass Spectrometry
Ritva Karinen*, Jannike Mørch Andersen, Åse Ripel, Inger Hasvold, Anita Braute Hopen, Jørg Mørland,
and Asbjørg S. Christophersen
Division of Forensic Toxicology and Drug Abuse, Norwegian Institute of Public Health, P.O. Box 4404, Nydalen,
0403 Oslo, Norway
Abstract
A high-performance liquid chromatography–tandem mass
spectrometry (LC–MS–MS) method has been developed for the
quantitative analysis of heroin and its major metabolites
6-acetylmorphine, morphine, morphine-3-glucuronide and
morphine-6-glucuronide in blood and brain tissue, using 0.1-mL
samples. We evaluated this method for analysis of heroin and its
metabolites in samples from heroin treated mice. Ice-cold acidic
buffer containing sodium fluoride was immediately added to blood
and brain homogenate samples. Sample preparation was achieved
by protein precipitation on ice-bath, using a mixture of ice-cold
acetonitrile and methanol. The supernatant was evaporated to
dryness, reconstituted with mobile phase, and injected into the
chromatographic system. Separation was performed on a Xterra®
C18 column with gradient elution. The MS analysis was performed
in positive ion mode, and multiple reaction monitoring (MRM) was
used for drug quantification. The limits of quantification for the
different opiates varied from 0.0007 to 0.02 mg/L in blood and
from 0.002 to 0.06 µg/g in brain tissue. Day-to-day relative
standard deviation ranged from 3.1 to 14.5%, and within-day
variation ranged from 2.1 to 11.4%. The recoveries were between
80 and 111%. The stability of heroin was tested, and the study
showed that heroin is more stable in brain tissue than in blood.
Introduction
Heroin is a potent narcotic analgesic with substantial potential for abuse. The half-life of heroin is extremely short [approximately 2–5 min (1)]. The compound is rapidly deacetylated to the specific metabolite 6-acetylmorphine (6-AM) both
spontaneously (2) and by enzymatic hydrolysis and further to
morphine. In humans, morphine is metabolized to morphine3-glucuronide (M3G) and, to a lesser extent, morphine-6glucuronide (M6G) and normorphine (3). In rodents, morphine is preferentially conjugated to M3G (4).
* Author to whom correspondence should be addressed. E-mail: [email protected].
Heroin is known to be unstable in both aqueous and organic
solutions (2). It has been documented that the rate of deacetylation of heroin to 6-AM in aqueous solution is dependent on
pH and temperature, increasing with higher pH and temperature. The breakdown of the drug is significantly inhibited in
aqueous solution at pH 4 and at a temperature of 4°C. 6-AM is
also unstable in aqueous solutions, but its degradation to morphine is limited under acidic conditions (2).
Different techniques such as high-performance liquid chromatography (HPLC) with ultraviolet (UV), diode-array (DAD),
and electrochemical (EC) detection (1,4,5) and gas chromatography with nitrogen-phosphorus detection (GC–NPD),
mass spectrometry (MS), and tandem MS have been used for
analyzing heroin (6–9). LC–MS and LC–MS–MS have been
more commonly used recently for simultaneous analysis of
heroin and its metabolites in a biological matrix because of
their high selectivity and sensitivity (10–12). Many of these
methods include a pretreatment of the samples with liquid–
liquid or solid-phase extraction and/or derivatization, which is
time consuming. In addition, they require relatively large
sample volumes (0.25–2.0 mL), which is a disadvantage when
the sample size is limited, as in experiments using small animals like mice that are often used in research on drugs of
abuse.
The aim of our study was, therefore, to develop a sensitive
LC–MS–MS method for the determination of heroin, 6-AM,
morphine, M3G, and M6G in small samples of blood and brain
tissue from mice combined with a sample treatment procedure
to minimize the degradation of heroin and 6-AM in biological
samples.
Experimental
Chemicals
Methanol (HPLC grade) and acetonitrile (for UV HPLC) were
purchased from LAB-SCAN (Dublin, Ireland). AnalaR® ammo-
Reproduction (photocopying) of editorial content of this journal is prohibited without publisher’s permission.
345
Journal of Analytical Toxicology, Vol. 33, September 2009
methanol, except the solutions for heroin and the morphine
glucuronides, which were prepared in acetonitrile and water,
respectively. All stock solutions were stored at –20°C. Stock solutions for calibration samples and quality control (QC) samples were prepared independently. Working standard solutions
for all compounds, except heroin, were prepared in a 5 mM ammonium formate buffer (pH 3.1). Heroin was prepared separately in the same buffer. Because it was difficult to obtain
sufficient amounts of blank blood from mice without sacrificing a large number of animals, human whole blood was
used to make blood standards. Spiked blood standards and
mice brain tissue homogenate standards were prepared at six
concentration levels (one replicate of each level) from the
working standard solutions at the concentration range shown
in Table I. Stock solutions for the deuterated analytes were prepared in methanol except for the morphine glucuronides,
which were prepared in water. An internal standard working solution of each compound was prepared in water (0.5 µM). QC
and calibration samples were freshly prepared for each analysis.
nium formate was from BDH Laboratory Supplies (Poole, England); heparin sodium was from SIGMA (Sigma-Aldrich
Norway AS, Oslo, Norway); and formic acid and sodium fluoride
(NaF) were from Merck (VWR International AS, Oslo, Norway).
Heroin, M6G, M3G, and 6-AM were supplied by Lipomed
(Lipomed, Cambridge, MA). Morphine was from NMD (NMD
Grossisthandel AS, Oslo, Norway). M6G-d3, M3G-d3 (0.1 mg/mL
in methanol), morphine-d 6 , and 6-AM-d 6 (1 mg/mL in
methanol) were supplied by Cerilliant® (Austin, TX). Deionized
water was obtained from a Milli-Q UF Plus water purification
system (Millipore, Bedford, MA). Human whole blood, used
for the preparation of calibration standards and quality control
samples, was supplied by the blood bank at Ullevål University
Hospital (Oslo, Norway).
Blood and brain tissue samples from mice
The Norwegian Review Committee for the Use of Animal
Subjects approved the experimental protocol of this study.
Each mouse (C59BL/6J-Bom) was given an injection (15
µmol/kg, sc) of heroin dissolved in 0.9% NaCl. The injections
were given in total volumes of 0.1 mL/10 g mouse. Five minutes after injection the mice were CO2 anesthetized. Blood
sampling (500 µL) was performed by heart puncture with a syringe containing 80 µL ice-cold NaF (final concentration 4
mg/mL) dissolved in heparin (100 IE/mL). The blood was transferred to a microcentrifuge tube, and aliquots of 100 µL were
taken out into plastic tubes and diluted (1:1, v/v) in ice-cold
ammonium formate buffer (5 mM, pH 3.1) containing NaF
(final concentration 4 mg/mL). The blood samples were immediately frozen in liquid N2 and stored at –20°C until analysis.
After blood sampling, the brain (except cerebellum) was
quickly removed, washed in ice-cold ammonium formate buffer
containing NaF, blotted on a filter paper, and homogenized
with an Ultra Turrax T8 homogenizer (IKA, Jake and Kunkle,
Germany) in ice-cold ammonium formate buffer (5 mM, pH
3.1) to a final concentration of 0.33 g tissue/mL homogenate.
Thereafter, a 100-µL aliquot of the brain tissue homogenate
was mixed with 100 µL of ice-cold formate buffer in a plastic
tube. Samples were immediately frozen in liquid N2 and stored
at –20°C. The brain homogenate was thawed and frozen once
before analysis to break intact cells.
Preparation of samples
One-hundred microliters of working standard/control solutions was added to an aliquot of 100 µL human whole blood or
mice brain tissue homogenate in a plastic tube. Fifty microliters of the internal standard mixture (0.5 µM in water) was
added to all samples, followed by immediate agitation on a
Multitube vortex mixer. Five-hundred microliters of ice-cold
acetonitrile/methanol (85:15) was added to each tube, followed
by shaking on a Whirlmixer. The tubes were capped and placed
in the deep-freezer at –20°C for a minimum of 10 min, then
centrifuged at 4500 rpm (3900 × g) at 4°C for 10 min. The organic phase was transferred to a glass tube and evaporated to
dryness at 40°C under a gentle stream of nitrogen. The dry
residue was then reconstituted with 100 µL of cold mobile
phase (3% acetonitrile/97% 5 mM ammonium formate buffer
pH 3.1, v/v), centrifuged, and transferred to auto sampler vials.
LC–MS–MS
LC was performed using an integrated system from Waters
with a 2695 Separations Module. Chromatographic separation
was performed at 35°C on a Xterra® MS C18 column (2.1 mm
× 150 mm, 3.5-µm particle size) using gradient elution with a
mobile phase consisting of 5 mM ammonium formate buffer
pH 3.1 (A) and acetonitrile (B). The flow rate was 0.2 mL/min.
Preparation of standard solutions
Stock standard solutions for all compounds were prepared in
Table I. Molecular Weight, LOD, LOQ, Dynamic Range, and Coefficient of Determination (r2) with %CV in Blood
(Human and Mouse) and Brain Tissue Samples
LOD
LOQ
Substance
Molecular
Weight
Blood
(mg/L)
Brain tissue
(µg/g)
M3G
M6G
Morphine
6-AM
Heroin
461.5
461.5
285.3
327.4
369.4
0.0065
0.00060
0.00049
0.00033
0.00096
0.020
0.0018
0.0015
0.0010
0.0029
346
Blood
(mg/L)
0.019
0.0014
0.0012
0.00065
0.0025
Dynamic Range
Brain tissue
(µg/g)
0.059
0.004
0.0036
0.0020
0.0077
Blood
(mg/L)
0.02–11.5
0.002–1.15
0.003–1.43
0.0007–0.16
0.002–0.89
Brain tissue
(µg/g)
Mean r2
(n = 10)
0.07–35.0
0.007–3.5
0.009–4.3
0.002–0.5
0.006–2.7
0.99973
0.99947
0.99949
0.99541
0.99878
%CV
0.03
0.10
0.06
0.05
0.17
Journal of Analytical Toxicology, Vol. 33, September 2009
A gradient was carried out starting from 3% B, increased to
(the same as those used in within-day and between-day varia60% over the next 8 min, and maintained for 2 min, before retion determinations, see Table III) for all compounds.
turning to its initial conditions within 0.1 min and equiliStability study of working solutions and sample extracts
brating for 5.9 min. Total run time was 16 min. Injection
The stability of the working solutions of all compounds at
volume was 10 µL. All compounds were eluted within 12 min.
three concentration levels was tested by analyzing stored soMS detection was performed on a Quattro Premier XE triplelutions against freshly prepared solutions. The stability of
quadrupole MS. Ionization was achieved using electrospray in
sample extracts was examined by reanalysis of some QC samthe positive mode (ESI+) and multiple reaction monitoring
(MRM). The source block temperature was 120°C, and the capples either after storage in the LC autosampler at 10°C for up
illary voltage was 2 kV. The desolvation gas (nitrogen) was
to 14 days or after storage in the freezer at –20°C for up to one
heated to 400°C, and the flow was set to 1097 L/h. The cone gas
month.
(nitrogen) was delivered at a flow rate of 48 L/h, and the colliStability study of heroin in authentic samples from mice
sion gas (argon) pressure was maintained at 2 psi. Data acquiTwenty mice, given heroin sc, were used to examine the stasition, peak integration, and calculation were interfaced to a
bility of heroin in blood and brain tissue homogenate. After
computer workstation running MassLynx 4.0 SCN509 software. The masses monitored, along with
Table II. LC–MS–MS Method
the respective cone voltage, collision energy, and retention times for all analytes,
Rt
MRM 1*
MRM 2
Cone Voltage Collision Energy
are listed in Table II.
Substance
Method validation
Quantitative results were obtained by
integrating the peak height of the specific
MRM chromatogram in reference to the
integrated height of the internal standard.
A second order calibration curve (y = ax2
+ bx + c) was used for quantification because of the wide concentration range
(six-point calibration). Origin was excluded and a weighing factor 1/x was used.
Limits of detection (LOD) and quantification (LOQ) were determined as a mean
of background noise + 3 standard deviations (SD) and + 10 SD, respectively. LOD
was confirmed from blank blood samples,
spiked with decreasing concentrations of
the analytes, where the ion ratio was acceptable (within ± 20% from the mean
ion ratio of standards and controls). The
ion ratio was calculated as the peak height
of the quantification transition divided by
the peak height of the qualifier transition.
Imprecision and inaccuracy of the method
at the LOQ was determined by analyzing
blood samples spiked near LOQ (n = 4,
three replicates).
Within-day and between-day variations
were determined by analysis of spiked
human whole blood and/or brain homogenate samples at three different concentration levels for all compounds. Extraction recovery and matrix effect were
studied using the method developed by
Matuszewski et al. (13). For this study,
four mouse brain homogenates and
mouse blood samples and three human
blood samples, two replicates of each,
were spiked at three concentration levels
(min)
(m/z)
(m/z)
(V)
(eV)
M3G
M6G
Morphine
6-AM
Heroin†
2.7
4.1
4.6
8.1
9.6
462.0 > 286.0
462.0 > 286.0
286.0 > 201.0
328.0 > 211.0
370.0 > 268.0
462.0 > 268.0
462.0 > 268.0
286.0 > 152.0
328.0 > 165.0
370.0 > 165.0
45
45
45
45
50
30/30
30/30
20/40
25/40
30/40
M3G-d3
M6G-d3
Morphine-d6
6-AM-d6
2.7
4.1
4.8
8.1
465.0 > 289.0
465.0 > 289.0
292.0 > 201.0
334.0 > 211.0
50
50
45
45
30
30
25
25
* First transition (MRM 1) was used for quantification.
† 6-AM-d was used for internal standard.
6
Table III. Within-Day Precision (%CV), Between-Day Precision (%CV) and
Bias (%) of the QC Samples (n = 10)
Concentration
Blood
(mg/L)
Brain
tissue
(µg/g)
Within-Day Precision
(%CV)
(Blood)
M3G
0.032
0.32
3.2
0.098
0.98
9.79
2.9
3.3
5.1
10.2
6.1
4.9
6.0
8.8
3.6
M6G
0.0032
0.032
0.32
0.0098
0.098
0.98
3.7
2.4
4.1
7.0
3.8
3.1
4.4
8.2
4.7
Morphine
0.0043
0.043
0.43
0.013
0.13
1.30
5.7
2.1
11.4
5.5
6.1
4.3
1.1
3.0
-0.4
6-AM
0.0010
0.010
0.10
0.0030
0.030
0.30
4.6
4.0
5.9
10.5
14.5
8.9
0.4
–7.1
–15.0
Heroin
0.0052
0.016
0.16
0.016
0.047
0.47
5.7
4.7
10.2
11.3
6.9
12.8
1.9
0.5
8.9
Substance
Between-Day Precision
(%CV)
(Blood and brain tissue)
Bias
(%)
347
Journal of Analytical Toxicology, Vol. 33, September 2009
sampling, the samples were stored at –20°C. Aliquots of 100 µL
were analyzed 3 h, 1 day, and 1 week after the experiment was
performed. Statistical analysis was performed using paired
samples T-test. A value of p < 0.05 was considered statistically
significant.
LC–MS–MS instrument without any further clean-up of the
samples.
HPLC separation and MS–MS methods
A sufficient separation of all the compounds was achieved
within 12 min. Gradient elution ensured a satisfactory separation to allow time-programmed MS detection, that is, detection
Results and Discussion
windows according to the retention time of different compounds.
Sample preparation
LC–MS–MS was carried out using the electrospray ionisation
Sample preparation was achieved by simple precipitation of
technique (ESI) in positive mode and multiple reaction monmacromolecules by addition of ice-cold acetonitrile/methanol
itoring (MRM). The MS–MS detector was programmed to demixture to 100 µL whole blood or brain tissue homogenate.
tect two ion transitions of the compounds within a time frame
The recoveries of all the different compounds were found to
where the compounds were known to elute. For the correbe between 78 and 111% (Table IV, mean of the three consponding deuterated analogues, only one transition was moncentration levels tested). The recoveries of the deuterated initored.
ternal standard analogues were of similar values. The superIn LC–MS–MS time segment 1, the following compounds
natant, after centrifugation, was injected directly into the
were detected: morphine, M3G, and M6G. 6-AM and heroin
were detected in MS–MS time segment 2.
Chromatograms of blank, calibrator, and
Table IV. Recovery (%), Matrix Effect (%), and Corrected Matrix Effect (%) in
an authentic sample are shown in Figure 1.
Blood (Human and Mouse) and Brain Tissue (Mouse)*
Substance
Recovery
(%)
Matrix
Effect
(%)
Corrected
Matrix Effect
(%)
97
102
104
M3G
Brain samples
Blood samples (mice)
Blood samples (human)
93
80
87
99
113
92
M3G-d3
Brain samples
Blood samples (mice)
Blood samples (human)
92
78
84
102
111
88
M6G
Brain samples
Blood samples (mice)
Blood samples (human)
107
88
87
331
424
529
M6G-d3
Brain samples
Blood samples (mice)
Blood samples (human)
107
88
84
334
417
545
Morphine
Brain samples
Blood samples (mice)
Blood samples (human)
87
100
104
108
125
161
Morphine-d6
Brain samples
Blood samples (mice)
Blood samples (human)
101
98
101
84
121
144
6-AM
Brain samples
Blood samples (mice)
Blood samples (human)
111
108
110
105
120
144
6-AM-d6
Brain samples
Blood samples (mice)
Blood samples (human)
112
107
107
105
120
124
Heroin
Brain samples
Blood samples (mice)
Blood samples (human)
106
97
–†
124
124
–†
* Mean calculated from three concentration levels.
† Not carried out.
348
99
102
99
128
103
111
100
101
108
124
105
Validation
A six-point calibration curve was set up
for the concentration ranges listed in Table
I. The calibrations curves were found to be
reproducible in the concentration ranges
listed and with correlation coefficients
greater than 0.995 for all the analytes.
Between-day and within-day precisions
for all compounds were determined at
three concentration levels. The results
from the between-day variation, within-day
precision, and bias are shown in Table III (n
= 10). Day-to-day variations were in the
range 3.1–14.5%, and intraday variations at
the same concentration levels were between 2.1 and 11.4%. The method was
found to be highly reproducible for all compounds.
Whole blood samples from humans and
mice, and brain tissue homogenates from
mice were used for determination of LOD
and LOQ. The imprecision and inaccuracy
at the LOQ was within ± 11.7% from the
nominal value with a %CV within ± 0.3%
for all compounds. There was no significant difference in background noise between human blood, mouse blood, and
brain tissue homogenate samples. LOD,
LOQ, dynamic range, and coefficient of determination (r2) with %CV are shown in
Table I. LOQ for all compounds were found
to be satisfactory for research purposes.
The results from the matrix effect experiment are shown in Table IV. The table
shows that the analytes, except M6G and
M6G-d6, had no or only minor ion en-
Journal of Analytical Toxicology, Vol. 33, September 2009
hancement/suppression. M6G and its deuterated analogue had
very large ion enhancement. When the results were corrected
against their deuterated analogues (response used in calculations) the matrix effects were eliminated. However, some ion
enhancement was observed for morphine and heroin (internal
standard for heroin was 6-AM-d6) in brain samples.
Stability of working solutions and sample extracts
Working solutions were found to be stable for at least three
months when stored at 4°C. No significant difference was
found for any compound in sample extracts after storage in the
auto sampler at 10°C for up to 14 days or after freezing for up
to one month. The results from these studies are not shown.
The 6-AM concentration in spiked heroin standard extracts
was also examined (n = 5). The results are shown in Figure 2.
Blood and brain extracts were found to contain approximately
3–11% and 0.5–9% 6-AM, respectively. Heroin dissolved in
physiological saline, used for injections, was stable for at least
10 h (results not shown).
Measured value (µM)
Figure 1. MRM chromatograms of extracted blank blood sample from human (A), QC sample from human (B), and blood sample from mouse taken 5 min after
injection of heroin (15 µmol/kg, sc) (C).
Theoretical value (µM)
Figure 2. Mean concentration of heroin and 6-AM measured in extracted
standards for brain and blood spiked with heroin (n = 5).
Stability of heroin in authentic samples
The stability of heroin in blood and brain tissue homogenate
samples stored at –20°C from 20 mice injected with heroin is
shown in Figure 3. There was no difference in the heroin concentration in brain tissue homogenates analyzed 3 h, 1 day, and
1 week after sampling, indicating high stability. However, in
blood the heroin concentration fell significantly from the first
measurement at 3 h to day 1 and further from day 1 to 1 week.
Low pH, low temperature and NaF were used to minimize
349
Heroin (µg/g)
Heroin (µg/g)
Journal of Analytical Toxicology, Vol. 33, September 2009
Time
Time
p < 0.05 from first measurement; # p < 0.05 from second measurement
(paired samples T-test)
Figure 3. Concentration of heroin in brain tissue homogenate (n = 20) and blood (n = 19) samples from mice injected with heroin in vivo (15 µmol/kg, sc) and
analyzed after storage at –20°C for 3 h, 1 day, and 1 week. The results are mean + SD.
deacetylation of heroin after sampling. This treatment was not
effective in stabilizing heroin in blood. This result supports an
earlier report of different esterases in the two tissues (1).
Conclusions
A reversed-phase HPLC–MS–MS method with high precision, selectivity, and sensitivity for analysis of heroin and the
major metabolites 6-AM, morphine, M6G, and M3G in small
samples of whole blood and brain tissue homogenate has been
developed and validated. Sample preparation was a simple protein precipitation, which was timesaving. The method was
found to be highly reproducible.
Use of sodium fluoride combined with immediate freezing,
followed by sample preparation at low temperature, and low pH
was found to stabilize heroin in the brain tissue. For blood
samples, this treatment was less effective. We, therefore, recommend that blood samples are extracted as soon as possible
after collection because of the instability of heroin.
Acknowledgments
The authors would like to thank Elisabeth Leere Øiestad for
valuable comments and for critical reading of the manuscript.
References
1. A.Y. Salmon, Z. Goren, Y. Avissar, and H. Soreq. Human erythrocyte but not brain acetylcholinesterase hydrolyses heroin to
morphine. Clin. Exp. Pharmacol. Physiol. 26: 596–600 (1999).
2. D.A. Barrett, A.L. Dyssegaard, and P.N. Shaw. The effect of temperature and pH on the deacetylation of diamorphine in aqueous
solution and in human plasma. J. Pharm. Pharmacol. 44: 606–608
(1992).
3. R.E. Aderjan and G. Skopp. Formation and clearance of active and
inactive metabolites of opiates in humans. Ther. Drug Monit. 20:
561–569 (1998).
350
4. M. Handal, M. Grung, S. Skurtveit, A. Ripel, and J. Mørland.
Pharmacokinetic differences of morphine and morphineglucuronides are reflected in locomotor activity. Pharmacol.
Biochem. Behav. 73: 883–892 (2002).
5. D. Bourquin, T. Lehmann, R. Hämmig, M. Bührer, and R. Brenneisen. High-performance liquid chromatographic monitoring of
intravenously administered diacetylmorphine and morphine and
their metabolites in human plasma. J. Chromatogr. Biomed. Sci.
Appl. 694: 233–238 (1997).
6. B.A. Goldberger, W.D. Darwin, T.M. Grant, A.C. Allen,
Y.H. Caplan, and E.J. Cone. Measurement of heroin and its
metabolites by isotope-dilution electron-impact mass spectrometry. Clin. Chem. 39: 670–675 (1993).
7. J.G. Guillot, M. Lefebvre, and J.P. Weber. Determination of heroin,
6-acetylmorphine, and morphine in biological fluids using their
propionyl derivatives with ion trap GC–MS. J. Anal. Toxicol. 21:
127–133 (1997).
8. P. Kintz, P. Mangin, A.A.J. Lugnier, and A.J. Chaumont. Simultaneous identification and quantification of several opiates and
derivatives by capillary gas chromatography and nitrogen selective detection. Int. J. Legal Med. 103: 57–62 (1989).
9. A. Polettini, A. Groppi, and M. Montagna. Rapid and highly
selective GC/MS/MS detection of heroin and its metabolites in
hair. Forensic Sci. Int. 63: 217–225 (1993).
10. S.G. Phillips and K.R. Allen. Acetylcodeine as a marker of illicit
heroin abuse in oral fluid samples. J. Anal. Toxicol. 30: 370–374
(2006).
11. E.J. Rook, M.J.X. Hillebrand, H. Rosing, J.M. van Ree, and
J.H. Beijnen. The quantitative analysis of heroin, methadone and
their metabolites and the simultaneous detection of cocaine,
acetylcodeine and their metabolites in human plasma by highperformance liquid chromatography coupled with tandem mass
spectrometry. J. Chromatogr. B 824: 213–221 (2005).
12. P. Zuccaro, R. Ricciarello, S. Pichini, R. Pacifici, I. Altieri,
M. Pellegrini, and G. D’Ascenzo. Simultaneous determination of
heroin 6-monoacetylmorphine, morphine, and its glucuronides by
liquid chromatography–atmospheric pressure ionspray-mass spectrometry. J. Anal. Toxicol. 21: 268–277 (1997).
13. B.K. Matuszewski, M.L. Constanzer, and C.M. Chavez-Eng. Strategies for the assessment of matrix effect in quantitative bioanalytical methods based on HPLC–MS/MS. Anal. Chem. 75:
3019–3030 (2003).
Manuscript received December 16, 2008;
revision received May 6, 2009.


© Copyright 2026