
INFLUENCES IN HOME, SCHOOL AND COMMUNITY ENVIRONMENTS
INFLUENCES IN HOME, SCHOOL AND COMMUNITY ENVIRONMENTS ON THE DIETARY BEHAVIOURS OF OVERWEIGHT/OBESE ADOLESCENTS by ALLISON WHITNEY WATTS B.MSc., The University of Western Ontario, 2006 M.Sc., The University of Guelph, 2007 A THESIS SUBMITTED IN PARTIAL FULFILLMENT OF THE REQUIREMENTS FOR THE DEGREE OF DOCTOR OF PHILOSOPHY in THE FACULTY OF GRADUATE AND POSTDOCTORAL STUDIES (Healthcare and Epidemiology) THE UNIVERSITY OF BRITISH COLUMBIA (Vancouver) August 2014 ©Allison Whitney Watts, 2014 Abstract The research presented in this thesis explored relationships between healthful eating and food environments among overweight/obese adolescents. The three aims were to: 1) examine associations between parent and adolescent diets, 2) determine associations between a range of factors in the home food environment and adolescent diets, and 3) explore perceived factors that impede or facilitate healthful eating within home, school and community environments among adolescents. A secondary data analysis of baseline data collected from 176 parent-adolescent (11-16 years old) pairs who presented for an e-health intervention was conducted. Parent and adolescent intake of specific foods (vegetables and fruit (VF), total fat, sugar-sweetened beverages (SSB), desserts/treats, and snacks) was assessed from up to three 24-hour dietary recalls, while demographic and household factors were collected from questionnaires. Analyses examined associations between adolescent diets and the following parent and household factors: parent intake, parent modeling, parenting style, family meal practices, and home food and beverage availability. Upon completion of the intervention, a subset of 22 adolescents took part in a photovoice study to explore perceived barriers and facilitators to healthful eating within the home, school and community settings. Parent intake was positively associated with adolescent intake for all dietary components except for desserts/treats. Both parent modeling of healthful food choices and healthier family meal practices were associated with fewer high fat food items and soft drinks in the home, but neither was directly related to adolescent intake. The availability of less healthful foods at home was related to intake of fat, SSB, desserts/treats and snacks. These findings were further expanded by adolescents’ photographs depicting a struggle with an obesity-promoting ii environment. At home, themes that emerged included family meals, availability, parenting practices, modeling, celebrations, accessibility, and screen use. In the school and community, themes that emerged included availability, peers, convenience, price, school practices, marketing, and online influences. Targeting the home food environment through family-based obesity interventions and minimizing opportunities for less healthful eating in schools and communities may support dietary behaviour change among overweight/obese adolescents. Socio-ecological and systemsbased approaches may help to conceptualize links between the multiple influences on dietary behaviour. iii Preface This thesis is composed of three research studies (Chapters 3 to 5), each of which has been approved by the Behavioural Research Ethics Board at the University of British Columbia (#H08-01638) and the Office of Research Ethics at the University of Waterloo (#16429). The data presented in Chapters 3 and 4 were collected as part of a Canadian Institutes of Health Research funded study (Grant #92369). Chapter 3: Association in Parent-Child Dietary Intake A version of Chapter 3 has been published in the Journal of the Academy of Nutrition and Dietetics: Watts AW, Mâsse LC, Barr SI, Lovato CY, Hanning RM. Parent-child associations in selected food group and nutrient intakes among overweight and obese adolescents. J Acad Nutr Diet, June 17 2014 [epub ahead of print]. For the study described in Chapter 3, I formulated the research question, collected a portion of the data, conducted the statistical analyses, interpreted the results and prepared the manuscript. Dr. Louise C. Mâsse, Dr. Chris Lovato, Dr. Rhona Hanning and Dr. Susan Barr provided guidance in study design and data interpretation, and critically reviewed the manuscript. Chapter 4: Model of the Home Food Environment and Dietary Intake For the study described in Chapter 4, I formulated the research question, collected a portion of the data, conducted the statistical analyses, interpreted the results and prepared the manuscript. Drs. Mâsse, Lovato, Hanning and Barr provided guidance in study design and data interpretation, and critically reviewed the manuscript. Dr. Mâsse also provided guidance on the statistical analyses. iv Chapter 5: Barriers and Facilitators of Healthful Eating At Home, School, and in the Community Explored through Photovoice For the study described in Chapter 5, I formulated the research question, designed the study, collected the data, conducted the qualitative analyses, interpreted the results and prepared the manuscript. Drs. Mâsse, Lovato, Hanning and Barr provided guidance in study design and data interpretation, and critically reviewed the manuscript. Dr. Lovato also participated in data analysis and interpretation by double coding approximately half of the qualitative transcripts collected for this study. Dr. Mâsse also contributed to data analysis and interpretation processes. v Table of Contents Abstract .......................................................................................................................................... ii Preface ........................................................................................................................................... iv Table of Contents ......................................................................................................................... vi List of Tables ..................................................................................................................................x List of Figures ............................................................................................................................... xi List of Photographs ..................................................................................................................... xii Acknowledgements .................................................................................................................... xiv Dedication .....................................................................................................................................xv Chapter 1: Introduction ................................................................................................................1 Chapter 2: Review of the Literature ............................................................................................4 2.1 Obesity in Adolescents and its Health Consequences .................................................... 4 2.2 Dietary Behaviours among Canadian Adolescents ......................................................... 5 2.3 Diets and Obesity ............................................................................................................ 7 2.4 Adolescent Development ................................................................................................ 8 2.5 Environmental Influences on Dietary Behaviour ......................................................... 10 2.5.1 The Home Food Environment .................................................................................. 13 2.5.2 The School and Community Food Environment ...................................................... 20 2.6 Methodological Challenges .......................................................................................... 26 2.7 Summary ....................................................................................................................... 27 2.8 Rationale, Objectives and Hypotheses .......................................................................... 28 Chapter 3: Associations in Parent-Adolescent Dietary Intake ................................................31 3.1 Introduction ................................................................................................................... 31 vi 3.2 Methods......................................................................................................................... 33 3.3 Results ........................................................................................................................... 41 3.4 Discussion ..................................................................................................................... 47 Chapter 4: Model of the Home Food Environment and Dietary Intake ................................53 4.1 Introduction ................................................................................................................... 53 4.2 Methods......................................................................................................................... 56 4.3 Results ........................................................................................................................... 63 4.4 Discussion ..................................................................................................................... 74 Chapter 5: Barriers and Facilitators to Healthful Eating at Home, School and in the Community Explored through Photovoice ................................................................................84 5.1 Introduction ................................................................................................................... 84 5.2 Methods......................................................................................................................... 86 5.3 Results ........................................................................................................................... 97 5.4 Discussion ................................................................................................................... 124 Chapter 6: Conclusions of Thesis .............................................................................................145 6.1 Summary of Thesis Findings Related to the Home Environment .............................. 145 6.2 Strengths ..................................................................................................................... 148 6.3 Limitations .................................................................................................................. 150 6.4 Implications and Directions for Future Research ....................................................... 153 6.4.1 Parents and the Home Environment ....................................................................... 153 6.4.2 School- and Community-based Approaches ........................................................... 157 6.4.3 Multi-Factorial Nature of Influences on Healthy Eating ........................................ 160 6.4.4 Peer Influence ......................................................................................................... 162 vii 6.5 Summary ..................................................................................................................... 164 Bibliography ...............................................................................................................................166 Appendices ..................................................................................................................................193 Appendix A ............................................................................................................................. 193 A.1 MySteps® Consort Chart ........................................................................................ 193 A.2 Goldberg Cut-off Calculations ................................................................................ 194 A.3 Modeling Habits from MySteps® Teen Survey ..................................................... 196 A.4 Home Food Availability Questions from MySteps® Parent Survey ...................... 197 A.5 Authoritative Parenting Scale Items from the MySteps® Parent Survey ............... 198 A.6 Demographic Questions from the MySteps® Parent Survey ................................. 199 A.7 MySteps® Family Practices Survey ....................................................................... 201 Appendix B ............................................................................................................................. 202 B.1 Consent Form .......................................................................................................... 202 B.2 Ethics Handout ........................................................................................................ 208 B.3 Subject Release Form ............................................................................................. 210 B.4 Letter of Explanation .............................................................................................. 211 B.5 Photo Log ................................................................................................................ 212 B.6 Photovoice Interview Guide ................................................................................... 213 B.7 Photograph Release Form ....................................................................................... 215 B.8 Field Notes Form .................................................................................................... 216 B.9 Initial Codebook...................................................................................................... 217 B.10 Final Codebook ....................................................................................................... 222 B.11 Member Check Questionnaire ................................................................................ 229 viii B.12 Supplementary Results Tables ................................................................................ 232 ix List of Tables Table 3-1 Characteristics of 165 adolescent and parent participants ............................................ 42 Table 3-2 Dietary intake as assessed by 24-hour dietary recall of 165 adolescent and parent participants .................................................................................................................................... 43 Table 3-3 Dietary intake by household characteristics of 165 adolescent participants ................ 44 Table 3-4 Associations between parent-adolescent dietary intake of vegetables & fruit, fat, sugar sweetened beverages, desserts/treats and snacks assessed by 24-hour dietary recall of 165 adolescent-parent pairsa ................................................................................................................ 46 Table 4-1 Adolescent and household characteristics .................................................................... 64 Table 4-2 Pair-wise Spearman correlations between dietary outcomes and characteristics of the home food environment ................................................................................................................ 65 Table 4-3 Measurement model of parenting constructs using confirmatory factor analysis ........ 67 Table 4-4 All estimated paths of the structural equation model examining direct effects (n=167) (Model 1) ...................................................................................................................................... 70 Table 4-5 All estimated paths of the structural equation model examining direct and indirect effects (n=167) (Model 2) ............................................................................................................. 73 Table 5-1 Participant characteristics: Comparison of adolescents who agreed to participate in the photovoice study with those who did not agree to participate ...................................................... 98 Table 5-2 Primary and secondary themes identified by 22 adolescents in the home environment and in the school and community environment (in descending order of frequency) .................. 101 x List of Figures Figure 2-1 M. Story et al., Figure 1 An ecological framework depicting the multiple influences on what people eat.11 Retrieved May 4, 2014. Reprinted with permission from Annual Reviews. .. 12 Figure 2-2 Conceptual model illustrating environmental influences within the home, school, and community settings on adolescent dietary intake ......................................................................... 13 Figure 4-1 Proposed model of environmental variables within the home food environment and their association with adolescent dietary intake............................................................................ 55 Figure 4-2 Model 1: Structural equation model of factors within the home environment directly associated with dietary intake of 167 overweight/obese adolescents ........................................... 68 Figure 4-3 Model 2: Structural equation model of statistically significant factors within the home environment associated with home food/beverage availability and dietary intake of 167 overweight/obese adolescents ....................................................................................................... 69 Figure 5-1 Socio-ecological framework of study findings ......................................................... 100 xi List of Photographs Photograph 5-1 “When I cook, I cook with healthy ingredients and end with delicious results” Dan, 17yrs ................................................................................................................................... 102 Photograph 5-2 “Corn dogs, croissants and Michelina’s Alfredo next to watermelon, hummus and coleslaw: It shows less healthy food next to healthy food. It’s representing that if there’s a lot of less healthy food and a lot of healthy food it would make me want to eat the less healthy food.” Rob, 12 yrs ....................................................................................................................... 104 Photograph 5-3 “I usually absent-mindedly wait till the house is empty to eat” Rachel, 15yrs . 106 Photograph 5-4 “My sister eating chocolate- It tempts you to have some too!” Violet, 17yrs .. 107 Photograph 5-5 “It’s hard to eat well when you have holidays mostly devoted to eating” Samantha, 16yrs .......................................................................................................................... 109 Photograph 5-6“These veggies are in our fridge all the time, and are often cut and ready to eat, as well. This makes it easier to eat healthy things at home and for lunches” Lindsay, 13yrs ........ 110 Photograph 5-7 “It is so easy to mindlessly eat in front of the computer” Carrie, 17yrs ........... 112 Photograph 5-8 “There are many vending machines around the school” Emma, 17yrs ............ 113 Photograph 5-9 “It makes me want unhealthy things when I see my friends eating them” Violet, 17yrs ............................................................................................................................................ 115 Photograph 5-10 “It is one of the convenience stores around where I work, I think the Mac’s® makes it harder to eat healthy because there is mostly junk food there” Margot, 17yrs ............ 117 Photograph 5-11 “It’s hard to eat good quality food on a low budget. This $5 will most likely go towards a cheeseburger.” Samantha, 16yrs................................................................................. 118 Photograph 5-12 “It’s cheaper to buy pop than it is water” Emily, 13yrs .................................. 119 xii Photograph 5-13 “Our math teacher likes to give us a lot of candy, and food which sometimes makes it hard to make good choices” Lily, 14yrs ....................................................................... 121 Photograph 5-14 “All the windows [in the school cafeteria] have posters like this, and so people want to go there. None of them show healthy foods, and there is only one salad in the caff [cafeteria]” Lindsay, 13yrs.......................................................................................................... 122 Photograph 5-15 “When we see the McDonald’s sign, we think about the delicious burgers” Suzy, 14yrs .................................................................................................................................. 123 xiii Acknowledgements This thesis could not have been completed without the contributions of many people. First and foremost, I would like to thank my thesis committee members: Dr. Louise Mâsse, for providing unwavering encouragement, guidance and support; Dr. Chris Lovato, whose mentorship, friendship and encouragement inspired me to follow this path; and Drs. Susan Barr and Rhona Hanning, for always being available to answer my questions and providing invaluable feedback and encouragement. I am also thankful for the financial support that I received while completing this thesis. Financial support was provided by the Canadian Institutes of Health Research (CIHR), the Heart and Stroke Foundation of Canada, and the Danone Institute of Canada. Financial support was also provided by a CIHR Training Grant in Population Interventions for Chronic Disease Prevention: A Pan-Canadian Program (Grant#53893). I have many colleagues, friends and family members who supported me in this research. Thank you to my fellow colleagues, Maria, Judith, Daniel, Andrew, Katie and the many others who helped me along the way. And to countless other friends, across the country, who encouraged and supported me throughout this process. To my parents, whose love and support provided me with every opportunity I could imagine. To my aunt, who contributed countless hours, over many years, so that I could produce this thesis. And finally, to Geoff, whose endless energy, dedication and perseverance inspire me each and every day. xiv Dedication To my grandmother, Annie Evelyn Colbert. xv Chapter 1: Introduction The World Health Organization (WHO) calls childhood obesity one of the most serious public health challenges of the 21st century.1 Of Canadian youth, one third of adolescents (12-17 years old) are overweight/obese2 representing a tripling over the last three decades.3 In part, this increase has been attributed to a rise in less healthful eating behaviours.4 Studies show that the consumption of less healthful food and beverages increases among this age group, in particular, the consumption of sugar-sweetened beverages (SSB), fast foods, and snacks.5–8 Despite these trends, adolescence remains an understudied, yet critical time period to intervene in health behaviours that may contribute to obesity, including diets.4 Although the etiology of adolescent obesity is complex and multi-factorial,9 this thesis focuses specifically on dietary behaviours. The socio-ecological model of health behaviour provides an ideal framework for conceptualizing the complex interplay of factors influencing dietary behaviours.10 The socioecological model positions eating behaviour as the result of an individual’s interaction with the social environment (e.g. peer and family influences), physical environment (e.g. what is available to eat and drink), and macro-level environment (e.g. policies and food prices).11 Adolescents spend most of their time at home and at school, and as a result, the home and school environments are thought to play the most important role in determining what adolescents eat and drink.11,12 As more families turn to sources of food outside the home, however, the community environment may have an increasing influence on dietary behaviours.13 In light of this theoretical and empirical evidence suggesting environments are important for shaping health behaviours, it is important to identify specific environmental factors that influence eating behaviours of overweight/obese adolescents. 1 Across studies, authoritative parenting,14 family meals,14 and parent modeling of food choices15,16 have been identified as the most consistent correlates with adolescent diets within the household environment. The school and community environments have been less frequently studied, and as a consequence, factors within these settings are not well understood.16 These findings suggest that the home setting may be of importance for intervening on adolescent diets;14,17,18 yet, we know very little about the importance of the home environment among adolescents who are overweight/obese. Findings also suggest that additional research is needed to elucidate the importance of the school and community environments among overweight/obese adolescents. Family-based programs are the gold-standard in adolescent obesity treatment;19 yet broader factors within the home, school and community that may be acting as barriers to behaviour change are rarely considered. Thus, the purpose of this thesis is to explore environmental factors that may influence dietary behaviours among overweight/obese adolescents. The three studies described in this thesis (presented in Chapters 3-5, respectively) utilized data collected from participants in the MySteps® intervention who were parent-adolescent pairs recruited from the greater Vancouver area in British Columbia (BC), Canada. The MySteps® intervention was an 8-month family-based e-health lifestyle modification intervention for overweight/obese adolescents led by Dr. Louise C. Mâsse. Identifying environmental barriers to healthful dietary behaviours among these adolescents may help to improve the effectiveness of such interventions. The three studies described in this thesis build on one another to gain a more complete picture of what environmental factors may be influencing eating behaviours of overweight/obese adolescents. Study 1 focused on the influence of parent dietary behaviours by examining parent-child associations in dietary intake (Chapter 3). Study 2 expanded to examine 2 additional factors in the home food environment that might influence adolescent dietary intake (Chapter 4). Baseline data collected as part of the MySteps® intervention were analyzed in Study 1 and 2. Study 3 then went on to examine adolescent perceptions of the home food environment and expanded to examine perceptions of factors within school and community environments associated with more healthful food choices (Chapter 5). This qualitative study utilized a subset of adolescents who completed the MySteps® intervention to explore a range of influences across these settings on their food choices. The methods and findings of Studies 1 to 3 are presented and discussed in Chapters 3 to 5, respectively. More detailed conclusions of each study along with overall study conclusions and broader implications for future research are presented in Chapter 6. Together, these three studies aimed to identify environmental factors that impede or facilitate healthful eating among treatment-seeking overweight/obese adolescents to address current gaps in the literature on how best to improve the success of behavioural interventions targeting adolescent obesity. Findings will contribute to understanding dietary choices among overweight/obese adolescents with implications for improving the diets of these youth and obesity treatment programs. Identification of environmental factors influencing diets may also help inform changes to home, school and community environments that may support healthier food choices among wider populations of adolescents. 3 Chapter 2: Review of the Literature This chapter provides a brief review of the literature on adolescent obesity, dietary behaviours and food environments. First, an overview of adolescent obesity, dietary behaviours, and the link between dietary behaviours, obesity and health will be presented with a focus on the Canadian context. Second, an overview of adolescent development and the implications for overweight/obese adolescents is discussed. Third, the conceptual framework used in this thesis, which outlines the environmental factors examined in Studies 1, 2 and 3 (Chapters 3 to 5, respectively) will be described. Finally, the current evidence linking adolescent diets to pertinent factors in home, school and community food environments will be reviewed. 2.1 Obesity in Adolescents and its Health Consequences Worldwide, it is estimated that 150-160 million children (5-17 years old) are overweight/obese.20 The most recent statistics from the 2009-2011 Canadian Health Measures Survey indicate that over 30% of 12-17 year old adolescents are overweight/obese, using WHO cut-points.2 This rate represents a tripling in obesity among Canadian adolescents since 1978.3 Similar rates of overweight (19% vs. 21%) and obesity (11% vs. 10%) have been identified for adolescent boys and girls, respectively.2 This unprecedented level of overweight and obesity has resulted in an increase in the incidence among children and adolescents in Canada of Type 2 diabetes, historically considered an adult-onset disorder.21 In addition, childhood obesity is associated with increased incidence of sleep apnea, metabolic syndrome, and psychological problems.22–24 Examination of a nationally representative sample of American adolescents revealed that overweight/obese adolescents had lower self-reported health, and more functional limitations that negatively impacted depression, self-esteem and social functioning at school.25 4 Two systematic reviews of studies that followed obese children into adulthood suggest that obesity persists into adulthood and is strongest for those who are obese as adolescents.26,27 Furthermore, the long term health impact of childhood overweight/obesity in adulthood has been found to include increased mortality and cardio-metabolic outcomes such as diabetes, hypertension, heart disease and stroke.26 Less consistent evidence also points to a link between obesity and certain forms of cancer such as prostate and breast cancer.26 These long term health impacts also result in a serious economic burden. A recent economic analysis suggests that the increased lifetime medical cost associated with a 10-year-old obese child is $19,000 relative to a normal weight child who remains normal weight into adulthood.28 These serious personal, health, and economic repercussions of childhood obesity demand a collective effort to better support behaviours associated with obesity, such as healthy diets.29 2.2 Dietary Behaviours among Canadian Adolescents A less than optimal dietary quality has been observed among Canadian adolescents.5 Approximately 65% of 9-18 year olds consume fewer than five servings of vegetables and fruit (VF) and 13% consume more than the recommended range of 25% to 35% of energy from fat.5 In addition, one quarter of energy intake of 9-18 year olds comes from naturally occurring or added sugars, with 40% of this energy comprised of foods in the “other” category (e.g. fats/oils, sugar, chocolate, soft drinks).30 Similarly, just over one quarter of energy intake among this age group comes from snacks (i.e. foods consumed outside of meals) that also consist primarily (~40%) of foods in the “other” category.5 Soft drinks were the most commonly consumed item in the “other” category and contributed 14.3% of total sugar intake.30 High levels of soft drink consumption have been reported for both adolescent boys and girls; 53% of boys and 35% of 5 girls consumed non-diet soft drinks in the previous day.6 Furthermore, the after school snacking period contributed 13% of total daily energy intake, of which energy-dense foods such as cookies, SSB (includes soft drinks and other sugar-added beverages such as iced tea, fruit drinks, energy drinks, and lemonade) and sweets made up the greatest proportion.31 As Canadian children get older their dietary quality tends to decline.5,6 As compared to 913 year olds, among 14-18 year olds, consumption of regular soft drinks increased from 152 g to 376 g per day6 and the percentage of boys and girls who exceed the recommended range for energy from fat increased from 11% to 15%.5 The percentage of calories obtained from snacks also increased slightly from 26% to 29% and the percentage of boys and girls reporting fast food consumption on the previous day jumped from 21% to 34% between these two age groups.5 In the United States (US), data also show declines in dietary quality from younger to older age groups7 as do longitudinal studies following children over time.8 In a study examining the transition from elementary to middle-school, young adolescents increased their SSB intake by three-fold and decreased their fruit intake by 41% and vegetable intake by 25%.8 Another study following 15-17 year old adolescents found an increase in fast-food consumption but no change in SSB intake over time.32 Poor dietary quality in adolescence is of concern as dietary practices have long-term health implications, including the development of obesity and its associated comorbidities.26 Independent of obesity, poor dietary quality is a risk factor for heart disease, diabetes, and certain cancers.33 In addition, short-term health implications include weight gain, iron deficiency, eating disorders, under-nutrition, and dental cavities.34,35 Given these health implications, efforts to improve the dietary quality of adolescents are warranted. 6 2.3 Diets and Obesity Changes in dietary behaviour have been implicated as likely contributors to the increase in obesity observed over the last several decades.29 For example, the 15% increase in the average US body weight equates to 300 excess kilocalories per day, the equivalent of just an extra chocolate bar, slice of pizza or large SSB per day.29 Evidence linking particular dietary components to the development of obesity is mixed,36 but several large cohort studies have identified a relationship between dietary components consumed by adolescents and overweight/obesity.37,38 Examination of the cross-sectional relationship between dietary patterns and obesity among 10 year olds across 21 years of the Bogalusa Heart Study revealed that SSB, sweets (desserts, candy), total consumption of low-quality foods, and total food consumed from snacks were positively associated with overweight status.37 A longitudinal study following 5-15 year old youth in the UK revealed that diets characterized by high energy, high fat, and low fibre (of which VF were the primary contributors of the high fiber dietary pattern) were positively associated with overweight/obesity over time.38 There is also evidence that low intake of VF and high intake of fat and other energy-dense low-nutrient foods are associated with increased weight37,39–42 and risk of chronic disease.43 In addition to the types of food consumed, snacking may be an important contributor to weight gain as the number of eating occasions has been implicated as a more biologically plausible driver of the obesity epidemic than the amount consumed at a particular eating occasion.44 Both healthful and less healthful foods and beverages are consumed for snacks,5,45 but data suggest that frequent snacking results in higher daily energy intakes by adolescents.45 Among a nationally representative sample of US adolescents, each additional snacking occasion resulted in a greater mean daily energy intake for boys and girls with a 50% greater intake for those who snacked four or more times per day as compared to 7 those who didn’t snack at all.45 These findings suggest that the energy consumed from snacks may not be compensated during meals.45 Based on this body of research, VF, fat, SSB (e.g. iced tea, fruit punch, slurpees and sports drinks), desserts/treats (e.g. cookies, cake, candy, chocolate, ice cream and chips), and snacks (i.e. number of snacking occasions) seem to be particularly relevant to overweight/obese adolescents and are the focus of this thesis. 2.4 Adolescent Development Adolescent health behaviours, such as diet, should be considered in the context of the literature on adolescent development. Adolescence is a developmental time period characterized by a number of physical, behavioural, cognitive, social, and contextual changes that begin in early (10 to 13 year olds) and middle (14 to 17 year olds) adolescence and continue into late adolescence/emerging adulthood (18 to 25 year olds).46 In early and middle adolescence (the age group of interest in this thesis research), considerable biological and physical changes occur during puberty, including significant weight gain.46,47 Adolescents also experience broad cognitive gains such as increased capacity for complex thought, logical and independent thinking, reasoning, self-reflection, expression of feelings, and a greater ability to think about the future.48 One of the hallmarks of adolescent development is the increase in autonomy, independence and involvement in social relationships.46,49 In conjunction with increased autonomy, adolescents become exposed to new contexts and environmental structures such as entering middle and high school where they take a larger role in choosing their courses, friends, and the activities that they participate in, they may obtain a part-time job, and spend more time with their peers outside the home.49,50 These gains in autonomy and cognitive ability suggest that adolescents have increasing control over their food choices, are exposed to a greater variety of 8 food choices in various environments, and may consider a complex array of factors when making their food choices. Among overweight/obese adolescents, normal social and psychological development may be hampered. Research suggests that body dissatisfaction is lower among overweight/obese adolescents, and in turn, these youth experience lower self-esteem and more depressive symptoms.51 In addition, overweight/obese adolescents with more developmentally appropriate parenting experiences (e.g. higher parent connectedness, parent expectations, and moderate monitoring) have improved self-esteem and depressive symptoms.52 Obesity in adolescence may also affect peer relationships. Research has shown that overweight/obese adolescents are more socially isolated and have fewer friends than normal-weight adolescents;53 however, other studies have found no difference in the number of friends between overweight/obese and normalweight girls at nine years of age.54 Greater social isolation may be caused by decreased involvement in sports and other extra-curricular activities and greater television (TV) watching,53 but also the general societal stigma against obesity that exists in North American culture.23 Together, this research suggests that overweight/obese adolescents experience greater emotional and social challenges than normal weight adolescents in their development, which may alter how these youth make food choices. As a result of the extensive developmental and contextual changes that occur in adolescence, it has been theorized as an important time where decisions that are made affect future development.49,50 For example, adolescence is a period of increased choices, whereby new behaviours are formed and patterns of behaviour can determine trajectories or pathways into adulthood.49,50 For this reason, adolescence may be an important time to intervene on dietary 9 behaviours, with the hope that interventions will promote healthy habits that are maintained into adulthood. 2.5 Environmental Influences on Dietary Behaviour Overweight and obesity is the result of a chronic energy imbalance thought to be driven primarily by increased energy intake and/or decreased energy expenditure.1,55 As such, the majority of treatment efforts have focused on encouraging individuals to eat less and move more.56,57 Despite the fact that genetic predisposition plays a role in the development of obesity,58 a growing body of evidence suggests that the environment is exerting the strongest force in the upward trends in childhood obesity over the past 30 years.9,59,60 Given that the promotion of more healthful diets among youth is already a key component of obesity treatment strategies, shaping the environment to better support healthful eating has great potential as an additional strategy to reduce adolescent obesity. Closer examination of environmental influences on diets among overweight/obese adolescents who are participating in intervention programs may be particularly helpful in supporting behaviour change and, in turn, improving the success of interventions. From a socio-ecological perspective, health behaviours are influenced by the environments in which individuals operate. Bronfenbrenner was the first to propose an ecological model to study child development in light of previous research that had not considered the real-life context in which child behaviours occured.61 This model situates the individual within a series of nested systems, including the micro-system (e.g. family, school, peer group, workplace) and macro-system (e.g. broader political and social structures acting on an individual and on settings) as well as meso-, exo- and chrono-systems that describe the linkages between 10 systems, individuals and time.10 More recently ecological models have been applied to obesityrelated behaviours11,62,63 to address the multiple contextual factors that are thought to influence lifestyle behaviours, including healthful eating. The model proposed by Story et al.,11 depicted in Figure 2-1, identifies the individual factors as well as the physical, social, and macro-level (e.g. economic and political) environments that are important for understanding food choices. Importantly, this model highlights the influence of various environments on dietary behaviours and the importance of understanding how these environments might impact adolescent dietary intake. As depicted in Figure 2-1, characteristics of the individual are at the center and play an important role in determining food choices. The figure also shows that individuals and their choices are embedded within, and interact with, social, physical and macro-level environments. Pertaining to adolescents, the concentric circles represented in Figure 2-1 illustrate that the actions and norms of an adolescent’s social network (e.g. family, friends, and peers), the settings within which these social networks operate (e.g. home, school, community, workplace), and the broad-level policies and systems acting on these settings may contribute to adolescent food choices. 11 Figure 2-1 M. Story et al., Figure 1 An ecological framework depicting the multiple influences on what people eat.11 Retrieved May 4, 2014. Reprinted with permission from Annual Reviews. The model presented in Figure 2-1 was adapted for the research presented in this thesis to focus on home, school and community food environments. Factors within these environments are the most proximal, and perhaps the most influential, in determining adolescent food choices.17,18,64 These include factors within the physical and social environment of the home, school, and community (e.g. what is available to eat or drink, and family and peer influences)16,64 and factors within the macro-level environment of the school and community (e.g. food and beverage prices and marketing). Figure 2-2 summarizes the primary environmental influences that will be the focus of this thesis. 12 Social Environment Physical Environment Macro-level Environment Family (modeling, parenting, meals) Availability Marketing Peers (modeling, norms) Accessibility Price Adolescent Dietary Intake Figure 2-2 Conceptual model illustrating environmental influences within the home, school, and community settings on adolescent dietary intake 2.5.1 The Home Food Environment Research suggests that Canadian and American adolescents consume between 50-60% of their total energy intake while they are at home.5,12 Parents, therefore, play a key role in determining their child’s preferences and can create the social and physical environment in which a substantial proportion of food choices are made.17,65 The following section will review the evidence linking key factors within the social and physical environment of the home found to influence adolescent dietary behaviour (Figure 2-2). Social Environment As depicted in Figure 2-2, several aspects of the social environment can influence healthful eating habits at home, including 1) parent modeling of healthful or less healthful eating habits; 2) parenting styles or practices through which food behaviours are navigated; and 3) 13 family meal patterns that set the tone for eating within the family, which are further described in this section. Parent Modeling As described by Bandura’s Social Cognitive Theory that integrates central elements of Social Learning Theory, health behaviours are influenced through observational learning.66 In terms of developing healthful eating habits, parent modeling of healthful choices (e.g. parent eats and enjoys VF) may promote children’s VF intake by increasing their child’s self-efficacy.67 On this basis, several studies have set out to examine this relationship. Parent modeling of food intake has been identified as an important predictor of child intake16,68,69 and has been identified by families as an important way to improve healthful eating of both children and the whole family.70 A large nationally representative study of US parentchild (2-18 years old) pairs found moderate to weak correlations (r=0.20-0.33) in dietary intake across a range of dietary components including fat, VF, candies, and soft drinks. This study reported a stronger resemblance with mothers, for older children, for non-white Hispanics, and by income and education levels for some dietary components.71 For example, stronger resemblance was reported for: dairy consumption in mother-child pairs; soft drink intake and overall dietary quality in Hispanic and other ethnic families; intake of most dietary components in older children except for VF, dairy, and sugar and candies; and diet soft drink intake in families with a higher socioeconomic status (SES).71 A meta-analysis of 15 studies that examined likeness in parent-child diets reported a mean correlation of 0.20 for fat intake in grams, 0.19 for energy intake from fat, and 0.17 for total energy intake across studies.72 The authors noted that most studies were small; correlations varied broadly across studies (e.g. for 14 energy intake, r = -0.24-0.39); and the strength of associations was greater when studies assessed diets using a 24-hour recall as compared to a food frequency questionnaire, when study quality was rated as higher, and when the study population was from a non-European or non-American country (e.g. Canada, Mexico, Brazil, North Korea, Nigeria).72 In addition to the likeness in parent-child diets, the specific act of parent modeling can be measured as perceived modeling, by asking adolescents directly about the foods that they see their parents eating. In a review of psychosocial correlates of eating behaviours, perceived parent modeling was the most consistent factor associated with child and adolescent diets, greater than parent-reported modeling, with associations found for VF, fat, energy, SSB, sugar, snacks, healthful foods, and less healthful foods.15 Together these findings suggest that parent modeling is not just important for younger children, but may also be important for adolescents. In addition, likeness in diets between parents and their children may differ across sub-groups of parent-child pairs (e.g. age, sex, ethnicity, country).15,16,71,72 Parenting Styles and Practices Additional mechanisms for parent influence on their children’s eating habits include general parenting style and parenting practices.17,73,74 Parenting style is made up of a general set of parent beliefs and actions that create the emotional climate of the parent-child interaction.75 Four parenting styles have been characterized by Baumrind75 according to the degree of responsiveness and demandingness that parents exhibit towards their children. Of the four styles, an authoritative parenting style, characterized as being responsive and demanding without being intrusive and restrictive, has been associated with greater child fruit intake,76,77 lower rates of obesity78,79 and healthier home food environments.80 15 More proximal to feeding behaviours than parenting style, parenting practices include the rules and restrictions that parents place on their children’s eating behaviours.81–83 Parenting practices that restrict or control intake of particular foods have been linked to increased desire and intake of those same foods when they become available.81,84,85 In general, most parenting practices have been studied in samples of younger children.16 The few studies that have been conducted with adolescents have found relationships between food-related parenting practices and food intake,73,86 disordered eating,87 and weight status,88 although findings are mixed. For example, pressure to eat more food, as reported by adolescents, was associated with greater sweet snack consumption among boys but not girls, while praise for eating healthful food, reported by the parent, was positively associated with girls’ consumption of savoury snacks.73 Furthermore, more healthful family rules, such as everyone must eat at the table, were negatively associated with soft drink consumption but not fat, VF, or snack intake; no associations were found with rules that restricted foods.86 Results also suggested that controlling practices are common among parents of adolescents and that lower parent education and income are associated with higher use of these strategies.89 The influence of these strategies is of particular interest among parents of overweight/obese adolescents since this group may be more apt to use them as a means to control their children’s food intake and/or weight. Family Meal Patterns As families become more constrained by time and money, the frequency and quality of meals eaten as a family may decrease (e.g. more meals eaten out or in front of the TV).90 Research conducted with families in Minneapolis/St. Paul found that decreases in the frequency of family meals occurred among girls, middle-school students, Asian youth, and youth from 16 families of lower SES.91 In contrast, the same study found that the frequency of family meals was increasing among families of higher SES. Trends demonstrating decreases in family meals in some groups are of concern as regularly eating meals as a family has been associated with greater adolescent dietary quality92–94 and lower weight,95,96 with effects found to persist into young adulthood.97 The mechanisms that translate family meals into healthier diets are unknown but are thought to be indirect. For example, stronger family connections may lead to healthier overall habits98 and the quality of foods eaten at family meals may be higher (e.g. more freshly prepared foods than in other situations).99 One study that examined the types of foods served at family meals found that three quarters of families regularly included fresh vegetables, one quarter regularly included a green salad, and one quarter ate fast food for the family meal two or more times per week.100 Fast-food purchases for family meals have also been related to other less healthful meal practices (e.g. more soft drinks and less milk and vegetables served at meals) and increased food and beverage intake.93 Other meal practices such as eating meals while watching TV have been studied in the context of child and adolescent diets and weight.73,101–105 Eating meals in front of the TV was unrelated to BMI in studies of 6-12 year olds101 and 8-12 year olds,103 but was related to increased BMI over 3-years in a prospective study of 10-12 year old Australian adolescents.102 Other studies have reported decreased dietary quality among adolescents who watch TV during meals (e.g. fewer VF).104,105 In contrast, another study of Australian adolescents (12-13 years old) found that neither family meals nor formality of meals (e.g. eating in front of the TV) were associated with dietary intakes, but eating take-out for meals was related to poorer dietary quality.73 The lack of association between family meals and dietary intake in that study may be 17 explained by the large number of constructs examined including parent modeling, availability of foods in the home, and parenting styles/practices that may have diminished the effect of some family meal patterns.73 In the Canadian context, high school students who were obese were also more likely to report watching TV while eating and were less likely to eat with a family member than non-obese students.106 These findings suggest that it may be particularly important to study the family meal context of overweight/obese adolescents. Physical Environment (Availability and Accessibility) As depicted in figure 2-2, the physical environment is thought to influence adolescent dietary intake. Specifically, this section will review the extent to which availability and accessibility of specific foods in the home environment influence adolescent dietary intake. Adolescents report that one of the most influential factors in their food choice is what food or beverages are available to eat or drink in their home.107 Cross-sectional,73,108–110 longitudinal111–113 and review114,115 studies have documented an association between home food availability and consumption among children and adolescents. A large proportion of these studies have focused on VF availability and consumption,110,113–119 while others have looked at dairy,110,113,120 fat,118 and other energy-dense foods and drinks.73,111,117,121 Conversely, other studies have found no association between home availability and intake of VF,118 high fat foods,118 and SSB.73 Inconsistencies across and within studies suggest that home food availability contributes to consumption in certain home environments, but may differ depending on the food type or characteristics of the participant (e.g. sex, race/ethnicity). Home environments that provide greater social support for healthful eating, more healthful family meal patterns, are food secure 18 and have higher family-level SES have been associated with greater home VF availability, and in turn, greater adolescent VF intake.119 Moreover, evidence suggests that certain styles of parenting, in combination with access to energy-dense foods, may lead to greater consumption and eventually higher BMI.64,73,93,119 Additionally, home food availability has been associated with intake among some groups of adolescents and not others. For example, adolescent-reported home availability of less healthful foods (e.g. junk food, SSB) was associated with sweet snack consumption among girls only,73 while another study found that parent-reported availability of fruit was associated with intake among white adolescents, but not black adolescents.118 Identification of adolescents whose diets benefit the most from changes in home food availability will help to direct intervention programming. Access to foods is different from availability. Access is not limited to the presence of foods but depends on how easy it is for children and adolescents to obtain them (e.g. fruit from a bowl on the table, cut-up vegetables at eye-level in the refrigerator). Studies have found that access can also be an important influence on diets.109,114 In younger children, it seems that greater accessibility is particularly important when preferences for VF are also low.109 For example, a study of grade 4 to 6 students reported that home availability of VF and 100% VF juice was the only significant predictor of VF and juice intake when taste preferences were high, but that availability and accessibility were predictors of FV and juice intake when taste preferences were low.109 Both availability and accessibility have been studied primarily in the context of younger children’s VF consumption; however, qualitative studies of adolescent food choice suggest that home availability and accessibility of foods are important influences on their eating behaviours.107,122 Overall, the importance of the home food environment on adolescent 19 dietary intake will likely depend on influences outside the home, namely, from school and community environments. 2.5.2 The School and Community Food Environment As adolescents become more autonomous and independent from their parents, the influence of school and community settings, including the influence of peers, becomes increasingly important.18 The growing interest in school and community environments is also the result of evidence that US adolescents consume one third of their daily energy intake while at school.12,123,124 Although intake within the school setting is less clear in the Canadian context, food sources outside the home are likely important. One third of lunch food consumed by grade 5 and 6 elementary students in the province of Prince Edward Island was found to come from school sources125 and Canadian adolescents (9-18 years old) consume up to one quarter of their energy from fast food outlets or other sources away from the home, which likely include sources at school or close to school.5 This section will review the literature linking the school and community food environments with adolescent dietary behaviour. As depicted in Figure 2-2, factors within the social (e.g. peers), physical (e.g. availability and accessibility) and macro-level environment (e.g. price and marketing) will be examined. Social Environment (Peers) Both the influence of individual peers and the pressure to follow group norms are considered hallmarks of adolescent development.126 Adolescents spend a large portion of their time with friends and eating constitutes an important aspect of socialization.4 Despite this, both quantitative and qualitative studies have been unable to demonstrate a consistent relationship between peer influence and dietary behaviours.127–132 The strongest evidence comes from social 20 network analyses that have found associations in relation to fast food, breakfast, whole-grain, dairy and vegetable, but not fruit, intake between adolescents and individuals identified as their friend or best friend.131,132 Other studies have been unable to find associations between adolescent diets and the perception of less healthful food intake 127 or low fat snack purchasing by friends.130 There is also evidence to suggest that overweight/obese youth may be particularly affected by peer dietary practices.133,134 An experimental study demonstrated that only overweight youth were influenced by the presence of peers and that these youth were more likely to consume a healthful snack if a peer did so as well.134 In addition, a social network analysis study found that adolescents with the highest BMIs also had the most similar eating behaviours.133 The growing influence of peers in adolescence as well as the evidence of an association with peer diets, particularly among overweight/obese adolescents, suggests the need for further investigation. Physical Environment (Availability and Accessibility) Of particular interest is the influence of the school food environment during adolescence, as adolescents may be more likely than younger children to purchase foods or beverages while at school135 and to leave the school campus to purchase meals and snacks during the day.136 The availability of energy-dense, nutrient-poor foods and beverages sold in school cafeterias, in school vending machines, and in outlets close to the school has been implicated as a potential influence on poor diets and the current obesity epidemic.12,137–139 Exposure to less healthful foods and beverages at school is also greater among adolescents (e.g. high schools vs. elementary schools).135,140 Among a nationally representative sample of US elementary and high school 21 students, researchers found that almost half of the students consumed low-nutrient, energy-dense foods obtained at school and that greater availability of such foods at school was associated with subsequent consumption.137 Of the limited number of interventions that have improved the quality of foods and beverages offered at school, studies from Canada, the US and Europe have reported a modest impact on fruit,141,142 fat,141,143,144 SSB intake143 and weight outcomes.142,145 In one study, increased availability of low fat choices in high schools resulted in increased sales of low fat foods that was maintained after two years.144 Other studies have demonstrated mixed findings. For example, a study of US schools found that grade 8 students who gained or lost access to competitive foods at school (e.g. junk foods and beverages) did not change their consumption of VF, but did increase SSB consumption among males, minorities, and students living in poverty.146 Evidence suggesting that the types of foods and beverages offered at school will lead to changes in students’ consumption appears promising,144 but may be more beneficial for certain students.146 In addition, less healthful foods accessed from other locations (e.g. brought from home or purchased off school property) will also need to be addressed. Availability and access to less healthful foods in the area surrounding schools is a growing concern.147,148 Research shows that fast-food outlets are clustered near schools, especially in socially deprived areas.149 A recent review on this topic found little evidence of an association between the retail environment surrounding schools and students’ food consumption or purchases, but did find a positive association with body weight.150 In the Canadian context, the density of food retailers near a school was associated with increased lunch time consumption at food outlets,136 but was unexpectedly related to a decreased risk for overweight/obesity and very small socioeconomic gradients were identified.151 Given these conflicting results, further studies, 22 particularly in the Canadian context, are needed to elucidate the role of food environments within and surrounding schools on adolescent diets. Associations between the neighbourhood food environment (e.g. the number of fast food outlets or supermarkets close to home) and food purchasing behaviour,152 food intake,115,153–155 and weight status153,156 have also been reported, although results are often inconsistent. For example, a study of 5-6 and 10-12 year old Australian children found that fewer fast food outlets and convenience stores close to home was associated with greater fruit, fast food and takeaway consumption and that a greater distance from a supermarket was associated with greater vegetable intake.154,155 Among older adolescents, the proximity to restaurants, fast food outlets, convenience stores, grocery stores and retail facilities was found to be associated with adolescent SSB consumption but not total energy or VF intake.153 Another study conducted in three large metropolitan US cities reported no relationship between more or less healthful neighbourhood food outlets and adolescent VF intake.157 In general, a limited number of studies have examined the community food environment and adolescent dietary intake and those that have been conducted report inconsistent findings. The community food environment remains difficult to measure and studies may need to consider a less restrictive definition than the direct area surrounding a home because families may be affected by food choices near other locations where they spend a considerable amount of time (e.g. routes between home and work or home and school, or near where extracurricular activities take place).158–160 Macro-level Environment As depicted in Figure 2-2, broader level influences that occur within the macro-level environment are thought to influence adolescent eating habits. Namely, the price of foods and 23 beverages and their marketing in schools and communities are thought to influence adolescent diets and will be reviewed in this section. Price Adolescents rate cost as the third most important reason for selecting vending machine snacks, behind taste and hunger.130 In the school setting, price reductions on healthful snacks such as fresh VF161 and low fat options162 increased purchasing of these foods in amounts proportional to their price reductions. For example, low fat snack purchases in high schools increased by 9%, 39%, and 93% when prices were reduced by 10%, 25%, and 50%, respectively.162 These results also demonstrate that adolescents are sensitive to food prices.162 In the community, studies of fast-food prices have also found that higher prices result in decreased consumption,163 while other studies have reported no change among elementary students164 or an association among lower income youth only.165 In a nationally-representative study in the US, Powell et al.166 found that lower VF prices, higher fast food prices, and greater supermarket availability were related to higher VF consumption and lower BMI, particularly among adolescents who were overweight or at risk for overweight and of lower SES. The sensitivity to price demonstrated by this age group suggests that the influence of price on adolescent food choice should be pursued as an important area for future research. In addition, the prices of less healthful foods and beverages warrant greater investigation given that price was identified as one of the most effective public health strategies responsible for reducing adolescent smoking rates.167 24 Marketing Globally, the types of foods and beverages marketed to children and adolescents consist overwhelmingly of energy-dense foods that are high in fat, sugar or salt.168–171 By comparison, almost no marketing is done for VF, whole grains or milk.168–171 A WHO investigation of marketing to children worldwide showed that in addition to high levels of less healthful food marketing, children have high levels of food marketing awareness168 resulting in increased consumption of marketed foods.168,172 There is also evidence that food and beverage advertising targeting children is on the decline, but that advertising targeting adolescents has increased.173 Between 2003 and 2007, exposure to TV food advertisements in the US, assessed by Nielsen Media ratings, increased by 4% among 12-17 year old adolescents, with fast food advertisements increasing by 20% and sweets and beverage advertisements falling by 12% and 30%, respectively.173 In the 2003-2004 school year, over half of US public schools participated in some form of marketing partnership with companies that sold foods high in fat and sugar and low in nutritional value.174 In Canada, limited data are available; however, a survey conducted by the Canadian Centre for Policy Alternatives and the Canadian Teachers’ Federation found that 32% of schools reported the presence of food advertising and that advertising was as high as 55% among high schools.175 Research conducted in Alberta high schools suggests that about half of students see brand logos for snack or beverage items while they are at school, primarily through vending machines selling and advertising these products.176 Little is known about the extent or effects of food marketing in Canadian schools or communities, and in general, further studies are needed to develop a better understanding of the importance of food advertisements in shaping adolescent food choices. 25 2.6 Methodological Challenges The previous section of this chapter summarized the current evidence linking adolescent diets to pertinent factors in home, school and community food environments. In general, the literature suggests that associations between many environmental factors and adolescent dietary behaviours are inconsistent across studies. In part, methodological weaknesses of previous studies may explain some of these inconsistencies. First, most studies rely on cross-sectional data. Although much more feasible than longitudinal or experimental studies, cross-sectional analyses provide no evidence of causation, making it difficult to assess if an environmental factor leads to certain dietary behaviours or if these are merely co-occurring states that may be related to some other third factor. Despite this, cross-sectional studies do provide valuable insight on potential causal relationships that need to be further examined in longitudinal or experimental study designs. Qualitative studies can also provide useful and novel information about potential mechanisms that may explain how environmental factors influence behaviour. Second, the assessment of diets often relies on surveys (e.g. food frequency questionnaire) that collect information about what foods/beverages were consumed in the previous week, month or year.177 These surveys can introduce error because it is difficult for individuals to accurately recall the types and amounts of foods they have eaten over a long period of time.177 Less time-intensive than detailed food records, 24-hour dietary recalls help to reduce recall error by guiding individuals to remember every food/beverage they consumed on specific previous day(s).177 This method is prone to error because of day-to-day variation in diets, but collecting multiple days of dietary intake helps to reduce this error.177 In addition, 24hour dietary recalls may provide a more sensitive measure of diet to compare with environmental exposures that are also measured during the same time frame. 26 Third, many studies focus on single factors or constructs in isolation, without consideration of how combinations of factors might contribute to dietary choices. This has been identified as a key challenge in a review of food-related parenting practices, as these practices occur within complex home food environments and are influenced by factors outside the home.83 In addition, analyses do not always control for appropriate confounding variables or test the effects of moderating variables which are needed to fully understand the interplay of influences on dietary behaviours.83,178 Fourth, many studies do not assess the psychometric properties of measures used to assess environmental factors within their own study sample. A recent review of youth physical activity parenting practices found that only three studies (7%) reported on psychometric properties obtained from the study sample. Instead, they referenced previous studies using the measure.179 Poor measurement of environmental variables may explain null or inconsistent associations in some studies. Reliability and validity of study measures, which are based on testing within the study sample, are required to appropriately evaluate study results.179 Lastly, aspects of the environment may influence dietary intake among some adolescents and not others; therefore, there is a need to identify for whom these environmental characteristics are most important. The studies presented in this thesis help to address some of these challenges. 2.7 Summary Adolescents divide their time among multiple environments. A large proportion of their food and beverage consumption occurs at home, at school, and in the community suggesting that these three environments may influence food choices.5,12 The home environment most likely plays a pivotal role in shaping children’s health behaviours including diets, but the extent to 27 which it continues to shape adolescent health behaviours is less clear. There may also be synergistic effects on adolescent diets among factors across these settings. For example, a recent examination of the interaction between an adolescent’s family and community food environment suggests that when both settings are supportive of healthful eating (e.g. greater number of family meals combined with lower density of fast food outlets near the home) adolescents consume more VF and have a healthier BMI.180 Obesity treatment programs targeting adolescents have only been modestly successful at teaching skills and strategies to promote healthful eating, in part, because they fail to address the social, physical and macro-level environments that may impede an adolescent’s ability to carry out desired behaviours.181,182 A closer examination of these environmental factors among overweight/obese adolescents who are participating in obesity treatment programs may be particularly helpful in improving the success of these interventions and helping teens to lead healthier lives. 2.8 Rationale, Objectives and Hypotheses Little is known about the environmental factors within home, school and community settings that influence diets among treatment-seeking overweight/obese adolescents. Despite the growing body of evidence that suggests the home environment is an important target for obesitypromoting behaviours in youth, including dietary behaviour,19,183 it remains unknown which aspects are most important and what role the school and community environments play. The overall purpose of the three research studies presented in this thesis was to address these gaps, with a primary focus on examining environmental factors within the home setting and a secondary focus on exploring environmental factors outside the home (e.g. school and 28 community setting). Studies 1 to 3 are presented sequentially in Chapters 3 to 5 of this thesis. The aim of each study is summarized here: Study 1: Associations in Parent-Adolescent Dietary Intake. The aim of this study was to determine the association between parent-child dietary intake among overweight/obese adolescents. H1: It was hypothesized that there would be a positive association between parent and adolescent intake of five dietary components (VF, total fat, SSB, desserts/ treats, and snacks). In addition, it was hypothesized that parent-adolescent associations would be greater among adolescents who were of younger age, female and from a family with a lower household income and educational attainment. Study 2: Model of the Home Food Environment and Adolescent Dietary Intake. The aim of this study was to investigate associations between the social environment (modeling, parenting style, and meal practices) and the physical environment (availability of less healthful foods and beverages) of the home setting, and intake of five dietary components (VF, total fat, SSB, desserts/ treats, and snacks) among overweight/obese adolescents. H2a: It was hypothesized that reduced availability of less healthful foods and beverages in the home (e.g. parents were asked if they had selected high fat foods or soft drinks in their home), parent modeling of healthful choices, a more authoritative parenting style, and more healthful family meal practices would be associated with more healthful dietary habits (e.g. more VF, less fat, and fewer SSB, desserts/treats and snacks). H2b: It was also hypothesized that an authoritative parenting style, parent modeling of healthful choices, and more healthful family meal practices would indirectly influence adolescents’ healthful dietary habits through availability of less healthful foods and beverages in the home. 29 Study 3: Barriers and Facilitators to Healthful Eating at Home, School, and in the Community Explored through Photovoice. The aim of this study was to explore perceptions among overweight/obese adolescents of factors within home, school, and community environments that influence more healthful food choices. Given the qualitative nature of this aim, no specific a-priori hypotheses are listed; however, it was anticipated that factors corresponding to the socio-ecological framework would influence food choices (e.g. physical, social and macro-level factors that make up the home, school and community food environments). These three studies will help to address current gaps in the literature on how to improve the success of behavioural interventions that address adolescent obesity. There is a need to identify environmental factors that impede or facilitate healthier dietary behaviours among overweight/obese adolescents in order to support healthful lifestyles in this population that may, in turn, prevent future chronic disease risk.26 Furthermore, identifying environmental factors that influence food choices has the potential to inform changes to home, school and community environments that may support healthier food choices among wider populations and lead to more adolescents achieving healthy weights. 30 Chapter 3: Associations in Parent-Adolescent Dietary Intake This chapter presents the findings of Study 1, a cross-sectional analysis that examined associations between select dietary components and nutrients among overweight/obese adolescents and one of their parents. Since parents are likely the closest relational figures to adolescents, similarities in their diets were examined. This chapter includes a brief introduction to better situate the specific aims of this study with the current literature, followed by a detailed description of the study methods and results. Finally, a discussion of the results and brief conclusions are presented. More detailed conclusions and study implications as they relate to the entire thesis are presented in Chapter 6. 3.1 Introduction Promoting more healthful diets among children is a key component of obesity prevention and treatment strategies. In both Canada and the US, adolescents do not meet recommendations for VF intake and consume too many of their calories from fats and sugars, particularly from snacking between meals.5,184–186 Several studies, including population-based samples, experimental and systematic reviews, have reported comparable diets (i.e. in terms of macronutrient and food group breakdown) between obese and non-obese adolescents particularly for less healthful foods and beverages.187–189 Given the less than optimal quality of adolescent diets, and the wide-spread prevalence of childhood obesity, a greater understanding of the factors that influence dietary behaviour is needed. Parents can shape the dietary behaviours of their children through the modeling of healthful or less healthful eating habits.17,65 As described by Social Learning Theory, important relational figures (e.g. a parent to child) can influence behaviour through observational 31 learning.66 As described in Social Cognitive Theory, successful modeling (e.g. parent eating and enjoying VF) serves to increase the self-efficacy of the observer in carrying out the desired behaviour (e.g. child consuming VF).67 Previous studies have identified parent modeling of food intake as an important predictor of child intake.16,68,69 Although adolescence is a time of growing autonomy, greater than 60% of energy consumed by adolescents still comes from the home, suggesting that parents have an opportunity to shape adolescent dietary behaviours.13 A nationally representative sample of 1500 US parent-child (2-18 years old) pairs found correlations in dietary intakes ranging from 0.20 to 0.33. Stronger resemblance in intakes for several dietary components were present for mothers, for older children, for non-white Hispanics, and among families with higher income and education levels.71A meta-analysis of 15 studies reported similar moderate to weak associations between parent-child dietary intake.72 The strength of these associations depended on methodology, nutrient or food group assessed, sex of parent-child pair, age of child, and population group studied.72 Variation across participant characteristics suggests that studies should consider parent-child dietary resemblance within different sub-groups. For those sub-groups with a stronger resemblance in parent-child diet, interventions targeting parents may prove more fruitful for promoting child/adolescent diet. Few studies have compared parent-child dietary intake among families with adolescents who are overweight/obese. One study by Raynor et al. found that among overweight/obese children (4-9 years old), parent-child intake was positively related for most food items (r=0.22-0.45), except SSB.190 With one third of adolescents in the US and in Canada overweight/obese,2,191 a greater understanding of how parents influence adolescent dietary behaviour among this group is timely. Furthermore, since overweight/obese adolescents are at a greater risk for developing chronic diseases later in life,26 studying the factors related to more or less healthful diets in this 32 population may contribute to understanding and reducing the overall population chronic disease burden. The aim of the present study was to examine the relationships between parent and adolescent intake of VF, total fat, desserts/treats, SSB, and snacks among overweight/obese adolescents. It was hypothesized that parents and adolescents would have similar diets. Based on findings from previous studies, differences in association by age, sex, income and education levels were also examined. 3.2 Methods Participants Baseline data collected from 165 parent and adolescent participants of the MySteps® intervention were used for this cross-sectional study. Families were recruited primarily by newspaper advertisements (62%), but also by other advertisements such as Facebook, Craigslist, and a parenting magazine (5%), by contacting former patients of the Endocrine and Diabetes Clinic at BC Children’s Hospital (13%) or the Centre for Healthful Weights program in BC (16%), or by other means (e.g. referral by other participants) (4%). Eligible participants were adolescents who were 11-16 years old and had Body Mass Index (BMI) z-scores greater than one standard deviation above the mean, according to the WHO age-and-sex matched growth charts.192 Participants also had to reside in the Greater Vancouver Area, read at the grade 6 level, speak English, and not be planning to move within the study period. In the main intervention study, 10 year olds were excluded because they did not meet the reading level and 17 year olds were excluded because they could begin college/university during the intervention and move away from home. Participants were also excluded because of comorbidities requiring medical 33 attention or that made physical activity too difficult, use of medications that can affect body weight, diagnosis of Type 1 diabetes, or participation in another weight-loss program. The participating parent also had to be a primary caregiver of the adolescent. The 8-month, web intervention targeted nutrition, physical activity, and sedentary behaviours and the main components of the intervention included: weekly login to the website to receive a weekly lesson; development of skills at the individual and familial level including goal setting, self-monitoring, and problem solving; tailored feedback; information and resources to help guide behaviour change; and interaction with health counsellors by weekly emails and monthly telephone counselling. In addition to the web intervention, participants completed four in-person study visits where anthropometric measurements and survey data were collected. In light of evidence suggesting that adherence is one of the main barriers to intervention efficacy,193 the purpose of the MySteps® study was to examine a wide range of factors related to intervention adherence. Of the 183 parent-child pairs assessed at the baseline visit, seven adolescents did not meet eligibility criteria (i.e., BMI or reading level), leaving 176 eligible families. The CONSORT diagram depicting participant flow through the intervention is included in Appendix A1. In addition, six families had either only child or parent dietary data and five parents did not provide complete socio-demographic information resulting in 165 parent-child pairs for the present study. Procedures At the baseline study visit, a trained staff member collected anthropometric measurements, administered questionnaires and instructed participants to complete a computerbased 24-hour dietary recall. Participants were asked to complete two more 24-hour dietary 34 recalls from home over the following week, including one weekend day. Participants were not assigned particular dates to complete their recalls, which may have inadvertently introduced bias if they selected healthier or easier reporting days. Anthropometric measurements included weight and height. Individuals were measured twice without their shoes and excess clothing using a stadiometer (Hohltain, United Kingdom) and calibrated scale (model 597K, Health-O-Meter, McCook, IL). If the two measurements were not within 0.5 cm for height or 0.7 kg for weight, both measurements were repeated. Parents and adolescents were each given a $20 cash incentive for participation. Measures BMI Parent and adolescent BMI was calculated from the average of two measurements for height (measured to the nearest 0.1 cm) and weight (measured to the nearest 0.1 kg) using the formula kg/m2. BMI z-scores were derived from a STATA macro developed by the WHO for children and adolescents (5-19 years old).194 The WHO calculated these z-scores by merging data from the 1977 WHO growth reference with data from the 2006 WHO under-five child growth standards using a smoothing technique.195 The 2006 WHO child growth standards are based on longitudinal data collected from children under five years of age in six countries under ideal growth conditions (e.g. breastfed, non-smoking mothers).195 The WHO growth standards produce much higher z-scores than growth charts from the Centers for Disease Control, which are based on a population sample of American children who are heavier by comparison.196 The WHO growth curves are those recommended for use in Canadian children and adolescents.197 For descriptive purposes in the present study, the following cut-points were used for adolescents: 35 >1 standard deviation (SD) = overweight; >2 SD = obese.192 WHO established cut-points were used for adults: <18.5=underweight, 18.5- 24.9=normal weight, 25-29.9=overweight, and >=30=obese.198 Demographic Characteristics Parents completed a set of five demographic questions adapted from the Canadian Community Health Survey199 assessing: cultural or ethnic background, parent education, household income, marital status, and number of children in the household. Details are summarized below: 1) Parent Ethnicity - Participants were asked to identify which cultural or racial background applied to them from a list of 13 options, including “other”. Responses were grouped into five categories: 1) White; 2) East or Southeast Asian; 3) South Asian; 4) Aboriginal; and 5) Other. The Other category included parents who reported their ethnicity to be Latin American, Black, Arab, West Asian, mixed, or other. 2) Parent Education - Participants were asked to provide the highest degree, certificate, or diploma they had obtained and responses were grouped into three categories: 1) Less than or equal to high school education; 2) Trade certificate, diploma, non-university certificate, or university certificate below a bachelor level; and 3) University degree or higher. 3) Household Income - Participants were asked, “What is your best estimate of the total income, before taxes and deductions, of all household members from all sources in the past 12 months?” Responses to thirteen income groups were collapsed into 4 categories: 1) Less than or equal to $40,000; 2) $40,001-$80,000; 3) $80,001-$120,000; and 4) $120,000 or greater. 36 4) Parent Marital Status - Participants were asked “What is your marital status?” and responses were grouped into two categories: 1) Married or living common-law; and 2) Single, widowed, separated or divorced. 5) Number of Children in Household - Participants identified the number of children 17 years old and younger who were living in their household at the time of the study (0-6 or more). Dietary Intake The 24-hour dietary recall program used in the present study was developed at the University of Waterloo and validated on grade 6 to 8 students (approximately 11-14 years old).200 The program employed a multiple pass technique where participants have three opportunities to review their food intake from the previous day. Participants were asked to report all the foods and beverages that they consumed the previous day at the following meal and snack times: breakfast, morning snack, lunch, afternoon snack, dinner, and evening snack. Participants were also instructed to select items from a list of over 900 brand or generic food items and, if necessary, substitute foods not found with similar items. Based on user comments at the end of the survey, it is estimated that 20% of dietary recalls had at least one food item that was replaced by a similar item. These substitutions may have introduced some bias into the results. Photographs depicting measured portion sizes were used to help participants estimate the amount of food or beverage they had consumed. A final summary screen allowed the participants to confirm or delete their selections for each meal. This tool was validated against a dietitianadministered dietary recall in an ethnically diverse sample with an intraclass correlation of 0.56 for total energy intake.200 The web-based tool underestimated total energy (-10.5%) and carbohydrate (-15.6%) intakes (p<0.05). Under-estimation of rice and pasta portions on the web 37 accounted for 50% of this discrepancy; therefore, adjustments to the tool were made for the portion sizes of rice and pasta. Dietary data were downloaded from the web survey and processed with The Food Processor software package (version 8.0, ESHA Research, Salem, OR, 2002) that uses the 2007 Canadian Nutrient file data (http://www.hc-sc.gc.ca/fnan/nutrition/fiche-nutri-data/index-eng.php) to calculate nutrient and Canadian food group estimates. The present study focused on five components of dietary quality because of their potential relevance to childhood obesity and chronic disease:37,42 servings of VF; percentage energy from total fat; percentage energy from SSB; percentage energy from desserts/treats; and percentage energy from snacking occasions (Snacks). SSB included regular soft drinks and sugar drinks (e.g. iced tea, fruit punch, slurpees and sports drinks). Diet drinks and 100% fruit juice were not included. Desserts/treats included food items commonly consumed for dessert or as a treat (e.g. cookies, cake, candy, chocolate, ice cream and chips), which are typically energy dense yet nutrient poor. Food and beverage items consumed during a snack time (morning, afternoon or evening snack) were combined to calculate the percentage of energy consumed from snacks, which has been associated with overweight status in previous studies.37,44 To estimate intake per day for each parent and adolescent, values were averaged across the number of dietary recalls completed (one, two or three days). Analysis Percentages, means and standard deviations were calculated for parent and adolescent dietary intake variables and demographic characteristics. T-tests, Wilcoxon signed-rank tests, and Wilcoxon rank-sum tests were conducted to examine significant differences in adolescent 38 mean intake by sex and compared to parent mean intake. One-way analysis of variance (ANOVA), Scheffe’s tests, and Kruskal-Wallis tests were conducted to examine differences in adolescent mean intake across household demographic characteristics. Multivariable regressions were used to examine associations between parent and adolescent intake of the five dietary components. Linear regression was used to model the continuous outcome variables: servings of VF, percentage energy from fat, and percentage energy from snacks. Assumptions for multiple linear regression were assessed by plotting the residuals against the fitted values and generating a normal quantile-quantile (Q-Q) plot.201 These plots suggested that the residuals had a constant variance and that they were approximately normally distributed. Negative binomial regression was used to model the percentage energy from SSB and percentage energy from desserts/treats because these variables were over dispersed due to many valid zero responses. Negative binomial models are used to model over dispersed count outcome variables.202 Poisson models can also be used to model count data, but require that the mean and the variance are equal.202 To test this assumption, a Poisson model was fitted and the chi-square statistic was found to be statistically significant confirming overdispersion and indicating that a negative binomial model would better fit the data.202,203 This method of estimation is preferred over collapsing data into a dichotomous variable and conducting logistic regression because it preserves variation and power to detect significant differences.203 Dietary variables not expressed as a percentage of energy were adjusted for total energy intake in regression models. All five models included the following covariates: adolescent age, sex and BMI z-score; and parent age, sex, BMI (continuous), parent education and household income. Correlations and univariate associations were first examined and then all covariates were added to the model. Five 39 interaction terms were examined to address the hypothesis that the relationship between parentchild dietary intake might differ by SES (education and income), parent sex, child sex or child age.72 Only statistically significant interactions were kept in the final model. Beta coefficients and standard errors, and relative risks and 95% confidence intervals (CI) are reported for linear and negative binomial regression models, respectively. Statistical significance was determined as a p-value<0.05. Analyses were conducted using STATA v.11, College Station, TX: StataCorp LP. Sensitivity Analysis To determine if the number of recall days completed would impact the results, a sensitivity analysis was conducted with participants who provided two (n=48) or three (n=79) days of dietary information (eliminating those who only provided one day (n=38)). Effect sizes were unchanged for all models except for desserts/treats. Results remained similar and nonsignificant when the number of recalls was entered as a variable in the final model for desserts/treats; therefore, participants with at least one day of valid dietary recall data were included in the final analyses. In addition, eliminating 100% fruit juice from the VF category was examined to determine if it would impact the results. This was done because100% fruit juice accounted for 30% of adolescent reported servings of VF and is higher in sugar and lower in fiber than whole fruits. The models with and without 100% fruit juice did not differ; therefore, the combined variable was used in this analysis. Additional models for each dietary outcome were also run to determine if parents and adolescents with a corresponding weight status had more similar diets. When both parents and adolescents were overweight/obese, as compared to 40 when only the parent was normal weight (i.e. discordant weight status between parent and adolescent), the significance and magnitude of the relationships were unchanged. 3.3 Results Demographic and household characteristics for the analytic sample are presented in Table 3-1. Adolescents had a mean age of 13 years and were equally split by sex, whereas most of the participating parents were female (84%). Based on previously described cut-points, 18% of adolescents were classified as overweight and 82% were obese, while 26% of parents were classified as normal weight, 31% as overweight and 43% as obese. This means that in 74% of families both parent and child were overweight/obese. Families in our sample ranged in educational attainment, household income, ethnicity, marital status and number of children in the household. 41 Table 3-1 Characteristics of 165 adolescent and parent participants Adolescent Characteristics Age BMI z-score Weight (kg) Height (m) Parent Characteristics Age BMI Female Sex Parent Education High school diploma or less Trade/College certificate University degree or higher Household Income <=$40,000 $40,001-$80,000 $80,001-$120,000 >$120,000 Parent Ethnicity White East/Southeast Asian South Asian Aboriginal Other Parent Marital Status Married/Common-Law Single/Divorced/Widowed Children in Family 1 2 3+ Girls (n=88) Boys (n=77) Mean ± SD 13.5 ± 1.9 12.8 ± 1.6 2.6 ± 0.8 2.82 ± 0.9 81.9 ± 20.0 84.6 ± 25.2 1.65 ± 0.12 1.65 ± 0.12 Mean ± SD/ n (%) 45.8 ± 6.3 30.2 ± 7.4 139 (84.2) 28 (17.0) 68 (41.2) 69 (41.8) 33 (20.0) 54 (32.7) 44 (26.7) 34 (20.6) 77 (46.7) 24 (14.6) 22 (13.3) 14 (8.5) 28 (16.9) 119 (72.1) 46 (27.9) 65 (39.4) 75 (45.5) 25 (15.1) SD, standard deviation; BMI, body mass index Dietary Intake Adolescents consumed significantly fewer VF and a lower percentage of energy from total fat and from snacks, but consumed a higher percentage energy from SSB than parents. Girls consumed significantly less energy than boys, but consumed a greater percentage of energy from snacks (Table 3-2). Fewer than 10% of parents and adolescents consumed seven servings of VF 42 per day, the minimum number of servings based on Canadian recommendations.204 The most recent US recommendations are nine or more servings per day based on a 2,000 calorie diet.205 Even fewer met Canadian or US guidelines when 100% fruit juice was not included. About 40% of parents and adolescents were consuming more than 35% energy from total fat, the end of the range of Canadian and US nutrition guidelines.57 Table 3-2 Dietary intake as assessed by 24-hour dietary recall of 165 adolescent and parent participants 1815±575 Adolescent Girls (n=88) 1706±512b Boys (n=77) 1939±620 1801±555 3.4±1.9a 9 (5.5) 3.3±1.9 4 (4.6) 3.5±2.0 5 (6.5) 3.8±2.0 10 (6.0) 2.7±1.7 a 4 (2.4) 2.6±1.8 3 (3.4) 2.7±1.7 1 (0.6) 3.5±1.9 6 (3.6) 32.7±8.1a 100 (60.6) 32.7±7.8 55(62.5) 32.6±8.5 45 (58.4) 34.7±7.5 85 (51.5) 3.8±5.6a 4.3±5.9 3.3±5.3 2.0±3.9 5.8±6.3 17.4±11.5a 7.2±6.9b 19.1±12.7b 4.2±4.9 15.5±9.7 6.8±8.0 19.8±13.2 All Energy (kcal ), mean ±SD Vegetables and fruit servings/d, mean ±SD ≥7 servings/d, n (%) Vegetables and fruit without juice Servings/d, mean ±SD ≥7 servings/d, n (%) Fat %kcal/d, mean ±SD ≤ 35%/d, n (%) Sugar-sweetened beverages % kcal/d, mean ±SD Desserts/Treats % kcal/d, mean ±SD Snacks, % kcal/d, mean ±SD Parent SD, standard deviation a Significantly different from parent intake, t-test or Wilcoxon signed-rank test (p<0.05); bsignificantly different from intake of boys, t-test or Wilcoxon rank-sum test (p<0.05) Table 3-3 presents differences in adolescents’ dietary intake by household characteristics. Adolescents with a parent who had a lower educational attainment (≤high school) consumed a greater percentage of energy from fat as compared to those with a parent who had a higher educational attainment (≥university degree). Adolescents with the lowest household incomes 43 (≤$40,000) had lower percentage of energy from fat than those in the next income bracket ($40,001-$80,000). In terms of ethnic differences, adolescents with an East/Southeast Asian background consumed fewer servings of VF than those with an Aboriginal background. Finally, adolescents in single parent households (parent identifies as single, divorced or widowed) consumed a greater number of servings of VF compared to those in two-parent households (parent identifies as married or common-law). Table 3-3 Dietary intake by household characteristics of 165 adolescent participants VF Fat SSB Desserts/ Treats Snacks Mean (SD) Parent Education ≤ High school Trade/College certificate ≥University degree Household Income <=$40,000 $40,001-$80,000 $80,001-$120,000 >$120,000 Parent Ethnicity White East/Southeast Asian South Asian Aboriginal Other Parent Marital Status Married/Common-law Single/Divorced/Widowed Children in Family 1 2 3+ 3.1 (1.7) 3.5 (2.1) 3.5 (1.9) 36.5 (7.9)a 3.57 (5.32) 32.2 (9.1)ab 5.10 (7.07) 31.6 (6.6)b 2.66 (3.55) 7.39 (8.14) 4.31 (4.91) 6.61 (6.36) 18.6 (12.6) 18.0 (12.7) 16.4 (9.8) 3.4 (2.3) 3.5 (2.0) 3.2 (1.7) 3.5 (1.8) 29.2 (9.8)a 34.4 (7.8)b 33.7 (8.2)ab 32.0 (5.3)ab 5.94 (8.61) 3.64 (5.01) 2.90 (4.08) 3.21 (4.00) 5.61 (6.96) 6.37 (6.26) 4.54 (4.75) 6.69 (7.20) 16.8 (13.8) 18.5 (10.7) 18.3 (12.3) 15.1 (9.1) 3.6 (1.8)ab 2.7 (2.3)a 3.0 (1.8)ab 4.9 (2.4)b 3.2 (1.5)ab 33.8 (7.1) 29.7 (9.0) 31.0 (8.9) 32.1 (7.4) 33.7 (9.1) 4.53 (6.39) 2.03 (3.39) 3.07 (3.11) 4.94 (6.14) 3.41 (6.00) 5.43 (6.34) 5.93 (5.46) 6.89 (5.63) 7.96 (7.71) 4.76 (6.40) 17.8 (11.9) 13.5 (11.0) 15.3 (8.7) 20.9 (12.9) 19.5 (11.7) 3.2 (2.0)a 3.9 (1.7)b 32.3 (8.5) 33.5 (7.1) 3.69 (5.80) 4.14 (5.16) 5.93 (6.11) 5.44 (6.69) 17.3 (10.3) 17.8 (14.3) 3.3 (1.9) 3.3 (1.9) 3.0 (2.1) 32.8 (8.2) 32.9 (8.6) 31.6 (6.4) 4.11 (6.04) 3.70 (5.50) 3.40 (4.95) 5.55 (5.64) 5.96 (6.19) 5.95 (8.02) 17.1 (12.7) 17.5 (10.4) 18.0 (11.9) SD, standard deviation; VF, servings of vegetables and fruit; Fat, percentage energy from fat; SSB, percentage energy from sugar-sweetened beverages; Desserts/Treats, percentage energy from desserts or treats; Snack, percentage energy from snacks Means with different superscripts were significantly different at p≤0.05 based on results from one-way analysis of variance and Scheffe’s test 44 Parent-Adolescent Associations Parent intake of several dietary components was significantly associated with adolescent intake, after controlling for a variety of demographic and household characteristics (Table 3-4). Greater intake among parents in servings of VF, and percentage energy from total fat, SSB, and snacks was associated with greater intake among adolescents. For every one additional serving of VF consumed by parents, adolescent intake increased by 0.23 servings. A significant interaction with educational attainment was observed for fat intake. Adolescent fat intake was more strongly associated with the fat intake of parents with lower educational attainment than parents with a higher educational attainment. Among parents with a high school education or less, a 10% increase in the percentage of energy from fat was associated with a 6% increase in adolescent intake. Among parents with a non-university diploma or degree and those with a university degree, a 10% increase in the percentage of energy from fat was associated with a 3% and 0.2% increase in adolescent intake, respectively. An additional percentage of energy consumed from SSB by parents was associated with a 9% increase in adolescent consumption of energy from SSB. In addition, a significant interaction effect was observed for snacks between boys and girls; a stronger association in snack intake was observed for parent-daughter pairs than for parent-son pairs. Specifically, the percentage of energy from snacks consumed by adolescent girls increased by 3% for every 10% increase in consumption by parents, while for boys the increase was close to zero, at 0.3%. No significant interactions were found with adolescent age, parent sex (mother vs. father), or household income. 45 Table 3-4 Associations between parent-adolescent dietary intake of vegetables & fruit, fat, sugar sweetened beverages, desserts/treats and snacks assessed by 24-hour dietary recall of 165 adolescent-parent pairsa Correlation Unadjusted Models RR (95% CI) Adjusted Modelsb r b (SE) b (SE) .23** .23 (.08)** .23(.08)** .31** - .33 (.08)** - .65(.16)** -.31(.11)** RR (95% CI) c Model 1 VF Model 2 c Fat Fat x educatione Model 3d SSB Model 4 d Desserts/treats Model 5 c Snacks Snacks x sex (male)f .29** 1.09 (1.02-1.16)* 1.09 (1.02-1.16)* .13 1.02 (0.98-1.05) 1.01 (0.98-1.04) .19* - .17 (.07)* - .32(.12)** -.29 (.15)* VF, servings of vegetables and fruit; Fat, percentage energy from Fat; SSB, percentage energy from sugar-sweetened beverages; Desserts/Treats, percentage energy from of desserts and treats; Snacks, Percentage energy from snacks; b, unstandaridized regression coefficient; SE, standard error; RR, Risk Ratio; CI, Confidence Interval a Dependent variable is child intake and independent variable is parent intake for all models b Models were adjusted for parent age, sex, BMI, education, household income and child age, sex and BMI z-score; Model 1 was adjusted for total energy intake by parent and child c Pearson correlation coefficient and linear regression estimate are presented d Spearman correlation coefficient and risk ratio (derived from negative binomial log count estimate) are presented e The interaction effect indicates the change in slope for the association in parent-child fat intake, between those with high school education (b=0.64) and those in the next education category, trades certificate (b=0.64-.31=.33). The next education category, university degree, would have a slope of b=.33-.31=0.02. f The interaction effect indicates the change in slope for the association in parent-child snack intake, between adolescent girls (b=.33) and adolescent boys (b=.33-.30=.03) *p<0.05 **p<0.01 46 3.4 Discussion The present study aimed to identify associations in dietary intake of parent-child pairs among a group of overweight/obese adolescents enrolled in a lifestyle behaviour modification intervention. This is one of few studies to have investigated parent and child dietary resemblance among adolescents who are overweight/obese. Associations between intake by parents and their overweight/obese adolescent children were identified for several dietary components thought to be important for healthful weights. With the exception of snacks, there were no significant differences in these associations between girls and boys or by age. These findings suggest that parent modeling may influence the diets of adolescents. Targeting parents of overweight/obese adolescents, by helping them to improve their own diets, may have the potential to improve the diets of their adolescent children. Dietary Intake As in other studies, the diets of families in the present sample were less than optimal. Poor diets have previously been reported among overweight adolescents presenting for weight management, although a higher mean energy and VF intake were reported and that study did not assess fat, SSB, desserts or snacks.206 Within the present study, dietary intake by adolescents also appeared different from the average Canadian diet. According to data collected by 24-hour dietary recall as part of the 2004 Canadian Community Health Survey, the average daily energy intake of BC adolescents (9-18 years) was 1946 kcal and 2661 kcal, and percentage energy from fat was 30.1% and 31.9% for girls and boys, respectively.207 Additionally, children 4-18 years old consumed 4.6 servings of VF per day.207 47 Reported energy intake in the sample used for the present study was lower than expected, and may be the result of dieting (34% of adolescents reported dieting), underreporting intake due to social pressures, or challenges completing the online recall. Upon comparison of this sample with the Goldberg cut-point,208 evidence of underreporting was found. The Goldberg cut-point values were developed to differentiate between plausible and implausible reporting by comparing reported energy intake to expected energy requirements that are adjusted for measurement error and sample specific characteristics.208 Estimated energy requirements from the sample (determined by dividing reported energy intake data by age-, sex- and weightestimated basal metabolic rate) that are below the expected energy requirements (value calculated based on the Goldberg cut-point formula)208 indicate under-reporting. Based on dietary intake data provided by participants in the present sample, estimated energy requirements of 0.98 for adolescents and 1.18 for parents (Appendix A.2) were below the expected energy requirements based on the Goldberg cut-points derived for this sample (1.38 for adolescents and 1.45 for parents; Appendix A.2). Under-reporting did not differ by dieting status for adolescents or parents (data not shown). These values of under-reporting are similar to those reported in another sample of overweight adolescents using the same web-based dietary intake tool.209 Previous studies have demonstrated that energy-adjusted nutrient and food intakes are relatively unaffected by energy under-reporting33,210 and as expected, participants had lower intakes of VF and higher intakes of energy from fat. For the present study, under-reporting of energy is of less concern given that analyses were controlled for energy intake and the purpose was to examine associations between parent-child diets, not to quantify diets with precision. Differences in dietary intake observed across household characteristics were somewhat unexpected. In line with previous studies, less healthful food patterns (higher % energy from fat, 48 SSB and desserts/treats) occurred in households with a lower educational attainment; however, fat intake was lower in the lowest income category.211 Differences by ethnicity and marital status were not expected, but given the relatively small sample size, they may reflect patterns of intake specific to the present study sample. Parent-Adolescent Associations Associations between parent-child intake of dietary components is supported by a similar study that found resemblance in fruit, vegetable, low fat dairy, snack foods but not SSB intake between parents and their overweight/obese children (4-9 years old).190 In contrast to the study with younger children, the present study found no association in snack-type foods (desserts/treats) but a positive association between parent and adolescent intake of SSB. Since SSB are more commonly consumed by older children185 this may explain differences in the association between studies. In light of the limited nutritional value of SSB and their association with childhood obesity,212 SSB are a particularly important dietary component to target for intervention and public health policy. In addition, small but positive associations between parent and adolescent VF, fat, SSB and snack intake suggest that when parents consume more of these food items, their children may also consume more. Of note, parents reported consuming more energy from snacks than adolescents, which is contrary to national surveillance findings5 and may suggest unique dietary patterns among these families. Other studies conducted among broader samples of adolescents have shown modest correlations with parent intake of VF,71 percentage energy from fat,71 and SSB213 as well as a range of other nutrients (e.g. energy, calcium, fiber, cholesterol);72 none have looked at resemblance of energy-dense food types or energy from snacks. In line with the 49 findings of the present study, authors of a review and meta-analysis on this topic among children and adolescents72 emphasize that the magnitude of the relationships is small to moderate across dietary variables. This finding is not surprising given the complex mix of factors that are known to influence diets, including home, school, and community availability, peers, marketing and price.11,60,214 Despite these other influences, small changes to adolescent diets, through changes to parent diets, have the potential to impact overall dietary behaviours. This finding supports previous intervention research that argues for parent-focused behaviour change as a means to successfully change child behaviour and reduce childhood obesity.183 The relationship between parent-adolescent fat intakes was stronger among families with lower parent education. A previous study on parent-child resemblance found parent education had a small but positive association with parent-child cholesterol resemblance and a small but negative association with fat resemblance.71 High fat intake has been associated with education attainment and other measures of SES,215 in part, because cost is a large predictor of dietary choices216 and many high fat food items are less expensive;217 however, the present study found no interactions with household income. Approaches that aim to change adolescent dietary fat intake by targeting parents, rather than adolescents, may be more effective and provide a greater benefit to families with lower education attainment. Limitations The small number of families participating in the present study (n=165) may limit its generalizability to the wider population. The present study did not examine temporal associations between parent-child dietary intakes; however, future research should examine if changes to parent diets result in changes to child diets. An important limitation of the present study is that 50 dietary data were collected by self-report and are thereby susceptible to recall and social desirability bias. These biases were mitigated by using a web-based format to increase privacy, photographs to help estimate portion size, and a multiple pass technique to improve recall. This sample underreported energy intake, but analyses controlled for the major determinants of underreporting, which are BMI, age, and sex.33 Despite this, bias in reporting remains a concern, particularly for overweight/obese adolescents, and may have masked or confounded associations. The web-based food recall had a finite number of items to choose from and may have introduced error in substituted items. Furthermore, 24% of parent-child pairs completed a different number of recalls and may have contributed to differences in intake. Finally, 75% of dietary recalls were reported on the same day for adolescents and parents; therefore, shared food and meal environments, in addition to possible genetic factors related to satiety and food preferences,190,218 may have contributed to observed similarities in their diets. The sample size did not permit examination of differences between pairs that reported dietary intakes on the same versus different days. Conclusions Among families with overweight/obese adolescents, similarities in dietary components thought to be important for healthful weights were found between parents and their adolescent children. Similar to studies in normal weight populations and in overweight/obese children (4 to 9 years old), this study confirms a modest relationship between parent and child dietary intakes. Parent-adolescent intakes of FV, total fat, SSB and snacks were positively associated (r=.19-.37). No relationship was observed for desserts/treats and relationships with fat and snack intake were stronger for parents with a lower educational attainment and for adolescent girls, respectively. 51 These findings suggest that parent modeling may influence diets among adolescents. The implications of these findings will be discussed in detail in Chapter 6. In brief, findings suggest that parent intake explains a small part of adolescent intake. Additional factors within the home environment beyond parent intake (e.g. parenting practices, food availability and the presence of siblings) will be explored in Chapter 4. 52 Chapter 4: Model of the Home Food Environment and Dietary Intake This chapter presents the findings of Study 2, a structural equation model analysis that examined cross-sectional associations between various characteristics of the home food environment and the intake of select dietary components and nutrients of overweight/obese adolescents. Similar to the previous chapter, a brief introduction is provided to better situate the specific aims of this study with the current literature, followed by a detailed description of the study methods and results. Finally, a discussion of the results and brief conclusions of this study are presented. More detailed conclusions and study implications as they relate to the entire thesis are presented in Chapter 6. 4.1 Introduction A growing body of evidence suggests that characteristics of the home environment play an important role in influencing child and adolescent eating behaviours.17,64 In obesity treatment programs, parents are seen as important agents of change, in large part, because they are in control of broader aspects of the home, including the availability of foods and rules that help to support or hinder their children’s behaviour change.181 Among younger children, parent-centered programs that focus on promoting an authoritative parenting style, role modeling, and a healthier home food environment (e.g. availability, accessibility, meal routines) have resulted in greater reductions in BMI than when children alone are targeted.219 The primary mechanism for these differences appears to be improvements in the types of foods available in the home.219 The particular aspects of the home environment that have been studied vary considerably across studies.14,17,18,64,68 Based on socio-ecological models of health behaviour, both physical and social aspects of the home food environment are likely to play a role.11,16,18 Physical aspects 53 include what is available to eat and drink, while social aspects include influences of parents and other family members (e.g. modeling, parenting practices and family meals).11,16,18 Previous studies have identified a range of family characteristics associated with better dietary quality among children and adolescents, including parenting style,220 parenting practices (modeling, feeding practices, rules),221 meal practices,93 availability222 and accessibility.109 A review of psychosocial correlates of child and adolescent diets identified child-perceived modeling as the correlate most consistently and positively associated with eating behaviour, in contrast to parentreported modeling for which associations were inconsistent.15 This finding supports the role of observational learning in the formation of eating behaviours.66 The implications for adolescents are less clear since most studies have been conducted in children. The role of parents and the home environment in influencing behaviour likely changes during adolescence, as adolescence in North American culture is a developmental period characterized by greater distancing from parents and increasing influence by peer groups.49 A previous study found that adolescent VF intake was strongly influenced by VF availability in the home, and in turn, VF availability was influenced by social support for healthful eating, family meal patterns, food security and SES.119 The authors concluded that the home environment does play an important role in influencing adolescent dietary habits perhaps to the greatest extent by influencing what foods are made available.119 Their results also suggest that socio-environmental aspects of the home environment may influence availability, which consequently influences diet, and such models warrant further investigation. It has been noted in the literature that contexttailored interventions are needed to improve outcomes;181 therefore, it is particularly important to examine models of the home environment among families that are the target of obesity interventions. 54 The aim of the present study was to examine aspects of the home food environment that are associated with adolescent intake of five dietary components: servings of VF, percent energy from fat, consumption of desserts/treats (yes/no), consumption of SSB (yes/no), and percent energy from snacks. It was hypothesized that an authoritative parenting style, parent modeling of healthful food choices (e.g. VF and low fat snacks), more healthful family meal practices (e.g. fewer meals in front of the TV and at fast food restaurants), reduced availability of less healthful foods and drinks (e.g. parents were asked if they had selected high fat foods or regular/non-diet soft drinks in their home) and high SES (e.g. higher education or income level) would be associated with more healthful dietary habits among overweight/obese adolescents. It was also hypothesized that social influences may indirectly influence adolescent dietary intake through associations with availability of less healthful foods in the home (See Figure 4-1) Social Environment Physical Environment Perceived parent modeling Authoritative parenting style Family meal practices Availability of high fat foods Availability of high fat treats Availability of soft drinks Adolescent’s Dietary Intake Covariates: age, sex, BMI, household income, parent education Figure 4-1 Proposed model of environmental variables within the home food environment and their association with adolescent dietary intake 55 4.2 Methods Participants Of the 176 parent-adolescent pairs who completed the baseline visit and were eligible for the MySteps® intervention (described in Chapter 3), three adolescents did not complete the 24hour dietary recall and six parents did not complete the questionnaire items about the home food environment and socio-demographics, yielding a sample of 167 adolescents for the present study. Measures Measures from parent and adolescent questionnaires are included in Appendix A (see A.3-A.7) and a detailed data collection protocol was presented in Chapter 3. Parent Modeling Five items from the adolescent questionnaire were used to measure parent modeling of fruit, vegetable, salad and low fat food intake: 1) My parents eat vegetables when I am with them; 2) My parents eat fruits when I am with them; 3) My parents eat salad at a restaurant when I am with them; 4) My parents eat low fat snacks when I am with them; 5) My parents eat low fat dressings with salads when I am with them. Responses to each item were coded on a 4-point likert scale (Never, Sometimes, Frequently, Always). These items were adapted from a 15-item scale developed by Cullen et al.116 that included additional items specific to meal times. The psychometric properties of this longer scale were tested in an ethnically diverse sample of grade 4 to 6 US children and found to have a good internal reliability of 0.89, but a low Pearson test-retest of 0.26. Results from principal component analysis show the scale explained 24% of the item 56 variance and small but significant correlations were identified with child fruit, juice and total fruit, juice and vegetable consumption (r=0.14-0.20, p<.05).116 Parenting Style Eleven items from the parent questionnaire assessed an authoritative parenting style. Items included questions such as wanting to hear about my child’s problems, knowing where my child is after school, and telling my child that I like him/her just the way they are. Responses to each item were coded on a 4-point likert scale (Never, Sometimes, Often, Always). These items were derived from Cullen’s 11-item authoritative parenting scale223 the psychometric properties were previously tested in a sample of ethnically diverse parents and grade 4 to 6 students. Based on principal component analysis, the scale explained 30% of the item variance, had an internal consistency of 0.72, and a Pearson test-retest of 0.53.223 Family Meal Practices Seven items pertaining to meal practices from the family nutrition and physical activity screening tool224 completed by parents were used to assess family meal practices. Items asked parents to select, between two opposing statements, the statement that best fits their child and/or family regarding norms about: 1) eating breakfast together, 2) eating at fast food restaurants, 3) eating while watching television, 4) eating fruits and vegetables with meals or as snacks, 5) using pre-packaged foods for meals, 6) eating dessert regularly after dinner, and 7) eating dessert regularly in the evening. This response style is thought to help reduce social desirability bias because it normalizes both the positive and negative response options.225 Responses were converted to a 4-point numerical scale, and reverse coded when needed, so that a score of four indicated more healthful meal practices. These items were derived from a tool that has 57 previously assessed in a large sample of parents and their children in grade one.224 The psychometric properties of this longer scale were tested using exploratory factor analysis and was found to have an internal consistency of 0.70 and scores coded to reflect less healthful practices were positively associated with children being in a higher BMI category (OR=1.7, 95% CI=1.07-2.80).224 Home Food Availability Eight items from the parent questionnaire assessed home high fat food and soft drink availability. Participants were asked if the following seven food types were available in the past week (yes/no) and if they were low fat (yes/no): 1) cookies, pies, cakes or snack cakes; 2) chips (e.g. potato, corn, tortilla or Doritos chips); 3) ice cream or frozen yogurt; 4) granola bars; 5) bacon/sausage; 6) hot dogs; and 7) frozen dinners. Similar to previous studies that summed food items into the total number of core foods versus non-core foods available in the home40 or the number of energy-dense snack foods,102 availability items were split into two indices and summed to generate: 1) Availability of high fat foods (bacon/sausage, hot dogs, frozen dinners; range=0-3), and 2) Availability of high fat treats (cookies/pies/cakes/snack cakes, chips, ice cream/frozen yogurt, and granola bars; range=0-4). Higher values for each index indicated more high fat foods or treats available. Items that participants identified as low fat versions were not included in the index. Availability of soft drinks in the home was assessed by a response of “yes” to one item: “Did you have regular sodas or soft drinks in your home in the past week?” These items were derived from a list of 15 items used in the Girls Health Enrichment Multisite Studies (GEMS)226 that was previously tested in a sample of parents of 10 year old African American 58 girls. Internal consistency for the 15 high fat food items was found to be 0.64 and a 12-week testretest reliability was 0.44.227 SES Parents completed survey questions that were used to assess maternal education and annual household income. Details are summarized below: 1) Maternal Education — Participants were asked to provide the highest degree, certificate, or diploma they had obtained and that their spouse had obtained. Responses were grouped into three categories: 1) Less than or equal to high school education; 2) Trade certificate, diploma, non-university certificate, or university certificate below a bachelor level; and 3) University degree or greater. To obtain maternal education, if the respondent was female (i.e. the mother), the respondent’s educational attainment was used and if the respondent was male (i.e. the father), the respondent’s spouse’s educational attainment was used. Maternal education, which has been found to predict children’s dietary intake228 and a wide range of child health outcomes229 was used in the present study to obtain a consistent measure of socio-economic influence for each participating adolescent. 2) Household Income — Participants were asked for their best estimate of the total income, before taxes and deductions, of all household members from all sources in the past 12 months. Responses were collapsed into four categories: 1) Less than or equal to $40,000; 2) $40,001$80,000; 3) $80,001-$120,000; and 4) $120,000 or greater. Adolescent Dietary Intake Adolescent dietary intake was assessed as described in Chapter 3. In summary, five dietary intake variables were calculated from the average of up to three web-based 24-hour 59 dietary recalls to estimate average intake per day of: 1) servings of VF, 2) percentage of total energy from total fat (Fat), 3) percentage of energy from SSB, 4) percentage of energy from desserts or treats (Desserts/treats), and 5) percentage of total energy from snacking occasions (Snacks). Of the 167 adolescents examined in the present study, 76 adolescents provided three days of dietary recalls, 46 provided two days, and 45 provided one day. Dietary intake was averaged across days for those who completed two or three days of dietary data, and for those providing just one day, dietary data for that one day were used. As presented in Chapter 3, differences by number of dietary recalls completed were examined and no differences were found except for consumption of desserts/treats, which was significantly greater among those who completed more days of dietary recall. Adolescent BMI Measured height and weight were used to calculate sex and age specific BMI z-scores for each adolescent based on the WHO method for children and adolescents (5-19 years old).195 Methods used for this calculation were described in Chapter 3. Analysis Measurement Model Confirmatory Factor Analysis (CFA) was performed to determine if the factor structure of the parent modeling, parenting style, and family meal practice scales were supported in this sample. Note that availability of high fat foods was conceptualized as an index and availability of soft drinks was assessed by only one item; therefore, they do not have a factor structure that can be examined using CFA. Model fit was assessed using commonly accepted fit indices: Chisquare goodness of fit test (p-value ≥.15), Comparative Fit Index (CFI>.95 and a p-value>.05), 60 Root Mean Square Error of Approximation (RMSEA<.06 and an upper CI ≤ .08), and the Standardized Root Mean Square Residual (SRMR<.08).230 Since the chi-square test is highly influenced by model complexity and sample size, and CFI and SRMR are highly influenced by the inclusion of non-significant paths, the RMSEA was the main index used to determine model fit.230 A single model was built with all three latent constructs and the Maximum Likelihood Estimator was used. Internal consistency of items in each scale was determined by computing Cronbach’s alpha. Structural Equation Model Structural equation modeling was selected for the present study to test a conceptual model of the home food environment and adolescent dietary intake. As in standard regression modeling, structural equation modeling uses regression equations to determine associations between multiple variables but allows for the inclusion of latent constructs that control for measurement error.231 Latent variables are not directly observed, but are made up of two or more observed variables believed to represent the latent construct.231 As such, error between observed variables that make up a latent construct can be estimated and corrected in the modeling process.231,232 The ability to adjust for measurement error can be particularly beneficial when using survey data and when modeling with smaller samples. An additional strength of this modeling technique is that it allows for simultaneous statistical testing of an entire system of variables (i.e., the hypothesized model) to determine if there is a fit between the model and the observed data.231 It also creates a pictorial representation of the model facilitating interpretation of the model, and allows for the study of direct and indirect effects.231,232 61 After the measurement models were refined, two structural equation models were built to test the conceptual model linking the home food environment to five adolescent dietary outcomes: VF, Fat, SSB, Desserts/treats, and Snacks. Since all other outcomes were expressed as a percentage of energy, VF was converted into a nutrient density by dividing the total servings by the total calories for each participant. First, all of the independent variables were regressed on each dietary outcome to determine direct effects. Second (final model), the independent variables were regressed on dietary outcomes as well as on home availability variables to examine if the socio-environmental variables were indirectly associated with diets through what is made available in the home to eat and drink. Covariates in each structural equation model included adolescent age, sex, BMI z-score, parent BMI, maternal education and household income. The Means- and Variance- adjusted Weighted Least Squares (WLSMV) method of estimation was used to handle a combination of continuous and dichotomous outcome variables. WLSMV has been proposed as the best estimator for modeling categorical data,233 was designed specifically for use with small and moderate sample sizes, and is fairly robust to non-normality.234,235 Due to a highly left-skewed distribution (high number of zero valid responses) and the inability of the WRMSR estimator to handle negative binomial regression, servings of SSB and servings of desserts/treats were dichotomized to 1=consumed, 0=not consumed. Model fit was assessed using the fit indices described earlier as well as the Weighted Root Mean Square Residual (WRMSR). When using the WLSMV estimator, the RMSEA and WRMSR are the best indices of model fit, with a WRMSR of less than 1.0 and a RMSEA of less than 0.6 suggesting a good fit.230 Within the analytic sample, parenting variables had less than 5% missing values; therefore, they were handled in MPlus® using pairwise deletion. All standardized paths were 62 considered significant at p-value<0.05. Regardless of significance levels, no conceptual paths were removed from the model. Value of non-normality such as kurtosis and skew were examined for each outcome variable and found to be within the acceptable range for structural equation modeling (skew <3; kurtosis<10).236 All statistical analyses were conducted using STATA v.11 (College Station, TX: StataCorp LP) and MPlus® version 7.0.237 4.3 Results Sample Characteristics A description of the study participants is presented in Table 4-1. The mean BMI z-score of adolescent participants was 2.7 and ranged from 1.14 to 6.72. Adolescents in this sample were an average of 13 years of age and slightly more females participated than boys. Families were fairly evenly distributed across household income categories, while twice as many mothers had a university degree as compared to a high school degree or less. Families reported having more high fat treats in the house than high fat foods and just over one third reported having regular soft drinks in the house. 63 Table 4-1 Adolescent and household characteristics Demographic Characteristics Age Female Sex BMI z-score 1.0-1.99 2.0-2.99 3.0-3.99 ≥ 4.0 Weight (kg) Height (m) Maternal Education ≤High School Trade Certificate/Diploma ≥University Degree Household Income ≤$40,000 $40,001-$80,000 $80,001-120,000 ≥$120,000 Home Food Environment Availability of High Fat Foods Availability of High Fat Treats Availability of Soft Drinks (yes) Authoritative Parenting Parent Modeling Family Meal Practices Dietary Intake VF, servings/d Fat, % kcal/d SSB, consumed (yes) Desserts/Treats, consumed (yes) Snacks, % kcal/d N Mean±SD / n (%) Range 167 167 167 13.2±1.79 89 (53.3) 11-16 167 167 167 30 (18.0) 87 (52.1) 34 (20.4) 16 (9.6) 83.5 ± 22.9 1.63 ± 0.10 48.0-175.8 1.39-1.95 32 (19.2) 64 (38.3) 71 (42.5) 167 33 (19.8) 54 (32.2) 45 (27.0) 35 (21.0) 167 167 167 159 162 154 0.61±0.74 1.86±1.15 61 (36.5) 3.51±0.45 2.52±0.63 2.83±0.65 0-3 0-4 167 167 167 167 167 3.37±1.95 32.8±8.1 88 (52.7) 104 (62.3) 17.3±11.5 0-8.8 3.4-56.7 2.14-4 1-4 1-4 0-67.7 SD, standard deviation; BMI, body mass index; VF, vegetables and fruit; SSB, sugar-sweetened beverages Significant simple correlations were in the expected direction (Table 4-2). Correlations revealed that homes with soft drinks, high fat foods and high fat treats were positively correlated. In addition, healthful modeling and family meal practices were negatively correlated with availability of less healthful foods. Intake of VF was negatively correlated with availability of 64 soft drinks, while intake of snacks was positively correlated with availability of high fat treats. Desserts/treats intake was negatively correlated with healthful modeling and positively correlated with availability of soft drinks and high fat treats. Table 4-2 Pair-wise Spearman correlations between dietary outcomes and characteristics of the home food environment Authoritative Parenting Dietary Intake -.16 VF, density1 .06 Fat, % kcal/d .00 SSB, consumed (yes) Desserts/Treats, -.04 consumed (yes) -.02 Snacks, % kcal/d Home Food Environment Authoritative Parenting Parent Modeling .12 .06 Family Meal Practices -.07 Availability of Soft Drinks -.02 Availability of High Fat Foods -.01 Availability of High Fat Treats Parent Modeling Family Meal Practices Availability Availability Availability of Soft of High Fat of High Fat Drinks Foods Treats .15 -.08 -.11 -.04 -.03 -.02 -.20* -.05 .15 -.11 .14 .13 -.12 -.13 .13 -.19* -.05 .15* .18* .13 -.10 -.15 .03 .19* .06 .18* - -.30** .01 - -.22** -.28** .25** - -.19* -.31** .22** .24** VF, vegetables and fruit; SSB, sugar-sweetened beverages 1 Nutrient density calculated as servings of VF/total kcal per day *p<.05 **p<.01 Measurement Model In preparation for the main analyses, the factor structure of the parent modeling, parenting style, and family meal practices scales was examined. The initial results did not 65 support the original factor structure of the data: χ2(df=249)=500, p<.001; RMSEA=.08 [.07-.09], p<.001; CFI=.78; and SRMR=.09. After examination of modification indices, several post-hoc modifications with conceptual relevance were made to produce a measurement model that demonstrated good model fit: χ2(df=87)=125, p<.01; RMSEA=.05 [.03-.07], p=.44; CFI=.93; and SRMR=.06. Factor loadings of each latent variable examined using CFA are presented in Table 4-3. Modifications made to the original factor structure are described below. CFA analysis did not support the 11-item authoritative parenting style factor structure because many error terms were correlated suggesting overlap in content among certain items. Based on modification indices and conceptual overlap, the scale was reduced to 7 items. This new factor structure was supported by the data (Table 4-3). The 5-item factor structure of the parent modeling scale was also not supported by the data since items measuring modeling of vegetables and modeling of fruits had high residual correlations. The item on parent modeling of vegetables was removed because another item asked about modeling of salads, and this new 4-item factor structure was supported by the data (Table 4-3). Finally, the 7-item factor structure of family meal practices was not supported in the present sample. Eating dessert in the evening was omitted because of conceptual overlap with eating dessert after dinner, and eating VF with dinner was not correlated with the other items and was removed. In addition, eating breakfast as a family was negatively correlated with the other items; thus, the scale was reduced to 4 items. This 4-item structure was supported by the sample data (Table 4-3). The internal consistency of this scale was below 0.70 and is considered sub-optimal, but may be the result of the small number of items in this scale (internal consistency increases with the number of items) or a lack of precision in responses for these scale items.236 66 Table 4-3 Measurement model of parenting constructs using confirmatory factor analysis Authoritative Parenting Listens to child’s problems Aware of where child is going Tells child when doing a good job Checks child’s homework Knows what child does with friends Likes child the way they are Tells child when to come home Parent Modeling Parents eat fruits around child Parents eat salad at restaurants around child Parents eat low fat snacks around child Parents eat low fat dressings around child Family Meal Practices Family eats fast food Family eats while watching television Family uses prepackaged meals Family eats dessert after dinner Factor Loadinga Standard Error 0.45 0.56 0.65 0.63 0.72 0.60 0.75 0.07 0.06 0.06 0.06 0.05 0.06 0.05 Cronbach’s alpha 0.81 0.76 0.50 0.60 0.75 0.82 0.07 0.06 0.05 0.05 0.71 0.42 0.66 0.41 0.09 0.09 0.09 0.09 0.60 a Standardized factor loadings, all significant at p<.001 Correlations between factors were as follows: 0.15 between authoritative parenting and parent modeling; 0.16 between authoritative parenting and family meal practices; and 0.25 between parent modeling and family meal practices. Structural Equation Model First, a model of direct effects was run and demonstrated adequate fit: χ2(df=267)= 365, p<.001; RMSEA=.05 [.03-.06], p=.67; CFI=.73; and WRMR=0.97. Figure 4-2 shows the standardized coefficients for model 1 that were significantly associated with dietary intake, with all paths and p-values presented in Table 4-4. In model 1, no direct associations were seen with authoritative parenting, parent modeling, or family meal practices and dietary outcomes. Availability of high fat treats was associated with a lower percentage of energy from fat, while availability of high fat foods was associated with a higher percentage of energy from fat and snacks. Second, a model with the addition of variables regressed on home food and beverage 67 availability was run and demonstrated adequate fit: χ2(df=290)= 408, p<.001; RMSEA=.05 [.04.06], p=.53; CFI=.71; and WRMR=0.96. Figure 4-3 shows the standardized coefficients for model 2 that were significantly associated with dietary intake, with all paths and p-values presented in Table 4-5. Examination of both models revealed that social variables (authoritative parenting, parent modeling, and family meal practices) had no direct effect on dietary outcomes, indicating that availability of food and beverages in the home does not mediate the relationship between social variables and dietary outcomes (i.e. there was no effect to mediate). However, several social variables had an indirect effect on diets through a direct association with the availability of food and beverages in the home (Figure 4-3). Model 2 represents the final model. Figure 4-2 Model 1: Structural equation model of factors within the home environment directly associated with dietary intake of 167 overweight/obese adolescents Standardized regression coefficients can be interpreted as correlations. Model controls for child age, sex and BMI z-score, and parent BMI, maternal education and household income. Nonsignificant paths and correlations between independent variables are not shown for clarity. 68 Figure 4-3 Model 2: Structural equation model of statistically significant factors within the home environment associated with home food/beverage availability and dietary intake of 167 overweight/obese adolescents Standardized regression coefficients can be interpreted as correlations. Model controls for child age, sex and BMI z-score, and parent BMI, maternal education and household income. Nonsignificant paths and correlations between independent variables are not shown for clarity. 69 Table 4-4 All estimated paths of the structural equation model examining direct effects (n=167) (Model 1) VF Fat SSB Desserts/Treats Snacks Standardized regression coefficient, p-value Home Food Environment Availability of High Fat Foods -.098, p=.29 .210, p=.01 .098, p=.36 .182, p=.08 .333, p<.001 Availability of High Fat Treats -.112, p=.19 -.173, p=.01 .135, p=.18 .142, p=.18 .024, p=.76 Availability of Soft Drinks -.132, p=.12 -.061, p=.44 .112, p=.25 .151, p=.15 -.040, p=.63 Authoritative Parenting -.106, p=.14 .051, p=.44 .049, p=.60 -.021, p=.83 .047, p=.50 Parent Modeling .095, p=.17 -.017, p=.83 -.051, p=.60 -.197, p=.09 -.050, p=.48 Family Meal Practices -.161, p=.07 -.049, p=.54 .004, p=.97 -.032, p=.78 -.100, p=.16 Maternal Education .129, p=.12 -.271, p=.001 .032, p=.75 .032, p=.75 -.004, p=.96 Household Income -.120, p=.13 .186, p=.02 -.007, p=.94 .072, p=.47 .004, p=.95 Age -.108, p=.20 .099, p=.20 .024, p=.81 .012, p=.91 .059, p=.47 Sex (male) -.035, p=.68 .015, p=.84 -.273, p=.01 -.166, p=.12 -.195, p=.01 BMI z-score .081, p=.35 -.002, p=.98 .189, p=.09 -.049, p=.66 -.075, p=.36 Covariates VF, vegetables and fruit; SSB, sugar-sweetened beverages; BMI, body mass index Bolded values are significant at p<0.05 70 Dietary Outcomes Inconsistent associations with dietary outcomes were observed. Home availability of high fat foods and availability of high fat treats were associated with adolescent dietary outcomes (Figure 4-3). As hypothesized, availability of high fat foods was associated with a greater percentage of energy from fat and a greater percentage of energy from snacks. Unexpectedly, a greater availability of high fat treat items was associated with a lower percentage of energy from fat. Despite hypothesized associations, no significant relationships were found for VF, desserts/treats and SSB intake or with the availability of soft drinks; however, borderline significant trends (p≤0.06) were present for the availability of high fat treats with lower VF intake, and the availability of high fat foods with greater consumption of desserts/treats. Among demographic and socio-economic factors, adolescents from families with higher maternal education consumed less energy from fat, while those with higher family household incomes consumed more energy from fat. Males had lower odds of reporting SSB consumption and SSB was the only dietary outcome associated with higher BMI z-scores among adolescents in this sample (Table 4-5). Home Availability Many hypothesized relationships between factors in the social environment and the physical environment of the home were observed. Healthful parent modeling and more healthful family meal practices were indirectly associated with dietary outcomes through home food availability (Figure 4-3). Adolescents who reported that their parents modeled healthful food consumption had fewer soft drinks, high fat foods and high fat treats in their homes. Similarly, families reporting healthier family meal practices also reported reduced availability of high fat 71 foods and treats. Among demographic and SES factors, greater availability of high fat foods was reported among parents with lower maternal education (Table 4-5). 72 Table 4-5 All estimated paths of the structural equation model examining direct and indirect effects (n=167) (Model 2) Dietary Outcomes VF Home Food Environment Availability of High Fat Foods Availability of High Fat Treats Availability of Soft Drinks Authoritative Parenting Parent Modeling Family Meal Practices Covariates Maternal Education Household Income Age Sex (male) BMI z-score -.131, p=.13 -.165, p=.05 -.149, p=.12 -.105, p=.16 .061, p=.55 -.159, p=.15 .135, p=.12 -.131, p=.13 -.114, p=.18 -.066, p=.43 -.029, p=.74 Fat SSB Desserts/Treats Standardized regression coefficient, p-value Snacks .091, p=.36 .139, p=.18 .138, p=.22 .063, p=.51 -.034, p=.78 .010, p=.94 .183, p=.06 .126, p=.28 .165, p=.17 -.055, p=.60 -.121, p=.37 .026, p=.86 .267, p<.001 -.017, p=.84 -.011, p=.91 .045, p=.57 -.042, p=.72 -.122, p=.23 .023, p=.82 -.268, p=.001 -.002, p=.99 .184, p=.03 .090, p=.27 .026, p=.80 .028, p=.71 -.243, p=.01 -.007, p=.94 .300, p=.01 Home Availability Outcomes .047, p=.67 .098, p=.36 .015, p=.89 -.112, p=.28 -.053, p=.67 -.002, p=.98 .004, p=.96 .029, p=.72 -.146, p=.11 -.052, p=.63 .168, p=.02 -.183, p=.01 -.077, p=.37 .050, p=.43 -.029, p=.75 -.035, p=.72 High Fat Food High Fat Treats Soft Drinks Standardized regression coefficient, p-value Home Food Environment Authoritative Parenting Parent Modeling Family Meal Practices Covariates Maternal Education Household Income Parent BMI .112, p=.17 -.175, p=.04 -.313, p=.003 .036, p=.63 -.242, p=.01 -.301, p=.01 .052, p=.61 -.413, p=.001 -.016, p=.89 -.150, p=.04 -.134, p=.12 .046, p=.64 -.007, p=.93 -.121, p=.14 .013, p=.90 .047, p=.67 -.137, p=.19 -.015, p=.89 VF, vegetables and fruit; SSB, sugar-sweetened beverages; BMI, body mass index Bolded values are significant at p<0.05 73 4.4 Discussion The aim of the present study was to identify factors within the home food environment that were associated with dietary behaviours of overweight/obese adolescents. Few studies have examined the home food environment among high-risk adolescents, specifically, those who are overweight/obese. In the present study, less healthful home food environments were associated with dietary intake among treatment seeking overweight/obese adolescents; however, results varied by food type. In addition, more positive parent modeling and family meal practices were not directly associated with any dietary outcomes, but may influence adolescent diets through their relationship with availability of foods in the home. Maternal education was also found to be associated with characteristics of the home food environment. Interventions that target both aspects of the social and physical environment of the home may help to support dietary intake among intervention participants. Physical Environment (Availability) Availability of less healthful foods at home was found to be associated with some but not all eating behaviours in adolescents. Previous studies have found that greater availability of food and beverages in the home was associated with greater consumption by adolescents of VF,111,119,157 non-core foods,40 less healthful foods,73 energy-dense snacks,111,238 and soft drinks.222,239–241 As hypothesized in the present study, greater availability of high fat foods in the home was associated with greater intake of fat and energy from snacks. Unexpectedly, availability of high fat treats (e.g. cookies, chips, ice cream, granola bars) was associated with less intake of energy from fat. These particular food items may be small contributors to a 74 participant’s fat intake or may be items that tend to be in most households for special occasions (e.g. parties, the weekend), but do not correspond to fat intake in any particular week. Although the present study identified a number of associations with home food and beverage availability that are consistent with other studies, some hypothesized associations were not found. For example, availability of soft drinks was not associated with SSB consumption or any other dietary variable in the model and no significant associations were identified for intake of VF of desserts/treats. Although, there was a non-significant trend (p≤0.06) for having a greater availability of high fat treats and a lower intake of VF as well as for having a greater availability of high fat foods and a greater intake of desserts/treats. The present study did not measure availability of VF, but it was hypothesized that availability of soft drinks and high fat foods might be indicative of a less healthful home food environment overall and thus impact a range of dietary behaviours. A previous study found that availability of less healthful foods in the home was negatively correlated with the number of servings of VF that adolescents consumed in a typical day.157 The availability of less healthful foods may displace more healthful foods, leading to a decrease in the consumption of foods like VF;73 however, this was not supported in the present study since consumption of more healthful foods was not associated with the presence of less healthful foods in the home. Promising experimental research has targeted the availability of SSB in the home (by-weekly delivery of no-calorie substitutes) and was able to reduce total sugar and SSB consumption among baseline high-consuming adolescents at 2-years follow-up,242 further suggesting that interventions that target home food availability should be used to help support behaviour change among overweight/obese adolescents. A previous population-based study by Neumark-Sztainer and colleagues119 examined individual and socio-environmental influences of adolescent VF intake and reported that parent 75 support for healthful eating, family meal patterns, food security, and socio-economic status had indirect effects on VF intake by acting on home VF availability. The current study did not find any associations with VF intake, but similar pathways were identified in the present study with fat, desserts/treats and snack intake. Although measured differently, the constructs identified by Neumark-Sztainer119 are conceptually related to those identified in the present study (with the exception of food security, which was not assessed here). A lack of association with VF in the present study may suggest that the socio-environmental context related to VF consumption differs from that of less healthful foods (e.g. high fat foods, soft drinks) where an association was identified in the present study. A lack of association with VF could also reflect the unique sample in the present study. Families with overweight/obese adolescents may be influenced by a different or more complex set of individual and socio-environmental factors, or may make changes to their environment in response to their own or their children’s weight. In the present study, there was a trend for families who were recruited from previous programs (28%) to report more healthful home food environments (fewer less healthful foods (NS), more healthful modeling (p=0.03), and more healthful family meal practices (NS)). Social Environment Parent Modeling Social aspects of the home food environment may indirectly influence adolescent dietary intake through home food and beverage availability. In line with hypotheses, perception of parent modeling of VF and low fat foods was associated with reduced availability of soft drinks, high fat foods, and high fat treats in the home. It remains unclear how modeling translates into future changes in adolescent diets as availability of foods and beverages was not associated with 76 all dietary outcomes and sometimes relationships were in unexpected directions (e.g. availability of high fat treats was negatively association with fat intake). This measure of parent modeling assessed adolescent perceptions of the types of foods their parents consumed in front of them. Previous studies suggest that children and adolescents eat similar foods to those eaten by their parents68,221 and in this sample, components of parent and adolescent diets were correlated (Chapter 2). In contrast, perceived modeling of healthier foods by parents did not directly associate with adolescent dietary intake, but results suggest that modeling may indirectly influence dietary intake of some foods through reduced availability of high fat foods. Parent preferences likely impact food purchases since studies have found parent preferences predict the foods served to younger children.243 Parents of overweight/obese adolescents who model healthful eating in front of their children may be more actively engaged in promoting healthful eating as a whole and thus, also making changes to other aspects of the home eating environment. Family Meal Practices In addition, more healthful family meal practices were associated with reduced availability of less healthful foods, but not soft drinks in the home. A component of the family meal practice measure examined in the present study was the consumption of fast food for family meals. Previous research has reported that families who consume a greater number of fast food meals are more likely to report having chips and soft drinks available in the home and a higher intake of fast food and salty snacks by adolescents.93 Although a similar association was not found in the present study, this previous research examined a wide range of dietary variables, and like the present study, found no difference in the intake of VF, soft drinks, energy from fat, 77 or snacks. Furthermore, a growing body of evidence links the number of family meals to greater dietary quality94,99,244 and lower BMI96,244 among children and adolescents. The mechanisms by which family meals are thought to impact health behaviours include improved family functioning, better quality of foods served at family meals (e.g. a balanced meal) and healthier family meal routines in general (e.g. fewer meals eaten out).99,245 The present study assessed family meal routines but not the number of family meals. Nonetheless, family meals appear to play a role in shaping the home food environment and, thus, have the potential to impact adolescent eating behaviour. Authoritative Parenting In contrast to hypotheses and previous studies that have linked an authoritative parenting style to adolescent diets14,76,246 and weight,14,78 an authoritative parenting style was not associated with dietary intake in the present study. A previous study found that an authoritative feeding style, and not overall parenting style, was related to weight status.247 In the present study, an authoritative parenting style was also unrelated to availability of less healthful foods or beverages in the home. In contrast, a study of younger children (3-10 year olds) found that authoritative parenting was positively associated with home availability of VF but not availability of other foods including snacks and sweets,248 and a study of 7-10 year olds found that authoritative parents had healthier home food and physical activity environments (mean score did not include measure of food availability but did include meal practices) as compared to more permissive parents.80 Furthermore, younger adolescents have been found to report higher authoritative parenting than older adolescents.220 Parenting style may have a stronger influence among younger adolescents and children,249 although little has been done to test this.83 The 78 measure used in the present study also had high scores overall, perhaps the result of social desirability bias.225 However, the measure used in the present study did not classify parents according to the typical typologies of parenting styles, but rather scored parents only on their authoritative parenting tendencies. This difference in measurement may explain differences in findings across studies. Despite no observed associations in the present study, a recent review suggests that the promotion of authoritative parenting is an overlooked but promising strategy for childhood obesity management interventions249 and warrants further study. Other Characteristics (SES) Higher maternal education was associated with reduced availability of high fat foods in the home. Similar associations were reported in a family-based treatment program219 and a Norwegian study where higher parent education was associated with greater availability of VF and lower availability of SSB.250 These findings may reflect barriers to food purchasing (e.g. knowledge, cost or neighbourhood availability). An education-based intervention in Australia improved perceptions of healthful food affordability among low SES mothers, which may lead to changes in purchasing.251 Future research is needed to explore socioeconomic differences in parenting practices and the home food environment. Limitations The present study is not without limitations. The voluntary nature of the present sample means that findings will not be generalizable to all adolescents or families. Findings are particularly relevant for families with overweight/obese adolescents who are seeking treatment. The present study was cross-sectional in nature and precludes causal inferences. The measure for family meal practices had somewhat low reliability and may highlight the difficulty in measuring 79 the home food environment, particularly in unique samples. The measures for parent modeling and parenting style were originally developed for slightly younger children (9-11 years old) and may be less precise in assessing the construct in older adolescents. A low test-re-test reliability was also reported in a previous study that used the same measure of parent modeling. Parent modeling is generally presumed to be a stable construct,116 but in the present study may only reflect modeling of food choices that occurred in the few days/weeks that preceded the survey. Other family members (e.g. siblings, grandparents) may also be important influences on adolescent dietary behaviours, but they were not measured in the present study. The measure of family meal practices used in the present study was also limited to a select number of practices and may be missing important meal practices that are related to adolescent dietary behaviours. The measure for home food availability included a limited number of items and was restricted to high fat foods and soft drinks; examination of the availability of other types of foods, such as a broader number of foods or other food groups (e.g. VF), may have revealed different relationships. The fact that the present study did not include a measure of the quantity of foods/beverages only their presence or absence may have masked associations.252 Other selfreported measures of home availability using only a few food items have found positive relationships with dietary intake of adolescents, and alternative strategies for measuring availability (e.g. complete home inventories) have considerable limitations including high costs and participant burden.253 Although participants had not yet started the intervention when data from the present study were collected, knowing that they were about to start an intervention might have influenced their behaviours (e.g. limiting the availability of particular foods in the home) making it more difficult to detect associations. As was noted earlier, parents who were recruited from previous weight-management programs offered in BC tended to report more 80 healthful home food environments, perhaps as a result of what they had learned in those programs. For example, adolescent BMI z-score was negatively associated with availability of ice cream, yet parent BMI was positively associated with availability of cookies, cake, and ice cream (data not shown). In unpublished data presented by Ward,253 overweight parents also reported greater availability of crackers, cookies, sweet snacks, SSB, and frozen treats than normal weight parents, while overweight children reported reduced availability of frozen treats compared to normal weight children. Like many observational measures of behaviour, selfreported parenting practices and diets are susceptible to social desirability bias225 and may have influenced the results towards a null finding. Difficulties in assessing dietary intake, including fluctuations in diets over time, underreporting because of social desirability or recall bias, and unknown measurement error may further explain null or unexpected findings. The present study was conducted as a secondary data analysis; therefore, measurement of the home food environment may have been incomplete in terms of representing the full context of parenting (e.g. specific feeding practices). Future work should continue to expand on the combination of variables and the specific household context under which dietary behaviours are changed among overweight/obese adolescents. These constructs were also based on the report from one parent and may be missing the full picture of the home food environment. This is particularly true for adolescents who spend time in two households. To be eligible for the present study, the participating parent had to be the primary caregiver; however, parents of adolescents who spend weekends in a different home were not excluded. Information about living situations was not collected from families; however, one quarter of parents reported being divorced or single perhaps suggesting some of these children were spending time in two households. Future research should examine how different living situations and family structures influence 81 relationships between the home food environment and dietary outcomes. All self-report survey data include measurement error; therefore, an important strength of the present study was the use of structural equation modeling to correct for measurement error in several of the survey measures. This modeling technique also made it possible to test a model of physical and socioenvironmental factors of the home that were previously hypothesized in the literature119 on adolescent dietary behaviour in the context of families who present for obesity treatment. It is important to understand the interplay of these influences within the home environments of overweight/obese adolescents to improve success of obesity treatment programs. Conclusions The present study was the first to examine factors within the home food environment that are associated with dietary behaviours among overweight/obese adolescents presenting for lifestyle modification interventions. Based on the findings from the present study, family-based programs to promote healthful eating should target parent modeling of desired habits, healthier mealtime routines, and reductions in high fat foods in the home. Further implications of these findings will be presented in Chapter 6. Despite confirmation of several hypothesized relationships in the present study, some dietary factors were not associated with aspects of the home environment or relationships were in unexpected directions. It remains a challenge to characterize both dietary intake and those aspects of the household environment that influence diets as they are complex and time-varying. The increasing independence experienced during adolescent development49 may also explain a lack of associations with particular less healthful foods, which teens associate with friends and time spent away from the home,254 In addition, the home environment and its influence on diet may be unique for overweight/obese adolescents. To 82 capture and better understand some of this complexity, the following chapter presents a qualitative study that examined overweight/obese adolescent perceptions of the home food environment. In addition, the third study expands its scope beyond the home environment to consider factors in the school and community environment that may also contribute to dietary behaviours among these youth. 83 Chapter 5: Barriers and Facilitators to Healthful Eating at Home, School and in the Community Explored through Photovoice Chapter 5 presents the findings of Study 3, a qualitative study with adolescent participants of the MySteps® intervention who explored their experiences making healthful dietary choices in their home, school and community environments. A brief introduction expands on the rationale for this study and is followed by a detailed description of the methods and study findings. Finally, an in-depth discussion of the findings is presented along with some brief conclusions. More detailed conclusions and study implications as they relate to the entire thesis are presented in Chapter 6. 5.1 Introduction Childhood obesity rates are at unprecedented levels worldwide1 and in Canada, one third of adolescents are overweight/obese.2 Concurrently, dietary habits among Canadian adolescents do not meet recommendations for optimal health and intakes of energy-dense, nutrient-poor foods (e.g. SSB) are high.5,6 A socio-ecological perspective of healthful eating behaviour among adolescents emphasizes the importance of influences across settings and at various levels, including the individual, social, physical and macro (e.g. economic and political) environments.11 Since research has historically focused on influences at the individual level (e.g. physiological and psychological factors), influences at the broader environmental levels remain understudied.60 Specific environmental factors thought to play a role in adolescent eating behaviours include parent and peer influences; what is available to eat and drink at home, at school and in the neighbourhood; and the cost and marketing of foods and beverages.11,60 A recent synthesis of reviews on environmental correlates of dietary behaviours and physical activity in children and adolescents revealed tremendous inconsistency or null findings across the environmental factors 84 examined.255 Factors found to have consistent associations with diets included family cohesion, parent modeling, parent monitoring, exposure to food advertising, and food price, although, limited reviews have examined the broader-level environmental constructs of price and marketing.255 No consistent factors within the school or neighbourhood settings were identified.255 This synthesis highlighted a general lack of understanding of how, why and for whom environmental factors influence dietary behaviours.255 Health behaviour research to understand a phenomenon of interest often excludes the perspectives of participants, but such phenomenological inquiry is important for addressing the questions of how and why the environment impacts eating behaviours. A small number of studies have used qualitative methods to explore adolescent perspectives on how they make their food choices.85,107,122,254,256–260 These studies revealed a range of factors at the individual level (e.g. preferences, knowledge, hunger), but also influences within the family (e.g. meals, availability, parenting) and community settings (e.g. peers, cost) that contribute to food choices.85,107,122,256,258–260 It was also revealed that adolescents identify junk foods with independence and healthful foods with family254 and that the increased autonomy of adolescents goes hand in hand with less healthful eating.122 Across these studies, few focused on environmental factors, yet adolescents in each study included environmental influences in their discussion of food choice. This finding suggests that understanding the environmental factors that lead to less healthful eating among adolescents may be particularly important. In obesity research, photovoice has most commonly been used to study the influence of the community environment on physical activity levels; however, it holds great promise in nutrition research for understanding food environments.261,262 A phenomenological inquiry, using photovoice methods, was conducted to gain a better understanding of how overweight/obese 85 adolescents interact with their food environments to determine their food choices. The aim of the present study was to explore adolescent perceptions of barriers and facilitators to healthful eating within home, school and community environments. Although no specific a-priori hypotheses were made, based on socio-ecological models of dietary behaviour, it was expected that adolescents would perceive that factors related to physical, social, and macro-level aspects of their environment influenced their food choices. 5.2 Methods Design A phenomenological and photovoice study was conducted among a sub-set of adolescents who participated in the MySteps® intervention to gain a deeper understanding of how home, school and community environments shape healthful dietary behaviours among these youth. The design of the present study was informed by a constructivist paradigm whereby reality is acknowledged as socially constructed, complex, and ever changing.263 Phenomenological inquiry places a focus on the perceived world and subjective experiences of the participant, a qualitative description of meaning, and a deliberate examination of the researcher’s prior beliefs.264 Traditional phenomenological inquiry serves to uncover the meaning of individual experiences, most commonly through individual interviews.265 To complement traditional phenomenological inquiry, experiences were also captured using photovoice methodology. Photovoice is an approach that uses photographic images to empower participants and is participatory and action-oriented.261,262 The theoretical position of photovoice methodology is that individual experience can be actively and methodically interpreted through representations shared in pictures and words.266 Photovoice was originally 86 developed as a participatory method to enable critical reflection and discussion among community members and to influence policy change.267 The present study uses a modified photovoice methodology to gather rich information about how adolescents experience their environments and allows their voices to be heard and to influence change.268,269 Combining phenomenology and photovoice approaches has been discussed in the literature as a means to enhance our understanding of a phenomenon.268 Plunkett suggests that “photovoice methodology may help to uncover enriched understanding of experience by eliciting additional visual and narrative data in phenomenological inquiry.”268 In the present study, adolescents were asked to take photographs that depicted their perceived barriers and facilitators to healthful food choices at home, school and in their community, allowing for interpretation and understanding of their food environments. In addition to using photographs to elicit descriptions of participant experiences, this study employed semi-structured interviews to probe areas not captured by photographs and provide an additional mode of communication for adolescents. Sample From August to November 2012, 72 families who completed the MySteps® intervention and consented to future contact were telephoned to determine adolescents’ willingness to participate in this follow-up study. Families who agreed to participate in the photovoice study also took part in a separate 30-minute interview about their experience in the MySteps® intervention. Ninety-six families completed the MySteps® intervention, but twenty-one adolescents were not included in the recruitment pool as they were already involved in another follow-up study and three families did not provide consent for follow-up contact. 87 It was anticipated, a priori, that the experiences of 25 adolescents would provide sufficient breadth for understanding the phenomenon of interest: how environment influences their healthful or less healthful dietary choices. The recruitment procedures were designed to enable purposive sampling, in that the participation of adolescents who varied by gender, age and ethnicity was sought to capture a range of experiences and perspectives;270 however, the limited recruitment pool and the willingness of adolescents to participate largely dictated the final sample of participants. Of the 48 families who were contacted by phone or email, 22 adolescents agreed to participate (50% response rate). Families declined because they were too busy or the adolescent was not interested, 14 families could not be reached, and 10 families were not contacted. Despite missing the recruitment target of 25, the final number of adolescent participants provided rich interviews and interviews reached the point where emerging data were redundant. Protocol At the outset, the protocol was refined through practice interviews conducted with one adolescent (a family friend of the researcher) as well as research staff. In all, adolescent participants attended two study visits at the BC Children’s Hospital Evaluation and Clinical Research Centre during scheduled appointment times (September 18, 2012-April 1, 2013). The instructional visit, which lasted 15 minutes, took place directly following an interview session related to another study that assessed their previous experience in the MySteps® intervention. At this visit, parent and adolescent consent and/or assent were obtained (consent forms found in Appendix B.1). Adolescents were provided with a digital camera and instructions on its use. A discussion on the ethics and sensitivity of the research technique was also initiated (Appendix 88 B.2). Five subject release forms (Appendix B.3) were provided to each adolescent so that they could get signed consent from any identifiable subject in their photographs (forms were checked against photographs taken at the second visit). Asking permission and respecting privacy when taking photographs was thoroughly discussed and encouraged. Adolescents were also provided with a letter that explained why they were carrying a camera and taking photographs in case a school official or other community member requested it (Appendix B.4). Adolescents were instructed to take photographs, over the course of the next one to two weeks, of things that made it easier or harder to make healthful food and drink choices. They were told to think about things they encountered when they were at home, at school and in the other places where they spend time in their community. A plastic card with these instructions was placed in each camera case as a reminder when they were taking photographs. Adolescents were also instructed to select five of their photographs to speak about during their next visit. These could be photographs that they liked best or felt were the most important. Based on previous literature and other researchers’ experiences,266,268,271,272 the number of photographs was restricted to encourage more thorough reflection prior to taking photographs,268 reduce redundancy that would likely occur with a large number of photographs268 and limit participant and researcher burden. Adolescents were also given a photo log (Appendix B.5) to record a description of what was depicted in each of the five photographs and where and why each had been taken. This log was returned with the camera at the second visit, along with any subject release forms collected. Photographs were reviewed to ensure that none included an identifiable individual without a corresponding signed consent form (all participants provided forms when required). An interview guide was used to conduct the semi-structured interview at the second visit (Appendix B.6). During interviews, each adolescent’s five photographs were uploaded and displayed on a computer screen and the 89 adolescent was asked to explain why the photograph had been taken. The adolescent was probed in order to gain a greater understanding of why the photograph was taken and how its contents influenced food choices in that environment. For example, after each photograph was displayed, adolescents were asked: Tell me about this photograph? Why did you take this photograph? What were you thinking when you took this photograph? How were you feeling when you took this photograph? Where was this taken? Does this happen a lot? Is this something that you think about or is an issue for you a lot? Additional probes were also used, for example, if no photographs had been taken at school, the adolescent was asked: You didn’t take any pictures at school, are there things that make it easy or hard to make healthful food and drink choices when you are at school? Can you tell me more about those? The adolescent was also asked to explain any photographs he or she wanted to take but had trouble taking. This is an important question as it is possible that some concepts are difficult to capture in a photograph. Each adolescent and parent was asked to sign a photograph release form outlining how the photographs would be used and giving permission for that use (Appendix B.7). Each adolescent was compensated in cash ($10 for the first visit and $25 for the second visit) and entered into a draw to win one of the digital cameras used in the project. Immediately after each session, a field notes form (Appendix B.8) was used to capture notes about the interview environment, non-verbal behaviour, overall impressions, topics or phrases that stood out, and any patterns emerging in the interviews. Field notes also provided an opportunity for self-reflection 90 and contributed an important step for contextualizing interpretations during the analysis phase.273 The interview sessions were recorded using two audio recorders. The purpose of the audio recorders was explained and adolescents were instructed to turn them off if they felt uncomfortable at any point during the interview; no participants chose to stop the interview. The average interview lasted 15 minutes; the shortest was seven minutes and the longest was 40 minutes. Addressing Power Relationships When conducting qualitative research with children or adolescents, it is important to consider how the power dynamic between researcher and participant will influence the data that are generated.274,275 The power imbalance experienced in the present study goes beyond the imbalance that exists between the researcher and participant because of the imbalance between adult and child (e.g. children have fewer legal rights, are younger in age, and are smaller in size).274,275 It is important to recognize that this power imbalance is embedded in the research process and to take steps to reduce it and empower the youth participant.274,275 Based on insights from the literature, several strategies were used to minimize the power imbalance in the present study: 1) youth participants had an active role in the research process and the use of photovoice methodology itself allows the participant to choose what photographs are taken and presented; 2) the interview was deliberately structured to allow the youth participant many opportunities to ask questions and clarify their intended meaning;276 3) participants were regularly told that they had an active role to play, that the interviewer had a genuine interest in their point of view, and that their perspective was important;275 4) participants were given some control over the interview situation (e.g. they controlled the tape recorder and told they could choose to turn it off if they 91 wished);274 5) non-verbal cues were used, including sitting at the same eye-level as the youth participant and being dressed in a casual manner.275,277 It should be noted that my relationship with the adolescents had already formed during the MySteps® study during face-to-face visits. This existing rapport may have contributed to increasing each adolescent’s comfort level during the interview. Despite efforts to minimize the power imbalance between me and the participant, power differences are embedded in the research process275 and will never be eliminated entirely. It is suggested that power dynamics change over the course of an interview as well as throughout a research project.264 Despite efforts to address power imbalance, it was something that was kept in mind both while conducting interviews and interpreting the data. After each session, notes were taken and they included any detection of a power dynamic in the interview. One or two adolescents seemed visibly uncomfortable or nervous during their interviews, suggesting that it may have been difficult for some to feel at ease talking with a researcher, particularly to talk openly about a sensitive issue, such as weight. Data Management Immediately after the interview, audio recordings and photographs were transferred to a secure computer server. Photographs from each participant were burned on to separate CDs and sent to each adolescent so that they had a copy of their photographic contribution to the research study. Audio recordings were transcribed verbatim by a professional service (Regent Office Services, Vancouver) as soon as possible after the visit (average turnaround time was 1.5 weeks). I reviewed each transcript against the original audio file to check for accuracy and make changes 92 when needed. Very few minor wording changes were made. To protect privacy, each participant was assigned a fictitious name for the analysis and presentation of results. Analyses During the present study, analyses involved both participants and researchers and occurred at several stages beginning with participant decisions about what photographs to take and selections of the most meaningful photographs to contribute.261,268,271 Logbooks completed by adolescents also served as a narrative interpretation of their photographs.268 Additional opportunities to verify interpretations occurred throughout the interview. Constant Comparative Analysis Transcribed audio interviews, photographs, and photo logs were analyzed using directed constant comparative analysis.278,279 Constant comparative analysis is a systematic method of identifying or coding data into categories or themes. It involves an iterative process, where the data are constantly revisited after the initial coding to revise previous coding and to determine when no new themes are emerging. Traditionally, coding is derived inductively from the raw data. In a directed approach, coding is guided by a framework, but also provides opportunities for researchers to immerse themselves in the raw data so that new themes can arise inductively.280 This type of analysis uses both inductive and deductive reasoning to categorize and interpret the data.273 A directed approach was chosen so that current theoretical models explaining the influence of the food environment could be tested (i.e. socio-ecological model), further described and potentially extended for this population. The initial coding scheme for the present study (Appendix B.9) consisted of codes derived from the theoretical framework introduced previously (Figure 2-1; Figure 2-2). New codes could also arise inductively, allowing 93 adolescents’ new or unique phenomenological descriptions to be co-created, captured and interpreted.281 Fully transcribed transcripts, photographs, and photo logs were imported into Nvivo 9 qualitative data analysis software (QSR International Pty Ltd. Version 9, 2010) to assist with organizing and analyzing the data. Coding occurred in two stages: 1) to code data from the original transcripts into broad themes/categories and 2) to examine text belonging to each theme/category in order to refine the themes into sub-categories/themes. In Stage 1, the first fully transcribed text and photo log were read in their entirety and then coded to identify each idea emerging from the text. The initial (Appendix B.9) and final (Appendix B.10) coding schemes were recorded in a document that listed each code and its definition. This document was constantly updated throughout Stage 1 as codes were refined or new codes emerged. As each subsequent transcript was analyzed, the previous coding was reviewed and revised where necessary. In Stage 2, a more inductive approach was used to refine themes and develop subcategories. Text belonging to each theme/category was grouped and read to further refine coding and interpretations. Each transcript was also coded for the participant’s age group (11-13 and 1417 years old) and gender so that thematic patterns by age and gender could be explored. Since there were a disproportionate number of females, and only a small number of participants, differences were mainly identified by the presence or absence of themes between groups. Three researchers were involved in the analyses: the author, Dr. Chris Lovato (CYL) and Dr. Louise C. Mâsse (LCM). After the first interview, CYL reviewed the audio recording. Halfway through the interview process, the first five transcripts were reviewed by LCM to gauge the breadth of information being collected. Each of these exercises served as an opportunity to adjust my interview techniques or questions/probes for use in the remaining interviews. Coding 94 began after 11 interviews had taken place. CYL double coded 10 of the transcripts (45%) using printed copies of the transcripts and photographs with coloured pens used to identify and distinguish themes. The first three transcripts were coded together for the purpose of training and making protocol decisions about how the transcripts would be coded; the remaining seven were double coded independently. During the second stage of coding, all quotations associated with each theme were examined and themes were refined in consultation with LCM and/or CYL. When applicable, LCM or CYL was involved when any discrepancies or uncertainties arose. The final themes that emerged were modified into survey items and were sent to one female and one male participant by email (Appendix B.11). For each item, participants were asked: “Is this true for you too?” with response options of “yes”, “sometimes”, and “no”. Trustworthiness In qualitative research, a study’s trustworthiness, or rigour, can be assessed in relation to concepts of credibility, dependability and confirmability, and transferability.282 How each of these concepts was addressed in the present study is summarized below. 1) Credibility — ensures that the results represent, as closely as possible, the true experiences or interpretations of the participants.270 During the interviews, ideas were repeated back so that the participants could confirm, or disconfirm, the initial interpretations. This process helps to ensure interpretations of participants are as true to their experiences as possible.264 To ensure coding and interpretations were true to the raw text, a large portion of the coding was done by more than one researcher and emerging interpretations were discussed with a larger research group (a third researcher (either LCM or CYL), research assistant, and my committee members). Also, data were collected through photographs and interviews to allow for triangulation of both visual and 95 verbal interpretations. Lastly, contact and engagement with the adolescent participants occurred several times before the interview, through the previous project and the initial instruction visit. This relationship development and the attempts described above to minimize power differences (e.g. giving adolescents an active role in the research and taking care with body language) helped to increase the credibility of the findings. 2) Confirmability and Dependability — ensures that the findings are true to the data.270 In qualitative research, there can be numerous interpretations of the same data;270 however, dependability is sought to ensure that interpretations are consistent with the data that are collected. Since the researcher becomes the data collection instrument in qualitative research,270 reliability of the researcher was improved through training and practice and the contribution of other perspectives. In the present study, double coding and consultation with a third researcher provided multiple perspectives on how to interpret the data; however, no research is without bias from the researcher’s own perspective. This is also true of quantitative methods where variable selection and interpretation depends on what the researcher thinks is most important. In addition, the group of researchers who made up my thesis committee and have diverse training and backgrounds, were invited to provide input on the interpretation of the final coding structure to further enhance credibility. A proportion of the transcripts was double coded, and between-coder coding consistency was calculated to be 63%. Coding consistency was calculated by hand by adding the number of themes identified by both researchers, and dividing by the total number of themes identified for each double-coded transcript. Discrepancies were reviewed to achieve consensus. A detailed coding document was maintained to make it clear how the data were interpreted (Appendix B9 and B10). All quotes coded to a particular theme were then reviewed by both researchers to ensure consistency in coding and to further refine coding. An audit trail 96 consisting of field notes and memos taken over the course of the data collection and analysis phases was used to confirm and expand upon the interpretations. Triangulation of text with photographs helped to confirm the emerging interpretations and final results were presented to two participants as a form of confirmation. Merriam et al. describe this process as the presentation of findings to some participants to see whether they “ring true.”270 Themes were rated as “true” or “sometimes true” for 78% and 91% of the items for the male and the female member check participant, respectively. This exercise in verification was very limited and provided only a crude sense of agreement. The limited value of verification is recognized in the literature as one would not expect each interviewee to recognize and verify each theme since they only contributed to a portion of the data.283 3) Transferability — Qualitative research serves to capture rich, in-depth experiences of a specific group of individuals. On the other hand, steps can be taken so that insights gained from qualitative research are transferable to as wide a group of people as possible. These steps include providing adequate information about the sample and procedures used so that users of the research can judge for themselves how applicable the findings are to their own group of interest.270 Adolescents varied to some degree in terms of their gender, age and ethnicity/culture, which may help to increase the applicability of results to other groups of interest. 5.3 Results A total of 22 adolescents participated in the photovoice study and their characteristics are compared to the MySteps® intervention study sample in Table 5-1. Adolescents ranged in family characteristics (e.g. parent education, income, ethnicity and marital status). A greater proportion of participants was female and from the highest income bracket, compared to the MySteps® 97 sample. In addition, when compared to the MySteps® sample, participants had lower baseline and final BMI z-scores, and similar adherence to the lifestyle modification program. Table 5-1 Participant characteristics: Comparison of adolescents who agreed to participate in the photovoice study with those who did not agree to participate Photovoice Participants (n=22) Age BMI z-score Start BMI z-score End Baseline Weight (kg) Baseline Height (m) Program Adherence # weeks logged in % of webpages viewed Female Sex Parent Ethnicity White Non-white missing Parent Education High School or less Trades or Other University Degree or higher Household Income ≤40,000 40,001-80,000 80,001-120,000 >120,000 missing Parent Marital Status Married/Common-law Divorced/Single/Widowed MySteps® Participants* (n=74) Mean±SD [range] 14.3 ± 1.9 [11-17] 13.0 ± 1.7 [11-16] 2.39 ± 0.55 [1.4-3.5] 2.71 ±.91 [1.1-6.0] 2.24 ± 0.72 [0.6-3.3] 2.65 ± 1.0 [0.8-6.3] 74.5 ± 14.2 [48.0-102.8] 83.1 ± 24.6 [50.1-175.8] 1.6 ± .09 [0.41-1.78] 1.63 ± .10 [1.41-1.95] 23.6 ± 10.0 [3-34] 45.6 ± 29.5 [2.4-90.1] 17 (77.3%) 21.3 ± 10.6 [1-34] 37.5 ± 26.6 [0-90.2] n (%) 38 (51.4%) 12 (55.5%) 10 (45.5%) - 31 (41.9%) 42 (57.8%) 1 (1.4%) 1 (4.5%) 8 (36.4%) 13 (59.1%) 13 (17.6%) 27 (36.5%) 34 (45.9%) 2 (9.1%) 5 (22.7%) 4 (18.2%) 10 (45.5%) 1 (4.5%) 12 (16.2%) 22 (29.7%) 24 (32.4%) 15 (20.3%) 1 (1.4%) 17 (77%) 5 (23%) 57 (77.0%) 17 (23.0%) *Adolescents who completed the 8-month intervention but did not agree to participate in the photovoice study (i.e. the pool from which photovoice participants was drawn). SD, Standard Deviation; BMI, Body Mass Index All participants were successful in taking photographs (mean number of photographs per participant was 4.6). One subject only had two photographs because she mistakenly took three 98 photographs of barriers to physical activity that were omitted. Another adolescent took 10 photographs, but selected five to keep and talk about before the interview started. In total, 100 photographs were taken: 65 at home, 17 at school and 18 in the community. It was anticipated that the home environment would stand out for these youths because the MySteps® study was a family-based intervention, but also because photographs would be easier to take in that environment. Some participants mentioned that they didn’t want to be seen with a camera at school or encountered difficulty taking photographs in the community (e.g. when one girl asked permission to take a picture at a grocery store she was told by management that she was not allowed). Despite these logistical limitations, adolescents had the opportunity to discuss all environments regardless of where they were able to capture photographs. Adolescents talked about environments within the home (425 quotes) and outside the home (456 quotes) with equal intensity. Adolescents talked almost equally about barriers and facilitators to healthful eating in the home environment (12 themes had at least one quote relating to a facilitator vs. 13 had quotes relating to a barrier) as compared to the school and community environments, where adolescents talked overwhelmingly about barriers to healthful eating (only four themes had at least one quote relating to a facilitator vs. 14 had quotes relating to a barrier). Figure 5-1 illustrates the primary themes that emerged from the data as they correspond with the socio-ecological framework depicted in Figure 2-1. In addition, Table 5-2 provides a general summary of the primary and secondary themes that emerged from the present study. 99 Figure 5-1 Socio-ecological framework of study findings 100 Table 5-2 Primary and secondary themes identified by 22 adolescents in the home environment and in the school and community environment (in descending order of frequency) Home Environment School and Community Environment Family Meals Cooking meals from scratch Family food preferences Meal routines Availability Types of foods available Lack of healthful options Availability Types of foods that are available Peer Influence What foods friends and peers are eating Fitting in Sharing with friends Events in places with a lot of less healthful food Parenting Practices Parent control Encouragement for healthful eating Child autonomy Rules and Restriction Indulgence and Permissiveness Negative emotions/reactions Accessibility/Convenience Accessibility to different types of foods Family Modeling Parent healthful and less healthful modeling Sibling healthful and less healthful modeling Price Available spending money Value of foods Celebrations Type and quantity of foods Social norms School practices Cooking course Treats used in class Accessibility/Convenience Accessibility of different foods Marketing Exposure to advertisements Placement/cues Screen Use and Studying Foods eaten in front of the screen or while studying Online World Source of ideas about food and eating 101 Home Environment Photographs and stories revealed seven themes within the home setting that influenced healthful eating. In order of frequency, the themes they talked about were: family meals, availability, parenting practices, family modeling, celebrations, accessibility/convenience, and screen use and studying. A more detailed summary of the categories and themes that emerged can be found in Appendix B.11. That summary includes the number of participants that talked about a particular theme, a quote that corresponds to each theme, and an indication as to whether a theme was talked about as a barrier, facilitator, or both. Family Meals Meals that were prepared at home were depicted as healthful, with VF, and as facilitators to healthful eating because participants could control what they were eating. Adolescents demonstrated this by photographing their family meals or individual food items that went into their meals (see photograph 5-1). Photograph 5-1 “When I cook, I cook with healthy ingredients and end with delicious results” Dan, 17yrs 102 Another adolescent talked about how she was able to make cookies in a more healthful way than if cookies were purchased. One adolescent noted that her friend’s parents buy frozen dinners that she thought were less healthful. One adolescent boy mentioned that healthful meals also need to taste good, while another recognized that the preparation of home cooked meals from scratch required him to develop cooking skills – an aspect of home cooking that others did not mention: I’m starting to get to that age where I really need to know how to prepare stuff on my own, and learning to prepare stuff that’s healthier rather than just microwaveable. (Dan, 17yrs) Adolescents described various types of household structures such as living with siblings, divorced parents (multiple household), grandparents, and homestay students. Adolescents explained that their food choices were not made in isolation and were impacted by the preferences of others in the family: [My sister’s] a really picky eater so my mom will usually cook something that she will like as well for the family. So, our nights kind of go like noodles, rice, noodles, rice, noodles, rice, noodles, rice, steak, noodles, rice… (Scott, 15yrs) Many adolescents talked about routines that their families had around meals. Some described routines that were helpful, while others described routines that made it more difficult: Every dinner that we have, we have a salad that goes alongside it (Dan, 17yrs) Our Thursday tradition is a little sushi place, right beside a pizza place and so they’ll go down and grab a couple slices of pizza and some sushi. (Scott, 15yrs) Adolescents took photographs of and described meal routines that were helpful such as fruit for dessert and salad with dinner. They also depicted less helpful routines such as fried foods, less healthful ethnic dishes, eating out, family baking and having juice with dinner. 103 Availability All but two adolescents talked about how foods made available at home impacted their food choices. Adolescents took photographs of the inside of their refrigerator or cupboards to illustrate the types of foods that were typically available in their home. Adolescents took photographs (see photograph 5-2) and explained that it was difficult to choose something healthful if there were less healthful options available, especially when there were lots of less healthful foods/drinks available and limited or unattractive healthier options: The food that we usually have like easily on hand and easy to get to is snacking stuff and stuff that’s less healthy, drinks that aren’t healthy too. (Scott, 15yrs) Photograph 5-2 “Corn dogs, croissants and Michelina’s Alfredo next to watermelon, hummus and coleslaw: It shows less healthy food next to healthy food. It’s representing that if there’s a lot of less healthy food and a lot of healthy food it would make me want to eat the less healthy food.” Rob, 12 yrs At the same time, adolescents said it was easier to make good choices if healthful foods were available at home, particularly when they had healthier alternatives or substitutions on hand: [The fridge] is always full of fruits and, yeah. I, like, pack them for lunch and have them when I come home from school too (June, 13yrs) Sometimes, however, having a lot of healthful food available wasn’t enough: 104 We also have a shelf that’s dedicated just for fruits and veggies which is always overflowing. [Interviewer: Do you like eating those?] Neh, the odd time, sometimes, yeah. Generally no. (Finn, 13yrs) Another adolescent girl pointed out that the options made available at home influence what she eats away from home: We can’t really go 100% just healthy because one way or another, I get what I want, so it’s kind of…if I go to school, if my friend says, “Hey, do you want this?” I’ll be like, “Yes.” Whether it’s a granola bar, anything that I don’t have at home, I’ll have that. (Rachel, 15yrs) Parenting Practices Adolescents described barriers and facilitators to healthful eating when parents tried to control their choices: If you’re just having something for dinner and it’s, like, healthy or not healthy, like, it’s not like you can change it necessarily because if that’s what, like, is made at home, then that’s what you’re going to eat. (Emma, 17yrs) It was helpful when parents prepared healthful family meals that everyone was eating and also if they asked adolescents for their input when deciding what healthful foods to purchase: She’ll ask us which [fruits or vegetables] do we not want ‘cause then we’ll eat them (Lindsay, 13yrs) Adolescents felt it was harder to make healthful choices when their own requests or other family member’s requests for less healthful foods were realized. Several adolescents described food availability or what they chose at home as not controlled by their parents: My dad just lets me take whatever I want [from the grocery store] (Suzy, 14yrs). These adolescents recognized that this lack of parent control was a barrier because they were tempted by all the less healthful food at home. On the other hand, many adolescents described some kind of rule or restriction that their parents imposed around eating. Some adolescents 105 described the restriction as helping them to limit less healthful foods, while others said it seemed to increase the appeal of restricted foods or made it difficult to control intake when the opportunity to have the restricted food arose (see photograph 5-3). Adolescents described scenarios where they would binge on certain foods when the food item was made available as a treat or when their parents were not paying attention or not at home: Having the house empty, I kind of just automatically link that with, “I can grab some food, go quick (Rachel, 15 yrs). Photograph 5-3 “I usually absent-mindedly wait till the house is empty to eat” Rachel, 15yrs Manipulative control by a parent (e.g. making the adolescent feel badly through comments or facial expressions) was described as a negative experience but it was not clear how it impacted food choices: My mom will walk up and like sigh and make stupid faces at me…my parents they make it quite obvious that I’m not healthy, so it’s sort of a negative way of pushing me to eat well. So my mom will basically make funny faces if I order something, so I will get healthier food. (Samantha, 16yrs) 106 Adolescents described parent support that made it easier to make healthful choices. Several adolescents felt supported when their parents verbally encouraged them to eat healthful foods, but this also presented a challenge as one adolescent pointed out: My mom tries to help me make better choices but sometimes I don’t listen to her…like sometimes it’s hard for me to talk, like I don’t like talking about stuff like that. (Tina, 12yrs) Siblings were also described as a source of verbal encouragement: If we’re at the mall, [my sister will] be like, “what are you getting to eat?”, and I’m like oh, “you know I kind of want like Chinese food” and she’s like, “go to Subway, get a sandwich, you don’t need that. (Violet, 17yrs) Family Modeling Adolescents took photographs of their parents or siblings and talked frequently about the kinds of foods they ate (see photograph 5-4). Photograph 5-4 “My sister eating chocolate- It tempts you to have some too!” Violet, 17yrs When parents or siblings liked to eat less healthful foods it was harder for adolescents to make healthful choices and indirectly increased their exposure to less healthful foods: When my brother buys a pack of chips it’s sort of hard to resist. He always likes to eat unhealthy. (Suzy, 14yrs) 107 Several adolescents described having siblings who were thin and could eat whatever they wanted: [My sister] kind of makes it hard I guess because she can eat anything and not gain like a pound. Like, I want to eat what she eats. (Tina, 12yrs) Thin siblings were allowed to eat less healthful foods without any perceived consequences resulting in jealously, resentment, and also temptation for overweight/obese adolescents. In addition to the increased temptation, adolescents talked about their sibling as people they could eat less healthful foods with and as people they needed to compete with in order to get a share of the less healthful food. For example: I know I want to get to it before [my brother] does ‘cause I know I won’t get any if he’s there first. So it’s kind of, “overdo it to the max” because I know he will too. (Rachel, 15yrs) In contrast, it helped adolescents when their parents or siblings modeled healthful eating because they felt like they were eating healthily together. For example: [My dad] just eats healthy with me (Jenny, 11yrs) More health-focused siblings were described as a motivation for the adolescents to be healthier. It is clear that it would help adolescents if the whole family ate healthily. Adolescents said that if their family members (siblings/parents) did not follow the same rules it was really difficult to be successful in choosing healthful foods. Also, it is a challenge when an adolescent is exposed to healthful modeling in one household but not the other. For example, Finn, talked about having healthful food available at his mom’s house, but lots of less healthful “yummy” foods available at his dad’s house: My mom’s into health and all that, but my dad isn’t. (Finn, 13yrs) 108 Celebrations Holidays and celebrations were portrayed as particularly challenging for adolescents because there was an excessive amount of less healthful food available to them and there was a social expectation or pressure to eat less healthful food. Photographs illustrated the type of less healthful food that they received, or consumed, during the particular holiday (see photograph 55). Photograph 5-5 “It’s hard to eat well when you have holidays mostly devoted to eating” Samantha, 16yrs Adolescents talked about the norms around particular holidays, for example at Halloween: It’s not like [you have to eat treats at Halloween] but it’s kind of, if it only happens once a year, might as well, like… should enjoy it. (Rachel, 15yrs) Eating on special occasions was also related to saving face. For example, eating dessert that company brings to your house for dinner because you don’t want to appear rude by not eating it: Like this time we were going to have fruit but then [our company] brought a cake and we didn’t want to be rude. So we ate it. (Lily, 14yrs) 109 Interestingly, almost all major holidays were photographed (Halloween, Thanksgiving, Christmas, Valentine’s Day and Easter) and all adolescents who discussed the holidays, highlighted them as barriers to healthful eating. Accessibility/Convenience Adolescents took photographs of foods in their house that were easy to access. Adolescents depicted healthful foods and beverages that were more appealing as easier and said they were more likely to pick something healthful if it was fast and easy to grab, such as pre-cut vegetables, fruits ready to grab on the table, or hard-boiled eggs in the refrigerator ready to take to school (see photograph 5-6). Photograph 5-6“These veggies are in our fridge all the time, and are often cut and ready to eat, as well. This makes it easier to eat healthy things at home and for lunches” Lindsay, 13yrs Likewise, if less healthful foods were perceived as less time consuming and easier to grab, like frozen pizza or crackers, they were harder to resist: The food that we usually have like easily on hand and easy to get to is snacking stuff and stuff that’s less healthy, drinks that aren’t healthy too. (Scott, 15yrs) 110 Less healthful foods that were also accessible were particularly hard to resist if adolescents did not have a lot of time or depending on their physical/emotional state: If I’m feeling really unmotivated what I’m going to do is I’m going to go, I’m going to grab like a frozen pizza and throw it in the oven and like pour a can of pop or something and do something easy, lay around, watch TV. (Scott, 15yrs) Parents influenced the effects of accessibility by the types of eating opportunities they provided for their children. The most common examples of parent support for healthful eating included making VF more enticing or convenient (e.g. by cutting them up, preparing servings for lunch, making them easy to spot) or ensuring that sweets were less accessible (e.g. by buying small packets as treats, or cutting up and serving fruit for dessert): Most of what’s in there is relatively healthy on purpose. So when we look for something to eat, we’ll get, like, vegetables or like, fruits are on the table already. Like, as I said earlier. So it’s faster to, than to try and find something that’s not as healthy. (Lindsay, 13yrs) One adolescent described his parents as always having fruit out on the table and encouraging them to eat it. A turning point for him was after the MySteps® intervention: They’ve kind of had [fruit on the table] for years, but up ‘til recently and then the My Steps program, my brother and I have, like, started, “Okay, well, we need to eat healthier. We got all this fruit. (Dan, 17yrs) Screen Use and Studying Adolescents took photographs of computers (see photograph 5-7), televisions, and school books and described eating less healthful snacks when they were in front of the TV or computer as well as while studying: I actually eat a lot more when I’m using my computer than I do [otherwise]. [I usually eat] stuff that I probably shouldn’t, like small snacks and stuff that tend to build up so like crackers or chips. (Scott, 15yrs) 111 Photograph 5-7 “It is so easy to mindlessly eat in front of the computer” Carrie, 17yrs Adolescents talked about “mindless eating” and felt that choosing less healthful foods occurred mostly out of boredom and habit but also because they were hungry after school, and while studying they are stressed, have limited time, or want to procrastinate: A lot of friends and myself can get really stressed out with our homework and when you’re stressed it’s like comfort food is probably not the healthiest stuff right, but it’s what you want to eat. (Scott, 15yrs) Although only a small number of adolescents talked about screen time as a barrier to healthful eating, it was highlighted by those adolescents who did discuss it. In addition, only older adolescents (14-17 years old) talked about this theme. School and Community Environment Adolescents talked about seven different areas of school and community environments that influenced their eating habits. In order of frequency, the themes they talked about were: availability, peer influence, accessibility/convenience, price, school practices, marketing, and the online world. Except for school curriculum and classroom practices, all themes were common to both school and community environments; therefore, themes across these settings were grouped 112 together. A summary of the categories and themes that emerged can be found in Appendix B.12. That summary includes the number of participants that talked about a particular theme, a quote from both the school and community that corresponds to each theme (if applicable), and an indication as to whether a theme was talked about as a barrier, facilitator, or both. Availability Almost all adolescents said that their school was a barrier to healthful eating because of the plentiful supply of less healthful food options in the cafeteria and in vending machines (see photograph 5-9). It was particularly common for adolescents to go to food outlets off school property to purchase lunch. Although some adolescents talked about healthful options available at the supermarket (mostly apples), the majority felt that they were tempted by less healthful options: Healthy choices [when getting lunch off school property]? No, there’s a Fresh Slice® down the road, there’s a burger place, no not really. It’s a pretty unhealthy area. (Scott, 15yrs) Photograph 5-8 “There are many vending machines around the school” Emma, 17yrs 113 Some adolescents said their schools were doing positive things (e.g. having a fruit and veggie program, offering healthful hot meals, and making changes to vending machines); however, despite positive changes in some schools, all adolescents stated that there remained numerous less healthful temptations at their school: [In the school cafeteria] they have, like, cookies and ice cream and chips and then, like, usually they have chicken strips and fries nonstop, you know. (Dawn, 12yrs) In addition to school, it was apparent that fast food outlets and other places to buy less healthful foods were all around and were embedded in the communities where adolescents spent their time. Within their communities, adolescents talked about fast food outlets, supermarkets, the mall, community centers, workplaces and convenience stores. More adolescents talked about availability of less healthful food only as opposed to a combination of both healthful and less healthful food, including at school: If I’m going to the cafeteria, then yeah, it’s sort of hard to [eat healthy], because there’s like, nothing healthy there. (Lindsay, 13yrs) Although healthful options existed, those options were much less plentiful and it was seen as more tempting to pick the less healthful option. One food outlet that adolescents described as healthful was Subway®. It was a common place that adolescents went to try to make healthier choices. Adolescents mentioned strategies that they used in order to avoid the temptation of less healthful food, particularly at school, such as physically not going near the places that sell food, not bringing money to school, or bringing lunch from home. In regard to lunch from home, adolescents felt that the food they brought from home was healthier than the food they could buy at school: 114 If I bring my own lunch it’s better than having to buy things which might not be as healthy. (Lily, 14ys). Peer Influence Adolescents took photographs of foods that their friends were eating or that they themselves were eating when with friends. This illustrated an association between friends and less healthful eating, in part because many of their friends and peers liked to eat less healthful things (see photograph 5-9). Photograph 5-9 “It makes me want unhealthy things when I see my friends eating them” Violet, 17yrs Seeing a friend eating less healthful things was described as a trigger for adolescents to want to eat them too: My friends have like, like crazy not-so-great lunches like cookies and cake and stuff that’s not so great…and I mean that kind of makes you want to have those kind of lunches. (Katrina, 13yrs) Secondly, many of these encounters with friends took place where less healthful food was readily available, leading one adolescent to describe it as matter of fact: [When at a Starbucks® meeting up with friends], if we’re there then I’m gonna most likely buy something. (Emma, 17yrs) 115 Adolescents talked about eating less healthful foods when they were at a friend’s house, when meeting up with friends, often at food outlets, or when attending an organized meeting/activity at a food outlet such as a Girl Guides meeting or a youth group activity: With my youth group from my church we, um, we went to the mall and we would buy our lunch from the mall and then go on a scavenger hunt. So definitely that was one of the less healthy days because, like, I had to buy my lunch there. (Dawn, 12yrs) In addition, adolescents felt like they needed or wanted to go along with what their group of friends was doing. Eating a less healthful treat was sometimes described as something you did to fit in: Oh, I probably shouldn’t have [ice cream] but all my friends are doing it. (Dawn, 12yrs) Going out for lunch, often to a fast food restaurant, was considered a social activity that their friends, and many other kids at school, liked to do. Fitting in also emerged as a facilitator to healthful eating in that it was easier when you had a friend who verbally encouraged you to pick something healthful or would eat healthful foods with you : I have a couple of friends who are like really into the healthy kind of thing, so it kind of makes me feel nice inside, like oh yea, I can have my salad with you. (Violet, 17yrs) Finally, on top of the social pressures created by the food choices of friends, friends were another source of less healthful food because adolescents talked about sharing their food with friends: Me and my friends, we all share everything. If somebody gets a drink from Tim Hortons®, then we all just like, take a sip, just share it all anyway. (Rachel, 15yrs) 116 Accessibility/Convenience Above and beyond the excessive availability of less healthful foods, these foods were particularly enticing when they were easy to access. Adolescents felt that if less healthful food was easier to access, that was what they would get. Easy access was particularly important, for example, when they were pressed for time, when a food outlet was closer to school or work (see photograph 5-10), or after a sporting event: We’re hungry after we play hockey for an hour, but nothing healthy is open and we don’t want to go home and cook at 11:00 o’clock at night. (Lindsay, 13yrs) Photograph 5-10 “It is one of the convenience stores around where I work, I think the Mac’s® makes it harder to eat healthy because there is mostly junk food there” Margot, 17yrs While at school, it is fast and easy for adolescents to buy less healthful food near their school: It’s just too convenient to go [across the street to Tim Hortons®] and buy myself a lunch, a muffin, or a doughnut or a cookie or French vanilla. (Rachel, 15yrs) The same was true for healthful choices. If healthful choices were easier to access, adolescents were more likely to choose them. Subway® was perceived as a facilitator to healthful choices when it was convenient and easy for them (e.g. across the street from work), otherwise, they 117 won’t bother going there. Convenience influenced what adolescents chose to eat for lunch. Some adolescents said it was easier to buy lunch from school because they don’t always have time or they don’t always feel like making their own lunch. Parents who made it easier, by helping to make lunch, facilitated healthful eating while at school. Price Adolescents described themselves as being sensitive to price by taking photographs of money they had with them or price tags on food items. Cost was described as something that they considered when picking what foods to eat. The influence of price on food choice was highly determined by available spending money. If the adolescents had the money, they “might as well” buy something. Most adolescents had a limited amount of spending money (e.g. $5 at any one time; see photograph 5-11) and so food choice was the result of having the money available, and being able to find something at that price point – often a less healthful item: Hey, I have another dollar, why not get this? And it’s 50 cents for a cookie. (Emily, 13 yrs) Photograph 5-11 “It’s hard to eat good quality food on a low budget. This $5 will most likely go towards a cheeseburger.” Samantha, 16yrs 118 At school, some adolescents talked about how they had to pay for water, or how water was more expensive than other less healthful drinks (see photograph 5-12). Photograph 5-12 “It’s cheaper to buy pop than it is water” Emily, 13yrs One adolescent girl talked about her reasoning when purchasing a drink to go with her lunch at school: I don’t want to spend a dollar fifty; I’ll just spend a dollar on a Fresca or something. And so it’s really, really tempting to just, this is going to sound weird, but it’s like “okay, so no, no, no, you should get the water” but then, I’m only going to spend a dollar. I’ll just grab a Fresca or a root beer. It’s always more expensive to buy water. (Emily, 13yrs) In addition, the places adolescents liked to go to for lunch were highly dependent on price, the cheaper the better in most cases. Many adolescents considered value. Since the amount of money available was generally small, it was even more important for them to maximize what they got for their money (including quantity): [McDonalds® has] like burgers for like a $1.75. So it’s like ridiculously cheap. And so if I have $5 I can still get that and maybe like a coke. (Samantha, 16yrs) 119 Similarly, if something would fill you up or tasted good, then it was worth spending money on, as opposed to a salad or water. One adolescent girl proclaimed: I’m not going to pay to be healthy. I’m going to take it from home if I’m going to eat vegetables, you know. Not just, oh, I’ll pay $3 to have a salad. I don’t, I don’t do that. (Rachel, 15yrs) Some adolescents also mentioned that they were interested in spending money on what they couldn’t get at home. A few adolescents realized that they should try not to buy junk food anymore because it was wasting their money and they should save it for something else. School Practices Several adolescents mentioned that they were enrolled in a home economics course (called “foods class” by the adolescents) at their school. They said that this class was a problem because they made mostly less healthful foods and perceived they were required to consume the foods they made. For some adolescents this was particularly challenging: Well I’m in a foods class and [my teacher] likes to have us cook like really unhealthy foods. And at the beginning of the year I was eating a lot more, I tried to cut back but she would do like a week and we would make like three pies in a week or something crazy like that and so that probably wasn’t helping. (Scott, 15yrs) In addition to foods class, some teachers used treats, including ice cream and pizza, during class as teaching tools or for social activities (see photograph 5-13). 120 Photograph 5-13 “Our math teacher likes to give us a lot of candy, and food which sometimes makes it hard to make good choices” Lily, 14yrs One adolescent described the challenge she faced with the weekly student-supplied snack break that occurred in one of her classes: My friend and I, like, we tried to ask if we could like, bring in healthier foods rather than like, cupcakes and stuff, but no one else really wants to…my teacher, kind of like, wants us to bring in healthier foods as well. But no one else really wants it. (Lily, 14yrs) Marketing Adolescents took photographs of advertisements that they saw at school (see photograph 5-14), on the TV or computer, or in their community. 121 Photograph 5-14 “All the windows [in the school cafeteria] have posters like this, and so people want to go there. None of them show healthy foods, and there is only one salad in the caff [cafeteria]” Lindsay, 13yrs Adolescents expressed frustration with being exposed to advertising in a variety of locations, including at school, and perceived them to be a trigger for selecting less healthful foods: I just took this picture [of the candy aisle at the convenience store] because it is really colourful and it makes you want to buy some. When there’s new flavours I would like to try some. I just like the colours (Suzy, 14yrs) No two adolescents talked about the same type of advertisements, but a wide variety were mentioned including online, TV and billboard advertisements, and posters within schools: Almost every window [in the cafeteria] has a poster similar, except that they’re all for stuff like ice cream or French fries or whatever, and so then when people go in, that’s what everybody wants to get. (Lindsay, 13yrs) In addition to advertisements, other marketing strategies were discussed that gave rise to temptations to consume less healthful foods. One adolescent describes the placement of sports drinks in a vending machine just outside her gym class at school, tempting her to buy one: I think that it’s very clever placement because [the vending machine] it’s right outside the gym which makes it harder to not want it because you’ve just been doing exercise. (Lindsay, 13yrs) 122 In the community, adolescents talked about the location of outlets or their advertisements such as when they were driving with their parents to and from school or sporting events, and it is where they often congregated to spend time with friends or at community events. One such marketing strategy included the cue of smell: There’s always like the smell of McDonalds® fries that haunt you. (Violet, 17yrs) Adolescents were also influenced by brand awareness (see photograph 5-15).: Photograph 5-15 “When we see the McDonald’s sign, we think about the delicious burgers” Suzy, 14yrs Online World A new environment that emerged from the present study was the internet, or online world. Social media or access to information was talked about as both a barrier and facilitator to healthful eating. Although relatively few adolescents mentioned the online world (n=3), their thoughts were quite interesting and new. Barriers included being exposed to pictures of less healthful foods through photographs posted on Facebook®: Like I don’t see too many people who post a picture [on Facebook] like wow, hey, I’m eating a salad. (Violet, 17yrs) They were also aware of online advertisements that popped up while surfing the web: 123 I don’t know what website I was on but McDonalds® ad popped up. I’ve had Tim Hortons® pop up, I don’t remember what else but it’s been very often and then I’m like well I wouldn’t mind, I’d go for a burger now. (Violet, 17yrs) Facilitators to healthful eating included apps or websites that provide nutrition and/or exercise information, particularly if it’s connected to social media where friends can also vouch for, or be seen as also interested in, a particular topic or idea: It’s a twitter® for fitness and nutrition. They post links of things that are generally healthy for like healthy stomachs and I guess like that. Then when you go through you see your friends’ tweets and then you see their tweets and they retweet some things that help you too. (Margot, 17 yrs) 5.4 Discussion The aim of the present study was to explore overweight/obese adolescent perceptions of barriers and facilitators to healthful eating within home, school and community environments. The study is the first to focus on environmental influences on healthful food choices across settings utilizing photovoice methodology and phenomenological inquiry. This methodology served to develop a deeper understanding of the experiences of overweight/obese adolescents who have presented for a family-based lifestyle modification intervention. The broad themes that emerged from adolescent photographs and stories are supported by socio-ecological theory and align with the theoretical model of eating behaviour described by Story et al.11 and used to inform the present study. Factors across physical, social and macro-level environments were described as influencing healthful eating among overweight/obese adolescents highlighting the large number of factors, and multiple-levels of influence, on healthful eating. Of interest, adolescents identified both barriers and facilitators of healthful food choices in their home and provided insight into several areas where parents could play a role in facilitating healthier eating. In contrast, outside the home, adolescents talked almost exclusively about scenarios that 124 discouraged healthful eating. Although healthful choices can be found in most schools and communities, adolescents in the present study rarely acknowledged them and talked most about all the “junk food” that is available. The prevalence of perceived negative influences might reflect the high visibility, value and promotion of these foods. The large number of barriers to healthful eating described in school and community settings may be of particular concern for adolescents with less than optimal home food environments since adolescents have described limited opportunities, perceived or real, for healthful eating outside the home. Home Environment Family Meals The literature has linked sitting down together for family meals with better dietary quality,92,244 positive psychological wellbeing98,244 and weight status,96,244 with effects that persist into young adulthood.97 In the present study, adolescents did not speak about the act of eating together as an important aspect of family meals. Instead, they focused on the quality of the food that was served, food preparation, the control that parents had in their home environments, and the preferences of other family members. Most commonly, family meals facilitated healthful eating when they were made from scratch, involved positive routines (e.g. serving a salad), and when other family members enjoyed healthful foods. Family meals could also be a barrier to healthful eating if other family members were ‘picky’ or enjoyed less healthful foods and when families had less positive routines (e.g. getting take-out and not cooking meals from scratch). A study examining the types of foods served at family meals found that 28% of meals contained a green salad, 70% contained fresh vegetables and 21% were comprised of fast food two or more times per week.100 Barriers to healthful meals were also examined and included educational 125 attainment, stress, depression, low family functioning, low enjoyment of cooking, low value of family meals, high barriers to food purchasing, and fewer hours spent in food preparation.100 In the present study, home-made meals that also tasted good were identified as being important to adolescents’ willingness to consume these foods, a finding that is supported by previous qualitative research with adolescents.107 Adolescents’ own cooking skills were rarely talked about as an aspect of home cooking, but one adolescent connected food preparation to his sense of growing independence, a concept that emerged as the primary theme identified by adolescents in another study of home cooking among families in BC, Canada.284 A previous qualitative study found that adolescents had little involvement in food preparation and perceived their healthful eating to be dependent on parent food preparation skills without which they would not be able to maintain a healthful diet.85 The authors of that study suggest that developing cooking skills may increase perceived control and efficacy,85 and indeed, involvement in home meal preparation has been previously associated with adolescent food preferences,285 self-efficacy285 and better dietary quality.286 It is important for families of overweight/obese adolescents to prioritize home-cooked family meals and encourage adolescents to take part. Encouraging adolescent participation in meal preparation will not only reduce the burden on parents, but also contribute to developing skills for healthful eating as adolescents grow. Educating parents and adolescents on how to prepare homemade meals that taste good should be incorporated into intervention programs. Parenting Practices There is a considerable body of research examining how parenting practices, including rules and feeding styles, impact children’s dietary intake and weight status.17,83,249 Study findings in this area have been mixed and suggest modest effect sizes.83 As has been found in previous 126 studies, child autonomy, parent encouragement, restrictions and rules, and indulgence/permissiveness were identified by adolescents in the present study. These findings also demonstrated that adolescents react differently to parenting practices. Some adolescents described restrictions or limits as helping to control their eating. For others, restricting less healthful foods had the consequence of making these foods more appealing, motivating adolescents to eat these foods at a later time, and hindering self-regulation. For example, when no one was at home, it was an opportunity for many adolescents to eat less healthful or restricted foods. High levels of parent restriction or control over desirable foods may lead to increased desire and intake of those foods when they become available.81,84,85 In adolescence, growing independence and autonomy makes the influence of parenting strategies particularly difficult to establish, as was described in interviews with parents of overweight/obese adolescents.287 Family Modeling Parent modeling of desired eating behaviours has been found to be a more consistent and successful method to improve a child’s diet than attempts at parent control.288 Many adolescents in the present study described parents or siblings who modeled less healthful eating, suggesting that healthful modeling remains a challenge for families seeking pediatric weight management. Researchers who have interviewed parents of children and adolescents who are overweight/obese found that parent modeling was a key piece of advice they wanted to share with other families.287,289 Siblings were not mentioned in their research. In light of both previous research linking parent modeling to adolescent diets287,288,290 and the descriptions provided by adolescents in the present study, it would be beneficial for the whole family, including siblings, to practice healthful eating. 127 Availability and Accessibility As has been found in previous studies, availability of healthful and less healthful foods or beverages at home was the most frequently described influence on food choice. In a study of 4000 Minnesota adolescents, the strongest correlate of VF intake was home availability of VF along with taste preferences.119 Similar relationships have been found with the availability of SSB110,239 and energy-dense snack foods,40,238 although not all studies report positive associations, or associations are not present for all food types.73,118 As it relates to behaviour change, home availability has been found to promote healthful changes in VF,111 energy-dense snack111 and SSB consumption;121 thus it may be important to include home availability in treatment and intervention programs. Adolescents in the present study explained that they often found it difficult to make healthful choices. This was because less healthful foods were readily available and healthier options were often limited and/or unappealing. It is important for families with overweight/obese adolescents to provide as many healthful foods as possible but also to ensure limited or no availability of less healthful foods in the home. Parents may be able to support healthful eating through their purchasing decisions and by encouraging healthier alternatives or substitutions for less healthful foods since both of these strategies were described as helpful by several adolescents. Interventions that educate and support parents in making healthier purchasing decisions are warranted, although financial constraints may be a barrier for some families. Such education-based interventions have been successful at increasing perceptions of healthful food affordability among low SES mothers in Australia,251 which may lead to changes in purchasing. In addition to availability, accessibility, particularly of VF, is an important determinant of consumption.109,114 Although the majority of studies involve younger children who generally 128 have less control over meal/snack preparation, accessibility also emerged as an important theme in the present study. Practices such as having fruit on the table or cut up vegetables were described as facilitators to healthful eating. Accessibility or convenience of less healthful foods at home was also described as increasing consumption. Previous qualitative research has identified foods that are convenient or “handy” as preferred122 and the convenience of healthful foods at home as extremely helpful.107 Both availability and accessibility of food options need to be considered for promoting healthful eating and discouraging less healthful eating among adolescents. Celebrations Interestingly, almost all major holidays were photographed (e.g. Halloween, Thanksgiving, Christmas, Valentine’s Day and Easter) and described as barriers to healthful eating. Special occasions spanned major holidays, birthdays, parties, barbeques and dinner with guests. Holidays were intertwined with eating, often rich desserts or treats, and were difficult times for adolescents who were trying to make healthier eating decisions. On these types of occasions, adolescents are not only tempted by the availability of less healthful foods, they are also expected to follow social norms. Families may want to consider de-emphasizing treats over the holidays, particularly as gifts; adolescents already have so many opportunities to consume these foods. An alternative strategy might be to make family activities a focus of special occasions. Since no data collection occurred over the summer months, it remains unclear how holidays and celebrations over the summer influenced the eating habits of adolescents in the present study. No previous qualitative study has reported that holidays or celebrations were barriers to healthful eating; however, social pressures to eat less healthful foods and the use of 129 less healthful foods as treats or rewards, both of which occur during holidays or celebrations, have been described by adolescents in previous studies.85 Screen Use and Studying The final theme that was identified by a small number of adolescents was screen use and studying. The literature has identified associations between screen time, poor diets111,118,291,292 and obesity,293 although, a meta-analysis has shown the effect on body fatness to be low.294 A recent longitudinal study following adolescents from 14 to 18 years of age found that higher screen time was associated with increased BMI and was stronger at higher BMI levels, suggesting this may be a more important influence for overweight/obese adolescents.293 Indeed, in the present study, adolescents described eating less healthful snacks when watching TV, using their computer, or playing video games. Adolescents talked about a variety of reasons for this behaviour including boredom, lack of awareness, hunger after school (when they often sit down to watch TV or go on the computer), stress, and social reasons (this is a time for hanging out with friends). Previous studies have identified distraction and a lack of awareness as factors contributing to overconsumption while watching TV.295 Commercials may also increase cravings for particular foods.296 Similar to screen time, studying was associated with less healthful eating behaviours and has not been documented previously. Furthermore, only older adolescents mentioned screen time and studying as barriers to healthful eating. This was surprising, but perhaps reflects the increasing prevalence of screen use and studying, as children age.297 130 School and Community Environments Peer Influence Away from home, the social environment of adolescents consists of their peer groups. The behaviour of peers and the location and context of social engagements were what adolescents talked about in relation to healthful eating. Most adolescents described their peers as modeling less healthful eating and in general as barriers to healthful eating. Of interest is that many peers were described as being thin and/or not concerned about their weight, but still choosing to eat less healthful foods. There is growing interest in social network analysis, with results suggesting that adolescents with similar weight-related behaviours group together 131,298 and that adolescent obesity spreads through social networks.299 Associations in breakfast, wholegrain, dairy and vegetable, but not fruit intakes have been found between adolescents and individuals identified as being a best friend or as a member of their group of friends.132 In a similar social network study with a representative sample of US adolescents, fast food consumption, but not breakfast, VF or calorie-dense snacks was associated with the intake of friends.131 A small experimental study with 10-12 year olds (n=39) demonstrated that only overweight youth were influenced by the presence of peers and were more likely to consume a healthful snack if a peer did so as well,134 perhaps suggesting that overweight youth are particularly sensitive to peer influences. In fact, a review of social network analyses found that adolescents with the highest BMI had the most similar eating behaviours.133 Other studies have not found an association between the perception of a friend’s less healthful food intake 127 or low fat snack purchasing130 and an adolescent’s own behaviour. Based on what adolescents talked about in the present study, friends may transfer eating habits because friends increase cues to eat (e.g. from seeing those foods more often), adolescents want to fit in with their peers, and because 131 adolescents typically share their food. Very few adolescents mentioned that friends model healthful eating in the present study, although some did. If healthful eating were adopted by a small number of friends, it may influence the entire network of friends to eat more healthily. Increasing social support among friends for healthful eating may be a promising strategy to incorporate into interventions. Availability and Accessibility The school food environment was described by most adolescents as a barrier to healthful eating. Schools provided access to a lot of less healthful foods that were tempting for adolescents. Less healthful foods were easy to access at school and healthier options were often hard to find, less convenient, more costly, or less appealing (e.g. bruised apple). These characteristics were also found in food options at locations surrounding schools and throughout the community in general. To what extent these food environments are perceptions as opposed to reality was not assessed and adolescents took very few photographs of the actual foods sold at school or in outlets near to the school. A recent examination of principal-reported food and beverage availability in BC schools revealed reduced offerings of less healthful foods at the time this study was conducted, although many schools still offered less healthful options (e.g. 45% of middle and high schools offered SSB, 22% did not offer fruit and 44% did not offer vegetables).140 In the present study, adolescents recognized that some healthful options existed, yet they were much less plentiful and it was tempting for adolescents to pick less healthful options. Among a nationally representative sample of elementary and high school students in the US, almost half of students consumed low-nutrient, energy-dense foods obtained at school, and greater availability at school was associated with consumption.137 In addition, the authors also 132 reported that a proportion of less healthful foods, including chips/salty snacks, candies and SSB, were consumed at school but came from non-school sources.137 Over half of schools in BC are within a 10-12 minute walk from a food outlet300 and a recent Canadian study demonstrated that as the number of food outlets within a 1km radius of high schools increased, so did the odds that grade 9 and 10 students (n=6,971) consumed their lunch from a food outlet.136 Since many food and beverage items that adolescents consume at school also come from home,5,137 families also have a role to play in improving the quality of foods that adolescents consume while at school. Of note, adolescents described lunches from home as being healthful, but some mentioned that time constraints made it difficult to pack a lunch. A study among elementary schools in Prince Edward Island, Canada, found that lunches from home were lower in energy, fat, and sugar but higher in sodium than school lunches,125 while a study conducted in UK high schools revealed school lunches to be of higher nutritional quality than lunches brought from home.301,302 These differences will depend on the policies in each jurisdiction regulating the types of foods offered in schools; however, both of these studies noted that lunch quality was poor in general, regardless of the source.125,301,302 School Practices Food classes provide an opportunity for schools to generate interest and skills in preparing healthful meals and snacks; however, they were identified as a barrier to healthful eating by adolescents. These classes were a barrier to healthful eating because adolescents described making less healthful foods (e.g. desserts, fried foods) and perceiving pressure to consume the foods that were made. In addition, foods provided to students as treats or as teaching tools were described as being less healthful (e.g. candy, pizza, ice cream). In a study of 133 US adolescents, student BMI was positively associated with less healthful school food practices, based on scores that included the use of less healthful foods as rewards or treats.303 Despite these findings, little research has been conducted on this practice.304–306 It was a surprise to hear about less healthful classroom practices in the present study. The most recent school guidelines for food and beverage sales in BC include recommendations for limiting less healthful foods offered in classrooms (http://www.bced.gov.bc.ca/health/2013_food_guidelines.pdf); however, the extent that this component of the guidelines is being implemented is unknown. As a whole, these findings are of concern because they suggest that adolescents are exposed to a flood of less healthful foods over the course of a school day. Adolescents talked about the availability of less healthful foods and beverages in schools through the cafeteria, vending machines, student-run stores, school events, and at food outlets near the school. Evidence suggests that the foods and beverages offered in BC middle and high schools has improved in the last five years; however, many schools continue to sell less healthful food/beverages or do not sell healthier options such as VF.140 These data do not include information on the food/beverages offered through classroom parties, but do suggest that schools may be struggling to offer healthier foods at special events and fundraising.140,307 Limiting the amount of less healthful foods and beverages available in schools, from all sources, could benefit overweight/obese adolescents, particularly those who are trying to make changes. Making changes to the school food environment is not without substantial challenges, and changes to the school food environment need to be supported by families and the broader community. For example, an adolescent in the present study reported that classmates were unwilling to eat VF brought in for a classroom snack, and other research has suggested that eliminating less healthful food at school may result in more purchasing from outlets off school property or bringing less 134 healthful foods from home.13,307 In contrast, two studies have found no evidence to support compensatory eating behaviour at home.308,309 There is a competing mix of food options surrounding schools300 and in the community310 in BC; yet adolescent participants in the present study struggled to select healthier options given that other aspects of the environment (e.g. convenience, marketing, price, and peers) also contributed to their selection. Outlets that are perceived as providing healthier food options, including Subway® and the grocery store, were described as popular, but they too offered less healthful options that adolescents described purchasing, thus, limiting their ability to promote healthful eating. To address food purchased at outlets near schools, a closed campus policy may be a promising strategy. High school students in the US who attended schools with closed campus policies (i.e. not allowed to leave school property at lunch) consumed significantly more vegetables (not including potatoes),137 fewer servings of SSB,137 and were less likely to eat lunch at a fast-food restaurant.311 Moreover, a 12-week multi-component intervention in Canadian high schools that aimed to keep students at school for lunch (e.g. messages and tools distributed to students, teachers, and parents; cooking sessions; play theatre at lunch) was successful in reducing the number of days students left school property for lunch as compared to control schools.148 Schools and their surrounding environment, thus, present potential opportunities to improve support for healthful eating of overweight/obese adolescents. Price Adolescents identified themselves as being sensitive to price and considered value when making food purchases, a finding supported by economic studies163,165 and previous research asking adolescents about perceived barriers to healthful eating.107,122 Of particular concern for 135 adolescents in the present study was the extent that price undermined healthful food choices, particularly at school. Experimental studies in US high school cafeterias and vending machines have demonstrated that lower prices for fruit, carrots and low fat snacks increased purchases of these same foods substantially,161,312 although no difference in salad sales was observed.312 It was surprising that some adolescents were very resistant to purchasing any healthful food items, but their resistance may reflect their desire for independence.254 For example, they wanted to use their money to buy treats that differ from what their parents buy or allow. Indeed, adolescent girls have been found to relate junk food with the opportunity to distance themselves from their parents and become closer to their peers.254 In another study, adolescents who described more control over their eating also described less healthful eating patterns.122 It remains important for adolescents to learn to make decisions about spending money, but their sensitivity to price in combination with the abundance of less healthful foods that are inexpensive poses a significant challenge. It is difficult to influence food prices in the community, although taxation of less healthful foods has been proposed.313,314 Schools may be able to make changes, particularly around water. As was described by some adolescents, water is difficult to access at school because it must be purchased or free water fountains are old and broken or too difficult to drink from. Supplying free water, through easily accessible and modernized drinking fountains, may help to encourage more students to drink water instead of higher calorie beverages. Furthermore, given that pricing strategies in the school setting have shown promise elsewhere,161,312 schools in BC and elsewhere may want to consider ways that the cost of healthful foods can be reduced. 136 Marketing TV, print and digital marketing of foods to children and adolescents is pervasive,170,171 is primarily for less healthful foods170 and, as some evidence suggests, is associated with the intake of less healthful foods.172 Adolescents in the present study confirmed that exposure to advertising in a variety of locations acted as a trigger to pick less healthful foods. They talked about being affected by different types of marketing, ranging from package colouring to advertisements, including posters within their school. In the Canadian setting, high school students in Alberta who reported seeing logos for food/beverage companies at their school had higher odds of purchasing foods and beverages and consuming salty snacks and candy.176 Many jurisdictions, including BC, have produced school guidelines that encourage, but do not mandate, schools to eliminate food and beverage marketing (http://www.bced.gov.bc.ca/health/2013_food_guidelines.pdf). Again, the extent to which schools have implemented this component of the guidelines is unknown. Likely, school audits would be needed to evaluate implementation. The results of the present study suggest that, at least in some schools, marketing continues. In Quebec, where they have enacted bans on advertisements targeting children 13 years of age and younger across all settings, including TV advertising, a decrease in household fast food purchasing has been demonstrated.315 Although few policies have been enacted, a call to strengthen policies that restrict food promotion to children at all levels has been urged by the WHO316 due to its detrimental effect on children’s diets and future chronic disease risk.168 137 Online Influences Only three adolescents talked about social media; however, their insights are of interest given the growing use of the internet and social media for delivering lifestyle behaviour change interventions to youth (e.g. E-health interventions).317 These technologies are of interest as they are scale-able, they take advantage of a medium that is popular with youth, and they may provide added motivation (e.g. health messages can be sent and subsequent behaviour can be monitored in real time). The role of social media in weight management has only been described for adults,318 but online can be conceptualized as an additional environment/setting where adolescents are exposed to information and social influences about healthful eating.319 Things that are “cool” and that friends share online may be particularly influential and images of friends eating less healthful foods may amplify social norms that promote less healthful eating. Of note, a successful school-based intervention to promote eating lunch at school included messages sent via Facebook,148 suggesting their potential value at reaching and engaging adolescents in health promotion strategies. Further studies examining the role of social media and the internet in dietary choices are needed. Interconnections Socio-ecological theory emphasizes the connections between multiple levels of influence including at the individual level.11 A phenomenological inquiry was particularly useful in capturing these connections. Phenomenology brought adolescent perspectives to the fore which allowed for detailed descriptions of the interactions between adolescents and the environments in which their eating behaviours occurred. The present study did not set out to investigate how individual factors interact with the environment, nor were adolescents asked about this; however, 138 through their stories, it was clear that individual factors also influenced their food choices. Adolescents talked about their preferences, cravings/temptations, hunger, knowledge, perceived benefits, time constraints and psychological factors (e.g. stress, boredom, mood) and other health behaviours (e.g. physical activity). These individual factors have been depicted in previous qualitative studies that examined adolescent food choice.85,107,122,256–258 The interconnections between the various levels of influence depicted in the socioecological model is difficult to study,320 but a phenomenological approach was useful for capturing this complexity and generating new knowledge about how various factors may be acting to influence an individual. Thus, this inquiry was relevant for studying the multiple levels of influence and the connections between levels that are depicted in the socio-ecological model of adolescent dietary behaviours.11 In the present study, conversations with the adolescents revealed many connections across settings and between social and physical influences. For example, the home and school setting were intertwined because food eaten at school can be brought from home; therefore, parenting practices and the home environment impact how adolescents will eat at school. Eating decisions also occur across settings. For example, adolescents reported being tempted to eat certain foods when out in the community or at a friend’s house if they were not available at home. Little is known about adolescent compensatory eating between settings; the few studies that have looked at compensatory behaviour between home and school suggest it doesn’t occur.308,309 Physical and social influences were also intertwined. In the home setting, food and beverage availability was influenced by many factors, including the food preferences of siblings and parents, purchasing behaviours, nutrition knowledge, and preparation skills. These factors also interacted with holiday traditions or screen 139 use to create barriers to healthful eating. Examining the social and physical influences on eating behaviour simultaneously is needed when addressing barriers and facilitators to healthful eating. Finally, an exploratory look at differences across age groups and for boys and girls revealed only small differences. Older adolescents (14-16 years old) were the only ones to talk about home screen use and studying, and older females were the only ones to talk about the online world; however, differences were among the smaller sized (less frequently mentioned) themes. Other qualitative studies on adolescent food choice also revealed little difference between boys and girls or age group in barriers to healthful eating.107,257,260 Limitations, Challenges and Personal Reflections Engaging in discussion with adolescents can be challenging, particularly on topics that are sensitive for some. I noticed that several adolescents felt very comfortable and were happy to express all kinds of feelings and behaviours, good and bad, while others were much shyer or more likely to express only positive feelings or behaviours. Since weight and eating can be topics associated with judgment, during each and every interview I tried, verbally and non-verbally, not to show any preference for positive or negative adolescent viewpoints. Despite this effort, there were probably times when I was not successful, leading some adolescents to tell me “what I wanted to hear.” I recall one adolescent in particular, who described multiple situations of being tempted by less healthful foods but always followed up by saying that she was able to resist or chose the healthful option. I suspect there was some social desirability creeping in to her responses. In general, I found it hard to encourage discussion and critical reflection from several of the adolescents. Their willingness to talk really depended on their personality and their 140 interaction with me. Some adolescents were very, very shy and it was hard to encourage them to speak. I did try to allow lots of pauses or silence in the hopes that I wouldn’t cut them off before they had a chance to think of something and express it. Some adolescents might have felt uncomfortable opening up and talking about this subject and I felt that I had to respect their boundaries. Their discomfort may also reflect their varying ages and developmental levels. Participants of younger age or developmental level may have found self-reflection and reflection on their environment more challenging, or may have had less confidence in talking about their experiences than older adolescents. A lack of confidence may also be reflected in what they chose to share with me. This was my first time conducting qualitative interviews, although I practiced in advance of the present study (qualitative research course, practice interviews, pilot, talking with other researchers, reviewing first interview audio-recording with a third party for tips). More experience has been shown to lead to more credible interpretations.273 It is important to acknowledge that my own biases may have contributed to the interview situation and my interpretations. I come from a perspective where the environment does influence food choices. I received graduate level training in nutrition and in my own teenage years, I fluctuated in weight; therefore, I do have some pre-conceptions about what kinds of things make it easier or more difficult to make healthful food choices. My own memories from when I was a teenager and the challenges I faced may have influenced how I interpreted the results. Despite this, I did try to keep potential bias in mind. I followed a coding scheme that was derived from the literature and I involved multiple other researchers in the process to reduce this bias as much as possible. This same bias may have affected the other researchers who participated in the present study; however, their own areas of expertise and personal experiences 141 would have contributed a different perspective to the interpretation of the results. In addition, as the interviewer, my personal characteristics will have contributed a particular bias to the interviews and data interpretation. For example, my gender (female), ethnicity (white) and weight status (normal BMI) put me in a privileged position in North American society and may have influenced the interview situation as well as my interpretation of the findings. The findings presented here cannot be generalized beyond the time, place and participants of the present study; however, findings may extend to other overweight/obese adolescents with similar characteristics or in similar contexts. Effort was made to recruit adolescents of varying sex, ethnicity and socioeconomic background; however, recruitment was constrained by a limited pool of potential participants and optimal variation was not always possible. For example, recruiting boys and lower SES adolescents was a challenge. During recruitment, many parents of boys said that their sons were just too busy and had too much going on with school, yet such explanations were rare from the parents of girls. Some families also didn’t want to participate because they had to travel quite far (30 minutes to one hour) for the MySteps® intervention and were not interested in another long drive when they perceived they had less to gain from the photovoice study. The participants in the present study were overweight/obese adolescents who had presented for a treatment program. The majority of adolescents included in this research were obese rather than overweight; these more extreme levels of overweight are typical of adolescents who present for treatment programs.206 Participants may also differ from the general population of overweight/obese adolescents in their level of motivation or support from family. The findings, therefore, reflect the perceptions of adolescents who present for obesity treatment and who are likely motivated to make changes. This group is often the target of interventions and 142 learning the challenges they face in their environment is relevant for treatment and intervention development and refinement. The present study did not attempt to explore understanding of healthful or less healthful foods by adolescents; however, participants were all part of an intervention that addressed healthful and less healthful foods. That program categorized foods and beverages into greenlight, yellow-light, and red-light categories. Green-light foods include most VF and low fat milk; yellow-light foods include options that are lower in fat (e.g. vegetarian thin crust pizza, diet soft drinks, some crackers and granola bars); and red-light foods include regular soft drinks, pizza, French fries and most full fat foods and desserts. The program promoted moderation to help participants increase green-light foods and decrease red-light foods, but not eliminate any foods entirely. Since all the adolescents were exposed to this same curriculum, it was anticipated that they would have an adequate understanding of nutrition knowledge and healthful food choices. Despite this, levels of understanding varied. For example, some adolescents talked about how foods without preservatives or that were organic were healthful (including chips). Different understandings of what is healthful or not healthful may change the types of barriers or facilitators that were identified and talked about. Conclusions In summary, the adolescent participants in the present study, a group who were likely motivated to change their eating behaviours, identified many barriers to achieving healthful eating. Most frequently, they identified social and physical aspects of their environment as barriers to healthful eating and to a lesser extent the macro level/policy influences (e.g. price and marketing), factors more distal to the individual.11,60 Adolescents also provided examples of 143 facilitators to healthful eating that can be supported by future intervention programs. Their photographs provided particularly salient examples of ways to facilitate change, particularly at the school and community levels. These conclusions will be expanded in Chapter 6 to include implications in light of findings across all three studies presented in this thesis. 144 Chapter 6: Conclusions of Thesis The aim of this thesis was to explore whether environmental factors within homes, schools and communities influence dietary behaviours of overweight/obese adolescents who are targeted by obesity treatment programs. Factors within the home environment were the primary focus of this thesis with a secondary focus on factors within school and community environments. This chapter highlights the key findings, limitations and strengths of the thesis as a whole. It also includes a discussion of the contributions and implications of this research as well as recommendations for future research. 6.1 Summary of Thesis Findings Related to the Home Environment Findings from Studies 1, 2, and 3 that highlight aspects of the home food environment associated with adolescent dietary intake are outlined below. Key Findings from Study 1 Parent-adolescent intakes of FV, total fat, SSB and snacks were positively associated (small to moderate associations). No relationship was observed for desserts/treats. Parent-adolescent associations for fat intake were stronger among parents with lower educational attainment and stronger for snacking among adolescent girls. Key Findings from Study 2 Availability of high fat foods in the home was associated with a greater percentage of energy from fat and a greater percentage of energy from snacks consumed by adolescents. 145 Unexpectedly, a greater availability of high fat treats in the home was associated with a lower percentage of energy from fat consumed by adolescents. No relationships were found with home availability of soft drinks. Also, no relationships were found with adolescent intake of VF, desserts/treats or SSB. Adolescents who reported that their parents modeled healthful food consumption had fewer soft drinks, high fat foods and high fat treats in their homes. Parents who reported healthier family meal practices had fewer high fat foods and high fat treats in their homes. Lower maternal education was associated with greater availability of high fat foods in the home. Key Findings from Study 3 Factors identified as influencing food choices included: family meals, availability, parenting practices, family modeling, celebrations, accessibility/convenience, and screen use and studying. Synthesis of Key Findings from Studies 1, 2 and 3 Both quantitative findings and qualitative accounts of the home food environment suggest that families can play an important role in shaping adolescent behaviour. At least for some adolescents, there were considerable barriers to healthful eating within their home, as demonstrated by Study 3. Factors that supported healthful eating across the studies included parent modeling, family meal practices, and the availability of foods in the home. 146 Availability of some less healthful foods at home was associated with poorer dietary behaviours, as adolescents confirmed in their photographic and narrative accounts. In contrast, home availability of soft drinks was not associated with SSB intake by adolescents. In their narratives adolescents alluded to the fact that availability may vary according to the homes in which they spend their time. While availability of soft drinks may be restricted in their primary residence, adolescents indicated that it was freely available in a second household when parents lived separately. In quantitative analyses, parents were found to indirectly influence diets by modeling healthful food choices and providing healthful meal routines. Both of these parenting behaviours were associated with fewer less healthful foods in the home. Adolescents who talked about being indirectly exposed to less healthful foods as a result of what their parents or siblings were eating corroborated this finding. Summary of Thesis Findings Related to School and Community Environments Study 3 was the only study that examined aspects of school and community environments related to adolescent food choices. Key findings from this study are summarized below. Key Findings from Study 3 Factors Identified as influencing food choices included: peers, availability, accessibility/convenience, school practices, price, marketing, and the online world. Adolescents perceived a multitude of opportunities for less healthful eating at school and in the community. The social nature of less healthful eating was emphasized. Accounts of peer modeling suggest that peer interactions increase adolescent exposure to less healthful foods 147 6.2 Strengths The three primary strengths of this research relate to its design and sample. First, this research incorporated both quantitative and qualitative methods to investigate familial and environmental determinants of dietary behaviours. Triangulation of both study designs provides a richer and more comprehensive understanding273,321 of how various factors within the home environment relate to the diets of overweight/obese adolescents. The collection of qualitative data served to corroborate and expand on findings from the quantitative analyses.321,322 Furthermore, while variables investigated in the quantitative data analyses were pre-determined and limited by the main study (MySteps® intervention), the qualitative study allowed for a broader range of information to emerge.323 Second, this thesis was guided by theory and incorporated previous models of adolescent diets11,73,119 to expand on what is already known about environmental influences on diets. Third, this research aimed to provide an understanding of dietary behaviour among overweight/obese adolescents who participated in obesity-treatment programs. This is a unique and understudied group whose experiences will help to inform and improve treatment programs. In addition, as the population of overweight Canadian adolescents continues to grow,2 understanding this group has a wide applicability particularly given the push towards finding ways to improve dietary behaviours and reduce obesity among this age group. Furthermore, home, school, and community food environments that influence dietary intake may have been more salient among this group of adolescents. Lastly, overweight/obese adolescents are at risk for future chronic disease development;26 therefore, a better understanding of the contextual factors that support healthful eating in this population may contribute to reducing the burden of chronic diseases at the population-level. 148 Strengths of the quantitative component of this research included the use of structural equation modeling that increased the study’s power to detect important associations by accounting for measurement error of several of the independent variables. Additional strengths of the measurements used in this thesis include that data were collected from both adolescents and parents including direct measurements for height and weight. The use of multiple 24-hour dietary recalls allowed for the examination of various nutrient and food component outcomes (e.g. percentage energy from snacks). Collection of two or more days of recalls for 75% of participants helped to improve estimation of usual daily intake. Inclusion of age, sex and BMI in statistical models, key variables associated with underreporting,33,324 contributed to a further reduction in measurement errors normally associated with the collection of dietary data. Strengths of the qualitative component of this research included the rich, in-depth details derived from photovoice methodology that revealed how overweight/obese adolescents interact with their food environments. This method was engaging for adolescents; adolescents had two weeks to think about what photographs to take providing them with a period of reflection before reporting their data. The provision of opportunities to reflect is a unique aspect of photovoice that could result in more credible insights from participants as compared to survey or interview responses that require immediate consideration and recall ability. In addition, learning about the environment through the eyes and voices of these adolescents provided a unique perspective that complimented the other sources of data and strengthened the overall implications of study findings. Finally, the results of this research provided timely and relevant evidence for programs aimed at promoting healthier eating habits to overweight/obese adolescents. Results provide information about the environmental contexts that are currently relevant for these adolescents. 149 Furthermore, influencing public health policy is complex and does not always incorporate scientific evidence, in part, because it is inaccessible or unconvincing to policy makers.325 Evidence in the form of photographs and storytelling may be a particularly powerful and persuasive way to engage with and influence policy makers responsible for school nutrition policies and broader public policies that encourage healthful eating, including pricing strategies, restriction of less healthful foods and/or promotion of more nutritious foods available in the community. Therefore, the qualitative results generated from this research are particularly well suited to impact policy making in school and community settings. 6.3 Limitations Limitations specific to the data collected and analyzed in each study were discussed in detail in each respective chapter. For interpreting the results of this thesis as a whole, there are four primary limitations that need to be considered and they are discussed in detail in this section. First, the sample was composed of adolescents in the greater Vancouver area who are obese or at risk-for obesity; therefore, findings may not be generalizable to other adolescents, particularly in rural settings. The present sample also consisted of more obese (~50% ≥ 2.0 SD) and severely obese (~30% ≥ 3.0 SD) adolescents, based on WHO growth curves, than what would be expected from the general population of overweight/obese adolescents, but is typical of those who present for treatment programs.206 However, based on absolute BMI values, which has been suggested as a preferable measure to classify severe obesity,326 8% of the present sample were severely obesity. Both methods suggest that some adolescents in the present sample were struggling with severe obesity. More severe obesity may result in abnormal parent-child 150 relationships, home environments and peer/school relationships. Comparison of the current sample and 2011 census data drawn from the Greater Vancouver Area general population327 showed that the current sample included more educated families (17% vs. 34% with high school education or less), fewer families in married or common-law partnerships (72% vs. 85%), fewer east/southeast Asian families (15% vs. 27%) and more aboriginal (9% vs. 3%) and other minority families (Black, Latin American) (17% vs. 5%). These differences may not be surprising in light of demographic differences associated with overweight/obesity3 and willingness to participate in interventions;206 thus findings are particularly relevant for families targeted in obesity treatment programs. The sample was also relatively small and participants were those who presented for lifestyle treatment with their parents. This suggests that participants were likely motivated to make changes; therefore, study findings apply to this particular group and may not apply to less motivated adolescents or families. It should be noted that some adolescents may have been “nudged” by their parents to participate while others were more involved in initiating their participation; therefore, their level of motivation could have differed. Second, the cross-sectional nature of the data used in this thesis did not allow for identification of temporal associations between independent variables and dietary behaviour. Longitudinal research is more costly and time intensive; however, it provides needed evidence to disentangle the impact of environments on dietary behaviours. Longitudinal studies will be particularly useful in determining if environments have long term impacts on diets and if changes to environments result in desired changes in behaviour. This type of evidence would be helpful for public policy decision-makers before enacting policies that subsidize healthful foods in 151 schools or in grocery stores, tax less healthful foods, require labels on food products, or mandate the ratio of healthful vs. less healthful foods that can be available in a particular area. Third, this thesis was limited by the use of self-reported measures to collect data on diets and the environment which may have resulted in reporting bias. Both diets and parenting constructs are subject to social desirability bias. The measure of family meal practices used a normalizing format to reduce social desirability. Dietary recalls used a web-based platform that increased privacy. In addition, participants were encouraged to answer completely and participant anonymity was stressed. Despite efforts to reduce social desirability bias, it remains extremely difficult to remove entirely, a difficulty that has led to a call to improve our measures of weight-related parenting constructs.225,328 Furthermore, measurement error inherent with survey data was reduced here by using structural equation modeling (when applicable) that served to increase power to detect associations, particularly given the relatively small sample size. Measurement error in diets, as a result of day to day variation, may have also limited the ability to detect associations. Both social desirability bias and measurement error likely served to push associations towards the null. Finally, this research aimed to understand the contexts in which dietary behaviours occur, and although addressed in the qualitative study, no quantitative data on variables within school or community environments were collected. Data of this nature, combined with data on the home environment, would have provided a more complete picture of the environmental influences on diets. Studies that utilize a socio-ecological framework require the collection of a broad range of variables/constructs making them difficult in practice because of the high cost and participant burden. 152 6.4 Implications and Directions for Future Research The research presented in this thesis generated new knowledge about environmental influences on dietary behaviours specific to overweight/obese adolescents who present for lifestyle modification interventions. Findings have implications primarily for families of overweight/obese adolescents as well as for improving adolescent obesity treatment interventions. Implications may also extend to a wider group of adolescents as findings from this thesis contribute to understanding how the home, school, and community environment can support healthful food choices. Implications for intervention and research will focus on four key areas that were found to be important for influencing adolescent dietary behaviours in this thesis. The main focus will be on 1) parents and the home environment, with a secondary focus on 2) school- and community-based approaches, 3) the multi-factorial nature of influences on healthy eating, and 4) the influence of peers. 6.4.1 Parents and the Home Environment Within the home environment, parents’ own behaviours as well as characteristics of the home food environment over which parents have considerable control were linked to adolescent food choices and some dietary outcomes. Results provide parents, adolescents and their families with strategies that may be useful in creating more supportive home environments for healthful eating. This is the first study to examine these influences in overweight/obese adolescents presenting for treatment; therefore, findings are particularly relevant for family-based adolescent obesity interventions. Since many factors in the home environment were either associated with adolescent dietary intake, or described by adolescents as influencing their food choices, interventions that 153 incorporate the entire family (i.e. both parents and siblings) and focus on environmental changes appear promising and may help to support dietary behaviour change. Currently, family-based interventions are the gold-standard for the treatment of childhood obesity.19 The Cochrane review of obesity treatment interventions in children and adolescents, and a more recent review of obesity interventions that include a parental component, suggest that greater parental involvement results in more efficacious results.183,329 The findings from this thesis affirm the importance of parental involvement in obesity treatment programs targeting adolescents. The use of parental involvement has primarily demonstrated promise in interventions with younger children (<12 years of age) and review articles consist primarily (>75%) of studies targeting this age group.183,329 Therefore, these findings contribute to building the evidence base for familybased treatment interventions targeting adolescents. Theoretical underpinnings of family-based obesity treatment programs include social cognitive theory and socio-ecological theory as they harness the influence of parents’ own behaviours and their role in shaping the home food environment.183 The influence of parents’ own dietary behaviours on overweight/obese adolescent dietary behaviours observed in this thesis were small. This is in line with the only other study that has examined overweight/obese youth (in children aged 2 to 9 years old),190 as well as a study in a population-based sample of adolescents.71 However, the role of observational learning (i.e. perceived parent modeling) for overweight/obese youth was not directly supported by the findings of this thesis. Parental modeling of low fat and VF food choices was not associated with any of the adolescent dietary components but was associated with other aspects of the home environment. Taken together, these findings suggest that shared aspects of the home environment (e.g. availability, routines), rather than modeling (i.e. observed learning), may be more influential for overweight/obese 154 adolescents. Findings also suggest that parents who are supported in making behaviour change themselves may be better able to shape a healthier home environment, in part, by influencing availably of foods in the home. A continued and more prominent focus on socio-ecological theory in designing adolescent obesity treatment interventions is thus warranted. 182 Similar to the intervention targets identified in this thesis, a previous study in younger children has reported that family-centered interventions that encourage authoritative parenting styles, role modeling, and a healthier home environment (e.g. availability, accessibility, meal routines) produce greater reductions in BMI than when children alone were targeted.219 The primary mechanism for these differences was reported to be improvements in the types of foods available in the home.219 More recent research also shows that broader activity and eating environments support greater weight loss in participants of family-based obesity treatment programs for 8-12 year old children.182 Likely, a broad mix of factors needs to be addressed to improve the success of family-based obesity treatment programs. Directions for Future Research Future research should identify the complex mix of factors within the home environment that influence adolescent diets and indicate how these factors can best support healthy food choices. While changes to the environment have been targeted in the homes of younger children with some success, we know very little about the mechanisms within the home environment that promote change in dietary behaviours among adolescents.183 This thesis aimed to address this gap and gain a better understanding of various environmental influences on eating behaviours. However, similar to other studies among children and adolescents,73,119,330 effect sizes were modest and some dietary factors were not associated with aspects of the home environment or 155 relationships were in unexpected directions. These relationships may also relate to developmental changes that occur during adolescence, which include decreasing reliance on parents and the home environment and a greater influence from peers and settings outside the home.49 Both longitudinal and qualitative studies may help to better understand the complex nature of these relationships. Longitudinal studies may be able to identify which experiences are most influential in shaping overweight/obese adolescent dietary behaviours over time and determine how changes in the home environment translate to changes in dietary behaviour. One such study is ongoing in the US and has focused on family meals, disordered eating behaviours, and body weight.99 It revealed consistent, positive outcomes associated with family meals, but also pointed to barriers that families face in providing more frequent and healthier family meals.99 Additional studies that expand to examine a greater number of factors within the home environment in overweight/obese adolescents as well as in the general population of adolescents may reveal important aspects of the home environment relevant to the adoption of healthy eating habits. In light of the large role parents play in overseeing the home food environment, qualitative research with or without the addition of photovoice methodology may help to uncover the barriers families face in creating supportive home food environments. As suggested by the findings of this thesis, along with previous studies,99 there may be complexities related to the culture, SES, or structure of the family. Such studies would aim to uncover detailed accounts from parents about the physical, psychological and economic barriers they face in providing a healthful home food environment that may be unique to overweight/obese adolescents. They may also uncover the impact of multiple households on adolescent dietary behaviours. For 156 example, many adolescents live in two households and consistencies or intricacies associated with food environments across households need to be better understood. 6.4.2 School- and Community-based Approaches Social and environmental contexts beyond the family (e.g. school, neighbourhood) play an increasing role in the development of adolescent behaviour.331The factors identified by adolescents within their school and community environments suggest that a policy focus will likely be important to support healthful diets of overweight/obese adolescents. Given that almost all adolescents are exposed to these settings, changes there may help a wider group of adolescents in making healthier eating choices. Furthermore, barriers and facilitators described in the present study do not appear to be unique to overweight/obese adolescents. Factors identified by adolescents were similar to those reported by other groups of adolescents when asked about their food choices in previous studies.85,107,122,254,256–260 This finding further suggests the potential applicability of results to wider groups of adolescents. The socio-ecological model emphasizes the influence of broader policies on individual behaviour and many adolescents examined in this thesis identified barriers that require policy intervention. Previous studies have demonstrated that policies are important mechanisms to promote health behaviours.332 Perhaps the most successful example has been the impact of school and community-level policies on curbing smoking rates.333–335 School policies have also been successful at improving school food environments140,336and student behaviours,137,337,338 although findings have been mixed.146,337 Policies that target communities are more difficult to enact; however, previous studies have suggested that policies that increase availability of healthy foods, restrict marketing of less healthful products, and impose taxes on less healthful foods 157 and/or subsidize healthier foods are potential strategies for improving diets in the context of adolescent obesity.314,332 The findings from this thesis suggest that several aspects of school and community environment challenge overweight/obese adolescents; yet how successful school policies will be in supporting healthful diets among these adolescents has not been studied. Directions for Future Research Future research should document barriers to healthy eating occurring in schools and in the community, test interventions that create healthier food environments, and examine behaviours across settings (e.g. to see if changes in one setting lead to compensatory eating in other settings). Findings from this thesis rely on adolescent perceptions; therefore, measurement of school and community food environments is needed. In particular, since the majority of research has been done in the US, examination of school food environments is needed to document characteristics of these environments in the BC and Canadian context.337 This type of data would help to confirm the perceptions of adolescents presented in this thesis and provide further information to school administrators and policy makers on the most important areas to target from a policy perspective. Barriers identified by adolescents provide some insight into future policy targets. In the school setting, potential targets include ensuring that water is freely accessible and promoted to students, limiting or eliminating school food classes and classroom activities that involve junk food, eliminating the marketing of less healthful foods, and promoting healthier foods and beverages. Currently, policies are underway in BC to address many of these barriers. Current BC policy mandates the restriction of high sugar and high fat food and beverage sales; encourages 158 restrictions on less healthful foods in fundraising, school events, and in classroom activities; and eliminates marketing/promotion of less healthful foods. Despite these policy efforts, data from this thesis suggest that several less healthful activities are ongoing in some schools. Continued research is thus needed to identify how to better support schools in making the changes mandated by the BC policy. Research is also needed to examine what policies are most effective in promoting positive change in school food environments and student dietary behaviours. There is some evidence that policies targeting the school environment may be most beneficial to overweight/obese students. For example, in BC schools, lower availability of SSB was more strongly associated with lower SSB consumption among students who were obese as compared to overweight.337 An important consideration for school and community policies includes how behaviour might be compensated for in other environments. For example, there is some evidence from qualitative interviews with school principals that changes to school food availability may result in more students purchasing less healthful foods/beverages off school property or bringing them from home.307 Other studies found that when less healthful foods were removed from school settings in various jurisdictions in the US, decreased consumption was observed across the school day with no increase in consumption of less healthful foods while at home.308,309 The qualitative component of this thesis suggests that compensatory behaviour may be occurring. How compensatory behaviour might differ for overweight/obese adolescents might be particularly interesting to investigate in future studies. 159 6.4.3 Multi-Factorial Nature of Influences on Healthy Eating The findings from this thesis highlight the fact that influences on dietary behaviours are multi-factorial and complex. A broad range of factors across settings (home, school and community) and across levels (social, physical, and macro) were associated with adolescent dietary intake or were identified by adolescents as influencing their food choices. These findings suggest that single-component strategies will likely not be successful at promoting more healthful eating behaviours in overweight/obese adolescents, but that a combination of multiplefactors need to be addressed to support more positive behaviours. The complex and multifactorial nature of diets needs to be stressed as current discourse in the media and the public continues to be one-dimensional (e.g. individuals need more willpower or we need to find the one intervention that will shift the tide). Successes in adolescent tobacco control were the result of comprehensive and sustained approaches that targeted multiple environmental and individual influences on smoking behaviour.339 As proposed by others, this same strategy should be applied to adolescent obesity and further supports the application of socio-ecological theory for addressing the dietary behaviours of overweight/obese adolescents.11 There is growing interest in applying systems theory to address obesity and related health behaviours.340 Systems theory extends socio-ecological theory by elaborating on the many sectors (e.g. education, agriculture, transportation) that are acting across levels of interest to influence behaviour and the bidirectional and dynamic nature of the interaction between factors.340 Systems theory also emphasizes key drivers or leverage points within the system that lead to certain outcomes.340 The application of socio-ecological and systems theories to obesity interventions suggests that broader environments need to be targeted (community-level or 160 higher),340 there is limited applicability of single component approaches, and there is a need for sustained efforts to promote healthful dietary behaviours. Directions for Future Research Future research should focus on multi-component approaches and include principals of systems theory to address healthy eating in the context of adolescent obesity. Applying a more systems-oriented lens to obesity treatment interventions suggests that they need to incorporate environments outside the home that influence targeted behaviours. A recent experimental study is the first to demonstrate that characteristics of the built environment (e.g. types of food stores in the neighbourhood and park space) moderate the long-term effectiveness of family-based obesity treatment for 8-12 year old children.182 Furthermore, although the research presented in this thesis focuses on dietary behaviours of overweight/obese adolescents, obesity treatment interventions that target multiple behaviours simultaneously (e.g. diet, physical activity, and sedentary behaviours) may yield stronger outcomes.329 In fact, some adolescents examined in this thesis suggested that their dietary behaviours might be linked with their physical activity behaviours (e.g. desire to eat healthier foods following physical activity or motivation to eat healthier foods to improve sport performance). Future research that considers environmental influences across multiple obesity-related behaviours may reveal important connections that will inform treatment interventions. At the community-level, large-scale, multi-component approaches similar to those used to address adolescent smoking are likely needed. One example of this is Shape Up Somerville, a comprehensive city-wide intervention in Somerville, Massachusetts targeting obesity rates among grade 1-3 students.341 The intervention engaged multiple settings (home, school and 161 community) and a wide range of stakeholders (parents, teachers, school food service providers, city departments, policy makers, healthy providers, after-school programs, restaurants and the media) and resulted in declines in BMI z-scores after one year, as compared to community matched controls. There remains very limited research incorporating broad sweeping, multicomponent interventions, but these types of efforts are likely needed to address the multiple influences on dietary behaviours. To address the dynamic nature of systems, ecological momentary assessment may be a promising assessment strategy. Ecological momentary assessment is a measurement technique that involves collecting data in real time and can be administered by using text messaging or apps on cell phones.342 This real time data capture helps to improve recall of foods and beverages consumed, particularly the assessment of portion size, and data are captured while participants are in an environment of interest providing a more ecologically sound association with environment.343 For example, a study using this technique found that university females of normal weight at the higher range of BMI were more likely to overeat when in the presence of highly palatable foods but not in their absence.344 There was no such environmental effect on overeating among those at the lower range of BMI344 revealing the complexity of studying environmental correlates of diets that may have differential effects across individuals, change over time, and be context-dependent. 6.4.4 Peer Influence In addition to changes to the number of opportunities for less healthful eating in home, school, and community environments, adolescents discussed social contexts associated with less healthful eating. In adolescence, relationships with peers become increasingly important and may 162 lead to substantial influence on adolescents’ attitudes and behaviours. The social context of less healthful eating described by adolescents in the present study,345 suggests that skills to navigate these situations may be helpful and that peers could act as a lever for behaviour change. Both social cognitive theory67 and socio-ecological theory60 posit that peer behaviour will influence an individual’s own behaviour and studies have demonstrated that health behaviours cluster in peer social networks.131,298 Currently interventions have observed positive results with peer-led346 and peer involvement347 approaches, particularly in physical activity-focused interventions. Schoolbased programs (i.e. inherently have a peer component) that target physical activity and dietary behaviours have also been relatively successful in decreasing BMI.348 Targeting peer groups may be limited for some youth, as peer relationships can be dynamic and instable during adolescence345and peer relationships may be weaker for obese adolescents.53 In general, few studies have incorporated a peer component into dietary behaviour change interventions for overweight/obese adolescents. The influence of peers through social media was raised by some adolescents in the present study. The growing use of technology in obesity treatment (e.g. mobile apps, internetdelivered interventions) as well as use of social media for obesity treatment in adults349may have implications for harnessing peer groups. Currently, there are almost no reports of research on adolescent obesity treatment programs that utilize social media and peer groups, but studies may be underway.350 Directions for Future Research Future research should identify the best way to harness peer influences for promoting more healthful dietary behaviours. 163 Intervention and treatment programs should target adolescents directly to help them manage the social situations that lead to less healthful eating. In addition, school-based interventions inherently target peer groups (e.g. when all children at school are involved in an intervention), but they are generally not focused on behaviour change among groups of friends. A recent meta-analysis of school-based interventions found small but encouraging declines in BMI, but this effect was diminished among adolescents.351 This review found that parent involvement was an important contributor to intervention success, but perhaps more focus on activities and dietary behaviour change among groups of friends would be helpful when targeting adolescents in the school environment. Schools may be the best settings for interventions with peer groups, but findings from the qualitative component of this thesis suggest that consideration should also be given to peer groups in other settings such as at social community groups (e.g. sports teams, girl guides). Very little attention in the literature has been given to these settings, which should be considered in future research studies. 6.5 Summary The aim of this thesis was to explore whether environmental factors influence dietary behaviours among overweight/obese adolescents presenting for lifestyle modification interventions. Using data collected from adolescent and parent participants of an e-health lifestyle behaviour modification intervention, environmental factors within home, school and community settings were explored. Characteristics of the home environment were found to be associated with dietary behaviour suggesting that family-based interventions and greater support to parents will be needed to promote dietary behaviour change. Nonetheless, associations identified in the home environment were modest, and point to the increasing reliance of 164 adolescents on social relationships and environments outside the home in making their food choices. The number of opportunities for less healthful eating described by overweight/obese adolescents, particularly at school and in their communities, suggests a need for public policy and intervention strategies that minimize exposure to less healthful foods in these settings. Overall, findings serve to bolster previous studies calling for weight-related behavioural interventions to focus beyond the individual by incorporating more socio-environmental influences on dietary behaviour across settings.119 They also suggest that multiple factors are at play and multi-component approaches are needed. Systems-based approaches may help to conceptualize the connections between factors and how multi-component efforts will impact one another and dietary outcomes. Focusing on environmental changes (incorporation into networks, settings, and policies) has implications for supporting healthy food choices among overweight/obese adolescents and enhancing long term maintenance of dietary behaviour change. Currently, the majority of discourse in the public and the media continues to be on single-focused solutions to the obesity epidemic.352,353 To appropriately address the dietary intake of overweight/obese adolescents, the complex and multi-faceted nature of this problem and its solutions need to be emphasized and broadly communicated. 165 Bibliography 1. World Health Organization. Childhood overweight and obesity. 2011. Available at: http://www.who.int/dietphysicalactivity/childhood/en/. Accessed November 9, 2011. 2. Roberts KC, Shields M, de Groh M, Aziz A, Gilbert J-A. Overweight and obesity in children and adolescents: Results from the 2009 to 2011 Canadian Health Measures Survey. Health Rep. 2012;23(3):37-41. 3. Shields M. Overweight and obesity among children and youth. Health Rep. 2006;17(3):27-42. 4. Dietz W. Critical periods in childhood for the development of obesity. Am J Clin Nutr. 1994;59(5):955 -959. 5. Garriguet D. Canadians’ eating habits. Health Rep. 2007;18(2):17-32. 6. Garriguet D. Beverage consumption of children and teens. Health Rep. 2008;19(4):1-7. 7. Nelson MC, Neumark-Sztainer D, Hannan PJ, Story M. Five-year longitudinal and secular shifts in adolescent beverage intake: Findings from Project EAT (Eating Among Teens)-II. J Am Diet Assoc. 2009;109(2):308-312. 8. Lytle LA, Seifert S, Greenstein J, McGovern P. How do children’s eating patterns and food choices change over time? Results from a cohort study. Am J Health Promot. 2000;14(4):222-228. 9. Spruijt-Metz D. Etiology, treatment and prevention of obesity in childhood and adolescence: A decade in review. J Res Adolesc. 2011;21(1):129-152. 10. Bronfenbrenner U. Ecological models of human development. In: International Encyclopedia of Education.Vol 3. 2nd ed. Oxford: Elsevier; 1994:37-43. 11. Story M, Kaphingst KM, Robinson-O’Brien R, Glanz K. Creating healthy food and eating environments: Policy and environmental approaches. Annu Rev Public Health. 2008;29:253-272. 12. Briefel RR, Wilson A, Gleason PM. Consumption of low-nutrient, energy-dense foods and beverages at school, home, and other locations among school lunch participants and nonparticipants. J Am Diet Assoc. 2009;109(2 Suppl):S79-S90. 13. Poti JM, Popkin BM. Trends in energy intake among US children by eating location and food source, 1977-2006. J Am Diet Assoc. 2011;111(8):1156-1164. 14. Berge JM. A review of familial correlates of child and adolescent obesity: What has the 21st century taught us so far? Int J Adolesc Med Health. 2009;21(4):457-483. 166 15. McClain AD, Chappuis C, Nguyen-Rodriguez ST, Yaroch AL, Spruijt-Metz D. Psychosocial correlates of eating behavior in children and adolescents: a review. Int J Behav Nutr Phys Act. 2009;6(54):1-20. 16. Van der Horst K, Oenema A, Ferreira I, et al. A systematic review of environmental correlates of obesity-related dietary behaviors in youth. Health Educ Res. 2007;22(2):203 -226. 17. Birch LL, Davison KK. Family environmental factors influencing the developing behavioral controls of food intake and childhood overweight. Pediatr Clin North Am. 2001;48(4):893-907. 18. Rosenkranz RR, Dzewaltowski DA. Model of the home food environment pertaining to childhood obesity. Nutr Rev. 2008;66(3):123-140. 19. Epstein LH, Paluch RA, Roemmich JN, Beecher MD. Family-based obesity treatment, then and now: Twenty-five years of pediatric obesity treatment. Health Psychol. 2007;26(4):381-391. 20. Wang Y, Lobstein T. Worldwide trends in childhood overweight and obesity. Int J Pediatr Obes. 2006;1(1):11-25. 21. Amed S, Dean HJ, Panagiotopoulos C, et al. Type 2 diabetes, medication-induced diabetes, and monogenic diabetes in Canadian children: A prospective national surveillance study. Diabetes Care. 2010;33(4):786-791. 22. Bray GA. Medical consequences of obesity. J Clin Endocrinol Metab. 2004;89(6):2583 2589. 23. Puhl RM, Latner JD. Stigma, obesity, and the health of the nation’s children. Psychol Bull. 2007;133(4):557-580. 24. Cali AMG, Caprio S. Obesity in children and adolescents. J Clin Endocrinol Metab. 2008;93(11 Suppl 1):S31-S36. 25. Swallen KC, Reither EN, Haas SA, Meier AM. Overweight, obesity, and health-related quality of life among adolescents: The National Longitudinal Study of Adolescent Health. Pediatrics. 2005;115(2):340-347. 26. Reilly J, Kelly J. Long term impact of overweight and obesity. Int J Obes. 2011;35:891898. 27. Singh AS, Mulder C, Twisk JWR, van Mechelen W, Chinapaw MJM. Tracking of childhood overweight into adulthood: A systematic review of the literature. Obes Rev. 2008;9(5):474-488. 167 28. Finkelstein EA, Graham WCK, Malhotra R. Lifetime direct medical costs of childhood obesity. Pediatrics. 2014;133(5):1-9. 29. Linde J, Jeffery R. Evolving environmental factors in the obesity epidemic. In: Obesity Epidemiology. 2nd ed. New York, NY: Oxford University Press; 2010:119-135. 30. Langlois K, Garriguet D. Sugar consumption among Canadians of all ages. Health Rep. 2011;22(3):23-27. 31. Gilbert J-A, Miller D, Olson S, St-Pierre S. After-school snack intake among Canadian children and adolescents. Can J Public Health. 2012;103(6):e448-e452. 32. Laska MN, Murray DM, Lytle LA, Harnack LJ. Longitudinal associations between key dietary behaviors and weight gain over time: Transitions through the adolescent years. Obesity. 2012;20(1):118–125. 33. Willett W. Nutritional Epidemiology. 3rd ed. New York, NY: Oxford University Press; 2012. 34. Story M. Nutritional requirements during adolescence. In: Textbook of Adolescent Medicine. Philadelphia: W.B. Saunders; 1992:75-84. 35. Centers for Disease Control and Prevention. Nutrition facts: Adolescent and school health. 2011. Available at: http://www.cdc.gov/healthyyouth/nutrition/facts.htm. Accessed May 29, 2014. 36. Swinburn BA, Caterson I, Seidell JC, James WPT. Diet, nutrition and the prevention of excess weight gain and obesity. Public Health Nutr. 2004;7(1A):123-146. 37. Nicklas TA, Yang S-J, Baranowski T, Zakeri I, Berenson G. Eating patterns and obesity in children: The Bogalusa Heart Study. Am J Prev Med. 2003;25(1):9-16. 38. Ambrosini GL, Emmett PM, Northstone K, Howe LD, Tilling K, Jebb SA. Identification of a dietary pattern prospectively associated with increased adiposity during childhood and adolescence. Int J Obes. 2012;36(10):1299-1305. 39. Ritchie LD, Spector P, Stevens MJ, et al. Dietary patterns in adolescence are related to adiposity in young adulthood in black and white females. J Nutr. 2007;137(2):399-406. 40. Johnson L, van Jaarsveld CHM, Wardle J. Individual and family environment correlates differ for consumption of core and non-core foods in children. Br J Nutr. 2011;105(6):950-959. 41. Epstein LH, Gordy CC, Raynor HA, Beddome M, Kilanowski CK, Paluch R. Increasing fruit and vegetable intake and decreasing fat and sugar intake in families at risk for childhood obesity. Obes Res. 2001;9(3):171-178. 168 42. World Health Organization. Diet, Nutrition and The Prevention of Chronic Diseases. Geneva; 2003. Available at: http://whqlibdoc.who.int/trs/who_trs_916.pdf. Accessed October 8, 2013. 43. Willett W. Diet and health: What should we eat? Science. 1994;264:532-537. 44. Mattes R. Energy intake and obesity: Ingestive frequency outweighs portion size. Physiol Behav. 2013. Epub ahead of print: doi:10.1016/j.physbeh.2013.11.012. 45. Sebastian RS, Cleveland LE, Goldman JD. Effect of snacking frequency on adolescents’ dietary intakes and meeting national recommendations. J Adolesc Health. 2008;42(5):503511. 46. Smetana JG, Campione-Barr N, Metzger A. Adolescent development in interpersonal and societal contexts. Annu Rev Psychol. 2006;57:255-284. 47. Susman EJ, Rogol A. Puberty and psychological development. In: Handbook of Adolescent Psychology. 2nd ed. New Jersey, NY: John Wiley & Sons; 2004:15-44. 48. Centers for Disease Control and Prevention. Child Development. 2014. Available at: http://www.cdc.gov/ncbddd/childdevelopment/positiveparenting/index.html. Accessed August 17, 2014. 49. Nurmi RM. Socialization and self-development. In: Handbook of Adolescent Psychology. 2nd ed. New Jersey, NY: John Wiley & Sons; 2004:85-124. 50. Crockett L. Developmental paths in adolescence: commentary. In: Pathways through Adolescence. New Jersey, NY: Lawrence Erlbaum Associates; 1995. 51. Mond J, van den Berg P, Boutelle K, Hannan P, Neumark-Sztainer D. Obesity, body dissatisfaction, and emotional well-being in early and late adolescence: findings from the project EAT study. J Adolesc Health. 2011;48(4):373-378. 52. Mellin AE, Neumark-Sztainer D, Story M, Ireland M, Resnick MD. Unhealthy behaviors and psychosocial difficulties among overweight adolescents: the potential impact of familial factors. J Adolesc Health. 2002;31(2):145-153. 53. Strauss RS, Pollack HA. Social marginalization of overweight children. Arch Pediatr Adolesc Med. 2003;157(8):746-752. 54. Phillips RG, Hill AJ. Fat, plain, but not friendless: self-esteem and peer acceptance of obese pre-adolescent girls. Int J Obes Relat Metab Disord. 1998;22(4):287-293. 55. Caballero B. The global epidemic of obesity: An overview. Epidemiol Rev. 2007;29(1):15. 169 56. Hafekost K, Lawrence D, Mitrou F, O’Sullivan TA, Zubrick SR. Tackling overweight and obesity: Does the public health message match the science? BMC Med. 2013;11(1):41. 57. U.S. Department of Agriculture and U.S. Department of Health and Human Services. Dietary Guidelines for Americans 2010. Washington, DC: U.S. Government Printing Office; 2010. Available at: http://www.health.gov/dietaryguidelines/dga2010/DietaryGuidelines2010.pdf. Accessed August 19, 2013. 58. Maes HH, Neale MC, Eaves LJ. Genetic and environmental factors in relative body weight and human adiposity. Behav Genet. 1997;27(4):325-351. 59. Hill JO, Peters JC. Environmental contributions to the obesity epidemic. Science. 1998;280(5368):1371-1374. 60. Story M, Neumark-Sztainer D, French S. Individual and environmental influences on adolescent eating behaviors. J Am Diet Assoc. 2002;102(3 Suppl):S40-S51. 61. Bronfenbrenner U. Toward an experimental ecology of human development. Am Psychol. 1977;32(7):513-531. 62. Swinburn B, Egger G, Raza F. Dissecting obesogenic environments: The development and application of a framework for identifying and prioritizing environmental interventions for obesity. Prev Med. 1999;29(6):563-570. 63. Stokols D. Establishing and maintaining healthy environments: Toward a social ecology of health promotion. Am Psychol. 1992;47(1):6-22. 64. Patrick H, Nicklas TA. A review of family and social determinants of children’s eating patterns and diet quality. J Am Coll Nutr. 2005;24(2):83-92. 65. Ritchie LD, Welk G, Styne D, Gerstein DE, Crawford PB. Family environment and pediatric overweight: What is a parent to do? J Am Diet Assoc. 2005;105(5 Suppl):70-79. 66. Bandura A. Social Learning Theory. New York, NY: General Learning Press; 1971. 67. Bandura A. Health promotion from the perspective of social cognitive theory. Psychol Health. 1998;13(4):623-649. 68. Pearson N, Biddle SJH, Gorely T. Family correlates of fruit and vegetable consumption in children and adolescents: A systematic review. Public Health Nutr. 2009;12(2):267-283. 69. Jones LR, Steer CD, Rogers IS, Emmett PM. Influences on child fruit and vegetable intake: Sociodemographic, parental and child factors in a longitudinal cohort study. Public Health Nutr. 2010;13(7):1122-1130. 170 70. Berge JM, Arikian A, Doherty WJ, Neumark-Sztainer D. Healthful eating and physical activity in the home environment: Results from multifamily focus groups. J Nutr Educ Behav. 2012;44(2):123-131. 71. Beydoun MA, Wang Y. Parent–child dietary intake resemblance in the United States: Evidence from a large representative survey. Soc Sci Med. 2009;68(12):2137-2144. 72. Wang Y, Beydoun MA, Li J, Liu Y, Moreno LA. Do children and their parents eat a similar diet? Resemblance in child and parental dietary intake: systematic review and meta-analysis. J Epidemiol Community Health. 2011;65(2):177-189. 73. Campbell KJ, Crawford DA, Salmon J, Carver A, Garnett SP, Baur LA. Associations between the home food environment and obesity-promoting eating behaviors in adolescence. Obesity. 2007;15(3):719-730. 74. Savage JS, Fisher JO, Birch LL. Parental influence on eating behavior: Conception to adolescence. J Law Med Ethics. 2007;35(1):22-34. 75. Baumrind D. The influence of parenting style on adolescent competence and substance use. J Early Adolesc. 1991;11(1):56 -95. 76. Kremers SPJ, Brug J, de Vries H, Engels RCME. Parenting style and adolescent fruit consumption. Appetite. 2003;41(1):43-50. 77. Lytle L, Varnell S, Murray D, et al. Predicting adolescents’ intake of fruits and vegetables. J Nutr Educ Behav. 2003;35:170-178. 78. Berge JM, Wall M, Loth K, Neumark-Sztainer D. Parenting style as a predictor of adolescent weight and weight-related behaviors. J Adolesc Health. 2010;46(4):331-338. 79. Rhee KE, Lumeng JC, Appugliese DP, Kaciroti N, Bradley RH. Parenting styles and overweight status in first grade. Pediatrics. 2006;117(6):2047 -2054. 80. Johnson R, Welk G, Saint-Maurice PF, Ihmels M. Parenting styles and home obesogenic environments. Int J Environ Res Public Health. 2012;9(4):1411-1426. 81. Birch L, Fisher J. Development of eating behaviors among children and adolescents. Pediatrics. 1998;101(3 Pt 2):539-549. 82. Clark HR, Goyder E, Bissell P, Blank L, Peters J. How do parents’ child-feeding behaviours influence child weight? Implications for childhood obesity policy. J Public Health. 2007;29(2):132-141. 83. Kremers S, Sleddens E, Gerards S, et al. General and food-specific parenting: Measures and interplay. Child Obes. 2013;9 Suppl:S22-31. 171 84. Birch LL, Fisher JO. Mothers’ child-feeding practices influence daughters’ eating and weight. Am J Clin Nutr. 2000;71(5):1054-1061. 85. Stevenson C, Doherty G, Barnett J, Muldoon OT, Trew K. Adolescents’ views of food and eating: Identifying barriers to healthy eating. J Adolesc. 2007;30(3):417-434. 86. Bourdeaudhuij ID, Oost PV. Personal and family determinants of dietary behaviour in adolescents and their parents. Psychol Health. 2000;15(6):751-770. 87. Loth KA, Maclehose RF, Fulkerson JA, Crow S, Neumark-Sztainer D. Are food restriction and pressure-to-eat parenting practices associated with adolescent disordered eating behaviors? Int J Eat Disord. 2014;47(3):310-314. 88. Loth KA, MacLehose RF, Fulkerson JA, Crow S, Neumark-Sztainer D. Food-related parenting practices and adolescent weight status: A population-based study. Pediatrics. 2013;131(5):e1443-1450. 89. Loth KA, MacLehose RF, Fulkerson JA, Crow S, Neumark-Sztainer D. Eat this, not that! Parental demographic correlates of food-related parenting practices. Appetite. 2013;60(1):140-147. 90. Lytle LA, Hearst MO, Fulkerson J, et al. Examining the relationships between family meal practices, family stressors, and the weight of youth in the family. Ann Behav Med. 2010. 91. Neumark-Sztainer D, Wall M, Fulkerson JA, Larson N. Changes in the frequency of family meals from 1999 to 2010 in the homes of adolescents: Trends by sociodemographic characteristics. J Adolesc Health. 2013;52(2):201-206.. 92. Burgess-Champoux TL, Larson N, Neumark-Sztainer D, Hannan PJ, Story M. Are family meal patterns associated with overall diet quality during the transition from early to middle adolescence? J Nutr Educ Behav. 2009;41(2):79-86. 93. Boutelle KN, Fulkerson JA, Neumark-Sztainer D, Story M, French SA. Fast food for family meals: Relationships with parent and adolescent food intake, home food availability and weight status. Public Health Nutr. 2007;10(1):16-23. 94. Woodruff SJ, Hanning RM, McGoldrick K, Brown KS. Healthy Eating Index-C is positively associated with family dinner frequency among students in grades 6–8 from Southern Ontario, Canada. Eur J Clin Nutr. 2010;64(5):454-460. 95. Taveras EM, Rifas-Shiman SL, Berkey CS, et al. Family dinner and adolescent overweight. Obesity. 2005;13(5):900-906. 96. Goldfield GS, Murray MA, Buchholz A, et al. Family meals and body mass index among adolescents: Effects of gender. Appl Physiol Nutr Metab. 2011;36(4):539-546. 172 97. Larson NI, Neumark-Sztainer D, Hannan PJ, Story M. Family meals during adolescence are associated with higher diet quality and healthful meal patterns during young adulthood. J Am Diet Assoc. 2007;107(9):1502-1510. 98. Eisenberg ME, Olson RE, Neumark-Sztainer D, Story M, Bearinger LH. Correlations between family meals and psychosocial well-being among adolescents. Arch Pediatr Adolesc Med. 2004;158(8):792-796. 99. Neumark-Sztainer D, Larson NI, Fulkerson JA, Eisenberg ME, Story M. Family meals and adolescents: What have we learned from Project EAT (Eating Among Teens)? Public Health Nutr. 2010;13(07):1113-1121. 100. Neumark-Sztainer D, Maclehose R, Loth K, Fulkerson JA, Eisenberg ME, Berge J. What’s for dinner? Types of food served at family dinner differ across parent and family characteristics. Public Health Nutr. 2012:1-11. 101. Saelens BE, Sallis JF, Nader PR, Broyles SL, Berry CC, Taras HL. Home environmental influences on children’s television watching from early to middle childhood. J Dev Behav Pediatr. 2002;23(3):127-132. 102. MacFarlane A, Cleland V, Crawford D, Campbell K, Timperio A. Longitudinal examination of the family food environment and weight status among children. Int J Pediatr Obes. 2009;4(4):343-352. 103. Wansink B, van Kleef E. Dinner rituals that correlate with child and adult BMI. Obesity. 2014;22(5):E91-E95. 104. Feldman S, Eisenberg ME, Neumark-Sztainer D, Story M. Associations between watching TV during family meals and dietary intake among adolescents. J Nutr Educ Behav. 2007;39(5):257-263. 105. Fitzpatrick E, Edmunds LS, Dennison BA. Positive effects of family dinner are undone by television viewing. J Am Diet Assoc. 2007;107(4):666-671. 106. Lillico HG, Hammond D, Manske S, Murnaghan D. The prevalence of eating behaviors among Canadian youth using cross-sectional school-based surveys. BMC Public Health. 2014;14(1):323. 107. Neumark-Sztainer D, Story M, Perry C, Casey MA. Factors influencing food choices of adolescents: Findings from focus-group discussions with adolescents. J Am Diet Assoc. 1999;99(8):929-937. 108. Bauer KW, Neumark-Sztainer D, Fulkerson JA, Hannan PJ, Story M. Familial correlates of adolescent girls’ physical activity, television use, dietary intake, weight, and body composition. Int J Behav Nutr Phys Act. 2011;8(25):1-10. 173 109. Cullen KW, Baranowski T, Owens E, Marsh T, Rittenberry L, de Moor C. Availability, accessibility, and preferences for fruit, 100% fruit juice, and vegetables influence children’s dietary behavior. Health Educ Behav. 2003;30(5):615-626. 110. Hanson NI, Neumark-Sztainer D, Eisenberg ME, Story M, Wall M. Associations between parental report of the home food environment and adolescent intakes of fruits, vegetables and dairy foods. Public Health Nutr. 2005;8(1):77-85. 111. Pearson N, Ball K, Crawford D. Predictors of changes in adolescents’ consumption of fruits, vegetables and energy-dense snacks. Br J Nutr. 2011;105(5):795-803. 112. Cutler GJ, Flood A, Hannan P, Neumark-Sztainer D. Multiple sociodemographic and socioenvironmental characteristics are correlated with major patterns of dietary intake in adolescents. J Am Diet Assoc. 2011;111(2):230-240. 113. Arcan C, Neumark-Sztainer D, Hannan P, van den Berg P, Story M, Larson N. Parental eating behaviours, home food environment and adolescent intakes of fruits, vegetables and dairy foods: Longitudinal findings from Project EAT. Public Health Nutr. 2007;10(11):1257-1265. 114. Blanchette L, Brug J. Determinants of fruit and vegetable consumption among 6-12-yearold children and effective interventions to increase consumption. J Hum Nutr Diet. 2005;18(6):431-443. 115. Jago R, Baranowski T, Baranowski JC. Fruit and vegetable availability: A micro environmental mediating variable? Public Health Nutr. 2007;10(07):681-689. 116. Cullen KW, Baranowski T, Rittenberry L, Cosart C, Hebert D, de Moor C. Child-reported family and peer influences on fruit, juice and vegetable consumption: Reliability and validity of measures. Health Educ Res. 2001;16(2):187 -200. 117. Bauer KW, Neumark-Sztainer D, Fulkerson JA, Story M. Adolescent girls’ weight-related family environments, Minnesota. Prev Chronic Dis. 2011;8(3):A68. 118. Befort C, Kaur H, Nollen N, et al. Fruit, vegetable, and fat intake among non-hispanic black and non-hispanic white adolescents: Associations with home availability and food consumption settings. J Am Diet Assoc. 2006;106(3):367-373. 119. Neumark-Sztainer D, Wall M, Perry C, Story M. Correlates of fruit and vegetable intake among adolescents. Findings from Project EAT. Prev Med. 2003;37(3):198-208. 120. Larson NI, Story M, Wall M, Neumark-Sztainer D. Calcium and dairy intakes of adolescents are associated with their home environment, taste preferences, personal health beliefs, and meal patterns. J Am Diet Assoc. 2006;106(11):1816-1824. 174 121. Ezendam NPM, Evans AE, Stigler MH, Brug J, Oenema A. Cognitive and home environmental predictors of change in sugar-sweetened beverage consumption among adolescents. Br J Nutr. 2010;103(05):768-774. 122. Fitzgerald A, Heary C, Nixon E, Kelly C. Factors influencing the food choices of Irish children and adolescents: A qualitative investigation. Health Promot Int. 2010;25(3):289298. 123. Booth SL, Sallis JF, Ritenbaugh C, et al. Environmental and societal factors affect food choice and physical activity: Rationale, influences, and leverage points. Nutr Rev. 2001;59(3):S21-S36.. 124. Institute of Medicine. Preventing Childhood Obesity: Health in the Balance. Washington, DC: National Academies Press; 2005. Available at: http://www.iom.edu/Reports/2004/Preventing-Childhood-Obesity-Health-in-theBalance.aspx. Accessed May 29, 2014. 125. Taylor JP, Hernandez KJ, Caiger JM, et al. Nutritional quality of children’s school lunches: Differences according to food source. Public Health Nutr. 2012;15(12):22592264. 126. Steinberg L, Morris AS. Adolescent development. J Cogn Educ Psychol. 2001;2(1):55-87. 127. Finnerty T, Reeves S, Dabinett J, Jeanes YM, Vögele C. Effects of peer influence on dietary intake and physical activity in schoolchildren. Public Health Nutr. 2010;13(3):376383. 128. Feunekes GIJ, de Graaf C, Meyboom S, van Staveren WA. Food Choice and fat intake of adolescents and adults: Associations of intakes within social networks. Prev Med. 1998;27(5):645-656. 129. Neumark-Sztainer D. The social environments of adolescents: Associations between socioenvironmental factors and health behaviors during adolescence. Adolesc Med. 1999;10(1):41-55, v. 130. French S, Story M, Hannan P, et al. Cognitive and demographic correlates of low-fat vending snack choices among adolescents and adults. J Am Diet Assoc. 1999;99(4):471475. 131. Ali MM, Amialchuk A, Heiland FW. Weight-related behavior among adolescents: The role of peer effects. PLoS ONE. 2011;6(6):e21179.. 132. Bruening M, Eisenberg M, MacLehose R, Nanney MS, Story M, Neumark-Sztainer D. Relationship between adolescents’ and their friends’ eating behaviors: Breakfast, fruit, vegetable, whole-grain, and dairy intake. J Acad Nutr Diet. 2012;112(10):1608-1613. 175 133. Fletcher A, Bonell C, Sorhaindo A. You are what your friends eat: Systematic review of social network analyses of young people’s eating behaviours and bodyweight. J Epidemiol Community Health. 2011;65(6):548-555. 134. Salvy S-J, Kieffer E, Epstein LH. Effects of social context on overweight and normalweight children’s food selection. Eat Behav. 2008;9(2):190-196. 135. Finkelstein DM, Hill EL, Whitaker RC. School food environments and policies in US public schools. Pediatrics. 2008;122(1):e251-259. 136. Seliske L, Pickett W, Rosu A, Janssen I. The number and type of food retailers surrounding schools and their association with lunchtime eating behaviours in students. Int J Behav Nutr Phys Act. 2013;10(19):1-9. 137. Briefel RR, Crepinsek MK, Cabili C, Wilson A, Gleason PM. School food environments and practices affect dietary behaviors of US public school children. J Am Diet Assoc. 2009;109(2 Suppl):S91-107. 138. Templeton SB, Marlette MA, Panemangalore M. Competitive foods increase the intake of energy and decrease the intake of certain nutrients by adolescents consuming school lunch. J Am Diet Assoc. 2005;105(2):215-220. 139. Rideout K, Levy-Milne R, Martin C, Ostry AS. Food sales outlets, food availability, and the extent of nutrition policy implementation in schools in British Columbia. Can J Public Health. 2007;98(4):246-50. 140. Watts AW, Mâsse LC, Naylor P-J. Changes to the school food and physical activity environment after guideline implementation in British Columbia, Canada. Int J Behav Nutr Phys Act. 2014;11(50):1-10.. 141. Lien N, Haerens L, Velde SJ te, et al. Exploring subgroup effects by socioeconomic position of three effective school-based dietary interventions: The European TEENAGE project. Int J Public Health. 2014;59(3):493-502. 142. Fung C, Kuhle S, Lu C, et al. From “best practice” to “next practice”: The effectiveness of school-based health promotion in improving healthy eating and physical activity and preventing childhood obesity. Int J Behav Nutr Phys Act. 2012;9(27):1-9. 143. Cullen KW, Zakeri I. Fruits, vegetables, milk, and sweetened beverages consumption and access to a la carte/snack bar meals at school. Am J Public Health. 2004;94(3):463-467. 144. French SA, Story M, Fulkerson JA, Hannan P. An environmental intervention to promote lower-fat food choices in secondary schools: Outcomes of the TACOS study. Am J Public Health. 2004;94(9):1507-1512. 176 145. Haerens L, Deforche B, Maes L, Stevens V, Cardon G, De Bourdeaudhuij I. Body mass effects of a physical activity and healthy food intervention in middle schools. Obesity. 2006;14(5):847–854. 146. Vericker TC. Limited evidence that competitive food and beverage practices affect adolescent consumption behaviors. Health Educ Behav. 2013;40(1):19-23. 147. Winson A. School food environments and the obesity issue: Content, structural determinants, and agency in Canadian high schools. Agric Hum Values. 2008;25(4):499511. 148. Beaulieu D, Godin G. Staying in school for lunch instead of eating in fast-food restaurants: Results of a quasi-experimental study among high-school students. Public Health Nutr. 2012;15(12):2310-2319. 149. Day PL, Pearce J. Obesity-promoting food environments and the spatial clustering of food outlets around schools. Am J Prev Med. 2011;40(2):113-121. 150. Williams J, Scarborough P, Matthews A, et al. A systematic review of the influence of the retail food environment around schools on obesity-related outcomes. Obes Rev. 2014;15(5):359-374. 151. Seliske LM, Pickett W, Boyce WF, Janssen I. Association between the food retail environment surrounding schools and overweight in Canadian youth. Public Health Nutr. 2009;12(09):1384-1391. 152. He M, Tucker P, Gilliland J, Irwin JD, Larsen K, Hess P. The influence of local food environments on adolescents’ food purchasing behaviors. Int J Environ Res Public Health. 2012;9(4):1458-1471. 153. Laska MN, Hearst MO, Forsyth A, Pasch KE, Lytle L. Neighbourhood food environments: Are they associated with adolescent dietary intake, food purchases and weight status? Public Health Nutr. 2010;13(11):1757-1763. 154. Timperio A, Ball K, Roberts R, Campbell K, Andrianopoulos N, Crawford D. Children’s fruit and vegetable intake: Associations with the neighbourhood food environment. Prev Med. 2008;46(4):331-335. 155. Timperio AF, Ball K, Roberts R, Andrianopoulos N, Crawford DA. Children’s takeaway and fast-food intakes: Associations with the neighbourhood food environment. Public Health Nutr. 2009;12(10):1960-1964. 156. Powell LM, Auld MC, Chaloupka FJ, O’Malley PM, Johnston LD. Associations between access to food stores and adolescent body mass index. Am J Prev Med. 2007;33(4 Suppl):S301-307. 177 157. Ding D, Sallis JF, Norman GJ, et al. Community food environment, home food environment, and fruit and vegetable intake of children and adolescents. J Nutr Educ Behav. 2011. 158. Penney TL, Almiron-Roig E, Shearer C, McIsaac J-L, Kirk SFL. Modifying the food environment for childhood obesity prevention: challenges and opportunities. Proc Nutr Soc. 2014;73(2):226-236. 159. Lytle LA. Measuring the food environment: State of the science. Am J Prev Med. 2009;36(4 Suppl):S134-144. 160. Burgoine T, Forouhi NG, Griffin SJ, Wareham NJ, Monsivais P. Associations between exposure to takeaway food outlets, takeaway food consumption, and body weight in Cambridgeshire, UK: Population based, cross sectional study. BMJ. 2014;348:g1464. 161. French SA, Jeffery RW, Story M, Hannan P, Snyder MP. A pricing strategy to promote low-fat snack choices through vending machines. Am J Public Health. 1997;87(5):849-51. 162. French SA, Jefery RW, Story M, Breitlow KK, al et. Pricing and promotion effects on low-fat vending snack puchases: The CHIPS study. Am J Public Health. 2001;91(1):1127. 163. Gordon-Larsen P, Guilkey DK, Popkin BM. An economic analysis of community-level fast food prices and individual-level fast food intake: A longitudinal study. Health Place. 2011;17(6):1235-1241. 164. Sturm R, Datar A. Regional price differences and food consumption frequency among elementary school children. Public Health. 2011;125(3):136-141. 165. Powell LM, Han E. The costs of food at home and away from home and consumption patterns among U.S. adolescents. J Adolesc Health. 2011;48(1):20-26. 166. Powell LM, Han E, Chaloupka FJ. Economic contextual factors, food consumption, and obesity among U.S. adolescents. J Nutr. 2010;140(6):1175 -1180. 167. World Health Organization. Tobacco Free Initiative, Taxation. 2014. Available at: http://www.who.int/tobacco/economics/taxation/en/index.html. Accessed January 22, 2014. 168. Cairns G, Angus K, Hastings G. The Extent, Nature and Effects of Food Promotion to Children: A Review of the Evidence to December 2008. Geneva, Switzerland: World Health Organization; 2009. Available at: http://whqlibdoc.who.int/publications/2009/9789241598835_eng.pdf?ua=1. Accessed January 25, 2014. 169. Elliott C. Assessing “fun foods”: Nutritional content and analysis of supermarket foods targeted at children. Obes Rev. 2008;9(4):368-377. 178 170. Kelly B, Halford JCG, Boyland EJ, et al. Television food advertising to children: A global perspective. Am J Public Health. 2010;100(9):1730-1736. 171. Weber K, Story M, Harnack L. Internet food marketing strategies aimed at children and adolescents: A content analysis of food and beverage brand web sites. J Am Diet Assoc. 2006;106(9):1463-1466. 172. Scully M, Wakefield M, Niven P, et al. Association between food marketing exposure and adolescents’ food choices and eating behaviors. Appetite. 2012;58(1):1-5. 173. Powell LM, Szczypka G, Chaloupka FJ. Trends in exposure to television food advertisements among children and adolescents in the United States. Arch Pediatr Adolesc Med. 2010;164(9):794-802. 174. Molnar A, Garcia DR, Boninger F, Merrill B. Marketing of foods of minimal nutritional value to children in schools. Prev Med. 2008;47(5):504-507. 175. Canadian Teachers’ Federation, Canadian Centre for Policy Alternatives. Commercialism in Canadian Schools: Who’s Calling the Shots? Ottawa, Ontario; 2006. Available at: http://www.policyalternatives.ca/sites/default/files/uploads/publications/National_Office_ Pubs/2006/Commercialism_in_Canadian_Schools.pdf. Accessed January 25, 2014. 176. Minaker LM, Storey KE, Raine KD, et al. Associations between the perceived presence of vending machines and food and beverage logos in schools and adolescents’ diet and weight status. Public Health Nutr. 2011;14(8):1350-1356. 177. Baranowski T. 24-hour recall and diet record methods. In: Nutritional Epidemiology.Vol 40. 3rd ed. New York, NY: Oxford University Press; 2013:49-69. 178. Kremers SPJ. Theory and practice in the study of influences on energy balance-related behaviors. Patient Educ Couns. 2010;79(3):291-298. 179. Trost SG, McDonald S, Cohen A. Measurement of general and specific approaches to physical activity parenting: A systematic review. Child Obes. 2013;9 Suppl:S40-50. 180. Berge JM, Wall M, Larson N, Forsyth A, Bauer KW, Neumark-Sztainer D. Youth dietary intake and weight status: Healthful neighborhood food environments enhance the protective role of supportive family home environments. Health Place. 2014;26:69-77. 181. Golan M. Parents as agents of change in childhood obesity ‐ from research to practice. Int J Pediatr Obes. 2006;1(2):66-76. 182. Epstein LH, Raja S, Daniel TO, et al. The built environment moderates effects of familybased childhood obesity treatment over 2 years. Ann Behav Med. 2012;44(2):248-258. 183. Golley RK, Hendrie GA, Slater A, Corsini N. Interventions that involve parents to improve children’s weight-related nutrition intake and activity patterns - what nutrition 179 and activity targets and behaviour change techniques are associated with intervention effectiveness? Obes Rev. 2011;12(2):114-130. 184. Kimmons J, Gillespie C, Seymour J, Serdula M, Blanck HM. Fruit and vegetable intake among adolescents and adults in the United States: Percentage meeting individualized recommendations. Medscape J Med. 2009;11(1):26. 185. Kit BK, Fakhouri TH, Park S, Nielsen SJ, Ogden CL. Trends in sugar-sweetened beverage consumption among youth and adults in the United States: 1999–2010. Am J Clin Nutr. 2013;98(1):180-188. 186. Sebastian R, Goldman J, Wilkinson Enns C. Snacking Patterns of U.S. Adolescents: What We Eat in American, NHANES 2005-2006. Food Surveys Research Group Dietary Data Brief No. 2; 2010. Available at: http://www.ars.usda.gov/SP2UserFiles/Place/12355000/pdf/DBrief/2_adolescents_snackin g_0506.pdf. Accessed August 7, 2013. 187. Janssen I, Katzmarzyk PT, Boyce WF, King MA, Pickett W. Overweight and obesity in Canadian adolescents and their associations with dietary habits and physical activity patterns. J Adolesc Health. 2004;35(5):360-367. 188. Larson N, Story M. A review of snacking patterns among children and adolescents: What are the implications of snacking for weight status? Child Obes Print. 2013;9(2):104-115. 189. Bandini LG, Vu D, Must A, Cyr H, Goldberg A, Dietz WH. Comparison of high-calorie, low-nutrient-dense food consumption among obese and non-obese adolescents. Obes Res. 1999;7(5):438–443. 190. Raynor HA, Van Walleghen EL, Osterholt KM, et al. The relationship between child and parent food hedonics and parent and child food group intake in children with overweight/obesity. J Am Diet Assoc. 2011;111(3):425-430. 191. Ogden CL, Carroll MD, Kit BK, Flegal KM. Prevalence of obesity and trends in body mass index among us children and adolescents, 1999-2010. JAMA. 2012;307(5):483-490. 192. World Health Organization. BMI-for-age (5-19 years). Available at: http://www.who.int/growthref/who2007_bmi_for_age/en/index.html. Accessed October 4, 2013. 193. Pagoto SL, Appelhans BM. A call for an end to the diet debates. JAMA. 2013;310(7):687688. 194. World Health Organization. WHO AnthroPlus software. Available at: http://www.who.int/growthref/tools/en/. Accessed September 4, 2013. 180 195. Onis M de, Onyango AW, Borghi E, Siyam A, Nishida C, Siekmann J. Development of a WHO growth reference for school-aged children and adolescents. Bull World Health Organ. 2007;85(9):660-667. 196. Onis M de, Garza C, Onyango AW, Borghi E. Comparison of the WHO Child Growth Standards and the CDC 2000 Growth Charts. J Nutr. 2007;137(1):144-148. 197. Dietitians of Canada, Canadian Pediatric Society, The College of Family Physicians of Canada, Community Health Nurses of Canada. Promoting Optimal Monitoring of Child Growth In Canada: Using the New WHO Growth Charts. Collaborative Public Policy Statement. Available at: http://www.dietitians.ca/downloadable-content/public/tcgposition-paper.aspx. Accessed August 18, 2014. 198. World Health Organization. Global Database on Body Mass Index. 2004. Available at: http://apps.who.int/bmi/index.jsp?introPage=intro_3.html. Accessed November 10, 2011. 199. Statistics Canada. Canadian Community Health Survey. 2008. Available at: http://www.statcan.gc.ca/cgibin/imdb/p2SV.pl?Function=getSurvey&SurvId=3226&SurvVer=0&InstaId=15282&Inst aVer=4&SDDS=3226&lang=en&db=IMDB&adm=8&dis=2. Accessed May 29, 2011. 200. Hanning R, Royall D, Toews J, Blashill L, Wegener J, Driezen P. Web-based food behaviour questionnaire: Validation with grades six to eight students. Can J Diet Pract Res. 2009;70(4):172-178. 201. Vittinghoff E, Glidden DV, Shiboski SC, McCulloch CE. Regression Methods in Biostatistics: Linear, Logistic, Survival, and Repeated Measures Models. 2nd ed. New York, NY: Springer; 2011. 202. Hilbe JM. Negative Binomial Regression. Cambridge, UK: Cambridge University Press; 2011. 203. Piza E. Using Poisson and Negative Binomial Regression Models to Measure the Influence of Risk on Crime Incident Counts. Neward, NJ: Rutgers Center on Public Security; 2012. 204. Health Canada. Canada’s Food Guide. 2011. Available at: http://www.hc-sc.gc.ca/fnan/food-guide-aliment/index-eng.php. Accessed August 19, 2013. 205. Center for Nutrition Policy and Promotion, U.S. Department of Agriculture. USDA Food Patterns. 2011. Available at: http://www.cnpp.usda.gov/Publications/USDAFoodPatterns/USDAFoodPatternsSummary Table.pdf. Accessed August 19, 2013. 206. Ball GDC, Lenk JM, Barbarich BN, et al. Overweight children and adolescents referred for weight management: are they meeting lifestyle behaviour recommendations? Appl Physiol Nutr Metab. 2008;33(5):936-945. 181 207. Health Canada. Canadian Community Health Survey, Cycle 2.2, Nutrition (2004) Nutrient Intakes from Food: Provincial, Regional and National Summary Data Tables, Volume 1. Ottawa, ON; 2009. Available at: http://www.hc-sc.gc.ca/fnan/surveill/nutrition/commun/cchs_focus-volet_escc-eng.php#order. Accessed May 29, 2014. 208. Goldberg GR, Black AE, Jebb SA, et al. Critical evaluation of energy intake data using fundamental principles of energy physiology: Derivation of cut-off limits to identify under-recording. Eur J Clin Nutr. 1991;45(12):569-581. 209. Vance VA, Woodruff SJ, McCargar LJ, Husted J, Hanning RM. Self-reported dietary energy intake of normal weight, overweight and obese adolescents. Public Health Nutr. 2008;12(02):222. 210. Martin LJ, Su W, Jones PJ, Lockwood GA, Tritchler DL, Boyd NF. Comparison of energy intakes determined by food records and doubly labeled water in women participating in a dietary-intervention trial. Am J Clin Nutr. 1996;63(4):483-490. 211. Xie B, Gilliland FD, Li Y-F, Rockett HRH. Effects of ethnicity, family income, and education on dietary intake among adolescents. Prev Med. 2003;36(1):30-40. 212. Te Morenga L, Mallard S, Mann J. Dietary sugars and body weight: Systematic review and meta-analyses of randomised controlled trials and cohort studies. BMJ. 2013;346:e7492. 213. Da Veiga GV, Sichieri R. Correlation in food intake between parents and adolescents depends on socioeconomic level. Nutr Res. 2006;26(10):517-523. 214. Willows ND, Hanley AJG, Delormier T. A socioecological framework to understand weight-related issues in Aboriginal children in Canada. Appl Physiol Nutr Metab. 2012;37(1):1-13. 215. Hart Jr A, Tinker L, Bowen DJ, Longton G, Beresford SAA. Correlates of fat intake behaviors in participants in the Eating for a Healthy Life Study. J Am Diet Assoc. 2006;106(10):1605-1613. 216. Glanz K, Basil M, Maibach E, Goldberg J, Snyder D. Why Americans eat what they do: Taste, nutrition, cost, convenience, and weight control concerns as influences on food consumption. J Am Diet Assoc. 1998;98(10):1118-1126. 217. Drewnowski A, Darmon N. Food choices and diet costs: an economic analysis. J Nutr. 2005;135(4):900-904. 218. Breen FM, Plomin R, Wardle J. Heritability of food preferences in young children. Physiol Behav. 2006;88(4-5):443-447. 182 219. Golan M, Kaufman V, Shahar DR. Childhood obesity treatment: Targeting parents exclusively v. parents and children. Br J Nutr. 2006;95(5):1008-1015. 220. Kremers SPJ, Brug J, de Vries H, Engels RC. Parenting style and adolescent fruit consumption. Appetite. 2003;41(1):43-50. 221. Tibbs T, Haire-Joshu D, Schechtman K, et al. The relationship between parental modeling, eating patterns, and dietary intake among African-American parents. J Am Diet Assoc. 2001;101(5):535-541. 222. Hebden L, Hector D, Hardy LL, King L. A fizzy environment: Availability and consumption of sugar-sweetened beverages among school students. Prev Med. 2013;56(6):416-418. 223. Cullen KW, Baranowski T, Rittenberry L, et al. Socioenvironmental influences on children’s fruit, juice and vegetable consumption as reported by parents: Reliability and validity of measures. Public Health Nutr. 2000;3(03):345-356. 224. Ihmels MA, Welk GJ, Eisenmann JC, Nusser SM. Development and preliminary validation of a Family Nutrition and Physical Activity (FNPA) screening tool. Int J Behav Nutr Phys Act. 2009;6(14):1-10. 225. Mâsse LC, Watts AW. Stimulating innovations in the measurement of parenting constructs. Child Obes. 2013;9 Suppl:S5-13. 226. Baranowski T. GEMS: Home Food Availability Questionnaire. 2000. Available at: http://www.bcm.edu/cnrc/faculty/Survey_documents/GEMSQnrs(0102)/PARENTFORMS/GEMS-P%20AVAIL.pdf. Accessed May 29, 2014. 227. Cullen KW, Klesges LM, Sherwood NE, et al. Measurement characteristics of diet-related psychosocial questionnaires among African-American parents and their 8- to 10-year-old daughters: Results from the Girls’ health Enrichment Multi-site Studies. Prev Med. 2004;38 Suppl:34-42. 228. Zarnowiecki D, Ball K, Parletta N, Dollman J. Describing socioeconomic gradients in children’s diets – does the socioeconomic indicator used matter? Int J Behav Nutr Phys Act. 2014;11(44):1-12. 229. Currie J, Stabile M. Socioeconomic status and child health: Why Is the relationship stronger for older children? Am Econ Rev. 2003;93(5):1813-1823. 230. Hu L, Bentler PM. Cutoff criteria for fit indexes in covariance structure analysis: Conventional criteria versus new alternatives. Struct Equ Model Multidiscip J. 1999;6(1):1-55. 231. Byrne BM. Structural Equation Modeling with Mplus: Basic Concepts, Applications, and Programming. New York, NY: Routledge; 2011. 183 232. Raykov T, Marcoulides GA. A First Course in Structural Equation Modeling. 2nd ed. New York, NY: Psychology Press; 2006. 233. Brown TA. Confirmatory Factor Analysis for Applied Research. New York, NY: Guilford Press; 2006. 234. Flora DB, Curran PJ. An empirical evaluation of alternative methods of estimation for confirmatory factor analysis with ordinal data. Psychol Methods. 2004;9(4):466-491. 235. Beauducel A, Herzberg PY. On the performance of maximum likelihood versus means and variance adjusted weighted least squares estimation in CFA. Struct Equ Model Multidiscip J. 2006;13(2):186-203. 236. Kline RB. Principles and Practice of Structural Equation Modeling. New York, NY: Guilford Press; 2011. 237. Muthen L, Muthen B. Mplus User’s Guide. 7th ed. Los Angeles, CA: Muthen & Muthen; 2012. Available at: http://www.statmodel.com/download/usersguide/Mplus%20user%20guide%20Ver_7_r6_ web.pdf. Accessed January 29, 2014. 238. Pearson N, Biddle SJ, Williams L, Worsley A, Crawford D, Ball K. Adolescent television viewing and unhealthy snack food consumption: the mediating role of home availability of unhealthy snack foods. Public Health Nutr. 2012;17(2):317-323. 239. Grimm GC, Harnack L, Story M. Factors associated with soft drink consumption in school-aged children. J Am Diet Assoc. 2004;104(8):1244-1249. 240. Vue H, Reicks M. Individual and environmental influences on intake of calcium-rich food and beverages by young Hmong adolescent girls. J Nutr Educ Behav. 2007;39(5):264-272. 241. Denney-Wilson E, Crawford D, Dobbins T, Hardy L, Okely AD. Influences on consumption of soft drinks and fast foods in adolescents. Asia Pac J Clin Nutr. 2009;18(3):447-452. 242. Ebbeling CB, Feldman HA, Chomitz VR, et al. A randomized trial of sugar-sweetened beverages and adolescent body weight. N Engl J Med. 2012;367(15):1407-1416. 243. Skinner JD, Carruth BR, Wendy B, Ziegler PJ. Children’s food preferences: A longitudinal analysis. J Am Diet Assoc. 2002;102(11):1638-1647. 244. Hammons AJ, Fiese BH. Is frequency of shared family meals related to the nutritional health of children and adolescents? Pediatrics. 2011;127(6):e1565-e1574. 245. Fulkerson JA, Larson N, Horning M, Neumark-Sztainer D. A review of associations between family or shared meal frequency and dietary and weight status outcomes across the lifespan. J Nutr Educ Behav. 2014;46(1):2-19. 184 246. Van der Horst K, Kremers S, Ferreira I, Singh A, Oenema A, Brug J. Perceived parenting style and practices and the consumption of sugar-sweetened beverages by adolescents. Health Educ Res. 2007;22(2):295-304. 247. Hennessy E, Hughes SO, Goldberg JP, Hyatt RR, Economos CD. Parent behavior and child weight status among a diverse group of underserved rural families. Appetite. 2010;54(2):369-377. 248. Gable S, Lutz S. Household, parent, and child contributions to childhood obesity. Fam Relat. 2000;49(3):293–300. 249. Gerards SMPL, Sleddens EFC, Dagnelie PC, Vries NK, Kremers SPJ. Interventions addressing general parenting to prevent or treat childhood obesity. Int J Pediatr Obes. 2011;6(2 Part 2):e28-e45. 250. Bjelland M, Lien N, Grydeland M, et al. Intakes and perceived home availability of sugarsweetened beverages, fruit and vegetables as reported by mothers, fathers and adolescents in the HEIA (HEalth In Adolescents) study. Public Health Nutr. 2011;14(12):2156-2165. 251. Williams LK, Abbott G, Thornton LE, Worsley A, Ball K, Crawford D. Improving perceptions of healthy food affordability: results from a pilot intervention. Int J Behav Nutr Phys Act. 2014;11(33):1-5. 252. Bryant M, Stevens J. Measurement of food availability in the home. Nutr Rev. 2006;64(2):67–76. 253. Ward DS. So, what’s in your house? Strategies for measuring the home food environment. 2013. Available at: http://www.aicr.org/assets/docs/pdf/research/rescon2013/wardmeasuring-home-food-envrionment.pdf. Accessed February 8, 2014. 254. Chapman G, Maclean H. “Junk food” and “healthy food”: Meanings of food in adolescent women’s culture. J Nutr Educ. 1993;25(3):108-113.. 255. De Vet E, de Ridder DTD, de Wit JBF. Environmental correlates of physical activity and dietary behaviours among young people: A systematic review of reviews. Obes Rev. 2011;12(5):e130-142. 256. Holsten JE, Deatrick JA, Kumanyika S, Pinto-Martin J, Compher CW. Children’s food choice process in the home environment. A qualitative descriptive study. Appetite. 2012;58(1):64-73. 257. Croll JK, Neumark-Sztainer D, Story M. Healthy eating: What does It mean to adolescents? J Nutr Educ. 2001;33(4):193-198.. 258. O’dea JA. Why do kids eat healthful food? Perceived benefits of and barriers to healthful eating and physical activity among children and adolescents. J Am Diet Assoc. 2003;103(4):497-501. 185 259. Findholt NE, Michael YL, Davis MM, Brigoitti VW. Environmental influences on children’s physical activity and diets in rural Oregon: Results of a youth photovoice project. Online J Rural Nurs Health Care. 2011;10(2):11-20. 260. St. George SM, Wilson DK. A qualitative study for understanding family and peer influences on obesity-related health behaviors in low-income African-American adolescents. Child Obes. 2012;8(5):466-476. 261. Garcia A, Sykes L, Matthews J, Martin N, Leipert B. Perceived facilitators of and barriers to healthful eating among university students. Can J Diet Pract Res. 2010;71(2):E28. 262. Martin N, Garcia AC, Leipert B. Photovoice and its potential use in nutrition and dietetic research. Can J Diet Pract Res. 2010;71(2):93-97. 263. Glesne C. Becoming Qualitative Researchers, An Introduction. 4th ed. Boston, MA: Pearson; 2011. 264. Kvale S. Interviews: An Introduction to Qualitative Research Interviewing. Thousand Oaks, CA: Sage Publications; 1996. 265. Lopez KA, Willis DG. Descriptive versus interpretive phenomenology: Their contributions to nursing knowledge. Qual Health Res. 2004;14(5):726-735. 266. Dennis Jr. SF, Gaulocher S, Carpiano RM, Brown D. Participatory photo mapping (PPM): Exploring an integrated method for health and place research with young people. Health Place. 2009;15(2):466-473. 267. Wang C, Burris MA. Photovoice: Concept, methodology, and use for participatory needs assessment. Health Educ Behav. 1997;24(3):369 -387. 268. Plunkett R, Leipert BD, Ray SL. Unspoken phenomena: Using the photovoice method to enrich phenomenological inquiry. Nurs Inq. 2012;20(2):156-164. 269. Cook T, Hess E. What the camera sees and from whose perspective. Childhood. 2007;14(1):29-45. 270. Merriam SB. Assessing and evaluating qualitative research. In: Merriam SB, ed. Qualitative Research in Practice: Examples for Discussion and Analysis. 1st ed. San Francisco: Jossey-Bass; 2002. 271. Hennessy E, Kraak VI, Hyatt RR, et al. Active living for rural children: community perspectives using PhotoVOICE. Am J Prev Med. 2010;39(6):537-545. 272. Hannay J, Dudley R, Milan S, Leibovitz PK. Combining photovoice and focus groups: engaging Latina teens in community assessment. Am J Prev Med. 2013;44(3 Suppl 3):S215-224. 186 273. Patton MQ. Qualitative Research & Evaluation Methods. 3rd ed. Thousand Oaks, CA: Sage Publications, Inc; 2001. 274. DeRoche KK, Lahman MKE. Methodological considerations for conducting qualitative interviews with youth receiving mental health services. Qual Soc Res. 2008;9(3):1-18. 275. Christensen PH. Children’s participation in ethnographic research: Issues of power and representation. Child Soc. 2004;18(2):165-176. 276. Eder D, Fingerson L. Interviewing children and adolescents. In: Handbook of Interview Research: Context & Method. Thousand Oaks, CA: Sage Publications; 2002:181-201. 277. Miller S. Researching children: issues arising from a phenomenological study with children who have diabetes mellitus. J Adv Nurs. 2000;31(5):1228-1234. 278. Glaser B, Strauss A. The Discovery of Grounded Theory. Chicago, IL: Aldine; 1967. 279. Hewitt-Taylor J. Use of constant comparative analysis in qualitative research. Nurs Stand. 2001;15(42):39-42. 280. Hsieh H-F, Shannon SE. Three approaches to qualitative content analysis. Qual Health Res. 2005;15(9):1277-1288. 281. Davidsen AS. Phenomenological Approaches in Psychology and Health Sciences. Qual Res Psychol. 2013;10(3):318-339. 282. Lincoln Y, Guba E. Naturalistic Inquiry. Newbury Park, CA: Sage Publications; 1985. 283. Cutcliffe JR, McKenna HP. Establishing the credibility of qualitative research findings: the plot thickens. J Adv Nurs. 1999;30(2):374-380. 284. Simmons D, Chapman GE. The significance of home cooking within families. Br Food J. 2012;114(8):1184-1195. 285. Chu YL, Farmer A, Fung C, Kuhle S, Storey KE, Veugelers PJ. Involvement in home meal preparation is associated with food preference and self-efficacy among Canadian children. Public Health Nutr. 2013;16(1):108-112. 286. Larson NI, Story M, Eisenberg ME, Neumark-Sztainer D. Food preparation and purchasing roles among adolescents: associations with sociodemographic characteristics and diet quality. J Am Diet Assoc. 2006;106(2):211-218. 287. Boutelle KN, Feldman S, Neumark-Sztainer D. Parenting an overweight or obese teen: Issues and advice from parents. J Nutr Educ Behav. 2012;44(6):500-506. 288. Brown R, Ogden J. Children’s eating attitudes and behaviour: a study of the modelling and control theories of parental influence. Health Educ Res. 2004;19(3):261-271. 187 289. Jackson D, Wilkes L, McDonald G. “If I was in my daughter”s body I’d be feeling devastated’: women’s experiences of mothering an overweight or obese child. J Child Health Care. 2007;11(1):29-39. 290. DeJong CS, van Lenthe FJ, van der Horst K, Oenema A. Environmental and cognitive correlates of adolescent breakfast consumption. Prev Med. 2009;48(4):372-377. 291. Olafsdottir S, Berg C, Eiben G, et al. Young children’s screen activities, sweet drink consumption and anthropometry: results from a prospective European study. Eur J Clin Nutr. 2013. 292. Ciccone J, Woodruff SJ, Fryer K, Campbell T, Cole M. Associations among evening snacking, screen time, weight status, and overall diet quality in young adolescents. Appl Physiol Nutr Metab. 2013;38(7):789-794. 293. Mitchell JA, Rodriguez D, Schmitz KH, Audrain-McGovern J. Greater screen time is associated with adolescent obesity: a longitudinal study of the BMI distribution from ages 14 to 18. Obesity. 2013;21(3):572-575. 294. Marshall SJ, Biddle SJH, Gorely T, Cameron N, Murdey I. Relationships between media use, body fatness and physical activity in children and youth: a meta-analysis. Int J Obes Relat Metab Disord. 2004;28(10):1238-1246. 295. Temple JL, Giacomelli AM, Kent KM, Roemmich JN, Epstein LH. Television watching increases motivated responding for food and energy intake in children. Am J Clin Nutr. 2007;85(2):355-361. 296. Dennison BA, Edmunds LS. The role of television in childhood obesity. Prog Pediatr Cardiol. 2008;25(2):191-197. 297. Atkin AJ, Corder K, van Sluijs EM. Bedroom media, sedentary time and screen-time in children: a longitudinal analysis. Int J Behav Nutr Phys Act. 2013;10(137):1-10. 298. De la Haye K, Robins G, Mohr P, Wilson C. Obesity-related behaviors in adolescent friendship networks. Soc Netw. 2010;32(3):161-167. 299. Fowler JH, Christakis NA. Estimating peer effects on health in social networks: A response to Cohen-Cole and Fletcher; Trogdon, Nonnemaker, Pais. J Health Econ. 2008;27(5):1400-1405. 300. Black JL, Day M. Availability of limited service food outlets surrounding schools in British Columbia. Can J Public Health. 2012;103(4):e255-259. 301. Pearce J, Wood L, Nelson M. Lunchtime food and nutrient intakes of secondary-school pupils; a comparison of school lunches and packed lunches following the introduction of mandatory food-based standards for school lunch. Public Health Nutr. 2013;16(6):11261131. 188 302. Stevens L, Nicholas J, Wood L, Nelson M. School lunches v. packed lunches: A comparison of secondary schools in England following the introduction of compulsory school food standards. Public Health Nutr. 2013;16(6):1037-1042. 303. Kubik MY, Lytle LA, Story M. Schoolwide food practices are associated with body mass index in middle school students. Arch Pediatr Adolesc Med. 2005;159(12):1111-1114. 304. Kubik MY, Lytle LA, Hannan PJ, Story M, Perry CL. Food-related beliefs, eating behavior, and classroom food practices of middle school teachers. J Sch Health. 2002;72(8):339-345. 305. Isoldi KK, Dalton S, Rodriguez DP, Nestle M. Classroom “cupcake” celebrations: Observations of foods offered and consumed. J Nutr Educ Behav. 2012;44(1):71-75. 306. Rossiter M, Glanville T, Taylor J, Blum I. School food practices of prospective teachers. J Sch Health. 2007;77(10):694–700. 307. Mâsse LC, Naiman D, Naylor P. From policy to practice: Implementation of physical activity and food policies in schools. Int J Behav Nutr Phys Act. 2013;10(71):1-12. 308. Schwartz MB, Novak SA, Fiore SS. The impact of removing snacks of low nutritional value from middle schools. Health Educ Behav. 2009;36(6):999-1011. 309. Huang R, Kiesel K. Does limited access at school result in compensation at home? The effect of soft drink bans in schools on purchase patterns outside of schools. Eur Rev Agric Econ. 2012;39(5):797-820. 310. Black JL, Carpiano RM, Fleming S, Lauster N. Exploring the distribution of food stores in British Columbia: Associations with neighbourhood socio-demographic factors and urban form. Health Place. 2011;17(4):961-970. 311. Neumark-Sztainer D, French SA, Hannan PJ, Story M, Fulkerson JA. School lunch and snacking patterns among high school students: Associations with school food environment and policies. Int J Behav Nutr Phys Act. 2005;2(14):1-7. 312. French S, Story M, Jeffrey R, et al. Pricing strategy to promote fruit and vegetable purchase in high school cafeterias. J Am Diet Assoc. 1997;97(9):1008-1010. 313. Brownell KD, Schwartz MB, Puhl RM, Henderson KE, Harris JL. The need for bold action to prevent adolescent obesity. J Adolesc Health. 2009;45(3 Suppl):S8-S17. 314. Mytton OT, Clarke D, Rayner M. Taxing unhealthy food and drinks to improve health. BMJ. 2012;344:e2931. 315. Dhar T, Baylis K. Fast-food consumption and the ban on advertising targeting children: The Quebec experience. J Mark Res. 2011;48(5):799-813. 189 316. World Health Organization. Set of Recommendations on the Marketing of Foods and Non-Alcoholic Beverages to Children. Geneva, Switzerland; 2010. Available at: http://whqlibdoc.who.int/publications/2010/9789241500210_eng.pdf?ua=1. Accessed January 25, 2014. 317. Norman GJ, Zabinski MF, Adams MA, Rosenberg DE, Yaroch AL, Atienza AA. A review of eHealth interventions for physical activity and dietary behavior change. Am J Prev Med. 2007;33(4):336-345. 318. Chang T, Chopra V, Zhang C, Woolford SJ. The role of social media in online weight management: Systematic review. J Med Internet Res. 2013;15(11):e262. 319. Loss J, Lindacher V, Curbach J. Online social networking sites—a novel setting for health promotion? Health Place. 2014;26:161-170. 320. Lytle LA. Examining the etiology of childhood obesity: The IDEA study. Am J Community Psychol. 2009;44:338-349. 321. Johnson RB, Onwuegbuzie AJ. Mixed methods research: A research paradigm whose time has come. Educ Res. 2004;33(7):14-26. 322. Creswell JW, Fetters MD, Ivankova NV. Designing a mixed methods study in primary care. Ann Fam Med. 2004;2(1):7-12. 323. Borkan JM. Mixed methods studies: A foundation for primary care research. Ann Fam Med. 2004;2(1):4-6. 324. Magarey A, Watson J, Golley RK, et al. Assessing dietary intake in children and adolescents: Considerations and recommendations for obesity research. Int J Pediatr Obes. 2011;6(1):2-11. 325. Brownson RC, Chriqui JF, Stamatakis KA. Understanding evidence-based public health policy. Am J Public Health. 2009;99(9):1576-1583. 326. Kelly AS, Barlow SE, Rao G, et al. Severe obesity in children and adolescents: identification, associated health risks, and treatment approaches a scientific statement From the American Heart Association. Circulation. 2013:CIR.0b013e3182a5cfb3. 327. Statistics Canada. The Canadian Population in 2011: Population Counts and Growth. Ottawa, ON; 2012. Available at: http://www12.statcan.ca/census-recensement/2011/assa/98-310-x/98-310-x2011001-eng.cfm. Accessed May 5, 2014. 328. Baranowski T, O’Connor T, Hughes S, et al. Houston... We have a problem! Measurement of parenting. Child Obes. 2013;9 Suppl:S1-4. 329. Oude Luttikhuis H, Baur L, Jansen H, et al. Interventions for treating obesity in children. Cochrane Database Syst Rev. 2009;3:1-57. 190 330. Baranowski T, Cullen KW, Baranowski J. Psychosocial correlates of dietary intake: Advancing dietary intervention. Annu Rev Nutr. 1999;19(1):17-40. 331. Leventhal T, Jeanne B-G. Diversity in developmental trajectories across adolescence: neighbourhood influences. In: Handbook of Adolescent Psychology. 2nd ed. New Jersey, NY: John Wiley & Sons; 2004:451-486. 332. Nestle M, Jacobson MF. Halting the obesity epidemic: A public health policy approach. Public Health Rep. 2000;115(1):12-24. 333. Centers for Disease Control and Prevention. Achievements in Public Health, 1900-1999: Tobacco Use -- United States, 1900-1999. MMWR Morb Mortal Wkly Rep. 1999;48(43):986-993. 334. Pentz MA, Brannon BR, Charlin VL, Barrett EJ, MacKinnon DP, Flay BR. The power of policy: The relationship of smoking policy to adolescent smoking. Am J Public Health. 1989;79(7):857-862. 335. Lovato C, Watts A, Brown KS, et al. School and community predictors of smoking: A longitudinal study of Canadian high schools. Am J Public Health. 2013;103(2):362-368. 336. Mâsse LC, Niet JE de. School nutritional capacity, resources and practices are associated with availability of food/beverage items in schools. Int J Behav Nutr Phys Act. 2013;10(26):1-12. 337. Mâsse LC, Niet-Fitzgerald JE de, Watts AW, Naylor P-J, Saewyc EM. Associations between the school food environment, student consumption and body mass index of Canadian adolescents. Int J Behav Nutr Phys Act. 2014;11(29):1-9. 338. Taber DR CJ. Differences in nutrient intake associated with state laws regarding fat, sugar, and caloric content of competitive foods. Arch Pediatr Adolesc Med. 2012;166(5):452458. 339. National Cancer Institute. Greater Than the Sum: Systems Thinking in Tobacco Control. Bethesda, MD: U.S. Department of Health and Human Services, National Institutes of Health, National Cancer Institute; 2007. Available at: http://cancercontrol.cancer.gov/brp/tcrb/monographs/18/m18_complete.pdf. Accessed May 14, 2014. 340. Huang TT, Drewnosksi A, Kumanyika S, Glass TA. A systems-oriented multilevel framework for addressing obesity in the 21st century. Prev Chronic Dis. 2009;6(3):A82. 341. Economos CD, Hyatt RR, Goldberg JP, et al. A community intervention reduces BMI zscore in children: Shape Up Somerville first year results. Obesity. 2007;15(5):1325-1336. 191 342. Runyan JD, Steenbergh TA, Bainbridge C, Daugherty DA, Oke L, Fry BN. A smartphone ecological momentary assessment/intervention “app” for collecting real-time data and promoting self-awareness. PLoS ONE. 2013;8(8):e71325. 343. Shiffman S, Stone AA, Hufford MR. Ecological momentary assessment. Annu Rev Clin Psychol. 2008;4:1-32. 344. Thomas JG, Doshi S, Crosby RD, Lowe MR. Ecological momentary assessment of obesogenic eating behavior: Combining person-specific and environmental predictors. Obesity. 2011;19(8):1574-1579. 345. Brown RM. Adolescents’ relationships with peers. In: Handbook of Adolescent Psychology. 2nd ed. New Jersey, NY: John Wiley & Sons; 2004:363-394. 346. Stock S, Miranda C, Evans S, et al. Healthy Buddies: A novel, peer-led health promotion program for the prevention of obesity and eating disorders in children in elementary school. Pediatrics. 2007;120(4):e1059-e1068. 347. Lloyd-Richardson EE, Jelalian E, Sato AF, Hart CN, Mehlenbeck R, Wing RR. Two-year follow-up of an adolescent behavioral weight control intervention. Pediatrics. 2012;130(2):e281-e288. 348. Katz DL, O’Connell M, Njike VY, Yeh M-C, Nawaz H. Strategies for the prevention and control of obesity in the school setting: Systematic review and meta-analysis. Int J Obes. 2008;32(12):1780-1789. 349. Patrick K, Marshall SJ, Davila EP, et al. Design and implementation of a randomized controlled social and mobile weight loss trial for young adults (project SMART). Contemp Clin Trials. 2013;37(1):10-18. 350. Li JS, Barnett TA, Goodman E, Wasserman RC, Kemper AR. Approaches to the prevention and management of childhood obesity: The role of social networks and the use of social media and related electronic technologies: A scientific statement from the American Heart Association. Circulation. 2013;127(2):260-267. 351. Sobol-Goldberg S, Rabinowitz J, Gross R. School-based obesity prevention programs: A meta-analysis of randomized controlled trials. Obesity. 2013;21(12):2422-2428. 352. Greener J, Douglas F, van Teijlingen E. More of the same? Conflicting perspectives of obesity causation and intervention amongst overweight people, health professionals and policy makers. Soc Sci Med. 2010;70(7):1042-1049. 353. Lawrence RG. Framing obesity the evolution of news discourse on a public health issue. Harv Int J Press. 2004;9(3):56-75. 192 Appendices Appendix A A.1 MySteps® Consort Chart Total Sample (N=617) 75 Invalid communication 88 Could not be reached Phone Screen (N=454) 49 Not eligible 193 Declined to participate 6 Could not be reached Email Screen (N=211) 28 Declined to participate Assessment 1 (N=183) 7 Not eligible 16 Declined to participate Assessment 2 (N=160) 12 Could not be reached for assessment 43 Dropped out Assessment 3 (N=105) 9 Could not be reached for assessment Assessment 4 (N=96) 193 A.2 Goldberg Cut-off Calculations The estimated energy requirements (Energy Intake (EI) / Estimated Basal Energy Expenditure for one day (BEEest)) of sample participants is compared to expected energy requirements based on a formula that accounts for measurement error and both study design and sample characteristics, including calculation of the physical activity coefficient (PAL) (Goldberg Cut-off ).1 Estimated Energy Requirements of Sample:2 BEEest for overweight girls/boys aged 3 to 18 years3 =420-(33.5*age) + (418*height) + (16.7*weight) if female =516-(26.8*age) + (347*height) + (12.4*weight) if male BEEest for adults4 =293-(3.8*age) + (456.4*height)+ (10.12*weight) if male =247-(2.67*age) + (401.5*height)+ (8.6*weight) if female EI/BEEestteen = 0.98 EI/BEEestparent = 1.18 Expected Energy Requirements of Sample (PAL calculation3 and Goldberg Formula5): PALteen=[(metvalue-1)*((1.15/0.9)*duration)/1440]÷[BEEest/(0.0175*1440*weight)]÷#days+1.1 =1.43 PALparent=[(metvalue-1)*((1.15/0.9)*duration)/1440]÷[BEEest/(0.0175*1440*weight)]÷#days +1.1 =1.49 194 Goldberg cut-offteen=PALteen X exp[-2 * (s/100)/√sample size) s=√(within subject variation in EI/days of recall) + precision of BEE measurement + total variation in PAL = √ 262/2.5+8.52+62 =19.46 =1.43 X exp[-2 * (19.46/100)/ √170) =1.38 Goldberg cut-offparent=PALparent X exp[-2 * (s/100)/√sample size) s=√(within subject variation in EI/days of recall) + precision of BEE measurement + total variation in PAL = √ 262/2.5+8.52+82 =20.17 =1.49 X exp[-2 * (20.17/100)/ √170) =1.45 1 Goldberg GR, Black AE, Jebb SA, Cole TJ, Murgatroyd PR, Coward WA, Prentice AM. Critical evaluation of energy intake data using fundamental principles of energy physiology: Derivation of cut-off limits to identify under-recording. Eur J Clin Nutr. 1991; 45(12): 569-581. 2 Institutes of Medicine. Dietary Reference Intakes for Energy, Carbohydrate, Fiber, Fat, Fatty Acids, Cholesterol, Protein, and Amino Acids. 2005 The National Academies Press. Washington, D.C. 3 Academey of Nutrition and Dietetics. Determining Energy Needs in Overweight Children and Adolescents. http://andevidencelibrary.com/topic.cfm?cat=3060&auth=1, Accessed March 31, 2014 4 Gerrior S, Juan W, Basiotis P. An Easy Approach to Calculating Estimated Energy Requirements. Preventing Chronic Disease. 2006; 3(4):1-4. 5 Black AE. Critical evaluation of energy intake using the Goldberg cut-off for energy intake: baal metabolic rate. A practical guide to its calculation, use and limitations. Int J Obes. 2000; 24(9): 1119-30 195 A.3 Modeling Habits from MySteps® Teen Survey Now that we have asked about your friends, we will ask the same questions about your PARENTS. Never Sometimes Frequently Always My parents eat vegetables when I am with them My parents eat fruits when I am with them My parents eat salad at a restaurant when I am with them My parents eat low fat snacks when I am with them My parents eat low fat dressings with salads when I am with them 196 A.4 Home Food Availability Questions from MySteps® Parent Survey The next questions will ask about food availability in your home. 1. 2. 3. 4. 5. 6. 7. 8. Did you have bacon or sausage in your home in the PAST WEEK? No Yes If “yes” What type of bacon or sausage did you have in your home in the PAST WEEK? Regular Reduced fat Did you have cookies, pies, cakes, or snack cakes in your home in the PAST WEEK? No Yes If “yes” What type of cookies, pies, cakes, or snack cakes did you have in your home in the PAST WEEK? Regular Low fat Did you have chips (e.g., potato, corn, tortilla or Doritos chips) in your home in the PAST WEEK? No Yes If “yes” what type of chips (e.g., potato, corn, tortilla or Doritos chips) did you have in your home in the PAST WEEK? Regular Reduced fat or baked Did you have ice cream or frozen yogurt in your home in the PAST WEEK? No Yes If “yes” What type of ice cream/frozen yogurt did you have in your home in the PAST WEEK? Regular Low fat Did you have granola bars in your home in the PAST WEEK? No Yes If “yes” What type of granola bars did you have in your home in the PAST WEEK? Regular Low fat or fat free Did you have TV dinners or frozen entrees in your home in the PAST WEEK? No Yes If “yes” What type of TV dinners or frozen entrees did you have in your home in the PAST WEEK? Regular Reduced fat Did you have hot dogs in your home in the PAST WEEK? No Yes If “yes” What type of hot dogs did you have in your home in the PAST WEEK? Regular Reduced fat Did you have sodas or soft drinks in your home in the PAST WEEK? No Yes If “yes” What type sodas or soft drinks did you have in your home in the PAST WEEK? Regular Reduced calories or sugar free 197 A.5 Authoritative Parenting Scale Items from the MySteps® Parent Survey Please indicate the extent to which you never, sometimes, often, or always do the following: 1. 2. 3. 4. 5. 6. 7. 8. 9. 10. 11. 12. 13. 14. 15. 16. I want to hear about my child’s problems I make sure my child tells me where he/she is going I usually know where my child is after school I tell my child when he/she does a good job on things I am interested in my child’s school work I check to see if my child does his/her homework I often ask my child what he/she does with friends I make my child feel better when he/she is upset I tell my child that I like my child just the way he/she is I am usually pleased with how my child behaves I tell my child times when he/she must come home It is hard for me to say ‘no’ to my child I am always telling my child what to do I make rules without asking my child what he/she thinks I forget the rules I make for my child I can be talked into things easily Never Sometimes Often Always 198 A.6 Demographic Questions from the MySteps® Parent Survey 1. People living in Canada come from different cultural and racial backgrounds. Please read all the categories and select all that apply. Aboriginal decent (e.g., North American Indian, Métis or Inuit (Eskimo)) White Chinese South Asian (e.g., East Indian, Pakistani, Sri Lankan, etc…) Black (e.g., African, Haitian, Jamaican, Somali, etc…) Filipino Latin American South East Asian (e.g., Vietnamese, Cambodian, Malaysian, Laotian, etc…) Arab West Asian (e.g., Iranian, Lebanese, Moroccan, Afghan, etc…) Korean Japanese Other If you selected other above, please specify. Otherwise skip to the next question._________________ 2. What is the highest degree, certificate, or diploma you have obtained? High school or less than high school education Trade certificate or diploma from a vocational school or apprenticeship training Non-university certificate or diploma from a community college, CEGEP, school of nursing, University certificate below bachelor’s level Bachelor’s degree University degree or certificate above bachelor’s degree 3. What is the highest degree, certificate, or diploma your spouse or common-law partner has obtained? Not applicable since I do not have a spouse or partner High school or less than high school education Trade certificate or diploma from a vocational school or apprenticeship training Non-university certificate or diploma from a community college, CEGEP, school of nursing, University certificate below a bachelor’s level Bachelor’s degree University degree or certificate above a bachelor’s degree 4. What is your marital status? Single Married Living common-law Widowed Separated Divorced 5. Would you consider your family to be a single or dual income family? single income family dual income family – both working full time dual income family – only one of us is working full time dual income family – both working part time Not working at the present time 199 6 What is your best estimate of the TOTAL income, before taxes and deductions, of all household members from all sources in the past 12 months? $0 – $20,000 $20,001 – $30,000 $30,001 – $40,000 $40,001 – $50,000 $50,001 – $60,000 $60,001 – $70,000 $70,001 – $80,000 $80,001 – $90,000 $90,001 – $100,000 $100,001 – $120,000 $120,001 – $140,000 $140,001 – $160,000 $160,001 – or above 7.The following questions ask about the number of people in your household. Please read each question carefully. If the question does not apply to you, select 0. How many adults 18 years of age or older live in your household? 1 (yourself only) 2 3 4 5 6 or more How many children between 12 and 17 years of age live in your household? 0 1 2 3 4 5 6 or more How many children between 5 and 11 years of age live in your household? 0 1 2 3 4 5 6 or more How many children 4 years of age or younger live in your household? 0 1 2 3 4 5 6 or more 200 A.7 MySteps® Family Practices Survey 201 Appendix B B.1 Consent Form Parent Consent Form Subject Assent Form (14 Years and Older) *Note: “you” refers to “you” or “your child” throughout this consent form Principal Investigator: [Contact Information] Co-Investigators: [Contact Information] Sponsor: [Contact Information] Purpose: In adolescents, as in adults, lack of physical activity, poor dietary habits, and being inactive are risk behaviours that can play an important role in the development of overweight and obesity. Programs that address these modifiable behaviours provide a first approach for the treatment of obesity among adolescents. There is some evidence that programs which target these modifiable behaviours can be delivered through the internet. You previously participated in the MySteps program and you are now being invited to take part in this interview because we would like to understand your experiences using the MySteps program and the barriers you may have faced in changing your behaviours. Specifically, we would like to determine which strategies of the program you found useful and which strategies you found not useful. Adolescents will also be participating in an added component of the study to determine how they perceive and interact with the food environment. The Photovoice method will be used for this portion. PhotoVoice is a type of research that gives participants cameras so that they can take pictures and create images that show others: “their world, their experiences as well as their point-of-view, in this case, relating to things that make it easier or more difficult to make healthful food choices at home, at school, and in their communities”. Adolescents will be given cameras and will be instructed to take photographs that depict things in their environment they feel help or get in the way of making healthful and less healthful food choices at home, school, and in their community. Procedures: A total of 25 parents and adolescents will be invited to participate in the interviews. Parents will be asked to participate in a 45 to 60 minute interview which focuses on their experiences in the MySteps program. Adolescents will be asked to participate in 2 interviews. The first will be a 45 to 60 minute interview where they will be asked about their thoughts and experiences regarding the MySteps program. They will also be taught how to use a camera to capture photos related to their food environment. Their second visit will happen 1 week after their first visit. At this visit, they will be asked to share 5-10 of their photographs and discuss how the photographs are related to their abilities to make healthful and less healthful choices related to nutrition. All interviews will be audio recorded and will take place at the Clinical Research Evaluation Unit at BC Children’s Hospital. 202 Participants: To be eligible to participate, you must have previously enrolled in the MySteps program. Voluntary Participation: Your participation in this study is entirely voluntary and you may refuse to participate. Further, you may terminate participating in the interview at any time without giving a reason. There are no penalties for not participating or withdrawing from the study. Data collected up to the point of withdrawal from the study must be kept for data analysis purposes under strict provisions of confidentiality. Potential Risks: There are no known risks or discomforts from participating in this study. Potential Benefits: There are no known direct benefits from participating in this study. However, by participating in this study, you will provide the research team with valuable information regarding the use of the web based program in modifying health behaviours. Adolescents will also be given an opportunity to talk about some of the factors that influence their food choices, and their views on healthful and less healthful eating in general. Your words and your pictures may allow others to understand factors that make it easier or more difficult to make healthful food choices, and may be a way for the concerns and needs of adolescents to be brought to researchers, health professionals, and policy-makers. Confidentiality: All documents will be identified only by a code number and will be kept in a locked filing cabinet. Your name and code will not be stored with the data. All data records will be put on a secure password protected web server which will only be accessed by the research staff. All photographs will only be identified with a code and will be stored on a secure password protected server. All audio recordings will only be identified with a code. Only the research staff will have access to data linking your code with your name and this information will be stored on a secure, password protected server. Audio recordings will be downloaded and put on a secure web server which can only be accessed by the research staff. All data, including photographs and digital audio files, will be destroyed 5 years after publication of the data. Once the data are no longer needed, they will be shredded and audio and digital recordings will be permanently erased. No photographs taken will be used without your written permission. Any reports of the completed study will present only group data so you will never be identified by name and your data will remain private at all times. Remuneration/Compensation: In recognition of your contribution to this study, parents will receive $10. Adolescents will receive $10 at their first visit and $25 at their second visit. Adolescents will also be entered into a draw to win one of the cameras used in the study. Contact Information: 203 If you have any questions or desire further information with respect to this study, you may contact a member of our research staff at [Contact Information. Contact for Concerns about the Rights of Research Subjects: If you have any concerns about your rights as a research subject and/or your experiences while participating in this study, contact the Research Subject Information Line in the University of British Columbia Office of Research Services [Contact Information]. Parent Consent: I have read and understood the study information and consent form. I have had sufficient time to consider the information provided and to ask for advice if necessary. I understand that my participation as well as that of my son/daughter are entirely voluntary. We are completely free to refuse to participate or withdraw from the study at any time without changing the quality of care that we receive in any way. I have been told that I will receive a dated and signed copy of this form as well as a copy of my son/daughter’s assent form. Signing this consent form in no way limits your legal rights against the sponsor, investigators, or anyone else. My signature below indicates that I have received a signed and dated copy of this consent form for my own records. I consent to my son/daughter’s participation in the study. ______________________________________________ Adolescent’s name I consent to participate in the study. _______________________________________________ Name and Signature of Parent I, the parent/guardian, and the researcher are satisfied that the information contained in this consent form and the subject assent form were explained to my son/daughter to the extent that he/she is able to understand it, that all questions have been answered, and that my son/daughter assents to participating in the research. ______________________________________________________________________________ Parent or Guardian Printed Name Date ______________________________________________________________________________ Signature of Parent or Guardian Date ______________________________________________________________________________ Principal Investigator or Designate Name Date ______________________________________________________________________________ Signature of Principal Investigator or Designate Date 204 SUBJECT ASSENT 14 YEARS OF AGE AND OLDER I have had the opportunity to read this consent form, to ask questions about my participation in this research, and to discuss my participation with my parents/guardians. All my questions have been answered. I understand that I may withdraw from this research at any time, and that this will not interfere with the availability to me of other health care. I have received a copy of this consent form. I assent to participate in this study. I agree to answer questions about the MySteps program I agree to taking photos about my food environment ______________________________________________________________________________ Adolescent’s Printed Name Date ______________________________________________________________________________ Signature of Adolescent Date 205 Subject Assent Form 11-13 Year Old Children Invitation I am being invited to be a part of a research study. It is up to me if I want to be in this study. No one will make me be a part of this study. Even if I agree now to be part of the study, I can change my mind later. No one will be mad at me if I choose not be a part of this study. Why Are We Doing This Study? This study will help us learn what you found helpful and not helpful about the MySteps program. It will also help us understand what makes it easier or harder for adolescents to make healthful food choices when they are at home, at school, and in their community. What Will Happen in This Study? If I agree to participate in this study, my parents and I will meet with the research team twice. Each visit will last between 45 minutes and 1 hour. At the first visit, I will: Answer a few questions about my experiences using the MySteps program I will learn about Photovoice I will learn how to use a digital camera to tell researchers the difficulties I face at home, at school, and within my community to make healthful food choices I will take photographs using the digital camera provided At the second visit, I will: Talk about the photos I took and explain how they show the barriers I face in making healthful food choices Write a few sentences that describe my feelings about the photos I took Who is doing this study? Dr. Louise Mâsse and researchers at the University of British Columbia are carrying out this study. They will answer any questions I have about the study. I can also call them at 604-875-3629 if I have any questions. Can Anything Bad Happen to Me? Nothing bad can happen to me by participating in this study. Who Will Know I Am in the Study? Only people involved in the study will know I am in it. There is a chance that others will find out that I am participating in this study. For example, they might see me with project materials, or while taking photographs when I’m at home, school or in my community. When the study is finished, the researchers will write a report about what was learned. This report will not say my name or that I was in the study. My parents and I do not have to tell anyone I am in the study if we don’t want to. 206 When Do I Have to Decide? I have as much time as I want to decide to be a part of this study. I have also been asked to discuss my decision with my parents. Do I get anything for participating in this study? For participating in this study, I will receive $10 cash at my first visit with the research team and $25 cash at my second visit with the research team. I will also be entered into a draw to win one of the digital cameras that was used in this study. Signature If I put my name at the end of this form, it means that I agree to be in this study. I agree to answer questions about the MySteps program I agree to taking photos about my food environment Printed Name Signature Date 207 B.2 Ethics Handout Etiquette, ethics and responsible photography Etiquette: Etiquette means being kind and thoughtful asking permission to take someone’s picture, for example, even when permission is not required by law. Ethics and responsibilities: Ethical photography means being aware of how photographs portray people – issues may include embarrassment, ridicule and stereotyping, for example. Some rules are easy to understand: for example, you cannot take photographs inside other people’s homes. A photographer has a responsibility to consider how a photograph may portray someone or some group in a negative way. In addition, a photographer must think about how a photograph may be misinterpreted by others. How do you think a photograph might be misunderstood or misinterpreted? How might a photograph embarrass somebody? Risks: Photographing certain behaviours may be risky for the photographer. For example, if you take a picture of someone doing something wrong – like throwing trash on the sidewalk—that person may become angry. Think of examples of behaviours you should avoid photographing. Remember: etiquette, ethics and responsible photography are meant to protect both subjects of photographs and photographers. 208 Obtaining consent: Private AVOID PICTURES HERE Need to use consent form Non-Identifiable A B A W C D W Identifiable W e e aW W a re er ea ae ar ra Public/Group Settings te et ta at ht th te *It is generally acceptable to useet images where people are not easily eh he identifiable (such as group settings) ne en and are public. However, when a person is easily recognizable and de the ed situation is private, you need o n no a picture that includes the face of a permission. For example, if you take fd df friend, a student or teacher at your to otschool, or someone in the community then you will have to get their permission. hf fh Permission is their signature et tewill need to return forms with your on the Subject Release Form. You ih hi camera next week. ne en ti it Camera Tips: en ne rt t 1. If you are taking a pictureve ofresomeone, first get their consent. v ri 2. Do not put yourself at riskir when trying to take photos. ev ve 3. Be creative with your camera. w i iw Try using different techniques, ,e e, taking photos. perspectives and themes when iw w i 4. Keep fingers out of camera’s s, ,s eye i it 5. Place sun at your back if tpossible hs sh et te rh hr ee ee ar ra 209 ne en ya ay tn nt hy yh it ti A A W W B.3 Subject Release Form Subject Release Form [printed on project letterhead] I am taking pictures for a research study about adolescents to understand the factors that influence food choices at home, at school, and in the community. I would like to photograph you. It is your right to refuse or to consent to have your picture taken. By signing the form below: You are providing me with consent to take your picture and possibly include the photo in the project You understand that there is a possibility that these pictures may be used publicly in a written report, presentation or research display You are aware that the researchers will take steps to protect my privacy and confidentiality at all times. Your name will not appear on any photo/material) and photographs will be destroyed 5 years after publication of the data. _________________________________ Name of subject ___________________________________________________________________________ Signature Date __________________________________ Name of person who obtained consent ___________________________________________________________________________ Signature Date The person who may be contacted about the research is [Researcher Contact Information] 210 B.4 Letter of Explanation [printed on project letterhead] To Whom it May Concern, The individual carrying this letter is a participant in a research study being conducted at the University of British Columbia. The goal of our project is to understand the difficulties adolescents face in making healthful food choices at home, at school, and within their communities. Each participant is given a digital camera for 7 to 14 days so that they can take pictures of things in their environment that they feel makes it easier or more difficult to make healthful food choices. They have been instructed on photography techniques as well as ethical issues surrounding privacy and confidentiality when taking photographs. Participants have a “Subject Consent Form” that is to be used if they wish to take a photo that includes an identifiable individual and is in a private space. They have been instructed to gain written consent before taking a photograph of this nature. We ask that you allow this student to take photographs at school that depict barriers or facilitators to healthful food choices. If you have any questions about the study or the cameras, please feel free to contact [Researcher Information]. Thank you for your understanding and cooperation with our research! Sincerely, [Researcher Contact Information] 211 B.5 Photo Log PHOTO LOG Participant ID:__________________________________ Date:________________________________________ Photo # Location: This is a photo of: I took this photo because: 1 2 3 4 5 212 B.6 Photovoice Interview Guide Interview Guide Study Visit #2 (ADOLESCENT ONLY) Interview Preparation: Test the audio recorder: record your voice from both the interviewer’s and subject’s chairs and replay to ensure your voice is recorded clearly from both seats. Troubleshoot as needed. Prepare the recorder for recording the interview. Greet Participant. Upon arrival of the subject, collect the digital camera and confirm the subject’s willingness to participate in the interview and discuss consent before proceeding with the interview. Let parent and adolescent know that you will have them read a Photograph Release Form at the end of the visit. Parent will wait outside during the interview. Introductory Script: Thank you again for agreeing to participate in our study. This interview will take between 45 minutes and 1 hour. [Dictate date and time of the interview so that it is audio-recorded] All your answers are completely confidential and your name will not appear on any of the materials. Is it okay to audiotape our interview? We are asking adolescents to record the interview so we can accurately capture your experience in your own words. I will be writing down everything that is recorded but I will not put your real name on them to protect your identity and privacy. You have control over the tape recorder, so you can turn it off at any time if you would like to stop the interview. Interview Script: [Upload and present the selected photographs on the computer screen] Pictures #1- #5: 1. Tell me about this picture? [Probe for more detail about the photograph]: 2. Can you tell me more about why you took this picture? 3. How important do you think this is for what you decide to eat or drink (healthful vs. less healthful)? 4. Can you tell me more about how this makes it easier or harder for you to make a healthful food choice? 213 5. Was this at home, at school or in another location? [if any pictures include other people, discuss diagram from instruction session to see if permission should have been obtained and ask participant about the scenario] Did you ask that person if you could take their picture? Did you get them to sign the Release Form I provided at our last visit? [Collect release form here. If no release form is provided, photograph will be deleted from database] 6. Were there any other pictures that you wanted to take but didn’t, or couldn’t, that you want to talk about? [if they didn’t include photos in all locations probe on the location they didn’t talk about - home setting, school setting, or community setting such as places they go after school, friend’s houses, places they go on the weekend (e.g. movie theatre, mall)] Can you tell me more about what makes it hard to pick healthful foods/drinks when you are at school?; Can you tell me more about what makes it hard to pick healthful foods/drinks when you are at home?; Can you tell me more about what makes it hard to pick healthful foods/drinks when you are visiting other places after school or on weekends? E.g. Can you think of anything at school that makes it easier for you to pick something healthful to eat or drink for lunch or snacks? Can you think of anything at school that makes it hard to pick a healthful lunch or snack? 7. Is there anything else you would like to ask or talk about with me that we haven’t talked about today? [Photograph Release Forms – have parent and adolescent complete release forms. Discuss any photographs where consent was not given by subject in photograph] This is the end of our interview. Thank you again for taking the time to talk with me today. If you think of anything else you’d like to tell me after our interview raises other thoughts for you in the coming days and you would like to share them with us, please feel free to contact me by phone or by email. As a token of appreciation, I am providing you with $25 to compensate you for your time. I will burn your pictures onto a CD and will send them to you within the next couple of weeks. I will also be entering your name into a draw for the digital cameras we used in this study. [Stop recorder and provide card with contact information] [Ask the adolescent and parent if they would be willing to participate in a short follow-up phone interview to go over the findings from this study that will be done with two or three of the adolescents who participated in the Photovoice project. If yes, make a note on the field notes form] [Take field notes as soon as possible after the participant has left] 214 B.7 Photograph Release Form Photograph Release Form [printed on project letterhead] 1. In addition to the researcher’s study, I give permission for my pictures/my adolescent’s pictures to be used for (check box): Other published papers on this topic Public presentations on this topic DO NOT use my/adolescent’s photos for anything other than the research study 2. I give the researcher permission to use all of the materials I have produced except for: In giving permission for the use of my pictures/my adolescent’s pictures beyond the current research, I have been offered the opportunity to view the pictures and I understand that I am free to withdraw my permission for other uses of the pictures at any time. I am aware that the researchers will take steps to protect my privacy and confidentiality at all times. All photographs will be destroyed 5 years after publication of the data. a) d) b) e) c) f) The person who may be contacted about the research is Allison Watts who may be reached at: [Researcher Contact Information] _________________________________ Adolescent’s Printed Name ___________________________________________________________________________ Signature of Adolescent Date __________________________________ Parent’s Printed Name ___________________________________________________________________________ Signature of Parent Date ____________________________________ Principal Investigator or Designate Name ___________________________________________________________________________ Signature of Principal Investigator or Designate Date 215 B.8 Field Notes Form Field Notes Form Participant Code: Interview Date: Visit (circle): 1 2 Starting Time: Ending Time: Location of Interview: People present: Description of Environment: Nonverbal Behaviour: Content of Interview (words, topics, phrases that stand out): Researchers Impressions (participant discomfort, emotional responses): Analysis (questions, hunches, trends, patterns that are emerging): Technical problems: 216 B.9 Initial Codebook Category Home Social Environment Sub-category Parent Modeling What parents eat or drink, mother or father, less healthful or healthful modeling. Sibling Modeling What siblings eat or drink, healthful or less healthful Parenting styles/practices/rules What rules parents have about food and how their parents are involved with controlling food Nutrition knowledge How much their parents know about good nutrition Family structure How the family composition or dynamics influence food and drink choices Family meal patterns Eating together, where the family eats, when the meal takes place Code Parent modeling Sibling modeling Parent support (Parents do things to support adolescent in making healthful choices, including encouragement to make healthful choices) Parent control (Parent decides what is served, what snacks and foods are available for the adolescent) Parent rules (Rules that parents have about what can be eaten, including restriction. E.g. family is expected to eat what is prepared for them) Cooking Skill (Parent or adolescent is able to prepare healthful home cooked meals) Adolescent knowledge (Displays that show good understanding of nutrition knowledge, or that show poor understanding or confusion) Multiple households (issues that arise from living in two separate households, e.g. divorced families) Normal weight family member (issues that arise from a normal weight family member, commonly a sibling, as what is available and how the family acts will be different as the other child may not need restriction, etc.) Eating together (sitting down for meals as a family) Meal timing (when the meal is eaten) Meal location (where the meal is eaten) Family meal at restaurant (when a family is out for dinner, 217 Category Sub-category Home Physical Environment Entertaining Norms What is practiced in the home when guests are over Home Availability What is available to eat or drink at home, healthful or less healthful and how easy it is for them to purchase or eat foods and drinks at home, healthful or less healthful School Social Environment Peer Modeling What other peers or friends eat or drink, healthful or less healthful Social Events Social events that take place at the school, or are school-sanctioned. More broad-level or school-wide events Fitting in Fitting in with peer groups, going along with group behaviour, meeting expectations of group School norms The way things are done in particular schools, culture, rules, etc. Code what happens or what is normal when family eats out at a restaurant) Entertaining occasion Home_Convenience (healthful or less healthful foods and drinks and easy to get to) Home_Restricted access (Where foods and drinks are kept as it relates to how often you would see the foods and drinks, are foods kept out of the way) Preparation (healthful food is more accessible because parent prepares healthful food so that it is easily chosen and eaten) School_peer modeling School_social event School_Fitting in Teacher modeling (what teachers eat/drink, or what they say about it) School messaging (can be direct or indirect – what message does something send to students) School rule/policy (a rule or policy that a school has regarding food/drinks) 218 Category Sub-category School Physical Environment In-School Availability What is available to eat or drink in the school and how easy it is for them to purchase or eat foods and drinks in their school Outside-School Availability What is available to eat or drink off school property and how easy it is for them to purchase or eat foods and drinks off school property Meal-time Meals/snacks consumed at school Community Social Environment Community Physical Environment Peer influence In community setting Family influence In community setting Community Availability What is available to eat or drink in the community and how easy it is for them to Code Classroom practice (when food/drink is used as a teaching tool or as a reward, or as a social event that takes place in the classroom) Cafeteria (adolescent talks about food/drink from the cafeteria) Vending machine (adolescent talks about food/drink from a vending machine) School_Convenience (Food and drinks are physically easy to access at school, this can include convenient locations and in prominent locations, less healthful foods are hard to avoid) Proximity to food outlets (How easy it is to access foods and drinks off of school property) School lunch (adolescent talks about lunch at school) Lunch from home (adolescents talks about bringing their lunch or snacks from home) School snacks (adolescent talks about snacks at school) Community_Social activity (social activity that takes place in the community) Community_Peer modeling (what peers eat/drink in locations within the community) Community_Fitting in (fitting in with peer groups, group expectations in the community and outside of school time) Community_Family modeling Community_Family activity Community_Convenience (how easy it is to access healthful or less healthful foods in the community, such as they are close by, on a highly travelled route, open when you need 219 Category Economic Environment Policy Environment Other Sub-category purchase or eat foods and drinks in their community Code them, etc.) Community_Available (talking about what the options are in the community) NOTE – code type of outlet as well as the idea Food outlet (restaurant, fast food restaurant, food truck or other outlets with prepared food) Mall (shopping mall or center) Convenience store (corner store) Supermarket (grocery store) Neighbourhood proximity (How close, or how easy it is to access food and drink options near the home) Cost of foods Spending money (Buying foods and drinks in relation to How the cost of foods and drinks enables or how much spending money is available, or how adolescents restricts choices choose to spend their money) Cost (How expensive it is to buy food and drinks) Marketing Direct advertising (direct advertising for a particular Advertisements for foods or drinks product or food type) Indirect advertising (Advertising that does not specifically promote the product, can include just visually appealing or enticing, or could promote an event that leads to consumption of the product. Includes promotion through social media including when friends take pictures of foods that indirectly promotes that food) More individual-based ideas Likes/dislikes (Preferences for particular foods, or classes of food) Temptation (adolescent talks about temptation) Choices (extent of options available, includes strategies that involve limiting of choices. Can include healthful alternatives, or comparing healthful to less healthful options) Strategy (adolescent talks about strategies they use to eat healthful. E.g. they don’t bring money to school, they avoid 220 Category Sub-category Code certain places or things) Perceived benefits of HE (adolescent talks about +ve reinforcement from healthful eating. E.g. they feel better, and have more energy) Weight-dependent HE (adolescents talks about how thin people can eat whatever they want) 221 B.10 Final Codebook Category Home Social Environment Sub-category Parent Modeling What parents eat or drink, mother or father, less healthful or healthful modeling. Sibling Influence What siblings eat or drink, less healthful or healthful modeling. Code Parent modeling Parenting styles/practices/rules What rules parents have about food and how their parents are involved with controlling food Parent support (Parents do things to support teen in making healthful choices, including encouragement to make healthful choices) Parent control (Parent decides what is served, what snacks and foods are available for the teen. Also includes rules that parents have about what can be eaten, including restriction. E.g. family is expected to eat what is prepared for them) Cooking Skill (Parent or teen is able to prepare healthful or less healthful home cooked meals) Parent knowledge (How much their parents know about good nutrition) Family Structure ( idea of multiple households, also having a normal weight family member and the issues that arise from a normal weight family member, commonly a sibling, as what is available and how the family acts will be different as the other child may not need restriction, etc.) Nutrition knowledge How much their parents know about good nutrition Family structure How the family composition or dynamics influence food and drink choices Sibling modeling (What siblings eat or drink, healthful or less healthful) Sibling support (Siblings do things to support teen in making healthful choices) 222 Category Sub-category Family meal patterns Eating together, where the family eats, when the meal takes place. What is practiced in the home around meals, including special occasions Code Meal Pattern (when teen discusses ideas related to what is normally served, eating together, meal timing or when the meal is eaten, meal location or where the meal is eaten) Family meal at restaurant (when a family is out for dinner, what happens or what is normal when family eats out at a restaurant) Celebrations What is practiced in the home when guests are over, when there is a special occasion, celebrations, and/or holidays. How is eating influenced by guests or holidays. Home Physical Environment Home Availability What is available to eat or drink at home, healthful or less healthful and how easy it is for them to purchase or eat foods and drinks at home, healthful or less healthful Home_Availability (code this way if availability appears to be an issue but it is not discussed in a way that talks about convenience or restriction, etc.) Home_Convenience (healthful or less healthful foods and drinks and easy to get to. Includes parent preparation to make foods more accessible) Home_Restricted access (Where foods and drinks are kept as it relates to how often you would see the foods and drinks, are foods kept out of the way) Home_screen Home Screen Use (when teen talks about how watching TV, being on the computer or phone influences their eating) School Social Environment Social Events Social events that take place at the school, or are school-sanctioned. More broad-level or school-wide events Peers What friends or school peers eat or drink. School_social event School_Peer Modeling What other peers or friends eat or drink, healthful or less healthful 223 Category School Physical Environment Sub-category Code School_Fitting in Fitting in with peer groups, going along with group behaviour, meeting expectations of group, also social expectations not necessarily relating to peers School_Peer Support When teen talks about having friends who support their healthful choices, e.g. friends will go to a healthful store with them to buy lunch School norms Culture, policies at school that related to what foods and beverages are consumed Teacher modeling (what teachers eat/drink, or what they say about it) School culture (includes school messaging, it can be direct or indirect – what message does something send to students) School rule/policy (a rule or policy that a school has regarding food/drinks) Classroom practice (when food/drink is used as a teaching tool or as a reward, or as a social event that takes place in the classroom) School_curriculum Class on food preparation Curriculum How classes at school might teach concepts related to healthful eating, or prepare foods as part of a school class In-School Availability What is available to eat or drink in the school and how easy it is for them to purchase or eat foods and drinks in their school Cafeteria (teen talks about food/drink from the cafeteria) Vending machine (teen talks about food/drink from a vending machine) Bakesale (teen talks about food/drink from bake sale or other school event) School_Availability (Teen mentions that they have access to certain foods at school but not necessarily as it relates to how easy it is to get. If you code school_convenience don’t also code school_availability) 224 Category Community Social Environment Community Physical Environment Sub-category Outside-School Availability What is available to eat or drink off school property and how easy it is for them to purchase or eat foods and drinks off school property Lunch from home (teens talks about bringing their lunch or snacks from home) Peer influence In community setting including at friend’s houses, the mall, etc. (places other than the home and school) Code School_Convenience (Food and drinks are physically easy to access at school, this can include convenient locations and in prominent locations, less healthful foods are hard to avoid) Proximity to food outlets (How easy it is to access foods and drinks off of school property) Lunch from home Community_Social activity (social activity that takes place in the community) Community_Peer modeling (what peers eat/drink in locations within the community) Community_Fitting in (fitting in with peer groups, group norms or expectations in the community and outside of school time – does not have to relate to peers) Family influence Community_Family modeling In community setting Community_Family activity Community Availability Community_Convenience (how easy it is to access healthful What is available to eat or drink in the or less healthful foods in the community, such as they are community and how easy it is for them to close by, on a highly travelled route, open when you need purchase or eat foods and drinks in their them, etc.) community Community_Available (talking about what the options are in the community) NOTE – code type of outlet as well as the idea Food outlet (restaurant, fast food restaurant, food truck or other outlets with prepared food) Mall (shopping mall or center) Convenience store (corner store) Supermarket (grocery store) 225 Category Sub-category Economic Environment Cost of foods How the cost of foods and drinks enables or restricts choices Policy Environment Marketing Advertisements for foods or drinks Code Neighbourhood proximity (How close, or how easy it is to access food and drink options near the home) Worksite (food available at work) Friend’s house (food available at friend’s house) Community center or gym (food available at community center or gym) Spending money (Buying foods and drinks in relation to how much spending money is available, or how teens choose to spend their money) Cost (How expensive it is to buy food and drinks) Direct advertising (direct advertising for a particular product or food type) Indirect advertising (Advertising that does not specifically promote the product, can include just visually appealing or enticing, or could promote an event that leads to consumption of the product. Social Media (promotion through social media including when friends take pictures of foods that indirectly promotes that food) 226 Category Other Sub-category More individual-based ideas Code Likes/dislikes (Preferences for particular foods, or classes of food) Temptation (teen talks about temptation) Choices (extent of options available, includes strategies that involve limiting of choices. Can include healthful alternatives, or comparing healthful to less healthful options) Strategy (teen talks about strategies they use to eat healthful. E.g. they don’t bring money to school, they avoid certain places or things) Perceived benefits of HE (teen talks about +ve reinforcement from healthful eating. E.g. they feel better, and have more energy) Weight-dependent HE (teens talks about how thin people can eat whatever they want) Teen knowledge (Displays that show good understanding of nutrition knowledge, or that show poor understanding or confusion) Portion size (when teen talks about portion size of foods as something that influences healthful or less healthful eating/drinking) Meal Skipping (when a teen talks about missed meals) Hunger (how hunger influences healthful or less healthful food choices – this is particularly interesting to see how hunger combines with environmental cues leading to food choice) Awareness (when teen describes a concept related to being mindfulness, or not, or being aware, or not, and how this influences what they are eating and how much they are eating) Time constraint (where limited time, or ample time, 227 Category Sub-category Code influences eating habits/choices) Psychological State (the below concepts as well as laziness) Studying (Teen talks about studying as being a circumstance that influences healthful or less healthful eating/food choices) Boredom (teen describes eating due to boredom, or is bored of certain foods, etc.) Procrastination (teen talks about how they eat to put off doing something else) Concentration (teen talks about how they eat to help them concentrate) Reward (teen talks about how they eat to reward themselves, also when teen talks about something being a treat or refers to something that “they deserve” etc.) Stress (teen talks about how what they eat is influenced by stress or worry) Fitness (teen talks about how what they eat is influenced by participating in sports, wanting to improve fitness, of any way that exercise of fitness influences what they are eating) Social expectations (teen talks about being embarrassed or self-conscious about eating when others are around or can see them. For example, they eat junk food when no one is around) 228 B.11 Member Check Questionnaire By completing this form, you are agreeing to have your answers used in the MySteps study. This survey is confidential. Please read and fill out the boxes below: Adolescents say that lots of things at HOME influence what they choose to eat or drink Is this true for you too? (please mark with an ‘x’) I notice when my parents are eating something less healthful or healthful What my brother(s) and/or sister(s) are eating tempts me My parents encourage me to eat healthful My parents make it easy for me to pick something healthful e.g. they cut up veggies or have fruit out on the counter I eat what my family prepares My parents make me feel guilty if I don’t choose something healthful to eat I’m not allowed to eat treats I’m allowed to have treats if I want them I get a say in what foods my parents buy and prepare Cooking meals from scratch is healthier What’s available to me depends on what my family likes to eat My family has food routines e.g. we have salad with dinner, we go out to eat on Fridays If we have less healthful food at home, I want to eat it If I want a treat, I will get it somehow ___Yes ___Sometimes ___No ___Yes ___Sometimes ___No ___Yes ___Sometimes ___No ___Yes ___Sometimes ___No ___Yes ___Sometimes ___No ___Yes ___Sometimes ___No ___Yes ___Sometimes ___No ___Yes ___Sometimes ___No ___Yes ___Sometimes ___No ___Yes ___Sometimes ___No ___Yes ___Sometimes ___No ___Yes ___Sometimes ___No ___Yes ___Sometimes ___No ___Yes ___Sometimes ___No 229 Is this true for you too? (please mark with an ‘x’) I will eat what is easiest We have lots of treats during special occasions It’s expected to eat treats on special occasions I eat less healthful things when I’m using a screen (TV or computer) I eat less healthful snacks when I’m studying ___Yes ___Sometimes ___No ___Yes ___Sometimes ___No ___Yes ___Sometimes ___No ___Yes ___Sometimes ___No ___Yes ___Sometimes ___No SCROLL TO NEXT PAGE 230 Adolescents say that lots of things at SCHOOL and in the COMMUNITY influence what they choose to eat or drink Is this true for you too? (please circle) ___Yes If my friends have treats, I’d like some too I want to go along with what my friends are eating My friends give me treats All the other kids eat less healthful foods We make mostly less healthful foods in foods class We sometimes get treats during class My school has lots of less healthful foods When I bring food from home, it’s usually healthier then when I have to buy something It’s a lot easier to buy something less healthful If I have money, I’ll buy a treat If it’s a good deal, I’ll buy something less healthful I notice advertisements for less healthful foods, and it makes me want to have some I use the internet to learn about healthful eating ___Sometimes ___No ___Yes ___Sometimes ___No ___Yes ___Sometimes ___No ___Yes ___Sometimes ___No ___Yes ___Sometimes ___No ___Yes ___Sometimes ___No ___Yes ___Sometimes ___No ___Yes ___Sometimes ___No ___Yes ___Sometimes ___No ___Yes ___Sometimes ___No ___Yes ___Sometimes ___No ___Yes ___Sometimes ___No ___Yes ___Sometimes ___No 231 B.12 Supplementary Results Tables Table 1: Primary and secondary themes that emerged from discussion of the home food environment (N=22) Themes Quote Facilitator(F) Barrier(B) SOCIAL ENVIRONMENT Family Meals (n=20) Cooking meals from scratch X Family food preferences X X Meal routines X X Parenting Practices (n=17) Encouragement for healthful eating X Child Autonomy X Rules/Restriction X Indulgence/Permissiveness Negative emotions/reactions X X X X X X X X X X Parent control Family Modeling (n=14) Parent Healthful/Less healthful Modeling Sibling Healthful/Less healthful Modeling F: “I’m starting to get to that age where I really need to know how to prepare stuff on my own. And learning to prepare stuff that’s healthier rather than just microwaveable” Dan F: I don’t really eat out a lot anymore. Like, my family, we really stopped doing it when my grandmother started having kidney problems [to reduce salt intake]” Dan B: “[My sister’s] a really picky eater so my mom will usually cook something that she will like as well for the family so our nights kind of go like noodles, rice, noodles, rice, noodles, rice, noodles, rice, steak, noodles, rice, noodles, rice…” Scott F: “Every dinner that we have, we have a salad that goes alongside it” Dan B: “Our Thursday tradition is a little sushi place ----right beside a pizza place and so they’ll go down and grab a couple slices of pizza and some sushi” Scott F: “My mom tries to help me make better choices but sometimes I don’t listen to her. So then she helps me, like are you sure you want this or you could wait maybe and get something else better. So then, she does help me a lot in making better food choices” Tina F: “She’ll ask us which foods do we not want…‘cause then we’ll eat them” Lindsay F: “[my mom] started limiting us more on crackers and less healthful stuff…she buys a lot less of the, I used to love these one type of crackers, I can’t remember the name right now. I would always have like a pack every few days and so now I see those crackers like once every three months” Scott B: “having the house empty, I kind of just automatically link that with, “I can grab some food now. Go quick” Rachel B: “my dad just lets me take whatever I want [from the grocery store]” Suzy F/B: “my mom will walk up and like sigh and make stupid faces at me…my parents they make it quite obvious that I’m not healthful, so it’s sort of a negative way of pushing me to eat well. So my mom will basically make funny faces if I order something, so I will get healthier food.” Samantha F/B: “If you’re just having something for dinner and it’s, like, healthful or not healthful, like, it’s not like you can change it necessarily because if that’s what, like, is made at home, then that’s what you’re going to eat” Emma F: “[My dad] just eats healthful with me.” Jenny B: “My mom always has chocolate…My dad will nom anything, so whatever is on the counter that’s sweet he’ll destroy it.” Samantha F: “[My brother] has his protein shakes after hockey…he gets this much exercise a day, and, yeah…It makes me feel really guilty that I’m not doing it… He’s doing it, why can’t I? So, and that’s also a good influence” Emily B:“When my brother buys a pack of chips. It’s sort of hard to resist…He always likes to eat less 232 Themes Quote Facilitator(F) Barrier(B) healthful.” Suzy PHYSICAL ENVIRONMENT Availability (n=18) Types of foods that are available X Celebrations (n=13) Type/quantity of foods X X Social norms X Accessibility/Convenience (n=11) Accessibility of different foods X Screen Use & Studying (n=4) Foods eaten in front of the screen or while studying X X F: “[the fridge] is always full of fruits and, yeah. I , like, pack them for lunch and have them when I come home from school too” June B: “If there’s like a whole bunch of less healthful food and then a whole bunch of healthful it would be harder to eat the healthful because there’s so much yummy-looking less healthful food” Rob B: “there was lots of chocolate. We had a huge family gathering and there was tons of chocolate scattered everywhere and candy and stuff” Finn B: “It’s not like [you have to eat treats at Halloween] but it’s kind of, if it only happens once a year, might as well, like… should enjoy it.” Rachel F: “most of what’s in there is relatively healthful on purpose. So when we look for something to eat, we’ll get, like, vegetables or like, fruits are on the table already. Like, as I said earlier. So it’s faster to, than to try and find something that’s not as healthful” Lindsay B:“the food that we usually have like easily on hand and easy to get to is snacking stuff and stuff that’s less healthful, drinks that aren’t healthful too“ Scott B: “I actually eat a lot more when I’m using my computer than I do [otherwise]. [I usually eat] stuff that I probably shouldn’t, like small snacks and stuff that tend to build up so like crackers or chips.” Scott 233 Table 2. Primary and secondary themes that emerged from discussion of the school and community food environments (N=22) Themes Quotes Facilitator(F) Barrier(B) SOCIAL ENVIRONMENT Peer Influence (n=19) What foods friends and peers are eating Fitting in Sharing with friends X X X Events and meetings in environments with lots of less healthful foods X X B: “My friends have like, like crazy not-so-great lunches like cookies and cake and stuff that’s not so great…and I mean that kind of makes you want to have those kind of lunches” Katrina F: “I have a couple of friends who are like really into the healthful kind of thing…so it kind of makes me feel nice inside, like oh yea, I can have my salad with you” Violet B: “Me and my friends, we all share everything…if somebody gets a drink from Tim Horton’s, then we all just like, take a sip, just share it all anyway” Rachel F: “Like some of my friends, one time he brought oranges. And then we exchange, like, maybe I have a cut pear and then he has cut oranges we exchange, yeah.” Sam X X Lack of healthful options X Price (n=17) Available spending money X X Community B: “[at the mall], there’s a store there called the Sweet Factory. One of my friends loves going there. And so I’ll want to buy a jawbreaker or maybe chocolate-covered pretzels. So that’s really hard.” Emily B: “Oh, I probably shouldn’t have [ice cream] but all my friends are doing it” Dawn B/F: “If I’m going with friends though we’ll get a box [of granola bars from the grocery store] and then share it between us” Samantha B: “With my youth group from my church we, um, we went to the mall and we would buy our lunch from the mall and then go on a scavenger hunt. So definitely that was one of the less healthful days because, like, I had to buy my lunch there” Dawn X PHYSICAL ENVIRONMENT Availability (n=20) Types of foods available Value of foods School F: They have a salad bar, and like veggie cups… and fruit and stuff like that and milk, skim milk. But then they also have like, muffins and French fries and like, breaded chicken and stuff, so…” Lily B: “They have, like, cookies and ice cream and chips and then, like, usually they have chicken strips and fries nonstop, you know” Dawn B: “If I’m going to the cafeteria, then yeah, it’s sort of hard to [eat healthful], because there’s like, nothing healthful there” Lindsay B: “Hey, I have another dollar. Why not get this?” And it’s 50 cents for a cookie” Emily B: “I don’t want to spend a dollar fifty…I’m only going to spend a dollar. I’ll just grab a Fresca or a root beer…It’s always more expensive to buy water” Emily F: So like restaurants, it’s tempting but you can always find healthier options when you’re there and I notice I like healthier things better now” Annie B: “I go to… the mall a lot and that has a pretty big risk factor, you could say [for less healthful eating]” Emily B: “Healthful choices? No, there’s a Fresh Slice down the road, there’s a burger place, no not really. It’s a pretty less healthful area” Scott B: “Whenever you have money, it always gets spent on, like, food” Emma B: “[McDonald’s has] like burgers for like a $1.75. So it’s like ridiculously cheap. And so if I have $5 I can still get that and maybe like a coke.” Samantha 234 Themes Quotes Facilitator(F) Barrier(B) School Community B: “It’s just too convenient to go [across the street to Tim B: “We’re hungry after we play hockey for an hour, but Accessibility/Convenience (n=11) Accessibility to different types of X Horton’s] and buy myself a lunch… a muffin or a nothing healthful is open and we don’t want to go home foods doughnut or a cookie or French vanilla” Rachel and cook at 11:00 o’clock at night” Lindsay B: “It’s talked about a lot more than it’s actually done. School Practices (n=6) Foods course Like, the only thing I think is pretty healthful that we’ve X made is we made a bun but it was like multigrain” Samantha B: “[my teacher] really likes to give out, like lollipops and like, and to teach us things, she uses like, pizza and Treats used in Class X ice cream and licorice and stuff. So yeah, that can be hard to be around that sometimes” Lily B: “almost every window [in the cafeteria] has a poster B: “I just took this picture [of the candy aisle] because it Marketing (n=6) Exposure to advertisements similar, except that they’re all for stuff like ice cream or is really colorful and it makes you want to buy X French fries or whatever, and so then when people go in, some…when there’s new flavors I would like to try that’s what everybody wants to get” Lindsay some…I just like the colours” Suzy Placement/cues B: “I think that it’s very clever placement because [the B: “There’s always like the smell of McDonalds fries that vending machine] it’s right outside the gym. Which haunt you” Violet X makes it harder to not want it because you’ve just been doing exercise” Lindsay F: “It’s a twitter for fitness and nutrition…they post links of things that are generally healthful for like healthful Online World (n=2) A source of information about food stomachs and I guess like that…then when you go through you see your friends’ tweets and then you see their tweets and eating, through peers and ads X X and they re-tweet some things that help you too” Margot B: “It’s all the tempting foods you can find on the Internet ‘cause like I know on Facebook…everybody posts pictures of their food.” Violet 235


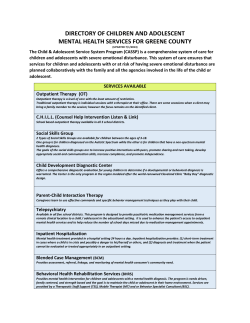


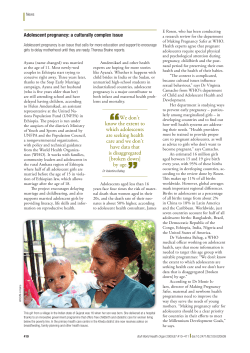


© Copyright 2026