
Cardiometabolic Risk Factors and Quality of Life in Severely
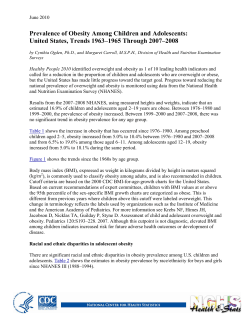
Cardiometabolic Risk Factors and Quality of Life in Severely
Obese Children and Adolescents in the Netherlands
Makkes, S*1, Renders, CM1, Bosmans, JE1, van der Baan-Slootweg, OH2, Seidell, JC1
¹ Department of Health Sciences and the EMGO Institute for Health and Care Research,
VU
University Amsterdam, the Netherlands
2
Merem Treatment Centers, Heideheuvel, Hilversum, the Netherlands
* Corresponding author
Faculty of Earth and Life Sciences
VU University Amsterdam
De Boelelaan 1085
1081 HV Amsterdam
Email addresses:
SM:
[email protected]
CMR: [email protected]
JEB:
[email protected]
OB:
[email protected]
JCS:
[email protected]
Page 1 of 27
Abstract
Background
The prevalence of severe obesity in children and adolescents is increasing. However,
little is known about cardiometabolic risk factors and quality of life of children with
severe obesity.
Therefore, the aim of this study was to assess the demographic characteristics and the
prevalence of cardiometabolic risk factors and quality of life in severely obese children
and adolescents undergoing intensive inpatient treatment for obesity.
Methods
Data were collected between August 2009 and April 2011 on 16 children (8-13y) and
64 adolescents (13-19y) with severe obesity (SDS-BMI ≥ 3.0 or SDS-BMI ≥ 2.3 and comorbidity) participating in an RCT evaluating two intensive inpatient treatment
programs for obesity (HELIOS). Demographic, anthropometric, clinical characteristics
and quality of life are described.
Results
Over 80% of participants in this study had at least one cardiometabolic risk factor in
addition to severe obesity. Low HDL-cholesterol and hypertension were most prevalent
(66.3% respectively 30.0%). The highest significant correlations were found between
SDS-BMI and SDS-waist circumference, fasting plasma insulin and systolic blood
pressure (respectively 0.84, 0.46, and 0.41). The mean EQ VAS of the participants was
69.4 on a scale of 0 to100 and their mean utility score was 0.78 on a scale of 0.0 to 1.0
on the EQ-5D questionnaire.
Conclusion
Page 2 of 27
Cardiometabolic risk factors are already highly prevalent in this group of severely obese
children and adolescents and their quality of life lower than children with normal weight
or overweight/obesity.
Trial registration
Netherlands Trial Register (NTR1678, registered 20-Feb-2009)
Page 3 of 27
Keywords: severe obesity, child, adolescent, cardiometabolic risk factors, quality of life
Page 4 of 27
Background
Worldwide there has been a large increase in the prevalence of obesity in children and
adolescents in the last decades [1, 2]. In 2009 in the Netherlands, about 2% of the boys
and girls were classified as obese. In comparison with 1980 these figures indicate a four
to six fold higher prevalence for obesity [3]. Moreover, the severity of obesity has also
increased, both in the Netherlands as in other countries. Results from the 2009–2010
NHANES indicate that an estimated 16.9% of children and adolescents aged 2–19 years
in the US are obese [4]. The rate of severe childhood obesity has tripled in the last 25
years [5]. This trend is worrisome, because obese children have a higher risk of type 2
diabetes mellitus and cardiometabolic risk factors such as high blood pressure, low
HDL cholesterol, high triglycerides, high fasting insulin concentration [6-9]. These
cardiometabolic risk factors are often clustered together in individuals which increases
the risk of cardiometabolic disease in young adulthood [10]. In addition, childhood
obesity often tracks into adulthood and is related to cardiometabolic disease, diabetes
type 2 and even cancer in later life, independent of adult BMI [11-13]. Besides these
negative clinical consequences of obesity, low self esteem and behavioral problems
seem to be particularly common in obese children [10]. Obese children and adolescents
also have psychological problems and a lower health-related quality of life [14].
Although it can be expected that the health consequences of severe obesity are even
more serious than of obesity, little is known about the demographic, anthropometric and
clinical characteristics of severely obese children and adolescents. This information is
important as it will give more insight into the health risks of these children. Therefore,
the objective of this article is to assess the prevalence of cardiometabolic risk factors
and the quality of life in severely obese children and adolescents undergoing intensive
inpatient treatment for obesity in the Netherlands.
Page 5 of 27
Methods
Design
Data were collected between August 2009 and April 2011 on 16 children (8-13y) and
64 adolescents (13-19y) with severe obesity who participated in the Health Effects of
Lifestyle Interventions in severely Obese children and adolescents Study (HELIOS).
HELIOS is a randomized controlled trial (RCT) in which the cost-effectiveness of two
treatment programs aimed at changing the lifestyle of both participants and their parents
are compared. These children receive one year of intensive treatment starting with either
an inpatient period of two or six months in a tertiary obesity center in Hilversum, the
Netherlands. After the intensive treatment there is follow-up of one year. Details about
the design of the study and the two treatment programs can be found elsewhere [15].
Participants
Inclusion criteria for the trial were a SDS-BMI >= 3.0 (this corresponds to the 99.9th
percentile) according to the growth curves based on the fourth Dutch nationwide growth
study of 1997, or a SDS-BMI >= 2.3 (this corresponds to the 99th percentile) and comorbidity (e.g. obstructive sleep apnea syndrome, raised insulin, diabetes type II, liver
function disorders, dyslipidemia, worn out joints). Participants were excluded from the
trial if they had syndromal or chromosomal determined obesity; obesity caused by
endocrine disorders (hypothyroidism, Cushing syndrome, primary hyperinsulinemia,
pseudohypoparathyroidism, acquired (structural) hypothalamic damage) or medicine
use (e.g. oral steroids, antiepileptic drugs, antidepressants); psychiatric problems; an IQ
below 75 or similar school level or if their parents were not willing or able to participate
in the treatment program and/or study.
Page 6 of 27
Measurements
Data on demographic characteristics, co-morbidities and quality of life were obtained by
questionnaires completed by the participants and their parents. Participants were
categorized into two main groups for ethnicity; Native Dutch and Immigrant (Western
and Non-Western). When both parents were born abroad in different countries, the
country in which the mother was born was used to classify the participant [16]. Highest
educational level attained by one of the parents was used for analysis and is divided into
low (lower vocational training, lower general secondary education and primary school
and special primary education or less), medium (intermediate vocational training, higher
general secondary training and pre-university education) or high (completed higher
vocational training and university) [17, 18]. To determine socio economic status (SES)
of the participants, we used status scores of the parents using data from The Netherlands
Institute for Social Research [19]. A status score is a measure for the social status of a
postal code area and consists of three elements: income, level of education and level of
unemployment. A status score below 0 means a SES above average and a status score
above 0 means a SES below average (0 meaning average) [19]. Quality of life was
measured using the EQ-5D-3L [20]. The EQ-5D-3L consists of two components; the
EQ-5D descriptive system and the EQ visual analogue scale (EQ VAS). Both the EQ5D and EQ-VAS were completed by the participants. The EQ-5D descriptive system
consists of five dimensions (mobility, self-care, usual activities, pain/discomfort, and
anxiety/depression) with three levels of severity (no problems/some or moderate
problems/extreme problems). The participants were asked to choose the level that best
described their current health status for each dimension. The resulting health state was
converted to a utility score using the Dutch EQ-5D valuation tariff [21] Utilities
represent quality of life in a single number along a continuum ranging from 0.0 (death)
Page 7 of 27
to 1.0 (full health). In the EQ-VAS a standard vertical 20 cm visual analogue scale is
used to measure an individual’s direct valuation of their current health-related quality of
life on a scale of 0 (worst imaginable health state) to 100 (best imaginable health state)
[15]. Co-morbidity (acanthosis nigricans, Blount’s disease, gallstones, hirsutism and
pseudogynecomastia) was determined by the treating pediatricians from obesity center
Heideheuvel before start of the treatment and by ultrasound. A clear description of the
anthropometric measurements that were performed can be found elsewhere [15]. The
equation used for the children and adolescents in this study to calculate percentage body
fat (%BF) was the Kushner equation for total body water (TBW) adjusted by Newton et
al [22, 23]. After an overnight fast, blood samples were obtained to measure lipid
spectrum, high sensitive C-reactive protein (HS-CRP) and hemoglobin type A1C
(HbA1C). To determine glucose tolerance and insulin resistance, the participants were
given glucose, in a dose of 1.75 g per kilogram of body weight (up to a maximum of 75
g) orally. Blood samples were obtained at 0 and 120 minutes for the measurement of
glucose and insulin levels. Homeostasis model assessment for insulin resistance
(HOMA-IR) was calculated using the following equation: fasting plasma insulin (µU/L)
x fasting glucose (mmol/L) / 22.5. Scores ordinarily range from 0 to 15, with higher
scores indicating greater insulin resistance. Insulin resistance was determined using the
cut-off points of Kurtoğlu et al for participants in the prepubertal and pubertal stage
(prepubertal: 2.67 in boys and 2.22 in girls, pubertal: 5.22 in boys and 3.82 in girls) [24,
25]. For participants in the postpubertal stage, the adult cut-off point of > 2.5 from
Keskin et al was used [26]. The three pubertal stages, prepubertal, pubertal and
postpubertal, were based on Tanner stages: prepubertal equals G/M1&P1; postpubertal
equals G/M5&P5; pubertal equals all other Tanner stages. For all participants the
Page 8 of 27
presence of a number of well known cardiometabolic risk factors was determined [27,
28]. The definitions of these cardiometabolic risk factors are included in the appendix.
Statistical analyses
All analyses were performed with SPSS for Windows, Version 15.0. Results were
stratified by age, where participants in the age group 8 to 13 years were categorized as
‘children’ and participants in the age group 13 to 19 years were categorized as
‘adolescents’. Results were also stratified according to SDS-BMI median (SDS-BMI =
3.5). Independent Student’s t-tests were used to analyze differences in continuous
measures between the age groups. Chi-square tests were used to analyze differences in
categorical variables. Because several variables had distributions that deviated from
normality, Spearman’s rank correlations were calculated. Spearman’s rank correlations
were used to determine the correlation between SDS-BMI and anthropometric and
laboratory measurements, such as blood pressure, blood lipids, insulin and glucose.
Also Pearson product-moment correlation coefficients were calculated but results are
not shown in the tables. In addition logistic regression was used to determine the
association between SDS-BMI and dichotomous classification of elevated
cardiometabolic risk factors. A p-value below 0.05 was considered statistically
significant.
Page 9 of 27
Results
Demographic characteristics
Table 1 describes the demographic characteristics of the 80 participants. Of the
participants, the mean age of the group was 14.8 years, 65% were girls and 20% fell in
the age group 8 to 13 years. Approximately half of the participants (57.5%) were native
Dutch. Of the Immigrants, 5.9% were Western. About half of the participants lived in
two parents family, 41.3% of the participants lived in a single parent family. Thirty-six
percent of the participants’ parents were classified as having a low level of education
and 40% and 17.5% as having respectively a medium or high level of education,
respectively. Over 60% of the participants lived in a family situation with a SES below
average. No statistically significant differences were found in demographic
characteristics between the children and adolescent groups. Acanthosis nigricans was
the most common co-morbidity among the participants (60%). Blount’s disease was
only present in adolescents, whereas gallstones were only prevalent among children.
Almost all boys in both age groups had pseudogynecomastia. Hirsutism was only seen
in the adolescent girls (12.5%). According to self reported data by the parents of the
participants, the weight of the participants started to increase disproportionally when
they were about 5 years old and at age 9 the weight started to become a real problem.
Quality of life
The mean EQ VAS of the participants was 69.4 on a scale of 0 to 100 and their mean
EQ-5D utility score was 0.78 on a scale of 0.0 to 1.0. Children had a slightly higher EQ
VAS than adolescents (72.8 vs. 68.5). Also participants with a SDS-BMI < median
scored higher on the EQ-5D than participants with a SDS-BMI >= median (71.3 vs.
67.7). These differences were not statistically significant. As for the utility scores,
children scored slightly lower than adolescents (0.75 vs. 0.79). Participants with a SDSPage 10 of 27
BMI >= median had lower utility scores than participants with a SDS-BMI < median
(0.76 vs. 0.79). 20 children and adolescents (25%) reported having no problems at all on
any of the five dimensions. Of the participants reporting any problems, the most
reported problem was pain; 57% reported having (some or extreme) problems with pain.
Followed by anxiety/depression (36.7%), usual activity (26.6%), mobility (25.4%) and
finally self care (3.8%). No differences were found between the adolescents and
children. However, participants with a SDS-BMI >= median had slightly more problems
with mobility (32.5% vs. 17.9%) and pain (62.5% vs. 51.3%) than participants with a
SDS-BMI < median, although this was not statistically significant (fig 1). Of the
participants reporting any problems (some or extreme) on any of the five dimensions,
the majority experienced some problems. Extreme problems were most often reported
on the anxiety/depression dimension. Relatively boys had slightly more problems with
activity whereas girls tented to have more problems with anxiety/depression, although
these differences were not statistically significant.
Anthropometric measurements
The mean SDS-BMI was 3.4 and the mean percentage FM of the 80 participants was
52% (table 2). Although not different between participants with a SDS-BMI < median
or participants with a SDS-BMI >= median nor between children and adolescents, there
was a statistically significant difference in percentage FM and SDS-BMI between boys
and girls; 49.7% vs. 53.2% and 3.3 vs. 3.7. The mean systolic blood pressure, SDSwaist circumference, fasting plasma insulin, triglycerides and HOMAIR were
significantly higher in participants with SDSBMI >= median than SDS-BMI< median.
Moreover there seemed to be a significant correlation between SDS-BMI and SDSwaist circumference, percentage FM, blood pressure, fasting plasma insulin, HDLcholesterol, triglycerides and HOMA-IR. Regarding both age groups, adolescents had a
Page 11 of 27
statistically significant higher mean systolic blood pressure and HS-CRP than children
(data not shown). The highest significant correlations were found between SDS-BMI
and SDS-waist circumference, fasting plasma insulin and systolic blood pressure
(respectively 0.84, 0.46, and 0.41).
Cardiometabolic risk factors
Table 3 shows that 81.3% of all participants had at least 1 cardiometabolic risk factor in
addition to being obese. This was 77.5% in the lower SDS-BMI group and 85% in the
higher SDS-BMI group. The most common cardiometabolic risk factors were low
HDL-cholesterol (66.3%), hypertension (30.0%) and high triglycerides (11.3%). These
risk factors were more present among participants with an SDS-BMI above the median
than among participants with an SDS-BMI under the median, although these differences
were not significant. Furthermore, children and adolescents with a higher SDS-BMI
were four times more likely to have hypertension (OR 4.08, 95% CI 1.10, 15.07) and
almost five times more likely to have a high insulin resistance (OR 4.92, 95% CI 1.35,
17.93). In the group with a SDS-BMI >= median fewer participants had no
cardiometabolic risk factor in addition to their obesity than in the group with a SDSBMI < median. Of the participants that had any cardiometabolic risk factor in addition
to obesity, more children and adolescents in the highest SDS-BMI group had 2 or more
cardiometabolic risk factor in addition to their obesity, whereas more children and
adolescents in the lower SDS-BMI group had only 1 cardiometabolic risk factor in
addition to their obesity. Additional analyses in which results were stratified by SDSBMI < 3.0 (N=10) or SDS-BMI >= 3.0 (N=70) taken the inclusion criteria into account,
showed that 70% respectively 82.9% had at least 1 cardiometabolic risk factor or more
in addition to being obese (data not shown). When we looked at the group of children
and the groups of adolescents separately (data not shown), we saw that already 62.5% of
Page 12 of 27
the children between 8-13 years old had 1 cardiometabolic risk factor in addition to their
obesity and 18.8% already had 2 additional cardiometabolic risk factors. Only 18.7% of
the children had no additional cardiometabolic risk factors in addition to obesity. If we
combine the cardiometabolic risk factors in our study according to the new IDF
definition of MetS, the prevalence of MetS was 28.8% in our study population. When
we took the degree of obesity into account, 22.5% in the lower SDS-BMI group had
MetS, whereas 35.0% in the higher SDS-BMI group had MetS.
Page 13 of 27
Table 1. Demographic characteristics, quality of life and co-morbidity of the children
and adolescents participating in HELIOS, for all participants together and stratified
according to age group
Total (n=80)
Children (n=16)
Adolescents (n=64)
N
80
16
64
Age (y)
14.3 (2.3)
11.3 (1.2)
15.6 (1.6)
Male/Female (%)
35 / 65
37.5 / 62.5
34.4 / 65.6
Native Dutch
57.5
62.5
56.3
Immigrants
42.5
37.5
43.7
3.8
0
4.7
Ethnicities (%)
o
Western (% of total)
o
Non-Western (% of total)
§
Moroccan
5
6.3
4.7
§
Dutch Antilles/Aruba
5
0
6.3
§
Surinam
5
6.3
4.7
§
Turkish
16.3
25
14.1
§
Other Non-Western
7.5
0
9.4
Low
36.3
43.8
34.4
Medium
40.0
31.3
42.2
High
17.5
18.8
17.2
Below average
62.5
73.3
63.9
Above average
32.5
26.7
36.1
Married/living together
52.5
56.3
53.2
Divorced
31.3
37.5
30.6
One parent family(mother)
10
6.3
11.3
Other situation
3.8
0
4.8
EQ VAS
69.4 (21.0)
72.8 (19.4)
68.5 (21.5)
EQ-5D utility score
0.78 (0.23)
0.75 (0.22)
0.79 (0.23)
Acanthosis nigricans
60
50
63.5
Blount’s disease
3.8
0
4.8
Gallstones
2.5
12.5*
0*
Hirsutism (only girls)
9.6
0
12.5
Pseudogynecomastia (only boys)
89.3
100
86.4
Level of education of the parents (%)
SES (%)
Household situation (%)
Quality of life
Co-morbidity (%)
Page 14 of 27
Data are mean (SD).
SD – standard deviation; SES – Socio-economic status.
A participant falls in the “Children” group if aged 8 to 13 years and falls in the “Adolescents” group if
aged 13 to 19 years.
If both parents were born in the Netherlands, a participant was categorized as Native Dutch; if one of the
parents was born abroad, a participant was categorized as Immigrant. Immigrant is further divided into
Western of Non-Western, of which Non-Western if further subdivided into Morocco, former Dutch
Antilles and Aruba, Surinam, Turkey and Other Non-Western.
SES below average corresponds to a status score of 0 or higher, SES above average corresponds to a
status score below 0.
* P value <0.05.
Page 15 of 27
Table 2. Anthropometric and laboratory measurements of the children and adolescents participating in HELIOS, for all participants
together and stratified according to SDS-BMI group
Total (n=80)
SDS-BMI < median (n=40)
SDS-BMI >= median (n=40)
Spearman’s correlations coefficient
Age (y)
14.3 (2.3)
14.2 (2.3)
14.5 (2.3)
0.15
Male/Female (%)
36 / 65
20 / 80**
50 / 50**
NA
SDS-BMI
3.4 (0.4)
3.1 (0.3)**
3.7 (0.3)**
SDS-waist circumference
3.1 (0.4)
2.9 (0.3)**
3.4 (0.3)**
0.84**
52.0 (5.0)
51.0 (3.8)
53.0 (5.7)
0.30**
Systolic blood pressure (mmHg)
121.7 (12.7)
118.0 (11.3)*
125.4 (13.0)*
0.41**
Diastolic blood pressure (mmHg)
77.0 (11.0)
71.1 (9.1)
78.7 (12.5)
0.24*
Prepubertal
8.8
12.5
5.0
NA
Pubertal
41.3
45.0
37.5
NA
Postpubertal
42.5
32.5
52.5
NA
Fasting plasma insulin (pmol/L)
98.6 (65.3)
70.8 (41.7)*
125.0 (72.9)*
0.46**
Fasting plasma glucose (mmol/L)
4.8 (0.7)
4.7 (0.3)
4.9 (0.9)
0.11
2-h plasma glucose (mmol/L)
6.3 (3.7)
6.0 (1.7)
6.7 (5.0)
0.06
Total cholesterol (mmol/L)
3.7 (0.7)
3.7 (0.8)
3.8(0.7)
0.09
HDL-cholesterol (mmol/L)
1.0 (0.2)
1.1 (0.2)
1.0 (0.2)
-0.22†
LDL-cholesterol (mmol/L)
2.3 (0.6)
2.2 (0.6)
2.3 (0.7)
0.05
Triglycerides (mmol/L)
1.0 (0.5)
0.8 (0.4)*
1.2 (0.6)*
0.38**
HS-CRP (mg/l)
4.9 (4.6)
4.4 (4.6)
5.4 (4.6)
0.23*
HbA1C (DCCT %)
5.5 (0.3)
5.5( 0.3)
5.5 (0.2)
0.10
HOMA-IR
3.1 (2.5)
2.2 (1.3)*
4.1 (3.0)*
0.39**
BIS
Fat mass (%)
Puberty stage (%)
1
Page 16 of 27
Data are mean (SD).
SD – standard deviation; SDS-BMI – standard deviation of body mass index; SDS-waist circumference – standard deviation of waist circumference; BIS – Bioelectrical impedance spectroscopy; HDL – high-density lipoprotein; LDL – low-density lipoprotein; HS-CRP - high sensitive C-reactive protein; HbA1C – hemoglobin
type A1C; HOMA-IR – homeostasis model assessment for insulin resistance.
Median is 3.49.
† P value = 0.05.
* P value <0.05.
** P value < 0.01.
1
Three stages based on Tanner stages: ‘prepubertal’ equals G/M1&P1; ‘postpubertal’ equals G/M5&P5; ‘pubertal’ equals all other Tanner stages.6 participants in the
Adolescents group did not want to undress, therefore no puberty stage available.
NA Not applicable.
Page 17 of 27
Table 3. The prevalence of cardiometabolic risk factors (CRF) of the children and adolescents participating in HELIOS, for all participants
together and stratified according to SDS-BMI group
Total (n=80)
SDS-BMI < median (n=40)
SDS-BMI >= median (n=40)
OR (95% CI)
High triglycerides
9 (11.3)
3 (7.5)
6 (15.0)
3.45 (0.60, 19.88)
Low HDL-cholesterol
53 (66.3)
24 (60.0)
29 (72.5)
1.78 (0.55, 5.80)
Hypertension
24 (30.0)
10 (25.0)
14 (35.0)
4.08 (1.10, 15.07)*
Impaired fasting glucose
1 (1.3)
1 (2.5)
0 (0)
-
Impaired glucose tolerance
6 (7.5)
4 (10.0)
2 (5.0)
-
DMII
2 (2.5)
1 (2.5)
1 (2.5)
-
High HOMA-IR
30 (37.5)
9 (22.5)
21 (52.2)
4.92 (1.35, 17.93)*
1 CRF (only obesity)
15 (18.8)
9 (22.5)
6 (15.0)
NA
2 CRF (1 in addition to obesity)
40 (50)
21 (52.5)
19 (47.5)
NA
>=3 CRFs (>=2 in addition to obesity)
25 (31.3)
10 (25.0)
15 (37.5)
NA
Data are n (% of total) and OR with 95% CI.
OR – Odds Ratio; SDS-BMI – standard deviation of body mass index; CI – confidence interval; HDL – High Density Lipoprotein; HOMA-IR – homeostasis model
assessment for insulin resistance: DMII – Diabetes Mellitus type II.
Reference cut off points cardiometabolic risk form ‘The metabolic syndrome in children and adolescents – an IDF consensus report’ by Zimmet et al [27].
Reference cut off points HOMA-IR from ‘Insulin resistance in obese children and adolescents: HOMA-IR cut-off levels in the prepubertal and pubertal periods’ by
Kurtoğlu et al [25], ‘Homeostasis model assessment is more reliable than the fasting glucose/insulin ratio and quantitative insulin sensitivity check index for assessing
insulin resistance among obese children and adolescents’ by Keskin et al [26] for postpubertal stage.
CRFs are based on the IDF criteria including obesity, high triglycerides, low HDL-cholesterol, hypertension, impaired fasting glucose, impaired glucose tolerance and
DMII. Since all participants fulfilled the IDF criterion for obesity, none of the participants had zero CRF. Participants with 1 CRF only had obesity and none of the
other CRFs. Participants with 2 CRFs had 1 CRF in addition to obesity. Participants with 3 or more CRFs had 2 or more CRFS in addition to obesity.
Median is 3.49.
- Insufficient sample size.
* P value <0.05.
NA Not applicable.
Page 18 of 27
Discussion
This study shows that more than 80% of the severely obese children and adolescents
eligible for intensive inpatient treatment programs for severely obese had at least 1
cardiometabolic risk factor (in addition to obesity) indicating that they are at increased
risk for severe health complications. Within this group, higher SDS-BMI was associated
with a worse profile of several cardiometabolic risk factors. The mean EQ VAS of the
participants was 69.4 on a scale of 0 to 100. Unfortunately, there are hardly studies that
describe characteristics of this specific group of severely obese children and
adolescents. Therefore there is little insight into the health risks of this group and the
urgency to quickly detect this group and offer suitable treatment programs. Most studies
included only obese participants and not severely obese or also obese participants, or
had fewer participants than we did. Moreover often anthropometric and clinical
characteristics of the study population are only described after treatment. In our study,
we see a tendency; the higher the SDS BMI and higher the degree of obesity, the higher
the prevalence of MetS. This is also seen in a study by Weiss et al [29], although the zscores of BMI in our study population are much higher. Weiss et al found that 38.7% of
the participants with moderate obesity (defined as 2.0 < SDS-BMI =< 2.5) and 49.7%
with severe obesity (SDS-BMI > 2.5) were diagnosed with MetS. Thus, the prevalence
of cardiometabolic risk factors seems to increase with worsening obesity, even in the
upper regions. The most common cardiometabolic risk factor seen in our study
population is low HDL-cholesterol (66.3%), followed by hypertension (30%) and high
triglycerides (11.3%). In the Lafortuna study, hypertension was the most prevalent
component of MetS (66.1% for Germans vs. 44.7% for Italians), followed by low HDLcholesterol (39.5% vs. 37.4% respectively). In correspondence to our study, impaired
fasting plasma glucose was the least prevalent abnormality. Adolescents had higher
Page 19 of 27
prevalences of cardiometabolic risk factors than children in our study population. This
was also found by Lafortuna et al, in which the prevalences of almost all components of
MetS increased with age groups. There are only a few studies that looked at the
relationship between childhood obesity and quality of life, and almost none that studied
this association in severely obese children and adolescents. In our study we found that
the average score on a scale of 0 to 100 was 69.4, which is comparable to the score in
the study by Schwimmer although they used a different questionnaire (PedsQL 4.0)
[14]. They found that obese had a significantly lower mean health-related quality of life
score compared to healthy children and adolescents (mean score 67.0 vs. 83.0) and that
they were 5.5 times more likely to have impaired health-related quality of life than a
healthy child or adolescent, which is similar to a child or adolescent with cancer.
Williams et al also used the PedsQL 4.0 and compared schoolchildren with normal
weight, overweight and obesity to each other [30]. They found total mean scores of
respectively 80.5, 79.3 and 74.0. The degree of obesity was taken into account by Varni
et al [31]. Severely obese children self-reported significantly lower overall healthrelated quality of life, physical health, psychosocial health, and school functioning in
comparison to obese children. The results of a recent study by Philips et al also suggest
the ‘extremely obese’ are significantly more depressed, more socially anxious and have
poorer quality of life in comparison to the ‘obese’ [32] We report the same findings in
our study (higher BMI, poorer quality of life), although these results were not
statistically significant. All children that participated in this study were referred to
obesity center Heideheuvel by their pediatricians. Since not every severely obese child
or adolescent in the Netherlands will have been under the care of a pediatrician and
therefore was not able to participate in the study, participants of HELIOS were probably
a selection from the total group of severely obese children and adolescents in the
Page 20 of 27
Netherlands. It is unknown if the children and adolescents not being referred by
pediatricians differ in characteristics from the children and adolescents that were being
referred. It is possible that the children and adolescents that were to seek help from a
pediatrician were also the ones already suffering from cardiometabolic risk factors.
Also, the inclusion of participants with a SDS-BMI between 2.3 and 3.0 with comorbidity can lead to a preselected sample and therefore has a higher prevalence of
these factors than a general population of obese children. In practice, 7 participants had
a SDS-BMI between 2.3-3.0 (2.9, 2.8, 2.9, 2.5, 2.8, 2.6, and 2.5). Of these participants,
0 had impaired fasting glucose, 0 had impaired glucose tolerance, 0 had diabetes
mellitus type II, 4 had insulin resistance, 1 had hypertension, and 6 had low HDLcholesterol. Indeed, some of them already had cardiometabolic risk factors, but in
general we saw a higher prevalence of these risk factors among those with higher SDSBMI. A strong point of this study is the large number of participants that came from all
parts of the Netherlands. Many studies with a severely obese children and/or
adolescents study population had fewer participants and participants for a limited area
that did not present the country. This article was written since the prevalence of severe
obesity is rising in children and adolescents worldwide; a good description of
particularly this population is needed. The results in this article clearly demonstrate that
most severely obese children and adolescents already have several cardiometabolic risk
factors present and are at high risk for developing cardiometabolic disease in young
adulthood. These findings stress the importance and need of the early detection of these
children, of the availability of appropriate intensive treatment programs and of the early
screening for cardiometabolic risk factors. It is even more important to prevent them
from becoming severely obese, because effects of treatment can be lower than desired
resulting from the complexity within the group of severely obese children and
Page 21 of 27
adolescents to prevent the development of cardiometabolic risk factors and diabetes and
impaired quality of life.
Page 22 of 27
Conclusions
Cardiometabolic risk factors are already highly prevalent in this group of severely obese
children and adolescents; 80% had at least 1 cardiometabolic risk factor (in addition to
obesity) indicating that they are at increased risk for severe health complications. The
development of appropriate screening and treatment programs for this group of severely
obese children is urgently needed.
Page 23 of 27
Competing Interests
The authors declare that they have no competing interests. This study is funded by a
grant from the Netherlands Organization for Health Research and Development
(ZonMw).
Ethical and Legal Prerequisites
Trial registration: Netherlands Trial Register (NTR): NTR1678.
The Medical Ethics committee (METc) of VU University Medical Centre approved the
study design, protocol and informed consent procedures. Written informed consents
were obtained from both the participants and their parents.
Acknowledgements
All authors contributed to the design of the study. OB and SM were responsible for
acquisition of data. SM prepared the initial draft of the manuscript. All authors
contributed to the writing of the manuscript and approved the final version of the
manuscript. We acknowledge the assistance of Liesbeth van Essen, Jannetta Huisman,
Lydia Kok, Lisa Numann, Wil te Pas, Anita Planje, Christine Tamminga. Ottelien van
Weelden and Michelle Belder. Also we would like to thank all the other professionals at
obesity center Heideheuvel for their assistance in the treatment programs and in
gathering data. Furthermore we would like to thank the participants and their
parents/caretakers participating in this study.
Page 24 of 27
References
1.
2.
3.
4.
5.
6.
7.
8.
9.
10.
11.
12.
13.
14.
15.
16.
17.
Jackson-Leach R, Lobstein T: Estimated burden of paediatric obesity and comorbidities in Europe. Part 1. The increase in the prevalence of child
obesity in Europe is itself increasing. Int J Pediatr Obes 2006, 1:26-32.
Wang Y, Lobstein T: Worldwide trends in childhood overweight and obesity.
Int J Pediatr Obes 2006, 1:11-25.
Schonbeck Y, Talma H, van Dommelen P, Bakker B, Buitendijk SE, Hirasing
RA, van Buuren S: Increase in prevalence of overweight in Dutch children
and adolescents: a comparison of nationwide growth studies in 1980, 1997
and 2009. PLoS One 2011, 6:e27608.
Fryar CD, Carroll MD, Ogden CL: Prevalence of Obesity Among Children
and Adolescents: United States, Trends 1963–1965 Through 2009–2010.
(Surveys DoHaNE ed.: Centers for Disease Control and Prevention; 2012.
Skelton JA, Cook SR, Auinger P, Klein JD, Barlow SE: Prevalence and trends
of severe obesity among US children and adolescents. Acad Pediatr 2009,
9:322-329.
Freedman DS, Dietz WH, Srinivasan SR, Berenson GS: The relation of
overweight to cardiovascular risk factors among children and adolescents:
the Bogalusa Heart Study. Pediatrics 1999, 103:1175-1182.
Dietz WH: Health consequences of obesity in youth: childhood predictors of
adult disease. Pediatrics 1998, 101:518-525.
Ludwig DS: Childhood obesity--the shape of things to come. N Engl J Med
2007, 357:2325-2327.
Franks PW, Hanson RL, Knowler WC, Sievers ML, Bennett PH, Looker HC:
Childhood obesity, other cardiovascular risk factors, and premature death.
N Engl J Med 2010, 362:485-493.
Reilly JJ, Methven E, McDowell ZC, Hacking B, Alexander D, Stewart L,
Kelnar CJ: Health consequences of obesity. Arch Dis Child 2003, 88:748-752.
Baker JL, Olsen LW, Sorensen TI: Childhood body-mass index and the risk
of coronary heart disease in adulthood. N Engl J Med 2007, 357:2329-2337.
Singh AS, Mulder C, Twisk JW, van Mechelen W, Chinapaw MJ: Tracking of
childhood overweight into adulthood: a systematic review of the literature.
Obes Rev 2008, 9:474-488.
The NS, Suchindran C, North KE, Popkin BM, Gordon-Larsen P: Association
of adolescent obesity with risk of severe obesity in adulthood. Jama 2010,
304:2042-2047.
Schwimmer JB, Burwinkle TM, Varni JW: Health-related quality of life of
severely obese children and adolescents. Jama 2003, 289:1813-1819.
Makkes S, Halberstadt J, Renders CM, Bosmans JE, van der Baan-Slootweg
OH, Seidell JC: Cost-effectiveness of intensive inpatient treatments for
severely obese children and adolescents in the Netherlands; a randomized
controlled trial (HELIOS). BMC Public Health 2011, 11:518.
CBS: Statistisch jaarboek 2000. Heerlen, the Netherlands: Statistics
Netherlands (CBS); 2000.
de Jong E, Schokker DF, Visscher TL, Seidell JC, Renders CM: Behavioural
and socio-demographic characteristics of Dutch neighbourhoods with high
prevalence of childhood obesity. Int J Pediatr Obes 2011, 6:298-305.
Page 25 of 27
18.
19.
20.
21.
22.
23.
24.
25.
26.
27.
28.
29.
30.
31.
32.
Kardal M, Lodder B: De gezonde levensverwachting naar
sociaaleconomische status. Centraal Bureau voor de Statistiek; 2008.
Knol FA: Van hoog naar laag; van laag naar hoog. Sociaal Cultureel
Planbureau; 1998.
EuroQol--a new facility for the measurement of health-related quality of
life. The EuroQol Group. Health Policy 1990, 16:199-208.
Lamers LM, Stalmeier PF, McDonnell J, Krabbe PF, van Busschbach JJ:
[Measuring the quality of life in economic evaluations: the Dutch EQ-5D
tariff]. Ned Tijdschr Geneeskd 2005, 149:1574-1578.
Kushner RF, Schoeller DA, Fjeld CR, Danford L: Is the impedance index
(ht2/R) significant in predicting total body water? Am J Clin Nutr 1992,
56:835-839.
Newton RL, Alfonso A, White MA, York-Crowe E, Walden H, Ryan D, Bray
GA, Williamson D: Percent body fat measured by BIA and DEXA in obese,
African-American adolescent girls. Int J Obes (Lond) 2005, 29:594-602.
Matthews DR, Hosker JP, Rudenski AS, Naylor BA, Treacher DF, Turner RC:
Homeostasis model assessment: insulin resistance and beta-cell function
from fasting plasma glucose and insulin concentrations in man.
Diabetologia 1985, 28:412-419.
Kurtoglu S, Hatipoglu N, Mazicioglu M, Kendirici M, Keskin M, Kondolot M:
Insulin resistance in obese children and adolescents: HOMA-IR cut-off
levels in the prepubertal and pubertal periods. J Clin Res Pediatr Endocrinol
2010, 2:100-106.
Keskin M, Kurtoglu S, Kendirci M, Atabek ME, Yazici C: Homeostasis model
assessment is more reliable than the fasting glucose/insulin ratio and
quantitative insulin sensitivity check index for assessing insulin resistance
among obese children and adolescents. Pediatrics 2005, 115:e500-503.
Zimmet P, Alberti KG, Kaufman F, Tajima N, Silink M, Arslanian S, Wong G,
Bennett P, Shaw J, Caprio S: The metabolic syndrome in children and
adolescents - an IDF consensus report. Pediatr Diabetes 2007, 8:299-306.
American-Diabetes-Association: Diagnosis and classification of diabetes
mellitus. Diabetes Care 2012, 35 Suppl 1:S64-71.
Weiss R, Dziura J, Burgert TS, Tamborlane WV, Taksali SE, Yeckel CW, Allen
K, Lopes M, Savoye M, Morrison J, et al: Obesity and the metabolic
syndrome in children and adolescents. N Engl J Med 2004, 350:2362-2374.
Williams J, Wake M, Hesketh K, Maher E, Waters E: Health-related quality of
life of overweight and obese children. Jama 2005, 293:70-76.
Varni JW, Limbers CA, Burwinkle TM: Impaired health-related quality of
life in children and adolescents with chronic conditions: a comparative
analysis of 10 disease clusters and 33 disease categories/severities utilizing
the PedsQL 4.0 Generic Core Scales. Health Qual Life Outcomes 2007, 5:43.
Phillips BA, Gaudette S, McCracken A, Razzaq S, Sutton K, Speed L,
Thompson J, Ward W: Psychosocial functioning in children and adolescents
with extreme obesity. J Clin Psychol Med Settings 2012, 19:277-284.
Page 26 of 27
Appendix
Definition of cardiometabolic risk factors
Obesity
Children <16
Children >=16
Boys and Girls
Boys
Girls
WC >= 94cm for males
WC >= 80cm for females
>= 90th percentile (6-<10) or >= 90th
percentile or adult cut-off if lower (10-<16)
High triglycerides
>= 1.7 mmol/L or >= 150 mg/dL
>= 1.7 mmol/L or >= 150 mg/dL
>= 1.7 mmol/L or >= 150 mg/dL
Low HDL-cholesterol
< 1.03 mmol/L or < 40 mg/dL
< 1.03 mmol/L or < 40 mg/dL
< 1.29 mmol/L or < 50 mg/dL
Systolic BP >= 130 or diastolic BP >= 85 mm
Systolic BP >= 130 or diastolic BP >= 85 mm
Systolic BP >= 130 or diastolic BP >= 85 mm
Hg
Hg
Hg
FPG >= 5.6 mmol/L (100 mg/dL)** or known
FPG >= 5.6 mmol/L (100 mg/dL)** or known
FPG >= 5.6 mmol/L (100 mg/dL)** or known
DMII
DMII
DMII
Hypertension
FPG or DMII
HDL – high-density lipoprotein; BP – blood pressure; FPG – fasting plasma glucose; DMII – type 2 diabetes mellitus.
Reference cut off points cardiometabolic risk form ‘The metabolic syndrome in children and adolescents – an IDF consensus report’ by Zimmet et al [27].
Page 27 of 27
Figur e 1. Frequency of reported problems within the dimensions of the EQ-5D descriptive
system stratified according to the median of SDS-BMI
The EQ-5D descriptive system consists of five dimensions (mobility, self-care, usual activities, pain/discomfort, and anxiety/depression).
SDS-BMI – standard deviation of body mass index.
Median is 3.49.
Figure 1


© Copyright 2026