
A practical guide to sand dam implementation
A practical guide to sand dam implementation
Water supply through local structures as adaptation to climate change
A guideline based on the Swiss Re 2007 award winning pilot project “Water harvesting to
improve livelihoods in southern Ethiopia: from pilots to mainstream” and large-scale
implementation of sand dams in Kenya.
Colophon
RAIN Foundation
Address:
Donker Curtiusstraat 7-523
1051 JL Amsterdam, The Netherlands
Email:
[email protected]
Website:
www.rainfoundation.org
Acacia Water
Address:
Jan van Beaumontstraat 1
2805 RN Gouda, The Netherlands
Email:
[email protected]
Website:
www.acaciawater.com
Ethiopian Rainwater Harvesting Association
Address:
P.O. Box 27671/1000
Addis Ababa, Ethiopia
Email:
[email protected]
Action for Development
Address:
P.O. Box 19859
Addis Ababa, Ethiopia
Email:
[email protected]
Sahelian Solutions Foundation, Kenya
Address:
P.O. Box 14333
Nairobi, Kenya
Email:
[email protected]
Table of Content
1.
Case studies from Ethiopia and Kenya
1
1.1
Sand storage dams to improve rural livelihoods in Kituï District, Kenya
1
1.2
The catchment approach: an example project of combining water harvesting techniques in
Borana, southern Ethiopia
2
2.
2.1
Basic principles of a sand dam
3
What is a sand dam?
3
2.1.1 Definition of a sand dam
3
2.1.2 Functions of a sand dam
4
2.1.3 Types of sand dams
4
Hydrological principles of a sand dam
5
2.2.1 Filling of the sand dam aquifer (after Gijsbertsen, 2007)
5
2.2.2 Hydrological functioning of a sand storage dam
6
3.
Practical steps within a sand dam project
7
4.
Site selection
8
2.2
4.1
Importance of site selection
8
4.2
Selecting potential catchments for sand dams
8
4.3
Selecting potential riverbeds
9
4.3.1 Community involvement and forming a Water Committee
10
4.3.2 Physical and social selection criteria
10
Selecting riverbed section(s) and sand dam location(s)
13
4.4.1 Storage capacity and extraction percentage of sand
13
4.4.2 Gradient of the riverbed
13
4.4.3 Depth and type of basement and depth of groundwater
14
4.4.4 Example of longitudinal profile and cross section
14
4.4
5.
Water demand vs. water yield
16
5.1
Water use assessment
16
5.2
Water yield
16
6.
Design
17
6.1
Introduction
17
6.2
Dam and spill way height
17
6.3
Spillway, wing walls and stilling basin dimensions
18
7.
7.1
7.2
7.3
8.
8.1
8.2
9.
9.1
Excavation and construction
20
Materials and Labour
20
7.1.1 Materials
20
7.1.2 Labour
21
The trench
21
7.2.1 Setting the trench
21
7.2.2 Excavating the trench
22
Construction of the dam
22
Water extraction from a sand dam
23
Types and locations of water extraction points
23
8.1.1 Traditional scoop holes
23
8.1.2 Well with hand- or rope pump
23
8.1.3 Outlet pipe with tap
24
Construction of wells
24
Management and maintenance and monitoring
25
Training of local community
25
9.1.1 Educational sessions on natural resources management, sanitation and hygiene
25
9.1.2 Technical training on operation, management and maintenance
26
9.2
Management of a sand dam
26
9.3
Maintenance
27
References
28
List of Annexes
1:
Check list for first and detailed site selection
28
2:
Steps in community involvement
29
3:
Probing the selected river section
31
4:
Questionnaire water use assessment
32
5:
Calculating the quantities of materials
34
6:
Guideline for sand dam construction
35
7:
Guideline for well construction (based on Nissen-Petersen E, 2006)
37
8:
Guideline for sand dam maintenance
39
List of Boxes
1:
Quick facts Kituï region.
1
2:
Advantages of a sand dam compared to surface water dams.
4
3:
Stepping stones in sand dam construction.
7
4:
Practical guidelines for locating wells.
23
5:
Natural Resource Management training.
24
6:
Hygiene training.
25
7:
Management training.
25
List of Tables
1:
Measured social and economic impacts of sand dams in the Kituï region, Kenya (Thomas,
1999).
1
2:
Water-indicating vegetation with root depth.
11
3:
Sand fractions, saturation and extraction rates (Nissen-Petersen, E. 2006).
13
4:
Example of a bill of quantity for materials and transportation costs in ETB (2007).
20
5:
Example of a bill of quantity for labour costs in ETB (2007).
20
List of Figures
1:
Hypothetical example of catchment approach in rainwater harvesting: combining sand dams
and rainwater harvesting tanks in one (sub)catchment.
2
2:
Schematic cross section of a typical sand storage dam (Borst & de Haas, 2006).
3
3:
Schematic representation of the sedimentation process (Gijsbertsen, 2007).
5
4:
Important water balance components to the hydrological functioning (Borst & de Haas,
2006).
5:
6
Usage of the levelling tool at horizontal grounds (left) and at sloping grounds (right)
(Nissen-Petersen, 2006a).
13
6:
Example of a longitudinal profile of a river section.
14
7:
Example of cross profile and probing results.
14
8:
Examples of sand dam heights: do’s and don’t’s.
16
9:
Cross section with maximum flood height to determine maximum discharge.
17
10:
Cross section of a sand dam body and its dimensions.
18
11:
Cross sectional profile of a sand dam body and its dimensions.
18
12:
Cross sectional profile of a sand dam body.
19
13:
Example of setting a trench with pegs.
21
1.
Case studies from Ethiopia and Kenya
1.1
Sand storage dams to improve rural livelihoods in Kituï District, Kenya
In the Kituï District of Kenya the SASOL (Sahelian Solutions) Foundation began constructing sand
storage dams in 1995. Since this period, over 500 sand storage dams have been constructed. These
vary in size according to valley dimensions and peak flows. On average the Kituï dams are between 24 metres in height and around 20 metres in length.
The main advantage of the Kituï dams is that they use simple inexpensive technology and can be
constructed by local communities mainly with locally-available materials. The cost of an average sand
3
storage dam with a minimum life span of 50 years and storage of at least 2.000 m is about US$
7.500. Some 40% of overall construction cost is provided by the community. They are involved in the
construction of sand storage dams by provision of labour and raw materials through sand dam
management groups. After construction, these groups ensure maintenance of dams and protection of
the water quality as well as promoting ownership and thus sustainability.
Box 1: Quick facts Kituï region:
Area:
Population density:
Climate:
Geology:
Soils:
2
20.400 km
2
25 persons / km
semi arid (precipitation: 250-750 mm/year falling in two wet seasons, open water
evaporation 2000 mm / year)
Metamorphic and igneous basement covered with weathered rock
Silty and clayey sediments, low fertility. In the western part black cotton soils
Sand dams are usually built in sequence because the ecological damage resulting from having a
single point water source is avoided. Also, the water table rises higher and over a larger area
compared to individual units. This will result in ecological regeneration. Apart from drinking water
security, sand storage dams also provide water for development of rural commercial activities such as
small scale irrigation (cash crops and tree nurseries), piped water supply to nearby villages and
industrial activities (brick making). Furthermore, since less time is needed to fetch water (see table),
school attendance increases significantly and more time can be spent on other income generating
activities such as household industries (basket weaving, sewing).
There are examples of subsurface dams in Kituï that already have been in operation for 25 years, and
most that have been constructed subsequently are still fully operational. Although normally a good
constructed sand storage dam requires little maintenance, the sand dam committee is responsible for
it. It is very important that attention is paid to this. Small deficits may otherwise lead to complete dam
malfunction while if proper attention would have been paid, the dam could have been repaired. The
committee should be trained to perform evaluations and report this to SASOL.
Vulnerability
Categories
Agriculture
Special aspects
Gender
Economic
Health
Vulnerability indicators
# of cash crops
% irrigated crops
Water collection Domestic (minutes)
Water collection Life Stock (minutes)
Average walking distance women to water (km)
Income (US$./year)
% households suffering from malnutrition
Before dam
construction
1.5
37
140
110
3
230
32
After
dam
construction
3
68
90
50
1
350
0
Table 1: Measured social and economic impacts of sand dams in the Kituï region, Kenya (after Thomas, 1999).
1
1.2
The catchment approach: an example project of combining water
harvesting techniques in Borana, southern Ethiopia
The Borana Zone in southern Ethiopia is a semi-arid region in which rural communities depend mostly
on livestock farming (mostly pastoralists) and small-scale agriculture. Both activities are highly
constrained by water availability, there being no perennial rivers and with rainfall varying highly, both
spatially and temporally. Communities live in very remote areas, with no access to water, electricity or
sanitation facilities. Children in this region have the lowest school enrolment rate in the country,
spending substantial amounts of time in collecting water and in addition to other domestic tasks.
Water harvesting has proven to be an attractive decentralised water source in areas where other
means of water supply have little potential, like in Borana. However, roof water harvesting is not
effective from thatched roofs and storage of surface runoff in tanks can only provide sufficient water
for the dry period and the quality is questionable. Therefore the sand dam technology provides an
attractive solution for the people of Borana.
Photo 1: Sand dam site after first flood event in Borana,
Ethiopia (ERHA, 2008).
Photo 2: Woman fetching water from a
surface runoff tank in Borana, Ethiopia
(RAIN, 2007).
Communities are already known with the phenomenon of collecting water from ephemeral river beds.
However the sand dam technology itself is not very common in Ethiopia. During an award winning pilot
project which started in 2007, RAIN, ERHA, AFD, Acacia and SASOL conducted several trainings for
10 NGOs throughout the country and implemented 7 sand dams in combination with 10 surface runoff
tanks in Borana. This innovative combination of infrastructure, to recharge groundwater and to harvest
surface runoff water, will ensure drinking and productive use water in the short- and long-term for
communities living both adjacent to an ephemeral watershed (by sand dams) and those further away
(by rainwater harvesting tanks) (see figure1). The project will increase access to a reliable source of
water for at least 10 communities in the critically dry Borana Zone and an environment for further
upscaling in other parts of the country has been created.
Figure 1: Hypothetical example of catchment approach in rainwater harvesting: combining sand dams and
rainwater harvesting tanks in one (sub)catchment.
2
2.
Basic principles of a sand dam
2.1
What is a sand dam?
2.1.1
Definition of a sand dam
A sand storage dam (or sand dam) is a small dam build on and into the riverbed of a seasonal sand
1
river . The functioning of a sand dam is based on sedimentation of coarse sand upstream of the
structure, by which the natural storage capacity of the riverbed aquifer is enlarged. The aquifer fills
with water during the wet season, resulting from surface runoff and groundwater recharge within the
catchment. When the riverbed aquifer is full, usually within one or two large rainfall events, the river
starts to flow as it does in the absence of the dam. However, the groundwater flow through the
riverbed is now obstructed by the sand storage dam, creating additional groundwater storage for the
community.
Photo 3: Typical sand storage dam during the dry season (Borst & de Haas, 2006)
During the dry season, water levels will drop due to abstraction of water, minor evaporation and
possibly by leakage through the dam or vertical leakage into the bedrock. Meanwhile, subsurface flow
(base flow) from the riverbanks towards the riverbed and through the riverbed itself will slowly and
partly refill the riverbed aquifer. Because of the larger storage volume and he slower depletion, the
river provides water throughout the dry season (when built under appropriate conditions), whereas
otherwise the riverbed would have dried up long before the beginning of the new rains.
Figure 2: Schematic cross section of a typical sand storage dam (Borst & de Haas, 2006)
1
Dry and sandy riverbeds are seasonal water courses that transport runoff-water from catchment areas into rivers or swamps
once or a few times in a year. Dry riverbeds are also called ephemeral streambeds, seasonal water courses or sand rivers. Most
of the rainwater being transported downstream in riverbeds appears as high flood events that can be up to several metres high.
Sand rivers are only suitable for sand dams when coarse sands are available and the river must be underlain by impervious
bedrock (or clays like black cotton soil).
3
The volume of water available for abstraction is considerably larger than just the volume present in the
riverbed sands. This is because a large quantity of the water is additionally stored in the riverbanks,
recharging the sand dam reservoir in the dry season (Borst & de Haas, 2006; Hoogmoed, 2007).
Sand dams effectively increase the volume of groundwater available for abstraction as well as
prolonging the period in which groundwater is available.
Box 2: Advantages of a sand dam compared to surface water dams.
Sand storage dams have several important advantages over surface water dams, resulting in a higher water
quality and improved environmental conditions.
•
Protection against evaporation
•
Reduction of contamination (by livestock and other animals)
•
Filtration of water flowing through the riverbed sand (disinfection)
•
Unsuitable for breeding of mosquitoes (malaria) and other insects
•
Inexpensive structures with a high level of community involvement.
2.1.2
Functions of a sand dam
The primary function of a sand dam is increasing the water availability by storing water in the riverbed
and -banks. Water is stored in the spaces (voids) in the sand, which can hold up to 35 percent of the
volume of sand. Sand dams obstruct groundwater flow through the riverbed, resulting in a (continuous
replenishment of the) enlarged groundwater reservoir upstream of the dam.
Besides this, sand dams can have other functions and positive side effects, like:
•
Regional groundwater recharge:
A cascade of sand dams in a will cause a general rise in groundwater levels in a larger area. This
positively affects the environment in the surrounding area of the dam, due to more water availability for
people and vegetation.
•
Sand harvesting and rehabilitating of gullies:
Sand dams can rehabilitate erosion gullies, while the sand sediments behind the dam can be
harvested for sale. If a sand storage dam is built for this purpose, the dam doesn’t have to be
impermeable. Usage of plastic bags filled with soil is more profitable for this purpose (NissenPetersen, 2006).
2.1.3
Types of sand dams
Sand storage dams can be classified according to their construction material (Negassi et al., 2002):
•
Stone-masonry dam:
A dam built of concrete blocks or stones. This type of dam can be
easily constructed by local artisan. A stone-masonry dam is also
durable and suitable for any dam height. The dam is cheap when
construction materials are available within the dam area.
Photo 4: Sand dam
(Gijsbertsen, 2006).
in
Kituï
4
•
Reinforced concrete dam:
A dam consisting of a thin wall made of reinforced concrete. It is a durable structure, relatively
expensive but suitable for any dam height.
•
Earth dam:
A dam consisting of impermeable soil material (mostly clay or clayey soils, or black soils). This type of
dam is relatively expensive to construct and it requires special skill for its design and construction. An
earth dam can easily be damaged and even destroyed by underground flow. Earth dams are not
popular and are seldom used (only for minor works).
2.2
Hydrological principles of a sand dam
2.2.1
Filling of the sand dam aquifer (after Gijsbertsen, 2007)
Sedimentation upstream of the sand storage dam occurs during heavy rainfall events, when river
discharge will be high, transporting large quantities of sediments. The grain size of the transported
sediments is dependent on river flow velocity and the material comprising the riverbanks. Since most
of the land is bare at the start of the rainy season, soils are poorly protected against soil erosion,
resulting in a high silt and sand load in the water.
The sand dam will reduce the flow velocity of the river at some distance upstream of the structure.
This drop in flow velocity results in sedimentation. The materials found in the river bed prior to
construction are a good indication of the type of sediment that will be collected by the sand dam.
These sediments form a ridge comparable to the formation of a delta. Upstream of the ‘delta’, flow
velocity is higher and coarse sediments are transported. Where the ‘delta’ stops, a sudden drop in flow
velocity occurs causing coarse sediments to settle, building the ‘delta’ further towards the sand dam
(see figure 3). Continuous repetition of this process causes the ridge of sand to move towards the
dam, eventually filling the total volume behind the dam.
Figure 3: Schematic representation of the sedimentation process (Gijsbertsen, 2007)
However, the river also transports finer materials, like silt and clay. These sediments have a lower
settling velocity compared to sand will largely stay in suspension and are transported over the dam.
However, fine sediments can settle resulting in a silt layer directly upstream of the sand dam. After the
rainfall event, base flow will dominate river discharge. Coarse sediments can no longer be transported
due to the low flow velocities and are deposited. Without the coarse material, the base flow water has
excess energy leading to erosion of the river bed. Fine sediments will be (re)taken into suspension
and transported, leaving the coarser grained material in the riverbed. Once the runoff has stopped
completely, residual silt layers on top will dry and crack. Animals and people walking on the riverbed
will pulverize this dry silt layer, making it susceptible for wind erosion (Borst & de Haas, 2006). These
processes limit the accumulation of silt and clayey material behind the sand dam.
5
Sedimentation will continue until the ‘delta’ reaches the height of the sand storage dam. The sand
storage dam is mature and filled with coarse sand. This can take several wet seasons, depending on
the availability of coarse sediments, height of the sand dam, river discharge, catchment slope and
rainfall intensity.
In upstream parts of a catchment it is recommended that sand dams are built in stages,
since the availability of coarse material is generally limited and base flow is small or
absent. The optimum height of one stage is site specific. The first stage is typically 50 cm.
It is recommended to consult an expert on this matter.
2.2.2
Hydrological functioning of a sand storage dam
In most semi arid regions, rivers are only holding water during and short after rainfall events,
especially in more upstream parts of catchments. Due to the often short and intense rainfall events in
combinations with certain soil types like silt and clay, a large part of the rainfall will leave the
catchment as surface runoff instead of infiltrating the soil and recharging the groundwater. Runoff
coefficients up to 70% can be found.
A sand dam obstructs groundwater flow through the permeable riverbed. It only takes one or two
heavy rainfall events to fill the enlarged riverbed aquifer completely, and after this the river will start to
flow as it would in absence of a sand storage dam. The raised water table in the riverbanks results in a
groundwater flow from the riverbanks towards the river bed. This leads to replenishment of the created
reservoir (see figure 4). Water will be available in the riverbed as long as the groundwater flow from
the riverbanks continues. Therefore it can be highly profitable to take soil- and water conservation
measures in the upstream areas within the catchment, to increase infiltration of rain water creating
more base flow within the catchment.
Water balance components
ET
E
P
R
Bs
Bf
Qout
Lout
Qin
Up
Gr
Evapo(transpi)ration from slopes
Evaporation from riverbed
Precipitation
Surface runoff from slopes to river
Groundwater baseflow from slopes to river
Shallow and deep longitudinal baseflow
River discharge outflow over downstream dam
Leakage underneath and around downstream dam
River discharge inflow over upstream dam
Use of water (abstraction)
Loss of water into the ‘impermeable ground
Figure 4: Important water balance components to the hydrological functioning (Borst & de Haas, 2006).
6
3.
Practical steps within a sand dam project
In the previous chapter, you have learned what a sand dam is and how it is functioning. Understanding
the functioning of a sand dam crucial in order to go through the following chapters which contain a
sep-wise approach in how to implement a sand dam project. These steps are:
•
Site selection and community involvement;
•
Water use assessment;
•
Design;
•
Excavation and construction;
•
Maintenance & management.
Box 3: Stepping stones in sand dam construction
Chapter 4:
Site selection and Community involvement
Chapter 5:
Water use assessment
Chapter 6:
Design
Chapter 7:
Excavation and Construction
Chapter 8:
Maintenance and Management
In this manual we will focus on masonry dams with or without a reinforced foundation and a u-shaped
spillway. After many years of practical experience and research on sand dam design by SASOL, this
design has proven to be most effective, durable and easiest to construct by local beneficiaries.
Although earth dams are most cost-effective, they can not store large quantities of water which makes
them less suitable.
To keep this manual easy to read and understand, attachments have been added in which further
information is given like checklists, design and cost calculation tools. Also a CD-rom has been
provided with more information and tools.
7
4.
Site selection
4.1
Importance of site selection
Site selection is the first and most important step in constructing a sand dam. Accuracy in site
selection will determine the success of the dam. A construction site should be appropriate on both
physical and social grounds. This chapter will guide you through site selection for sand dams in 3
steps:
•
Selecting potential catchments from a probability map based on a desk study (paragraph 4.2)
•
Selecting potential riverbeds based on field data regarding the physical and sociological aspects
(paragraph 4.3).
•
Selecting riverbed sections and the sand dam location(s) (paragraph 4.4)
4.2
Selecting potential catchments for sand dams
A quick scan is used to make a probability map of an area for building sand dams. This will make site
selection more specific and thus efficient. The desk study can be performed using digital or analogue
data. The result will be a map showing high potential areas. If available, the below mentioned data are
for a first indication whether a catchment is suitable for building sand storage dams.
1.
Topography map:
A topography map gives general information about the catchment, such as locations of villages and
roads. The presence of communities (the beneficiaries) in the area in the dry period (nomads or
permanently) is the first condition.
A topography map also shows locations of rivers, and the size and general characteristics of the
catchment. Rivers may have a maximum width of 25 metres (otherwise other options may be more
suitable, such as subsurface dams (Nissen Peterson, 2006)). The catchment should be hilly (see also
point 2: Digital Elevation Map).
2.
Digital Elevation Model:
A Digital Elevation Model (DEM) contains information on the morphology of an area (elevation and
slopes). A local drainage direction map can be calculated from it, which will give the drainage pattern
(rivers) of the catchment. Furthermore, information on the slopes within a catchment can be derived
from a DEM. The most suitable locations for sand dams have a slope gradient between 2 to 4 percent.
The particle size of sediments accumulated along streams and in riverbeds (which will also fill the
sand dam) is proportional to the slope gradient, whereas the depth and the lateral extent of the river
bed aquifer are inversely proportional to the slope gradient. The optimum relation between these two
factors is found on the gentle slopes between hills and plains with a gradient ranging from 0.3 to 4
percent (Gezahegne, W., 1986).
Digital elevation data by the Shuttle Radar Topography Mission (SRTM) can be freely downloaded
from the internet (http://srtm.csi.cgiar.org/SELECTION/inputCoord.asp). The resolution of the data is
rather coarse; 90 meter horizontal.
8
3.
Geological map and soil data:
Catchment geology determines, together with discharge characteristics and slope, the grain size of the
sand dam. A geological map can indicate whether a catchment has the potential to produce (coarse)
sand. For example, granite hard rock will produce coarse sand while shales will produces fine (clay or
silty) material.
For example, the geology of Kenya is available from USGS. This map is part of the open file report 97470A, version 2.0 2002, scale of 1:5,000,000. The dataset is an interim product of the U.S. Geological
Survey’s World Energy Project (WEP) and can be freely downloaded from the internet.
If the riverbed itself contains large stones and boulders, seepage under the dam may
occur. When large boulders occur, special care should be taken to site selection. This will
need to be checked in the field. Soil data can give information on where to locate sandy
areas within a catchment.
4.
Aerial photographs and satellite images:
Aerial photographs and satellite images can help locating sandy riverbeds based on the morphology.
Aster satellite images can also be used to indicate sandy riverbeds and different types of geology
through the reflection (ratio), as has been done by Gijsbertsen (2007). Aster satellite images can be
downloaded from http://asterweb.jpl.nasa.gov/.
5.
Precipitation and evaporation data:
The effectiveness of sand storage dams appears to be quite insensitive to precipitation (Borst and de
Haas, 2006; Hoogmoed, 2007). However, when locating suitable regions for building sand dams,
precipitation will be important because it influences discharge characteristics (base flow) and thus also
the availability of coarse grained material in the riverbeds. Higher annual precipitation will mean more
storm events. These areas have a higher suitability based on precipitation compared to regions with a
lower annual rainfall. Also, to calculate the yield of a sand dam, it is essential to know the
climatologically behaviour of an area.
Tropical Rainfall Measuring Mission (TRMM) satellite images contains rainfall data with a spatial
resolution of 4.3 km (In the region between 35°N an d 35°S). Data is available on the internet on
monthly basis (http://neo.sci.gsfc.nasa.gov/Search.html). LocClim also provides rainfall data
(http://www.fao.org/sd/2002/EN1203a_en.htm, where the program can be requested for free).
6.
Flood data:
Flood data can be used to determine the maximum flood height and thus the minimal height of the
riverbanks (see also paragraph 6.2). It also provides information on discharge characteristics of a
catchment during a rainfall event.
For example, the river has to be seasonal, although it is very important that base flow occurs since this
prevents sand storage dams of filling with fine (unfavourable) sediments. Local communities and water
authorities can indicate whether the river dries up immediately after a rainfall event or if the river
continues to flow, showing base flow.
4.3
Selecting potential riverbeds
The result of the desk study described in paragraph 4.2 is a first indication of which (parts of)
catchments are suitable for constructing sand dams. To fine tune this selection field visits are
necessary (paragraph 4.3.2). From this stage onward, community involvement is crucial to the
success of the project.
9
4.3.1
Community involvement and forming a Water Committee
Involvement of beneficiaries aims at sensitizing and mobilizing communities to improve the quality of
their life through collective self-help. Many types of
community organizations usually already exist within a
community depending on their current needs, problems
and aspirations. Before starting a sand dam project in an
area, the community must be intensively involved to
create a feeling of ownership which has proven to be the
key factor in successful construction and maintenance of
sand dams. The benefits of a sand dam project are
mostly collective, but there can also be individual needs,
like irrigation of specific land plots. An organization with
sensitivities for collective as well as individual effort is
therefore required for a sand dam project.
Photo 5: Beneficiary involvement during
site selection in Borana, Ethiopia (RAIN,
2007).
A sand dam project in a catchment potentially suitable for implementation starts with sensitizing the
communities’ awareness on the project. Also, information on institutions, rules and habits of the
communities should be identified. Secondly, a community meeting will be held with the project staff
and community discuss the possible environmental and social impact of the development of sand
dams within the area. The following aspects should be discussed in the community meeting.
•
Assessment of water problems,
•
Assessment of development issues within the project area,
•
Informing and educating on the various types of water harvesting technologies, in particular the
sand dam technology,
•
First and indicative assessment of possible sand dam locations with the community.
Also, the community has to elect a committee from their midst. This so-called water committee
consists of a representative group of the community and will take part in several trainings (further
discussed in chapter 9). Awareness and involvement in the project processes will hence be ensured.
The water committee will have the following objectives (Munyao et al, 2004):
•
Performing baseline survey on water use within the community
•
Joining in the riverbed surveys resulting in selection of the building location
•
organising community mobilization for required participation works during the construction
process;
•
supervise the implementation, operation and maintenance procedures.
The steps in community involvement and its objectives are discussed in further detail in attachment 2.
4.3.2
Physical and social selection criteria
The result of the desk study described in paragraph 4.2 is a first indication of which
catchments are suitable for the implementation of sand dams. Then, the information
community (paragraph 4.3.1) is integrated into this map, resulting in the most potential
riverbeds. These will be visited together with the water committee to collect valuable data
(parts of)
from the
(parts of)
based on
10
which building location(s) are chosen. The following is based on practicalities from Nissen-Petersen
(2006).
First draw a sketch of the riverbed and surrounding areas which will be visited and from which the
following information will be gathered:
1.
Location and types of water-indicating vegetation.
Vegetation that indicate the presence of water, can be growing on the banks where the reservoir will
be located, as proof of the riverbed capacity to store water. In the table below some names of trees
are given which indicate water at a given depth below the surface.
Botanical name
Cyperus Rotundus
Vangueria Tomentosa
Delonix Elata
Grewia
Kiswahili and Kikamba
names
Kiindiu
Muiru Kikomoa
Mwangi
Itiliku Itiliku
Depth to water-level (m
below surface)
3–7
5 – 10
5 – 10
7 – 10
Markhamia hildebranditi
Muu Chyoo
8 – 15
Hyphaene Thebacia
Kikoko Ilala
9 – 15
Borassus Flabellierfer
Mvumo Kyatha
9 – 15
Ficus Walkefieldii
Mombu
9 – 15
Ficus natalensis
Muumo Muumo
9 – 15
Ficus malatocapra
Mkuyu Mukuyu
9 – 20
Gelia aethiopica
Mvungunya Muatini
9 – 20
Piptadenia hildebranditi
Mganga Mukami
9 – 20
Acacia seyal
Mgunga Munini
9 – 20
Table 2: Water-indicating vegetation with root depth.
2.
Location of waterholes, their depth to the water table and quality of the water.
Presence of waterholes especially after the rainy season) is an indication that the riverbed contains
water and that it does not leak to deeper groundwater very fast. Pay special attention to those
providing water the longest during the dry season. Also note the depth of the water table to the
riverbed surface.
The water quality in the waterhole is an indication of the quality of water which can be harvested after
building a sand dam. However, water quality can improve significantly by taking protective measures
against animals can make significant improvements (see: RAIN water quality guidelines).
3.
Location and types of rocks and boulders.
If large boulders are present in the riverbed, care should be taken in choosing the sand dam location.
The sand dam is preferably build on (and its wings attached to) hard rock or a compacted and strong
soil. If a large boulder is mistaken for hard rock, water can leak from the sand dam reservoir, leading
to unnecessary loss and potential undermining of the sand dam. Check whether hard rock is present
in the riverbanks and –bed by looking for rock outcrops.
Pay special attention to the presence of halite near the
riverbed, which is a salty whitish substance that turns water
saline. If salty rocks (white and pink mineral rocks) are
situated in the riverbanks upstream of a dam, then the water
may be saline and therefore only useful for livestock. Local
11
communities often know if there are any salty rocks, because livestock like to lick them for their salt
content.
4.
Coarseness of the sand in the riverbed.
The material which is present in the riverbed is a good indication of the material which will fill up the
sand dam reservoir after construction. Coarse sand is preferred, since it has a larger infiltration
capacity and water can be abstracted more easily.
5.
Two high riverbanks.
Suitable riverbeds have two high riverbanks. During flood events the river should not flow over the
riverbanks, because this can cause erosion of the riverbanks, flooding of downstream located villages
and it might cause the river to change its course. In this case, the sand dam will be left as a ruin. By
using flood data and information from local water departments and local knowledge of the community,
the maximum water height during a flood event can be determined. The minimal height of the
riverbanks should be:
Minimum height riverbanks = Height of dam + Flood height + max. 10% (safety height)
6.
A (preferred) maximum width of 25 metre.
Riverbed width preferably shouldn’t exceed 25 metres. The reinforcement required for such kind of
long dam walls is too expensive; hence the sand dam will not be cost-effective. Other alternatives,
such as subsurface dams, can be applied.
7.
An impermeable (bedrock)layer.
To ensure storage of water within the sand dam aquifer, losses through leakage to deeper
groundwater should be minimised. Therefore, the dam should be built on solid bedrock or an
impermeable layer. This will also protect the sand dam from undermining through groundwater flow
underneath the sand dam. This can be checked by using the geological map and outcrops in the area.
Also, holes can be dug in the riverbed to find the depth of a consolidated layer or bedrock layer.
8.
Type, suitability and availability of construction material.
The construction material locally available (such as sand, rock outcrops, bricks, etc.) can help to
determine the type of sand dam (as described in paragraph 1.2) to construct. For example, a masonry
dam is not the best choice if no stones are available in the area since transporting them from other
areas is very expensive.
9.
Presence of riverbed crossings and roads.
Rural roads often cross riverbeds. A sand dam is preferably located near these crossings, if physical
conditions allow, because it will be easily reached through existing roads. Also, for transportation of
materials it is important to know the most suitable roads or routes.
10.
Names of houses, schools and shops near the riverbed.
This information is useful for organising the project. Also, an assessment of the water demand can be
made.
11.
Land rights.
To avoid conflicts, care should be taken in areas where the dam site is owned or used by two or more
villages or individuals.
12
4.4
Selecting riverbed section(s) and sand dam location(s)
After having compiled the information listed above, a detailed survey is carried out in the parts of the
catchment which seem most promising. This mainly consists of probing and evaluating the properties
of the riverbed. Attachment 3 lists data which should be collected during this survey. These are:
•
depth and coarseness of the sand at different levels and the type of basement from the probing
rod.
•
depth of water from the rod.
•
width of the riverbed and height of the riverbanks.
•
presence of water-indicating vegetation, waterholes, roads, etc. is noted.
This procedure is repeated at regular intervals, for example 20 metres. The data gathered by the
above described survey results in a map and profile (paragraph 4.4.4) of the river section. This map
shows information about the river length and width, locations of cross-sectional, longitudinal profiles,
water-indicating trees and waterholes.
4.4.1
Storage capacity and extraction percentage of sand
Water extraction is more profitable from riverbeds containing coarse sand than from those with fine
textured sand. The porosity and extractable capacity of sand can be determined through the following
method. A 20 litre container with a plug in the bottom is filled with sand from the riverbed. The sand is
slowly saturated with a measured volume of water. Then the plug is removed from the bottom of the
container. The volume of water which has drained out of the sand within one hour is taken as a
measure for the extractability. Table 3 gives values of extractability of water in different soils. This
shows that the extractability of sand is highest; therefore coarse sand is preferred as aquifer material.
Size (mm)
Saturation
Water Extraction
Silt
< 0.5
38%
5%
Fine Sand
0.5 – 1.0
40%
19%
Medium Sand
1.0 – 1.5
41%
25%
Coarse Sand
1.5 – 5.0
45%
35%
Table 3: Sand fractions, saturation and extraction rates (Nissen-Petersen, E. 2006).
4.4.2
Gradient of the riverbed
Measuring the gradient of the riverbed can be done by using a circular transparent hose, half-filled
with water. One person should stand at the starting point, using the levelling tool. Another person
should stand upstream of the person holding the levelling tool with a long pole which is held vertically.
The person with the levelling tool has to make sure the water levels in the tube are in one line. He or
she should indicate to the person holding the pole where this sight line crosses the pole. The height at
which the line of sight crosses the pole should be measured from the surface of the riverbed
(parameter y [m]). The distance between point No. 1 and point No. 2 should be measured (parameter
x [m]). The height of the eyes of the person holding the levelling tool should be measured (parameter z
[m]). Then, the gradient (parameter w [m]) can be calculated using the below formula:
W = ((z – y)/x)*100 = gradient [%]
13
Figure 5: Usage of the levelling tool at horizontal grounds (left) and at sloping grounds (right) (Nissen-Petersen,
2006a).
4.4.3
Depth and type of basement and depth of groundwater
The depth of the basement or impermeable layer in the riverbed with respect to the riverbed surface is
of importance to decide where the sand storage dam should be build. It should be constructed at the
location where the impermeable layer is closest to the riverbed surface. Preferably, the basement
upstream of this location is deeper, to get a larger sand dam aquifer. The depth of the sand in the
riverbed can be surveyed by using an iron rod with a diameter of 16 mm (5/8”) Notches should be cut
in the probing rods for every 25 cm to collect sand samples when the rods are pulled up. A hammer is
needed for hammering the rod into the riverbed, together with a tripod ladder used for hammering long
probing rods. This can be done following the procedure below:
Hammer the probing rod straight down in the middle of the riverbed until it hits the floor under the sand
with a dull sound. Mark the level of the sand on the rod and pull the rod straight up without twisting.
4.4.4
Example of longitudinal profile and cross section
Figure 6 is an example of a longitudinal profile. It shows the points at which the sand is deepest (here:
4.0 m deep between 55 and 60 metres) and where natural subsurface dykes (of solid bedrock or
impermeable soil) are located (for example at 40, 70 and 85 metres). The locations with deep sand
are the potential reservoir of a sand dam and the natural dykes are potential locations for a sand dam.
After making a longitudinal profile of the selected riverbed section, the point where the sand is the
deepest and therefore the largest reservoir can be selected. In figure 6 this is at 60 metres.
Figure 6: Example of a longitudinal profile of a river section.
14
By knowing the longitudinal and cross-sectional profile, a calculation of the reservoir capacity can be
made. In figure 7 an example is given of a cross-section where the sand is deepest. It is important to
take measurements every 1 or 2 metre across the riverbed to determine the riverbed morphology.
Figure 7: Example of cross profile and probing results.
15
5.
Water demand vs. water yield
5.1
Water use assessment
The water demand of the local community has to be investigated before starting a water project, to
understand the most important needs of a community. Next to this the community has to be aware of
the possibilities and limitations of a sand dam. The water needs or water demand of a community is
the amount of water currently used by people for domestic purposes as drinking, cooking and
cleaning, as well as for irrigation or for cattle. This information gives insight into water demand, water
use, future aspirations and water quality problems. The water use assessment has to be executed by
the implementing organisation before selecting the locations of the sand dams. The information which
needs to be gathered includes:
•
the number of households within a community;
•
the number of women, men, boys and girls;
•
their current water needs for each water requiring activity;
•
their aspirations / expectations for future water needs.
When executing a water use assessment, the water committee has to elect people from each group of
the community (men, women, elder, youth etc) to contribute. This can be a member of the water
committee itself as well as other members from the community. Water needs from each group of the
community have to be reflected in the water use assessment.
In attachment 4a practical questionnaire is given. The questionnaire will provide a guideline to
determine the water needs of a community. After finalization of the sand dam project (when the sand
dam is mature and in full use), a second water use assessment should be carried out. The results of
the water use assessment before and after the project can then be compared and conclusions about
the success of the project can be made.
5.2
Water yield
Determining the volume of extractable water is not very straight forward in the case of a sand storage
dam. The total amount of water is not simply the water which can be stored in the riverbed sand.
Hoogmoed (2007) and Borst & de Haas (2006) have indicated that the riverbanks play a crucial role in
the functioning of a sand storage dam because of the continuous groundwater flow from the
riverbanks to the riverbed, which slowly and partly compensates the loss of water through leakage,
evaporation and abstraction (paragraph 2.2.2). Therefore, the riverbanks must be included in the
calculation of the water yield.
Calculating the volume of water which can be abstracted from the riverbed can be done using the
calculation tool available at www.sanddam.org.
This is only an indicative estimation of the storage capacity. Sand dams depend largely on
local factors, which are difficult to include in a model. Also factors like, irregularities or
fractures in the basement, geomorphology of the catchment, rainfall events etc. can have
a big influence on the success and yield of a sand storage dam. More information can be
found on www.sanddam.org.
16
6.
Design
6.1
Introduction
After determining the water demand and estimating the water yield at the selected sand dam location,
the design can be made. There are different approaches in designing a sand dam, but this manual will
focus on the designing approach of SASOL, combined with AFD. A sand dam can be defined in four
main parts:
•
the dam;
•
spillway;
•
the wing walls;
•
and the stilling basin.
6.2
Dam height
To determine the dam and spillway height at a specific location, it is very important that the water level
and the maximum flood level will remain below the riverbanks after construction of the dam,. If the
flood level is higher than the riverbanks (Bh), construction of a dam is not advisable. The dam and spill
way height are therefore determined by the maximum discharge and maximum flood height (see figure
9).
Figure 8: Examples of sand dam heights: do’s and don’t’s.
In figure 8 the top picture shows a sand dam height by which the maximum flood level will remain
lower than the riverbanks, while the picture below shows a sand dam height by which the maximum
flood level will exceed the riverbanks. In this scenario flooding and thus severe erosion of riverbanks
(eventually causing dam failure) will occur. The most practical way of calculating maximum discharge
is by getting information in the field and from the selected beneficiaries on flood levels.
However, maximum discharge can be calculated in 2 different ways:
17
•
Calculating the maximum discharge by the highest flood level (known by flood marks on the
banks or information from local community’s);
•
Calculating the discharge at the selected location by using a certain return period (for example:
a rain event with a return period of 50 years) by using a rainfall-runoff model or a mathematical
formula for rainfall runoff.
In the picture below you see a cross-section at a dam location, with the different parameters that have
to be measured to calculate the maximum discharge.
Figure 9: Cross section with maximum flood height to determine maximum discharge.
Maximum discharge in riverbed section:
2/3
Q = 1/n * A * R
*S
1/2
3
Q = maximum discharge in riverbed section (m /s)
n = Manning roughness of riverbed
2
A = wetted cross-sectional area (m ), by:
P = wetted perimetre (m), by:
R = hydraulic radius (m), by:
S = slope of riverbed (m/m)
6.3
½*(channel width + riverbed width)* flood height
B1 + riverbed width + B2
A/P
Spillway, wing walls and stilling basin dimensions
The maximum discharge (as determined using the equation in paragraph 6.2) is used to determine the
spillway dimensions, for which the formula is given in the box below.
Using maximum discharge to calculate spillway dimensions
3/2
Q = c * L s* H
3
Q = maximum discharge in riverbed section (m /s)
c = 1,9 (constant depending on spillway shape, here: broad crested weir)
Ls = length of spillway (m)
H = height of spillway (m)
Cros-sectional width dimension of a sand dam
Gf = gross freeboard (m)
Hf = height freeboard (m)
Hd = total height of dam (m)
Hs = total height of spillway (m)
Lw = length wing wall (m)
Lwe = length wing wall extension (m)
Ls = length spillway (m)
18
Figure 10: Cross section of a sand dam body and its dimensions.
When determining the distance the wing walls go into the banks, bank characteristics have to be taken
into account (Munyao et al, 2004):
•
in loose riverbanks: approximately 7 metres into the riverbanks;
•
in hard soils: approximately 5 metres into the riverbanks;
•
in hard and impermeable soil: approximately 0 – 1 metre into riverbanks;
•
in rock formation: no need of constructing in riverbanks.
The length of the wing wall (Lw) should be approximately 2 metres into the riverbanks. The length of
the wing wall extension (Lwe) should be approximately 5 metres. This is an example of wing wall
dimensions in loose riverbanks. Currently a research is carried by SASOL and Acacia on the specific
effects of sand dams on groundwater levels within a catchment, which will lead to more specific
guidelines on wing wall dimensions.
Stilling basin dimensions
SL
=c*L
1/3
* H2
1/2
SL = length of stilling basin (m)
c = 0,96 (constant)
H2 = height of freefall (m): height of water level upstream –height of water level downstream
Legend of cross-sectional profile length
dimensions
Hd
Fh
Fl
Lt
Lb
Sl
Sh
Ah
Al
= height of dam (m)
= height of foundation (m)
= length of foundation (m)
= length of top of dam (m)
= length of base of dam (m): 1 m
= length of stilling basin (m)
= height of stilling basin (m) (max of 0.3 m)
= height of anchor (m): 0.3 m
= length of anchor (m)
Figure 11: Cross sectional profile of a sand dam body and its dimensions.
19
7.
Excavation and construction
7.1
Materials and Labour
7.1.1
Materials
The types of materials needed to construct a sand dam depend on the type of dam (paragraph 2.1.3)
that is found most suitable at the selected location. This depends on physical properties of the
catchment and on the materials available on the market as well as within the area of the selected sand
dam location. If materials like stones and sand are locally available, this will reduce costs of materials
and transport. In this paragraph we will focus on the bill of quantity for stone-masonry dams.
Figure 12: Cross sectional profile of a sand dam body.
Construction materials masonry sand dam
Stilling basin:
1:3 mortar
Large boulders
Dam:
1:4 mortar with well interlocked stones, ratio cement:sand:hardcore = 1:4:9-12
Upstream wall and top of dam plastered with 1:3 mortar (30 mm)
Foundation:
1:3 mortar foundation (100 mm)
1:4 mortar with well interlocked stones, ratio cement:sand:hardcore = 1:4:9-12
(reinforcement bars of barbed wire (400 mm spacing)
20
Description
Unit
Unit cost
(ETB)
Cement
50 kg
bag
pieces
pieces
20 kg
roll
2
m
metre
pieces
kg
kg
kg
m3
m3
m3
unit
Reinforcement bars ½ Dia’ (12m)
Reinforcement bars ¼ Dia’ (12m)
Barbed wire
Timber 2”x 2”
Polythene paper g 1000
Reinforcement bars Dia’ (10m)
Reinforcement bars Dia’ (6mm)
Black wire
C.I.S. Nails
Stone hard core2
Sand13
Water
Other construction equipment (
V.tools, Hand pump, Mould for well
concrete rig)
Camping site for skilled labourers
Total
unit
130
Total
quantity for
a sand dam
241.8
Costs per
Volume of work
3
(ETB per m )
3.10
Total
cost
(ETB)
31,434
0
0
68
0.0
0.0
6.0
0.18
0.18
0.08
0
0
411
12
15
140
14
14
18
31.25
19
140
7,500
52.0
104.0
3.1
51.5
3.9
2.3
233.2
66.3
37.4
1.0
0.67
1.33
0.04
0.66
0.05
0.03
2.99
0.85
0.48
1.00
624
1,560
437
721
55
42
7,288
1,260
5,242
7,500
6,500
1.00
1.00
6,500
63,073
Table 4: Example of a bill of quantity for materials and transportation costs in ETB (2007).
In attachment 6 you will find the guidelines to calculate the quantity of the materials derived from the
dimensions of the dam.
7.1.2
Labour
In table 5 an example is given of the bill of quantity for labour costs: the contribution of community
workers will reduce costs. The number of masons needed and days required to construct the sand
dam depend largely on the size and location of the dam.
Description
4 masons
10 mason assistant
15 community
workers
Total
Unit (days
p.p.)
45,8
31
50
Unit
(ETB)
50
15
0
cost
Total
days
183.3
312.0
750
Cost per Volume of work
3
(ETB per m )
2.35
4.00
0
Total
(ETB)
9,165
4,680
0
cost
13,845
Table 5: Example of a bill of quantity for labour costs in ETB (2007).
7.2
The trench
7.2.1
Setting the trench
This is marking the position and the size of the dam taking in to account the size of the wing walls and
working space during construction.
To estimate the size of the trench, the following should be taken into account:
2
Refers to collection, preparation and loading of stone and sand that is expected to be covered by community participation. The
cost planned is for renting a truck for transportation.
21
•
Measure
the
appropriate
distance
(determined in paragraph 6.3) from one of
the river banks depending on bank
characteristics and fix a peg.
•
Fix another peg across the river
perpendicular to the river course at the
appropriate distance.
•
Use a plumb bob and line mark several
points from the building line and fix pegs.
Figure 13: Example of setting a trench with pegs.
7.2.2
Excavating the trench
The marked trench is dug guided by the building line (see below photo). The
depth of the trench is determined by the depth of impermeable layer in the
ground which will obstruct seepage below the sand storage dam. The dug out
soil should be placed downstream of the building location to avoid it filling the
aquifer. If the dam is build into bedrock material, a trench should be cut into
the rock to ensure secure jointing of the rock and mortar. Care should be
taken to make sure no fractures or weathering zones are present in the
basement rock. If suspected, this can be tested by poring water on the
suspected weathered zones. If the water leakes away, the rock surface
should be cleaned from the weathered rock or fractured rock. If clay forms the
impermeable layer, the trench should be dug in for about 0.5 m to avoid
seepage. After these conditions are met, the trench is ready for dam setting
and construction (Munyao et al, 2004).
Photo 6: People
excavating a trench
(RAIN, 2007).
7.3
Construction of the dam
Construction starts with putting in place the reinforcement columns vertically in the trench followed by
the construction of the foundation blinding slab. Reinforcement is only required if a very large or high
dam is constructed. After this the second horizontal reinforcement layer is placed, followed by the
second foundation blinding slab and then the actual masonry structure (of hard core and mortar) starts
(Munyao et al, 2004). In attachment 7 you will find a detailed guideline for construction of a sand dam.
Intensive technical supervision and monitoring is the major activity that should be attained during the
construction process of a sand dam.
22
8.
Water extraction from a sand dam
8.1
Types and locations of water extraction points
8.1.1
Traditional scoop holes
The most common way to abstract water from a sand storage
dam is by means of a hand dug scoop hole in the riverbed.
Water is scooped out at first, and the water that refills the
scoop hole is abstracted. The method is susceptible for
pollution, especially by animals. Therefore, animals and
humans should use different scoop holes. The human scoop
holes should be located close to the sand dam, on the
upstream side. The animal waterhole should be at the
downstream side of the sand storage dam. The riverbed will
filter the groundwater as it flows through, so the distance
between the waterholes for domestic use and cattle should be
as far apart as possible.
Photo 7: Women using a scoop hole,
Kituï District, Kenya (M. Hoogmoed,
2007).
Furthermore, to prevent animals from using the domestic waterholes, these should be barricaded all
around by thorny bushes. The water from the scoop holes is relatively clean. Nevertheless should it be
boiled or treated before drinking.
During the dry season the riverbed is often used as a road for cattle, which results in
manure on the riverbed. At the start of the wet season, this manure will be flushed into the
scoop holes, leading to contamination of the water. After the first river discharge, the
water remaining in the scoop holes should not be used for drinking without treatment. The
area close to the scoop hole, especially upstream should be kept clean of animal human
interference and treatment or cooking before use is recommended.
8.1.2
Well with hand- or rope pump
A well is the better alternative for a scoop hole. It will protect
the water quality because animals and river water can not
enter. Many different types of wells exist. A well need to be
covered (to prevent contamination, resulting in higher water
quality) and a hand pump should be used to extract water. A
maximum of 3 wells should be located on the upstream side
and close to the dam embankment: approximately within 3 to
10 metres, since the sand reservoir will be deepest just
upstream of the dam (depending on the longitudinal profile as
described in paragraph 4.4.4). The yield of the potential well
should be sufficient. If a well is located in the riverbank, the
profile should be checked on permeable layers and their
connection to the riverbed by making a test drill.
Photo 8: Men fetching water from a
closed well near a sand dam in Kituï
Kenya (M. Hoogmoed, 2007).
23
Box 4 provides practical guidelines to identify potential well locations. Water can be extracted from a
well using a motor pump or hand pump. SASOL has been using rope and washer pumps and hand
pumps. However, sustainability of rope and washer pump might be questionable as long as people are
not trained in proper operation and maintenance. Hand pumps are therefore recommended.
Box 4: Practical guidelines for locating wells.
The well should just be located at the spot where the most water is available: this is closest to the am at
locations where the bedrock or impermeable layer is deepest. Experiences in Kenya and Ethiopia showed
that practical site specific information can be used to locate potential well locations. This includes:
-
Identifying locations of existing scoop holes:
Scoop holes are the best spots from communities' long-term experience to collect water from the river.
Based on the locations of scoop holes, wells for a sand dam can be located at either side of the river
embankment near the identified scoop holes.
-
Identifying locations near the sand dam where the riverbed material is deep.
A deep riverbed means more storage. Locating the well up stream of the dam at either sides of the
river embankment in the direction of the riverbank where the riverbed material is thicker is found the
best location for sand dam wells.
8.1.3
Outlet pipe with tap
An outlet can be installed as a perforated pipe at the bottom of the dam just above the impermeable
layer. The pipe should be covered fully with filter material and geo-membrane to prevent entry of sand
and silt. Disadvantages of an outlet, is that it can weaken the dam structure, maintenance is
complicated and it is also found be an expensive option (Understanding the Hydrology of (Kituï) sand
dams: Short mission report, November 2005).
8.2
Construction of wells
A well for a sand dam is constructed similarly as a shallow hand dug well, usually constructed for
exploration of shallow ground water. It is important that the well abstracts the water from the deepest
parts of the river sands. The deepest sands will produce the most safe water (bacteriological).The
lining of the well should preferably have no openings at shallow depths. It could even be considered
just to have an open well-floor, covered by gravel.
If a well is constructed at the centre of a river, it is extremely important to protect it from high flod
damages. The well has to be a ‘hydrodynamic’ type to withstand the forces of a flood and must be
protected from siltation by keeping its height about 0.5 – 1 metre above the surface of the riverbed.
The top must be covered with a concrete slab (facing downstream to prevent entry of floodwater) to
prevent contamination and mosquito breeding. The detailed construction process for a well and
wellhead is given in attachment 8.
To protect the intake from high flood damages, alternatives can be considered. The intake can be
constructed in, or close to the riverbank or by an outlet pipe through the dam. Creative alternatives are
given by (Nissen Petersen, 2006).
24
9.
Management and maintenance and monitoring
9.1
Training of local community
Based on the experiences of successful sand dam projects, facilitating community trainings on
implementation, operation, management and maintenance are advised to be addressed during a
community based sand dam project. Community trainings have the following objectives for the
community:
•
Full participation in the process of the project planning and implementation;
•
Enhanced awareness on project management;
•
Ensured technical and management skills after project completion;
•
Enhanced awareness on management of the water quality and risks involved.
During the pilot sand dam project in Ethiopia community trainings have been divided into three
categories:
•
Sessions on the project planning, implementation and management of activities. This is already
discussed in paragraph 4.3.1;
•
Educational sessions on natural resources management, sanitation and hygiene;
•
Technical trainings on operation, management and maintenance for the water committee.
The proposed methodology of all these trainings and educational sessions is based on carefully
selected questions to guide group discussions. Each community elects five to seven members for the
water committee and at least two other community members (future caretakers) to participate in the
trainings and sessions.
9.1.1
Educational sessions on natural resources management, sanitation and hygiene
These educational sessions will be facilitated by a qualified person from the implementing
organisation, preferably in cooperation with a representative from the concerning local government
department. During these sessions, representatives of the water committee are educated on several
subjects to ensure awareness and understanding of natural resources management, sanitation and
hygiene. Natural resources management will mainly focus on the proper and efficient management
and usage of the sand dam. These sessions will take 5 days in total and are organised within the
community (Munyao et al, 2004).
Box 5: Natural Resource Management training
This training aims to facilitate ways and means of management of natural resources. With the help of a
questionnaire the community gathers the necessary information about their available natural resources and
explores ways and means of utilizing their natural resources to improve their livelihoods. By the end of the
training, each community has developed a comprehensive list of the natural resources found in their village.
They compile the potential ways and means of using these resources in an action plan.
In the absence of hygienic water practices, attempts to ensure high water quality will be futile. Safe
rainwater can be easily contaminated after extraction from the system, for example by the use of
contaminated jerry cans or by contamination present on the hands of users. Therefore, hygiene
25
education and monitoring of the operation and maintenance of the system, along with sanitary
practices, are essential if rainwater supplies are to fulfil their potential to provide clean water. Creating
awareness on personal and system hygiene issues related to water is crucial. Local health
organizations play an important role in educating consumers on water treatment methods, managing
water supplies and giving specific guidance in managing, operating and maintaining RWH systems.
Water supplies, sanitation facilities and hygiene behaviour work together as an integrated package:
the quality of the approach in all components determines the outcome [Hygiene Promotion, Thematic
Overview Paper 1, 2005].
Box 6: Hygiene training
This training focuses on creating awareness within the community on contamination risks of their water
sources and giving guidelines for hygienic and practical guidelines on water usage. This training is based on
the RAIN Water Quality Policy and on national and regional policies and programmes. At least one third of
the local community is expected to participate, especially women since they are mainly responsible for
collecting water, cleaning, washing and cooking: activities which have high risks of contamination.
9.1.2
Technical training on operation, management and maintenance
The water committee is responsible for proper operation, management and maintenance of the sand
dam, which includes:
•
Regular monitoring of the functioning and utilization of the sand dam;
•
Establishing a demand driven payment scheme and;
•
Effective management of the water reservoir as far as possible.
Two persons from the water committee or two community members will be trained on construction of
the sand dam and wells by participating during construction. Technical knowledge and skills to
execute maintenance and repair works is hereby ensured. These trained community members can
become potential artisans for the construction of future sand dams within the area. They will become
the caretakers of the sand dam, wells and surrounding area.
Box 7: Management training
In the project management training workshop the first step involves the examination of the community
experiences in their projects for a previous five-years period, encompasses project undertaken, which were
successful, which have failed, what aided to success and what caused failure. At the end of this analysis, the
participants can draw lessons from past projects, understand the needs of the community and define
solutions by them selves. This training will take 4 days and are organised within the community.
9.2
Management of a sand dam
Since the water committee and care takers have been trained and have coordinated community
mobilization during implementation, the responsibility of the sand dam will be fully assigned to the
water committee and care takers after completion of the construction of the sand dam. The water
committee will be responsible for the management of the sand dam as well as the payment scheme
and the caretakers will be responsible for the daily monitoring, operation and maintenance of the sand
dam, wells and surrounding area. The water committee, with support and assistance of the concerned
local government departments and the implementing partner, will monitor all activities to ensure
sustainability of the project. This will be further discussed in chapter 7.
26
9.3
Maintenance
The approach on maintenance activities is based on the Kenyan experiences of SASOL. If a sand
dam is properly constructed, it only requires little or no major maintenance. Maintenance of a sand
dam can be assured if the following issues have been properly addressed during the project:
•
Good workmanship during the construction of the sand dam.
•
Full involvement of the community to ensure operation, management and maintenance once
construction of the sand dams has been completed.
•
Presence of a trained mason near to the sand dam project to ensure adequate repairs if there
should be any serious damage to the structure, which is beyond the capacity of the trained
caretakers.
•
Proper linkage between the local community, local administration and governmental sector to
ensure technical and advisory assistances for the community.
If these issues have been addressed as described in the previous paragraphs, maintenance can be
kept at a minimum. In attachment 9 some guidelines are described for small technical maintenance
issues.
27
References
•
Beekman, H. E., Xu, Yongxin (2003), Review of Groundwater Recharge Estimation in Arid and
Semi-Arid, Southern Africa, Environmental and University of the Western Cape, 16 p
•
Borst, L., Haas, S.A. (2006), Hydrology of Sand Storage Dams, A case study in the Kiindu
catchment, Kituï District, Kenya. Master thesis, Vrije Universiteit, Amsterdam
•
FAO (2005), New LocClim 1.06, Environment and Natural Resources Service (SDRN), Working
paper No. 20 (CDROM)
•
Gezahegne, W. (1986), Sub-surface dams for rural water supply in arid and semi-arid regions of
developing countries, Department of Civil Engineering, Tampere University of Technology;
•
Hellwig, D.H.R. (1973), Evaporation of water from sand, 4: The influence of the depth of the watertable and the particle size distribution of the sand, Journal of Hydrology, 18, 317 – 327 pp.
•
Louis Berger International Inc. (1983), Arid and Semi-Arid Lands Development Project, Kituï
District Water Resources Study, Executive Summary, Government of Republic of Kenya
•
Munyao, J.N., Munywoki, J.M., Kitema, M.I., Kithuku, D.N., Munguti, J.M., Mutiso, S. (2004), Kituï
Sand Dams: Construction and Operation, SASOL Foundation
•
Negassi, A., Bein, E., Ghebru, K., Tengnäs, B. (2002), Soil and water conservation manual for
Eritrea, Regional Land Management Unit (RELMA), Swedish International Development
Coorperation Agency (Sida);
•
Nissen-Petersen, E. (2006), Water from Dry Riverbeds, Danish International Development
Assistance (Danida);
•
Nissen-Petersen, E. (2006a), Water surveys and designs, Danish International Development
Assistance (Danida);
•
Subsurface Dams: a simple, safe and affordable technology for pastoralists, A manual on
Subsurface Dams construction based on an experience of Veterinairies Sans Frontieres In
Turkana Districst (Kenya), September 2006, VSF-Belgium
•
Community Management of Water Supply Services: the Changing Circumstances and Needs of
Institutional Support Situations and reflections based on Colombian experiences, M. G. Vargas,
IRC, June 2005
•
Hoogmoed, M. (2007). Analyses of impacts of a sand storage dam on groundwater flow and
storage. Vrije Universiteit, Amsterdam
•
Jansen J. (2007). The influence of sand dams on rainfall-runoff response and water availability in
the semi arid Kiindu catchment, Kituï District, Kenya. Vrije Universiteit, Amsterdam
•
Gijsbertsen C. (2007). A study to upscaling of the principle and sediment transport processes
behind sand storage dams, Kituï District, Kenya. Vrije Universiteit, Amsterdam.
•
Understanding the Hydrology of (Kituï) sand dams: Short mission report, November 2005. within
component 1 , Hydrological evaluation of Kituï sand dams, of ‘Recharge Techniques and Water
Conservation in East Africa; up scaling and dissemination of good practices with the Kituï sand
dams’.
•
[Hygiene Promotion, Thematic Overview Paper 1, 2005].
•
Subsurface Dams: a simple, safe and affordable technology for pastoralists, A manual on
Subsurface Dams construction based on an experience of Veterinairies Sans Frontieres In
Turkana Districst (Kenya), September 2006, VSF-Belgium).
•
Nzomo Munyao, J. Muinde Munywoki J., Ikuthu Kitema M., Ngui Kithuku D., Mutinda Munguti J.,
Mutiso S. (2004). Kituï sand dams: Construction and operation. Principles. Sasol Foundation,
Kenya.
28
Attachment 1: Check lists for first and detailed technical site selection
Criteria for first site selection:
A stony catchment area (source of sand) and sandy riverbeds
A sandy riverbed
Two high and strong riverbanks
A maximum width of 25 metre
No fractured rocks or large boulders
No salty rocks
Presence of water-indicating vegetation
Presence of waterhole
Presence of riverbed crossings
Type of community structures within in the area, possible conflicts etc.
Type, suitability and availability of construction material
compulsory
x
x
x
x
x
x
optional
x
x
x
x
x
Steps for detailed site selection:
Measuring the water extraction rate of potential riverbed(s) section(s)
Making a plan of the potential riverbed(s) section(s) with information on the river length
and width, locations of cross-sectional and longitudinal profiles, water-indicating trees
and waterholes
Making a longitudinal profile of the potential riverbed(s) section(s) by probing (see
attachment 2)
Making cross-sectional profiles of the potential riverbed(s) section(s) by probing (see
attachment 2)
Selecting different points in the riverbed section in which the sand is the deepest
(potential reservoirs) and in which the natural underground dykes are most shallow
(potential sand dams locations)
Selecting the point where the sand is the deepest and therefore the largest reservoir
can be selected
Selecting the point where the underground dyke is most shallow and therefore the
location of the sand dam
Making a cross-sectional profile of the potential sand dam location
compulsory
x
x
x
x
x
x
x
x
29
Attachment 2: Steps to be taken in community involvement during site selection.
Step 1: Creating awareness and sensitizing the community.
Starting a sand dam project in a catchment potentially suitable for implementation (Paragraph 4.1)
begins with sensitizing the community’s awareness on the project, by undertaking regular visits to the
project area and facilitating meetings with the representatives and members of community. All
communication shall be carried out with respect to the existing institutions, rules and habits of the
community.
Step 2: Community assessment and performing a water use assessment.
The best-suited sites identified during step 1 are visited and a dialogue with the community is held.
During this meeting, the project staff and community discuss the possible environmental and social
impact of the development of sand dam within the area. The following information needs to be
gathered.
•
Assessing the water problems of the targeted communities. During a plenary discussion
problems and possible solution should be discussed by the community. Ownership, number of
beneficiaries and their participation and involvement, timing of construction are discussed.
•
Organising meetings or group dialoguing concerning the development issues within the project
area. Project staff, community members including influential persons, local administrators,
politicians, elders (both men and women), youth leaders and any other development agencies
within the area should participate in these meetings.
•
Informing and educating the community members on the various types of water harvesting
technologies, in particular the sand dam technology. Advantages, disadvantages, feasibility, site
selection criteria, the construction process and the level of community participation will be
discussed.
•
Assessing possible sand dam locations with the community. The community will be involved in
site selection based on their local knowledge of the area (Paragraph 4.3.2). The selected sites
should be discussed with local authorities.
Step 3: Establishing a water committee.
The water committee will need to be established, and its responsibilities will need to be defined in a
binding document like a Memorandum of Understanding (MoU) between the water committee and the
implementing partner. Each sand dam will have a water committee containing a maximum of nine
members. At least 50 % of the committee members are selected from women representatives. Two
members from the committee selected as care taker and will be responsible for operation and
maintenance of the sand dam. Its duties are to mobilize resources, plan the site works, record
progress, supervise and monitor the implementation process amongst else. The committee must on
weekly basis monitor and evaluate the progress. On the part of the implementing partner, the MoU
states:
•
to supply all construction materials if not locally available;
•
to supply in skilled labour;
•
to provide technical supervision
Furthermore, the water committee and implementing partner will have to draw a Community Action
Plan (CAP), containing an implementation schedule until completion. This is documented in a tabular
format defining all the activities and responsibilities. It clearly defines the roles of each partner within
the project i.e. the community and implementing organization. <br>The action plan will contain the
following issues:
30
•
Bill of Quantities for the material and labour in which the community will supply during the
project.
•
A work plan in which a clear and realistic time frame is given.
•
Security of storage of materials and supervision on site.
On the part of the implementing partner, the MoU states:
•
to supply all construction materials if not locally available;
•
to supply in skilled labour;
•
to provide technical supervision
Step 4: Organising community mobilization for required participation works during the
construction process.
At the start of the construction process, the following activities are should be undertaken:
•
The actual movement of resources like transportation of equipment and tools to the site,
•
Involvement of skilled and unskilled labour. Elderly at the head of community committee are in
charge of mobilizing community members because of their respected position and accepted
authority in the community.
•
The implementing partner will provide a representative at the grassroots’ level; he/she will
coordinate all activities. He/she advises elderly on community mobilization and participation.
31
Attachment 3: Data collection for the selected river section
The tools required for simple surveys as follows (Nissen-Petersen, E. 2006):
•
Measuring rods made of 16 mm (5/8”) iron rods for measuring depths of sand. Notches should
be cut in the probing rods for every 25 cm to collect sand samples when the rods are pulled up.
•
A circular levelling tool made of a transparent hosepipe for measuring the gradients of riverbeds.
•
Two long tape measures, one hanging down vertically from the horizontal one, to measure width
and depth of riverbeds.
•
A tripod ladder for hammering long probing rods into the sand.
•
A mason hammer.
•
A 20 litres jerry can with water.
•
Half a dozen of transparent plastic bottles with water.
•
A knife and writing materials,
•
A Data Sheet as shown below.
Example of a Data Sheet:
Measurement
nr.
Distance
between
measurements
(m)
Width
of
riverbed
(m)
Depth
to water
(m from
surface)
Depth
of the
sand (m
from
surface)
Type of
sand
1
2
3
4
5
6
7
8
0
20
20
20
20
20
20
20
20.8
24.2
28.2
25.5
19.5
21.3
18.6
17
0.30
0.8
1.2
0.5
0.6
0.7
1.25
0.8
0.7
1
1.3
Medium
Fine
Medium
Medium
Coarse
Coarse
Medium
Coarse
Type of
bedrock
or soil
under
the
sand
Clay
Clay
Clay
Rock
Rock
Clay
Clay
Clay
Height of
the
riverbank
(m)
Left
1.5
1.0
1.4
1.3
1.4
1.4
1.97
1.3
Right
1.9
1.6
1.84
1.7
1.65
1.7
1.55
1.64
Items
seen
on
the
riverbanks
Acacia tree
Waterhole
Fig tree
Rock
32
Attachment 4: Questionnaire water use assessment
GENERAL
Date
Country
District
INTERVIEWER / NGO
GPS
Longitude
Village
GPS
Latitude
HOUSEHOLD (number of people living)
Girls (0 Boys (0Men
Women
15)
15)
(>15)
(>15)
Total
Main water
source
Distance (km)
Main water
source
Distance
(km)
Time one
way (hours)
Name
Interviewer
Time one way
(hours)
Use for
drinking?
NGO
drinking
cooking
shower
washing
livestock
Name
Total
Gender
Distance (km)
RAINY SEASON
Other water
Treament
source
method
Distance
(km)
agriculture
other
Age
Marital
status
Main
income
generating
activity
Other
income
generating
activity
PERSON(S) FETCHING WATER in HOUSEHOLD
Girls (0 Boys (0Men
Women
15)
15)
(>15)
(>15)
Total
DRY SEASON
Other water
Treatment
source
method
WATER USE DRY SEASON (average litres per person per day)
No. of
months
Name
employee
NGO
COMMUNITY
Boys (0Men
Women
15)
(>15)
(>15)
Girls (0 15)
Use for
drinking?
Email and
telephone
nr.
INTERVIEWEE
Time one
way (hours)
Use for
drinking?
Time one way
(hours)
Treatment
method
Use for
drinking?
Treatment
method
WATER USE RAINY SEASON (average litres per person per day)
Total
No. of
months
drinking
cooking
shower
washing
livestock
agriculture
other
Total
33
Attachment 5: Calculating the quantities of materials
I.
Concrete
Mix Ratio – 1 : a : b
Where: 1 = cement proportion : a = sand proportion : b = coarse aggregate proportion
If the amount of concrete needed is C, then:
Cement Quantity (kg)
= 1 * C * 1400 * 1.3 * 1.05/(1+a+b)
Sand Quantity (m3)
= a * C* 1.3 * 1.15/(1+a+b)
Gravel Quantity (m3)
= b * C * 1.3 * 1.15/(1+a+b)
II.
Stone Masonry
For water tight structures usually 65% of masonry body is proposed to be stone and 35% cement
mortar. So, if the volume of stone masonry work is S, then
3
Volume of Stone (m )
= 0.65 * S * 1.3
3
Volume of Mortar, M (m )
= 0.35 * S
If mix ratio of mortar is 1: C,
Cement Quantity (kg)
= 1 * M * 1400 * 1.2 * 1.05/(1+C)
Sand Quantity (m3)
= C * M * 1.2 * 1.15/(1+C)
III. Plastering
Follow the same formula used for mortar ingredients of stone masonry.
IV. Pointing
Pointing area is taken as 1/3 of plastering area and then follows the same way used for plastering.
V.
Water
Water required for mixing, curing, washing dirty construction faces, workers construction and food
preparation is roughly calculated from the total cement requirement of the site.
If Z Quintals of cement is required to complete the construction work,
Total volume of water
= 280 * Z
34
Attachment 6: Guideline for sand dam construction
Step 1: Placing reinforcements
These are placed vertically across the entire length of the dam at an interval of 2.5m. They are round
bars with a diameter of 12.5 mm and the length depending on the complete height of the dam. The
amount necessary can be determined as follows:
Ld
−1
No of columns = 2
With Ld : length of the dam in metres.
10
−1 = 4
For example: iIf Ld =10, Then No of columns = 2
Mark the positions of the columns along the building line, then measure the vertical depths to the
bottom of the trench and record them as follows.
No 1 =2.53m, No 2=2.27m, No 3 = 3.05m, No 4 = 1.97m
The round bars of the columns are firmly grouted into holes on 5cm deep that have been cut into the
foundation at the requested depth (depending on the bedrock material or soil type).
Step 2: Making the foundation blinding slab
A layer of cement mortar (1:3) is prepared on the foundation to the depth of 5cm. When there is no
foundation rock the vertical iron bars are placed in the mortar layer.
Step 3: Constructing the first horizontal reinforcement layer
After the mortar layer 12 strands of barbed wire are evenly divided over the building slab along the
dam.
Step 4: Constructing the second foundation blinding slab
The barbed wire is covered by 5cm of foundation blinding slab.
Step 5: Masonry comprising hardcore and mortar substructure
After the foundation blinding slab sets and holds the columns firmly, the foundation trench is filled with
masonry comprising clean hardcore and mortar (1:4). Mortar for filling should have more water. The
joints between the rocks are filled 25mm of this mortar. The rocks should be tapped well to settle
completely into all voids. When the filling reaches the level of the back flow, the construction of the
backflow should be done along side that of the wall as shown. Masonry comprising is extended to the
wind wells.
Step 6: Installation of templates above the sand level
The two templates made of timber are erected at the ends of the spillway for giving the outline of the
dam wall, spillway and wing wall. Nylon strings have to be drawn tightly from the inner corners of the
35
templates to pegs hammered into the soil next to the upper end of the wing walls. In this way, the
position of the outer sides of the masonry wall can be determined.
Step 7: Constructing Masonry hardcore and mortar substructure within two templates
Flat stones have to set in cement mortar 1:4 along the inner lines of the strings. The next day, the
space between the flat stones has to be filled with mortar, 1:4, into which round rubble stones were
compacted. After that the flat stones were mortared onto the wing walls so that they could be filled
with mortar and stones the following day.
Step 8: Preparation and construction of the stilling basin structure along with the dam body
The base of the dam wall, the spill-over apron and the spillway,(the latter being situated between the
two templates), were only raised to 30 cm above the original sand level in the riverbed. A small
flooding deposited a 20 cm layer of coarse sand that reached the first stage of the spillway. The
spillway was therefore raised another 100 cm above the sand level, for the next stage of the spillway.
The wing walls construction is executed at a time while extending each stage of the dam height
construction.
Step 9: Stilling basin construction with the stone pavement for flood protection at the bank of
the river
Large boulders were concreted into the spill-over apron, to reduce the velocity (speed) and speed of
surplus water falling over the spillway and wing walls. Stone pavement were placed as a unit part of
the stilling basin and extended at either side of the riverbank to down stream of the flood flow.
Step 10: Construction for the dam wall
The next flooding deposited coarse sand up to the level of the spillway. The spillway was raised
another 30 cm above the new sand level. The process of raising a spillway in stages of 30 cm height,
may be completed in one rainy season provided the required number flooding occurs and builders are
ready for their work without delay.
Step 11: Plastering and pointing works
Exposed dam section at the upstream side, top surface of the entire dam and wing wall section are
plastered with cement mortar of ration 1:3. The up stream section of the dam well plastered to be
watertight. Down stream-exposed section of the dam wall and the stone pavements extended from the
stilling basin were pointed with cement mortar mix ratio of 1:3.
36
Attachment 7: Guideline for well construction (based on Nissen-Petersen E, 2006)
Step 1: Excavation.
•
Select the site and clear the area for excavation
•
Mark out a circle of 1-metre radius.
•
Dig the well using skilled man power as the well should be excavated straight for the diameter of
2 metres.
•
Excavation of well continues until a depth at which sufficient water from the lowest water level of
the sand storage can be extracted. Well digging is normally carried out in the dry season when
the water table is lowest.
•
While the digging process is on going, local construction materials such as sand, stones and
preparation of crashed stone will be executed simultaneously.
Step 2: Construction of concrete ring and blocks.
Preparation of concrete ring. This ring will have an outside radius of 75 cm and inside radius of 55 cm.
The width of the ring is 20 cm and the thickness is 25 cm. The ring is made in a circular trench
carefully dug to the correct dimensions. A concrete of mix of cement, sand and crashed stone (1:3:4)
is used and six round of 3 mm galvanized wire are used to provide reinforcement of the ring.
Additionally, 16 vertical pieces of wire 60cm long are attached to the reinforcing for fixing rope when
lowering the ring in to the shaft. The ring is kept wet for seven days to cure the concrete.
The concrete blocks are made in specially fabricated mould with curved sides. The block is 15cm high,
10cm wide and 50 cm long. The concrete mix is the same as for the ring. The blocks are placed on a
plastic sheet and kept wet for seven days for curing.
Step 3: Construction of the well cover.
The well’s cover is made with a diameter of 150 cm and thickness of 10 cm; it has a hole of 60 cm in
diameter in the middle. This will be used for drawing water. An additional smaller hole, 10cm in
diameter, is made to one side as outlet hole to allow an exchange of fresh air. The cover is cast in an
excavation in the ground. The same concrete mix is used as before together with 8 rounds wire
connected by 31 shorter pieces of reinforcement.
The well lid to cover the centre hole is made in a similar manner with barbed wire reinforcement of 50
mm thickness. Two handles of round bars should be made for lifting.
Step 4: Construction of the well shaft.
The well ring is lowered using ropes if sufficient depth of the well has been reached.
The con is lowered using ropes with the help of at least 15 men because of the weight. The concrete
blocks are lowered one by one in a bucket. A cement and sand mortar mix (1-3) is used for the vertical
joints and between the ring and the first course.
In the horizontal joints between the first and second course and the second and third course, no
matter is used so that water can gain entry. One round 3-mm galvanized wire is used with mortar
between the third and fourth course and a step made from a round iron bar is installed. The same
sequence continues until there are six horizontal joints without mortar through which water can enter.
All subsequent joints are mortared. Steps are installed every three courses. After every six courses,
the surrounding space in the well shaft is filled with coarse sand to act as a filter.
The shaft is built till 60 cm above ground level to prevent surface runoff from entering the well. Barbed
wire is left sticking out to joint with the reinforcement in the apron that will be constructed around the
well shaft to keep the area clean and prevent contamination.
37
The apron extends around the well shaft and slopes outward to a distance of 1.2 metres. This area is
first excavated and then back-filled with hardcore to a depth of 30cm, to which is added a 5-cm layer
of ballast. A 5-cm layer of concrete (1:3:4, cement:sand:ballast) is laid on the surface, and barbed wire
is placed concentrically and radially for reinforcing. A further 5 cm of concrete covers the reinforcing.
The apron is surrounded by al low wall with a gap to allow spilt water to drain away. Building two steps
complete the work, each 30 cm high, to the well cover, plastering as necessary and placing the lid in
position.
Before the well can be used, the community must remove all the water and clean the bottom.
38
Attachment 8: Guideline for sand dam maintenance
Repairing cracks and weak points in the dam
Sand dams require careful maintenance, and immediate repair, as flooding causes hundreds of tons of
water to fall over the dam wall and onto the spill-over apron. Flood water may also spill over and erode the
wing walls and, perhaps, even over the riverbanks during heavy rains. Extreme changes in temperature
can cause the structure crack. If any cracks or weak points are observed in the sand dam, a technical
engineer and mason should inspect the whole dam structure and execute repair works before the following
rainy season.
Cleaning the well
The well should be covered and closed at all times. Regular checking of the water content is not
recommended, since debris or human faeces could fall in the well and contaminate the water. If an animal,
chemicals or other health-risk related substances have polluted the well, using the water for drinking
purposes is strictly prohibited. The well should be inspected by an expert on water quality and a action plan
should be made. If contamination is suspected which can be removed by simple and local water quality
measures, then these should always be applied before use of the water.
Cleaning of the outlet
It is very important that the outlet isn’t blocked with silt of other fine textured material. It is therefore
important to have a good access to the outlet construction. Blocking of the outlet can be prevented by the
designing criteria as mentioned in paragraph 3.2.3. Regular cleaning of the riverbed just upstream of the
sand dam after a flood can prevent silt from percolating downwards into the riverbed and blocking the
outlet. If contamination of the water is suspected which can be removed by simple and local water quality
measures, then these should always be applied before use of the water.
Removing silt from the top of riverbed of the reservoir
The riverbed (especially just upstream of the sand dam) and the surrounding area of a sand dam have to
be kept as clean as possible: rocks, branches, leaves, dead animals, animal dropping and fine textured
material should be removed since they can lead to contamination of the water, reduce the capacity of the
dam, lead to blocking of the reservoir and outlet or cause damage to the dam structure. Debris like rocks,
branches, leaves and sediment are usually deposited after a flood event, so the time of inspecting is well
known. But dead animals, animal dropping and other debris can be deposited any time. It is wise to have a
strict schedule for inspection of the dam and its surroundings.
39


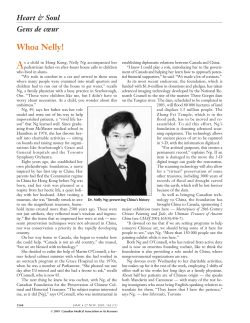


© Copyright 2026