
International Journal of Behavioral Development
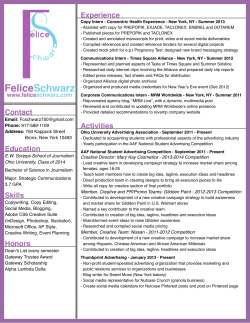
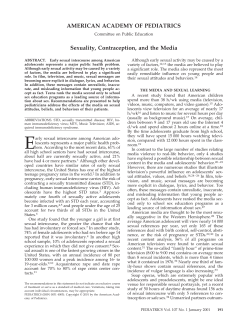
International Journal of Behavioral Development http://jbd.sagepub.com Dear Santa: The effects of television advertising on young children Karen J. Pine and Avril Nash International Journal of Behavioral Development 2002; 26; 529 DOI: 10.1080/01650250143000481 The online version of this article can be found at: http://jbd.sagepub.com/cgi/content/abstract/26/6/529 Published by: http://www.sagepublications.com On behalf of: International Society for the Study of Behavioral Development Additional services and information for International Journal of Behavioral Development can be found at: Email Alerts: http://jbd.sagepub.com/cgi/alerts Subscriptions: http://jbd.sagepub.com/subscriptions Reprints: http://www.sagepub.com/journalsReprints.nav Permissions: http://www.sagepub.co.uk/journalsPermissions.nav Citations http://jbd.sagepub.com/cgi/content/refs/26/6/529 Downloaded from http://jbd.sagepub.com at SAGE Publications on November 12, 2009 International Journal of Behavioral Development 2002, 26 (6), 529–539 # 2002 T he International Society for the Study of Behavioural Development http://www.tandf.co.uk/journals/pp/01650254.html DOI: 10.1080/01650250143000481 Dear Santa: The effects of television advertising on young children* Karen J. Pine and Avril Nash University of Hertfordshire, Hateld, UK Every day children are exposed to the selling messages of advertisers via the television. T here is some debate in the literature over the age at which young children can distinguish television advertisements from programmes, when they can remember and want what they see and when they are able to understand that the advertiser’s motive is to sell a product. Resolution of the debate has been hampered by methodological difculties and paradigms which fail to fully capture and explain children’s responses to advertisements. T his study uses a novel and ecologically valid method of exploring how toy advertising affects children by studying their requests to Father Christmas, monitoring toy commercials and collecting television viewing data. Eighty-three children aged from 4.8 to 6.5 years, who had written letters to Father Christmas, were interviewed regarding the extent and nature of their television viewing. Letters and similar data were also analysed for 16 nursery school children, aged 3.8 to 4.8 years, using questionnaire responses from their parents. Overall, children who watched more commercial television were found to request a greater number of items from Father Christmas. These children also requested more branded items than children who watched less. However, the children’s requests did not correlate signicantly with the most frequently advertised toy products on television in the build-up to Christmas. Almost 90% of the toys advertised did not feature once in the children’s letters, suggesting that recall for specic brand names is poor in the under-7s. A positive correlation was found between watching television alone and number of requests. One interpretation of this may be that lone viewing renders children more susceptible to advertising. A comparison group of children from Sweden, where advertising to children is not permitted, asked for signicantly fewer items. It is argued that English children who watch more TV, and especially those who watch alone, may be socialised to become consumers from a very early age. Introduction T elevision is a major part of children’s lives in the Western world today. In the UK children spend an average of 2½ hours each day watching TV and 63% have their own TV set (Livingston & Bovill, 1999). T hree of the ve terrestrial channels carry advertising and, within certain limits, advertisements can be aimed directly at children. What effect is increasing exposure to television advertising having upon children in the UK today? This paper is concerned particularly with younger children, below the age of 7 years, and aims to explore how receptive they are to the commercial messages of toy advertisers It has been argued that, due to their limited memory capacity, young children may not recall advertisements and therefore will be relatively immune to advertisers’ messages (Macklin, 1994). Others claim that having a lack of cognitive mechanisms to defend themselves actually renders children more susceptible to persuasive messages. Furthermore, there is a question mark over whether very young children can distinguish advertisements from programmes. Levin, Petros, and Petrella (1982) found that children as young as 3 years were able to make the distinction but had no understanding of the selling motives of advertisers. Levin et al. say that it is not until 8 years of age that children begin to understand the selling purpose of an advertisement. Prior to this children regard advertisements as simply announcement s designed to help, entertain, or inform viewers. In making the decision not to allow advertising aimed at children, the Swedish government relied on evidence from sociologist Erling Bjurstrom that it is not until 12 years of age that all children can distinguish advertisements and understand the selling motives of the advertiser. Being able to recognise that advertisements differ from programmes appears to emerge early on in development , whereas the kind of healthy scepticism needed to resist commercial pressure requires far more sophisticated levels of understanding. The cognitive skills that children lack, i.e., understanding of persuasive intent, consumer literacy, and perception of realism, are discussed further here. Understanding of persuasive intent Young children do not realise that a message can portray only positive information, whilst withholding negative information, in order to manipulate another’s mental state (Aloise-Young, Correspondence should be addressed to Karen J. Pine, Psychology UK and the Head Start Nursery School, Leighton Buzzard, UK for Department, University of Hertfordshire, College Lane, Hateld, their kind assistance and cooperation during the carrying out of this Herts. AL10 9AB, UK; e-mail: k.j.pine@ herts.ac.uk. research. Thanks also are due to Lillian Hedman, the staff and children T he authors would like to thank the staff and pupils at Green Lanes at the preschool, ‘‘Capella’’, in Nacka, Sweden and to Geoff Jensen Primary, New Briars Primary, and UnderhillDownloaded Infants’ from School Hateld, and Josene Magnusson for translation assistance. http://jbd.sagepub.com at SAGE Publications on November 12, 2009 530 PINE AND NASH / THE EFFECT S OF TELEVISION ADVERTISING 1993 ; Bennett & Yeeles, 1990). For example, in the AloiseYoung study, children were asked to present a description of themselves in order to get picked for a ctitious team. Younger children included negative as well as positive information, whereas older children were better at self-promotion and included only positive descriptions. Eight-year-olds’ ability to selectively self-promote suggests that this is the age when children are also able to appreciate that advertisers try to inuence us with persuasive messages. A lack of this awareness in younger children, resulting in higher trust in the advertiser, renders them more vulnerable to selling messages. Allied to this is the authoritative status of television messages for young children, who believe that adults do not lie, and the younger the child is, the more likely they are to believe that advertisements always tell the truth (Greenberg, Fazal, & Wober, 1986). In a review of the literature, Dorr (1986) found that it is between 7 and 9 years of age that children understand the persuasive intent of television advertising. is exactly as it appears and will fail to realise that the advertisement was created to promote it in the best possible way. After the age of 4 years children develop the cognitive skills, including a theory of mind, which helps them to distinguish reality from fantasy. T hus a number of strategies and cognitive abilities need to be in place before the child is fully aware of the selling motives of the advertiser. Evidence from psychological studies suggests that these abilities emerge at different points in developmen t and that full understanding of advertisers’ motives is likely to be a process that takes a number of years. Parents have a role to play in this. By watching television with their children they can help them to understand advertisers’ motives and the difference between appearances and reality, thus neutralising some of the powerful messages their children are exposed to. T here is little reliable data available on co-viewing although it has been found that children who watch more commercial television had parents who were less concerned about the negative effects of watching television and perceived less need Consumer literacy to control their child’s viewing (Gunter & McAleer, 1997). Nonetheless, children’s lack of awareness about the motives Young children have a limited understanding of commercial markets, and are unaware that advertisements are motivated of television advertisers does not prevent the commercial messages inuencing their preferences and, as suggested, may out of a desire for prots. Somewhat surprisingly, Greenberg et render the child more susceptible. For the advertiser, a al. (1986) claimed to have found that 80% of 4- to 13-year-old children knew that advertisements ‘‘wanted to sell you somesuccessful advertisement is one that is memorable since there is usually a delay between seeing an advertisement and thing’’, with no variation by age. In a study by Gaines and Esserman (1981), however, only 1% of 4- to 5-year-olds remembering to buy, or request, the product. Children’s realised that the goal of an advertisement was ‘‘to try and make memory for advertisements is a very complex issue and one that has been investigated using a variety of methodologies . you buy things’’, rising to 28% in 6- to 8-year-olds. Clearly, the type of question asked in these studies elicited different results T hese include diary methods (Greenberg et al., 1986), surveys but when Ward, Wackman, and Wartella (1977) asked 11- to that rely on free recall and ask about requests to parents (Robertson & Rossiter, 1976), and experimental studies that 12-year-olds to explain the selling and prot motives of advertisers only 25% were able to do so, suggesting that real test children’s recognition of advertised products (C.E. Hite & consumer literacy emerges in early adolescence. Younger Hite, 1994 ; Macklin, 1994 ; Sharp, Dyer, & Divita, 1976). Discrepancies in the results of studies into the age at which children, who do not know that selling implies an exchange of money for goods (and an opportunity for prot), are unlikely children can remember television advertisements may be due to recognise advertisers’ motives (Henricksen, 1996). T hereto the limitations of each of these methodologies. Surveys suffer from lack of verication of the information gained and fore, it is probably around age 13 or 14 that young people the fact that children are often over-concerned with giving the understand consumer markets and acquire a healthy scepticism towards the truthfulness of product claims (Linn, De ‘‘right’’ answers. Younger children are also likely to be unable to recall brand names which, nonetheless, may still have left a Benedictis, & Delucchi, 1982; Robertson & Rossiter, 1976). memory trace. Studies that test recognition of products get around this problem, usually by employing a forced-choice Perception of realism test, but these have usually been conducted in laboratory settings and suffer from a lack of ecological validity. Both types In television commercials techniques are frequently employed of studies fail to successfully emulate the time lapse that can to enhance the appearance of a product. Adults know that the occur between exposure to an advertisement and its recall, or sparkle on the newly cleaned oor in the T V commercial is to recreate the type of context in which children typically unlikely to be matched in reality. But before the age of 4 or 5 express a product preference. years children are more heavily affected by product factors and T he current study looks at the impact toy advertising, in the do not understand that appearances can differ from reality. run-up to Christmas, has upon children below the age of Two- and three-year-olds, in fact, believe that images on TV 7 years. As the literature has shown, this is the age group that is screens reect real objects inside the set (Flavell, Flavell, Gree, likely to have higher trust, lower recall, and lower under& Korfmacher, 1990 ; Huston & Wright, 1998). In Flavell’s standing of commercial messages than older children. This study he found that these young children believed a bowl of would lead us to expec t these children to have a high popcorn would spill if the set was turned upside down. And vulnerability to advertising, although perhaps with a low recall when Jaglom and Gardner (1981) showed 2- and 3-year-olds of brand names. The study also employs a novel method, an egg breaking on television, the children tried to clear it up. which overcomes many of the methodological limitations of This reality perception is important because television that is earlier research by looking at a behaviour that many children perceived as real has a greater impact on children than if it is engage in spontaneously: asking for toys in a letter to Father judged unreal (Berry & Keiko Asamen, 1993). Without an Christmas. T hus it overcomes the lack of ecological validity awareness of production techniques and the representational from which laboratory experiments suffer, since many children nature of television, young children willDownloaded believefrom that a product http://jbd.sagepub.com at SAGE Publications on November 12, 2009 INTERNATIONAL JOURNAL OF BEHAVIORAL DEVELOPMENT , 2002, 26 (6), 529–539 in the UK write a letter to Santa each year. Furthermore, it is less subject to the failings of survey methods, where misunderstandings about questions can produce inaccurate data. By collecting children’s letters at the beginning of December, when toy advertising has been intensifying for a number of weeks, the study also makes use of the real time frame between exposure to the advertisements and the making of requests. It also goes beyond measuring which advertised products children recognise or recall and tells us what they actually want. Finally, it is not complicated by the nancial status of the children’s parents. Children from poorer families may have been socialised not to ask their parents for expensive toys, yet may feel these constraints do not apply to their requests to Santa. By looking at the under-7s’ requests in their letters to Santa, and also obtaining a measure of their television viewing habits, this study therefore aims to discover whether there is a relationship between young children’s exposure to commercial television and requests for advertised products. The data on viewing habits also reveal whether children watch alone or with a parent and whether this is related to the requests made by the children. By comparing letters written by children in the UK with those written by Swedish children it also asks whether children raised in a country where there is a ban on toy advertising ask for less. Method Design 531 and the branded products requested and (6) there would be signicant differences between the amount of branded products requested by the UK children and the Swedish children. Participants A total of 118 children took part in the study. The UK sample were recruited from a nursery school in Bedfordshire, the Reception and Year 1 classes of two primary schools in Hertfordshire, and an infants’ school in the London Borough of Barnet. T he overall mean age of the children was 5;5 years (SD ˆ 8.59 months) and the sample comprised 45 boys and 54 girls. The UK sample was composed as follows: Nursery children: n ˆ 16. Ages 3;8 to 4;8 years. Mean age 4;2 years (SD ˆ 3.7 mths) School children n ˆ 83. Ages 4;8 to 6;5 years. Mean age 5;8 years (SD ˆ 5.6 mths) For the purposes of this study they were then subdivided further into age groups as follows: Group 1: 3;8 to 4;8 years (n ˆ 16; mean age 4;2 years, SD ˆ 3.72 mths) Group 2: 4;8 to 5;6 years (n ˆ 41; mean age 5;3 years, SD ˆ 2.84 mths) Group 3: 5;7 to 6;5 years (n ˆ 42; mean age 6;2 years, SD ˆ 2.98 mths). Group 1 represents the nursery school group. As the television scores for these children were derived from parental report this group is considered separately for some of the analyses. The other two groups are representative of Reception and Year 1 classes. T he overlap in age groups between Groups 1 and 2 occurs because there was one child aged 56 months at school. Head teachers and parents consented to the children participating in the study. The nal gure of 118 takes into account 9 parental withdrawals for religious (7), educational (1), or other (1) reasons, and 2 instances where children declined to take part. T he sample size was chosen as a result of a priori power calculations using G Power (Faul & Erdfelder, 1992). Based on the ITC report, which suggests a strong effect of advertising, an effect size of r ˆ .5 was used. With alpha ˆ .05 and power ˆ .95, a sample of 34 participants is recommended for a onetailed correlation. T he Swedish sample, Group 4, comprised 19 kindergarten children (9 girls and 10 boys). They were all 6 years old. Letters were obtained after contacting a preschool in Nacka, Sweden but no interviews were conducted. A correlational design was used to examine the relationship between the amount of television watched, and in particular commercial television, and the proportion of branded products requested by children in their letters to Father Christmas. T he two principal variables were a television score (calculated from responses to a questionnaire) and the proportion of branded products. Branded or brand name products referred to in this report are those which are marketed under a proprietary trade mark or registered name, e.g., Barbie, as opposed to a generic term, e.g., doll. T he overall relationship was examined, as were relationships using classifying variables of age, access to cable or satellite television, and whether or not the child watched television with an adult. Another correlational analysis considered the relationship between children’s requests and products advertised on children’s television (ITV) during the 6-week period prior to the children writing their letters. A between-groups design was used to compare the proportion of branded items requested by the UK children with that of kindergarten children in Sweden, where toy advertising aimed at children is banned. It was predicted that (1) there would be a signicant Materials relationship between the television score and the proportion of branded products requested by the UK children in their letters The letters to Father Christmas were written on paper to Father Christmas, i.e., that a higher television score would provided by each individual school and this varied from school indicate a higher proportion of branded products requested. It to school: in some it was printed with a seasonal decoration, in was also predicted that the relationship between the two others it was decorated by the children themselves, and one variables would be inuenced by (2) the children’s age, (3) school provided areas on the paper for the children to both regular access to satellite or cable television, and (4) watching write and draw their requests. T he Swedish children all drew with an adult. It was further predicted that (5) there would be a their requests, which were then labelled. Either the original relationship between the frequency of television advertisements letter or a photocopy was used for analysis. Downloaded from http://jbd.sagepub.com at SAGE Publications on November 12, 2009 532 PINE AND NASH / THE EFFECT S OF TELEVISION ADVERTISING The questionnaire used for the structured interview with Groups 1, 2, and 3 was constructed to provide information about the children’s viewing habits in order to establish a TV score for each child and to gather information. 7. Do you watch TV on your own or with a grown up, someone like mum or dad? T his question established whether the child watched alone or with a parent, as previous research has suggested this affects how children process television’s messages. CONST RUC TION OF T HE QUEST IONNAIRE 1. Do you watch children’s television? This acted as an introductory question to the rest of the interview. 2. How often do you watch? Do you watch children’s television when you go home after school? Is that: Every day / A lot of days / Just some days? What about before you come to school in the morning (when you get up)? Is that: Every day / A lot of days / Or just sometimes? Do you watch on a Saturday morning? Yes / Sometimes / No On a Sunday morning? Yes / Sometimes / No Question 2 was designed to reect how much children’s television the child watched after school, before school, and at weekends . Television programmes in the UK aimed at children on IT V (CITV) cover a period of 1.75 hours each weekday (15.15–17.00 hours), 3.5 hours on a Saturday (08.00–11.30) and 1.5 hours on a Sunday (08.00–09.30). Responses to the various sections of questions were scored to reect these hours proportionately. 3. Do you have a favourite programme, something you like watching best? This was designed as an interest question to stimulate the children’s thoughts about television programmes that they watch. 4. Do you ever watch: The Forgotten Toys / Sooty / Kipper / Art Attack / Sabrina / Diggit / SM:TV Live? In order to examine how much commercial television the children watched, IT V (or CITV as the children’s programming is termed), was chosen as being the channel most accessible to all UK children. The programmes given as examples in this question were from this channel and were selected as being representative examples of children’s television viewing in the afternoon, after school, or at the weekend. The programmes selected were considered suitable for a range of age groups (e.g., The Mopatops Shop for younger children and Sabrina, the Teenage Witch for older children). 5. Do you know what adverts are? Can you tell me about them? 6. Do you watch the adverts? OR Do you ever see Barbie (or Action Man) on the telly, do you watch them when they’re on? 8. Think about the televisions there are in your house, can you tell me how many there are? Question 8 was designed to discover whether the children had access to more than one television, thus increasing their overall access to commercial television. 9. Do you ever watch any of the satellite or cable TV channels (e.g., Nickelodeon, Disney Channel, Cartoon Network)? Is that at home? Question 9 sought to discover whether the child had regular increased access to commercial television in the form of satellite or cable broadcasting. 10. Do you do any after-school activities regularly (every week)? For example, swimming, dance, clubs, gym, football, etc.? How often / many days in the week? Finally, question 10 sought to establish whether regular extracurricular activities curtailed viewing and the score for this item was designed to be subtracted from the sum of scores from questions 2 and 4 to give a nal ‘‘T V score’’. T he children’s interview questionnaire was also distributed, in a modied form, to the parents of the nursery children. Besides amending the wording of the questions in order to ask the parent about the child, since the children were considered too young to self-report, question 5 was modied to ascertain whether the parent thought that the child made some distinction between advertisements and programmes. A further question was added to establish how often the child attended nursery (i.e., number of morning or afternoon sessions) as this would affect the amount of exposure to children’s television, since television was not watched at nursery. As with the extracurricular activities, the number of afternoon nursery sessions was designed to be deducted from the sum of questions 2 and 4. As the questionnaire was designed to elicit information rather than attitude, no response order bias was deemed necessary. Photocopies of the letters written by Swedish children were also used for analysis. Translations were carried out by a Swedish person studying in England and an English person residing in Sweden. T he interviews with the children were recorded using an Olympus S711 Micro cassette recorder. Television programmes and advertisements were recorded using a Panasonic NV HD640 video recorder. Questions 5 and 6 looked at whether the child knew what an advertisement was and whether she or he paid attention to Procedure them. Following a pilot study, Question 6 was modied (from ‘‘Do you watch them?’’) in order to allow for a negative response Video recordings were made of a selection of children’s T V to Question 5. T hus, if a child responded ‘‘no’’ to question 5, viewing between 23.10.99 and 28.11.99. T his comprised six then question 6 would be phrased, ‘‘Do you ever see Barbie or Saturdays from 8.00 am to 11.30 am, ve Sundays from 8.00 am to 9.30 am, and two weekdays per week, chosen Action Man on the telly, do you watch them when they’re on?’’, as these products are only seen in advertisements. at random, from 3.15 to 5.00 pm (Tuesday n ˆ 3; Wednesday Downloaded from http://jbd.sagepub.com at SAGE Publications on November 12, 2009 INTERNATIONAL JOURNAL OF BEHAVIORAL DEVELOPMENT , 2002, 26 (6), 529–539 n ˆ 2; T hursday n ˆ 3; Friday n ˆ 3), giving a total of nearly 50 hours of children’s commercial television. In order to keep the study as naturalistic as possible, and thereby maintain external validity, the teachers at the schools and nursery were asked to proceed as they would normally do in asking the children to write their letters to Father Christmas. It was agreed that this would occur at some point convenient to the teachers in the week beginning 29th November. No experimenter was present. Children were assisted by the teachers, where necessary, with spelling and writing. In the case of the nursery the children were asked to dictate their letter to a nursery teacher or nursery nurse who wrote it out in highlighter so that the child could write over it. The original letters or photocopies of these were used for the study. See Figure 1 for an example of children’s letters. All interviews were conducted during the rst 3 weeks of December after the children had written their letters to Father Christmas. T he interviews were preceded by a brief explanation and time to settle the child, then each interview followed the questionnaire closely. At the end of the interview each child was thanked for his or her assistance. The children in Sweden were asked by their teachers to send a letter to Father Christmas with their Christmas requests. Photocopies of these were used for the study. 533 Results The results of the study are divided into four parts. T he rst section considers an analysis of the questionnaire data and the second examines the relationship between television viewing and the proportion of branded products requested by children in their letters to Father Christmas. The third section then looks at the relationship between those branded items requested and those advertised on television and, nally, the fourth section compares requests made by UK school children with those made by a contrast group of Swedish nursery children. Analysis of questionnaire data In this section it is important to note that the source of the questionnaire data for one of the three groups, i.e. the nursery group, is parental report, whereas the source for the other two groups is self-report. Therefore the analysis of this data will be carried out in two parts, commencing with the self-reported school children’s data. The information will then be combined to give overall means and any differences that arise as a result of these alternative sources will be examined. In general, even where the distribution has not been normal, parametric inferential tests have been carried out on the data. However, due to the very varied, non-normal distribution of the parental report, or nursery children’s, data nonparametric tests have been used for inferential statistics in that instance. T elevision scores were calculated by summing the scores for responses to questions number 2 (three parts) and 4: T his indicated how much television and, in particular, how much commercial television, the children watched. From this gure was deducted the number of days of after-school activities and, in the case of the nursery children, the number of afternoon sessions attended, since these would prevent the child from watching afternoon children’s television. The result was an individual television score for each child. Construct validity was evaluated by correlating the response scores with the total TV score. Positive, reliable Pearson correlations were found for questions 2 and 4, a total of four response scores (Q1a: r ˆ .615; Q1b: r ˆ .333; Q1c: r ˆ .760; Q2: r ˆ .640; in all cases, n ˆ 99, p 5 .05). Question number 8, concerning the number of televisions per household, was discarded after internal consistency checks failed to produce a reliable correlation (p 4 .05). SCHOOL CHILDREN (SELF-REPORT DAT A) Amount of TV viewing. TV scores for this sample produced a negatively skewed distribution with no outliers. The mean TV score (n ˆ 83) was 9.68 (SD ˆ 3.709); scores ranged from a minimum of 0 to a maximum of 15. T he mean television scores were analysed by gender and by age. A two-tailed between-groups ANOVA found no reliable main effects on TV score for either age or gender (p 4 .05). However, there was a two-way interaction between age and gender. As Figure 2 shows, younger girls (55–66 months) had signicantly higher TV scores than boys of the same age but the situation was reversed for the older children (67–77 months). This interaction was conrmed as reliably different in a two-way ANOVA, Figure 1. An example of a letter written by the children to Father Christmas. 81) ˆ 4.082, ˆ .047. F(1, Downloaded from http://jbd.sagepub.com at SAGE Publications on November 12,p2009 534 PINE AND NASH / THE EFFECT S OF TELEVISION ADVERTISING Figure 2. Mean scores on the TV Viewing questionnaire, for male and female school children across ages. Knowledge about advertisements. T he question ‘‘Do you know what an advert, or advertisement, is?’’ produced 56 negative responses and 27 positive responses from the sample of 83 school children. However, of those who said that they did know what an advertisement was only 16 were able to dene it in such a way that it was clear that they knew the difference between an advertisement and a programme. The other 11 were unable to explain that an advertisement was different or offer an example of one. Equally, of the 56 who said that they did not know what an advertisement was, further probing in relation to question 6 found that 11 of these children were able to offer an explanation which showed that they were able to make the distinction. Some of the children also mentioned the selling aspect of the advertisement. Missing data (10 missing values in total) in response to question 6 arose as a result of the original wording of the question, which was corrected after piloting. Of the 73 children who did respond, 55 (66.3% of the total sample) appeared to watch advertisements and 18 (21.7%) responded that they either did not watch advertisements, or more specically, Barbie or Action Man advertisements. Lone viewing and access to satellite/cable television. Of the sample (n ˆ 83), children (21.7%) regularly watched television with an adult (parent), 31 (37.3%) sometimes watched with an adult, and 34 (41%) watched either on their own or with a sibling. Fifty-two children (62.7%) had home access to satellite or cable television channels. NURSERY SCHOOL DAT A (PARENT AL REPORT ) Figure 3. Mean TV scores for nursery children (parental report data) and schoolchildren (self-report data). of the school children and nursery school children, shown in Figure 3, was found to be signicant in a Mann Whitney U test (U ˆ 257, p .01). This suggests that the nursery school children watched signicantly less T V than the school children. However, it may be due to the sources of the data, with parental report data resulting in a far lower mean TV score than the self-report data. Knowledge about advertisements. In response to the questions about understanding and watching advertisements, nine parents considered that their child did understand that advertisements were different to programmes whereas six parents were uncertain of their child’s knowledge. Only one parent felt that their child could not make the distinction between programmes and advertisements. Lone viewing and access to satellite/cable television. According to the parental reports, 7 (44%) of the nursery school children regularly watched television with an adult and 9 (56%) sometimes watched with an adult. According to their parents, none of the children in the nursery group watched television regularly without an adult. Of the sample (n ˆ 16), 9 (56.3%) had regular/home access to satellite or cable television channels. T his suggests that the nursery school children were less likely to watch alone than the school children, although the source of the data (parent vs. self) report may account for some of this difference. T he difference is conrmed as signicant in a Pearson chi-square, w2 (n ˆ 99) ˆ 10.33, p ˆ 5 .01. T he implications on reliability will be explored in the discussion section. Amount of TV viewing. TV scores for the nursery children appeared to be not normally distributed and this was conrmed in a Shapiro Wilks Test for normality (W ˆ .849, p ˆ .013). T he mean TV score for this sample (n ˆ 16) was 5.375 (SD ˆ 3.6674 ) and the mode was 8. T V scores ranged DATA FROM NURSERY AND SCHOOL CHILDREN (COMBINED) from a minimum of 3 to a maximum of 9. T he mean television scores were analysed by gender using a two-tailed Mann TV viewing data. When data from both sources was Whitney U test and no reliable main effects of gender were combined (n ˆ 99) this produced a negatively skewed found for TV score (p 4 .05). distribution with two outliers (values: ¡1, ¡3). As the primary A comparison of the difference in mean TV viewing scores purpose of the study was to examine relationships rather than Downloaded from http://jbd.sagepub.com at SAGE Publications on November 12, 2009 INTERNATIONAL JOURNAL OF BEHAVIORAL DEVELOPMENT , 2002, 26 (6), 529–539 compare means, these outliers were retained in the data set. T he overall mean TV score was 8.99 (SD ˆ 4.014). Viewing data related to access to satellite/cable TV. Overall mean T V scores for those without home access to cable or satellite television (n ˆ 38) was 7.658 (SD ˆ 4.320) and for those with cable or satellite television (n ˆ 61) the mean T V score was 9.819 (SD ˆ 3.603). In a two-tailed independen t groups t-test, this difference was found to be signicant, t(97) ˆ ¡2.687, p ˆ 5.01. As might be expected, given the extra choice of programmes afforded by nonterrestrial TV, those with access to satellite/cable TV had signicantly higher T V viewing scores than those without. Letters to Father Christmas and correlation with TV scores 535 products requested, r(97) ˆ .054, p 4 .05. Thus, a higher TV score did not increase the proportion of branded products requested. Although one aim of the study was to examine the number of branded products requested in the context of overall requests, this places a range restriction on one of the variables, by making it proportional. Consequently this may have an overall effect of lowering the correlation. To examine whether this may be the case, another correlation was carried out examining the relationship between the T V score and the number of branded products requested. In this situation, the result of a Pearson one-tailed correlation was both positive and approached signicance, r(99) ˆ .191, p ˆ .058. Furthermore, a reliable and positive correlation was found between the children’s T V scores and the total number of items, both branded and nonbranded, requested in their letters, r(99) ˆ .248, p ˆ 5.05. As the amount of commercial television viewing increased, so did the number of requests. T hree further correlations were carried out. The rst considered whether there was an inuence of age on TV scores and the proportion of branded products. The second correlation examined whether access to cable or satellite television inuenced Christmas requests. Neither of these was found to be signicant. T he third correlation was concerned with whether watching television with or without an adult present had an effect. For this analysis, data from ‘‘sometimes with adult’’ was discarded as being ambiguous and only those responses which indicated that the child watched ‘‘mostly alone’’, or ‘‘mostly with an adult’’, were considered. There was a positive and reliable correlation between watching television alone and the proportion of branded products requested, Pearson correlation coefcient r(2-tailed) ˆ .364, p .05. The correlation between watching television with an adult and the proportion of branded products requested was not signicant, Pearson correlation coefcient r(2-tailed) ˆ ¡.177, p .05. Thus lone viewing was related to higher requests for branded products. Requests by the children in their letters to Father Christmas were initially categorised as either nonbranded/other goods and branded items, to enable a comparison between the amount of television watched and the amount of branded items requested. Items in the nonbranded/other group comprised a wide variety of items including such things as sweets, felt-tip pens, paints, dolls, teddy bears, and computers. Various pets were also popular, ranging from hamsters to horses. A total of 307 items were requested by the sample (n ˆ 99) and of these 126 were branded items, i.e., 41%. T he mean number of items requested per child, both branded and nonbranded , was 3.10 (SD ˆ 2.234), and the mean number of branded items per child was 1.273 (SD ˆ 1.185). An indication of the restrictions imposed by the children’s underdeveloped writing skills on the number of requests made is clear when a comparison is made with the situation where the children at one of the UK schools were allowed to draw their requests (N ˆ 34): in this situation the number of items requested, branded and nonbranded , ranged from 2 to 6, with a mean number of total requests of 5.47 (SD ˆ 2.24). Almost three quarters (73%) of the school and nursery children (n ˆ 99) made a request for one or more branded products. Of these children, the maximum number of branded Analysis of brand name items requested and television products requested was 5 (by three children) and the mode was advertisements 1. The difference in means for both total requests and branded requests was not found to be signicantly different by gender in Branded items were categorised under their category brand two separate independen t groups t-tests, p 4 .05. name so, for example, a Barbie doll and a Barbie caravan Examination of the data from the letters to Father would come under the category ‘‘Barbie’’. Figure 4 shows a pie Christmas highlighted an effect in this study, which occurred graph of all the requests made by the sample (n ˆ 99). as a result of the restricted writing and spelling ability of the Further analysis of the branded products revealed that 27 children involved. Fifty-seven (57.6%) of the total UK sample requests were for media-licensed or character merchandise requested only one item and this occurred not necessarily products and another 20 requests were for electronic games or because of a desire for only one item but simply because the games machines. T hese, together with the top three requested children’s writing and spelling abilities were insufciently items (Barbie, Furbies, and Action Man), accounted for 92% developed , and time constraints on teachers did not allow for of the branded products. In the nonbranded products, two them to assist with spellings of more than one item. Since generic terms accounted for 6.5% of the total number of children differed in the total number of requests made, the requests (307): remote control car (8 requests) and baby doll proportion of branded products requested was calculated by (12 requests). No brand names were used for either of these dividing the number of requested branded items by the total products. number of requests per letter. This resulted in a trimodal Over the period of nearly 50 hours, a total of 1388 distribution. T he relationship between television score (T V advertisements appeared. The maximum number of advertisescore) and the proportion of branded items requested in the ments in a weekend session was 127 on a Saturday and for a letter to Father Christmas was examined for the whole UK weekday session the maximum was 56 advertisements. In this sample (n ˆ 99). In a one-tailed Pearson correlation no section, the term ‘‘advertisement’’ refers only to those relationship between the two variables was found; there was no commercials which were recorded on video for the purposes reliable effect of the T V score on the proportion of branded of this study; clearly there may well have been advertisements Downloaded from http://jbd.sagepub.com at SAGE Publications on November 12, 2009 536 PINE AND NASH / THE EFFECT S OF TELEVISION ADVERTISING Figure 4. Pie chart showing requests made by UK children in their letters to Father Christmas. * These account for a cumulative total of items for which only 1 or 2 requests were made. Numbers in brackets indicate total number of requests. for other products at other times but the advertisements recorded were designed to act as a representative sample. The 1388 advertisements comprised 175 (12.6%) for food or drink products, 88 (6.3%) for ‘‘other’’ products such as washing powder, tissues, nappies, etc., and 24 (1.7%) for fast food restaurants (McDonald’s 23; Burger King 1). T he advertisements for McDonald’s and Burger King restaurants both promoted free gifts which were designed to appeal to children (i.e., models of T arzan, Barbie, or Hot Wheels cars); nevertheless, for the purposes of this study they have not been included as ‘‘toy’’ advertisements. The remaining 1101 advertisements (79.3%) were for toys; these included computers or games consoles and associated games and children’s videos. In all 201 different toys were advertised. After collapsing within groups, i.e., amalgamating all the different products related to one brand name, for example Action Man or Lego, this gure reduced to 175. The 10 most frequently televised advertisements are listed in Table 1 together with the number of requests made by children for those products. Table 1 The 10 most frequently televised advertisements and number of requests made by UK children. Product No. of adverts No. of requests Star Wars 43 4 Barbie 39 34 Action Man 38 17 Bugs Life Hot Wheels 34 25 0 1 24 0 Tanya My Sweet Love Baby Expressions Lego Beast Wars Transformers In a one-way Pearson test this correlation was found to be both positive and signicant, r(n ˆ 175) ˆ .433, p 5 .01. This suggests a positive relationship between the frequency of a product advertisement and the number of requests for that product. However, this may be a spurious relationship as two outliers, Barbie and Action Man products, appear to be responsible for the strength of this relationship. If these two products are excluded from the calculation, then the one-way Pearson correlation changes completely, nding no relationship between the two variables r(n ˆ 173) ˆ .065, p 4 .05. In fact, of the 175 advertisements, a total of 152 (86.8%) products appeared for which no request was made. With regard to those toys requested, Figure 5 shows the number of requests per item and also the number of televised recorded advertisements, if any, in the period 23.10.99 to 28.11.99. Of the 27 media-related or character merchandise products that were requested by the children, 9 were not advertised. CHILDREN’S NONBRANDED REQUEST S In relation to the use of generic terms, i.e., remote control car and baby doll, analysis of the television advertisements found 21 advertisements for 7 individually named remote control cars (e.g., Hex Wheeler, Super Rebound), and 168 advertisements for 19 named baby dolls (e.g., Baby Expressions, My Sweet Love), thus suggesting that these advertisements may have created a desire for the products but no recall for the brand-name. Comparison with a contrast Swedish group of children T he letters from the Swedish children (n ˆ 19) were analysed as before. T he letters from a matched group from the English 23 0 sample, who had also been allowed to draw their requests and 23 0 whose age range matched those of the Swedish children (5–6 years old), were used for comparison purposes. 19 0 As Table 2 shows, the UK children requested more 19 0 products generally than the Swedish children and this was Downloaded from http://jbd.sagepub.com at SAGE Publications on November 12, 2009 INTERNATIONAL JOURNAL OF BEHAVIORAL DEVELOPMENT , 2002, 26 (6), 529–539 537 Table 2 Mean (SD) number of requests for items (total and branded) in children’s letters to Father Christmas according to nationality. Nationality N Age group Mean no. of total requests Mean no. of branded requests % of total requests Swedish UK 19 34 5–6 years 5–6 years 4.316 (2.473) 5.470 (1.186) 1.578 9 (1.304) 2.206 (1.149) 36.58% 40.33% conrmed as reliably different in a two-tailed independen t groups t-test, t(51) ˆ 2.301, p .05. A two-tailed independen t groups t-test of the difference in the mean number of branded requests between the UK children and the Swedish children approached but did not reach signicance, t(51) ˆ 1.815, p ˆ .075. Discussion T his study set out to examine whether the amount of television watched inuences children’s requests for toys. More specically, it searched for a positive relationship between the amount of commercial children’s television watched and the proportion of brand-named toys requested in children’s letters to Father Christmas. It looked further at whether this relationship was affected by other covariants such as age, increased availability of commercial television in the form of satellite or cable television, and whether the presence of an adult when watching television mediated the effect. The results of the study suggest that the proportion of branded products requested by children in their letters to Father Christmas is not inuenced (1) by the amount of commercial television viewing; (2) by age, in this case across a range of 3 to 6 years; and (3) by increased access to commercial television in the form of cable and satellite television. However, by removing the range restriction imposed by proportional analysis, it appeared that children who watched more television, and commercial television in particular, were more likely to request not only more branded goods, but also more items generally. As these data are Figure 5. Number of requests per item/ number of televised advertisements. correlational this does not constitute evidenc e for causality. However, one interpretation of this nding may be that increased commercial television viewing encourages a more consumer-orientated and materialistic nature, a nding that concurs with those of Ward et al. (1977), Robertson and Rossiter (1974), and Robertson, Ward, Gatignon, and Klees (1989). Moreover, the fact that both the overall number of requests for toys and the number of requests for branded items increase means that the proportion of branded products requested is likely to remain the same. T here was, as expected, an increased inuence of advertisements when children watched the television on their own. This suggests that, when compared to adults, there is an effect of advertising on children which means the under-7s may be less resistant to the marketing intentions of advertisers and manufacturers when watching alone (Bjustrom, 1994 ; Gunter & McAleer, 1997 ; Young, 1998). Of course, alternative interpretations are feasible. One is that unaccompanied children may be more motivated to recall brand names in order to request them when in the presence of an adult. Another interpretation is that these are the children of busier parents, who know they can persuade their parents to buy them more as compensation for lack of attention. Clearly directional causality cannot be inferred. However, when comparing children of different ages, the lack of effect by age within our sample of under-7s suggests that 6-year-olds have developed no more cognitive resistance to television advertisements than 3-year-olds. Despite having acquired more cognitive skills by age 6, particularly those relating to theory of mind and reality distinction, the older children appeared to be as susceptible as Downloaded from http://jbd.sagepub.com at SAGE Publications on November 12, 2009 538 PINE AND NASH / THE EFFECT S OF TELEVISION ADVERTISING the younger ones. This emphasises the importance of the role found here may also reect the normal delay that occurs that parents play in advertisement education and in helping between advertisement and moment of purchase. their children to acquire critical viewing skills. Even preschool In light of the number of advertisements for toys aimed at children have been found to be more advertising literate after children and the large proportion of advertised products for being taught, within the family, about market-place skills and which no request was made, there is a poor effect of many of the purpose of advertising (R.E. Hite & Eck, 1987). Afterwards the individual advertisements themselves. This is conrmed by they were less susceptible to deception than those children in the lack of a relationship between children’s requests and families who did not teach the same skills. televised advertisements after removing Barbie and Action The novel use of letters to Father Christmas in this study Man from the analysis, the only two products for which there emulates the typical delay that occurs between seeing an appears to be some effect. Collins and Wellman (1982) advertisement and the time of purchase or request, and lends identied a memory bias in young children, claiming they ecological validity to these ndings. Equally, construct validity attend more closely to familiar content on television. As these appeared to be strong. However, the signicant difference two dolls have been on the market for a long time, and were between the television scores for the school children (selfpopular with the parents of today’s children, their familiarity report) and the nursery children (parental report) requires may have reinforced the impact of the commercials. This further investigation. It may be that the scores accurately suggests that advertisers of new products are at a huge reect the different viewing habits of the two groups of disadvantage when it comes to trying to get their name across children. Alternatively it may be inaccuracy of memory on to young children, since familiarity takes a long time to either part, elaboration in a desire to create a good impression establish. As Vakratsas and Ambler (1999, p. 31) note, ‘‘a or, in the case of parent report, a lack of awareness or minimum number of exposures is necessary for the advertiseunderestimation of their child’s viewing habits. As the wording ment to have an effect’’. of the questions was derived from the children, it is unlikely Lack of product familiarity and memory decits offer some that the children’s understanding of the wording is a problem. explanation s as to why many of the toys advertised were not Whatever the cause, measures of television viewing habits requested by any of the children in this study. Certainly the employed in future studies need to pay particular attention to Admap (2000) suggestion that ‘‘the visuals are key, words issues of reliability and accuracy. Asking parents to keep a diary secondary’’ when advertising to children does not seem to have may be one method of producing more reliable records of what resulted in production techniques that enhanc e the memorchildren watch and monitoring devices within the TV set that ability of the product name. However, recognition memory at record which programmes are watched could also be employed this age is far better than recall (Gunter & McAleer, 1997), and in future studies to address this issue. a child would need to recall a product’s name explicitly in A promising framework for understanding children’s order to ask for it in a letter. Future studies will include memory for, and understanding of, advertisements involves recognition measures in order to tap in to the child’s implicit applying a model based on implicit and explicit knowledge. memory. An alternative explanation is that the products This is explored well in Karmiloff-Smith’s (1992) Representathemselves may not be appealing and fail to create a desire tional Redescription model, whereby knowledge is redescribed and that children are more shrewd and sophisticated than the from an implicit nonverbalisable level through transitional advertisers would believe. However, given the lack of cognitive stages to an explicit, and transferable, form (see also Pine & skills of children in the age group studied here, this is unlikely. Messer, 1999). T he idea of having knowledge at different levels Finally, the restrictions on advertisements imposed by the of explicitness also offers an explanation of previous ndings IT C, and the self-regulation codes, may be seen here to be whereby a variety of ages have been accredited with underworking very effectively in preventing pester power. It is standing of advertisements. A young child may not be able to unlikely that children would be pestering their parents for dene an advertisement explicitly but, implicitly, may be able advertised toys and yet fail to mention the desired toy in their to distinguish a commercial from a programme. Similarly, letter to Santa. Although these ndings are from a correlation being able to tell what an advertisement is and understanding study using cross-sectional data, one interpretation could be the objectives of the advertiser are two very different areas of that increased exposure to commercials has the effect of knowledge. Children (and adults too) possess many dimenmaking children want more toys in general, rather than specic sions of thought that are represented in a nonlinguistic form named products, so pester power cannot be totally ruled out. and television advertising is no exception. The challenge for T he heavy viewing children in this study may possibly be researchers is to employ methodologies that tap into implicit pestering their parents for the latest type of toys, although not and explicit knowledge in order to achieve a fuller awareness of necessarily by name. A similar positive relationship between how children’s understanding of television develops. high viewing and more requests was also found in a crossIn terms of the children’s requests for branded products in cultural study carried out by Robertson et al. (1989). Their relation to their total requests, 41% suggests either that study also investigated parent-child conict and found this was children below the age of 7 years are not oriented towards higher in families where children watched more television. brand names, that they do not understand the salience of the T herefore, parents who allow their children to watch a lot of brand names, or, as was predicted, that they simply have T V in order to give themselves an ‘‘easier’’ life may, in fact, be difculty remembering them. Moreover, the 73% who creating more problems for themselves in the long run. Future requested one or more branded items is less than Greenberg studies could explore this relationship more systematically by et al. (1986) found. T hey issued diaries to children for use of longitudinal observations. These could employ diary completion during 1 week in October and found that 91% of methods, interviews, and children’s letters to Santa over a 2- or heavy viewers of commercial television requested advertised 3-year period. products. Although these products included food and other T he comparison with the Swedish children conrmed that items, rather than just toys, the lowerDownloaded number of requests the presence of advertisements on UK television tended to from http://jbd.sagepub.com at SAGE Publications on November 12, 2009 INTERNATIONAL JOURNAL OF BEHAVIORAL DEVELOPMENT , 2002, 26 (6), 529–539 result in more requests generally. Does this mean that increased exposure to commercial television generates more demands from children and, where there are fewer advertisements, children ask for less? Of course, these data have to be treated with caution as the sample of Swedish children was small and it may be differences between British and Swedish cultures which account for the difference. However, it would be useful to explore this further given that there exists a nation of children who are raised in a Western culture but without the levels of exposure to TV advertising experienced by children in the UK. In summary, this study nds that increasing amounts of commercial television watched are matched by an increase in the overall amount of toys requested by children, and an increase in the number of branded products requested. One interpretation is that there is a general effect of advertising on children’s desires and the lone viewing data may be taken as evidenc e of young children’s susceptibility to the persuasive intent of commercials. However, with the exception of two well-established products, the paucity of a relationship between the branded products requested and the frequency of televised advertisements for them suggests that advertisements may not have an individual impact on the under-7s but may simply contribute to a general increase in desire. One implication of this is that a society which exposes young children to many thousands of advertisements every year also has a duty to educate those children in consumer literacy and critical viewing. Manuscript received September 2000 Revised manuscript received October 2001 References Admap. (2000). Children: Victims or allies? January, 402, 19–20. Admap Publications. Aloise-Young, P.A. (1993). The development of self-presentation: Self-promotion in 6- to 10-year-old children. Social Cognition, 11, 201–222. Bennett, M., & Yeeles, C. (1990). Children’s understanding of the selfpresentational strategies of ingratiation and self-promotion. European Journal of Social Psychology, 20, 455–461. Berry, G.L., & Keiko Asamen, J. (1993). Children and television: Images in a changing sociocultural world. London: Sage. Bjurstrom, E. (1994). Children and television advertising. Sweden: Consument Verket. Collins, W.A., & Wellman, H. (1982). Social scripts and developmental patterns in comprehension of televised narratives. Communication Research , 9, 380– 398. Dorr, A. (1986). Television and children: A special medium for a special audience. Beverley Hills, CA: Sage. 539 Faul, F., & Erdfelder, E. (1992). GPOWER: A priori, post hoc, and compromise power analyses for MS-DOS [Computer program]. Bonn, Germany: Bonn University, Dept. of Psychology. Flavell, J.H., Flavell, E.R., Gree, F.L., & Korfmacher, J.E. (1990). Do young children think of television images as pictures or as real objects? Journal of Broadcasting and Electronic Media, 34, 399–417. Gaines, L., & Esserman, J.F. (1981). A quantitative study of young children’s comprehension of television programmes and commercials. In J.F. Esserman (Ed.), Television advertising and children, New York: Child Researc h Service. Greenberg, B.S., Fazal, S., & Wober, M. (1986). Children’s views on advertising. London: Independent Broadcasting Authority (now the Independent Television Commission). Gunter, B., & McAleer, J. (1997). Children and television (2nd ed.). London: Routledge. Henricksen, L. (1996). Naive theories of buying and selling: Implications for teaching critical viewing skills. Journal of Applied Communication Research, 24, 93–109. Hite, C.E., & Hite, R.E. (1994). Reliance on brand by young children. Journal of the Market Research Society, 37, 185–193. Hite, R.E., & Eck, R. (1987). Advertising to children: Attitudes of business vs. consumers. Journal of Advertising Research , October/November, 40–53. Huston, A.C., & Wright, J.C. (1998). Mass media and children’s development. In W. Damon (Gen. Ed.), I.E. Sigel, & K.A. Renninger (Vol. Eds.), Handbook of child psychology: Vol. 4, Child psychology in practice (pp. 999–1058). New York: Wiley. Jaglom, L.M., & Gardner, H. (1981). The preschool television viewers as anthropologist. In H.L. Kelly & H. Gardner (Eds.), Viewing children through television (pp. 9–30). San Francisco: Jossey-Bass. Karmiloff-Smith, A. (1992). Beyond modularity: A developmental perspective on cognitive science. Cambridge, MA: MIT Press. Levin, S.R., Petros, T.V., & Petrella, F.W. (1982). Preschoolers’ awareness of television advertising. Child Development, 53, 933–937. Linn, M.C., De Benedictis, T., & Delucchi, K. (1982). Adolescent reasoning about advertisements : Preliminary investigations. Child Development, 56, 1479–1498. Livingstone, S., & Bovill, D. (1999). Social perspectives: Have the media ruined childhood? Interactions, 6 , 36–41. Macklin, C. (1994). The effects of an advertising retrieval cue on young children’s memory and brand evaluations . Psychology and Marketing , 11, 291– 311. Pine, K.J., & Messer, D.J. (1999). What children do and what children know: Looking beyond success using Karmiloff-Smith’s RR framework. New Ideas in Psychology, 17, 17–30. Robertson, T.S., & Rossiter, J.R. (1976). Short-run advertising effects on children: A eld study. Journal of Marketing Research, 13, 68–70. Robertson, T .S., Ward, S., Gatignon, H., & Klees, D. (1989). Advertising and children: A cross cultural study. Communication Research , 16, 459–485. Rossiter, J.R., & Robertson, T.S. (1974). Canonical analysis of developmental, social and experiential factors in children’s comprehension of television advertising. Journal of Genetic Psychology , 129, 317–327. Sharp, T ., Dyer, R., & Divita, S. (1976). An experimental test of the harmful effects of premium-orientated commercials on children. Journal of Advertising Research, 3, 1–11. Vakratsas, D., & Ambler, T. (1999). How advertising works: What do we really know? Journal of Marketing, 63, 26–43. Ward, S., Wackman, D.B., & Wartella, E. (1977). How children learn to buy, Beverley Hills, CA: Sage. Young, B. (1998). Emulation, fears and understanding: A review of recent research on children and television advertising. London: Independent Television Commission. Downloaded from http://jbd.sagepub.com at SAGE Publications on November 12, 2009


© Copyright 2026