
MANUAL 2009 for Measuring ICT Access and Use by Households and Individuals
ITU I n t e r n a t i o n a l T e l e c o m m u n i c a t i o n U n i o n MANUAL for Measuring ICT Access and Use by Households and Individuals Printed in Switzerland Geneva, 2009 Manual for measuring ICT access and use by households and individuals 2009 Edition 2009 EDITION International Telecommunication Union Manual for Measuring ICT Access and Use by Households and Individuals 2009 Edition © ITU 2009 All rights reserved. No part of this publication may be reproduced, by any means whatsoever, without the prior written permission of ITU. Preface It is a pleasure to present to you the ITU Manual for Measuring ICT Access and Use by Households and Individuals. This Manual has been prepared to support countries in their efforts to measure and monitor the developments towards becoming information societies. With the ever growing spread of information and communication technologies (ICTs) throughout the world, and increasingly in the developing countries, the demand for accurate and comparable data and statistics on ICT access and use has also grown. ICT measurement has thus become vital to formulating and revising national ICT policies and strategies, and to monitoring the global digital divide. ICT indicators are also necessary to monitor the Millennium Development Goals (MDGs) and the targets set out by the World Summit on the Information Society (WSIS). ITU has a long history of collecting, harmonizing and disseminating international statistics on telecommunication and ICTs. Our World Telecommunication/ICT Indicators (WTI) database dates back to the 1960s. More recently, and following the WSIS, we have expanded our data collection to include a larger number of Internet-related statistics. At the same time, there is an increasing demand for data on the usage of ICTs, which cannot be provided through subscriber data that are collected mainly from administrative (our traditional) data sources. Instead, statistics on Internet and telephone usage, for example, are being collected through household surveys carried out by national statistical offices (NSOs). Data coming from these sources provide more reliable information on the use of ICTs and important insights to questions such as, where do people access the Internet and what do they use it for? Therefore, in 2003, we started to expand our global data collection to include ICT statistics based on household surveys through an annual questionnaire sent to NSOs in all countries. At the same time, we are actively involved in developing international standards and methodologies related to ICT infrastructure and household statistics, and in helping countries build capacities in the area of ICT measurement. We work in close cooperation with other international partners. ITU is a founding member of the Partnership on Measuring ICT for Development, which was launched in 2004, following the WSIS held in Geneva. Since then, the Partnership has achieved international recognition as a key initiative to promote and improve the availability of ICT statistics globally. As an active member of the Partnership, ITU has contributed significantly to developing the core list of indicators, in particular those on ICT infrastructure and access, and on ICT access and use by individuals and households. We will continue to work with our partners from the international community. In addition, I am very pleased about our cooperation with the United Nations Statistics Division, which we actively pursue in order to ensure that our work is conform to international statistical standards and gets widely disseminated in the global statistical community. An important objective of our work is to provide assistance to our members in the area of ICT measurement. This Manual, which is based on the Partnership’s core list of indicators, has therefore been prepared as a practical tool to guide countries in their ICT data production. It can be used as basic reference material when preparing, designing and implementing ICT household surveys. The Manual also serves as the basis for our training course on ICT household statistics, which we offer to countries that would like to receive capacity building in this field. This is the first edition of the Manual. It will be updated continuously, in close consultation with members and experts from the international community through online tools, workshops and seminars in countries and regions, and our World Telecommunication/ICT statistics meetings (WTIM). I invite all of you to use these forums actively to further develop and improve international standards and data on ICT. I am confident that this Manual will be useful to everyone involved in the production of ICT household statistics. Sami Al Basheer Al Morshid Director Telecommunication Development Bureau (BDT) International Telecommunication Union Foreword At its 38th session, held in 2007, the United Nations Statistical Commission endorsed a core list of ICT indicators. The core list, which has been developed by the Partnership on Measuring ICT for Development, includes indicators on ICT infrastructure and access; ICT access and use by households and individuals; ICT use by businesses and the ICT producing sector. The Commission, in addition, encouraged countries to adopt the core indicators in their ICT data collection programmes. It also urged the Partnership on Measuring ICT for Development to update the list of indicators regularly and assist countries in their capacity building efforts for ICT data collection. A revised core list of ICT indicators will be presented by the Partnership to the 40th session of the Statistical Commission, including indicators on ICT in education. Furthermore, the United Nations Principles and Recommendations on Population and Housing Censuses, Revision 2, released in 2008, urges countries to collect statistics on household access to ICT as a core topic. ICT statistics have been on the agenda of the international statistical community for many years. It is against this background that the above-mentioned Partnership has been working with national and international stakeholders in developing statistical standards and relevant methodologies pertinent to ICT measurement. While there are several general manuals and handbooks on household surveys, this is the first manual dedicated to the collection of ICT statistics at the household level. The Manual adheres to the standard, and internationally accepted principles, underlying sample survey methodologies. The publication is intended to assist national statistical offices in the art of collecting and compiling ICT statistics. It deals with the collection, processing, evaluation and dissemination of ICT household statistics. The Manual will be a useful reference for ICT data producers worldwide. Indeed, an increasing number of countries are conducting specialized ICT household surveys or are including ICT questions in their existing household surveys. This Manual complements the UNCTAD Manual on the Production of Statistics on the Information Economy, which covers ICT statistics collected through business surveys and is based on the Partnership core list of indicators on ICT use by businesses. The two Manuals provide a complete set of tools at the disposal of national statistical offices for use in their ICT data collection programmes. I wish to congratulate the ITU, a founding member of the Partnership, in taking a leading role, at the international level, to develop internationally comparable indicators on ICT infrastructure and ICT access and use by households and individuals. Paul Cheung Director United Nations Statistics Division Department for Economic and Social Affairs Acknowledgements The Manual for Measuring ICT Access and Use by Households and Individuals was prepared by Sheridan Roberts, a consultant to the International Telecommunication Union. The work was coordinated by the Market Information and Statistics Division within the Telecommunication Development Bureau of ITU, including Susan Teltscher (Head of the Division), Esperanza Magpantay, Vanessa Gray and Doris Olaya. Substantive comments were provided by José Luis Cervera Ferri, also a consultant to ITU. Various references were consulted for this publication, especially publications from the Partnership on Measuring ICT for Development, United Nations Statistics Division, OECD and Eurostat. Other material includes survey and indicator metadata from national statistical sources, ITU, UNECLAC, OECD and Eurostat. Special acknowledgement is made to the Census and Statistics Department of Hong Kong, China, the Central Bureau of Statistics of Nepal, the Ministry of Communication and Information Technology of Egypt and UNECLAC. These organizations provided additional information for some of the examples used in the Manual. The desktop publishing was carried out by the Publication Composition Service. Nathalie Rollet from the Market Information and Statistics Division coordinated the printing of the Manual. The cover was designed by Sarah Roxas from the Partnership and Promotion Division. Contents Page Preface ........................................................................................................................................................ iii Foreword ......................................................................................................................................................v Acknowledgements..................................................................................................................................... vi Contents..................................................................................................................................................... vii Index of boxes, tables and figures .............................................................................................................. ix Boxes ..........................................................................................................................................................ix Tables .........................................................................................................................................................ix Figures ........................................................................................................................................................ix Chapter 1. Introduction ................................................................................................................................1 Scope and structure of the Manual ............................................................................................................ 2 Chapter 2. International and national stakeholders in ICT measurement.....................................................5 The work of international organizations in developing relevant statistical standards ................................. 5 Stakeholders in the national statistics system ............................................................................................ 9 Chapter 3. Planning and preparation for ICT household surveys ..............................................................11 Survey planning ........................................................................................................................................ 11 Budget and management issues ............................................................................................................. 13 Other preparatory work ............................................................................................................................. 14 Staff training and selection .................................................................................................................. 14 Chapter 4. Statistical standards and measurement topics for ICT household statistics ............................17 Core ICT household indicators................................................................................................................. 17 Household ICT access indicators ....................................................................................................... 17 Individual ICT use indicators ............................................................................................................... 18 Classificatory variables for ICT household statistics................................................................................. 23 Household characteristics................................................................................................................... 24 Individual characteristics ..................................................................................................................... 24 Age .................................................................................................................................................. 24 Highest education level received.................................................................................................... 24 Labour force status ......................................................................................................................... 25 Occupation...................................................................................................................................... 25 Cross-classification of variables.......................................................................................................... 25 Other classificatory variables .............................................................................................................. 26 Other measurement topics related to ICT household statistics ............................................................... 27 E-commerce ........................................................................................................................................ 27 E-security: trust in the on-line environment ......................................................................................... 28 The social and economic impacts of ICT access and use by households and individuals .............. 28 Barriers to ICT access or use .............................................................................................................. 28 Time-related issues .................................................................................................................................. 30 Chapter 5. Data sources and collection techniques for ICT household statistics ......................................33 Data sources............................................................................................................................................. 33 Types of surveys.................................................................................................................................. 33 Data collection techniques ....................................................................................................................... 37 Personal face-to-face interviews..................................................................................................... 39 Personal telephone interviews ........................................................................................................ 39 Page Self-enumeration ............................................................................................................................. 40 Internet based surveys.................................................................................................................... 41 Chapter 6. Question and questionnaire design for ICT household surveys...............................................43 General principles on questionnaire design for household surveys ........................................................ 43 ICT model questions ................................................................................................................................ 46 Reference period ................................................................................................................................. 47 ICT concepts that may be difficult to understand ............................................................................... 48 Internet access services.................................................................................................................. 48 Internet activities related to government organizations.................................................................. 48 Internet access using mobile devices ............................................................................................ 50 Mobile cellular telephones .............................................................................................................. 50 Questionnaire logic................................................................................................................................... 51 Chapter 7. Designing ICT household surveys............................................................................................53 Scope and coverage for households and individuals .............................................................................. 53 Target populations and survey frames ..................................................................................................... 55 Statistical units .......................................................................................................................................... 57 Sample design and selection ................................................................................................................... 58 Chapter 8. Data processing for ICT household statistics...........................................................................61 Data entry.................................................................................................................................................. 61 Data editing............................................................................................................................................... 61 Micro edits ........................................................................................................................................... 61 Macro edits .......................................................................................................................................... 63 Imputation for missing data (non-response) ............................................................................................ 67 Weighting of data ...................................................................................................................................... 68 Calculating and reporting of ICT household indicators ............................................................................ 68 Chapter 9. Data quality and evaluation for ICT household statistics..........................................................70 Sampling error .......................................................................................................................................... 71 Non-sampling error................................................................................................................................... 73 Assessment of data quality....................................................................................................................... 74 Evaluation.................................................................................................................................................. 75 Chapter 10. Dissemination of ICT household data and metadata .............................................................77 Data dissemination ................................................................................................................................... 77 Tabulation plans for ICT indicators ........................................................................................................... 77 Metadata reporting and dissemination ..................................................................................................... 80 Data collection and dissemination of ICT statistics by ITU ...................................................................... 83 Annex 1. Core Iist of ICT Indicators (revised 2008) ....................................................................................85 Core indicators on ICT infrastructure and access .................................................................................... 85 Core indicators on access to, and use of, ICT by households and individuals ....................................... 86 Core indicators on use of ICT by businesses........................................................................................... 87 Core indicators on the ICT (producing) sector......................................................................................... 88 Core indicators on trade in ICT goods ..................................................................................................... 88 Core indicators on ICT in education......................................................................................................... 88 Annex 2. ITU model questionnaire for measuring ICT access and use by households and individuals ....89 Page Annex 3. Examples of imputation and weighting .......................................................................................99 Imputation for missing data ...................................................................................................................... 99 Weighting records................................................................................................................................... 100 Annex 4. Tabulations for reporting on the core ICT indicators .................................................................101 Annex 5. Glossary and abbreviations.......................................................................................................103 Bibliography .............................................................................................................................................113 Index of boxes, tables and figures Boxes Box 1. Box 2. Box 3. Box 4. Box 5. Box 6. Box 7. Box 8. Box 9. Box 10. Box 11. Box 12. Box 13. Box 14. Box 15. Box 16. Box 17. Box 18. Box 19. Box 20. Box 21. Box 22. Page The Partnership on Measuring ICT for Development................................................................... 7 Institutional collaboration in Egypt.............................................................................................. 10 Australia: geographical classification used in ICT household survey ....................................... 26 Singapore: barriers to household Internet access ..................................................................... 29 Nicaragua: measuring barriers to individual use of the Internet ................................................ 29 Eurostat model question on barriers to more intensive use of the Internet by individuals........ 30 Latin America: frequency of IT access and use surveys ........................................................... 31 Lao People’s Democratic Republic: use of budget surveys to collect ICT access data .......... 34 Ghana: use of multi-purpose survey vehicles for collecting ICT household data..................... 35 Nepal: surveys used to collect household ICT access data...................................................... 36 Use of a combination of techniques to collect ICT household data.......................................... 38 Malaysia: random digit dialing in the Household Use of the Internet Survey............................ 40 Hong Kong, China: question on use of e-Government services, 2008..................................... 49 Hong Kong, China: question on devices used to access the Internet, 2008............................ 50 Interviewer instructions for ICT household surveys of Canada and Hong Kong, China ........... 52 Morocco: scope of the 2005 ICT household survey .................................................................. 54 Honduras: change in statistical units in household surveys...................................................... 57 Definition of household used in Australia and Hong Kong, China ............................................ 58 Greece: stratification of the sample of the ICT household survey ............................................. 60 Example of a consistency check ................................................................................................ 62 Australia: example of post-stratification ..................................................................................... 68 Sampling error of the value of an ICT household indicator ....................................................... 72 Tables Table 1. Table 2. Table 3. Table 4. Table 5. Table 6. Table 7. Table 8. Table 9. Table 10. Table 11. Table 12. Table 13. Table 14. Table 15. Reference material for household surveys and standards..................................................... 8 Core indicators on access to, and use of, ICT by households and individuals................... 19 ISCO major groups: 1988 and 2008 ..................................................................................... 25 Survey vehicles used for collecting household ICT access and use data........................... 35 Surveys used by countries of the Latin American and Caribbean region to measure household access to, and individual use of, ICT .............................................. 37 Data collection techniques used for collecting household ICT access and use data........ 38 Age scope for surveys that collect household ICT access and use data............................ 54 Frames for surveys that collect household ICT access and use data ................................. 56 Micro and macro edits for ICT household statistics ............................................................. 64 Example of data reporting: partial table................................................................................ 70 Example tabulation for household ICT access core indicators............................................ 78 Example tabulation for ‘whole population’ individual use indicators ................................... 79 Example tabulation for the location of Internet use .............................................................. 80 Metadata associated with ICT household surveys ............................................................... 82 Tabulation for reporting on households access to ICT ...................................................... 101 Table 16. Table 17. Table 18. Table 19. Table 20. Page Tabulation for reporting on individual use of ICT broken down by age and gender ......... 102 Tabulation for reporting on Internet activities broken down by age and gender ............... 103 Tabulation for reporting on individual use of ICT broken down by highest education level received...................................................................................................... 104 Tabulation for reporting on individual use of ICT broken down by labour force status ..... 105 Tabulation for reporting on individual use of ICT broken down by Occupation ................ 106 Figures Figure 1. Structure and logic of a model questionnaire/module for collecting ICT household data .. 45 Chapter 1. Introduction Chapter 1. 1 Introduction 1. The primary objective of this Manual is to assist countries to measure ICT access and use by households and individuals to enable the production of high quality and internationally comparable data. While it is primarily intended as a practical tool for official statisticians of developing economies, its content will also be relevant to developed and transition economies. 2. The Manual focuses on the core list of ICT indicators1 identified by the Partnership on Measuring ICT for Development – specifically, the indicators on access to, and use of, ICT by households and individuals.2 3. Within the Partnership, ITU works to increase the availability of internationally comparable statistics on ICT access and use by households and individuals. 3 In this context, it develops methodologies and provides assistance to members wishing to collect ICT household statistics. This Manual is part of ITU’s technical assistance work in this area. It also serves as the basis for the ITU training course on the same topic.4 4. At the global level, ICT household statistics are still limited. ITU’s data collection experience shows the relatively poor state of ICT household measurement globally. This was illustrated in the first statistical publication by the Partnership (Partnership, 2008). It showed that: • Relatively few developing and least developed economies collect ICT household statistics5 (although a majority of developed economies do),6 and • There are a number of other challenges, including lack of comparability between statistics collected by countries, lack of information about surveys (metadata), and lack of adherence to the core ICT indicator standards in some areas. 5. In covering many of the statistical difficulties in this field, the Manual aims to address both these issues. 6. Conceptually, the Information Society is a complex set of topics, entities, actions and relationships. OECD (2009), through its Working Party on Indicators for the Information Society (WPIIS), has developed a broad conceptual framework covering the information society measurement areas of ICT infrastructure, ICT products, ICT demand and supply, and information and electronic content. 7. The component of main interest for this Manual relates to ICT demand by households and individuals, although all elements of the framework are relevant to some degree, for instance, households use ICT infrastructure and interact with businesses and government. The measurement of some of the other components, namely ICT demand by businesses and ICT supply, is covered in the UNCTAD 2009 Manual on the Production of Statistics on the Information Economy (UNCTAD, 2009). 1 These may be found in Annex 1 More information on the Partnership and its members can be found in Chapter 2 and on ITU’s website http://www.itu.int/ITU-D/ict/partnership/index.html. 3 In addition to its statistical work on telecommunication and ICT infrastructure. 4 ITU Training Course on Measuring ICT Access and Use by Households and Individuals 5 The Manual uses the term ‘ICT household statistics’ to refer to statistics on both household access to, and individual use of, ICT. 6 As at the end of 2007, about one third of developing economies (including least developed economies) had indicators for household access to radio, TV, fixed telephone and computer. Fewer had data on mobile phone and Internet access and very few had information on individual ICT use. 2 Manual for Measuring ICT Access and Use by Households and Individuals 2 Chapter 1. Introduction 8. It is important, at the outset, to distinguish what we mean by ICT access and ICT use. ICT access refers to availability of ICTs within the home. Use of ICT refers to use by one or more individuals of the household, whether at home or elsewhere. 9. Household statistics on ICT access and use are mainly produced by National Statistical Offices (NSOs) using traditional household surveys. 7 NSOs 8 have particular expertise in conducting household surveys. Their role in ICT household statistics is considered in Chapter 2, which also discusses the importance of relationships between data producers, data users and data providers. Scope and structure of the Manual 10. The Manual focuses on the core list of ICT indicators developed by the Partnership, in particular those produced by NSOs through household surveys. All the core indicators, including those on household ICT access and use, may be found in Annex 1. 11. There are many aspects of survey design and processing that are not specific to ICT household statistics. While this Manual broadly covers those aspects, it leaves it for other publications to provide detailed methodological advice for conducting household surveys. References are provided to such publications, the main ones being from the United Nations Statistics Division: • Household Sample Surveys in Developing and Transition Countries (UNSD, 2005a) and • Designing Household Survey Samples: Practical Guidelines (UNSD, 2005b). 12. Following the introduction in Chapter 1, Chapter 2 of the Manual focuses on the roles of international and national stakeholders in ICT measurement. It includes a discussion of the development of ICT household statistics standards and briefly describes the roles of international organizations involved in standard setting for household surveys generally (Table 1). The chapter then looks at the roles of data producers, users and providers/respondents in a national context. 13. Chapter 3, Planning and preparation for ICT household surveys, describes the range of preparatory activities for ICT household measurement. It explains planning, budgeting and other preparatory work. 14. Chapter 4, Statistical standards and measurement topics for ICT household statistics, addresses statistical standards for household surveys in general and, in particular, those pertaining to ICT household statistics. It introduces the core ICT household indicators (Table 2) and associated classificatory variables that describe household and individual characteristics. In order to assist countries that wish to collect statistics beyond the core list, the chapter considers other ICT household measurement topics, such as e-commerce, trust in the on-line environment, impacts of ICT access and use, and barriers to ICT access and use. It also discusses time-related issues such as reference periods and the value of time series. 7 These can be broadly categorized as household surveys that are either dedicated to measuring ICT access and use or surveys that include some questions or modules on ICT access and use. 8 The term NSO as used in this Manual is taken to include all government agencies that collect official statistics. Where a national statistical system is decentralized, there may be several official statistical agencies in a country. NSOs are usually governmentfunded and are responsible for providing high quality, standardized statistical data to government, industry and the public. They may also be responsible for co-ordinating the national statistical system. Manual for Measuring ICT Access and Use by Households and Individuals Chapter 1. Introduction 3 15. Chapter 5, Data sources and collection techniques for ICT household statistics, provides information on the types of surveys and data collection techniques that statistical agencies may use to measure access to and use of ICTs by households and individuals. 16. Chapter 6, Question and questionnaire design for ICT household surveys, explores the principles of good question and questionnaire design and issues relevant to ICT household measurement. It presents model questions for the core indicators and a logical structure for a stand-alone questionnaire or a module of questions for measuring the core indicators. 17. Chapter 7, Designing ICT household surveys, considers issues of survey scope and coverage, target populations and survey frames, statistical units to be used, and sample design and selection. 18. Chapter 8, Data processing for ICT household statistics, deals with the conduct of surveys and processing of survey data, including data entry, editing, imputation and data weighting. It also discusses how the core ICT household indicators are calculated. 19. Chapter 9, Data quality and evaluation for ICT household statistics, discusses issues relating to data quality, including sampling and non-sampling error, data quality assurance frameworks and evaluation. 20. Chapter 10, Dissemination of ICT household data and metadata, looks at dissemination of data and metadata on ICT household statistics and presents basic tabulation plans. It also describes the data collection and dissemination efforts of ITU. 21. There are five annexes as follows: • Annex 1 provides the entire Partnership’s core list of ICT indicators (as revised in 2008). • Annex 2 presents the ITU model questionnaire (for a stand-alone survey or a module in an existing household survey) for collecting statistics for the core indicators on household access to, and individual use of, ICT. • Annex 3 provides examples of imputation and weighting, and complements Chapter 8. • Annex 4 provides tabulations that can be used by countries to report on the core ICT household indicators to ITU. • Annex 5 is a glossary of terms and abbreviations. 22. The Manual concludes with a bibliography. Manual for Measuring ICT Access and Use by Households and Individuals Chapter 2. International and national stakeholders in ICT measurement Chapter 2. 5 International and national stakeholders in ICT measurement 23. This chapter considers the roles of international and national organizations in measuring access to, and use of, ICT by households and individuals. It looks first at the work of international organizations in developing relevant statistical standards. The chapter then examines the roles of stakeholders in the national statistics system. The work of international organizations in developing relevant statistical standards 24. During the past decade, several international organizations have been involved in the development of statistical standards for measurement of ICT access and use by households and individuals. Details are as follows: • ITU has a long history in setting standards for telecommunication statistics. Of most relevance to the Manual is the important role played by ITU in standardizing definitions of telecommunication and ICT indicators. The telecommunication and ICT indicators produced by ITU are defined in the Telecommunication Indicators Handbook (ITU, 2007), which is updated and reviewed regularly. Some of the definitions in the Handbook are used for many of the technical terms (radio, computer, fixed line telephone, mobile cellular subscriber etc) used in the Partnership’s core indicators on access to, and use of, ICT by households and individuals. • In 2003, closely linked to the WSIS and the recognized need to measure the Information Society, ITU expanded its statistical work from defining and collecting (primarily administrative) data in the area of telecommunication and ICT infrastructure from regulatory authorities etc, into the area of household statistics and started to collect household core ICT indicators data from national statistical offices. 9 As an active member of the Partnership, 10 ITU has contributed to the development of the core list of ICT household indicators, including their definitions, consultations with stakeholders, and the preparation of relevant methodological documents. This Manual is a further contribution by ITU towards the availability of comparable ICT household statistics based on internationally agreed standards. • The OECD, through its Working Party on Indicators for the Information Society (WPIIS),11 has developed standards covering a number of aspects of information society measurement. In respect of households and individuals, WPIIS has developed a model survey for measuring ICT access and use by households and individuals (OECD, 2009).12 • Eurostat, the statistical office of the European Union, works closely with information society statisticians from its member states, and other participating countries, to develop and run the annual Community survey on ICT usage in households and by individuals. The harmonized approach is very effective and provides a detailed and highly comparable dataset on household and individual ICT statistics. Eurostat produces model questionnaires 9 The first ITU questionnaire on access to, and use of, ICT by households and individuals was sent to all national statistical offices in October 2005. 10 Including a member of the Partnership Steering Committee and its Task Group on Capacity Building. 11 Most members of the WPIIS are information society statisticians from national statistical offices of OECD member countries. Other international organizations, including Eurostat and ITU, are also members. 12 www.oecd.org/sti/measuring-infoeconomy/guide. Manual for Measuring ICT Access and Use by Households and Individuals 6 Chapter 2. International and national stakeholders in ICT measurement and methodological manuals dealing with measurement of ICT access and use by households and individuals (Eurostat, 2007, 2009).13 • The Partnership on Measuring ICT for Development (see Box 1) is a partnership of 10 international and regional organizations involved in ICT measurement. It was established following the Geneva phase of the World Summit on the Information Society in 200314 and officially launched in 2004. One of the main achievements of the Partnership was to identify a core list of ICT indicators, in close consultation with other stakeholders, mainly NSOs. • At its meeting of 2007, the United Nations Statistical Commission (UNSC) endorsed the Partnership core list of ICT indicators and encouraged countries to use it in their data collection programmes (UNSC, 2007b).15 The core list was originally composed of 41 ICT indicators, covering ICT infrastructure, ICT access and use by households and businesses, the ICT-producing sector and trade in ICT goods. • The Partnership list was revised in 2008. The revised list had slightly fewer indicators on infrastructure and access. It also included, for the first time, a set of indicators on ICT in education. The number of ICT household indicators was reduced by one to 12, with the combining of two household access indicators (access to fixed and access to mobile telephone). In addition, there were revisions to some definitions and to a number of response categories.16 The complete revised core list is shown at Annex 1. • The main purpose of the core list is to help countries produce high quality and internationally comparable ICT statistics. The indicators have associated standards and metadata, including definitions, model questions, classificatory variables, scope and statistical units. A detailed presentation of the ICT household indicators, including definitions of terms and model questions, can be found in Chapter 4. 13 OECD and Eurostat cooperate in this area; in particular, Eurostat provides data and metadata to the OECD and is represented on the WPIIS. 14 For more information on the Geneva and Tunis phases of the World Summit on the Information Society, see ITU (2005). 15 The report presented by the Partnership can be seen in UNSC (2007a) 16 See Partnership (2009) and UNSC (2009). Manual for Measuring ICT Access and Use by Households and Individuals Chapter 2. International and national stakeholders in ICT measurement 7 Box 1. The Partnership on Measuring ICT for Development Launched: June 2004 at UNCTAD XI (Sao Paulo, Brazil). Current members: ITU, UNCTAD, OECD, UIS, UNECLAC, UNESCWA, UNESCAP, UNECA, Eurostat and the World Bank. Objectives: To identify a common set of core ICT indicators, to be harmonized and agreed upon internationally, that will constitute the basis for a database on ICT statistics; To enhance the capacities of national statistical offices in developing economies and to help them measure the Information Society, based on the core list of indicators; and To develop a global database of ICT indicators and to make it available via the Internet. Memorandum of Understanding: Signed by the partners in 2007 in order to further strengthen their commitment and to provide guidelines to potential new members. Structure: A Steering Committee (currently consisting of ITU, UNCTAD and UNECLAC) plus five task groups (on ICT in education indicators, e-government indicators, capacity-building, database development and ICT impact measurement). Capacity building: The capacity-building work of the Partnership is undertaken by its members either independently or under the auspices of the Partnership Task group on capacity-building. Activities include the conduct of training workshops and similar events, as well as the production of technical material (of which this Manual and that of UNCTAD (2009) are examples). This work was described in Partnership (2008) and is elaborated on the websites of ITU and UNCTAD. Data dissemination: The Partnership released the first comprehensive compilation of core ICT data, The Global Information Society: a Statistical View, 2008 (Partnership, 2008) in May 2008. Most of the information was collected from member countries by ITU, Eurostat, UNCTAD and UNECLAC. More information on the Partnership, its members and its activities can be found on the websites of ITU and UNCTAD, see: http://www.itu.int/ITU-D/ict/partnership/index.html and http://new.unctad.org/default____600.aspx. 25. A number of international organizations are active in developing standards for household surveys more generally. These are detailed in Table 1 and are likely to be relevant to countries measuring ICT household statistics. Some refer to standardized methodologies and survey vehicles, while others refer to major classifications on which ICT household classificatory variables are based. Manual for Measuring ICT Access and Use by Households and Individuals 8 Chapter 2. International and national stakeholders in ICT measurement Table 1. Reference material for household surveys and standards Publishing entity Title Short description United Nations Statistics Division (2005a) Household Sample Surveys in Developing and Transition Countries17 Guidance on conducting household surveys in developing and transition economies, including sample design, survey implementation, non-sampling errors, survey costs and data analysis. United Nations Statistics Division (2005b) Designing Household Survey Samples: Practical Guidelines18 Provides a practical reference tool for those involved in designing and implementing household sample surveys. United Nations Statistics Division ( 2008a) Principles and Recommendations for Population and Housing Censuses Revision 2 Information on statistical standards as well as on the conduct of population censuses. In particular, it recommends the collection of statistics on household access to ICT as a ‘core topic’.19 Maintenance of a catalogue of developing economies’ household surveys, and the development of tools for metadata management. The International Household Survey Network (IHSN, 2009)20 World Bank (2009) Living Standards Measurement Study (LSMS) Surveys The LSMS provides survey tools that are applicable to any complex household survey. The LSMS has a broad objective of improving the quality of household statistics in developing economies, with a more specific goal being to develop methods to monitor progress in raising living levels in developing economies.21 International Labour Organization (ILO, 1993, 2009) International Standard Classification of Occupations (ISCO) and International Classification of Status in Employment (ICSE)22 ISCO is a classification that organizes jobs into a clearly defined set of groups according to the tasks and duties undertaken in the job. ICSE classifies jobs held by persons, with respect to the type of explicit or implicit contract of employment of the person with other persons or organizations. United Nations Educational, Scientific and Cultural Organization (UNESCO, 1997) International Standard Classification of Education (ISCED).23 ISCED is a classification that describes the educational attainment of individuals. The current version (ISCED97) organizes educational attainment into seven levels, ranging from Level 0: Pre-primary education to Level 6: Second stage of tertiary education. 17 http://unstats.un.org/unsd/HHsurveys/pdf/Household_surveys.pdf. http://unstats.un.org/unsd/demographic/sources/surveys/Handbook23June05.pdf. 19 Including household access to radio, TV, fixed line telephone, mobile cellular telephone, personal computer and Internet access. These correspond to the household access core ICT indicators (HH1-HH4 and HH6). Note that the UNSD also recommends collection of data on households accessing the Internet elsewhere (other than home). This refers to any member of the household and is not a core ICT indicator. The Partnership recommends that such information is collected from individuals (note that the results are not equivalent). The UNSD publication can be found here: http://unstats.un.org/unsd/demographic/sources/census/docs/P&R_Rev2.pdf. 20 The International Household Survey Network (IHSN) is a partnership of international organizations, established in 2004, that seeks to improve the availability, quality and use of household survey data in developing countries. The IHSN arose because of a perceived need to “… better coordinate support to strengthen the statistical systems and monitoring and evaluation capacity that countries need to manage their development process.” (IHSN, 2009). 21 http://www.worldbank.org/LSMS/. 22 See http://www.ilo.org/public/english/bureau/stat/isco/index.htm and http://www.ilo.org/public/english/bureau/stat/class/icse.htm. 23 http://www.uis.unesco.org/ev.php?ID=3813_201&ID2=DO_TOPIC. 18 Manual for Measuring ICT Access and Use by Households and Individuals Chapter 2. International and national stakeholders in ICT measurement 9 Stakeholders in the national statistics system 26. In a national context, there are three main groups involved in the ICT household statistics system. They are: • Data producers, especially NSOs; • Policymakers, especially sector ministries and regulatory authorities dealing with ICT and/or telecommunications, and other data users (including international organizations, private businesses and academia); and • Data providers/respondents, mainly individuals from sampled households. 27. The first group is the main audience for this Manual. Their core function is to collect, process and publish high quality statistical data and associated metadata. Their structures and capacities (including human, technological, legal and financial resources) will vary but most NSOs aim to follow international methodologies and standards for collecting data. 28. It is strongly recommended that ICT household statistics are collected by NSOs (defined to include all government statistical agencies, as described in Chapter 1). There are numerous benefits to this, including the capacity of NSOs to carry out nation-wide, representative household surveys and their links with national and international statistical systems. Most NSOs are also supported by legislation designed to protect data and, in many cases, to mandate provision of data, thereby enhancing response rates. They have the necessary technical experience in data collection and generally provide credibility of the official statistics they produce. In some countries, NSOs will also have a coordination role that confers advantages in terms of technical and legal coordination, as well as resource allocation. 29. It is recommended that representatives of the second group (policymakers) work closely with data collection agencies to ensure the relevance of ICT statistics programmes (Box 2 describes cooperation between the Ministry and the NSO in Egypt). Government policymakers responsible for telecommunications and ICT policy will usually be the most influential data users, although users from business, the non-profit sector and academia may also have important input and their experience should be taken into consideration. Governments have a number of options for eliciting input from users and ensuring optimal national cooperation. They could, for example, set up a working group on ICT statistics under the umbrella of a national statistical council. Ideally, more than one avenue of communication should be available in order to take best advantage of user input, the benefits of which include: • Production of more relevant data, especially for policy purposes; • Ongoing support for statistical activities (including funding in some cases); • Use of information from existing research and studies, for example by academia or the private sector; and • Incorporation of the subject matter expertise of data users, which may improve concepts and definitions. 30. An important aspect of the relationship between NSOs, policymakers and other data users is the relevance and quality of data and metadata produced by NSOs. This is discussed in chapters 9 and 10. Manual for Measuring ICT Access and Use by Households and Individuals 10 Chapter 2. International and national stakeholders in ICT measurement Box 2. Institutional collaboration in Egypt In 2006, the Ministry of Communication and Information Technology (MCIT) of Egypt launched the national ICT indicators project Information and Communication Technology (ICT) Indicators Project, in cooperation with the Central Agency for Public Mobilization and Statistics (CAPMAS). This project resulted from Egypt's concern to implement the recommendation of the World Summit on the Information Society (WSIS) in Geneva 2003 and Tunis 2005, to develop tools to provide statistical information on the information society. The aim of the project is to build information society indicators in Egypt, through providing relevant and accurate data about ICT infrastructure and usage within households, private businesses, government and public sector enterprises, in addition to public access points (IT clubs and Internet cafés) and educational institutions. Regarding ICT households indicators, a survey is conducted once a year, with a sample of 21,000 households. The questionnaire is designed by the MCIT team to conform with the Partnership’s core ICT indicators. The structure of the questionnaire is updated regularly by the MCIT team in order to cope with the requirements of analysis and the latest international recommendations. The frameworks and samples are designed by the MCIT team in cooperation with CAPMAS, so as to ensure adequate coverage for all geographic regions and income levels. The data collection process is handled by CAPMAS, and final results are prepared by CAPMAS and provided to MCIT. Survey results are analysed by the MCIT team, using both descriptive and comparative analysis techniques. Results are published through Egypt's ICT indicators Portal developed by MCIT – the first portal in the Arab region and Africa to disseminate ICT usage indicators. In addition, some key indicators are published in MCIT's quarterly ICT indicators bulletin, while others are published by international organizations. The household surveys conducted since 2006 have seen significant enhancement in the indicators measured and fine tuning of the survey questions. New indicators include household expenditure on ICT and security measures undertaken. A joint high level committee from MCIT and CAPMAS meets monthly to follow up the progress of the project, which is formalized through an agreement signed annually between the two parties. This success story has been achieved through continuous and open cooperation between MCIT and CAPMAS. Source: Information Center, Ministry of Communication and Information Technology of Egypt http://www.egyptictindicators.gov.eg. 31. Data providers (respondents) are very important players in the statistical system. Without their cooperation, data would be inadequate in terms of either/both quality and quantity. It is important that NSOs recognize the contribution of respondents and put the necessary effort into gaining their trust and cooperation. At the most obvious level, this entails making the respondent’s job easier for them by providing coherent and understandable survey material, including questionnaires and instructions. This is further discussed in Chapter 6. 32. As a rule, it is important to minimize the burden on respondents providing data for statistical surveys. The potential benefits to NSOs of doing this include higher response rates and better data quality. This issue is also addressed in Chapter 6. 33. While many NSOs work in a legal framework that makes provision of statistical data mandatory, 24 cooperation may be better if such legislation is used sparingly. The legal framework of NSOs will also generally ensure the confidentiality of data provided by individuals. It is very important that protection of individual statistical data is assured and is communicated to respondents. At a more advanced level, public relations efforts may be needed to ensure cooperation. For instance, where the first stage of sampling is by geographic area, there could be localized advertising in areas that have been selected in a household survey. See Chapter 7 for more information. 24 The legal basis of a large number of NSOs can be found here: http://unstats.un.org/unsd/dnss/kf/LegislationCountryPractices.aspx. Manual for Measuring ICT Access and Use by Households and Individuals Chapter 3. Planning and preparation for ICT household surveys Chapter 3. 11 Planning and preparation for ICT household surveys 34. Survey planning and preparation is an obvious prerequisite to survey success and cost minimization. As discussed in the previous chapter, widespread and extensive consultation and coordination with policymakers and other stakeholders will help ensure that the final product is of optimum relevance to their needs. It will also help build support for the project that may assist with fund-raising or publicity. 35. A worthwhile discipline in planning any statistical survey is to constantly consider the purpose for which the eventual results will be used and what types of public policy or other decisions will rely on the results. As it is common for the release of statistics to trigger further demand for data, planners need to contemplate whether, and when, they are prepared to undertake follow-up data collection. Given the rapid change in the state of ICT, there is likely to be a demand for regular surveys (whether stand-alone ICT household surveys or modules included in multi-purpose household surveys). 36. This chapter looks at planning considerations, budget and cost issues, and other preparatory activities. 37. The broad assumption made in this Manual is that ICT household surveys will generally be conducted by NSOs (broadly defined to include all government agencies that collect official statistics). NSOs will generally be more experienced in conducting household surveys than other organizations and will have access to the statistical infrastructure required (including skilled staff, survey frame information, conceptual and methodological knowledge and computer systems). Survey planning 38. A household survey is generally a complex and costly undertaking. Good planning will almost certainly lead to a better result – in terms of data quality, cost and timeliness. Broad areas to consider are: • Purpose and data content of the survey. It is important to always have the purpose of the survey in mind and to review it if necessary. It is assumed that the purpose of the survey will be formulated with the input of policymakers and other major users and will be centred on the most important, and measurable, needs of policymakers. The purpose will lead on to data specifications and may extend to proforma data tabulations. Whatever the detail, the purpose needs to be clear – and clearly understood – by the statisticians and data users involved in the survey. It may also be communicated to respondents in some form in order to gain their cooperation, for example at the time of interview or in publicity material. • Mechanisms for cooperating with policymakers and other data users. As discussed in Chapter 2, close cooperation with policy makers and other data users is strongly recommended in order to improve the relevance of the survey results and to optimize survey questions. Consultation mechanisms (such as a working group on ICT statistics) may already exist in the area of ICT statistics. If they do not, then they should be considered at the planning stage. Possible mechanisms were introduced in Chapter 2. • Available survey vehicle. A decision needs to be taken early in the process on the survey vehicle to be used. The options are to include a modest set of questions in an existing multi- Manual for Measuring ICT Access and Use by Households and Individuals 12 Chapter 3. Planning and preparation for ICT household surveys purpose household survey or to conduct a stand-alone ICT household survey (also known as a ‘dedicated’ survey). There are various advantages of each and these are explored in Chapter 5. • Adherence to existing statistical standards.25 A major focus of this publication is the core list of ICT indicators identified by the Partnership on Measuring ICT for Development (see Annex 1). Those indicators have associated statistical standards and statisticians are strongly encouraged to use those standards. This may require some compromise on the part of policymakers but is of ultimate benefit for several reasons, including: that most of the core indicators are used by many countries and are therefore tested; and that they are clearly defined in terms of associated information, such as definitions and classifications. The results based on the core list of indicators will be internationally comparable and will therefore allow countries to benchmark their national results. The core indicator standards also incorporate other international standards, for example, the definition of occupation, labour force status and educational attainment. Statistical standards are described in Chapter 4. • Answering policy questions through statistical surveys. It is probable that not all questions of interest to policymakers can be answered effectively by a statistical survey.26 The question of feasibility is therefore an important one. In addition, existing data may be able to address some questions, which therefore do not need to be included in a survey. While it may be tempting to simply take the policy questions and ask them of respondents, for a number of reasons, this will often fail. As an example, if a policymaker wishes to know how many households are accessing the Internet through broadband, a simple question to place on a questionnaire is: Does this household access the Internet using broadband? However, ‘broadband’ is a technical term and many respondents may not know if they are accessing the Internet through broadband or not. A better approach is to prepare the survey answers based on the different Internet access services available in the country and to formulate the possible answers based on these. The responses can then be aggregated appropriately afterwards, to derive the answer to the policy question. • Available budget. The budget available to conduct a survey may be a constraining factor that needs to be considered at the planning stage. The possibility of obtaining additional budget from users interested in particular topics should be ascertained early in the process as it might affect the development of the survey. For example, if one user is very interested in use of ICT by people in a particular area, then they may provide funds to boost the sample in that area and therefore enable more detailed output. Survey budgeting is discussed below. • Timeframe. The release of data should generally occur as quickly as possible after the date of the survey and of the reference period (without compromising data quality), particularly given the rapid developments in the area of ICT. Statistical resources, such as interviewers and other staff, may only be available in a specified time frame and will have costs associated with the time they are employed on the survey. For these reasons, it is very important that the planning stage includes a detailed timetable of activities involved in the survey cycle and that milestones are adhered to. An example of a broad timetable that could be adapted can be found in Chapter 2 of Designing Household Survey Samples: Practical Guidelines (UNSD, 2005b).27 25 The word ‘standards’ is used here in a broad context covering topics, questions, concepts, classifications and definitions. Other approaches such as case studies may be more appropriate for some topics (though generally not for the core ICT indicators). 27 Time-table of Household Survey Activities for Country X; the same chapter has a cost worksheet that may also be useful in outlining the steps in the survey process. See: http://unstats.un.org/unsd/demographic/sources/surveys/Handbook23June05.pdf. 26 Manual for Measuring ICT Access and Use by Households and Individuals Chapter 3. Planning and preparation for ICT household surveys 13 • The survey scope (the ‘target population’ of interest) and units. When planning a survey, it is important to define the target population to be covered. For instance, is information required for both urban and rural areas? In some countries, ICT penetration is very low in rural areas – some might not have electricity – and therefore it may be both unnecessary and not feasible to survey the rural population about their access to ICT.28 It may be very expensive to survey some populations, for instance, those living in remote locations, so decisions need to be made at the planning stage about such populations.29 In respect of individuals, are there age scope considerations, for instance, is there a particular interest in children – or older people? Chapter 7 covers scope and units in some detail. • Classificatory data required. If users require detailed breakdowns by particular characteristics (for example, age of individuals, geographic area, labour force status, gender or educational attainment), then this needs to be established at the planning stage as it may have implications for sample design and size (and therefore cost). Classifications and other statistical standards are considered in Chapter 4. • Survey design. Survey design issues and procedures include availability or development of a survey frame, decisions on data sources and data collection techniques, sample design according to the available budget and output requirements, and questionnaire design and testing. These issues are examined in chapters 5, 6 and 7. • Survey implementation issues. Survey implementation issues and procedures include development and testing of computer systems (for all stages of the survey cycle), consideration of skills and training required, data collection, data processing requirements and methods. These issues are mainly covered in chapters 5 and 8. • Post survey processes. Post survey processes include data tabulation and dissemination, metadata dissemination and evaluation. These are very important elements of the survey process, especially as they are the most visible to users. Post survey processes are mainly covered in chapters 9 and 10. 39. A likely outcome of the planning phase is that priorities will be reassessed and changes made to aspects of the survey, such as its purpose and objectives, and subsequent stages such as survey design. 40. Many developing economies are in the process of preparing National Strategies for the Development of Statistics (NSDS), which are short-term or medium-term programming instruments in the national statistical system. Countries in this situation should consider the explicit inclusion of ICT surveys in NSDS in order to ensure coordination with other household surveys and sustainability over time. Budget and management issues 41. It is rarely possible to achieve good results without significant cost but it is certainly possible to incur significant project costs and yet obtain poor quality results. Having an experienced and knowledgeable project manager and paying careful attention to planning for every phase before commencing the operational phase will generally be very cost effective. 28 If electricity is not available, it is unlikely that most ICTs are widely used there (the possible exception to this is the mobile phone). However, note the importance of providing available data and metadata in relation to the non availability of ICT services in unsurveyed areas. Some data dissections, such as urban/rural, are important for measuring the digital divide and where a survey measure is not available, an alternative based on other data (for instance, infrastructure data) could be included in the data dissemination. It is also very important to document any scope limitations so that users are able to make relevant comparisons. This subject is further dealt with in Chapter 10. 29 Manual for Measuring ICT Access and Use by Households and Individuals 14 Chapter 3. Planning and preparation for ICT household surveys 42. It is necessary, at the outset, to itemize and estimate costs associated with the survey. A draft budget sheet has been developed by UNSD30 and could be adapted by countries based on their own costing data. 43. Budgeting needs to be carried out carefully in order to avoid the most common difficulties, which include: • Underestimating known costs (for instance, because allowance is not made for things going wrong and therefore staff resources required are underestimated); • Omitting some costs (for example, costs of unexpected publicity); and • Ignoring or underestimating overhead costs (these can be significant and will include direct and indirect overhead costs).31 44. Given the likelihood of delays, it is useful to include some extra budget (and other resources such as staff time) for unforeseen events or delays. 45. Mechanisms to reduce costs should be considered and include: • Use of ‘economies of scale’, for instance, including ICT questions in a larger survey (it is usually cheaper to include a number of questions in a single household survey, as a few extra questions represent a relatively small part of the total cost), and • Use of technology to reduce costs, for instance, several European countries use call centres and computer assisted telephone interviewing (CATI) to conduct ICT household use surveys. Of course, careful consideration of other factors is necessary, for instance, the costs of computer systems development and maintenance, and any bias issues associated with telephone surveys. 46. Often trade-offs are required to fit the survey to the available financial and other resources. Trade-offs could include a reduction in sample size (usually resulting in larger sampling error), removal of some level of detail, or removal of some questions or topics. Ideally, such decisions would be made together with policymakers and other major data users to ensure that their data needs are still adequately addressed. Other preparatory work 47. Preparatory work covers a range of activities and arguably continues throughout the survey cycle. Planning and budget issues were discussed above. In subsequent chapters, we will look at data sources, collection methods, questionnaire design and survey design. In this chapter, we look at staff training which is only discussed briefly in other parts of the Manual. Staff training and selection 48. It can be seen from the information presented above that staff with diverse skills and expertise will be required for different aspects of the survey. Skills relevant to the following areas will be required: survey management, computer systems development, interviewing, data entry, data editing, data manipulation and publication writing.32 In many statistical agencies, some of 30 See UNSD (2005a, Chapter IV). Direct overhead costs are those that are proportional to units used (e.g. staff salary overheads such as contributions to pension funds). Indirect overhead costs are those that are not proportional to units used but may be significant at a ‘whole of organization’ level. They include things like building costs. 32 The last is quite a specialized skill, needing general writing ability as well as an understanding of data and an ability to describe and interpret data clearly and unambiguously. 31 Manual for Measuring ICT Access and Use by Households and Individuals Chapter 3. Planning and preparation for ICT household surveys 15 these skills will be centralized, for example, computer programmers and data entry staff may work in distinct departments within the organization. 49. Staff selection and training will run parallel with survey planning, questionnaire design and sample selection. It will often be a phased activity, for instance, staff involved in establishing the survey are likely to be employed first. While specialized staff may be available in an organization, they will usually need to be trained on the specifics of the survey. 50. It is better to make training an inclusive activity. For instance, interviewers and their supervisors often have valuable ideas for the operational phases of the survey and will be more committed to a quality result if they have had some involvement in documentation and the setting of field procedures. 51. While many staff involved in a particular survey will be skilled and will require minimal training, others may need significant training. Of particular importance is the training of interviewers, some of whom may be inexperienced. An important cause of bias is poor handling of respondents by interviewers, for instance, asking leading questions or suggesting some judgement of responses (for instance, by their tone of voice or facial expression). Training and briefings, as well as survey material, should be focused on avoiding such problems. Elements of training may include classroom training, interviewer manuals and field work in the presence of experienced interviewers or supervisory staff. 52. It is important that staff involved in a particular process (for example, data collection) receive the same, or similar, training to avoid bias. 53. The performance of all staff should be monitored closely, especially in the early stages of the survey. Any instances of underperformance, or behaviour that might induce statistical bias, need to be addressed as quickly as possible. 54. Given that some questions on ICT access and use are somewhat technical, it could be advantageous to employ people who are more attuned to ICT, for instance young adults and people with proven ICT skills. Clearly also, it is important to provide training in the ICT concepts and terms used in questionnaires.33 55. A most important pre-requisite for training is the availability of training and/or procedures manuals for each broad class of staff – interviewers, supervisors and data entry staff. Such manuals should be prepared before the survey commences and may continue to be useful references during the survey. Training manuals should clearly explain the purpose of the survey and be quite explicit about tasks to be performed by staff.34 33 34 Some technical definitions are included in the revised core list of indicators, see Table 2 and Partnership (2009). UNSD (2005a, Chapter IV) discusses this in more detail. Manual for Measuring ICT Access and Use by Households and Individuals Chapter 4. Statistical standards and measurement topics for ICT household statistics Chapter 4. 17 Statistical standards and measurement topics for ICT household statistics 56. Survey planning can be simplified, and output improved, by the use of national and international standards covering model questions, concepts, units, scope, definitions and classifications. In respect of ICT statistics, the standards described in this Manual are both specific and general. Specific standards are those recommended by the Partnership on Measuring ICT for Development (and endorsed by the United Nations Statistical Commission). General standards include methodological recommendations and classifications for labour force status, occupation, educational attainment and age groups. 57. Adherence to both specific and general standards governing ICT statistics should be a primary aim and will ensure that collected data have maximum usefulness and are as comparable as possible with the output of other countries. In a national context, use of standards may also enable comparability with other datasets and with historical data. 58. In this chapter, we will consider specific standards pertaining to ICT household statistics and relevant international classifications. Methodological standards, such as survey procedures, scope and statistical units are discussed in the following chapters. Core ICT household indicators 59. The core list of indicators was formally released by the Partnership in 2005 as Core ICT Indicators (Partnership, 2005). The list was revised in 2008 to improve international comparability and relevance (Partnership, 2009). The revised list can be found in Annex 1. With respect to the household and individual indicators, most of the changes in 2008 were amendments to concepts and definitions; other changes were made to response categories of some indicators (location of use, Internet activities, means of Internet access and frequency of use). 60. There are 12 ICT household indicators plus one household reference indicator. The main purpose of the core list is to assist countries to produce high quality and internationally comparable ICT household statistics. As we have seen, the indicators have associated standards and metadata including definitions, model questions, classificatory variables, scope and statistical units. 61. To simplify understanding, the indicators are separated into the access indicators applying at the household level and the use indicators applying to individuals. The indicators, with associated model questions and definitions, are shown in Table 2. Household ICT access indicators 62. Indicators HH1–HH4, HH6 and HH11 refer to access of the household to ICT equipment and services, not to use of those products by individual household members. In order for a household to have access to ICT equipment or services, it should be able to be used, that is, equipment is in working condition, or expected to be returned to that condition soon. ICT services (Internet access and mobile phone service) should be in operation, or expected to be returned to that condition soon. Manual for Measuring ICT Access and Use by Households and Individuals 18 Chapter 4. Statistical standards and measurement topics for ICT household statistics 63. The access indicators are presented as the proportion of households with [equipment, Internet access]. With the exception of HH11, indicator values are calculated by dividing the number of in-scope households with [equipment, Internet access] by the total number of inscope households. For HH11 (Internet access by type), output for each type of Internet access category (narrowband, fixed broadband and mobile broadband) should generally be presented as a proportion of households with the Internet. 64. Sub-indicators can be constructed using the classificatory variables, household composition and size. These are detailed later in this chapter. Individual ICT use indicators 65. Indicators HH5, HH7–HH10 and HH12 refer to use of ICT equipment and services by individual household members. The suggested reference period35 is the last 12 months. 66. Three individual use indicators (HH5, HH7 and HH10) are presented as the proportion of individuals who used [equipment, Internet access] in the last 12 months. The other three indicators (HH8, HH9 and HH12) break down Internet use (by location, Internet activities undertaken and frequency of use respectively). 67. Indicator values for HH5, HH7 and HH10 are calculated by dividing the number of inscope individuals using [equipment, Internet access] by the total number of in-scope individuals. For HH8 (location of use), HH9 (Internet activities undertaken) and HH12 (frequency of use), output may be calculated as either the proportion of in-scope individuals or the proportion of individuals using the Internet. Chapter 8 provides further information on the calculation of the core indicators. 68. Sub-indicators can be constructed using the classificatory variables associated with the core indicators: age, gender, education, labour force status and occupation. These are detailed later in this chapter, along with other possible classifications (for example, geographic classifications). 35 Reference period is the time period referred to in the survey when asking about individual use of ICT. The core ICT indicators standards and this Manual recommend a 12-month reference period. Country practices vary, but ideally, reference periods should be aligned in order to obtain comparable data. Manual for Measuring ICT Access and Use by Households and Individuals Chapter 4. Statistical standards and measurement topics for ICT household statistics 19 Table 2. Core indicators on access to, and use of, ICT by households and individuals Indicator HH1 Proportion of households with a radio Suggested model question: Does any member of this household/do you36 have a radio at home? HH2 Proportion of households with a TV Suggested model question: Does any member of this household/do you have a television at home? HH3 Definitions and notes The proportion of households with a radio is calculated by dividing the number of in-scope households with a radio by the total number of in-scope households. A radio is a device capable of receiving broadcast radio signals, using popular frequencies, such as FM, AM, LW and SW. It includes a radio set integrated in a car or an alarm clock but excludes radios integrated with a mobile phone, a digital audio player (MP3 player) or in a computer. The proportion of households with a TV is calculated by dividing the number of in-scope households with a TV by the total number of in-scope households. A TV (television) is a stand-alone device capable of receiving broadcast television signals, using popular access means such as over-the-air, cable and satellite. It excludes TV functionality integrated with another device, such as a computer or a mobile phone. Proportion of households with telephone The proportion of households with telephone (fixed or mobile) is calculated by dividing the number of in-scope households with a telephone (fixed or mobile) by the total number of in-scope households. Proportion of households with fixed telephone only The proportion of households with fixed telephone only is calculated by dividing the number of in-scope households with a fixed telephone only by the total number of in-scope households. A fixed telephone line refers to a telephone line connecting a customer's terminal equipment (e.g. telephone set, facsimile machine) to the public switched telephone network (PSTN) and which has a dedicated port on a telephone exchange. This term is synonymous with the terms main station or Direct Exchange Line (DEL) that are commonly used in telecommunication documents. It may not be the same as an access line or a subscriber. Suggested model question: Does this household have a fixed line telephone at home? Proportion of households with mobile cellular telephone only Suggested model question: Does any member of this household/do you have a mobile telephone at home? The proportion of households with mobile cellular telephone only is calculated by dividing the number of in-scope households with a mobile cellular telephone only by the total number of in-scope households. A mobile cellular telephone refers to a portable telephone subscribing to a public mobile telephone service using cellular technology, which provides access to the PSTN. This includes analogue and digital cellular systems, as well as IMT-2000 (3G). Users of both post-paid subscriptions and pre-paid accounts are included. Proportion of households with both fixed and mobile cellular telephone HH4 Proportion of households with a computer Suggested model question: Does any member of this household/do you have a computer at home, regardless of whether it is used? HH5 36 The proportion of households with a computer is calculated by dividing the number of in-scope households with a computer by the total number of inscope households. A computer refers to a desktop or a laptop computer. It does not include equipment with some embedded computing abilities such as mobile cellular phones, personal digital assistants (PDAs) or TV sets. Proportion of individuals who used a The proportion of individuals who used a computer is calculated by dividing computer (from any location) in the the total number of in-scope individuals who used a computer from any last 12 months location in the last 12 months by the total number of in-scope individuals. A computer refers to a desktop or a laptop computer. It does not include Suggested model question: Have equipment with some embedded computing abilities such as mobile cellular you used a computer from any phones, personal digital assistants or TV sets. location in the last 12 months? The term ‘do you’ is included to cover single person households. It does not refer to individual activities. Manual for Measuring ICT Access and Use by Households and Individuals 20 HH6 Chapter 4. Statistical standards and measurement topics for ICT household statistics Indicator Definitions and notes Proportion of households with Internet access at home The proportion of households with Internet access at home is calculated by dividing the number of in-scope households with Internet access by the total number of in-scope households. The Internet is a world-wide public computer network. It provides access to a number of communication services including the World Wide Web and carries e-mail, news, entertainment and data files, irrespective of the device used (not assumed to be only via a computer − it may also be by mobile phone, PDA, games machine, digital TV etc.). Access can be via a fixed or mobile network. Suggested model question: Does any member of this household/do you have Internet access at home, regardless of whether it is used? HH7 The proportion of individuals who used the Internet is calculated by dividing Proportion of individuals who used the Internet (from any location) in the the total number of in-scope individuals who used the Internet (from any location) in the last 12 months by the total number of in-scope individuals. last 12 months The Internet is a world-wide public computer network. It provides access to a number of communication services including the World Wide Web and Suggested model question: Have carries e-mail, news, entertainment and data files, irrespective of the device you used the Internet from any used (not assumed to be only via a computer − it may also be by mobile location in the last 12 months? phone, PDA, games machine, digital TV etc.). Access can be via a fixed or mobile network. HH8 Location of individual use of the Internet in the last 12 months Suggested model question: Where did you use the Internet in the last 12 months? (select all that apply)37 The proportion of individuals who used the Internet at each location can be calculated as either: the proportion of in-scope individuals or the proportion of Internet users, using the Internet at each location. Access to the Internet is not assumed to be only via a computer − it may also be by mobile phone, PDA, games machine, digital TV etc. Individuals should be asked about all locations of Internet use (that is, the survey question used by countries should specify multiple responses). Note that, except for mobile access, the locations are associated with the equipment used e.g. a PC installed at work or at an Internet café. Home 37 Work Where a person’s workplace is located at his/her home, then he/she would answer yes to the home category only. Place of education For students. Teachers (and others who work at a place of education) would report ‘work’ as the place of Internet use. Where a place of education is also made available as a location for general community Internet use, such use should be reported in the Community Internet access facility category. Another person’s home The home of a friend, relative or neighbour. Community Internet access facility Internet use at community facilities such as public libraries, publicly provided Internet kiosks, non-commercial telecentres, digital community centres, post offices, other government agencies; access is typically free and is available to the general public. Commercial Internet access facility Internet use at publicly available commercial facilities such as Internet or cyber cafés, hotels, airports etc, where access is typically paid (i.e. not free of charge). Any place via a mobile cellular telephone Use of the Internet at any location via a mobile cellular telephone (including handheld devices with mobile phone functionality). Any place via other mobile access devices Use of the Internet at any location via other mobile access devices, e.g. a laptop computer or handheld device that uses wireless access (at a WiFi ‘hotspot’) or a laptop computer connected to a mobile phone network. Some countries may ask about location of use as a series of yes/no questions, each referring to one location of use. Manual for Measuring ICT Access and Use by Households and Individuals Chapter 4. Statistical standards and measurement topics for ICT household statistics Indicator HH9 Internet activities undertaken by individuals in the last 12 months (from any location) Suggested model question: For which of the following activities did you use the Internet for private purposes in the last 12 months (from any location)? (select all that apply)38 21 Definitions and notes The proportion of individuals who undertook each activity can be calculated as either: the proportion of in-scope individuals or the proportion of Internet users who undertook each activity. Note that these activities are restricted to private purposes and therefore exclude activities such as purchasing over the Internet undertaken as part of a person’s job. Individuals should be asked about all Internet activities (that is, the question used by countries should specify multiple responses). Activities are not mutually exclusive. Access to the Internet is not assumed to be only via a computer − it may also be by mobile phone, PDA, games machine, digital TV etc. Getting information about goods or services Getting information related to health or health services Includes information on injury, disease, nutrition and improving health generally. Getting information from general government organizations General government organizations should be consistent with the SNA93 (2008 revision) concept of general government. According to the SNA “… the principal functions of government are to assume responsibility for the provision of goods and services to the community or to individual households and to finance their provision out of taxation or other incomes; to redistribute income and wealth by means of transfers; and to engage in non-market production.” (General) government organizations include central, state and local government units. Interacting with general government organizations Includes downloading/requesting forms, completing/lodging forms on line, making on-line payments and purchasing from government organizations. It excludes getting information from government organizations. General government organizations should be consistent with the SNA93 (2008 revision) concept of general government. According to the SNA “… the principal functions of government are to assume responsibility for the provision of goods and services to the community or to individual households and to finance their provision out of taxation or other incomes; to redistribute income and wealth by means of transfers; and to engage in non-market production.” (General) government organizations include central, state and local government units. Sending or receiving e-mail 38 Telephoning over the Internet/VoIP Using Skype, iTalk, etc. Includes video calls (via webcam). Posting information or instant messaging Posting messages or other information to chat sites, blogs, newsgroups, on-line discussion forums and similar; use of instant messaging. Purchasing or ordering goods or services Refers to purchase orders placed via the Internet whether or not payment was made on line. Orders that were cancelled or not completed are excluded. Includes purchasing of products such as music, travel and accommodation via the Internet. Internet banking Includes electronic transactions with a bank for payment, transfers, etc. or for looking up account information. Excludes electronic transactions via the Internet for other types of financial services such as share purchases, financial services and insurance. Some countries may ask about Internet activities as a series of yes/no questions, each referring to one activity. Manual for Measuring ICT Access and Use by Households and Individuals 22 Chapter 4. Statistical standards and measurement topics for ICT household statistics Indicator HH9 Internet activities undertaken by individuals in the last 12 months (from any location) (continued) Education or learning activities Playing or downloading video games or computer games Downloading movies, images, music, watching TV or video, or listening to radio or music Downloading software Reading or downloading on-line newspapers or magazines, electronic books HH10 HH11 Definitions and notes Refers to formal learning activities such as study associated with school or tertiary education courses as well as distance education involving on-line activities. (A more narrow interpretation is likely to be less meaningful as it could include a range of activities such as using the Internet to search for information.) Includes file sharing games and playing games on line, either paid or free of charge. Includes file sharing and using web radio or web television, either paid or free of charge. Includes downloading of patches and upgrades, either paid or free of charge. Includes accessing news websites, either paid or free of charge. Includes subscriptions to on-line news services. Proportion of individuals with use of The proportion of individuals with use of a mobile cellular telephone is calculated by dividing the total number of in-scope individuals with use of a a mobile cellular telephone mobile cellular telephone by the total number of in-scope individuals. Suggested model question: Did you A mobile cellular telephone refers to a portable telephone subscribing to a public mobile telephone service using cellular technology, which provides have use of a mobile telephone access to the PSTN. This includes analogue and digital cellular systems, as during some or all of the last well as IMT-2000 (3G). Users of both post-paid subscriptions and pre-paid 12 months? accounts are included. Use of a mobile cellular telephone does not mean that the telephone is owned or paid for by the person but should be reasonably available through work, a friend or family member, etc. It excludes occasional use, for instance, borrowing a mobile phone to make a call. Proportion of households with This indicator should be calculated as the proportion of in-scope access to the Internet by type of households with Internet access that use each type of access service, for access (narrowband, broadband instance, the proportion of households with Internet access that use a (fixed, mobile)) broadband service as their means of access. It is expected that countries will collect data at a finer level than shown here. The categories chosen by countries should allow aggregation to total Suggested model question: What narrowband and total broadband, as well as to fixed and mobile broadband, type/s of Internet access services as defined below. are used for Internet access at As households can use more than one type of access service, multiple home? (select all that apply)39 responses are possible. Narrowband Narrowband includes analogue modem (dial-up via standard phone line), ISDN (Integrated Services Digital Network), DSL at speeds below 256 kbit/s, and mobile phone and other forms of access with an advertised download speed of less than 256 kbit/s. Note that narrowband mobile phone access services include CDMA 1x (Release 0), GPRS, WAP and i-mode. Fixed broadband Fixed broadband refers to technologies at speeds of at least 256 kbit/s, in one or both directions, such as DSL (Digital Subscriber Line), cable modem, high speed leased lines, fibre-to-the-home, powerline, satellite, fixed wireless, Wireless Local Area Network and WiMAX. 39 It is probable that countries will include more detailed categories in national questionnaires. These would reflect services available in the country. The model questionnaire at Annex 2 suggests the categories: Analogue modem, ISDN, DSL, cable modem and mobile broadband. Manual for Measuring ICT Access and Use by Households and Individuals Chapter 4. Statistical standards and measurement topics for ICT household statistics Indicator HH11 HH12 23 Definitions and notes Proportion of households with access to the Internet by type of access (narrowband, broadband (fixed, mobile)) (continued) Mobile broadband Mobile broadband refers to technologies at speeds of at least 256 kbit/s, in one or both directions, such us Wideband CDMA (W-CDMA), known as Universal Mobile Telecommunications System (UMTS) in Europe; Highspeed Downlink Packet Access (HSDPA), complemented by High-Speed Uplink Packet Access (HSUPA); CDMA2000 1xEV-DO and CDMA 2000 1xEV-DV. Access can be via any device (handheld computer, laptop or mobile cellular telephone etc.). Frequency of individual use of the Internet in the last 12 months (from any location) The frequency of individual use of the Internet can be calculated as either: the proportion of in-scope individuals or the proportion of Internet users, using the Internet with each frequency. Suggested model question: How It is recommended that countries collect this information in respect of a typical period; therefore, respondents should ignore weekends (if they only use the Internet at work) and breaks from their usual routine, such as holidays. often did you typically use the Internet during the last 12 months (from any location)? At least once a day Access to the Internet is not assumed to be only via a computer − it may also be by mobile phone, PDA, games machine, digital TV etc. Once a working day for respondents who only (or most frequently) use the Internet from work At least once a week but not every day Less than once a week Reference indicator HHR1 Proportion of households with electricity Electricity is not an ICT commodity, but is an important prerequisite for using many ICTs. It is therefore included in the core list as a reference indicator. Suggested model question: Does the dwelling in which this household resides have access to electricity? Electricity access may be by a grid/mains connection, or from power generated locally (including at the dwelling). Local power includes electricity generated by a fuel-powered generator, or from renewable resources such as wind, water or solar. It excludes sole use of energy storage devices, such as batteries (though these may be used to store electricity from other sources). Source: Core ICT Indicators, Partnership on Measuring ICT for Development (2005), “Revisions and Additions to the Core List of ICT Indicators” (Partnership, 2009). Classificatory variables for ICT household statistics 69. The metadata associated with the core indicators include a set of classificatory variables, with relevant categories. Data for these variables would usually be collected as part of the survey that collects ICT data, or less commonly, are available from the survey frame. Manual for Measuring ICT Access and Use by Households and Individuals 24 Chapter 4. Statistical standards and measurement topics for ICT household statistics Household characteristics 70. There are two household characteristics variables as follows: • Household composition (households with children and households without children under 1540) and • Household size (number of household members, including those outside the age scope). Individual characteristics 71. There are several individual characteristics variables, with categories based on international standards. They are: age, gender (male and female), highest education level received, labour force status and occupation. Age 72. Age is a strong determinant of ICT use so a common age cut-off and categories are important. It is recommended to use as a minimum the following equal-sized ranges: 15 to 24; 25 to 34; 35 to 44; 45 to 54; 55 to 64 and 65 to 74.41 Countries are encouraged to collect data for other age groups, in particular, children. Four additional age ranges outside the minimum recommended age ranges are: 1 to 4, 5 to 9, 10 to 14 and 75 and over. These should be used where the age scope permits. 73. These ranges are consistent with UNSD recommendations on age ranges of individuals, which are: under 1 year; 1-4 years; 5-9 years; 10-14 years; 15-19 years; 20-24 years; 25-29 years; 30-34 years; 35-39 years; 40-44 years; 45-49 years; 50-54 years; 55-59 years; 60-64 years; 65-69 years; 70-74 years; 75-79 years; 80-84 years; 85-89 years; 90-94 years; 95-99 years; and 100 years and over.42 Highest education level received 74. Categories are based on the United Nations Educational, Scientific and Cultural Organization (UNESCO) International Standard Classification of Education (ISCED97) (UNESCO, 1997). Categories are: Primary education or lower (no formal education, pre-primary (ISCED 0) or primary education (ISCED 1)); Lower secondary education (ISCED 2); Upper secondary or post-secondary non-tertiary (ISCED 3 and 4); and Tertiary (ISCED 5 and 6). ISCED97 levels are as follows:43 75. Level 0: Pre-primary education; Level 1: Primary education or first stage of basic education; Level 2: Lower secondary or second stage of basic education; Level 3: Upper secondary education; Level 4: Post-secondary non-tertiary education; 40 The age standard as specified in 2005 (in Partnership, 2005) was originally 16 years of age, but was changed for consistency with the UN age range standard, and the practices of a number of countries. 41 The ‘youth’ age standard as specified in 2005 (in Partnership, 2005) was 16-24 years per recommendations made by OECD and Eurostat for their model surveys. This has been revised to conform with UN standards and the practices of a number of countries. Countries which use 16 (or, less commonly, 18) as their lowest age should report on that basis but note the difference in survey metadata. 42 Principles and Recommendations for Population and Housing Censuses Revision 2 (UNSD, 2008a). 43 See http://www.uis.unesco.org/ev.php?ID=3813_201&ID2=DO_TOPIC for details. Manual for Measuring ICT Access and Use by Households and Individuals Chapter 4. Statistical standards and measurement topics for ICT household statistics 25 Level 5: First stage of tertiary education (not leading directly to an advanced research qualification); and Level 6: Second stage of tertiary education (leading to an advanced research qualification). Labour force status 76. Categories used for the core ICT indicators are based on the International Labour Organization (ILO) International Classification of Status in Employment (ICSE-93)44 and are: Paid employee; Self-employed; Unemployed; and Not in the labour force.45 77. The ICSE-93 categories map to the Partnership core indicators categories for those in the labour force.46 The category self-employed includes the ICSE-93 categories: employers, own account workers, members of producers' cooperatives and contributing family workers. The category not in the labour force includes individuals who are not economically active, that is those who are neither employed nor unemployed. They mainly consist of students (except those who also have a job), people undertaking home duties only, and those who are retired or sick. Occupation 78. Categories should be based on ISCO major groups (where possible). 47 The major groups for the 1988 and the 2008 versions of ISCO are shown in Table 3. Table 3. ISCO major groups: 1988 and 2008 Major group 1 2 3 4 5 6 7 8 9 0 1988 (ISCO-88) Legislators, senior officials and managers Professionals Technicians and associate professionals Clerks Service workers and shop and market sales workers Skilled agricultural and fishery workers Craft and related trades workers Plant and machine operators and assemblers Elementary occupations Armed forces 2008 (ISCO-08) Managers Professionals Technicians and associate professionals Clerical support workers Service and sales workers Skilled agricultural, forestry and fishery workers Craft and related trades workers Plant and machine operators, and assemblers Elementary occupations Armed forces occupations Source: ILO, http://www.ilo.org/public/english/bureau/stat/isco/isco88/publ4.htm and for details of ISCO-08, see http://www.ilo.org/public/english/bureau/stat/isco/docs/resol08.pdf. 79. ISCO (the International Standard Classification of Occupations) is maintained by the ILO, which defines an occupation as a “set of jobs whose main tasks and duties are characterized by a high degree of similarity”. A person may be associated with an occupation through the 44 The ICSE-93 consists of the following six categories: employees; employers, own account workers, members of producers’ cooperatives, contributing family workers, and workers not classifiable by status. 45 This category is not a component of the ICSE-93. 46 With the exception of the ICSE category, workers not classifiable by status. 47 For more information on ISCO, see http://www.ilo.org/public/english/bureau/stat/isco/index.htm. The 1988 version (ISCO-88) is currently being updated and is being released as ISCO-08. Manual for Measuring ICT Access and Use by Households and Individuals 26 Chapter 4. Statistical standards and measurement topics for ICT household statistics main job currently held, a second job or a job previously held.48 ISCO-88 is to be replaced by ISCO-08. At the level of interest for ICT statistics (the major group level), the changes are minor and unlikely to affect time series. Cross-classification of variables 80. In terms of output, many countries will want to cross-classify some of the above variables (for instance, age by gender49). This can produce information that is very useful for analytical purposes. However, it should be noted that cross-classified output is usually quite detailed and would therefore require higher sample sizes to support reliable estimates. Cross-classification is more likely to be feasible for indicators such as individual use of the Internet. Other classificatory variables 81. For many developing economies, there are socio-economic problems that create barriers to access to, and use of, ICT. These problems are diverse and broadly cover lack of opportunity and lack of ability. They include illiteracy and other linguistic limitations, socio-cultural barriers, lack of ICT and other skills, lack of confidence or awareness, lack of ICT access facilities, geographical disadvantages (for example, those of remote communities) and low income. Some classificatory variables that might address these issues are briefly discussed below. 82. Countries that have a notable rural/urban divide or a strong regional structure (for example, federal states) may be interested in a geographical classification. For many countries, an income variable will also be of interest. Because both variables are problematic from a collection and international comparability viewpoint, they are not included as recommended classificatory variables for the ICT indicators. However, because of their policy relevance they are described in this Manual. Countries are encouraged to include geographic and income classificatory variables if they are able to, as the output can provide very useful policy information. 83. The complexity of geographic classifications is illustrated by the Australian approach (see Box 3). Box 3. Australia: geographical classification used in ICT household survey The Australian Bureau of Statistics uses a remoteness classification based on six classes of Remoteness Area as follows: y y y y y y Major Cities of Australia, Inner Regional Australia, Outer Regional Australia, Remote Australia, Very Remote Australia and Migratory. Remoteness is calculated using road distance to the nearest Urban Centre in each of five classes based on population size. The key element in producing the structure is the preparation of the Accessibility/Remoteness Index of Australia (ARIA+) grid. ARIA+ scores are first calculated for each Urban Centre and are then interpolated to create a 1 km grid covering the whole of Australia. Each grid square carries a score of remoteness from an index of scores ranging from 0 (zero) through to 15. Remoteness Areas are created by averaging the ARIA+ scores within Census Collection Districts (CDs), then aggregating the CDs up into the 6 Remoteness Area categories based on the averaged ARIA+ score. Source: ABS (2007). 48 According to the ILO, the basic criteria used to define the system of major, sub-major, minor and unit groups are the “skill level” and “skill specialization” required to competently perform the tasks and duties of the occupations. 49 For examples of such cross-classifications, see ITU (2008b). Manual for Measuring ICT Access and Use by Households and Individuals Chapter 4. Statistical standards and measurement topics for ICT household statistics 27 84. The variables, ‘household income’ and ‘individual income’, are regarded as important classificatory variables because of the strong correlation between income and access to/use of ICT. However, income of households and individuals is difficult to measure and there is a diversity of approaches typically used by statistical agencies (household/ individual, monthly/ annual, gross/ net etc). Eurostat adopted a quartile approach for measuring household income from 2006. It entails either collecting income in ranges corresponding to quartiles (based on other survey data) or collecting income data in other ways and converting them to quartiles for output purposes. It is expected that the quartile approach would allow better comparability between countries choosing to use this classificatory variable (and within a country, possibly better comparability over time). UNECLAC has adopted quintiles of household per capita income for surveys by countries of Latin America and the Caribbean (LAC).50 As most of the LAC household surveys that include ICT questions have also collected information on household income, it is possible to compare differences in the domestic income divide.51 85. Extra individual classifications on socio-demographic/cultural characteristics might also be of interest. They include level of literacy, ethnicity, languages spoken, language skills, disability status and ICT skills.52 Other measurement topics related to ICT household statistics 86. The core list of household indicators is a starting point for collection of data on ICT. Many countries will have information needs for policy purposes that are not satisfied by the Partnership indicators. A glance at the OECD and Eurostat model questionnaires (OECD, 2009; Eurostat 2007), shows that there are many topics of interest beyond those covered by the core indicators. This section outlines additional topics that countries may wish to measure in addition to those required to construct the core indicators. Much of the discussion in this section is based on work by the OECD’s Working Party on Indicators for the Information Society. For a more detailed discussion, readers are referred to the OECD Guide (OECD, 2009), Chapter 6 and annexes 1d and 5. E-commerce 87. For individual members of households, e-commerce presents an alternative method of purchasing (and increasingly selling) goods and services for private use. According to the longstanding OECD statistical standard for measuring e-commerce, it is the method by which an order is placed or received, rather than the payment or channel of delivery, which determines whether a transaction is an e-commerce transaction. OECD member countries have endorsed narrower (Internet) and broader (other computer-mediated networks) definitions of ecommerce. 88. The main interest in e-commerce measurement for the household sector is in use of the Internet for purchasing rather than selling transactions. This can provide useful information on, for example, business-to-consumer e-commerce, often not obtained through business surveys. Surveys of ICT use in households may collect information on individual purchasing activity via the Internet, with details including the nature of goods and services purchased, the monetary value of those purchases, the monetary value of on-line payments and/or barriers to purchasing over the Internet. 50 UNECLAC (2007). See UNECLAC (2009) OSILAC ICT Statistical Information System (www.cepal.org/tic/flash). 52 Of particular interest is the use of such categories to identify non-users. According to UNECLAC, variables like ethnicity and language spoken are relevant for ICT access discrimination in some Latin American countries. 51 Manual for Measuring ICT Access and Use by Households and Individuals 28 Chapter 4. Statistical standards and measurement topics for ICT household statistics 89. There are both conceptual and data collection challenges associated with e-commerce measurement. For example, in respect of individuals reporting the value of Internet purchases, there are issues of understanding the definition of e-commerce (for instance, distinguishing purchases from payments 53 ) and the small volume of e-commerce activity (which has implications for the size of sampling error). In addition, there are recall issues for respondents in relation to the value of e-commerce purchases (that is, they may not be able to report reliable information on the value of those purchases). Indeed, as such Internet transactions become more common, the recall problem is likely to worsen.54 E-security: trust in the on-line environment 90. The question of trust in the on-line environment is an important one from a policy point of view, as lack of trust potentially impedes the uptake of ICT by individuals and other entities, such as businesses. Both the OECD and Eurostat have made attempts to measure trust via their model surveys of household ICT access/use and the efforts of member countries. 55 However, evidence indicates that it presents difficult measurement challenges. Problems include the difficulties of asking individuals about IT security in terms of: the incidents they have encountered, what action they take to protect themselves and whether the computer they use at home is protected. Anecdotal evidence indicates that respondents have difficulty responding to such technical questions. The social and economic impacts of ICT access and use by households and individuals 91. There has been relatively little data collection and analytical work done on the impacts of ICT access and use by households and individuals. However, the availability of ICT has obviously changed – and will continue to change – the types of jobs people do, how they work (for instance, teleworking), how they communicate with others, how they access commercial and government services, and what they do in their leisure time. 92. In respect of social statistics, the following ideas for impact measurement have been suggested (OECD, 2007): • Include perception questions in social surveys (for example, asking people how the Internet has affected their lives); • Use of standard time use and household expenditure survey methodologies and classifications in the area of ICT measurement, in order to find out how much time people are spending using ICT (and how this is changing) and how much money they are spending on ICT compared with other goods and services; and • Collection of statistics on ‘teleworking’ and other changes in work patterns that are driven by ICT; such data can be collected from specific ICT use surveys or via labour force surveys. Barriers to ICT access or use 93. For many developing economies, there are significant barriers to access to, and use of, ICT. Consideration could be given to including one or more household or individual barrier 53 Following the OECD definition, an e-commerce purchase occurs where an individual buys or orders a good or service on line, irrespective of the method of payment (and whether the payment is made on line or off line). A payment that occurs on line without the ordering of a good or service (e.g e-banking) is not regarded as e-commerce. 54 OECD countries vary in their collection efforts in this area, with an obvious trend being that fewer are collecting the value of Internet purchases (driven, in large part, because of changes to Eurostat’s model household survey of 2006, where the question on value of Internet purchases was removed). The 2005 OECD model survey nominated the value of Internet purchases as a non-core question, reflecting both the direction of Eurostat and the difficulty respondents have to recall the value of purchases. 55 Several questions (and parts of questions) in the OECD 2005 model questionnaire deal with the topic of trust in the on-line environment. The questions concern the issue of IT security (questions 8, 15 and 16) and privacy, security or trust as barriers (questions 5 and 23). See OECD (2009), Annex 1d. Manual for Measuring ICT Access and Use by Households and Individuals Chapter 4. Statistical standards and measurement topics for ICT household statistics 29 questions in ICT household questionnaires. Box 4 shows barriers to household Internet access identified by Singapore in its 2007 Infocomm Usage Survey (IDA, 2007). Box 5 shows the Internet use barriers question used by Nicaragua in 2007. Box 6 shows Eurostat’s 2007 model question on barriers to more extensive use of ICT by individuals. The OECD 2005 model questionnaire has two barriers questions – household Internet access and individuals’ barriers to purchasing over the Internet (OECD, 2009). Such questions could be adapted, based on perceived barriers present in countries. Box 4. Singapore: barriers to household Internet access Main reason for not having Internet access at home: Population: households without access to the Internet at home Lack of interest/no need Lack of knowledge/skills/confidence Have access to Internet elsewhere Costly equipment costs Subscription to the Internet is too costly Concern about exposure to inappropriate or harmful content Other Source: IDA (2007). Box 5. Nicaragua: measuring barriers to individual use of the Internet The National Institute of Development Information (INIDE) of Nicaragua included an ICT module in the Labour Force survey (Encuesta de Medición del Empleo Urbano y Rural) in 2006. The module included a question on the barriers to individual use of Internet. The question was worded as follows: Reasons why (name) didn’t use Internet in the last 6 months: Population: household members older than 7 who did not use the Internet in the last 6 months Does not have a computer Does not know how to use a computer The cyber-café is far away Has problems with the language or cannot read or write Lack of electricity Cannot pay for the service Does not have time Other Source: Presentation by INIDE Nicaragua at the 4th workshop on the Measurement of Information Society in Latin America and the Caribbean (San Salvador, February 2008). Manual for Measuring ICT Access and Use by Households and Individuals 30 Chapter 4. Statistical standards and measurement topics for ICT household statistics Box 6. Eurostat model question on barriers to more intensive use of the Internet by individuals What are your barriers to more intensive use of the Internet? Population: Internet users Foreign language skills are inadequate Lack of time Connection is too slow Additional connection or per-volume download cost Cost of online content Content (what is there is not interesting enough to make more use of the Internet) Lack of skills or knowledge (e.g. sites are not user-friendly or too complicated) Security or privacy concerns None of the above Source: Methodological Manual for Statistics on the Information Society (Eurostat, 2007). Time-related issues 94. There are several aspects of a survey that have a time characteristic. They are: • Survey frequency (how often a survey is conducted); • Reference period/s (recall period/s) used in the questionnaire, typically when asking questions of an individual’s ICT use activities; • Reference date/s used in the questionnaire when asking about a given situation (for example, whether the household has Internet access); and • Time series, that is a data series derived from surveys that are sufficiently compatible to allow comparison of data over time. 95. For a particular country, survey frequency will be determined by national priorities, available resources and the level of penetration of ICT infrastructure and use. Where ICTs are being introduced rapidly (or a convenient survey vehicle is available), an annual survey is preferable. Where the level of access to ICT is low and not growing rapidly, it is reasonable to adopt a longer interval between surveys. ITU recommends that countries attempt to conduct an ICT access/use survey at least once every two years. 96. Where an annual collection is not feasible, countries should attempt to align their collection years with those of countries they wish to be compared with. This will commonly be countries in a region. 97. Most developed economies that conduct household ICT access/use surveys do so annually. Among developing economies, the situation is complicated by different frequencies for measuring household access and individual ICT use. A small number of countries with strong interest on ICT issues conduct surveys more frequently than annually (for example, the Republic of Korea and China). The situation in Latin America is described in Box 7. Manual for Measuring ICT Access and Use by Households and Individuals Chapter 4. Statistical standards and measurement topics for ICT household statistics 31 Box 7. Latin America: frequency of IT access and use surveys In Latin America, most countries include questions on household ICT access annually. However, the frequency of inclusion of questions on individual ICT use varies. Some countries have collected the information annually (Mexico, El Salvador, Honduras, Panama), while other countries have included ICT use questions every two or three years (Dominican Republic and Chile). A group of countries have included an ICT use module only once or twice between 2005 and 2008 and it is not yet clear what frequency they will adopt in the future (Cuba, Costa Rica, Colombia, Nicaragua, Paraguay, Peru and Uruguay). In 2005, the Brazilian Institute of Geography and Statistics (IBGE) conducted the first survey for Brazil that included core ICT use questions and will repeat the survey in 2009. The Brazilian Internet Steering Committee (CGI) has conducted an annual stand-alone ICT survey since 2005. Source: UNECLAC (2007) and updated information provided directly by UNECLAC-OSILAC. 98. Reference period is the time period referred to in the survey when asking about individual use of ICT. The core ICT indicators standards and this Manual recommend a 12-month reference period. Country practices vary, but ideally, reference periods should be aligned among countries in order to obtain comparable data.56 99. As the core indicators on household access is usually ‘point-in-time’ data, it is also preferable to have alignment of reference dates across participating countries. Reference dates are typically the day of interview, with questions of the type “Do you or anyone in your household have access to a computer at home?” (Eurostat, 2007 questionnaire). 100. Countries that are dependent on existing survey vehicles may be unable to adopt all these timing recommendations, because of constraints imposed by the timing of the vehicles used. 101. Other time-related issues include the importance of time series data in order to track changes over time and to improve survey processes and understanding. It is expected that the extra cost of conducting surveys on a regular basis will be offset, to some degree, by the availability of experienced staff and existing systems and procedures. 56 Country practices include reference periods of 12 months, three months, one month or one week. Some surveys (for instance, those done by Eurostat) use more than one reference period (both one year and three months). Some surveys do not use a reference period at all, referring instead to current use. An example is the 2003 United States ICT use survey (Computer and Internet Supplement to the Current Population Survey) that asked “Does this person use a computer at home?” without reference to a particular time period. Compare this with the Eurostat question for 2007 “When did you most recently use a computer? (options include Within the last 3 months, Between 3 months and a year ago, More than 1 year ago and Never used one). Manual for Measuring ICT Access and Use by Households and Individuals Chapter 5. Data sources and collection techniques for ICT household statistics Chapter 5. 33 Data sources and collection techniques for ICT household statistics 102. This chapter considers the sources of data and the data collection methods for ICT household statistics that can be employed by statistical agencies. The sources and methods chosen will be influenced by: • • • • • The subject matter to be targeted; The resources and time available for the project; Requirements to maintain consistency over time; Infrastructure and expertise available in the statistical agency; and Practicalities such as geography and language. 103. This chapter examines the advantages and disadvantages of various options. It also looks at the practices of countries that collect ICT household data. Data sources 104. The main data sources for social and demographic data are surveys or administrative data. The types of surveys considered in this Manual are household sample surveys and population censuses. 57 In all known cases, the ICT household indicators considered in this Manual are collected by surveys (including censuses). 105. Administrative data sources are unlikely to generate indicators on household ICT access and individual ICT use, because administrative data are generally not classifiable according to the characteristics of interest. However, such sources are successfully used by ITU to produce statistics on available infrastructure, tariffs and subscriber numbers. It is important to note that subscriber58 data are not equivalent to survey data on households and individuals, but they can be very useful, especially for monitoring uptake of ICT in countries with low levels of ICT access and use. 106. This Manual will focus on the range of surveys that can be used to collect ICT household data. Types of surveys 107. There are various types of surveys used to collect information about households and household members. They include: • Multi-purpose household surveys. Multi-purpose household surveys collect data on more than one subject via a single household survey. They include survey vehicles designed to cover a range of topics (often unrelated) and single topic modules attached to labour force surveys. Despite some necessary compromises, this type of survey can be cost effective and produce timely results if the survey vehicle is ongoing. Once collected and 57 The word ‘survey’ is sometimes taken to mean ‘sample survey’ although, in fact, it includes completely enumerated surveys, that is, censuses. Surveys include those conducted by personal interview or by other means, such as mail. 58 Subscribers may be organizations (business, government or non-profit) or individuals. There may be more than one subscriber in a household and several individuals may use the same subscription. Subscriber data do not usually include information about the subscriber, except for the location where the service is provided. Exceptions to this are surveys of Internet service providers where providers are asked to split subscribers by type (e.g. household and other). Such surveys are conducted by few countries, among them Australia (ABS, the Internet activity survey, www.abs.gov.au/ausstats/[email protected]/mf/8153.0) and Norway (Statistics Norway, the Internet survey, http://www.ssb.no/inet_en/). Manual for Measuring ICT Access and Use by Households and Individuals 34 Chapter 5. Data sources and collection techniques for ICT household statistics computerized, data can be further edited and tabulated by separate subject matter teams. Particular surveys that are sometimes used for collecting ICT household data in developing economies include Living Standard Measurement Study (LSMS) Surveys (World Bank) 59 and Demographic and Health Surveys (DHS).60 • Stand-alone household surveys. Stand-alone household surveys dealing with a single topic (such as ICT access and use). These allow for more detail to be collected than is usually possible in an existing survey vehicle. • Household budget expenditure surveys. Household expenditure (budget) surveys are designed to measure household expenditure and are also used by a number of countries to identify household access to ICT equipment and services. 61 Some countries include questions on household income in their household expenditure surveys. As we have seen above, income is a useful classificatory variable for ICT access (and use) data. Box 8 illustrates use of household expenditure surveys by the Lao People’s Democratic Republic to collect household ICT access data; and • Population censuses. Population censuses can be used to collect ICT access and/or use data. This is usually an expensive option and yields a limited range of ICT indicators (though with very good detail). UNSD ( 2008) presents standards for the 2010 round of population and housing censuses. In particular, the standards include ICT access as a core topic (see Chapter 2, Table 1, for details). 108. Most countries collect ICT household statistics using stand-alone surveys or via a module in an existing household survey vehicle. Box 8. Lao People’s Democratic Republic: use of budget surveys to collect ICT access data The Lao PDR used an interviewer-administered general household module and diary for its 1997-98 Expenditure and Consumption Survey (conducted by the National Statistical Centre of Lao People’s Democratic Republic). Census enumeration areas were used as primary sampling units (PSUs) which were stratified by 18 provinces and within provinces by urban/rural. A sample of 25 PSUs was allocated to each province. A further allocation by urban/rural was implemented. In total, there was a sample of 450 PSUs and 9,000 households. As well as information on consumption, data were collected on the possession of durables, including TVs, radios and videos (providing data for the two core indicators, HH1 and HH2). Source: UNSD (2005a). 109. Given the cost of developing and running a household survey, it is likely that developing economies would prefer not to run stand-alone household surveys on ICT access and use (or at least only infrequently). A more likely option is a multi-purpose household survey where ICT questions comprise a topic or module (see Box 9). Table 4 confirms this expectation, with 18 of 40 known surveys in developing economies62 collecting ICT statistics as part of a multi-purpose household survey and another seven including ICT questions in a household budget survey or population census. Only eight stand-alone ICT household surveys are known to be conducted by developing economies. Developed economies are evenly split between stand-alone and 59 The LSMS has a broad objective of improving the quality of household statistics in developing economies. A more specific goal is to develop methods to monitor progress in raising of living levels in developing economies, see: http://go.worldbank.org/IFS9WG7EO0. 60 The MEASURE DHS program is funded by USAID with contributions from other donors. DHS surveys have been conducted by a large number of countries and collect statistics in the areas of population, health, and nutrition. For information about the program, see: http://www.measuredhs.com/aboutdhs/. For examples of ICT data compiled from such surveys, see: http://www.statcompiler.com/ind_map.cfm#Characteristics%20of%20Households. 61 The main objective of household budget surveys is to measure household consumption (expenditure) for national accounts purposes and calculation of consumer price indices. Chapter XXIV of UNSD (2005a) discusses design and measurement issues specific to household budget surveys. 62 Defined here as an economy not belonging to OECD or not covered by Eurostat ICT household collections (that is the European Union countries plus a small number of other countries such as Norway and Turkey). Manual for Measuring ICT Access and Use by Households and Individuals Chapter 5. Data sources and collection techniques for ICT household statistics 35 multi-purpose surveys as a vehicle for collecting ICT household statistics (18 known surveys each). Box 9. Ghana: use of multi-purpose survey vehicles for collecting ICT household data The Ghana Statistical Service is mandated by law to conduct censuses and surveys relating to social, economic, demographic, and other issues in the country. The Service has a section that is responsible for the collection of data on transport and ICT. Different household surveys have served as vehicles for ICT questions over the years. The Ghana Living Standards Survey (GLSS 2005-2006) included questions on household access to, and use of, fixed line phones, mobile phones, computers and paid cable network. The Core Welfare Indicators Questionnaire (CWIQ) of 2003, also used in other African countries, included questions on household access to TV, video recorder, cassette player/radio, stereo system, computer, fixed telephone and mobile telephone. The use of different household surveys to collect ICT household data allows analysis of trends in ICT penetration without the need for an annual stand-alone ICT survey. Source: Statistics Ghana. Table 4. Survey vehicles used for collecting household ICT access and use data63 OECD countries and countries covered by Eurostat Survey vehicles used Other economies (including transition and least developed economies) 62 Total number of surveys64 Stand-alone ICT access/use survey65 18 8 26 Multi-purpose personal interview survey (including omnibus and labour force supplementary surveys) 18 18 36 Household income/expenditure survey (typically measuring household access to equipment/services) 4 4 8 Population census (or partial census) - 3 3 3 7 10 43 40 83 Unknown survey vehicle Total surveys Source: ITU, Eurostat, OECD, UNECLAC and national statistical sources.66 Metadata generally refer to the latest survey carried out as of the middle of 2007 (about the middle of 2008 for Latin American and Caribbean countries). 110. There are advantages to using an existing survey vehicle, apart from cost. The main one is that a number of other data items and classificatory variables are available and these can be cross-tabulated against ICT data to produce a richer dataset. 111. However, there are disadvantages as well. The use of existing survey vehicles may impose constraints on applying some of the recommendations presented in this Manual. For instance, an 63 The table presents available metadata. It is not a comprehensive account of ICT household surveys. In ‘Other economies’ especially, a number of countries not included in the table have measured household access to ICT using existing survey vehicles. The table is reasonably comprehensive for OECD and Eurostat countries. A country level account of ICT household data availability (as of 2007) may be found in Annex 1 of Partnership (2008). 64 The number of surveys does not equate to the number of countries as, for some countries, metadata are provided for more than one survey. However, where there was a survey for a country for two or more years and the metadata details were essentially the same, only the most recent year was used. Surveys for reference year 2002 or earlier were not included. 65 Including self-enumeration surveys. 66 OECD’s ICT statistics metadata repository can be found here: http://www.oecd.org/sti/ictmetadata. Eurostat SDDS metadata records were used for countries that conduct Eurostat’s community survey and can be found here: http://europa.eu.int/estatref/info/sdds/en/isoc/isoc_ci_sm.htm#top. The source UNECLAC, includes information found in UNECLAC (2007) or UNECLAC (2009) OSILAC ICT Statistical Information System: http://www.cepal.org/tic/flash and provided directly by UNECLAC. Manual for Measuring ICT Access and Use by Households and Individuals 36 Chapter 5. Data sources and collection techniques for ICT household statistics existing labour force survey will have an established methodology and questions.67 These may not be optimal for collecting ICT data, nor for producing disaggregated ICT indicators. 112. Another disadvantage of using existing survey vehicles is that ICT topics will be competing for space and time, given a likely pressure to minimize interview time in order to reduce respondent burden and cost. Most developing economies will therefore need to determine a small set of important questions. The core list of ICT indicators developed by the Partnership is a recommended starting point, in conjunction with other information requirements of a country’s policymakers. 113. Box 10 describes surveys used by Nepal to measure household access to ICT. Table 5 describes the range of surveys used by Latin American and Caribbean countries to measure household access to, and individual use of, ICT. Box 10. Nepal: surveys used to collect household ICT access data The Central Bureau of Statistics of Nepal conducts several multi-purpose surveys that collect some ICT household data. They are: Labour Force Survey The Nepal Labour Force Survey is generally conducted every five years; the current survey is in respect of 200708. In the current survey, the household head is asked about the presence in the household of radio, TV, fixed telephone, mobile telephone and computer, and also how many of each type of item are present in the household (for instance, how many radios). The sample size for the 2007-08 survey is 16,000 households and data collection is by face-to-face personal interview with relevant individuals. Living Standards Survey The Nepal Living Standards Survey is also generally conducted every five years. The last survey was conducted during 2003-04 and the household head was asked about the availability in the dwelling unit of a telephone, mobile phone, pager, cable TV, e-mail and the Internet. Because there were very few positive responses and the survey had a relatively small sample size (4,000 households, out of which 3,912 were interviewed), only results from the telephone question were published. A question was also asked on electricity connection in the home and the results were published. Population Census, 2011 Nepal plans to include most of the ICT access questions recommended by UNSD ( 2008) in its next population census. These are: household access to radio, TV, fixed-line telephone, mobile cellular telephone and computer. Nepal may also include a question on household access to the Internet. An advantage of using a census to collect this information is the potential for detailed tabulation, for instance by geographic area. Source: Final report, “UNCTAD Mission to assist the Nepalese Government on ICT measurement” (UNCTAD, 2008). 67 An example might be where the age scope of the labour force survey is limited to those of working age, whereas the age scope of an ICT household survey is usually broader than this. Manual for Measuring ICT Access and Use by Households and Individuals Chapter 5. Data sources and collection techniques for ICT household statistics 37 Table 5. Surveys used by countries of the Latin American and Caribbean region to measure household access to, and individual use of, ICT Country Survey Type of Survey Year Brazil (Brazilian Institute of Geography and Statistics, IBGE) Supplementary survey on Internet access to the National Survey for dwelling sample (PNAD) Multi-purpose household survey 2005 Brazil (Brazilian Internet Steering Committee, CGI) Survey on Information and Communication Technologies in Brazil Stand-alone ICT survey 2005, 2006, 2007 Chile Encuesta de Caracterización Socioeconómica Nacional CASEN Life conditions survey 2000, 2003 2006 Costa Rica Multiple Purpose Household Survey (MPHS) Multi-purpose household survey 2005 (2006 partially) Cuba Encuesta Nacional de Ocupación y Situación Económica de los hogares (ENO) Life conditions and labour force survey 2006 Dominican Republic Multiple Purpose Household National Survey (ENHOGAR) Multi-purpose household survey 2005, 2007 El Salvador Multiple Purpose Household Survey (EHPM) Multi-purpose household survey 2005, 2006, 2007, 2008 Honduras Permanent Multiple Purpose Household Survey Multi-purpose household survey 2006, 2007 Mexico Survey on Information and Communication Technologies in households (ENDUTIH) ICT survey attached to a structural survey, usually the labour force survey. 2001, 2002, 2004, 2005, 2006, 2007 Paraguay Permanent Household Survey Life conditions survey 2005, 2006 Uruguay Continuous Household Survey Multi-purpose household survey 2006, 2008 Source: UNECLAC (2007) and information provided directly by UNECLAC-OSILAC. Data collection techniques 114. Households and/or individuals within them can be presented with questions in face-toface interviews, by telephone interviews, by a self-enumerated questionnaire (posted or delivered) or by e-mail/web site interaction. Information for some members of the household can be provided by proxy if another member of the household answers questions on their behalf. 115. Most countries use personal interview techniques for collecting ICT household data. Personal interviewing includes face-to-face interviewing (generally in the respondent’s home), telephone interviewing and a combination of the two (see Box 11 for examples). A personal interview, whether face-to-face or telephone, requires careful training and evaluation of interviewers to avoid bias (for instance, affecting the likelihood of a response option by their tone of voice). Manual for Measuring ICT Access and Use by Households and Individuals 38 Chapter 5. Data sources and collection techniques for ICT household statistics Box 11. Use of a combination of techniques to collect ICT household data Macao, China In 2006, Macao, China, included ICT questions on a partial census of the population (20 per cent of dwellings were included). Questionnaires were mailed to households and later collected by enumerators who also conducted face-to-face interviews. Computer assisted telephone interviewing (CATI) was used mainly for making appointments, although telephone interviews were conducted upon request by respondents. New Zealand New Zealand conducted its 2006 Household Use of ICT Survey as a supplement to its quarterly labour force survey. Personal telephone interviews using CATI were conducted for the majority of respondents, with face-toface interviews using computer aided personal interviewing (CAPI) for the minority. This follows the methodology used for New Zealand’s labour force surveys where households remain in the survey for eight quarters; newly selected households are initially interviewed face-to-face and thereafter by telephone. Denmark Denmark collects information for its annual ICT household survey by telephone interviews, utilizing a CATI system. When the sample has been drawn, selected individuals are contacted by mail and asked to participate in the subsequent telephone phase of the survey. If a telephone number is not readily available, the respondent is asked to contact Statistics Denmark and provide a number on which he or she can be reached. Poland Poland mainly uses face-to-face interviewing for its ICT household survey. Interviewers complete the household questionnaire together with the head of household or another person able to give credible answers. Then all members of the household aged 16-74 are interviewed by means of individual questionnaires. Where an individual was absent, the interviewer revisited the respondents in order to complete the missing questionnaires. However, if more convenient, the forms could be left with the respondents to complete by themselves. Interviewers then gathered these questionnaires on a prearranged day. Source: Statistics and Census Service, Macao, China; Statistics New Zealand,68 Statistics Denmark69 and the Central Statistics Office of Poland.70 116. Table 6 summarizes available information on data collection techniques used by developing and developed economies. Table 6. Data collection techniques used for collecting household ICT access and use data63 OECD countries and countries covered by Eurostat Primary data collection technique71 Other economies (including transition and least developed economies) 62 Total number of surveys64 Face-to-face interview 25 25 50 Telephone interview 16 3 19 Self-enumerated questionnaire 2 - 2 Unknown collection technique - 12 12 43 40 83 Total surveys Source: ITU, Eurostat, OECD, UNECLAC and national statistical sources.66 Metadata generally refer to the latest survey carried out as of the middle of 2007 (about the middle of 2008 for Latin American and Caribbean countries). 117. Each data collection method has advantages and disadvantages and these are summarized below. 68 From information provided to the OECD as part of its ICT metadata collection, see http://www.oecd.org/sti/ictmetadata. From information provided to Eurostat as part of its ICT metadata collection, see http://europa.eu.int/estatref/info/sdds/en/isoc/isoc_hh_dk.htm. 70 From information provided to Eurostat as part of its ICT metadata collection, see http://europa.eu.int/estatref/info/sdds/en/isoc/isoc_hh_pl.htm. 71 A number of statistical offices use more than one technique for instance, initial contact by mail of telephone followed by a face-toface personal interview. The main method was used to compile this table (face-to-face personal interview in the preceding example). 69 Manual for Measuring ICT Access and Use by Households and Individuals Chapter 5. Data sources and collection techniques for ICT household statistics 39 Personal face-to-face interviews 118. Personal face-to-face interviewing is very common in household surveys in both developed and developing economies. 119. The main advantages of face-to-face interviews are facilitation of responses by the interviewer (and therefore a higher unit and item response rate) and that the technique does not rely on having an existing survey frame of households or individuals (Chapter 7 describes sampling techniques for household surveys that include cluster sampling based on geographic sampling). 120. In respect of ICT access and use data, face-to-face interviewing enables better explanation of technical terms by the interviewer. It may also allow the interviewer to check aspects of the respondent’s technical set-up, such as the type of Internet connection (for example, dial-up using analogue modem versus broadband or the existence of a fixed line telephone). 121. Where a number of languages or dialects are spoken, a face-to-face technique may be very effective, although it relies on being able to assign the most appropriate interviewer for a given respondent.72 122. The main disadvantage of face-to-face interviewing as a method of data collection is that it is costly, requiring more time spent by the interviewer travelling and locating respondents (though this is offset where respondents are geographically clustered). A relatively recent problem for many countries is the difficulty of accessing some kinds of dwellings, for instance, apartment buildings with access secured by electronic or physical locks. While face-to-face interviews allow careful explanation of relevant topics and questions, interviewers need to be trained not to indicate (for example, by their facial expression) judgements of responses. 123. Face-to-face interviewing can be facilitated by ICT in the form of direct entry of responses into computers (often portable computers, carried in the field by the interviewer) and supporting software (Computer Assisted Personal Interview software – CAPI). Such software also provides automatic question sequencing (via a series of ‘skips’) and immediate editing of responses. Personal telephone interviews 124. Telephone interviewing is less common than face-to-face interviewing but is still reasonably common, especially for developed economies. Like face-to-face interviews, telephone interviewing can be supported by ICT. For instance, interviews can be conducted in a call centre environment and use supporting software (Computer Assisted Telephone Interview software – CATI). As with CAPI, CATI software also provides automatic filtering and immediate editing of responses. Telephone interviewing may be based on a list of telephone numbers or be implemented by randomly dialing a sequence of digits that comprise a valid phone number (called random digit dialing). 125. The main advantage of telephone interviewing is that it is relatively inexpensive compared with face-to-face interviewing and there is greater flexibility in assigning the most appropriate interviewer (for instance, in a call centre environment, staff with skill in a particular language can be quickly chosen and assigned to deal with respondents who speak that language). 126. While response to telephone interviews is facilitated by interaction with a human interviewer, the relationship between the interviewer and respondent is likely to be less effective 72 Chapter 6 discusses questionnaire issues where a number of languages are spoken in a country. Manual for Measuring ICT Access and Use by Households and Individuals 40 Chapter 5. Data sources and collection techniques for ICT household statistics than in a face-to-face situation. In addition, the response rate may be lower as it is likely to be easier to reject a telephone caller than a person who is physically present at the respondent’s dwelling. 127. For many developing economies, there are insufficient households with a telephone connection, or a telephone directory listing, to make this method feasible. In particular, there would be problems creating a representative sample (and making contact with selected households) if telephone is the only option. This will apply, for instance, where telephone penetration is low or it is not possible to include mobile or unlisted subscribers. Random digit dialing (RDD) may overcome the problem of lack of directory listings but may result in an unrepresentative sample. Frequently, quotas that broadly represent the population are set and the quotas are gradually filled as RDD telephone interviews proceed. See Box 12 for information on use of RDD in Malaysia. 128. The telephone can be a useful complementary method of interview, subsequent to faceto-face interviewing, once contact has been made and a telephone number obtained. Box 12. Malaysia: random digit dialing in the Household Use of the Internet Survey The Malaysian Communications and Multimedia Commission (MCMC) carried out Household Use of the Internet Surveys in 2005 and 2006 to investigate Internet access and use, including type of access, consumer ecommerce, average use per week and purpose of use. The target population was the universe of Internet users, regardless of age, who accessed the Internet from a dialup or xDSL connection from their own homes at least once in the past month. Users of wireless access were excluded from the surveys. Selection of units was done by random digit dialing on the public switched telephone network with further screening of the household performed by a question on access to the Internet. As a second sampling stage, a member of the household was selected at random by asking which user in the household had the next birthday. Data were collected during the same telephone call. Source: Household Use of the Internet Survey 2005 and 2006, http://www.skmm.gov.my/facts_figures/stats/index.asp. Self-enumeration 129. Logically, household surveys can also be conducted by mail, though this is rarely done (no instances are known for developing economies). While there are cost advantages in use of mail surveys, there are obvious potential disadvantages as well. Some countries use mail to make initial contact and then conduct a personal interview (see Box 11 for examples). 130. Self-enumerated surveys are those where respondents complete a questionnaire themselves, usually paper-based. The questionnaire may be mailed (a postal survey) or delivered to the respondent, together with appropriate instructions.73 Following completion, the questionnaire may be collected by field staff or posted back to the collection agency by the respondent. Postal surveys require a current and complete sampling frame of addresses for households or individuals. They do not involve interaction with the respondent, therefore technical questions on ICT use may be less well understood and questionnaire logic is likely to be more complex. 131. Where questionnaires are delivered directly to mail boxes, there may be no need for a sampling frame of addresses. Where questionnaires are collected by field staff, they may be able to check responses and assist with any problems the respondent has completing the questionnaire. 73 These may be incorporated in the questionnaire or provided as a separate document. Manual for Measuring ICT Access and Use by Households and Individuals Chapter 5. Data sources and collection techniques for ICT household statistics 41 132. One advantage of self-enumerated questionnaires is that bias due to interaction with interviewers is likely to be reduced or eliminated, especially for sensitive questions. However, unit and item response rates are likely to be lower than for personal interviewing, leading to higher sampling error and likely non-response bias. In situations where there are several languages or dialects spoken in a country, or where literacy is low, self-enumeration is likely to be ineffective, unless combined with other methods. In addition, some ICT questions can be complicated for non-experts, for example, questions on broadband. 133. The need for good questionnaire design is likely to be greater for self-enumerated questionnaires as interviewers are not available to interpret the questions or manage the flow of questions. The principles of good questionnaire design are therefore particularly important for such surveys; this is explored further in Chapter 6. 134. Despite the potential problems outlined above, there are obvious advantages of selfenumerated surveys. These include lower costs and the ability to ask list-based questions. At least two OECD countries, Germany and Japan, use mailed self-enumeration questionnaires to collect ICT household data. Internet based surveys 135. The final method is to use the Internet to assist data collection. This would entail either an on-line questionnaire, which respondents fill out on a webpage, or questionnaires that can be emailed back to the agency conducting the survey. There has been minimal use of this approach for household surveys. The only known examples are for population censuses (for instance, by Australia in 2006, where a web form was available for use by household members after the physical form was delivered by census collectors). 136. While this method of data collection may seem attractive, it is only practical as a supplementary form of data collection for household ICT access and use data. For a start, it can only be used by respondents with Internet access and a reasonable level of ICT proficiency. This clearly excludes a large proportion of the population of interest for ICT access/use measurement (that is, non-users). The costs of establishing software and appropriate questionnaires might also be high and not cost-effective for a method that can only ever supplement other methods of data collection. Advantages include concurrent editing while the questionnaire is being completed (although methods such as CATI and CAPI also do this), reduced actual data collection costs and perhaps novelty and convenience value for respondents that might increase response rates. 137. While there are some cost advantages to such an approach, there are a number of reasons why this method will not be feasible, especially as a primary means of data collection. Manual for Measuring ICT Access and Use by Households and Individuals Chapter 6. Question and questionnaire design for ICT household surveys Chapter 6. 43 Question and questionnaire design for ICT household surveys 138. This chapter considers general issues of question and questionnaire design and assumes use of the model questions associated with the core list of ICT indicators, presented in Table 2 in Chapter 4. 139. Poor question and questionnaire design can be a significant source of survey error. It is therefore very important that design is undertaken carefully and that sufficient time is allowed for thorough testing. 140. There will never be a questionnaire design that works optimally for every household or individual in a survey, so it will be necessary to undertake careful research and testing to ensure an effective compromise. Once data requirements are determined, appropriate questions can be drafted, although it usually takes quite a lot of effort to finalize the wording, establish a logical order for the questions and construct a sequence guide to fit all situations. 141. We saw in the last chapter that most countries collect ICT household statistics by personal interview. Therefore, the assumption made in this chapter is that questionnaires will be administered by interviewers. However, much of the material presented applies equally to selfenumerated questionnaires.74 General principles on questionnaire design for household surveys 142. Most household surveys are conducted by personal interview (either face-to-face or by telephone). This enables terms to be explained, and logic applied, by trained interviewers. The method of asking questions will vary with the collection methodology used, for instance, telephone interviewers will ask questions differently from face-to-face interviewers. 143. In general, questionnaires should be designed to: • Maintain respondents’ cooperation by being as short as possible; this will also generally improve the quality of responses by avoiding respondent fatigue. • Maintain respondents’ interest and motivation to complete the form, for example, by clearly explaining the aims and methodology of the survey, starting with simple and interesting questions, and, as far as possible, avoiding complicated questions. • Appear logical by having related questions grouped (possibly into modules) and with a logical flow; if there is more than one respondent in the household, group their questions in order to use their time most efficiently. • Where a question has a number of response categories (or items), these need to be handled carefully to avoid recall problems. For instance, if items are all read out to the respondent at once, s/he may have a clearer recollection of the last two or three items than the first few, or an impression that the order of the responses reflects their importance. With the exception of the ‘frequency of Internet use indicator’ (HH12), the response categories in the model questions are all ‘multiple responses’, that is, all instances should be reported. This should minimize an order effect. One of the model questions (Internet activity – HH9) does have quite a large number of response items. To avoid recall problems, an appropriate way to ask this question might be by showing a list (in the case of a face-to- 74 That is, a questionnaire completed by a respondent, usually as a paper form but it could also be electronic. See previous chapter for details. Manual for Measuring ICT Access and Use by Households and Individuals 44 Chapter 6. Question and questionnaire design for ICT household surveys face interview or paper questionnaire) or asking a series of ‘yes/no’ questions about each activity (in a telephone interview). • Ensure that question wording is clear, uses plain language, is unbiased and is unambiguous. It is particularly important to avoid bias in question wording and not to ask ‘leading questions’ (that is, a question where a particular answer is implied thus resulting in a biased response); and • Build trust with the respondent by avoiding sensitive questions, as far as possible, and assuring confidentiality of responses. Questions that are sensitive could be asked at the end of the interview so that they do not affect responses to other questions.75 144. Interviewer-administered questionnaires include prompts and skips 76 to guide the interviewer through the questionnaire. These will specify the population for each question and ensure, as far as possible, consistent conduct of the interview. Figure 1 shows the populations that are asked each of the model ICT questions, for instance, only those who have used the Internet in the last 12 months are asked questions about the location, activity and frequency of Internet use. 145. Past experience can often be used to refine question wording and the logic aspects of form design. 146. Where more than one language is used in a country, UNSD strongly recommends that questionnaires be translated into all major languages spoken in order to ensure preservation of meaning and uniformity of presentation by interviewers. They present evidence that the alternative, being an ‘on-the-spot’ translation by the interviewer, increases errors by a factor of between two and four. Decisions on how many languages should be represented will be a factor of things like the number of people speaking only a minor language and the likelihood that their omission would bias survey results.77 147. Questions and whole questionnaires should be thoroughly tested before use in a survey. They should always be tested with actual respondents to find out whether the questions can be understood and answered accurately and whether respondents have a common understanding of the meaning of the questions. Testing can be qualitative or quantitative. Qualitative tests include focus group tests 78 and cognitive research. 79 Quantitative testing includes pilot tests and dress rehearsals.80 75 The United States 2003 Computer and Internet Use Supplement (to the Current Population Survey) asked two questions about concerns relating to the Internet. They were asked after the other ICT questions and were only asked of respondents on an outgoing rotation of the CPS. 76 These are instructions to interviewers that guide them through a questionnaire. For instance, if a respondent answers ‘no’ to a question on whether they used the Internet, the enumerator would ‘skip’ to the next logical question and not ask about use of the Internet. 77 See UNSD (2005a, Chapter III). 78 Focus groups involve informal discussions of relevant survey issues or topics with small groups of people who are in scope of the survey. 79 This involves research on how potential respondents interpret questions in a questionnaire. More information can be found in UNSD (2005a, Chapter IX). 80 A dress rehearsal is a large scale pilot test. Manual for Measuring ICT Access and Use by Households and Individuals Chapter 6. Question and questionnaire design for ICT household surveys 45 Figure 1. Structure and logic of a model questionnaire/module for collecting ICT household data Section 1: Household characteristics81 Number of household members Population: all in-scope households, includes household members outside any individual age scope applied Number of children aged 15 years or younger Population: all in-scope households 82 Household access to electricity Population: all in-scope households Optional questions such as household income, location (for example, urban/rural)83 Population: all in-scope households Section 2: Household access to information and communication technology Household access to a radio (HH1) Population: all in-scope households Household access to a TV (HH2) Population: all in-scope households Household access to a fixed telephone line (HH3) Population: all in-scope households Household access to a mobile cellular telephone (HH3) Population: all in-scope households Household access to a computer (HH4) Population: all in-scope households Household access to the Internet (HH6) Population: all in-scope households Types of Internet access services used at home (HH11) Population: all in-scope households with Internet access at home Section 3: Individual characteristics81 Age Population: all selected in-scope individuals Gender Population: all selected in-scope individuals Educational level Population: all selected in-scope individuals Labour force status Population: all selected in-scope individuals Occupation Population: all selected in-scope individuals Optional questions e.g. income, disability status, languages spoken/read Population: all selected in-scope individuals Section 4: Individual use of information and communication technology Individual use of a mobile cellular telephone (HH10) Population: all selected in-scope individuals Individual use of a computer (any location, last 12 months) (HH5) Population: all selected in-scope individuals Individual use of the Internet (any location, last 12 months) (HH7) Population: all selected in-scope individuals Location of individual use of the Internet in the last 12 months (HH8) Population: all selected in-scope individuals who used the Internet in the last 12 months Frequency of individual use of the Internet in the last 12 months at any location (HH12) Population: all selected in-scope individuals who used the Internet in the last 12 months Internet activities undertaken by individuals in the last 12 months at any location (HH9) Population: all selected in-scope individuals who used the Internet in the last 12 months 148. Testing of a set of draft questions at an early stage can greatly assist planning as well as questionnaire design. Such testing may be undertaken by statistical agency staff, including selected field supervisors. This would serve as a familiarization opportunity for those who will 81 Some or all of this ‘characteristics’ information would be collected as part of a larger survey and therefore would not need to be included in a module on ICT access and use. 82 This may be observed by a face-to-face interviewer. 83 Location will often be known already, in which case it will not need to be asked of respondents. Manual for Measuring ICT Access and Use by Households and Individuals 46 Chapter 6. Question and questionnaire design for ICT household surveys have roles in training household interviewers once the methodology has been determined. As well as firming up the final set of questions to be asked, testing will also help determine the best collection method, if not already known, and the time necessary to conduct interviews. 149. Testing can be done in two stages84 – pre-testing parts of the questionnaire on a small number of respondents (this may occur a number of times) and a comprehensive field test (or pilot test) involving more respondents who are selected to be reasonably representative of the population. Following UNSD,85 it is recommended that questionnaire modules be tested on at least 50 respondents to that module (therefore, for individual ICT use, the questions should be pilot tested on 50 individuals who have used the Internet). A large survey may also involve a final ‘dress rehearsal’ prior to launch. This will test all aspects of the survey, including procedures and will also provide valuable information on costs, the adequacy of training and documentation, and the need for fine-tuning of timetables. 150. Non-question elements of a questionnaire include:86 • An identifier for each variant of a questionnaire87 and a unique identifier for each copy of the form (with a check digit88 if the identifier is to be entered by keying); • Boxes of appropriate size to record responses (for instance, the number of household members can be expected to require space for two digits, while household income might require space for 7 or more digits, depending on the currency); and • If Optical Character Recognition (OCR), Intelligent Character Recognition (ICR) or Optical Mark Reading (OMR) software are used to convert responses on a paper questionnaire to a computer record, then there may be need for additional information on the form (such as a page identifier) or a particular style of layout. ICT model questions 151. Model questions for the ICT household indicators are shown in Table 2 in Chapter 4 and a model questionnaire is presented in Annex 2. It is important to note that the model questions and questionnaire need to be adapted by each country to suit: • The survey vehicle and method of data collection (for instance, a questionnaire that is designed for a telephone survey will differ from a questionnaire that is used for face-to-face interviewing), and • Cultural and linguistic conventions of the country. 152. For comparability purposes, it is important that the meaning of the model questions is preserved and that the specified populations of households or individuals are asked each question. 153. Four of the model questions have response categories (location, Internet activities, type of Internet access and frequency). Countries have some options about how they deal with these. For instance, for the three multiple response questions (location, Internet activities and type of Internet access), countries can add or split categories. For international reporting, split categories need to be re-aggregated. This process is explained in Chapter 8. 84 UNSD (2005a, Chapter III). UNSD (2005a, Chapter III). 86 UNSD (2005b, Chapter 9). 87 Variants might include questionnaires in different languages. 88 A check digit is a number or letter in a keyed sequence, the value of which is derived from a function involving the other digits in the sequence. If a data entry error is made, the derived check digit will differ from the actual check digit, thus signaling that a keying error has been made. Check digits are typically used for record identifiers and codes rather than quantitative data. 85 Manual for Measuring ICT Access and Use by Households and Individuals Chapter 6. Question and questionnaire design for ICT household surveys 47 154. Another variation is that countries can add an ‘other’ category to the activity (HH9) and location (HH8) questions. The model questions for these indicators, as presented in the model questionnaire in Annex 2, include ‘other’ categories. 155. For HH8 (location of Internet use), some countries may wish to specify a particular location of importance for policy purposes, for example, Internet access provided through government supported public centres (for example, Tunisia’s Publinet89). The addition of such locations as a separate category to the question on location of Internet use would assist policymakers to evaluate government support for such centres. Note that all locations of Internet use should be collected. 156. For HH9 (individual Internet activities), countries might like to split the broader categories to obtain more detailed information. Countries could also ask the question in other ways, for example, rate each activity according to its frequency of use, and rank the activities by frequency. However the question is asked, information on all activities should be collected. 157. For HH11 (household Internet access by type of access), categories should be chosen such that responses can be aggregated to Narrowband, Fixed broadband and Mobile broadband. The suggested question in the model questionnaire facilitates this (see Annex 2). As with the other multiple response indicators, all methods of access should be reported. 158. For HH12 (frequency of Internet use), countries can split a category, for example, ‘less than once a week’ could be split into ‘at least once a month but not every week’ and ‘less than once a month’. Reference period 159. Reference period (also know in statistics as recall period) refers to the period in respect of which respondents are asked to report. For ICT household statistics, the length of the reference period has been much debated, especially for the value of Internet purchases. The general argument is that a question asked in respect of a longer period is more likely to yield an inaccurate response because of problems the respondent has remembering the required information. A variety of reference periods is used by countries (and also a mix).90 For the model questions associated with the core indicators, a 12-month reference period is likely to be suitable as the questions are not very complex and do not involve complex recall tasks (such as remembering the value of purchases). Use of a 12-month reference period avoids seasonal effects and better captures rare events, such as purchasing on line or searching for health information. Note that recall problems will be worsened if there is a long lag between the end of the reference period and the time of data collection. 160. The 2005 OECD model questionnaire (OECD, 2009) retained a 12-month reference period for individual use questions but included new filter questions probing the time period when activities occurred (use of a computer, the Internet and purchasing). This allows tabulation of those aggregates for both three and 12-month time periods. An additional point regarding reference period, is that for developed economies, at least, it makes little practical difference whether a three or 12-month period is used (as very few individuals are infrequent 89 For more information, see http://www.tunisiaonline.com/internet/publinet.html. The OECD model questionnaire uses a 12-month reference period for all questions. The 2006, 2007 and 2008 Eurostat model questionnaires ask some questions in respect of both 12 months and three months (for instance, individual use of a computer and the Internet, and whether the individual has purchased products over the Internet) but ask others (e.g. location and frequency of use and activities undertaken) in respect of the last three months. 90 Manual for Measuring ICT Access and Use by Households and Individuals 48 Chapter 6. Question and questionnaire design for ICT household surveys users). The situation may be different for developing economies and for particular questions, such as Internet purchasing.91 ICT concepts that may be difficult to understand 161. There are a number of concepts used in the core list of ICT indicators that may be difficult for respondents to understand and respond to consistently. They include: Internet access services, Internet activities related to government organizations, Internet access using mobile devices and Mobile cellular telephones. 162. It is important when designing questions for ICT household surveys that these concepts are explained clearly and placed in a country and cultural context. Internet access services 163. Household core indicator HH11 deals with the type of Internet access services used by households with Internet access. The indicator has three response categories, though in practice, countries are likely to include more categories on national questionnaires. Whichever approach is chosen, the categories are likely to be quite technical and the types of services may change as technology evolves. Anecdotal evidence indicates that many respondents will not understand the meaning of the Internet access service categories used. It is therefore desirable that questions on this topic use categories that are relevant to services existing at the time of the survey within the country and are likely to be understood in a local context, for instance, use the product names of widely available broadband services. The ‘other’ categories shown in the model questionnaire should be used if there are services not covered by the specific categories. They should also be framed to reflect particular services that exist in the country and may appear on questionnaires as several categories. There may also be a policy interest in particular Internet access services. In this area, in particular, it is important that interviewers are familiar with technologies and their brand names. As an example, in countries that have launched 3G networks, it is important that interviewers know the names of the services on offer so that they can identify respondents who access broadband Internet through their mobile phone. Internet activities related to government organizations 164. Household core indicator HH9 deals with the Internet activities undertaken by individuals. The response categories include ‘getting information from general government organizations’ and ‘interacting with general government organizations’. It is important to differentiate between these categories. Whereas the former refers to obtaining information (often from websites), the latter is more interactive and covers activities such as completing forms on line and making online payments. 165. In both cases, the definition of what constitutes a general government organization may prove difficult for respondents to understand, especially in a consistent way. Statistically, it is recommended that the SNA93 (2008 revision) concept of government be used, as follows: 91 The value of Internet purchases is not a core indicator and is likely to present collection difficulties. It is suggested that countries which decide to collect this information select a reference period which would enable calculation of 12 months value. For instance, countries that collect quarterly data, should ask about purchases in the last quarter and then aggregate estimates over each quarter to provide data in respect of 12 months. Manual for Measuring ICT Access and Use by Households and Individuals Chapter 6. Question and questionnaire design for ICT household surveys 49 According to the SNA “… the principal functions of government are to assume responsibility for the provision of goods and services to the community or to individual households and to finance their provision out of taxation or other incomes; to redistribute income and wealth by means of transfers; and to engage in non-market production.” (UNSD, 2008b) 166. General government organizations include central, state and local government units. It should be noted that general government organizations do not include public corporations (legal entities, predominantly owned and controlled by the government that are created for the purpose of producing goods and services for the market and may be a source of profit or other financial gain to their owner/s). (UNSD, 2008b) 167. Clearly, the concept of government is complex and needs to be interpreted within a country context. It could be useful to provide examples of websites of government organizations that are thought to be widely used (for instance, websites of government-run media organizations or national statistical office websites). Box 13 reproduces the question asked by the Census and Statistics Department of Hong Kong, China in 2008. The question assists the respondent by providing examples of each class of e-government services. 168. More information on the conceptual challenges of e-government measurement may be found in Chapter 8 of the OECD Guide (OECD, 2009). Box 13. Hong Kong, China: question on use of e-Government services, 2008 In the past 12 months, had you used any of the e-Government services for your personal matters? (e.g. search for Government information, submit application, book appointment for identity card application, book leisure facilities, registration, pay tax or pay other governmental charges, etc.) If “yes”: Show card In the past 12 months, which e-Government services had you used for personal matters? (Allow multiple answers) Browse and enquire information disseminated by the Government (e.g. enquiring about weather condition, traffic condition, statistical data, air pollution index, Government news etc.) Online financial management (e.g. paying various Government bills, such as rates, Government rent, water charges, tax, purchasing tax reserve certificates, paying fixed penalty tickets for traffic offences or littering etc) Online appointment booking or licenses/certificates application (e.g. appointment booking for road test and vehicle examination, renewing driving and vehicle licenses, appointment booking for registration of identity card/ giving of marriage notice, applying for copy of birth/ death/ marriage certificates) Online registration services (e.g. voter registration and volunteer scheme registration) Online change of personal particulars (e.g. changing address) Online job search and recruitment (e.g. searching for job vacancies, registering job vacancies and searching for suitable candidates) Online purchase of Government publications and Government statistical publications Online booking of Government venues or facilities (e.g. sports venues, training courses or leisure facilities) Online submission of information to Government (e.g. filing of tax return) Online library services (e.g. book reservation, book renewal) Download Government forms General browsing of government websites Others (Please specify): _______________ Have used, but forget the types of service Source: Questionnaire for the Thematic Household Survey on Information Technology Usage and Penetration in 2008, Census and Statistics Department, Hong Kong, China. Manual for Measuring ICT Access and Use by Households and Individuals 50 Chapter 6. Question and questionnaire design for ICT household surveys Internet access using mobile devices 169. It is evident that ways of accessing the Internet are growing. Of particular interest is ‘mobile access’ enabled via services, such as WiFi and 3G mobile telephone technology, and devices, such as mobile phones and personal digital assistants. Reflecting the interest in this topic, the 2008 revision of the core list of ICT indicators included indicators on mobile access to the Internet (as categories in the ‘location of Internet use’ indicator, HH8). The indicators were based on the OECD 2005 and Eurostat 2008 model questionnaires. 170. As many developing economies have seen rapid growth in the number of mobile phone subscribers in recent years, there may be particular interest in asking a more detailed question on use of mobile phones to access the Internet. Box 14 shows a related example from Hong Kong, China in the 2008 survey. Box 14. Hong Kong, China: question on devices used to access the Internet, 2008 Show card In the past 12 months, did you use these devices for wired Internet connection or wireless Internet connection at any places? (Allow multiple answers) Non-mobile Devices (a) Desktop computer for wired Internet connection ........................... (b) Laptop / Notebook / Tablet PC for wired Internet connection............. (c) Desktop game console (e.g. Playstation II/ III of Sony (PS2, PS3), Xbox/Xbox360 of Microsoft, Game Cube/ Wii of Nintendo, etc.) for wired Internet connection............. Mobile Devices (d) Palm top/ PDA for wireless Internet connection ........................... (e) Mobile phone for wireless Internet connection ........................... (f) Desktop/ Laptop/ Notebook/ Tablet PC for wireless Internet connection ....................................... (g) Portable game console (e.g. Playstation Portable (PSP), Nintendo DS (NDS) etc.) for wireless Internet connection.............. (h) None of the above ....................... a Member (H/H head) b Member 2 c Member 3 d Member 4 e Member 5 f Member 6 1 1 1 1 1 1 2 2 2 2 2 2 3 3 3 3 3 3 4 4 4 4 4 4 5 5 5 5 5 5 6 6 6 6 6 6 7 7 7 7 7 7 9 9 9 9 9 9 Source: Questionnaire for the Thematic Household Survey on Information Technology Usage and Penetration in 2008, Census and Statistics Department, Hong Kong, China. Mobile cellular telephones 171. There are both household and individual mobile cellular telephone indicators in the core list (HH3 and HH10 respectively) and corresponding model questions (see Table 2). The meaning in each context is different. In the household context, the interest is in whether the household, through one or more of its members, has access to a mobile cellular telephone. In Manual for Measuring ICT Access and Use by Households and Individuals Chapter 6. Question and questionnaire design for ICT household surveys 51 the individual context, the interest is in the use of a mobile cellular telephone by an individual irrespective of who owns or pays for it. 172. The concept for individual mobile cellular telephone use is different from a mobile telephone subscription. The model question corresponding to HH10 specifies that “Use of a mobile cellular telephone does not mean that the telephone is owned or paid for by the person but should be reasonably available through work, a friend or family member, etc. It excludes occasional use, for instance, borrowing a mobile cellular telephone to make a call.” Subscribers, on the other hand, subscribe to a mobile phone service by a post-paid subscription or a pre-paid account. They are therefore likely to be owners of a mobile phone in a legal sense. They may also be organizations, such as businesses, rather than individuals. Questionnaire logic 173. The structure and logic for a set of core ICT questions are presented in Figure 1. It is assumed that the ICT access and use questions are included as a module in a larger household survey (which will usually be the case for developing economies). The structure, question, wording and definitions suggested in this Manual would not necessarily be used unchanged (or literally translated). However, it is important to retain the suggested meanings and logic. 174. The structure should be used in conjunction with the model questions (Table 2) and associated definitions of terms and categories. 175. Note that the term population refers to the units that are in scope for each question. For example, a question collecting ‘Types of Internet access services used at home’ (used for deriving HH11) is asked only of the (population of) households that have Internet access. 176. The data collection method used will influence the way questions are asked. A questionnaire delivered by personal interview will include instructions to the interviewer in the form of prompts and skips.76 177. Prompts should reflect the definitions of terms (for example, computer, the Internet) shown in Table 2. Box 15 illustrates interviewer instructions through excerpts from the ICT household questionnaires of Canada and Hong Kong, China. 178. A model questionnaire covering the core list of ICT household indicators is presented at Annex 2. Manual for Measuring ICT Access and Use by Households and Individuals 52 Chapter 6. Question and questionnaire design for ICT household surveys Box 15. Interviewer instructions for ICT household surveys of Canada and Hong Kong, China Canadian Internet Use Survey, 2005 (personal interview face-to-face or telephone) Section: Ever Users (EV) EV_BEG Begin Module Coverage: All respondents EV_Q01 Have you ever used the Internet (E-mail or World Wide Web) from home, work, school, or any other location for personal non-business use? 1 Yes 2 No..........................................(Go to EV_END) DK, RF........................................(Go to EV_END)92 Coverage: All respondents EV_Q02 How many years have you used the Internet? INTERVIEWER: Read categories to respondent. 1 Less than 1 year 2 1 to 2 years (1 year or more but less than 2 years) 3 2 to 5 years (2 years or more but less than 5 years) 4 5 or more years DK, RF Coverage: Respondents who have ever used the Internet EV_END End Module Hong Kong, China, Thematic Household Survey on Information Technology Usage and Penetration in 2008 (personal interview face-to-face) D14 Show card Including all places, for what purposes did you usually use (desktop computer or laptop / notebook / tablet PC or desktop game console (e.g. Playstation II/III of Sony (PS2/PS3), Xbox/Xbox360 of Microsoft, Game Cube/Wii of Nintendo etc.)) via wired Internet connection? Any other purposes? Any others? (Allow multiple answers) F4 Show card In the past 12 months, which e-Government services had you used for personal matters? (Allow multiple answers) Source: Statistics Canada93 and Questionnaire for the Thematic Household Survey on Information Technology Usage and Penetration in 2008, Census and Statistics Department, Hong Kong, China. 92 93 DK=don’t know; RF=refusal. http://www.statcan.ca/english/sdds/instrument/4432_Q1_V6_E.pdf. Manual for Measuring ICT Access and Use by Households and Individuals Chapter 7. Designing ICT household surveys Chapter 7. 53 Designing ICT household surveys 179. This chapter considers the design of ICT household surveys, focusing on survey scope and target populations, statistical units and sampling issues. 180. Many aspects of survey design are not specific to ICT household surveys. Indeed, as we saw in Chapter 5, many countries use existing household surveys to collect ICT access and use data. These may be multi-purpose surveys, labour force surveys, household budget surveys or population censuses. Therefore, this chapter considers aspects related to household surveys generally, with emphasis on the application to ICT measurement. Scope and coverage for households and individuals 181. The scope of a survey refers to the statistical units (members of the target population) required to be represented by the survey and for which data are to be collected and tabulated. For household surveys, the scope may be all households, a subset of household types or geographic locations, or a set of certain individuals within households. 182. In respect of ICT household statistics, the Partnership has proposed several statistical standards associated with the core list of ICT indicators, including recommendations on survey scope for households and individuals. 183. The recommended minimum scope for households is all households where at least one member is aged 15-74. Scope restrictions in individual countries could include a restriction to households living in private dwellings. 184. For individuals, the suggested age range is 15-74 but this is a minimum scope and countries are encouraged to expand the scope where possible, for example, to children or older people.94 Many countries have a lower age scope cut-off (commonly 10 or 12 years) and a number of countries do not have a maximum age cut-off. 185. Most countries will have individual scope limitations not related to age, for instance, the scope exclusion of individuals in institutions such as prisons and nursing homes, members of the armed forces, diplomats, short-term foreign visitors and those with no fixed address, such as nomads. 186. Table 7 provides information about the age scope of known ICT household surveys as of 2007/2008. Of the surveys that collect individual information, and for which the age scope is known, nearly two-thirds (41 of 67 surveys) collect information about both adults and children. 187. The scope of surveys that collect household ICT access/use data should be guided by the standards outlined above. However, it is acknowledged that there are practical issues that are country-specific (for an example, see Box 16). An important issue for some developing economies is the limitation of the survey’s scope to urban areas and other locations that have reasonable ICT infrastructure. For instance, it may be unrealistic to ask questions about ICT use in rural areas where electricity is not available, thus limiting the options for ICT (with the possible exception of mobile cellular telephones). 94 UN convention is an opening age range of 15-24 (‘youth’) and this is used by many developing economies. This Manual assumes 15 as the lower age cut-off, although most European countries use 16 as the lower limit. Manual for Measuring ICT Access and Use by Households and Individuals 54 Chapter 7. Designing ICT household surveys Table 7. Age scope for surveys that collect household ICT access and use data95 OECD countries and countries covered by Eurostat Survey scope, age of individuals Other economies (including transition and least developed economies) 96 Total number of surveys97 Adults only (aged from 15, 16 or 18) 22 4 26 Adults and children (under 15) 17 24 41 Unknown individual scope 1 5 6 Survey scope excludes individuals (households only) 3 7 10 43 40 83 Total surveys 98 Source: ITU, Eurostat, OECD, UNECLAC and national statistical sources. Metadata generally refer to the latest survey carried out as of the middle of 2007 (about the middle of 2008 for Latin American and Caribbean countries). Box 16. Morocco: scope of the 2005 ICT household survey The National Telecommunication Regulatory Agency of Morocco (ANRT) carried out a household survey in 2005 to measure access to, and use of, ICT by households and individuals. The scope of the survey included all Moroccans in the age range 12-65 living in areas with access to electricity. According to the latest population census, this population represents 20.2 million people or 68% of the national population. Source: ANRT- Enquête de collecte des indicateurs TIC 2005, www.anrt.net.ma. 188. Coverage is the degree to which the in-scope units are actually on the survey frame (and therefore represented in the sample). Once the required scope is determined, alternative survey frames can be investigated to identify sources that provide the best (most up to date and/or complete) coverage of the households or individuals that are within the scope of the survey. 189. A particular issue for some developing economies is scope and/or coverage omissions due to language limitations. Where a large number of languages are spoken in a country, it is likely to be impractical to translate the questionnaire into every language. Respondents who do not speak one of the questionnaire languages will therefore not be able to participate in the survey. Such respondents may be treated as scope exclusions, undercoverage or nonresponse (because of inability to respond).99 Different treatments will result in different survey outcomes. 190. There are also geographic coverage issues for some countries, for example, rural or remote populations may be poorly covered. 95 The table presents available metadata. It is not a comprehensive account of ICT household surveys. In ‘Other economies’ especially, a number of countries not included in the table have measured household access to ICT using existing survey vehicles. The table is reasonably comprehensive for OECD and Eurostat countries. A country level account of ICT household data availability (as of 2007) may be found in Annex 1 of Partnership (2008). 96 Defined here as an economy not belonging to OECD or not covered by Eurostat ICT household collections (that is the European Union countries plus a small number of other countries such as Norway and Turkey). 97 The number of surveys does not equate to the number of countries as, for some countries, metadata are provided for more than one survey. However, where there was a survey for a country for two or more years and the metadata details were essentially the same, only the most recent year was used. Surveys for reference year 2002 or earlier were not included. 98 OECD’s ICT statistics metadata repository can be found here: http://www.oecd.org/sti/ictmetadata. Eurostat SDDS metadata records were used for countries that conduct Eurostat’s community survey and can be found here: http://europa.eu.int/estatref/info/sdds/en/isoc/isoc_ci_sm.htm#top. The source, UNECLAC, includes information found in UNECLAC (2007) or UNECLAC (2009) OSILAC ICT Statistical Information System: http://www.cepal.org/tic/flash and provided directly by UNECLAC. 99 UNSD (2005a, Chapter VIII). Manual for Measuring ICT Access and Use by Households and Individuals Chapter 7. Designing ICT household surveys 55 191. Other omissions will reflect coverage issues such as errors in the survey frame (discussed below). It is important that the omission of a significant proportion of the population, whether by a specific scope limitation or because of undercoverage, be mentioned in output. One example of failure to do so is that comparisons are made between the whole population of one country and the urban population of another. Target populations and survey frames 192. The target population is the population about which survey estimates will be produced, that is, the scope of the survey.100 The survey frame (also known as a population frame or a sampling frame) is a list from which units of a survey are selected. In practice, the survey frame will approximate the target population.101 193. In general, there is seldom much choice of survey frame; often there is only one viable option, sometimes with idiosyncrasies or lack of timeliness. The frame may be a register of persons, an electoral roll, a population and housing census data file, a master sampling frame 102 or some other listing such as electricity connections or lists of dwellings used for property valuation purposes. A frame may be quite suitable for one set of data requirements but hold unacceptable biases for other data.103 This is clearly an issue to be considered when ICT questions are included in a multi-purpose household survey. 194. Generally speaking, the desirable characteristics of survey frames are: • Completeness with respect to coverage of the in-scope population; • Timeliness– it should be as up-to-date as possible and have the potential to be updated in the future to permit further iterations of the household survey; • Accuracy of information on the records; • Availability of descriptive data that will assist in sample design and possibly classification of data, for example, location of units; and • Availability of household access information – usually address or telephone numbers.104 195. Major frame problems for household surveys include undercoverage, clusters of elements, blanks and duplicate listings. Undercoverage is a particular concern for household surveys in developing economies and may occur at the levels of geographic area, household and/or individual. A typical problem is the identification of households within an area. Clusters of elements refers to the situation where a single unit on the frame consists of multiple units in the target population, for example, a dwelling with several households. Blanks refer to units that do not contain a member of the target population, for example, an empty dwelling. Duplicate listings occur when a member of the target population appears more than once on the frame, for example, a nomad person moving from place to place may have a higher probability of selection.105 100 UNSD (2005a, Chapter VIII). A more technical discussion of survey frames may be found in UNSD (2005a, Chapters II and V; 2005b, Chapter 4). 102 A master sampling frame (or master sample) is a large sample which is used for several surveys. It typically consists of a constant set of enumeration areas, with different households within those areas selected for each survey run off the master frame. UNSD (2005a, Chapter V; 2005b, Chapter 4) discusses master sampling frames in some depth. 103 An example is a frame consisting of households who live in homes that they own. While this may be a good frame for measuring characteristics of home ownership, it is likely to be a poor frame for measuring household ICT access because home owners could be more likely to have access to, and use, ICT. 104 Though in some circumstances, survey questions may be posed, or subsequent household visits arranged, at a central location where householders or heads of households attend, for example, for voting. 105 See UNSD (2005a, Chapter II) for more detail. 101 Manual for Measuring ICT Access and Use by Households and Individuals 56 Chapter 7. Designing ICT household surveys 196. Field-testing of questionnaires and procedures may present an opportunity to test problems with the survey frame and to make adjustments if feasible. 197. UNSD106 recommends that NSOs with significant household survey programmes invest resources in creating and maintaining a master frame of geographic areas defined and used in the preceding census. Ideally, the frame would be created as soon as possible after the completion of the census, thereby reducing the amount of labour involved. 198. Multi-stage sampling is common for household surveys, in which case separate survey frames are required for each sampling stage. Commonly, the first stage of sampling is area sampling based on a frame of geographic areas (also called ‘enumeration areas’), which in turn might be determined from the last population census.107 Once enumeration areas are chosen, households may be selected from a frame that is a listing created for the survey. 199. Countries use a variety of survey frames for ICT household surveys, see Table 8. Use of individual registers (often known as central population registers) as a frame is quite common in European countries, where such registers are maintained for administrative purposes. Some developing economies 108 have registers of households or dwellings that may be based on population census records or maintained for administrative purposes, such as for land taxes. The most common primary frame used is a list of geographic areas, usually based on information collected in the preceding population census. 200. It is often the case that only the NSO in a country has access, for confidentiality reasons, to an adequate household or individual survey frame. Other organizations that carry out ICT surveys (such as ministries for ICT, telecommunication regulatory authorities or private institutions) may not have a reliable frame. It is therefore important for them to collaborate with NSOs to avoid using poor frames that could produce biased estimates. Table 8. Frames for surveys that collect household ICT access and use data95 OECD countries and countries covered by Eurostat Other economies (including transition and least developed economies) 96 Total number of surveys97 6 12 18 14 - 14 20 14 34 Telephone directories or RDD 3 1 4 Unknown survey frame - 13 13 43 40 83 Primary survey frame used109 Register of households or dwellings110 Register of individuals Geographic areas (‘enumeration areas’) 111 Total surveys Source: ITU, Eurostat, OECD, UNECLAC and national statistical sources.98 Metadata generally refer to the latest survey carried out as of the middle of 2007 (about the middle of 2008 for Latin American and Caribbean countries). 201. For surveys using techniques such as ‘quota sampling’, a frame is not required. An example of this is random direct dialing (see Box 12). 106 UNSD (2005a, Chapter V; 2005b, Chapter 4). UNSD (2005b, Chapter 4) discusses area frames and their characteristics (including having population data available for each area). 108 Defined here as an economy not belonging to OECD or Eurostat. 109 It was not always clear from the metadata available which sampling frame was used. In some cases, the frame was inferred based on information about the sampling methods used. The frame shown here is the primary (first stage) frame. 110 In some cases, these are identified as coming from population census records. In others, they are lists of dwellings maintained for land valuation or other purposes. In some cases, the original source of register data was not clearly identified. 111 Random digit dialling, see earlier discussion (Chapter 5). 107 Manual for Measuring ICT Access and Use by Households and Individuals Chapter 7. Designing ICT household surveys 57 Statistical units 202. For ICT measurement, there are typically two statistical units: households and individuals. The household unit is used to elicit information about the facilities in place in the household (for example, whether there is a TV, computer or Internet connection). Box 17 presents an example of modifications in statistical unit at the household level. The individual unit is used to provide information on use of ICT (both at, and away from, home) and, most importantly, the nature of that use (for instance, frequency and range of activities undertaken). The core indicators require that both the household and the individual are statistical units. It is necessary to sample both households and individuals, and to design questionnaires and other survey materials for both types of units. Box 17. Honduras: change in statistical units in household surveys The National Statistical Institute of Honduras modified the statistical unit for several questions on access to ICT in the Living Conditions Surveys of 2005, 2006 and 2007. In particular, questions about access to radio, TV set, fixed phone and computer were recorded at dwelling level until 2006 but at household level in 2007, while access to a mobile phone was asked at dwelling level until 2005 and at the individual level from 2006. Source: Presentation by INIDE Honduras at the 4th workshop on the Measurement of Information Society in Latin America and the Caribbean (San Salvador, February 2008). 203. The application of a definition of ‘household’ needs to be undertaken with great care to ensure that it is relevant to the society being measured yet still meets the requirements for international comparisons of output data. 204. UNSD states that “Most surveys consider households to be the collection of persons who usually reside in a housing unit. Two components are thus important: the definition of a usual resident and the definition of a housing unit.”112 Of these, the definition of housing unit may be more problematic and it may not always be clear what constitutes a ‘housing unit’. UNSD considers that a housing unit definition takes into account whether the persons living there live and eat separately from others in the same structure. 205. The following definition is based on the “housekeeping concept” described in the UNSD’s Principles and Recommendations for Population and Housing Censuses Revision 2 (UNSD, 2008): “The concept of household is based on the arrangements made by persons, individually or in groups, for providing themselves with food and other essentials for living. A household may be either (a) a oneperson household … or (b) a multi-person household, that is to say, a group of two or more persons living together who make common provision for food and other essentials for living. The persons in the group may pool their resources and may have a common budget; they may be related or unrelated persons or constitute a combination of persons both related and unrelated. This “concept of household … is known as the “housekeeping concept”. It does not assume that the number of households and housing units are or should be equal.”113 112 UNSD (2005a, Chapter VIII). UNSD ( 2008) also discusses the “household-dwelling” concept of a household whereby a household is associated with a single housing unit. 113 Manual for Measuring ICT Access and Use by Households and Individuals 58 Chapter 7. Designing ICT household surveys 206. For the purposes of the Manual, it is recommended that household be defined as follows. A household consists of one or more people, who: • May or may not be related to each other; • Share accommodation; and • Make common provision for food. Examples of household definitions are presented in Box 18. Box 18. Definition of household used in Australia and Hong Kong, China The Australian Bureau of Statistics (ABS), in its 2006-07 multi-purpose survey, that included ICT topics, defined a household as “…a person living alone, or two or more related or unrelated persons who live and eat together in private residential accommodation.” (ABS, 2007). Hong Kong, China defines a domestic household as “a group of persons who live together and make common provision for essentials for living. These persons need not be related. If a person makes provision for essentials for living without sharing with other persons, he is also regarded as a household.” (Census and Statistics Department, Hong Kong, China, 2008). Sample design and selection 207. The main sample design and selection issue for ICT household statistics is the need to produce a representative sample of households and individuals (in order to measure household access to ICT and individual use of ICT). Otherwise, the issues applying more generally to household surveys also apply to those measuring ICT access and use. 208. Some general points related to sampling techniques, and calculation of sample sizes and sampling errors are presented below.114 • For household surveys using face-to-face interviews, where fine geographic tabulation is not required, the clustering of sampled units, that is, concentrating the sample into a few geographic areas, is very cost effective and potential losses of data rigour can usually be compensated by small increases in sample size. • Stratification refers to a grouping of population units into mutually exclusive groups of units referred to as ‘strata’. The grouping is based on values of ‘stratification variables’ such that both homogeneity of units within strata and heterogeneity of units between strata are maximized (with respect to survey variables). Therefore, strata should consist of units that are as similar as possible to each other and as different as possible from units in other strata. The main aim of stratification is to minimize sampling error for a given sample size. Examples of stratification variables for a typical household survey are: average income level, concentration of ethnic groups and level of urbanization. An example of stratification is shown in Box 19. • Actual sample size rather than the sample fraction within strata is the major determinant of the size of sampling error. Therefore, minimum sample sizes need to be maintained, even in strata where the population is low and sampling fractions are high. Conversely, where total sample size is low because of costs, fine stratification should be avoided. Sample sizes will need to be higher where a higher degree of reliability or confidence is required.115 114 Readers should refer to specific chapters of UNSD manuals (UNSD, 2005a, b) for more detailed information. Confidence in an estimate is often expressed as the 95% confidence interval around the estimate, that is the value of the estimate +/– two standard errors (this assumes a normal distribution of the variable being measured). It may also be expressed as the ratio of the estimate’s standard error to the estimate (referred to as the coefficient of variation or the relative standard error). 115 Manual for Measuring ICT Access and Use by Households and Individuals Chapter 7. Designing ICT household surveys 59 • In general, a greater level of detail in output requires a higher sample size for a constant degree of reliability (reflected by the magnitude of sampling error). This is relevant to ICT household statistics where data are disaggregated by some or all the classificatory variables described in Chapter 4. A particular case is sampling for areas where samples may be designed to provide good estimates, requiring some loss of efficiency (that is, the sample size is larger than needed for achieving the desired accuracy for estimates at the national level).116 • Oversampling to compensate for non-response 117 is commonly practised and should be based on the estimated non-response rate.118 It should be recalled that different collection strategies may lead to different non-response rates. • Households, and individuals within those households, should be selected in an unbiased manner. For instance, individuals within households should be randomly chosen. Where a selected individual is not available at the time of interview, they should be contacted later by a follow up visit (or perhaps by telephone). 209. Many surveys have samples selected in a series of steps, with the most complicated (a stratified multi-stage cluster design) as follows:119 • Area sampling. Most countries do not have registers with details of statistical units (household or individual). Those countries will usually take a stratified random sample120 of areas, known as ‘geographic areas’ (or ‘enumeration areas’ or ‘primary sampling units’) as a first step. The areas have known characteristics (commonly derived from the previous population census). The benefits of stratification are particularly evident at this stage, therefore a significant effort should be made to properly stratify geographic areas.121 For most household surveys in developing and transition economies, geographic areas are selected with probability proportional to population size (that is, a large area is more likely to be selected than a small one). • This first stage of sampling results in geographic ‘clusters’, such as villages or city blocks. As the name implies, these are sets of units (usually dwellings or households) that are closely located geographically (‘clustered’) in order to minimize the cost of collection. Clustering, while reducing costs, is also likely to reduce reliability because of higher homogeneity of units within clusters (the ‘clustering effect’).122 • There may be a second sampling stage at the sub-cluster level (for example ‘segments’ or ‘blocks’). • Household sampling. Households (or dwellings) within clusters (or sub-clusters) are typically listed in some fashion in order to create a survey frame. Selection may be random or systematic.120 In order that every household in the population has an equal chance of selection, it is common to have a fixed size sample of households within clusters.123 • If there is more than one household in a dwelling, there is a need to sample households within the dwelling. Typically, information about the household will be provided by an individual within that household (randomly chosen or a responsible person as defined by 116 UNSD (2005a, Chapter II). Treatment of non-response is dealt with in Chapter 8. 118 UNSD (2005b, Chapter 3). 119 Box 19 presents an example of sampling of the ICT household survey for Greece. 120 UNSD (2005a) also refers to systematic sampling of geographic areas in the case where the variable of interest is correlated with one or more variables which are available for the geographic areas. The records are sorted with respect to the available variable/s and then the sample is selected systematically (that is, units are chosen from an ordered list with a random start point and a constant interval between selections). Households may also be systematically sampled within geographic areas where the records can be sorted according to one or more relevant variables. UNSD (2005b) also discusses quota sampling within geographic areas. 121 UNSD (2005a, Chapter IV). 122 See UNSD (2005b, Chapter 3) for more details. 123 UNSD (2005b, Chapter 3). 117 Manual for Measuring ICT Access and Use by Households and Individuals 60 Chapter 7. Designing ICT household surveys the statistical agency; some countries select the household head to provide the information); and • Sampling of individual/s within the household. It is recommended that information in respect of individual ICT use should be provided by a randomly selected in-scope individual, answering questions about him/herself. An acceptable alternative is to randomly sample more than one individual in the household or to collect information from all individuals. Some countries collect information about individuals in a household by proxy, that is, one person (often the household head) responds on behalf of others in the household (often children). However, there are potential biases associated with this approach, which is therefore not recommended.124 If one individual is selected to respond to the individual use questions, typically s/he would also answer the household questions on behalf of the household. Box 19. Greece: stratification of the sample of the ICT household survey In Greece, the 2005 household survey on ICT was carried out using the sample of the Survey on Living Conditions (EU-SILC), which is harmonized in all European Union member states. The sample design was multistage stratified sampling, with primary sampling units defined as areas (one or more geographic areas) and the final unit the household. For the individual questionnaire, one member of the household was selected at random. There are two levels of stratification: (i) The first level is geographical stratification based on the partition of the country area into thirteen standard regions corresponding to the European NUTS II level. The two major city agglomerations of Greater Athens and Greater Thessalonica constitute separate major geographical strata. (ii) The second level of stratification involves grouping municipalities and communes within each NUTS II region by degree of urbanization (that is, according to their population size) into four categories. These categories are defined by the population size intervals 0-999, 1000-4999, 5000-29999 and 30000 and over. The number of final strata in the thirteen regions was 50. The two major city agglomerations were further partitioned into 31 and 9 substrata (administrative subsections), respectively, on the basis of the city blocks of the municipalities that constitute them. Thus, the total number of strata for this survey was 90. Source: National Statistical Service of Greece, http://www.statistics.gr/eng_tables/S803_SFA_3_MT_05_13_Y_EN.pdf. 210. As Table 8 shows, a number of countries use household or individual registers as their primary survey frame. In such cases, records can be selected directly from the register. A variety of sampling methods may be used, including one or two stage stratified random sampling or a mix of stratified random, simple random and systematic sampling. 211. Error associated with a sample is known as sampling error (or sample error). This is an element of data quality and is examined in Chapter 9. 212. Because the sample of households and individuals selected is unlikely to be representative of the population, it is important to weight responses according to independent estimated distributions of the population. This is further discussed in the next chapter. 124 Collection of information about children’s use of ICT can be complicated by national laws preventing interviewing of minors. The alternative of asking another household member to provide information in respect of children’s activities can introduce bias (especially for older children whose activities may not be known to the respondent). However, a number of countries collect information about children in this way. Those that do should take measures to minimize response bias. Manual for Measuring ICT Access and Use by Households and Individuals Chapter 8. Data processing for ICT household statistics 61 Chapter 8. Data processing for ICT household statistics 213. This chapter discusses data processing for ICT household statistics, from the data entry phase of a survey cycle to calculation of output data. Tabulation of results, while an aspect of data processing, is discussed in Chapter 10, Dissemination. 214. Many statistical agencies will have access to generalized computer programs that facilitate data entry, editing, imputation for missing data and non-response, weighting of data, and calculation and tabulation of results. Planning for development work on such programs should run in parallel with other survey planning and be well advanced prior to finalization of questionnaire design. Sequencing of questions and the inclusion of questions that facilitate edit checks need to be planned in conjunction with data processing preparations. 215. Many data processing tasks are not specific to ICT measurement. This chapter therefore pays particular attention to ICT-specific data processing issues, including editing and calculation of ICT indicators. 216. Data processing can be a significant source of non-sampling error, which is discussed in the next chapter. Data entry 217. As we saw in Chapter 8, data entry may occur at the time of the interview, where CAPI or CATI programs are used. In other cases, it will occur as a separate process that may take place in a specialized data entry unit of the statistical agency. 218. As with other aspects of survey implementation, it is important to have good training and procedures for data entry. These will help to minimize data entry errors as will techniques such as use of check digits 125 and other checks of keying accuracy. In practice, quality control checks are often dealt with during data editing rather than data entry.126 Data editing Micro edits 219. Micro editing may also be called input editing and is applied to individual records. There are five different types of micro edits: range checks, checks against reference data, skip checks, consistency checks and typographic checks. They can be described as follows:127 • Range edits check that data values are valid, for instance, categorical variables can only have a predefined value (for example, gender can be coded only as 1 or 2); • Checks against reference data are an example of a range check and involve a comparison of the reported value with external data (such as a reasonable household size range); • Skip edits verify that the logic of the questionnaire has been followed, for instance, that the correct populations are asked each question; in a CAPI or CATI environment, the program 125 A number or letter in a keyed sequence, the value of which is derived from a function involving the other digits in the sequence. If a data entry error is made, the derived check digit will differ from the actual check digit, thus signaling that a keying error has been made. Check digits are typically used for record identifiers and codes rather than quantitative data. 126 UNSD (2005a, Chapter XV). 127 UNSD (2005a, Chapter XV). Manual for Measuring ICT Access and Use by Households and Individuals 62 Chapter 8. Data processing for ICT household statistics will usually determine the skips, so errors should not occur if the programming has been done correctly; • Consistency checks determine whether the information in the questionnaire is internally consistent, for instance, reported age matches reported date of birth (see also Box 20); and • Typographical checks (to find keying errors by the interviewer or data entry operator); these may be difficult to find and may be discovered as a result of other edits or through checkadd (or ‘control’) totals or check digits. Box 20. Example of a consistency check An individual respondent belongs to a household that responded “No” to the question “Does any member of this household/do you have Internet access at home regardless of whether it is used?”. If that individual responds “Yes” to the option “Home” as a response category to the question “Where did you use the Internet in the last 12 months?”, the response is not internally consistent and should be queried by the interviewer. 220. In addition to the five micro edits mentioned above, it can be useful to distinguish ‘fatal’ from ‘non-fatal’ edit failures. There is typically more tolerance of the latter, which are designed to identify values or conditions that are not impossible but are uncommon and worthy of investigation. Fatal errors indicate a situation that is logically impossible and will include things like data components not adding to a total or inconsistent information on age and date of birth. Where there are a large number of fatal errors, investigations into the reasons should be undertaken. They may indicate an error in the editing program or systematic errors made by an individual interviewer. Fatal errors need to be resolved before compromised data records are incorporated into any final tabulation of results. The resolution could be to amend the values causing the failures or to omit the records in error, where they cannot be fixed.128Both solutions have implications for the final calculation of estimates. 221. Where data are collected by personal interview, data editing is often performed during the interview. This can be facilitated by use of CAPI or CATI programs (which should automatically advise the interviewer of edit failures). However, on-the-spot editing during interview can also happen where these computer assisted programs are not used. For instance, the interviewer may have prompts indicating a range of realistic responses. In the case of ICT statistics, an example of such a prompt is that where a household has access to the Internet at home, an individual who uses the Internet but does not select home as one of the locations of use should be probed by the interviewer. This is a ‘non-fatal’ error – a ‘no’ response to home use may be correct but is unlikely. 222. Where data errors are found after interview, it may be difficult (or costly) to resolve them with the respondent. Given the obvious importance of having correct survey data, it is clear that any edits applied during the interview should be carefully specified and tested in advance of the survey. 223. In cases where data are not edited at time of interview, good questionnaire design can be very helpful in minimizing respondent errors. As we saw above, some checks may be used during data entry to uncover keying errors. 224. Table 9 suggests a number of micro level edits for ICT data. They would be applied during an interview (either as prompts to the interviewer using a paper form or as part of CATI/CAPI programs). 128 Such records would be ‘flagged’ with an edit status indicating the existence of fatal errors. It is a simple matter to omit records with such a flag. Manual for Measuring ICT Access and Use by Households and Individuals Chapter 8. Data processing for ICT household statistics 63 Macro edits 225. Macro editing might also be called output editing and consists of checks of aggregated data for coherence, including: • Consistency of estimates over time, for instance, use of the Internet by individuals is expected to grow over time; • Relationships between output variables from the survey, for instance, the proportion of households with a computer would be expected to be higher than the proportion with Internet access; • Relationship with data external to the survey, for instance a survey estimate of the proportion of households with a fixed telephone line should be related to ITU’s infrastructure indicator, fixed telephone lines per 100 inhabitants; and • Logical rules are obeyed, for instance, components of a percentage distribution should add to 100. 226. If major errors are found during macro editing, they might be simply fixed by, for instance, correcting estimation programs if that is where the errors originated. However, if their source lies with the original unit record data, it can be difficult to fix the problem once a survey is completed. It is therefore suggested that, where possible, interim tabulations and macro edits are performed during the course of the survey so that errors that cause failures may be addressed. An understanding of the macro edits to be applied might also be useful at the inception of the survey, for instance, in designing questionnaires or input edits so that failures will not occur at the output stage. 227. Table 9 presents a range of possible micro and macro edits applying to the core ICT indicators. As indicated above, micro edits may be incorporated into CAPI or CATI software or applied after interviews are conducted. During the interview, they may result in probes (or prompts), for example, to confirm a ‘no’ response or to clarify an ‘other’ response. Examples of probes are also included in Table 9. Macro edits would be undertaken on tabulated data as explained above. Countries collecting ICT household statistics for the first time might use results from the surveys of similar countries to apply macro editing. Manual for Measuring ICT Access and Use by Households and Individuals 64 Chapter 8. Data processing for ICT household statistics Table 9. Micro and macro edits for ICT household statistics Indicator Possible micro edits and probes (edits applied to individual records, preferably at time of interview) Possible macro edits (edits applied to aggregated data) HH1 Proportion of households with a radio If HH2 ‘yes’, would expect HH1 response to be ‘yes’ 1. Historical trends, would expect a flat trend or slow growth. 2. Usually, the value of HH1 will be higher than HH2. HH2 Proportion of households with a TV An interviewer could check for the presence of a TV aerial or a set if the interview takes place at the household’s residence. Historical trends, would expect a flat trend or slow growth. HH3 Proportion of households with fixed line telephone An interviewer could possibly check for the presence of a fixed line telephone if the respondent is not sure (if the interview takes place at the household’s residence). 1. Historical trends, would expect a fairly flat trend but may show slow growth or slow decline. 2. Broad consistency with core indicator A1 (fixed telephone lines/100 inhabitants), absolute values and growth. HH3 Proportion of households with mobile cellular telephone As a mobile phone is a personal device, a ‘no’ response may need to be confirmed by a probe asking again if anyone in the household has access to a mobile phone. 1. Historical trends, would expect medium to high growth. 2. Broad consistency with (but lower than) growth rate and values for core indicator A2 (mobile cellular telephone subscribers/100 inhabitants). HH4 Proportion of households with a computer An interviewer could check for presence of a computer if respondent is not sure (if interview takes place at household residence). 1. Historical trends, would expect medium to high growth. 2. Usually, the value of HH4 will be higher than HH6. HH5 Proportion of individuals who used a computer (from any location) in the last 12 months Where a household has access to a computer (HH4), it is quite likely that the selected individual is a computer user. Therefore probe a ‘no’ response. 1. Historical trends, would expect medium to high growth. 2. Usually, the value of HH5 will be higher than HH7. HH6 Proportion of households with Internet access at home An interviewer could check for the presence of an Internet connection (e.g. modem connection) if respondent is not sure (if interview takes place at household residence). 1. Historical trends, would expect medium to high growth. 2. Usually, the value of HH6 will be lower than HH4. HH7 Proportion of individuals who used the Internet (from any location) in the last 12 months Where a household has access to the Internet (HH6), it is quite likely that the selected individual is an Internet user. Therefore probe a ‘no’ response. 1. Historical trends, would expect medium to high growth. 2. Usually, the value of HH7 will be lower than HH5. Manual for Measuring ICT Access and Use by Households and Individuals Chapter 8. Data processing for ICT household statistics Indicator HH8 Possible micro edits and probes Location of individual use of If HH7 is ‘yes’ at least one of the the Internet in the last 12 response categories should be selected. months: See suggestions for response items, below. 65 Possible macro edits 1. Historical trends may not change much unless there is a large change in locations of access, for instance, home Internet access increases or government run community access facilities are opened. 2. The values of these categories, as a percentage of individuals using the Internet, should add to more than 100 (per cent), because many individuals use the Internet at more than one location. Home Where a household has access to the Where household access to the Internet Internet, Internet users who record a ‘no’ is high, this will generally be the largest against this category should be probed. output category. Work Those in the workforce who are Internet users and who record a ‘no’ against this category could be probed. Place of education Students who are Internet users and who record ‘no’ against this category could be probed. Individuals who are not students should not report ‘yes’ against this category; teachers and others who work at a place of education, would report ‘work’ as place of Internet use. Where a place of education is used as a location for general community Internet access, such use should be reported under Community Internet access facility. Another person’s home Community Internet access facility Interviewers may need to use examples relevant to the country to explain this category. The values in this category may increase with policy intervention. Commercial Internet access facility Interviewers may need to use examples relevant to the country to explain this category. Where household access to the Internet is low, this category will often be high, where such facilities are available. Other locations (where used)129 A ‘yes’ response should be probed as it may need to be recoded. The value of this category should be very low. Any place via a mobile cellular telephone Interviewers may need to use examples relevant to the country to explain this category. This is a new category (introduced in 2008). It is likely that values will increase quickly over time. Any place via other mobile access devices Interviewers may need to use examples relevant to the country to explain this category. This is a new category (introduced in 2008). It is likely that values will increase quickly over time. 129 Other locations is not a category in core indicator HH8. However, it can be useful to include ‘Other’ categories in questionnaires. Where the set of response categories (excluding ‘Other’) is considered to be comprehensive, then ‘Other’ responses should be queried and the response recoded if appropriate. Manual for Measuring ICT Access and Use by Households and Individuals 66 Chapter 8. Data processing for ICT household statistics Indicator HH9 Possible micro edits and probes Possible macro edits Internet activities undertaken If HH7 is ‘yes’ at least one of the by individuals (from any response categories should be selected. location)in the last 12 months: The values of these categories, as a percentage of individuals using the Internet, should add to significantly more than 100 (per cent), as most individuals undertake more than one activity. Getting information about goods or services This is often the second highest output category, after Sending or receiving e-mail. Getting information related to Interviewers may need to use examples. health or health services Getting information from government organizations Interacting with general government organizations Interviewers may need to use examples to show which organizations conform to the definition of general government organizations. There may be data from government organizations indicating the extent of usage of their websites. There may be data from government organizations indicating the extent of interactive usage of their websites. Sending or receiving e-mail Interviewers may need to explain what e- This is likely to be the largest output mail is. category. Telephoning over the Internet/VoIP Interviewers may need to explain the technicalities involved in this category. This is a new category (introduced in 2008). It is likely that values will increase quickly over time. Posting information or instant Interviewers may need to explain the messaging technicalities involved in this category. This is a new category (introduced in 2008). It is likely that values will increase quickly over time. Purchasing or ordering goods or services Interviewers may need to provide definitions so that payments are excluded. The size of this category may be related to several factors, including the on-line security environment and the availability of Internet commerce sites. Internet banking Explain the activities per the definition. The size of this category should be related to the availability of Internet banking. Education or learning activities Note that this refers to formal educational activities, this would ideally be included in the question wording. Playing or downloading video games or computer games Interviewers may need to provide examples. Downloading movies, Interviewers may need to provide images, music, watching TV examples. or video, or listening to radio or music Downloading software Interviewers may need to provide examples. Reading or downloading onInterviewers may need to provide line newspapers or magazines, examples. electronic books Other activities (where used)130 130 A ’yes’ response should be probed as it may need to be recoded. However, some activities are valid for this category, e.g. on-line gambling and use of ‘adult content’. The value of this category should be low but is unlikely to be zero given that the list of activities is not comprehensive. Other activities is not a category in core indicator HH9. However, it can be useful to include ‘Other’ categories in questionnaires. Manual for Measuring ICT Access and Use by Households and Individuals Chapter 8. Data processing for ICT household statistics Indicator Possible micro edits and probes HH10 Proportion of individuals The definition of use should be included with use of a mobile cellular in question wording and/or probes. It telephone does not always equate to a subscriber or owner. HH11 Proportion of households with access to the Internet by type of access: Analogue modem ISDN DSL Cable modem Mobile broadband Other narrowband Other broadband 67 Possible macro edits 1. Historical trends, would expect medium to high growth. 2. Broad consistency with core indicator A2 (mobile subscribers/100 inhabitants), absolute values and growth.131 3. Check growth with published information from service providers. If HH6 is ‘yes’ at least one of the response categories should be selected. 1. Historical trends, depending on services available, may expect an increase in broadband and mobile phone Interviewers may need to assist by Internet access. providing specific examples of Internet 2. The values of these categories, access service products available in the expressed as a percentage of country, in each category. households with Internet access, should add to more than 100 (per cent), allowing for some households having more than These would not normally be included in one access method. questionnaires in this form. As above, examples may need to be provided to elicit an accurate response. HH12 Frequency of individual access to the Internet in the last 12 months (from any location): If HH7 is ‘yes’ at least one of the response categories should be selected. 1. Historical trends, may expect slight growth in frequent use and a decrease in infrequent use. 2. The values of the three categories, These categories refer to a typical At least once a day expressed as a percentage of Internet At least once a week but not period; therefore, respondents should users, should add to 100 (per cent) with ignore weekends (if they only use the every day allowances for rounding (2 percentage Internet at work) and breaks from their points). Less than once a week usual routine, such as holidays. HHR1 Proportion of households with electricity If one of HH2, HH4 or HH6 is ‘yes’, it is expected that HHR1 would also be ‘yes’. Where the interview occurs at the household dwelling, the presence of electricity may be directly observable by the interviewer. Compare with known electricity distribution (this may understate the situation as the scope of the question includes electric power generated locally). Imputation for missing data (non-response) 228. Non-response can occur for the whole response – unit non-response, where the respondent refuses, or is unable, to take part in the survey. Non-response can also apply to parts of a questionnaire – item non response, for instance, where a respondent refuses to answer a sensitive question. In many cases, the agency conducting the survey will make estimates for non-response; this is usually referred to as ‘imputation’. Both non-response per se and non-response estimates can be a significant source of bias and therefore need to be handled carefully, especially if there is a high rate of non-response. 229. Imputation for unit non-response may occur in household surveys though, commonly, it will be dealt with by substituting other respondents (in the last chapter we saw that some oversampling to account for unit non-response might be necessary). Imputation, if performed, may 131 The relationship between the indicators HH10 and A2 may be complex. Manual for Measuring ICT Access and Use by Households and Individuals 68 Chapter 8. Data processing for ICT household statistics take the form of adjusting weights so that responding units have higher weights and nonresponding units have a zero weight.132 230. Item non-response (that is non-response to parts of a questionnaire) can be treated like unit non-response if a large proportion of the questionnaire is unanswered. Where this is not the case, the missing data may be imputed, that is, they are replaced with information derived from survey data (from the same or other respondents). In ICT household surveys, there are usually not sensitive questions that might provoke item non-response. However, some of the questions are technical and it is useful for interviewers to have access to technical information, such as definitions of particular ICTs, and information on ICT services and websites available in the country. 231. Imputation techniques for item non-response include use of regression models, hot deck imputation or nearest neighbour imputation. 133 Annex 3 includes examples of imputation for missing items. 232. The best solution to both unit and item non-response is to try and avoid them with good interviewer training and survey material (including initial contact letters or phone calls, questionnaires and publicity material, if used). Where respondents are not available during an initial interview, they should be re-contacted, possibly by phone in the case of a face-to-face interview methodology.134 Weighting of data 233. Data from a sample are weighted to represent the population. The initial ‘design weight’ of a unit in a particular stratum is the inverse of its probability of selection. For example, if a stratum has a population of 100 and 20 are randomly sampled, then the probability of selection is 20/100 and the weight is 100/20 (that is, 5). We saw in the last chapter that most household surveys have more than one stage of sampling. The design weights will incorporate the chance of selection at each stage. A simple example of data weighting is presented in Annex 3. 234. Design weights will usually be adjusted to reflect non-response, unknown eligibility, outof-scope units and/or frame problems, such as duplicate records and undercoverage.135 Box 21. Australia: example of post-stratification The Australian multi-purpose household survey (MPHS) for 2006-07 included a number of ICT household questions. The first step in calculating weights for each unit of the MPHS was to assign an initial weight, which was the inverse of the probability of the unit being selected in the survey. The initial weights were then calibrated to align with independent estimates of the population of interest, referred to as ‘benchmarks’. This ensured that survey estimates conformed to an independently estimated distribution of the population rather than the distribution within the sample. Benchmarks were produced to match the survey’s scope. Estimates for individuals were benchmarked to the estimated civilian population aged 15 years and over living in private dwellings in each Australian state and territory, excluding persons out of scope. Household benchmarks were actually estimates themselves and not strictly known population totals. Source: (ABS, 2007). 235. As we saw in the last chapter, it is also important to weight responses according to independent estimated distributions of the population. This form of weighting compensates for 132 Information on this and other imputation techniques for unit non-response can be found in UNSD (2005a, Chapter VIII). These are described in some detail in UNSD (2005a, Chapters VIII and XVI). 134 UNSD (2005a, Chapter VIII) recommends use of more skilled interviewers to undertake such callback work. 135 See UNSD (2005b, Chapter 6) for adjustment of design weights. 133 Manual for Measuring ICT Access and Use by Households and Individuals Chapter 8. Data processing for ICT household statistics 69 non-representativeness of the effective sample (that is, the population of respondents to the survey). It may be referred to as ‘post-stratification’ or ‘benchmarking’. 236. An additional tier of weighting, ‘trimming of weights’, consists of reducing the size of very large weights to reduce their contribution to the magnitude of estimates and their variance. However, its impact on bias should also be taken into account.136 237. For more information on weighting readers are referred to UNSD (2005b, Chapter 6), which presents a comprehensive technical discussion of weighting. Calculating and reporting of ICT household indicators 238. Calculation of the ICT household indicators, while not complex, needs to be clear so will be described in some detail. 239. Most of the indicators arising from ICT use surveys are presented as proportions data.137 They include proportions of the whole population of households/individuals or of subpopulations, such as particular household types or age groups. Additionally, countries may present data as a proportion of households/individuals that have access to, or use, computers or the Internet. Having two methods of calculation for some indicators can be potentially confusing to users, so it is important to be clear which denominator is used to construct a particular indicator and to have a common approach for reporting purposes. 240. When reporting data to ITU, countries should provide data on numbers of units (rather than proportions or percentages) with a particular ‘ICT characteristic’, for example, the number of adult Internet users, or the number of male computer users. Those numbers should represent the target population and not sample estimates (the difference will reflect the expansion of survey data as well as any post-stratification adjustments). In addition, numbers for the population (e.g. all in-scope adults, to continue the above example), and each subpopulation (e.g. all in-scope males), also need to be provided so that proportions can be calculated. Population numbers should also represent the whole population and not the number of units in the sample. Annex 4 presents tabulations that can be used for reporting on the core ICT indicators to ITU. An example of data reporting is provided in Table 10. 241. It can be seen that the presentation in table 10 provides the data user with maximum flexibility. Examples of calculations which can be made include: The proportion of individuals using a computer, The proportion of males and females using the Internet, The proportion of individuals using the Internet at home, The proportion of Internet users using the Internet at work, The proportion of Internet users aged 25 years or over using the Internet at another person’s home, and The proportion of young people aged 5-24 using computers.138 136 UNSD (2005b, Chapter 6). In particular, all the core ICT household indicators are proportions data. 138 This last calculation involves aggregation of categories. This would not be possible if only percentages (expressed as the proportion within each age group) were provided. 137 Manual for Measuring ICT Access and Use by Households and Individuals 70 Chapter 8. Data processing for ICT household statistics Table 10. Example of data reporting: partial table Variable Estimated population (total in-scope population, not sample number), in thousands Gender Male Age Female 5-14 15-24 25+ 1,214 1,121 370 507 1,458 HH5 Number of individuals who used a computer (from any location) in the last 12 months, in thousands 595 605 183 403 614 HH7 Number of individuals who used the Internet (from any location) in the last 12 months, in thousands 402 439 122 297 422 HH8 Number of individuals who used the Internet at home in the last 12 months, in thousands 206 217 81 150 192 HH8 Number of individuals who used the Internet at work in the last 12 months, in thousands 189 152 5 147 189 HH8 Number of individuals who used the Internet at their place of education in the last 12 months, in thousands 130 134 107 119 38 HH8 Number of individuals who used the Internet at another person's home in the last 12 months, in thousands 53 68 46 38 37 242. Care should be taken when aggregating response categories. Some countries may construct indicators for the core indicators HH8, HH9, HH11 and HH12 based on more detailed response categories. For example, in the ‘location of use’ question in a country survey, the response category ‘community Internet access facilities’ could be comprised of the subcategories, public libraries, digital community centres and other government agencies. 243. In this example, the proportion of Internet users using the Internet at community Internet access facilities is calculated by deriving the number of users who used the Internet at one or more of the locations, public libraries, digital community centres or other government agencies. Clearly, this aggregation has to be done at the unit record level rather than from aggregated data and gives a different answer than if the percentages or numbers accessing the Internet at each of the component locations are summed (this is because those individuals who use the Internet at more than one of these locations will be counted more than once). 244. More information on ITU’s data collection and dissemination for ICT household statistics can be found in Chapter 10. Manual for Measuring ICT Access and Use by Households and Individuals Chapter 9. Data quality and evaluation for ICT household statistics Chapter 9. 71 Data quality and evaluation for ICT household statistics 245. An underlying principle, applicable to all aspects of survey design and implementation, is that it is important to understand sources of error so that it can be minimized. This chapter outlines survey data quality issues, in particular, those specific to household ICT access and use statistics. 246. The chapter examines both sampling and non-sampling error, and provides information on quality assurance techniques and frameworks. It concludes with some general advice on data evaluation. 247. In general, countries should aim to reduce survey error as much as possible by: • Using well-designed samples that are of sufficient size to produce reliable data (that is having low standard errors for the required aggregates); • Careful design and testing of questions and question sequences; • Intensive training and checking of interviewers and other staff; • Reducing non-response rates as far as possible; and • Minimizing data entry, editing and other processing errors. 248. In practice, there will often be trade-offs between sampling and non-sampling error. UNSD139 cites the example of having smaller sample sizes and using more skilled interviewers. This would be expected to reduce non-sampling error, including non-response bias. However, for a given sample design, this strategy will result in higher sampling error, as sampling error is related to sample size. Sampling error 249. Sampling error is the component of survey error that occurs because only a fraction of the total population is sampled. It is said to measure the precision of an estimate. The sampling error of an estimate can be expressed in three ways, all of them a function of the standard error around the estimate,140 noting that the quoted standard error of a survey estimate is an estimate based on observations from the sample. 250. Sampling error may be expressed in terms of the standard error of the estimate of interest, but more commonly it is expressed as a ratio of the standard error of the estimate to the value of the estimate converted to a percentage (for instance, as 2 per cent of the value of the estimate). This provides scale in relation to the estimate and enables simple comparison of the sampling error around different estimates (see Box 22 for an illustration). The ratio is referred to as the ‘relative standard error’ (RSE) or ‘coefficient of variation’ (CV). 251. Sampling error can also be expressed as a confidence interval around an estimate, commonly, a 95 per cent confidence interval. This refers to the probability (95 per cent) that the parameter to be estimated will lie within an interval around the estimate of +/– 2 standard 139 140 UNSD (2005a, Chapter II). The standard error of an estimate is the square root of the estimate’s variance. Manual for Measuring ICT Access and Use by Households and Individuals 72 Chapter 9. Data quality and evaluation for ICT household statistics errors. 141 It assumes that the estimate conforms with a normal statistical distribution, an assumption that is rarely questioned as it usually applies well to large samples. 252. The core indicators for household ICT access and use are all proportions, for instance, the proportion of individuals who used the Internet in the last year. Proportions may be of the total population (for instance, the proportion of households with Internet access) or a subpopulation, such as the proportion of households with Internet access that use broadband to access the Internet at home. In the first case, the estimate is of a proportion. In the second, it is a ratio calculated as an estimate of the number of households with broadband access to the estimate of the number with Internet access. 253. In the case of a simple random sample without replacement, the standard error (SE) of a sample proportion, pˆ , of the population (the first example above) is estimated by: SE ( pˆ ) = (1) N −n pˆ (1 − pˆ ) , ( n − 1) N where pˆ is the sample estimate of the true proportion, p. 254. The relative standard error (or ‘coefficient of variation’) of pˆ is 100* SE ( pˆ ) / pˆ . Examples of the use of standard errors to show RSEs and confidence intervals of simple proportions are provided in Box 22. Box 22. Sampling error of the value of an ICT household indicator If the estimated proportion of individuals who used the Internet in country A in the last year is 0.83 and the standard error of the estimate is 0.01, then the value for core indicator HH7 is 83 per cent and the relative standard error is 100*0.01/0.83 = 1.2 per cent of the estimate. If the estimated proportion of people aged 55-64 who used the Internet in country A in the last year is 0.49 and the SE of the estimate is 0.03, then the value for core indicator HH7 (individuals aged 55-64) is 49 per cent and the RSE is 100*0.03/0.49 = 6.1 per cent of the estimate. It can be seen that the reliability of the two estimates can be directly compared by using the value of the respective RSEs. With a probability of 95 per cent, the value of the parameter to be estimated will lie within the 95 per cent confidence interval. The interval can be expressed as: the sample estimate +/– twice141 its standard error. In the first example, the 95 per cent confidence interval around the estimate is 0.83 +/– 0.02 (twice the SE). Therefore, with a confidence level of 95 per cent, the value of the parameter to be estimated (in percentage terms) will lie in the interval 83–2 to 83+2, that is, between 81 and 85 per cent. The 95 per cent confidence interval in the second example is 0.49 +/– 0.06, that is 43 to 55 per cent. 255. For a complex proportion, both the numerator and denominator are estimated separately from the survey, forming a ratio estimate x . y 256. There is no unbiased estimate with a closed form for the RSE of a ratio, and generally approximations are used. As an example, the Australian Bureau of Statistics (ABS, 2007), uses the following approximation to calculate the RSE of a ratio estimate of x and the RSE of y: (2) 141 ⎛x⎞ RSE ⎜⎜ ⎟⎟ = ([RSE(x)]2 − [RSE(y)]2 ) . ⎝ y⎠ This is an approximation, the multiplier is actually 1.96. Manual for Measuring ICT Access and Use by Households and Individuals x as a function of the RSE y Chapter 9. Data quality and evaluation for ICT household statistics 73 257. ABS applies the formula to the estimate of the proportion of households with broadband access, where x is the estimate of the number of households with broadband access and y is the estimate of the number of households with Internet access. 258. Of particular interest for many statistics, including ICT statistics, is the calculation of the SE of an estimate of change over time (for instance, the number of computer users in 2000 compared with the number in 2007). If the samples on which the two estimates are based are independent, then the SE of the difference over time, xt+1 – xt, is as follows: SE ( xt +1 − xt ) = (3) [SE ( xt +1 )]2 + [SE ( xt )]2 . 259. There is a relationship between the SE and the sample size (n), with the SE decreasing as n increases. Commonly, survey designers will determine in advance (and preferably in accordance with users’ needs) the required reliability for major aggregates (for example, the estimated percentage of households with Internet access should have a RSE of no more than 2 per cent) and then use estimates of the SEs around those aggregates to determine sample size.142 Other determinants of the size of the SE are the population size, the sampling method and the inherent variability in the population of the variable being estimated. 260. Determination of the SE of an estimate becomes much more complicated with a complex survey design, that is, a design involving stratification and more than one sampling level. For instance, consideration must be taken of the degree of homogeneity of units within a cluster and other design effects.143 In this case, SEs are usually calculated as approximations.144 261. It is beyond the scope of this Manual to do more than introduce the subject of sample design and sampling error. Readers are referred to UNSD (2005b), which deals primarily with the design of household surveys and UNSD (2005a), which covers all aspects of household sample survey design and implementation in respect of developing and transition economies. UNSD145 also provides an overview of analysis software packages that may be used to estimate sampling error. A more complete review may be found on the joint Harvard–American Statistical Association’s Summary of Survey Analysis Software website.146 Non-sampling error 262. Non-sampling error (also referred to as ‘bias’) refers to errors in output that are not due to sampling. Non-sampling error (NSE) has diverse origins. The sources and prevention of NSE have been discussed throughout this Manual. NSEs include those related to: Frame inadequacies, including undercoverage, duplicates and incorrect data; Inappropriate or misunderstood question wording; Poor quality or inconsistent interview performance; Non-response; 142 Such estimates might come from previous data. Where the survey is run for the first time, other information could be used, for instance, data on sampling error from similar countries. 143 Described by UNSD (2005a) as follows: “The design effect represents the factor by which the variance of an estimate based on a simple random sample of the same size must be multiplied to take account of the complexities of the actual sample design due to stratification, clustering and weighting.” The square root of the design effect (which UNSD calls the ‘design factor’) is the multiplier applied to a standard error. The design effect is specific to each estimate in a given survey and is generally greater than one. 144 See UNSD (2005a, Chapter XXI) for details. UNSD (2005b, Chapter XXI). 146 See: http://www.hcp.med.harvard.edu/statistics/survey-soft/. 145 Manual for Measuring ICT Access and Use by Households and Individuals 74 Chapter 9. Data quality and evaluation for ICT household statistics Respondent effects (for instance, proxy reporting); and Problems in data processing and tabulation. 263. While non-sampling error is controllable in theory, in practice some NSE will usually persist and it is important to try to describe its extent and nature to data users, even though the size (and sometimes even the direction) of the error is usually difficult to measure. 264. It is worth noting that, to a greater or lesser degree, NSE from different sources may cancel each other, in respect of particular estimates. As an example, a survey frame based on telephone subscribers may lead to over-representation of computer users in the survey estimates, which unadjusted will cause inflated estimates of the proportion of computer users in the population. On the other hand, if the survey questionnaire incorrectly limited the definition of a computer, then some users might be excluded, thus reducing the proportion and cancelling the first error, to some extent. 265. As we saw in Chapter 3, careful planning and testing should reduce NSE. In particular, attention to interviewer training and questionnaire design (Chapter 6), will be well rewarded. 266. More information on NSE can be found in UNSD,147 which discusses ‘non-observation’ errors. These are errors arising from non-response or non-coverage (which is a frame problem, referred to as undercoverage in this Manual). UNSD148 also discusses NSE arising from the questionnaire, method of data collection, the interviewer, and the respondent. It provides some techniques that will assist in understanding bias from these sources and broadly quantifying it. Assessment of data quality 267. Within the constraints of survey resources, a high level of data quality should be the goal of every survey statistician.149 Good statistical agencies have a strong data quality culture that not only enables them to produce high quality data, but also lends credibility to those data. Data quality considerations must be paramount at each stage of the survey process. 268. Data quality can be considered in terms of several dimensions or criteria (for example, relevance, accuracy,150 timeliness and punctuality, accessibility and clarity, comparability, and coherence). It is recommended that countries use at least these dimensions to ensure the quality of ICT household statistics. More specific guidance may be found from the experiences of those statistical organizations that have quality assurance (QA) frameworks based on these dimensions. They include the Australian Bureau of Statistics’ quality template,151 Eurostat’s 2005 code of practice for European statistics (principles 11 to 15 on statistical output)152 and the IMF’s Data Quality Assessment Framework.153 Eurostat has several data quality reports and tools.154 147 UNSD (2005a, Chapter VIII). UNSD (2005a, Chapter IX). 149 Data quality, like everything else in a system of limited resources, is not boundless. For instance, sample sizes may be smaller than ideal or interviewers may be relatively inexperienced. A good survey manager will maximize the quality of the output and may need to suppress data which s/he considers to be unreliable. 150 The word “accuracy” is used by UNSD (2005b) to refer only to non-sampling error. This Manual uses the term to refer to both sampling and non-sampling error. This is consistent with usage of Eurostat and the ABS. See Glossary and abbreviations for more information. 151 http://www.nss.gov.au/nss/home.NSF/533222ebfd5ac03aca25711000044c9e/61743489d51ade77ca2571ab002436be/$FILE/ Appendix%201.pdf. 152 http://epp.eurostat.ec.europa.eu/pls/portal/docs/PAGE/PGP_DS_QUALITY/TAB47141301/VERSIONE_INGLESE_WEB.PDF. 153 Even though the IMF primarily deals with economic statistics, a DQAF module on household income in a poverty context has been developed in collaboration with the World Bank. See: http://dsbb.imf.org/Applications/web/dqrs/dqrsdqaf/. 154 Links can be found on this page: http://epp.eurostat.ec.europa.eu/portal/page?_pageid=2273,1,2273_47143234&_dad=portal&_schema=PORTAL. 148 Manual for Measuring ICT Access and Use by Households and Individuals Chapter 9. Data quality and evaluation for ICT household statistics 75 269. Detailed data quality reports are typically produced for internal approval processes and should address the quality dimensions referred to above. They will also include detailed information about the survey’s results including the results of macro (or output) editing (see Chapter 8) and an explanation of divergences from expected findings.155 Table 13 in Chapter 10 presents metadata associated with the core ICT indicators. The metadata include topics relating to data quality. Evaluation 270. An element of both data quality and evaluation is careful documentation of survey processes and procedures. These may include a priori descriptions of survey plans, including costs, methodologies and procedures. They should also include documentation of costs and procedures as they occur during survey implementation. An example of the latter is the importance of documenting any changes in sample design during the field phase, reflecting changes or adaptations.156 This is necessary for later adjustments and is particularly useful for designing future surveys. 271. After the survey is completed, further documentation should describe the collection and present survey data and metadata. A subset of such information should be disseminated as part of the survey’s output. This is addressed in the next chapter. 272. Staff contributions can also be important to survey evaluation. The experiences of all staff, including interviewers and data entry operators, can be a very useful input to evaluation of a survey and should be obtained shortly after completion of the survey.157 155 UNSD (2005a, Chapter X) discusses quality assurance in some detail. It suggests the need for quality standards, QA procedures and evaluation of QA. It describes the World Health Survey quality standards and assurance procedures devised by the World Health Organization. The standards are presented in stages, representing the stages of a survey cycle and include useful checklists of QA procedures and issues. 156 UNSD (2005b, Chapter 5). 157 See UNSD (2005a, Chapter IV). Their input should be encouraged at other stages as well, given their specialized knowledge on the operations of the survey. Manual for Measuring ICT Access and Use by Households and Individuals Chapter 10. Dissemination of ICT household data and metadata 77 Chapter 10. Dissemination of ICT household data and metadata 273. This chapter deals with dissemination of ICT household statistical data and metadata. It includes example tabulations of core indicator data for household ICT access and individual ICT use. 274. The chapter also considers the international data collection and dissemination work carried out by ITU. Annex 4 includes tabulations that can be used by countries to report on the core ICT indicators to ITU. Data dissemination 275. Data may be released in different formats, including: Hardcopy publications, summaries or press releases; Electronic publications (for instance pdf files of hardcopy publications, web publications in html form, summaries or press releases); and Tables on websites, spreadsheets or CD-ROMs. 276. Data may be free or charged, or a combination. For instance, pdf files might be free to download but printed versions, reflecting their cost of production, may be charged. Hardcopy releases may be provided free to some users, for instance, government departments, but provided at cost to other users. Some agencies provide some free data on their website, but may charge for more detailed data. 277. Some countries may provide microdata from ICT household surveys. These are data at unit record level that have been confidentialized. Such information can be very useful for detailed analysis. 278. All released data should be based on a single approved version of the dataset, unless revisions are later made (in which case, all released data are subject to revision). 279. Where data are deemed unreliable (usually because of high standard errors), they should be suppressed and that should be indicated by a symbol in the cell, for instance, na (for ‘not available’). Where data cells are combined (e.g. the Internet leisure activity categories are aggregated into a single category), the advice on aggregating response categories should be followed (see Chapter 8). Tabulation plans for ICT indicators 280. We saw in Chapter 8 how the ICT household indicators should be calculated and how they should be provided to collection agencies for international compilation purposes. 281. The situation is different for national presentation purposes. In a national context, ICT household data are most likely to be presented as percentages, rather than numbers. For indicators with multiple response categories, it may be more relevant to present data using the active population as the denominator, for example, the proportion of individuals using the Internet rather than the whole population of individuals. In addition, national presentation may Manual for Measuring ICT Access and Use by Households and Individuals 78 Chapter 10. Dissemination of ICT household data and metadata be more (or less) detailed and could include classificatory variables of national interest (such as an urban/rural split). 282. Tables 11 and 12 below are examples of how ICT household core indicator data might be tabulated for dissemination purposes. Table 13 presents an example of tabulation for individual use by location. Similar tabulations can be made to disseminate other indicators with several response categories (Internet activities and frequency of use). The examples include all the classificatory variables associated with the core indicators. Table 11. Example tabulation for household ICT access core indicators Proportion of households with: Household characteristics radio TV telephone (fixed or mobile) fixed telephone only mobile telephone only fixed and mobile telephone Internet access (narrowband or broadcomputer band) narrowband Internet access fixed broadband Internet access mobile broadband Internet access Percentage Household composition has children under 15 does not have children under 15 Size (number of members) 1 2 3-5 6-10 more than 10 Household income158 Province or state159 Zone159 urban rural All households 158 Household income. While this is not a recommended core indicator classificatory variable, it can be a very useful household characteristic. No categories or presentation are suggested, although a quartile presentation might be the simplest. 159 Province or state, and Zone. These are not recommended core indicator classificatory variables but can also be very useful household characteristics for policy purposes, especially where information is required in respect of different areas of a country, including information about any rural/urban divide. Manual for Measuring ICT Access and Use by Households and Individuals Chapter 10. Dissemination of ICT household data and metadata 79 Table 12. Example tabulation for ‘whole population’ individual use indicators160 who used a computer Individual characteristics Proportion of individuals: who used the with use of a Internet mobile phone Percentage Age161 15 to 24 25 to 34 35 to 44 45 to 54 55 to 64 65 to 74 Gender male female Highest education level162 primary education or lower lower secondary education upper secondary or post-secondary non-tertiary tertiary Labour force status163 paid employee self-employed unemployed not in the labour force not classifiable Occupation164 legislators, senior officials and managers professionals technicians and associate professionals clerks service workers and shop and market sales workers skilled agricultural and fishery workers craft and related trades workers plant and machine operators and assemblers elementary occupations armed forces165 Languages read/spoken166 Disability status167 All individuals 160 That is, those indicators, where the whole population (in each population category, e.g. males) is the only possible denominator. These are distinguished from the more complex indicators shown in Table 13, where the denominator might be the whole population or the population of Internet users. The table heading should specify that use is from any location and in respect of the last 12 months (or other period, if used). 161 The 15-24 category may be 16-24 or even 18-24 depending on the age scope used. It is possible to include categories for younger people (e.g. 5-14) and older people (e.g. over 75). 162 Based on ISCED97. 163 Self-employed includes: employers, own account workers, contributing family workers and members of producers' cooperatives. 164 Based on ISCO-88; categories would change slightly with the implementation of ISCO-08 in 2008. See Table 3. 165 Armed forces may be out of scope, in which case the category would not be included. 166 This is not a recommended core indicator classificatory variable but can be very useful in a country where a number of languages are read/spoken (especially where this might be limiting in terms of employment, education, ICT use or other activities). 167 This is not a recommended core indicator classificatory variable but will be of policy interest in some countries. It is important to establish the existence of disability carefully and this might require several questions. Manual for Measuring ICT Access and Use by Households and Individuals 80 Chapter 10. Dissemination of ICT household data and metadata Table 13. Example tabulation for the location of Internet use168 Location of Internet use: Individual characteristics169 any place community commercial via other another Internet Internet via mobile mobile place of person's access access cellular access home work education home facility facility telephone device Percentage of Internet users* Age 15 to 24 25 to 34 35 to 44 45 to 54 55 to 64 65 to 74 Gender male female Highest education level primary education or lower lower secondary education upper secondary or postsecondary non-tertiary tertiary Labour force status paid employee self-employed unemployed not in the labour force not classifiable Occupation legislators, senior officials and managers professionals technicians and associate professionals clerks service workers and shop and market sales workers skilled agricultural and fishery workers craft and related trades workers plant and machine operators and assemblers elementary occupations armed forces All individuals * It can be also presented as a percentage of 'whole population'. 168 In the last 12 months (or other period, if used). It is unlikely that all cells in this table would be filled due to data reliability concerns. See Chapter 10 for information on how to deal with this situation. 169 For notes on the classifications, including other possible classifications, see Table 12. Manual for Measuring ICT Access and Use by Households and Individuals Chapter 10. Dissemination of ICT household data and metadata 81 Metadata reporting and dissemination 283. It is important that countries include relevant survey and data item metadata in published statistical output. This includes information on data quality, which may be considered in terms of several dimensions or criteria (for example, relevance, accuracy,150 timeliness and punctuality, accessibility and clarity, comparability, and coherence). A number of statistical organizations have quality assurance (QA) frameworks based on these dimensions; these were discussed in the previous chapter. Eurostat provides guidance to member country statisticians on how to report data quality according to Eurostat’s quality criteria.170 The reports for Eurostat’s information society statistics consist of webpages containing metadata on the community business and household surveys of ICT access and use.171 OECD has a metadata repository for ICT statistics, which includes metadata for all ICT surveys conducted by OECD countries.172 284. Limitations of survey data should be emphasized and include the fact that data were calculated from a sample of units and the likely existence of non-sampling error (with steps taken to reduce it). Any time series incompatibility should also be described under limitations, for instance, that results should not be compared with those of earlier surveys because of differences in scope or methodology. 285. Standard errors for at least the major aggregates from a survey should be disseminated to data users as they provide a vital indication of the reliability of the estimates. Where relative standard errors are high, users should be alerted to this fact. UNSD suggests that a RSE of 7.5 per cent of the estimate is the maximum that should be allowable for major aggregates. 173 Where RSEs are higher than this level, consideration should be given to suppressing the affected data because of its poor reliability and potential to mislead rather than inform. 286. Metadata can relate to a whole survey or to particular survey results (e.g. a particular indicator).174 Table 14 recommends the broad classes of metadata that should be disseminated with ICT survey data and provides examples. Table 20 in annex 4 presents a tabulation format that can be used to present the minimum required metadata. 170 Information to be reported for each quality criterion can be found here http://epp.eurostat.ec.europa.eu/pls/portal/docs/PAGE/PGP_DS_QUALITY/TAB47143233/STANDARD_QUALITY_REPORT_0.PDF. Quality indicators are discussed in this document, http://epp.eurostat.ec.europa.eu/pls/portal/docs/PAGE/PGP_DS_QUALITY/TAB47143233/STANDARD%20QUALITY%20INDICATOR S.PDF. 171 The base page is a very useful reference for information society statisticians and includes links to questionnaires and individual country metadata records. See: http://europa.eu.int/estatref/info/sdds/en/isoc/isoc_pi_base.htm. 172 This is a web-based annex to the OECD Guide. See: http://www.oecd.org/sti/ictmetadata. 173 Based on the recommendation in UNSD (2005b, Chapter 3). Note that this is higher than the levels stated by Eurostat, which recommends that RSEs for ICT household surveys be no more than 2 per cent for the overall aggregates (for example, proportion of individuals using a computer) and 4 per cent for proportions relating to significant sub-groups of the population (for example, the proportion of females using a computer). 174 An example of survey result (or survey estimate) metadata is information that the estimated proportion of households with a computer is understated because computers were restricted to desktop computers. Manual for Measuring ICT Access and Use by Households and Individuals 82 Chapter 10. Dissemination of ICT household data and metadata Table 14. Metadata associated with ICT household surveys Metadata class Examples of metadata Reference period Survey name and organization conducting the survey (if relevant) Survey history. Main changes over time to survey scope, methodology, definitions, etc. General information about the survey Frequency of survey (quarterly, annual etc). Whether a stand-alone survey or not; a stand-alone survey only collects ICT use data and any other information required to tabulate results (e.g. age, gender). Whether a mandatory or voluntary survey (legal basis for the survey). Major underlying statistical frameworks used (e.g. Partnership core ICT indicators concepts and definitions). Main statistical standards used Differences from international or national standards (for instance, scope differences or differences in concepts or definitions used for individual ICT indicators). Changes in standards over time and their likely impact (for instance, a change in the definition of ‘computer’ between one survey and the next). Might include a glossary of terms used (e.g. the Internet). Main classifications used (e.g. ISCED). Description of household and individual scope where relevant. Scope (target population), survey frame and coverage, statistical units Any significant limitations on the scope or coverage of the survey (e.g. the exclusion of non-urban populations). Survey frame/s used including any inaccuracies such as undercoverage and duplication. Statistical units (household and individual). Collection technique (e.g. face-to-face interview using CAPI). Sample size. Survey methodology Sample design (stratification, sampling stages). Changes in survey methodology and impact on estimates. Weighting methods, including final benchmarking against independent estimates. Response rate Non response treatment For each unit type, households and individuals, and possibly for major disaggregations (e.g. for males and females, areas, linguistic groups). Imputation rules for units. Imputation rules for items. Relative standard errors (coefficients of variation) or confidence intervals the best presentation for RSEs is probably as a table corresponding to data tables; alternatively, RSEs may be presented in a range for each type of aggregate (e.g. total level, province level). Known non-sampling error bias (e.g. non-response, frame errors, questionnaire bias) and attempts made to minimize it. Reference to further information about the survey (usually a website link) might include links to more detailed methodological information, questionnaires, how to obtain more detailed data, future plans etc. Contact information for further information about the survey or survey data An e-mail address is very useful. Manual for Measuring ICT Access and Use by Households and Individuals Chapter 10. Dissemination of ICT household data and metadata 83 Data collection and dissemination of ICT statistics by ITU 287. ITU collects telecommunication data annually for over 200 economies worldwide, with some data series going back as far as 1960. These series traditionally refer to telecommunication and ICT infrastructure data, such us fixed telephone lines, mobile cellular subscribers and Internet subscribers and users. Some of them are included in the Partnership’s core list of indicators (namely, the ICT infrastructure and access indicators, see Annex 1 for details). The main sources for these data are national regulatory authorities and sector ministries in charge of telecommunication/ICT that collect administrative data directly from operators and service providers. For some countries, ITU collects data directly from the incumbent operator. 288. As mentioned in Chapter 2, ITU has expanded its statistical work since 2003 by collecting official household and individual ICT data from national statistical offices. From 2005, ITU has sent an annual questionnaire to all NSOs, requesting data on the core indicators on access to, and use of, ICT by households and individuals. 289. ITU statistics are disseminated in various ways, including printed publications, CD-ROM, and electronic download. In particular, data are disseminated through the World Telecommunication/ICT Indicators (WTI) Database (ITU, 2008), which is available in CD-ROM as well as by electronic download. The WTI Database includes annual time series for over 100 indicators. ITU also produces a number of global and regional reports to analyse regional market trends and developments. Some key telecommunication/ICT data are provided for free, through the ITU’s ICT Eye (www.itu.int/ITU-D/icteye/Default.aspx). ITU data are also shared with other international organizations and are used in inter-governmental publications such as the United Nations Development Programme (UNDP) Human Development Report (UNDP, 2007), the World Bank’s World Development Indicators (World Bank, 2007) and the United Nations Statistical Yearbook (UNSD, 2008c). 290. Household and individual ICT data collected by ITU have been disseminated via regional reports and in the Global Information Society Report: A Statistical View (Partnership, 2008). Relevant results from the questionnaire have also been used to prepare other ITU statistical publications such as the Use of Information and Communication Technology by the World’s Children and Youth (ITU, 2008b). ICT household data collected by ITU will figure prominently in future ITU publications that analyse trends in ICT access and use. Publications of interest are available from the ITU statistics website. 291. The aim of the database project of the Partnership on Measuring ICT for Development, is to make core indicator data freely available. ITU and other Partnership members are currently working with the UN data team to distribute data for the core list of indicators at http://data.un.org/. ITU household ICT data are included in this project. 292. Calculating and reporting of data to ITU for international comparability purposes was described in Chapter 8. We saw that the preferred approach is for countries to provide data on numbers of units (households, individuals) with a particular characteristic rather than proportions or percentages. Numbers for total populations and sub-populations also need to be provided to enable calculation of proportions for various population groups. The point was also made that data on the number of units with a particular ‘ICT characteristic’ (e.g. the number of adult Internet users) and population numbers (e.g. the number of in-scope adults) should represent the whole population and not the sample estimates. Annex 4 presents tabulations that can be used for reporting on the core ICT indicators to ITU. Manual for Measuring ICT Access and Use by Households and Individuals Annex 1. Core list of ICT Indicators (revised 2008) Annex 1. 85 Core list of ICT Indicators (revised 2008)175 Core indicators on ICT infrastructure and access Indicator 175 A1 Fixed telephone lines per 100 inhabitants A2 Mobile cellular telephone subscribers per 100 inhabitants A3 Fixed Internet subscribers per 100 inhabitants A4 Fixed broadband Internet subscribers per 100 inhabitants A5 Mobile broadband subscribers per 100 inhabitants A6 International Internet bandwidth per inhabitant (bits/second/inhabitant) A7 Percentage of population covered by a mobile cellular telephone network A8 Fixed broadband Internet access tariffs (per month), in US$, and as a percentage of monthly per capita income A9 Mobile cellular prepaid tariffs, in US$, and as a percentage of monthly per capita income A10 Percentage of localities with public Internet access centres (PIACs) by number of inhabitants See Partnership (2009) for details, including definitions and notes associated with each indicator. Manual for Measuring ICT Access and Use by Households and Individuals 86 Annex 1. Core list of ICT Indicators (revised 2008) Core indicators on access to, and use of, ICT by households and individuals Indicator HH1 Proportion of households with a radio HH2 Proportion of households with a TV HH3 Proportion of households with telephone Proportion of households with fixed telephone only Proportion of households with mobile cellular telephone only Proportion of households with both fixed and mobile cellular telephone HH4 Proportion of households with a computer HH5 Proportion of individuals who used a computer (from any location) in the last 12 months HH6 Proportion of households with Internet access at home HH7 Proportion of individuals who used the Internet (from any location) in the last 12 months HH8 Location of individual use of the Internet in the last 12 months: Home Work Place of education Another person’s home Community Internet access facility Commercial Internet access facility Any place via a mobile cellular telephone Any place via other mobile access devices HH9 Internet activities undertaken by individuals in the last 12 months (from any location): Getting information about goods or services Getting information related to health or health services Getting information from general government organizations Interacting with general government organizations Sending or receiving e-mail Telephoning over the Internet/VoIP Posting information or instant messaging Purchasing or ordering goods or services Internet banking Education or learning activities Playing or downloading video games or computer games Downloading movies, images, music, watching TV or video, or listening to radio or music Downloading software Reading or downloading on-line newspapers or magazines, electronic books HH10 Proportion of individuals with use of a mobile cellular telephone HH11 Proportion of households with access to the Internet by type of access (narrowband, broadband (fixed, mobile)): Narrowband Fixed broadband Mobile broadband HH12 Frequency of individual use of the Internet in the last 12 months (from any location): At least once a day At least once a week but not every day Less than once a week HHR1 Proportion of households with electricity Manual for Measuring ICT Access and Use by Households and Individuals Annex 1. Core list of ICT Indicators (revised 2008) 87 Core indicators on use of ICT by businesses Indicator B1 Proportion of businesses using computers B2 Proportion of persons employed routinely using computers B3 Proportion of businesses using the Internet B4 Proportion of persons employed routinely using the Internet B5 Proportion of businesses with a web presence B6 Proportion of businesses with an intranet B7 Proportion of businesses receiving orders over the Internet B8 Proportion of businesses placing orders over the Internet B9 Proportion of businesses using the Internet by type of access (narrowband, broadband (fixed, Narrowband Fixed broadband Mobile broadband B10 Proportion of businesses with a local area network (LAN) B11 Proportion of businesses with an extranet B12 Proportion of businesses using the Internet by type of activity: Sending or receiving e-mail Telephoning over the Internet/VoIP Posting information or instant messaging Getting information about goods or services Getting information from general government organizations Interacting with general government organizations Internet banking Accessing other financial services Providing customer services Delivering products on line Internal or external recruitment Staff training Manual for Measuring ICT Access and Use by Households and Individuals 88 Annex 1. Core list of ICT Indicators (revised 2008) Core indicators on the ICT (producing) sector Indicator ICT1 Proportion of total business sector workforce involved in the ICT sector (expressed as a percentage) ICT2 ICT sector share of gross value added (expressed as a percentage of total business sector gross value added) Core indicators on trade in ICT goods Indicator ICT3 ICT goods imports as a percentage of total imports ICT4 ICT goods exports as a percentage of total exports Core indicators on ICT in education Indicator ED1 Proportion of schools with a radio used for educational purposes (by ISCED level 1 to 3) ED2 Proportion of schools with a TV used for educational purposes (by ISCED level 1 to 3) ED3 Proportion of schools with a telephone communication facility (by ISCED level 1 to 3) ED4 Student-to-computer ratio (by ISCED level 1 to 3) ED5 Proportion of schools with Internet access, by type (by ISCED level 1 to 3): Fixed narrowband Fixed broadband Both fixed narrowband and broadband ED6 Proportion of students who have access to the Internet at school (by ISCED level 1 to 3) ED7 Proportion of students enrolled by gender at the tertiary level in ICT-related fields (for ISCED levels 5 and 6) ED8 Proportion of ICT-qualified teachers in primary and secondary schools EDR1 Proportion of schools with electricity (by ISCED level 1 to 3)176 176 Since electricity is not specifically an ICT commodity, but an important prerequisite for using many ICTs, it is not included in the core list, but included as a reference indicator. International studies reviewed by UIS reveal that the lack of electricity is such a significant barrier in many developing economies that monitoring trends of its provision is as relevant as monitoring the supply and use of ICT. Manual for Measuring ICT Access and Use by Households and Individuals Annex 2. ITU Model Questionnaire Annex 2. 89 ITU model questionnaire for measuring ICT access and use by households and individuals 1. The model questionnaire can be used in a stand-alone ICT household survey or as a module in an existing survey vehicle, for example, a multi-purpose household survey. If used as a module in an existing survey, it is likely that sections 1 and 3 would not be needed (or could be reduced) as such information is likely to be included elsewhere in the survey vehicle. 2. The model questionnaire is not an operational questionnaire that can be used directly in countries’ household surveys. This is because countries conduct household ICT access and use surveys in different ways, each requiring their own types of survey instruments. For instance, a questionnaire that is self-enumerated will look quite different from one designed for a telephone survey, which in turn will differ from a questionnaire used in face-to-face interviewing. 3. It is not expected that the structure, question wording or definitions that comprise the model questionnaire would be used unchanged (or literally translated) in national surveys. However, it is important for comparability purposes that: • Where questions are used, their meanings are preserved, and • The logic is preserved to the extent that the same (or very similar) populations of households or individuals are asked each question. Manual for Measuring ICT Access and Use by Households and Individuals 90 Annex 2. ITU Model Questionnaire ITU model questionnaire for measuring ICT access and use by households and individuals Section 1: Household characteristics 1 Number of household members a. This question is asked of all in-scope households. b. It includes members who are older or younger than the individual age scope used for the survey. 2 Number of children aged 15 years or younger a. This question is asked of all in-scope households. 3 Does the dwelling in which this household resides have access to electricity? a. This question is asked of all in-scope households. b. Electricity access may be by a grid/mains connection, or from power generated locally (including at the dwelling). Local power includes electricity generated by a fuel-powered generator, or from renewable resources such as wind, water or solar. It excludes sole use of energy storage devices, such as batteries (though these may be used to store electricity from other sources). Yes No Yes No Yes No Interviewer instructions c. Where the interview occurs at the household dwelling, the presence of electricity may be directly observable by the interviewer, in which case the question does not need to be asked. Section 2: Household access to information and communication technology 4 Does any member of this household/do you have a radio at home? a. This question is asked of all in-scope households. b. A radio is a device capable of receiving broadcast radio signals, using popular frequencies, such as FM, AM, LW and SW. It includes a radio set integrated in a car or an alarm clock but excludes radios integrated with a mobile phone, a digital audio player (MP3 player) or in a computer. c. The equipment should be in working order or expected to be returned to working order soon. Interviewer instructions d. The interviewer should probe a 'no' response to this question if the response to Q5 is 'yes'. 5 Does any member of this household/do you have a television at home? a. This question is asked of all in-scope households. b. A television (TV) is a stand-alone device capable of receiving broadcast television signals, using popular access means such as over-the-air, cable and satellite. It excludes TV functionality integrated with another device, such as a computer or a mobile phone. c. The equipment should be in working order or expected to be returned to working order soon. Interviewer instructions d. The interviewer could check for the presence of a TV aerial or a TV set if the interview takes place at the household’s residence. Manual for Measuring ICT Access and Use by Households and Individuals 91 Annex 2. ITU Model Questionnaire 6 Does this household have a fixed line telephone at home? a. This question is asked of all in-scope households. b. A fixed telephone line refers to a telephone line connecting a customer's terminal equipment (e.g. telephone set, facsimile machine) to the public switched telephone network (PSTN) and which has a dedicated port on a telephone exchange. c. The equipment should be in working order or expected to be returned to working order soon. Yes No Yes No Yes No Yes No Interviewer instructions d. The interviewer could possibly check for the presence of a fixed line telephone if the respondent is not sure (if the interview takes place at the household’s residence). 7 Does any member of this household/do you have a mobile telephone at home? a. This question is asked of all in-scope households. b. at home means that the mobile telephone can be used by members of the household, though it is not restricted to home use. c. A mobile (cellular) telephone refers to a portable telephone subscribing to a public mobile telephone service using cellular technology, which provides access to the PSTN. This includes analogue and digital cellular systems, as well as IMT-2000 (3G). Users of both post-paid subscriptions and pre-paid accounts are included. d. The equipment should be in working order or expected to be returned to working order soon. 8 Does any member of this household/do you have a computer at home, regardless of whether it is used? a. This question is asked of all in-scope households. b. A computer refers to a desktop or a laptop computer. It does not include equipment with some embedded computing abilities such as mobile cellular phones, personal digital assistants (PDAs) or TV sets. c. The equipment should be in working order or expected to be returned to working order soon. Interviewer instructions d. The interviewer could possibly check for the presence of a computer (e.g. a desktop PC) if the interview takes place at the household’s residence. 9 Does any member of this household/do you have access to the Internet at home, regardless of whether it is used? a. This question is asked of all in-scope households. b. The Internet is a world-wide public computer network. It provides access to a number of communication services including the World Wide Web and carries email, news, entertainment and data files. c. Access may be by any device enabling Internet access (not only a computer). It may also be by mobile phone, PDA, games machine, digital TV etc. Access can be via a fixed or mobile network. Go to 11 Interviewer instructions d. The interviewer may be able to check for the presence of some kinds of Internet connection (e.g. a modem connection) if the respondent is not sure (if the interview takes place at the household’s residence). Manual for Measuring ICT Access and Use by Households and Individuals 92 10 Annex 2. ITU Model Questionnaire What type/s of Internet access services are used for Internet access at home? Narrowband Analogue modem Yes No Yes No Yes No Yes No Yes No Yes No Mobile broadband refers to mobile cellular networks with access to the Internet at speeds greater than or equal to 256 kbit/s, in one or both directions, such as Wideband CDMA (WCDMA), Universal Mobile Telecommunications System (UMTS); High-speed Downlink Packet Access (HSDPA), complemented by High-Speed Uplink Packet Access (HSUPA); CDMA2000 1xEV-DO and CDMA 2000 1xEV-DV. Access can be via any device (handheld computer, laptop or mobile cellular telephone etc.). Yes No Do not know Yes No Dial-up via standard telephone line; it requires that the modem dial a phone number when Internet access is needed. ISDN ISDN (Integrated Services Digital Network) turns a traditional telephone line into a higher speed digital link. Other Narrowband Includes mobile phone and other forms of access with an advertised download speed of less than 256 kbit/s (including CDMA 1x (Release 0), GPRS, WAP and i-mode). Broadband DSL DSL (Digital Subscriber Line) includes ADSL, SDSL, VDSL and uses ordinary telephone lines. Cable modem A cable modem uses cable TV lines for connecting to the Internet. Other fixed broadband Includes technologies at speeds greater than or equal to 256 kbit/s, in one or both directions, such us leased lines, fibre-to-the-home, satellite, fixed wireless, Wireless Local Area Network and WiMAX. Mobile broadband a. This question is asked of all in-scope households with access to the Internet at home. b. Record all Internet access services used by the household (that is, allow multiple responses). c. It is not necessary to explicitly present categories grouped into narrowband and broadband, but the question should be worded in a way that makes it easy for the interviewer and the respondent to differentiate between narrowband and broadband Internet access. d. Where possible, use specific country examples for the two 'other' categories. e. The Mobile broadband category can be split into several categories reflecting available country services. f. Note that DSL services with an advertised download speed of less than 256kbit/s are defined as narrowband. Where such services exist, they should be placed in a separate category to enable aggregation to total narrowband. Manual for Measuring ICT Access and Use by Households and Individuals 93 Annex 2. ITU Model Questionnaire Section 3: Individual characteristics 11 Age (years) a. This question is asked of all in-scope individuals. 12 Gender Male Female a. This question is asked of all in-scope individuals. 13 Educational level Primary education or lower Includes no formal education, pre-primary or primary education. Lower secondary education Upper secondary or post-secondary non-tertiary Tertiary a. This question is asked of all in-scope individuals. b. Categories are based on UNESCO's International Standard Classification of Education (ISCED97), or the equivalent national classification. 14 Labour force status Paid employee Self-employed Includes employers, own account workers, contributing family workers and members of producers' cooperatives. Unemployed Not in the labour force Individuals who are not economically active: usually students (not in the workforce), people undertaking home duties only, and those who are retired or infirm. Go to 16 a. This question is asked of all in-scope individuals. b. Categories are based on the International Labour Organization's (ILO) International Classification of Status in Employment (ICSE93), or the equivalent national classification. 15 Main occupation (please describe) ..…………………………… a. This question is asked of all in-scope individuals. b. Responses should be coded according to the 1-digit categories of the International Labour Organization's International Standard Classification of Occupations (ISCO 1988 or 2008), or the equivalent national classification. Manual for Measuring ICT Access and Use by Households and Individuals 94 Annex 2. ITU Model Questionnaire Section 4: Individual use of information and communication technology 16 Did you have use of a mobile telephone during some or all of the last 12 months? a. This question is asked of all in-scope individuals. b. Use of a mobile telephone does not mean that the telephone is owned or paid for by the person but should be reasonably available through work, a friend or family member, etc. It excludes occasional use, for instance, borrowing a mobile phone to make a call. 17 No Yes No Yes No Have you used a computer from any location in the last 12 months? a. This question is asked of all in-scope individuals. b. A computer is defined above (Q8). 18 Yes Have you used the Internet from any location in the last 12 months? a. This question is asked of all in-scope individuals (not only those who have used a computer). b. The Internet is defined above (Q9). c. The Internet can be accessed by any device that enables Internet access (not only a computer). Devices include mobile phone, PDA, games machine and digital TV. Access can be via a fixed or mobile network. Manual for Measuring ICT Access and Use by Households and Individuals Go to 19 No more questions 95 Annex 2. ITU Model Questionnaire 19 Where did you use the Internet in the last 12 months? Home Work Where a person’s workplace is located at his/her home, then s/he would answer yes to the home category only. Place of education For students. Teachers and others who work at a place of education, would report ‘work’. Where a place of education is used as a location for general community Internet use, this use should be reported in 'community Internet access facility'. Another person’s home The home of a friend, relative or neighbour. Community Internet access facility For example, public libraries, publicly provided Internet kiosks, non-commercial telecentres, digital community centres, post offices, other government agencies; access is typically free and is available to the general public. Commercial Internet access facility For example, Internet or cyber cafés, hotels, airports etc; access is typically paid (i.e. not free of charge). Other locations (please specify………………...…..…………….) Excluding use at any location via a mobile cellular telephone or other mobile access device. Any place via a mobile telephone Use at any location via a mobile cellular telephone (including handheld devices with mobile phone functionality). Any place via another mobile access devices Use at any location via other mobile access devices, e.g. laptop computer or handheld device that uses wireless access (at a WiFi ‘hotspot’) or laptop connected to a mobile phone network. Yes No Yes No Yes No Yes No Yes No Yes No Yes No Yes No Yes No a. This question is only asked of individuals who used the Internet in the last 12 months. b. Record all locations where individuals used the Internet (that is, allow multiple responses). c. The Internet is defined above (Q9). d. The Internet can be accessed by any device that enables Internet access (not only a computer). Devices include mobile phone, PDA, games machine and digital TV. e. Except for mobile access from any location, the locations are associated with the technology used e.g. a desktop or laptop computer installed at work or at an Internet café. f. Where a household has access to the Internet, probe Internet users who record a ‘no’ against 'Home'. g. Countries can replace the Community and/or Commercial Internet access facility categories with those that reflect the types of facilities available in their country. 20 How often did you typically use the Internet during the last 12 months (from any location)? At least once a day Once a working day for those who only (or most frequently) use the Internet from work. At least once a week but not every day Less than once a week a. This question is only asked of individuals who used the Internet in the last 12 months. b. The question refers to a typical period; therefore, respondents should ignore weekends (if they only use the Internet from work) and breaks from their usual routine, such as holidays. c. The Internet is defined above (Q9). d. The Internet can be accessed by any device that enables Internet access (not only a computer). Devices include mobile phone, PDA, games machine and digital TV. Manual for Measuring ICT Access and Use by Households and Individuals 96 21 Annex 2. ITU Model Questionnaire For which of the following activities did you use the Internet for private purposes in the last 12 months (from any location)? Getting information about goods or services Yes No Getting information related to health or health services Yes No Yes No Yes No Yes No Yes No Yes No Yes No Yes No Yes No Yes No Yes No Yes No Yes No Yes No Includes information on injury, disease, nutrition and improving health generally. Getting information from government organizations Government organizations Include central, state and local government units. Information may be obtained via websites or email. Interacting with government organizations Government organizations Include central, state and local government units. Interacting with government organizations includes downloading/requesting forms, completing/lodging forms on line, making on-line payments and purchasing from government organizations. It excludes getting information from government organizations. Sending or receiving email Telephoning over the Internet/VoIP Using Skype, iTalk, etc. Includes video calls (via webcam). Posting information or instant messaging Posting messages or other information to chat sites, blogs, newsgroups, online discussion forums and similar; use of instant messaging. Purchasing or ordering goods or services Purchasing or ordering goods or services refers to purchase orders placed via the Internet whether or not payment was made on line. Orders that were cancelled or not completed are excluded. Includes purchasing of products, such as music, travel and accomodation via the Internet. Internet banking Includes electronic transactions with a bank for payment, transfers, etc. or for looking up account information. Excludes electronic transactions via the Internet for other types of financial services such as share purchases, financial services and insurance. Education or learning activities (formal) Formal learning activities such as study associated with school or tertiary education courses as well as distance education involving on-line activities. Playing or downloading video games or computer games Includes file sharing games and playing games on line, either paid or free of charge. Downloading movies, images, music, watching TV or video, or listening to radio or music Includes file sharing and using web radio or web television, either paid or free of charge. Downloading software Includes downloading of patches and upgrades, either paid or free of charge . Reading or downloading on-line newspapers or magazines, electronic books Includes accessing news websites, either paid or free of charge. Includes subscriptions to on-line news services. Other activities (please specify……………………………………) a. This question is only asked of individuals who used the Internet in the last 12 months. b. Record all Internet activities undertaken (that is, allow multiple responses). Activities are not mutually exclusive. c. Private means not as part of one's current job or business. d. The Internet is defined above (Q9). e. The Internet can be accessed by any device that enables Internet access (not only a computer). Devices include mobile phone, PDA, games machine and digital TV. f. Government organizations should be explained to respondents in a way that is consistent with the SNA93 (2008 revision) concept of general government. According to the SNA “… the principal functions of government are to assume responsibility for the provision of goods and services to the community or to individual households and to finance their provision out of taxation or other incomes; to redistribute income and wealth by means of transfers; and to engage in non-market production.” (General) government organizations include central, state and local government units. Some countries clarify the definition by listing particular general government organizations or functions of those organizations. Manual for Measuring ICT Access and Use by Households and Individuals Annex 2. ITU Model Questionnaire 97 Notes and instructions to questionnaire designers a. Where there is no ‘Go to’ direction, the respondent is asked the next question. b. The term "do you" in questions 4, 5, 7, 8 and 9 is included to cover single person households. It does not refer to individual activities. c. For questions 10, 19 and 21, country variations are: remove categories where items are not feasible; and add or split categories corresponding to country data requirements. Care should be taken when adding or splitting categories that statistical bias is not introduced. This could occur if the provision of alternative categories affects response. Care should be taken when aggregating detailed sub-categories of these questions to avoid double counting individuals who respond to more than one of the subcategories. d. For questions 10, 19 and 21, countries may ask about response categories as a series of yes/no questions, rather than a single 'list' question. The method chosen will reflect the method of data collection e.g. a telephone interview is more likely to use a series of questions, especially for the questions with a large number of response items. e. For question 20, countries are able to add additional frequency categories if they wish to obtain finer level information. Manual for Measuring ICT Access and Use by Households and Individuals Annex 3. Examples of imputation and weighting 99 Annex 3. Examples of imputation and weighting Imputation for missing data The following table shows raw data from a survey on ICT use by households. Each row represents data from one survey record. ‘Missing’ refers to item non-response. The statistician is interested in imputing a value for the missing data ‘use of Internet’ for records #1, #4 and #6. Record ID #1 #2 #3 #4 #5 #6 #7 #8 Access to Internet (household) No No Yes Yes Yes Yes No No Education level (individual) Primary Primary Tertiary Secondary Tertiary Tertiary Secondary Primary Use of Internet (individual) Missing No Yes Missing Yes Missing Yes No The statistician can select different rules for imputation as follow: • Rule 1: A deterministic rule that imputes ‘Yes’ to all missing values for the item ‘Use of Internet’ if the household has access to Internet and ‘No’ otherwise. • Rule 2: A deterministic rule that imputes ‘Yes’ to all missing values for the item ‘Use of Internet’ if the household has access to Internet and the level of education of the individual is ‘Tertiary’, and ‘No’ otherwise. • Rule 3: A rule that imputes the most frequent value of the item ‘Use of Internet’ in the set of records with the same value for ‘Access to Internet’. • Rule 4: A rule that imputes the most frequent value of the item ‘Use of Internet’ in the set of records with the same value for ‘Level of education’. The application of the above rules is shown below. Rule 1 2 3 4 Record #1 No No No (there are 2 ‘No’ and 1 ‘Yes’ responses in the set of records with no access to Internet ) No (there are 2 ‘No’ and 0 ‘Yes’ responses in the set of records with Primary education ) Imputed value for ‘Use of Internet’ Record #4 Record #6 Yes Yes No Yes Yes Yes (there are 2 ‘Yes’ and 0 (there are 2 ‘Yes’ and 0 ‘No’ responses in the set of ‘No’ responses in the set of records with access to records with access to Internet ) Internet ) Yes Yes (there is 1 ‘Yes’ and 0 ‘No’ (there are 2 ‘Yes’ and 0 responses in the set of ‘No’ responses in the set of records with Secondary records with Tertiary education ) education) It should be noted that the selection of one or other rule will produce biases in the final estimates. In general, methods based on the replacement of a missing value by a modal, median or average value of the same variable in a set of ‘similar’ records reduces the bias, but also artificially reduces the variance of the population. Manual for Measuring ICT Access and Use by Households and Individuals 100 Annex 3. Examples of imputation and weighting Weighting records Suppose that a population of households has been sampled, producing a stratified random sample of 9 units from strata A and B as follows: Stratum A B Population size 3,000 1,000 Sample size 5 4 The results of the survey provide the following records: Household ID Stratum #1 #2 #3 #4 #5 #6 #7 #8 #9 A A B A B A B A B Access to computer (household) No No Yes Yes Yes Yes No Yes Yes Access to Internet (household) No No No Yes Yes Yes No No No The sampling weight of each household in A is equal to 3,000 /5 = 600, while for one in B, it is 1,000/4 = 250. Population estimates for the proportion of households with access to a computer are calculated by weighting each household in A by 600 and each one in B by 250. This gives the following statistics: Stratum Number of households with access to computer (unweighted) Number of households with access to Internet (unweighted) A B 3 3 2 1 Number of households with access to computer (weighted) 1,800 750 Number of households with access to Internet (weighted) 1,200 250 The weighted proportions of households with a computer and access to the Internet are: Stratum Total number of households A B 3,000 1,000 Number of households with access to computer (weighted) 1,800 750 Number of households with access to Internet (weighted) 1,200 250 Proportion of households with access to computer (weighted) Proportion of households with access to Internet (weighted) 1,800/3,000 = 60% 750/1,000 = 75% 1,200/3,000 = 40% 250/1,000 = 25% While, in each stratum, the weighted estimate is equivalent to the estimate based on the sample proportion, for the total population, the estimates are: Population Total number of households A+B 4,000 Number of households with access to computer (weighted) 1,800+750 = 2,550 Number of households with access to Internet (weighted) Proportion of households with access to computer 1,200+250 = 1,450 2,550/4,000 = 63.75% Manual for Measuring ICT Access and Use by Households and Individuals Proportion of households with access to Internet (weighted) 1,450/4,000 = 36.25% 101 Annex 4. Tabulations Annex 4. Tabulations for reporting on the core ICT indicators Table 15. Tabulation for reporting on households access to ICT Household characteristics All households No. Indicator Household composition has children under 15 does not have children under 15 Size (number of members) 1 2 3-5 6-10 more than 10 Zone urban rural All households HH1 HH2 HH3 Number of households with a radio Number of households with a TV Number of households with: telephone (fixed or mobile) fixed telephone only HH4 HH6 HH11 mobile cellular telephone only both fixed and mobile telephone Number of households with a computer Number of households with Internet access at home Number of households with access to the Internet, by type of access narrowband fixed broadband mobile broadband HHR1 Number of households with electricity Manual for Measuring ICT Access and Use by Households and Individuals 102 All individuals No. Indicator All individuals HH10 HH5 HH7 HH8 Number of individuals with use of a mobile cellular telephone Number of individuals who used a computer Number of individuals who used the Internet Number of individuals who used the internet, by location of use at home at work at place of education at another person’s home at community Internet access facility at commercial Internet access facility at any place via a mobile cellular telephone HH12 at any place via other mobile access devices Number of individuals using the Internet, by frequency at least once a day at least once a week but not every day less than once a week Gender Male Female Age and Gender Less than 15 male female 15-24 male female 25-34 male female 35-44 male female 45-54 male female 55-64 male female 65-74 male female 74 + male female Annex 4. Tabulations Manual for Measuring ICT Access and Use by Households and Individuals Table 16. Tabulation for reporting on individual use of ICT broken down by age and gender Table 16. Tabulation for reporting on individual use of ICT broken down by age and gender (continued) All individuals No. HH9 Indicator Gender Male Female Age and Gender Less than 15 male female 15-24 male female 25-34 male female 35-44 male female 45-54 male female 55-64 male female 65-74 male female 74 + male female Number of individuals who used the internet, by activity Getting information about goods or services Posting information or instant messaging Purchasing or ordering goods or services Internet banking Education or learning activities Playing or downloading video games or computer games Downloading movies, images, music, watching TV or video, or listening to radio or music Downloading software Reading or downloading on-line newspapers or magazines, electronic books Annex 4. Tabulations 103 Manual for Measuring ICT Access and Use by Households and Individuals Getting information related to health or health services Getting information from general government organizations Interacting with general government organizations Sending or receiving e-mail Telephoning over the Internet/VoIP 104 Annex 4. Tabulations Table 17. Tabulation for reporting on individual use of ICT broken down by highest education level received All individuals No. Indicator Highest education level received primary education or lower All individuals HH10 Number of individuals with use of a mobile cellular telephone HH5 Number of individuals who used a computer HH7 Number of individuals who used the Internet HH8 Number of individuals who used the internet, by location of use at home at work at place of education at another person’s home at community Internet access facility at commercial Internet access facility at any place via a mobile cellular telephone at any place via other mobile access devices HH12 Number of individuals using the Internet, by frequency at least once a day at least once a week but not every day less than once a week HH9 Number of individuals who used the internet, by activity Getting information about goods or services Getting information related to health or health services Getting information from general government organizations Interacting with general government organizations Sending or receiving e-mail Telephoning over the Internet/VoIP Posting information or instant messaging Purchasing or ordering goods or services Internet banking Education or learning activities Playing or downloading video games or computer games Downloading movies, images, music, watching TV or video, or listening to radio or music Downloading software Reading or downloading on-line newspapers or magazines, electronic books Manual for Measuring ICT Access and Use by Households and Individuals lower secondary education upper secondary or post-secondary non-tertiary tertiary Annex 4. Tabulations 105 Table 18. Tabulation for reporting on individual use of ICT broken down by labour force status All individuals No. Indicator Labour force status paid employee selfemployed unemployed not in the labour force not classifiable All individuals HH10 Number of individuals with use of a mobile cellular telephone HH5 Number of individuals who used a computer HH7 Number of individuals who used the Internet HH8 Number of individuals who used the internet, by location of use at home at work at place of education at another person’s home at community Internet access facility at commercial Internet access facility at any place via a mobile cellular telephone at any place via other mobile access devices HH12 Number of individuals using the Internet, by frequency at least once a day at least once a week but not every day less than once a week HH9 Number of individuals who used the internet, by activity Getting information about goods or services Getting information related to health or health services Getting information from general government organizations Interacting with general government organizations Sending or receiving e-mail Telephoning over the Internet/VoIP Posting information or instant messaging Purchasing or ordering goods or services Internet banking Education or learning activities Playing or downloading video games or computer games Downloading movies, images, music, watching TV or video, or listening to radio or music Downloading software Reading or downloading on-line newspapers or magazines, electronic books Manual for Measuring ICT Access and Use by Households and Individuals 106 Occupation All individuals No. Indicator All individuals HH10 HH5 HH7 HH8 Number of individuals with use of a mobile cellular telephone Number of individuals who used a computer Number of individuals who used the Internet Number of individuals who used the internet, by location of use at home at work at place of education at another person’s home at community Internet access facility at commercial Internet access facility at any place via a mobile cellular telephone at any place via other mobile access devices HH12 Number of individuals using the Internet, by frequency at least once a day at least once a week but not every day less than once a week legislators, senior officials and managers professionals technicians and associate professionals clerks service workers and shop and market sales workers skilled agricultural and fishery workers craft and related trades workers plant and machine operators and assemblers elementary occupations armed forces Annex 4. Tabulations Manual for Measuring ICT Access and Use by Households and Individuals Table 19. Tabulation for reporting on individual use of ICT broken down by Occupation Table 19. Tabulation for reporting on individual use of ICT broken down by Occupation (continued) Occupation All individuals No. HH9 Indicator legislators, senior officials and managers professionals technicians and associate professionals clerks service workers and shop and market sales workers skilled agricultural and fishery workers craft and related trades workers plant and machine operators and assemblers elementary occupations armed forces Number of individuals who used the internet, by activity Getting information about goods or services Getting information related to health or health services Interacting with general government organizations Sending or receiving e-mail Telephoning over the Internet/VoIP Posting information or instant messaging Purchasing or ordering goods or services Internet banking Education or learning activities Playing or downloading video games or computer games Annex 4. Tabulations Downloading movies, images, music, watching TV or video, or listening to radio or music Downloading software Reading or downloading on-line newspapers or magazines, electronic books 107 Manual for Measuring ICT Access and Use by Households and Individuals Getting information from general government organizations 108 Annex 5. Glossary and abbreviations Table 20. Reporting of metadata for an ICT household Survey177 Survey information Survey name Organization conducting the survey Contact information for further information about the survey or survey data Reference period Frequency of survey Type of survey Legal basis for the survey, if any Total number of in scope households Total number of in scope individuals Survey frame Statistical units Collection technique Sample size Sample design Weighting methods Response rate Non response treatment Standard errors (coefficients of variation) or confidence intervals Known non-sampling error Reference to further information about the survey (Website URL) Other remarks related to the survey not mentioned above 177 For description and additional information on metadata see Table 14 Manual for Measuring ICT Access and Use by Households and Individuals Year Annex 5. Glossary and abbreviations 109 Annex 5. Glossary and abbreviations Term or abbreviation 3G Accuracy150 ADSL Analogue modem Anti-spyware software External source, if relevant Notes 3G (and 3.5G) is third generation mobile telephone technology. It includes: -Wideband CDMA (W-CDMA), an IMT-2000 3G mobile network technology, based on CDMA that presently delivers packet-switched data transmission speeds up to 384 kbit/s and up to 2 Mbit/s when fully implemented. It is known as Universal Mobile Telecommunications System (UMTS) in Europe. -High-speed Downlink Packet Access (HSDPA), an upgrade to W-CDMA to allow downlink data transmission at speeds of typically 8-10 Mbit/s. It is complemented by High-Speed Uplink Packet Access (HSUPA), which offers uplink speeds of around 5 Mbit/s. -CDMA2000 1xEV-DO (Evolution, Data Optimised), an IMT-2000 3G mobile network technology, based on CDMA that delivers packet-switched data transmission speeds of up to 4.9 Mbit/s. Denotes the closeness of computations or estimates to the exact or true values. Statistics are not equal with the true values because of variability (the statistics change from implementation to implementation of the survey due to random effects) and bias (the average of the possible values of the statistics from implementation to implementation is not equal to the true value due to systematic effects). Asymmetric Digital Subscriber Line (ADSL) where more bandwidth is allocated to download than upload and High Rate Digital Subscriber Line (HDSL) are considering as dominant DSL technologies. Typically, individual connections will provide from 1.544 Mbps to 512 Kbps downstream and about 128 Kbps upstream. Actual bandwidth may vary significantly between the states as wells as within the state. A DSL line can carry both data and voice signals and the data part of the line is continuously connected. DSL connection is considered as one of the high capacity ‘speed’ permanent ‘fixed’ Internet connection (broadband). Dial-up is a connection to the Internet via an analogue modem and telephone line, which requires that the modem dial a phone number when Internet access is needed. The modem converts a digital signal into analogue for transmission by traditional (copper) telephone lines. It also converts analogue transmissions back to digital. Software which detects and removes spyware from a computer system (spyware is tracking software which gathers information without the user's knowledge). ITU (2007) Eurostat Standard Quality Report (WG on assessment of quality in statistics, 2003) Eurostat enterprise questionnaire 2007 Partnership (2005) OECD (2009) Area sampling Selection of geographical area units that comprise sampling frame (may include selection of area segments, defined as mapped sub-divisions of administrative area). UNSD (2005b) Bit ABS (2007) CAPI Abbreviation for binary digit and describing the smallest unit of information handled by a computer. One bit expresses a 1 or a 0 in a binary numeral, or a true or false logical condition. See also Byte. Abbreviation for binary term. A unit of data, today almost always consisting of 8 bits. A byte can represent a single character, such as a letter, a digit, or a punctuation mark. See also kilobit and kilobyte. Cable modem uses modems attached to cable television networks (cable TV lines) for permanent ‘fixed’ access to the Internet. A cable modem is a device that enables you to hook up a computer to a local cable TV line and receive data. It is considered as one of the high capacity ‘speed’ permanent ‘fixed’ Internet connection (broadband). Computer assisted personal interviewing. CATI Computer assisted telephoning interviewing. CDMA 1x (Release 0) CDMA 1x (Release 0) is a part of the IMT-2000 family of standards and provides an upgrade for CDMA users, but typically has a capacity of below 256 kbit/s. ITU (2007) CDMA2000 1x CDMA2000 1x is an IMT-2000 3G mobile network technology, based on CDMA that delivers packet switched data transmission speeds of up to 144 kbps. Also referred to as 1XRTT. CDMA2000 1xEV-DO (Evolution, Data Optimised), an IMT-2000 3G mobile network technology, based on CDMA that delivers packet-switched data transmission speeds of up to 4.9 Mbit/s. Cellular mobile networks with access to data communications (e.g. the Internet) at broadband speeds (defined as greater than or equal to 256 kbit/s in one or both directions) such as WCDMA, HSDPA, CDMA2000 1xEV-DO, CDMA 200 1xEV-DV etc. These services are typically referred to as 3G or 3.5G. Eurostat enterprise questionnaire 2007 Byte Cable modem CDMA2000 1xEVDO Cellular mobile with access at broadband speeds ABS (2007) Eurostat enterprise questionnaire 2007 adapted ITU (2007) ITU (2007) Manual for Measuring ICT Access and Use by Households and Individuals 110 Annex 5. Glossary and abbreviations Term or abbreviation Cluster sampling Clustering; clustered Complex sample design Confidence level Design effect – deff Dial-up DQAF DSL Notes Sampling in which next-to-last stage is geographically-defined unit such as census enumeration area (EA). Refers to tendency of sample units – persons or households – to have similar characteristics. Refers to use of multiple stages, clustering and stratification in household survey samples, as opposed to simple random sampling. Describes degree of statistical confidence with which precision or margin of error around the survey estimate is obtained, 95 per cent generally being regarded as the standard. Ratio of variance from complex sample design to simple random sample of same sample size; deft is ratio of standard errors; sometimes referred to as clustering effect though deff includes effects of stratification as well as clustering. Dial-up is a connection to the Internet via a modem and telephone line, which requires that the modem dial a phone number when Internet access is needed. Data Quality Assessment Framework (IMF). External source, if relevant UNSD (2005b) UNSD (2005b) UNSD (2005b) UNSD (2005b) UNSD (2005b) ITU (2007) Internet access using Digital Subscriber Line (DSL) technology. DSL is a technology for bringing high-bandwidth information to homes and small businesses over ordinary copper telephone lines. Speed should be equal to, or greater than, 256 kbit/s, in one or both directions. European Union ITU (2007) General Packet Radio Service (GPRS), a 2.5G mobile standard typically adopted by GSM operators as a migration step towards 3G (W-CDMA). Global system for mobile communications. ITU (2007) Various, adapted ICT A household consists of one or more people, who may or may not be related to each other, who share accommodation and who make common provision for food. High-speed Downlink Packet Access (HSDPA), an upgrade to W-CDMA to allow downlink data transmission at speeds of typically 8-10 Mbit/s. It is complemented by High-Speed Uplink Packet Access (HSUPA), which offers uplink speeds of around 5 Mbit/s. Information and communication technology. ILO International Labour Organization. i-mode i-mode, a packet-based means of wireless data transfer and uses Compact Wireless Markup Language (CWML) instead of WAP's WML for data display. imode was introduced in Japan in 1999 and was an early method available to browse the Web from a cellular phone. Games machine with Internet connection, also known as a games console. EU GPRS GSM Household HSDPA Internet access via a games machine IP Internet service provider. IT Information technology. ITU International Telecommunication Union. Kbit/s Kilobits per second. Kilobit (Kb) A data unit of 1,024 bits and generally abbreviated as kb or kbit. Data speeds are generally referred to in kilobits (kbps) rather than kilobytes. A data unit of 1,024 bytes and generally abbreviated as KB or Kbyte. Making on-line payments Master sample Mbit/s Measure of size, MOS Megabyte (MB) ITU (2007) OECD (2009) Internet protocol. ISDN (Integrated Services Digital Network) ISP Kilobyte (KB) ITU (2007) ISDN is a telecommunication service that turns a traditional (copper) telephone line into a higher speed digital link. ISDN is usually considered to be narrowband. Includes payment of fees, payments for purchases, taxation remittances etc. Online payments to government organizations may be made via an intermediary, for instance, a bank's website. A supersample intended to be used for multiple surveys and/or multiple rounds of the same survey, usually over 10-year time frame. Megabits per second. A data unit of 1,048,576 bits, sometimes interpreted as 1 million bits. In multi-stage sampling a count or estimate of the size (e.g., number of persons) of each unit at a given stage. A data unit of 1,048,576 bytes, sometimes interpreted as 1 million bytes. Manual for Measuring ICT Access and Use by Households and Individuals Partnership (2005) ABS (2007) ABS (2007) OECD (2009) UNSD (2005b) ABS (2007) UNSD (2005b) ABS (2007) Annex 5. Glossary and abbreviations 111 Term or abbreviation Notes External source, if relevant Modem Eurostat enterprise questionnaire 2007 Non-sampling error Device that modulates outgoing digital signals from a computer or other digital device to analogue signals for a conventional copper twisted pair telephone line and demodulates the incoming analogue signal and converts it to a digital signal for the digital device. Bias in survey estimate arising from errors in design and implementation; refers to accuracy150 or validity of an estimate as opposed to its reliability or precision. NSDS NSO National strategy for the development of statistics (PARIS21). National statistical office. OCR OECD Optical character recognition. Organisation for Economic Co-operation and Development. OSILAC Observatory for the Information Society in Latin America and the Caribbean PDA Personal digital assistant. Primary sampling unit, PSU Probability sampling Public Internet access centres (PIAC) Geographically-defined administrative unit selected at first stage of sampling UNSD (2005b) Selection methodology whereby each population unit (person, household, etc.) has known, non-zero chance of inclusion in the sample A PIAC is a site, location, or centre of instruction at which Internet access is made available to the public, on a full-time or part-time basis. This may include telecentres, digital community centres, Internet cafés, libraries, education centres and other similar establishments, whenever they offer Internet access to the general public. All such centres should have at least one public computer for Internet access. Public Wireless Local Area Network (PWLAN), based on the IEEE 802.1b standard, commonly referred to as WiFi. Refers to degree of sampling error associated with a given survey estimate. UNSD (2005b) Relative standard error (coefficient of variation). Standard error as percentage of survey estimate, i.e. standard error divided by estimate. Set of materials from which sample is actually selected, such as a list or set of areas. Number of units (households or persons) selected. UNSD (2005b) Random error in survey estimate due to the fact that a sample rather than entire population is surveyed; square root of sampling variance. Selecting sample in (generally) two time periods, with second phase typically a subsample of first-phase sample; not to be confused with trend sampling (see below). UNSD (2005b) PWLAN Reliability (precision, margin of error) RSE Sample frame(s) Sample size Sampling error (standard error) Sampling in phases; also known as double sampling or poststratified sampling Sampling in stages Sampling variance Satellite Segment Stratified sampling Systematic sampling Target population UIS UNSD (2005b) ITU (2007) ITU (2007) UNSD (2005b) UNSD (2005b) UNSD (2005b) UNSD (2005b) Means by which sample of administrative areas and households/persons is chosen in successive stages to pinpoint geographic locations where survey is conducted. Square of standard error or sampling error. UNSD (2005b) A satellite stationed in geosynchronous orbit that acts as a microwave relay station, receiving signals sent from a ground based station, amplifying them, and retransmitting them on a different frequency to another ground-based station. Satellites can be used for high-speed transmission of computer data. A delineated, mapped sub-division of a larger cluster. ABS (2007) Technique of organizing sample frame into sub-groupings that are internally homogeneous and externally heterogeneous to ensure sample selection is spread properly across important population sub-groups. Selection from a list, using a random start and predetermined selection interval, successively applied. Definition of population intended to be covered by survey; also known as coverage universe. UNESCO Institute for Statistics. UNSD (2005b) UNSD (2005b) UNSD (2005b) UNSD (2005b) UNSD (2005b) Manual for Measuring ICT Access and Use by Households and Individuals 112 Annex 5. Glossary and abbreviations Term or abbreviation Notes External source, if relevant UMTS Universal Mobile Telecommunications System (UMTS) is one of the thirdgeneration (3G) mobile phone technologies. It uses W-CDMA as the underlying standard, is standardized by the 3GPP, and represents the European answer to the ITU IMT-2000 requirements for 3G Cellular radio systems. It presently delivers packet switched data transmission speeds up to 384 kbps and up to 2 Mbps when fully implemented. United Nations Conference on Trade and Development. Eurostat enterprise questionnaire 2007 UNCTAD UNECA United Nations Economic Commission for Africa. UNECLAC United Nations Economic Commission for Latin America and the Caribbean. UNESCAP United Nations Economic and Social Commission for Asia and the Pacific. UNESCO United Nations Educational, Scientific and Cultural Organization. UNESCWA United Nations Economic and Social Commission for Western Asia. UNSC United Nations Statistical Commission. UNSD United Nations Statistics Division. URL Uniform resource locator. Virus checking or protection software VoIP WPIIS Software which detects and responds to malicious programs such as viruses, Trojan horses and worms. Voice over Internet Protocol, VoIP is a family of transmission technologies for delivery of voice communications over the Internet or other packet-switched networks. It is more generally referred to as IP (or Internet) telephony. Wireless Application Protocol (WAP), a protocol for wireless communications that makes it possible to create advanced telecommunications services and to access Internet pages from a mobile telephone. Wideband CDMA (W-CDMA), an IMT-2000 3G mobile network technology, based on CDMA that presently delivers packet-switched data transmission speeds up to 384 kbit/s and up to 2 Mbit/s when fully implemented. Known as Universal Mobile Telecommunications System (UMTS) in Europe. Location on the World Wide Web identified by a web address. Collection of web files on a particular subject that includes a beginning file called a home page. Information is encoded with specific languages (Hypertext mark-up language (HTML), XML, Java) readable with a web browser, like Netscape's Navigator or Microsoft's Internet Explorer. Inverse of probability of selection; inflation factor applied against raw data; also known as design weight. Wi-Fi (or Wi-fi, WiFi, Wifi, wifi), short for Wireless Fidelity, is a set of Ethernet standards for wireless local area networks (WLAN) currently based on the IEEE 802.11 specifications. New standards beyond the 802.11 specifications, such as 802.16 are currently in the works, they offer many enhancements, anywhere from longer range to greater transfer speeds. Wi-Fi was intended to be used for wireless devices and LANs, but is now often used for Internet access (one of the main international standards for wireless broadband Internet access and networking, with widespread use in business, homes and public spaces). It is based on radio signals with a frequency of 2.4 Ghz and capable of speeds of up to 11 Mbps. It enables a person with a wireless-enabled computer or personal digital assistant to connect to the Internet when in proximity of an access point called a hotspot. Working Party on Indicators for the Information Society (OECD). WSIS World Summit on the Information Society. WWW World Wide Web. xDSL xDSL (Digital Subscriber Line) refers to a family of a high-bandwidth (broadband), local loop technologies that provide a digital permanent Internet connection over the copper wires of the local telephone network. Digital Subscriber Line. DSL technologies are designed to increase bandwidth available over standard copper telephone wires. Includes IDSL, HDSL, SDSL, ADSL, RADSL, VDSL, DSL-Lite. WAP W-CDMA Website Weight WiFi Manual for Measuring ICT Access and Use by Households and Individuals OECD (2009) Wikipedia (2009) ITU (2007) ITU (2007) Eurostat enterprise questionnaire 2007 UNSD (2005b) Eurostat enterprise questionnaire 2007 Eurostat enterprise questionnaire 2007 Bibliography 113 Bibliography ABS (Australian Bureau of Statistics) (2007), Household Use of Information Technology, Australia, 2006-07, cat. no. 8146.0, www.abs.gov.au/ausstats/[email protected]/mf/8146.0. Census and Statistics Department, Hong Kong, China (2008), Questionnaire for the Thematic Household Survey on Information Technology Usage and Penetration in 2008. Eurostat (2007), Methodological Manual for Statistics on the Information Society, Luxembourg, http://europa.eu.int/estatref/info/sdds/en/isoc/isoc_metmanual_2007.pdf. Eurostat (2009), Information Society Statistics, webpage, http://epp.eurostat.ec.europa.eu/portal/page?_pageid=2973,64549069,2973_64553608&_dad=p ortal&_schema=PORTAL. IDA Singapore (Infocomm Development Authority) (2007), Annual Survey on Infocomm Usage in Households and by Individuals for 2007, http://www.ida.gov.sg/doc/Publications/Publications_Level2/20061205092557/ASInfocommUsage Hseholds07.pdf. IHSN (International Household Survey Network) (2009), webpage, http://www.surveynetwork.org/home. ILO (International Labour Organization) (1993), International Classification of Status in Employment, http://www.ilo.org/public/english/bureau/stat/class/icse.htm. ILO (2009), International Standard Classification of Occupations, webpage, http://www.ilo.org/public/english/bureau/stat/isco/index.htm. ITU (International Telecommunication Union) (2005), WSIS Outcome Documents: Geneva 2003 – Tunis 2005, http://www.itu.int/wsis/outcome/booklet.pdf. ITU (2006), World Telecommunication/ICT Development Report 2006: Measuring ICT for social and economic development, http://www.itu.int/ITU-D/ict/publications/wtdr_06/index.html. ITU (2007), Telecommunication Indicators Handbook, http://www.itu.int/ITU-D/ict/handbook.html. ITU ( 2008), World Telecommunication/ICT Indicators database, 12th edition, http://www.itu.int/ITUD/ict/publications/world/world.html. ITU (2008b), Use of Information and Communication Technology by the World’s Children and Youth: a Statistical Compilation, http://www.itu.int/ITU-D/ict/material/Youth_2008.pdf. OECD (Organisation for Economic Co-operation and Development) (2005), “ICT Use by Households and Individuals: Proposal for Revising the OECD Model Survey”, Working Party on Indicators for the Information Society, DSTI/ICCP/IIS(2005)3/FINAL, Paris. OECD (2007), “Measuring the impacts of ICT using official statistics”, Working Party on Indicators for the Information Society, DSTI/ICCP/IIS(2007)1, Paris, http://www.oecd.org/document/22/0,3343,en_2649_34449_34508886_1_1_1_1,00.html. OECD (2009), Guide to Measuring the Information Society, Paris, www.oecd.org/sti/measuringinfoeconomy/guide. PARIS21 (2009), webpage, http://www.paris21.org. Partnership on Measuring ICT for Development (2004), “Project Document”, http://www.itu.int/ITUD/ict/partnership/material/Partnership%20Project%20Document%2023%20June.pdf. Partnership on Measuring ICT for Development (2005), Core ICT Indicators, New York/Geneva, http://www.itu.int/ITU-D/ict/partnership/material/CoreICTIndicators.pdf. Partnership on Measuring ICT for Development (2008), The Global Information Society: a Statistical View, 2008, http://www.itu.int/ITU-D/ict/partnership/material/05-42742%20GLOBAL%20ICT.pdf Partnership on Measuring ICT for Development (2009), “Revisions and Additions to the Core List of ICT Indicators”, http://www.itu.int/ITU-D/ict/partnership/material/CoreICTIndicators_e_rev2.pdf . Manual for Measuring ICT Access and Use by Households and Individuals 114 Bibliography UNCTAD (United Nations Conference on Trade and Development) (2008), Final report, “UNCTAD Mission to assist the Nepalese Government on ICT measurement” (unpublished). UNCTAD (2009), Manual for the Production of Statistics on the Information Economy, Revised Edition, Geneva, http://new.unctad.org/templates/Page____885.aspx. UNDP (United Nations Development Programme) (2007), Human Development Report 2007/2008, New York, http://hdr.undp.org/en/media/HDR_20072008_EN_Complete.pdf. UNECLAC (2007), Compendium of Practices on the implementation of ICT questions in households and businesses surveys in Latin America and the Caribbean, UNECLAC-OSILAC, http://www.cepal.org/ddpe/publicaciones/xml/4/32164/W169_Ingles.pdf. UNECLAC (2009), OSILAC ICT Statistical Information System, webpage, www.cepal.org/tic/flash. UNESCO (United Nations Educational, Scientific and Cultural Organization) (1997), International Standard Classification of Education, http://www.uis.unesco.org/ev.php?ID=3813_201&ID2=DO_TOPIC. UNSC (United Nations Statistical Commission) (2007a), “Report of the Partnership on Measuring Information and Communication Technologies for Development: information and communication technology statistics”, E/CN.3/2007/5, Thirty-eighth session, New York, http://unstats.un.org/unsd/statcom/doc07/2007-5e-ICT.pdf. UNSC (2007b), “Report on the Thirty-Eighth Session (27 February to 2 March 2007)”, E/2007/24 and E/CN.3/2007/30, New York, http://unstats.un.org/unsd/statcom/doc07/FinalReport-Unedited.pdf. UNSC (2009), “Report of the Partnership on Measuring Information and Communication Technologies for Development: information and communications technology statistics”, E/CN.3/2009/19, New York, http://unstats.un.org/unsd/statcom/doc09/2009-19-ICT-E.pdf. UNSD (United Nations Statistics Division) (2005a), Household Sample Surveys in Developing and Transition Countries, http://unstats.un.org/unsd/HHsurveys/pdf/Household_surveys.pdf. UNSD (2005b), Designing Household Survey Samples: Practical Guidelines, http://unstats.un.org/unsd/demographic/sources/surveys/Handbook23June05.pdf. UNSD ( 2008), Principles and Recommendations for Population and Housing Censuses Revision 2, http://unstats.un.org/unsd/methods.htm. UNSD (2008b), Updated System of National Accounts 1993 (1993 SNA): Volume 1: Chapters 1 – 17, http://unstats.un.org/unsd/methods.htm. UNSD (2008c), United Nations Statistical Yearbook - Fifty-first Issue, United Nations, Department of Economic and Social Affairs, http://unstats.un.org/unsd/syb/. World Bank (2007), World Development Indicators 2007, http://publications.worldbank.org/WDI/. World Bank (2009), Living Standards Measurement Study, webpage, http://www.worldbank.org/LSMS/. Manual for Measuring ICT Access and Use by Households and Individuals ITU I n t e r n a t i o n a l T e l e c o m m u n i c a t i o n U n i o n MANUAL for Measuring ICT Access and Use by Households and Individuals Printed in Switzerland Geneva, 2009 Manual for measuring ICT access and use by households and individuals 2009 Edition 2009 EDITION


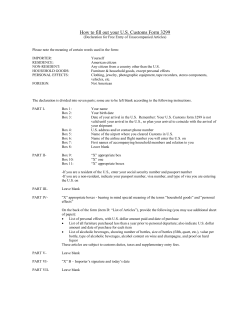
© Copyright 2026