
Curriculum-Based Measurement: A Manual for Teachers
Curriculum-Based
Measurement: A
Manual for
Teachers
Jim Wright
Syracuse (NY) City Schools
[email protected]
www.interventioncentral.org
Chapter 1: Introduction to Curriculum-based Measurement
1
An Overview of Curriculum-based Measurement
Introduction
A major responsibility of schools is to teach children the academic skills that
they will eventually need to take their place as responsible members of society. But
schools not only teach crucial academic skills, they are also required to measure
individual children's acquisition and mastery of these skills. The measurement of a
child's school abilities is just as important as the teaching of those skills. After all,
only by carefully testing what a child has learned can the instructor then draw
conclusions about whether that student is ready to advance to more difficult
material.
In the past, routine classroom testing has often involved the use of
commercially prepared tests. These tests have significant limitations, as we shall
soon see. An alternative approach to academic assessment has recently become
available, however, that allows teachers to closely monitor the rate of student
educational progress. Educational researchers have devised a simple, statistically
reliable, and practical means of measuring student skills in basic subject areas such
as reading, writing, and arithmetic. In this approach, called curriculum-based
measurement, or CBM, the student is given brief, timed exercises to complete, using
materials drawn directly from the child's academic program. To date, teachers using
CBM have found it to be both a powerful assessment tool for measuring mastery of
basic skills and an efficient means of monitoring short-term and long-term student
progress in key academic areas.
This manual has been designed for use in a CBM teacher-training course.
When you have completed the course, you will be able to use CBM independently
to monitor the academic skills of children in your classroom. You will be trained to
give CBM probes, chart the resulting data, and consult charted CBM information
collected over time to make decisions about the effectiveness of instructional
interventions. The remainder of the present chapter provides answers to questions
that educators commonly ask about curriculum-based measurement.
Q: What is curriculum-based measurement?
A: Curriculum-based measurement, or CBM, is a method of monitoring student
educational progress through direct assessment of academic skills. CBM can be used
to measure basic skills in reading, mathematics, spelling, and written expression. It
can also be used to monitor readiness skills. When using CBM, the instructor gives
the student brief, timed samples, or "probes," made up of academic material taken
from the child's school curriculum.
These CBM probes are given under standardized conditions. For example,
CBM Workshop Manual
Jim Wright
Page 1-1
Chapter 1: Introduction to Curriculum-based Measurement
the instructor will read the same directions every time that he or she gives a certain
type of CBM probe. CBM probes are timed and may last from 1 to 5 minutes,
depending on the skill being measured. The child's performance on a CBM probe is
scored for speed, or fluency , and for accuracy of performance. Since CBM probes are
quick to administer and simple to score, they can be given repeatedly (for example,
twice per week). The results are then charted to offer the instructor a visual record
of a targeted child's rate of academic progress.
Q: What are the drawbacks of traditional types of classroom
testing?
A: Traditional academic testing methods often rely on norm-referenced tests.
Norm-referenced tests are developed by testing companies to be used in schools
across the country. While these traditional academic achievement tests can yield
useful information in some situations, they also have several significant drawbacks:
Normed to a national "average"
First, to ensure that their tests can be used by schools across the country, most
testing companies set the performance standards for their academic achievement
tests according to a national average. However, as every teacher knows, the average
skill levels in a particular classroom or school may vary a great deal from national
averages. As a result, information from norm-referenced tests will probably not
give the instructor a clear idea of what the typical skill-levels might be in his or her
own classroom.
Lack of overlap with local, or classroom, curriculum
Also, because norm-referenced tests are designed to measure skills across a
national population, the skills that they measure will not completely overlap those
of the local classroom curriculum. Over the course of several months, for example,
one student may gain skills in certain math computation problems that are not
measured on a particular achievement test. The test information might then
mislead a teacher into believing that a child has made less progress than is actually
the case.
Given infrequently
In addition, norm-referenced tests cannot be given very often to determine
student academic progress. Teachers who depend on these tests usually have to wait
a number of months before they can learn whether a student is really benefiting
from an academic program.
Less sensitive to short-term academic gain
Norm-referenced tests are not very sensitive to short-term gains in school
skills. As a result, a teacher who relies solely on these tests to judge student growth
may miss evidence of small, but important, improvements in a child's academic
CBM Workshop Manual
Jim Wright
Page 1-2
Chapter 1: Introduction to Curriculum-based Measurement
functioning.
Q: What are the advantages of CBM over other testing methods?
A: In contrast to norm-referenced academic achievement tests, CBM offers distinct
advantages. Using CBM, an instructor can quickly determine the average academic
performance of a classroom. By comparing a given child's CBM performance in
basic skill areas to these classroom, or local, norms, the teacher can then better judge
whether that child's school-skills are significantly delayed in relation to those of
classmates. CBM has other benefits as well:
Good overlap with curriculum
Because CBM probes are made up of materials taken from the local
curriculum, there is an appropriate overlap between classroom instruction and the
testing materials used. In effect, CBM allows the teacher to better test what is being
taught.
Quick to administer
CBM probes are quick to administer. For example, to obtain a single CBM
reading fluency measure, the instructor asks the student to read aloud for 3 minutes.
CBM measures in math, writing, and spelling are also quite brief.
Can be given often
CBM probes can be given repeatedly in a short span of time. In fact, CBM
probes can be given frequently, even daily if desired. The resulting information can
then be graphed to demonstrate student progress.
Sensitive to short-term gain in academic skills
Unlike many norm-referenced tests, CBM has been found to be sensitive to
short-term student gains. In fact, CBM is so useful a measure of student academic
progress that teachers employing it can often determine in as short a span as several
weeks whether a student is making appropriate gains in school skills.
Q: What effect does CBM have on academic progress?
A: Instructors are faced with a central problem: they cannot predict with complete
assurance that a particular instructional intervention will be effective with a
selected student. The truth is that only through careful observation and data
gathering can teachers know if a child's educational program is really effective.
Much of the power of CBM, therefore, seems to lie in its ability to predict in a
short time whether an intervention is working or needs to be altered. By
monitoring students on a regular basis using CBM the teacher can quickly shift away
from educational programming that is not found to be sufficiently effective in
increasing a child's rate of learning. In fact, research has shown that teachers who
use CBM to monitor the effectiveness of instructional interventions tend to achieve
CBM Workshop Manual
Jim Wright
Page 1-3
Chapter 1: Introduction to Curriculum-based Measurement
significantly higher rates of student learning than those instructors who rely on
more traditional test measures.
Imagine, for example, that 2 students were given the identical reading
program in a classroom. If the children were also monitored using CBM reading
probes, their reading fluency could be charted over several instructional weeks to
judge whether the reading programming was effective. A teacher examining the
Fig. 1.1: Comparison of CBM reading data for two students
50
40
Student A shows
steady progress in
reading fluency
30
Student A
Student B
20
Student B's datapoints reveal no
increase over time
10
0
1
2
3
4
5
6
7
Instructional Weeks
graph above would have little difficulty judging that student A had made
considerable progress in reading, whereas student B did not increase reading
fluency. The difference in progress would be so obvious that the teacher would
probably want to change student B's instructional program to foster greater reading
growth. By using CBM as a tool to track academic progress, instructors can judge in
a shorter period whether students are learning at an optimal rate and change their
teaching approach as necessary.
CBM progress-monitoring also brings other benefits. Teachers using CBM
tend to be more realistic when estimating a student's rate of progress in the
curriculum. CBM data are also very useful for teachers when consulting with
parents, school support staff, or the Committee on Special Education. In addition,
many instructors report that sharing CBM graphs with students can be highly
motivating, as this sharing can encourage children to try to increase their
performance from week to week.
Q: If CBM measures only fluency, how can this approach serve as an
accurate indicator of a student's true academic abilities?
A: Fluency can be thought of as the speed with which a student is able to produce
CBM Workshop Manual
Jim Wright
Page 1-4
Chapter 1: Introduction to Curriculum-based Measurement
correct answers on an academic task. In reading, for example, fluency can be defined
in concrete terms as number of words correctly read aloud in one minute, while in
math, a fluency measure would be the number of digits correctly computed on a
worksheet in two minutes. Two major assumptions underlie the choice of fluency
as a useful measure of academic mastery. First, children must acquire basic skills
before they can move into more challenging curriculum demands. Those students,
for example, who have not yet learned to decode words obviously are not ready to
work on advanced comprehension of passages. As a screening instrument, CBM
allows the instructor to single out children that have failed to acquire fundamental
skills crucial to more advanced schoolwork. These children can then be given extra
instruction.
Second, a student's speed, or proficiency, in an academic skill is also of great
importance. For example, two children might be able to read an identical passage
with equal accuracy, but if one student needs triple the amount of time required by
her classmate to decode the passage, the slower reader is going to be at a
disadvantage in the classroom. While many commercial achievement tests are able
to measure some of the skills that a child has acquired, they typically do not measure
how quickly a student can carry out a given academic skill. In contrast, CBM gives
the instructor accurate information about the rate at which individual children are
able to complete academic tasks. CBM also can be used to directly compare the
performance of targeted students to classroom or grade-wide norms to determine
whether a particular child is as fluent as classmates in a given skill-area.
A final argument can be offered supporting CBM (with its emphasis on
fluency) as an accurate measure of academic achievement. Extensive research has
shown that CBM can reliably track children's academic growth. Furthermore,
teachers who rely on CBM data when evaluating the effectiveness of instructional
interventions generally have improved achievement rates in their classrooms.
Q: How much instructional time does CBM require?
A: CBM probes take only a few minutes to give to a student (with the specific
amount of time spent depending on the basic skill that the teacher has decided to
monitor). For instance, CBM probes that measure reading fluency are given
individually. These reading probes typically require about 5 minutes for the
instructor to give, score, and chart the results of one measurement session. CBM
probes in math, spelling, and writing are quite time-efficient, as they can be given
simultaneously to whole groups of children. Probes in these skill areas require from
3-5 minutes of instructional time to administer to an entire class. In some cases,
teachers have trained children to score their own CBM probes and regularly chart
their own results, reducing the instructor's time involvement. There are also
computer software programs available that can streamline the charting and
interpreting of CBM data.
CBM Workshop Manual
Jim Wright
Page 1-5
Chapter 1: Introduction to Curriculum-based Measurement
Q: What are some examples of CBM probes?
A: Well-researched CBM procedures have been developed for monitoring
basic skills in reading, mathematics, spelling, and writing.
Reading
When using CBM to measure reading fluency, the examiner sits down
individually with the child and has the student read aloud for 1 minute
from each of 3 separate reading passages randomly chosen from a reading
book. During the student's reading, the examiner makes note of any
decoding errors made in each passage. Then the examiner calculates the
number of words correctly read in the passage. Next, the examiner compares
the word-totals correctly read for the 3 passages and chooses the middle, or
median, score. This median score serves as the best indicator of the
student's "true" reading rate in the selected reading material.
Mathematics
When giving CBM math probes, the examiner can choose to
administer them individually or to groups of students. There are 2 types of
CBM math probes. Single-skill worksheets contain a series of similar
problems, while multiple-skill worksheets contain a mix of problems
requiring different math operations. No matter which type of math probe is
used, the student is given the worksheet and proceeds to complete as many
items as possible within 2 minutes.
More traditional approaches to scoring computational math problems
usually give credit for the total number of correct answers appearing on a
worksheet. In contrast to this all-or-nothing marking system, CBM assigns
credit to each individual correct digit appearing in the solution to a math fact.
By separately scoring each digit in the answer of a computation problem, the
instructor is better able to recognize and to give credit for a student's partial
math competencies.
For example, this addition problem has a 2-digit answer:
13
+6
19
If a student correctly gave the answer to the problem as "19," that student
would receive a score of 2 correct digits.
In this subtraction problem, the student placed an incorrect digit in the
ones place. However, the numeral 2 that appears in the tens place is correct.
CBM Workshop Manual
Jim Wright
Page 1-6
Chapter 1: Introduction to Curriculum-based Measurement
46
-18
27
So this student receives credit for a single correct digit in the subtraction
problem.
Spelling
In spelling assessments using CBM, the instructor reads aloud words
that students are to try to spell correctly within a time-limit. The teacher
may give 12 to 17 spelling words within a 2-minute period. According to the
CBM scoring technique, spelling words are scored for correct letter-sequences.
Correct letter-sequences are pairs of letters in a word that are placed in the
proper sequence. Let's look at an example.
The word 'talk' contains 4 letters. However, it is considered to have 5
possible correct-letter sequences. First, the examiner assumes that there is a
_TALK_
"phantom" letter, or space-holder, at the beginning and end of each spellingword. Phantom letters are represented here as spaces.
1. When the phantom letter at the start of the word is paired with T, it
makes up the first correct letter-sequence.
2. T A makes up the second letter-sequence
3. A L makes up the third letter-sequence.
4. L K makes up the fourth letter-sequence.
5. And K paired with the final phantom letter
makes up the fifth correct letter-sequence.
So the word talk has 5 correct letter-sequences in all. For each spelling word
given, a student gets credit only for those letter-pairs, or sequences, that are
written in the correct order.
Writing
CBM probes that measure writing skills are simple to administer but
offer a variety of scoring options. As with math and spelling, writing probes
may be given individually or to groups of students. The examiner prepares a
lined composition sheet with a story-starter sentence at the top. The student
thinks for 1 minute about a possible story to be written from the story-starter,
then spends 3 minutes writing the story. Depending on the preferences of
the teacher, the writing probe can be scored in several ways. For example, the
instructor may decide to score the writing probe according to the total number
of words appearing in a student's composition or for the number of correctly
CBM Workshop Manual
Jim Wright
Page 1-7
Chapter 1: Introduction to Curriculum-based Measurement
spelled words in the writing sample.
Summary
The accurate measurement of academic skills is a key component of a wellrun classroom. However, traditional, norm-referenced tests such as those used
most often in schools have several drawbacks. They reflect a national, rather than
local, average, do not overlap substantially with the curriculum of a particular
classroom, can only be given infrequently, and are not sensitive to short-term gains
in student skills. In contrast, curriculum-based measurement, or CBM, is a means of
tracking educational progress through direct assessment of academic skills in
reading, mathematics, writing, and spelling. CBM probes are created to match
curriculum objectives and are administered under timed, standardized conditions.
CBM uses probes that overlap closely with a school's curriculum, are quick to
administer, can be given frequently, and are quite sensitive to short-term student
gains. Reading probes are scored according to the number of words correctly read,
while math probes measure the number of correctly computed digits. Spelling
probes assign credit for correct letter-sequences; writing probes offer several scoring
options, including total words written and number of correctly spelled words.
When used to monitor an instructional intervention, CBM can give the
instructor timely feedback about the effectiveness of that intervention. The
measurement of fluency in basic skills is central to CBM. By assessing the fluency,
or speed, of a child's skills, CBM first allows the teacher to see if the student has
acquired the skill in question and then gives the instructor an indication of the
proficiency that the child has in the targeted skill. Considerable research indicates
that CBM is a reliable means of estimating the academic growth of children in basic
skills.
CBM Workshop Manual
Jim Wright
Page 1-8
Chapter 2: Administration and Scoring Of CBM Probes
2
Administration & Scoring of CBM Probes
Introduction
In contrast to less formal methods of monitoring classroom academic skills,
the hallmark of CBM is that it follows standardized procedures of administration
and scoring. Because CBM does make use of a standardized format, the instructor
can have confidence that the information provided by this direct-assessment
approach will serve as a reliable and valid indicator of school skills. In effect, results
obtained from CBM probes are replicable (that is, separate adults independently
giving similar CBM probes to the same child within a short span of time can be
expected to come up with closely matching results).
Before moving to specific instructions for giving and scoring CBM probes,
however, it might be useful to examine two more general decisions to be made by
an instructor who wishes to use CBM in the classroom. First, of course, the teacher
must select one or more areas of basic academic skills that the instructor wishes to
assess through CBM. Well-researched CBM procedures are presently in place for
reading, mathematics, spelling, and writing. Next, the teacher will need to define a
measurement pool of items to be included in CBM probes. As Table 2.1 illustrates,
the term measurement pool simply refers to the specific range of instructional
materials from which the instructor has decided to draw the content of CBM probes:
Table 2.1: Examples of measurement pools to be used in creating
CBM probes in basic-skill areas:
Reading: Passages drawn at random from a single basal reading text.
Math: Addition problems with single-digit terms and sums no greater
than 18.
Spelling: A summary list of words presented in a grade-appropriate
spelling book.
Writing: Story-starters suitable for a specific grade-level.
A few examples may help to give a clearer idea of the concept of the measurement
pool. If a teacher wishes to assess a younger child's reading fluency, he might
choose to track her progress using CBM passage-probes taken at random from a 2ndgrade reader. The measurement pool in this case would be the range of suitable
passages contained in a single reading book. Similarly, a 5th-grade instructor may
CBM Workshop Manual
Jim Wright
Page 2-1
Chapter 2: Administration and Scoring Of CBM Probes
decide to collect classroom CBM spelling norms on a regular basis. If she is using a
specific spelling curriculum in her class (e.g., Scott Foresman spelling text), she
could list all of the words to be taught from that book during the school year.
Random CBM spelling probes could then be drawn repeatedly from this
measurement pool of collected words.
Once the instructor has established a pool of items to be randomly selected for
basic-skill probes, that teacher is now ready to prepare, administer, and score CBM
probes according to standardized procedures. The important elements of CBM
probes that are standardized include the following: materials, directions for
administration, time limit, and scoring rules. The remainder of this chapter will
review the standardized procedures for CBM in reading, mathematics, spelling, and
writing.
Reading
Description
To complete a CBM reading fluency probe, the examiner sits down
individually with the child and has the student read aloud for 1 minute from each
of 3 separate reading passages. During the student's reading, the examiner makes
note of any reading errors in each passage. Then the examiner calculates the
number of words correctly read in the passage. Next, the examiner ranks in
ascending order the word-totals correctly read for the 3 passages and chooses the
middle, or median, score as the best indicator of the student's "true" reading rate in
the selected reading material.
Creating a measurement pool for reading-fluency probes
If a teacher's classroom reading program is based upon a basal reading series
(e.g., Houghton Mifflin, Silver Burdett & Ginn), the instructor can treat the sum of
passages contained within each basal text as a separate measurement pool. When
creating probes, the instructor would simply select passages at random from a
designated basal text.
If a reading program makes use of other materials instead (e.g., novels or
short stories drawn from a number of sources), the instructor may choose one of
two approaches. First, the teacher may still select passages from a basal reading
series to use as CBM probes for reading fluency. In essence, the teacher would be
using the basal series as a reading-fluency measurement tool--a common collection
of passages of graded difficulty in which to monitor the reading progress of students
participating in an independent reading program. This approach is convenient
because the passages within a single basal are presumed to be of a similar level of
difficulty, a necessary consideration for the instructor who plans to create
standardized reading probes. Instructors who have put together their own reading
programs can also assume that students in any effective reading program should
show generalized growth in reading fluency--growth that will be apparent even
when tracked in basal reading passages.
CBM Workshop Manual
Jim Wright
Page 2-2
Chapter 2: Administration and Scoring Of CBM Probes
Alternatively, the teacher who follows a non-basal reading program may
decide to apply one of several readability formulas (e.g., Fry's Readability Index) to
the reading materials used in the classroom. In this manner, the instructor should
be able to group novels of similar difficulty together into several successive levels.
These levels would resemble separate "basal" reading texts. When preparing CBM
reading probes, the instructor can simply draw passages randomly from those
novels grouped at the desired level of difficulty and use those passages to track the
child's reading progress.
Preparing CBM reading-fluency probes
When assessing the fluency skills of students placed in a basal reading series,
the instructor chooses 3 passages at random from the basal text chosen for
assessment. For children in the 1st and 2nd grades, each passage should be
approximately 150 words long, while passages of about 250 words should be prepared
for older students. Passages selected should not contain too much dialog and should
avoid an excessive number of foreign words or phrases. In addition, only prose
passages should be used in CBM assessments. Poetry and drama should be avoided
because they tend to vary considerably and do not represent the kind of text typically
encountered by students.
For ease of administration, the instructor will want to prepare examiner and student
copies of each passage. Ideally, reading passages should be free of illustrations that
may help a child to interpret the content of the text. While the teacher may type out
Fig. 2.1: An example of a CBM reading probe
Examiner Copy
Student Copy
Summertime! How lovely it was out
6
Summertime! How lovely it was out
in the country, with the wheat
12
in the country, with the wheat
standing yellow, the oats green,
17
standing yellow, the oats green,
and the hay all stacked down in the 25
and the hay all stacked down in the
grassy meadows!
grassy meadows!
And there went the 31
stork on his long red legs,
37
And there went the
stork on his long red legs,
chattering away in Egyptian, for he 43
chattering away in Egyptian, for he
had learnt that language from his
49
had learnt that language from his
mother. The fields and meadows
54
mother. The fields and meadows
CBM Workshop Manual
Jim Wright
Page 2-3
Chapter 2: Administration and Scoring Of CBM Probes
copies of a passage, another often-used method is to photocopy a selection from the
basal and to cut-and-paste a version of the passage that omits any illustrations but
retains the letter-size and font found in the original story. The examiner copy
should have a cumulative word total listed along the right margin of the passage for
ease of scoring (see Figure 2 above).
Materials needed for giving CBM reading probes
o Numbered and unnumbered copies of reading passage
o Stopwatch
o Pen or marker
Administration of CBM reading probes
The examiner and the student sit across the table from each other. The
examiner hands the student the unnumbered copy of the CBM reading passage. The
examiner takes the numbered copy of the passage, shielding it from the student's
view.
The examiner says to the student:
When I say, 'start,' begin reading aloud at the top of this page.
Read across the page [demonstrate by pointing]. Try to read each
word. If you come to a word you don't know, I'll tell it to you.
Be sure to do your best reading. Are there any questions?
[Pause] Start.
The examiner begins the stopwatch when the student says the first word. If the
student does not say the initial word within 3 seconds, the examiner says the word
and starts the stopwatch. As the student reads along in the text, the examiner
records any errors by marking a slash (/) through the incorrectly read word. If the
student hesitates for 3 seconds on any word, the examiner says the word and marks
it as an error. At the end of 1 minute, the examiner says, Stop and marks the
student's concluding place in the text with a bracket ( ] ).
Scoring
Reading fluency is calculated by first determining the total words attempted
within the timed reading probe and then deducting from that total the number of
incorrectly read words.
The following scoring rules will aid the instructor in marking the reading
probe:
Words read correctly are scored as correct:
--Self-corrected words are counted as correct.
--Repetitions are counted as correct.
--Examples of dialectical speech are counted as correct.
--Inserted words are ignored.
CBM Workshop Manual
Jim Wright
Page 2-4
Chapter 2: Administration and Scoring Of CBM Probes
Mispronunciations are counted as errors.
Example
Text: The small gray fox ran to the cover of the trees.
Student: "The smill gray fox ran to the cover of the trees."
Substitutions are counted as errors.
Example
Text: When she returned to the house, Grandmother called for Franchesca.
Student: "When she returned to the home, Grandmother called for
Franchesca.
Omissions are counted as errors.
Example
Text: Anna could not compete in the last race.
Student: "Anna could not in the last race."
Transpositions of word-pairs are counted as 1 error.
Example
Text: She looked at the bright, shining face of the sun.
Student: "She looked at the shining bright face of the sun."
Words read to the student by the examiner after 3 seconds have
gone by are counted as errors.
Computing reading-fluency rate in a single passage
The scoring of a reading probe is straightforward. The examiner first
determines how many words the reader actually attempted during the 1-minute
reading sample. On the completed probe in Fgure 2.2, for instance, the bracket near
the end of the text indicates that the student attempted 48 words before his time
expired. Next, the examiner counts up the number of errors made by the reader.
On this probe, the student committed 4 errors. By deducting the number of errors
from the total words attempted, the examiner arrives at the number of correctly read
words per minute. This number serves as an estimate of reading fluency,
combining as it does the student's speed and accuracy in reading. So by deducting
the errors from total words attempted, we find that the child actually read 44 correct
words in 1 minute.
CBM Workshop Manual
Jim Wright
Page 2-5
Chapter 2: Administration and Scoring Of CBM Probes
Fig. 2.2: Example of a scored reading probe
Total Words
Attempted
48
Errors
4
Summertime! How lovely it was out
in the country, with the wheat
12
standing yellow, the oats green,
17
and the hay all stacked down in the 25
grassy meadows!
Correctly Read
Words
44
6
And there went the 31
stork on his long red legs,
37
chattering away in Egyptian, for he 43
had learnt that language from] his
49
mother. The fields and meadows
54
Accommodating omissions when scoring. . .
When a student skips several connected words or even an entire line during
a reading probe, that omission creates a special scoring dilemma. An omission, after
Fig. 2.3: A reading probe marked for words omitted
Summertime! How lovely it was out
6
in the country, with the wheat
12
standing yellow, the oats green,
17
and the hay all stacked down in the 25
grassy meadows!
Original Total
Words Attempted
48
First omission:
5 of 6 words
deducted
And there went the 31
stork on his long red legs,
37
Second Omission: 3 of 4 words
deducted
chattering away in Egyptian, for he 43
had learnt that language from] his
49
mother. The fields and meadows
54
CBM Workshop Manual
Jim Wright
Page 2-6
Adjusted Total
Words Attempted
40
- 6 errors
34 Correctly
Read Words
Chapter 2: Administration and Scoring Of CBM Probes
all, is considered to be a single error of tracking, no matter how many words were
skipped at one time. However, if all words omitted in a line were individually
counted as errors, the student's error rate would be greatly inflated. The solution is
for the examiner to subtract all but one of the words in each omission before
computing the total words attempted.
Let's see how that score adjustment would work. On the completed probe in
Figure 2.3, the student omitted text in 2 places while reading aloud. The examiner
drew a line through all the connected words skipped by the child. The first
omission (words 7-12) was an entire line. Keeping in mind that 6 words were
omitted, the examiner drops 5 of those words before calculating the total words
attempted. Similarly, the student omitted words 32-35. Using the same rule, the
examiner drops 3 of those 4 words.
When finally calculating the number of words the child attempted to read,
the examiner notes that the child reached word 48. Eight words are then deducted
from the omitted lines to avoid inflating the error count. The adjusted figure for
total words attempted is found to be 40 words. The child committed 6 errors (4
marked by slashes and 2 omissions). These errors are subtracted from the revised
figure of 40 total words attempted. Therefore, the number of correctly read words in
this example would be 34.
Selecting the median reading-fluency rate in a basal
A major difference between basal reading probes and CBM probes in other
basic-skill areas is that the examiner is required to give 3 reading probes to arrive at
a single estimate of a student's reading fluency in a basal text. In contrast, single
administrations of CBM probes in mathematics, spelling, and writing are usually
sufficient to yield accurate estimates of student skills. Why does CBM reading alone
require 3 probes for each administration? The answer can be found in the nature of
basal reading texts.
Although publishers select the contents of a basal reading book to fall within
a restricted range of difficulty, instructors know that the material within a basal
reader will actually vary somewhat in level of difficulty from story to story. Given
the potential variability of text samples taken at random from a basal, there is some
danger that reading probes using only a single passage would provide a distorted
picture of a child's "true" reading rate. For instance, if the child happened by chance
to be given 2 excessively difficult reading probes during successive CBM
assessments, the examiner might be misled into believing that the student was
making slower reading progress than was actually the case.
To safeguard CBM reading probes against the possibility of faulty estimates of
reading ability, the examiner relies on a concept known as central tendency. While
this term is adopted from statistics, it means simply that when several samples of a
varying behavior are gathered (in this case, samples of reading fluency), there is a
much greater chance that one of those samples will be an accurate reflection of a
child's "true" ability. But when 3 reading probes are given from a single basal, how
does the examiner decide which of the probes represents the "best" estimate of the
student's proficiency in reading?
CBM Workshop Manual
Jim Wright
Page 2-7
Chapter 2: Administration and Scoring Of CBM Probes
First, the examiner mentally ranks the scores for words read correctly in
ascending order (from lowest to highest). Next, the examiner discards the lowest and
highest scores, retaining only the middle, or median, score. By dropping low and
high scores for each series of 3 reading robes, the examiner is able to greatly enhance
the accuracy of the CBM reading probe. The same approach allows the teacher to
accurately estimate the number of reading errors that a child makes in each basal.
An example may be helpful here. Let's assume that Jane, a 2nd-grade student,
sat down with her teacher one afternoon and was given 3 CBM reading probes taken
from basal 6 (early 2nd-grade reader) of the Silver Burdett & Ginn reading series.
The instructor then records the results on a recording sheet, as in Figure 2.4:
Fig. 2.4: Example of a completed score sheet for a CBM reading probe
Student Name_Janet Randall________ Grade/Unit___2____________
Reading Level____1B_________
Current Basal Placement_5 / SB&G__
--------------------------------------------------------------------------------------------------------------------Basal Number:___6_/ SB&G__ Date_4/9/92__
Correctly
Percent
Read Words
Errors
Accuracy
Story Name:___Frog and Toad____
_____64__
__ 4__
__94_ _
Story Name:___Daniel's Duck____
_____46__
__ 9__
__84__
Story Name:____Too Many Babas_
____ 38_
__7__
__84__
In order to arrive at the best estimate of the child's actual reading rate, the teacher
first decides which of the 3 reading rates is the middle, or median, score. Since 38
correct words per minute is the lowest score, she discards it. In the same fashion,
the instructor eliminates 64 words per minute, the highest score. She is then left
with the median, or middle, score of 46 words per minute as the most accurate
estimate of Jane's reading fluency in basal 6. Notice that the teacher also uses the
concept of the median score to find the best estimate of how many reading errors
Jane makes in basal 6. By dropping the low error score of 4 and the high error score
of 9, her teacher finds that the most accurate estimate is that Jane makes
approximately 7 errors per minute in the early 2nd-grade reader.
In this example, the teacher also computed the child's accuracy of decoding
for each reading probe. Strictly speaking, the calculation of a student's accuracy of
academic performance is not a part of CBM. However, many instructors find an
estimate of student accuracy to be useful diagnostic information. To determine the
percent accuracy of a child's reading, the teacher divides the number of words
correctly read by the total words attempted. The resulting figure will be a decimal
ranging between 0.0 and 1.0. That decimal figure is then multiplied by 100 to give
CBM Workshop Manual
Jim Wright
Page 2-8
Chapter 2: Administration and Scoring Of CBM Probes
the instructor the percent accuracy of the child's reading sample.
Referring back to the Figure 2.4, the instructor administered a reading probe
taken from the story Daniel's Duck. In that passage, the student managed to read 46
correct words out of a total of 55 words attempted. Dividing 46 words by 55 words,
the teacher came up with a quotient of 0.84. She then multiplied that decimal
figure by 100 (0.84 x 100) to come up with 84 percent as an index of the child's
reading accuracy in this individual reading probe. As with number of correctly read
words and errors, measures of reading accuracy may be reported as a median figure.
However, teachers often choose instead to present reading accuracy as a range of
performance. In the above example, the child could be said to read within a range of
84 to 94 percent accuracy in basal 6 of the Silver Burdett & Ginn reading series.
Mathematics
Description
There are 2 types of CBM math probes, single-skill worksheets (those
containing like problems) and multiple-skill worksheets (those containing a mix of
problems requiring different math operations). Single-skill probes give instructors
good information about students' mastery of particular problem-types, while
multiple-skill probes allow the teacher to test children's math competencies on a
range of computational objectives during a single CBM session.
Both types of math probes can be administered either individually or to
groups of students. The examiner hands the worksheet(s) out to those students
selected for assessment. Next, the examiner reads aloud the directions for the
worksheet. Then the signal is given to start, and students proceed to complete as
many items as possible within 2 minutes. The examiner collects the worksheets at
the end of the assessment for scoring.
Creating a measurement pool for math computational probes
The first task of the instructor in preparing CBM math probes is to define the
computational skills to be assessed. Many districts have adopted their own math
curriculum that outlines the various computational skills in the order in which
they are to be taught. Teachers may also review scope-and-sequence charts that
accompany math textbooks when selecting CBM computational objectives.
The order in which math computational skills are taught, however, probably
does not vary a great deal from district to district. Instructors seeking a quick review
of computational goals arranged in order of increasing difficulty may want to
consult the computational-skills chart included in Appendix D. This chart was
adapted from Shapiro (1989) and summarizes the math curriculum of a typical
school district. When consulting the chart, teachers can mark in the appropriate
place those skills which their students have mastered, those skills in which their
students are presently placed instructionally, and those skills which their students
have not yet been taught. In the sample chart below, for example, the instructor of a
2nd-grade math group has completed a skills-profile for his math group:
CBM Workshop Manual
Jim Wright
Page 2-9
Chapter 2: Administration and Scoring Of CBM Probes
Fig. 2.5: Sample Computational Skills Chart for 2nd-Grade Math Group
MASTERY
INSTRUCTIONAL
DIFFICULTY
Grade 1
__
__
__
__
__
__
1. Add two one-digit numbers: sums to 10.
2. Subtract two one-digit numbers: combinations to 10.
Grade 2
__
__
__
__
__
__
__
__
__
__
__
__
3. Add two one-digit numbers: sums 11 to 19.
4. Add a one-digit number to a two-digit number--no regrouping.
5. Add a two-digit number to a two-digit number--no regrouping.
6. Add a three-digit number to a three-digit number--no regrouping.
Instructors typically are interested in employing CBM to monitor students'
acquisition of skills in which they are presently being instructed. However, teachers
may also want to use CBM as a skills check-up to assess those math objectives that
students have been taught in the past or to "preview" a math group's competencies
in computational material that will soon be taught.
Preparing CBM Math Probes
After computational objectives have been selected, the instructor is ready to
prepare math probes. The teacher may want to create single-skills probes, multipleskill probes, or both types of CBM math worksheets.
Creating the Single-skill Math Probe
As the first step in putting together a single-skill math probe, the teacher will select
one computational objective as a guide. The measurement pool, then, will consist
of problems randomly constructed that conform to the computational objective
chosen. For example, the instructor may select the following goal from the math
skills chart as the basis for a math probe:
Fig. 2.6: Single-skill math probe
ˆ 3. Add two one-digit numbers: sums 11 to 19.
9
+7
CBM Workshop Manual
6
+5
8
+3
Jim Wright
4
+9
Page 2-10
17
+ 2
Chapter 2: Administration and Scoring Of CBM Probes
The teacher would then construct a series of problems which match the
computational goal, as in Figure 2.6. In general, single-skill math probes should
contain between 80 and 200 problems, and worksheets should have items on both
the front and back of the page. Adequate space should also be left for the student's
computations, especially with more complex problems such as long division.
Creating the Multiple-skill Math Probe
To assemble a multiple-skill math probe, the instructor will first select the range of
math operations and of problem-types that will make up the probe. The teacher will
probably want to consult the district math curriculum, appropriate scope -andsequence charts, or the computational-goal chart included in this manual when
selecting the kinds of problems to include in the multiple-skill probe. Once the
computational objectives have been chosen, the teacher can make up a worksheet of
mixed math facts conforming to those objectives. Using our earlier example, the
teacher who used the math-skills chart to estimate the proficiency of his 2nd-grade
math group may then decide to create a multiple-skills CBM probe. He could choose
to sample only those problem-types which his students have either mastered or are
presently being instructed in. Those skills are listed in Figure 2.7, with sample
problems that might appear on the worksheet of mixed math facts:
Fig. 2.7: Multiple-skill math probe
1.
2.
3.
4.
Add two one-digit numbers: sums to 10. (Mastered)
Subtract two one-digit numbers: combinations to 10. (Mastered)
Add two one-digit numbers: sums 11 to 19.(Instructional)
Add a one-digit number to a two-digit number--no regrouping. (Instructional)
23
+6
7
+4
4
+9
9
+9
36
+2
7
+1
Materials needed for giving CBM math probes
o Student copy of CBM math probe (either single- or multiple-skill)
o Stopwatch
o Pencils for students
Administration of CBM math probes
The examiner distributes copies of one or more math probes to all the
students in the group. (Note: These probes may also be administered individually).
The examiner says to the students:
CBM Workshop Manual
Jim Wright
Page 2-11
Chapter 2: Administration and Scoring Of CBM Probes
The sheets on your desk are math facts.
If the students are to complete a single-skill probe, the examiner
then says: All the problems are [addition or subtraction or
multiplication or division] facts.
If the students are to complete a multiple-skill probe, the
examiner then says: There are several types of problems on the
sheet. Some are addition, some are subtraction, some are
multiplication, and some are division [as appropriate]. Look at
each problem carefully before you answer it.
When I say 'start,' turn them over and begin answering the
problems. Start on the first problem on the left on the top row
[point]. Work across and then go to the next row. If you can't
answer the problem, make an 'X' on it and go to the next one. If
you finish one side, go to the back. Are there any questions?
Say, Start. The examiner starts the stopwatch.
While the students are completing worksheets, the examiner
and any other adults assisting in the assessment circulate around
the room to ensure that students are working on the correct
sheet, that they are completing problems in the correct order
(rather than picking out only the easy items), and that they have
pencils, etc.
After 2 minutes have passed, the examiner says Stop. CBM
math probes are collected for scoring.
Scoring
Traditional approaches to computational assessment usually give credit for
the total number of correct answers appearing on a worksheet. If the answer to a
problem is found to contain one or more incorrect digits, that problem is marked
wrong and receives no credit. In contrast to this all-or-nothing marking system,
CBM assigns credit to each individual correct digit appearing in the solution to a
math fact.
On the face of it, a math scoring system that awards points according to the
number of correct digits may appear unusual, but this alternative approach is
grounded in good academic-assessment research and practice. By separately scoring
each digit in the answer of a computation problem, the instructor is better able to
recognize and to give credit for a student's partial math competencies. Scoring
computation problems by the digit rather than as a single answer also allows for a
more minute analysis of a child's number skills.
Imagine, for instance, that a student was given a CBM math probe consisting
of addition problems, sums less than or equal to 19 (incorrect digits appear larger
CBM Workshop Manual
Jim Wright
Page 2-12
Chapter 2: Administration and Scoring Of CBM Probes
than correct digits):
Fig. 2.8: Completed math probe
13
+6
18
9
+ 7
17
4
+2
6
5
+4
9
12
+2
14
14
+4
19
If the answers in Figure 2.8 were scored as either correct or wrong, the child would
receive a score of 3 correct answers out of 6 possible answers (50 percent). However,
when each individual digit is scored, it becomes clear that the student actually
correctly computed 7 of 10 possible digits (70 percent). Thus, the CBM procedure of
assigning credit to each correct digit demonstrates itself to be quite sensitive to a
student's emerging, partial competencies in math computation.
The following scoring rules will aid the instructor in marking single- and
multiple-skill math probes:
Individual correct digits are counted as correct.
--Reversed or rotated digits are not counted as errors unless their
change in position makes them appear to be another digit
(e.g., 9 and 6).
Incorrect digits are counted as errors.
--Digits which appear in the wrong place value, even if otherwise
correct, are scored as errors.
Example:
97
x 9
8730
"873" is the correct answer to this
problem, but no credit can be given
since the addition of the 0 pushes the
other digits out of their proper placevalue positions.
The student is given credit for "place-holder" numerals that are included
simply to correctly align the problem. As long as the student includes the
correct space, credit is given whether or not a "0" has actually been inserted.
CBM Workshop Manual
Jim Wright
Page 2-13
Chapter 2: Administration and Scoring Of CBM Probes
Example:
55
x 82
110
4400
4510
Since the student correctly placed 0 in
the "place-holder" position, it is given
credit as a correct digit. Credit would
also have been given if the space were
reserved but no 0 had been inserted.
In more complex problems such as advanced multiplication, the student is
given credit for all correct numbers that appear below the line.
Example:
33
x 28
264
660
924
Credit is given for all work below the
line. In this example, the student
earns credit for 9 correct digits.
Credit is not given for any numbers appearing above the line (e.g., numbers
marked at the top of number columns to signify regrouping).
Example:
1
46
+ 39
85
Credit is given for the 2 digits below
the line. However, the carried "1"
above the line does not get credit.
Written Expression
Description
CBM Writing probes are simple to administer but offer a variety of scoring
options. As with math and spelling, writing probes may be given individually or to
groups of students. The examiner prepares a lined composition sheet with a storystarter sentence or partial sentence at the top. The student thinks for 1 minute
about a possible story to be written from the story-starter, then spends 3 minutes
writing the story. The examiner collects the writing sample for scoring. Depending
on the preferences of the teacher, the writing probe can be scored in several ways
CBM Workshop Manual
Jim Wright
Page 2-14
Chapter 2: Administration and Scoring Of CBM Probes
(see below).
Creating a measurement pool for writing probes
Since writing probes are essentially writing opportunities for students, they
require minimal advance preparation. The measurement pool for writing probes
would be a collection of grade-appropriate story-starters, from which the teacher
would randomly select a story-starter for each CBM writing assessment. Writing
texts are often good sources for lists of story-starters; teachers may also choose to
write their own.
Preparing CBM writing probes
The teacher selects a story-starter from the measurement pool and places it at
the top of a lined composition sheet. The story-starter should avoid wording that
encourages students to generate lists. It should also be open-ended, requiring the
writer to build a narrative rather than simply to write down a "Yes" or
Fig. 2.9: Example of a writing probe
CBM Written Language
Name_______________________
Grade____
Date_______
One day, I was out sailing. A storm carried me far out to sea and
wrecked my boat on a desert island. ______________________________
__________________________________________________________
__________________________________________________________
"No" response. The CBM writing probe in Figure 2.9 is a good example of how a
such a probe might appear. This particular probe was used in a 5th-grade classroom.
Materials needed for giving CBM writing probes
o Student copy of CBM writing probe with story-starter
o Stopwatch
o Pencils for students
Administration of CBM writing probes
The examiner distributes copies of CBM writing probes to all the students in
the group. (Note: These probes may also be administered individually). The
examiner says to the students:
I want you to write a story. I am going to read a sentence to you
first, and then I want you to write a short story about what
happens. You will have 1 minute to think about the story you
CBM Workshop Manual
Jim Wright
Page 2-15
Chapter 2: Administration and Scoring Of CBM Probes
will write and then have 3 minutes to write it. Do your best
work. If you don't know how to spell a word, you should guess.
Are there any questions?
For the next minute, think about . . . [insert story-starter]. The
examiner starts the stopwatch.
At the end of 1 minute, the examiner says, Start writing.
While the students are writing, the examiner and any other
adults helping in the assessment circulate around the room. If
students stop writing before the 3-minute timing period has
ended, monitors encourage them to continue writing.
After 3 additional minutes, the examiner says, Stop writing.
CBM writing probes are collected for scoring.
Scoring
The instructor has several options when scoring CBM writing probes.
Student writing samples may be scored according to the (1) number of words
written, (2) number of letters written, (3) number of words correctly spelled, or (4)
number of writing units placed in correct sequence. Scoring methods differ both in
the amount of time that they require of the instructor and in the quality of
information that they provide about a student's writing skills. Advantages and
potential limitations of each scoring system are presented below.
1. Total words--The examiner counts up and records the total number of words
written during the 3-minute writing probe. Misspelled words are included in the
tally, although numbers written in numeral form (e.g., 5, 17) are not counted.
Calculating total words is the quickest of scoring methods. A drawback, however, is
that it yields only a rough estimate of writing fluency (that is, of how quickly the
student can put words on paper) without examining the accuracy of spelling,
punctuation, and other writing conventions. The CBM writing sample in Figure
2.10 was written by a 6th-grade student:
Fig. 2.10: CBM writing sample scored for total words
I woud drink water from the ocean.....07
and I woud eat the fruit off of.......08
the trees. Then I woud bilit a.......07
house out of trees, and I woud........07
gather firewood to stay warm. I......06
woud try and fix my boat in my........08
spare time. .........................02
Word total = 45
Using the total-words scoring formula, this sample is found to contain 45 words
CBM Workshop Manual
Jim Wright
Page 2-16
Chapter 2: Administration and Scoring Of CBM Probes
(including misspellings).
2. Total letters--The examiner counts up the total number of letters written during
the 3-minute probe. Again, misspelled words are included in the count, but
numbers written in numeral form are excluded. Calculating total letters is a
reasonably quick operation. When compared to word-total, it also enjoys the
advantage of controlling for words of varying length. For example, a student who
writes few words but whose written vocabulary tends toward longer words may
receive a relatively low score on word-total but receive a substantially higher score
Fig. 2.11: CBM writing sample scored for total letters
I woud drink water from the ocean.....27
and I woud eat the fruit off of.......24
the trees. Then I woud bilit a.......23
house out of trees, and I woud........23
gather firewood to stay warm. I......25
woud try and fix my boat in my........23
spare time. .........................09
Letter total = 154
for letter-total . As with word-total, though, the letter-total formula gives only a
general idea of writing fluency without examining a student's mastery of writing
conventions. When scored according to total letters written, our writing sample is
found to contain 154 letters.
3. Correctly Spelled Words--The examiner counts up only those words in the
writing sample that are spelled correctly. Words are considered separately, not
within the context of a sentence. When scoring a word according to this approach, a
Fig. 2.12: CBM Writing sample scored for correctly spelled words
I woud drink water from the ocean.....06
and I woud eat the fruit off of.......07
the trees. Then I woud bilit a.......05
house out of trees, and I woud........06
gather firewood to stay warm. I......06
woud try and fix my boat in my........07
spare time. .........................02
Correctly Spelled Words = 39
good rule of thumb is to determine whether--in isolation--the word represents a
correctly spelled term in English. If it does, the word is included in the tally.
Assessing the number of correctly spelled words has the advantage of being quick.
Also, by examining the accuracy of the student's spelling, this approach monitors to
some degree a student's mastery of written language. Our writing sample is found
CBM Workshop Manual
Jim Wright
Page 2-17
Chapter 2: Administration and Scoring Of CBM Probes
to contain 39 correctly spelled words.
4. Correct Writing Sequences--When scoring correct writing sequences, the
examiner goes beyond the confines of the isolated word to consider units of writing
and their relation to one another. Using this approach, the examiner starts at the
beginning of the writing sample and looks at each successive pair of writing units
(writing sequence). Words are considered separate writing units, as are essential
marks of punctuation. To receive credit, writing sequences must be correctly spelled
and be grammatically correct. The words in each writing sequence must also make
sense within the context of the sentence. In effect, the student's writing is judged
according to the standards of informal standard American English. A caret (^) is
used to mark the presence of a correct writing sequence.
Fig. 2.13: An illustration of selected scoring rules for correct writing sequences.
Since the first word is correct, it is marked
as a correct writing sequence.
^ It^ was^ dark^ .^ Nobody^
Because the period is
considered essential
punctuation, it is joined
with the words
before and after it to make
2 correct writing sequences.
could seen the^ trees^ of
^ the
forrest.
Grammatical or syntactical errors are
not counted .
Misspelled words are not counted.
The following scoring rules will aid the instructor in determining correct writing
sequences:
Correctly spelled words make up a correct writing sequence (reversed letters
are acceptable, so long as they do not lead to a misspelling):
Example
^ Is^ that^ a^ red^ car^ ?
CBM Workshop Manual
Jim Wright
Page 2-18
Chapter 2: Administration and Scoring Of CBM Probes
Necessary marks of punctuation (excluding commas) are included in correct
writing sequences:
Example
^ Is^ that^ a^ red^ car^ ?
Syntactically correct words make up a correct writing sequence:
Example
^ Is^ that^ a^ red^ car^ ?
^ Is^ that^ a^ car
red?
Semantically correct words make up a correct writing sequence:
Example
^ Is^ that^ a^ red^ car^ ?
^ Is^ that^ a
read car^ ?
If correct, the initial word of a writing sample is counted as a correct writing
sequence:
Example
^ Is^ that^ a^ red^ car^ ?
Titles are included in the correct writing sequence count:
Example
^ The^ Terrible^ Day
With the exception of dates, numbers written in numeral form are not
included in the correct writing sequence count:
Example
^ The 14 soldiers^ waited^ in^ the^ cold^ .
^ The^ crash^ occurred^ in^ 1976^ .
Not surprisingly, evaluating a writing probe according to correct writing
CBM Workshop Manual
Jim Wright
Page 2-19
Chapter 2: Administration and Scoring Of CBM Probes
sequences is the most time-consuming of the scoring methods presented here. It is
also the scoring approach, however, that yields the most comprehensive
information about a student's writing competencies. While further research is
Fig. 2.14: CBM Writing sample scored for correct writing
sequence (Each correct writing sequence is marked with a caret
(^)):
^I
woud drink^ water^ from^ the^ ocean...05
^ and^ I
woud eat^ the^ fruit^ off^ of.... 06
^ the^ trees^ . ^ Then^ I
woud bilit a....05
^ house^ out^ of^ trees,^ and^ I
woud .....06
gather^ firewood^ to^ stay^ warm^ .^ I.... 06
woud try^ and^ fix^ my^ boat^ in^ my .....06
^ spare^ time^ .
.........................03
Correct Word Sequences = 37
needed to clarify the point, it also seems plausible that the correct writing sequence
method is most sensitive to short-term student improvements in writing.
Presumably, advances in writing skills in virtually any area (e.g., spelling,
punctuation) could quickly register as higher writing sequence scores. Our writing
sample is found to contain 37 correct writing sequences
Spelling
Description
Although they can be administered individually, CBM spelling probes are
typically given to groups of students. The examiner reads aloud a list of 12 to 17
spelling words, reading successive words after a predetermined number of seconds.
Students attempt to spell the words on their answer sheets in the time allotted.
Creating a measurement pool for spelling probes
There are a number of sources from which the instructor may build a
measurement pool of spelling words. A number of commercial spelling programs
are available (e.g., Scott Foresman) for use in classrooms. Some districts also have
created their own spelling curriculums, containing wordlists appropriate to each
CBM Workshop Manual
Jim Wright
Page 2-20
Chapter 2: Administration and Scoring Of CBM Probes
grade level. Teachers who use a basal reading series may choose to adopt a third
alternative: using the new vocabulary introduced in the grade reading text as the
source of spelling words. Regardless of what source instructors choose for their
spelling words, the process of building a measurement pool is the same. The
teacher compiles a single list of all the spelling words to be taught during the
instructional year and uses this master list to create individual CBM spelling probes.
Preparing CBM spelling probes
From the list of spelling words that make up the measurement pool , the
instructor chooses words at random when compiling individual CBM spelling
probes. For grades 1-3, a CBM probe will be comprised of 12 spelling words, with a
new word being announced to students each 10 seconds. A spelling probe for grades
4-8 will include 17 words, with a new word announced to students each 7 seconds.
One approach which is helpful in creating truly random CBM spelling lists is
for the teacher to randomly select words from a master spelling list, using the
random-number table and procedure presented in Appendix A. Choosing numbers
in the order that they appear in the table, the instructor counts down the master
spelling list. The teacher selects words that correspond with each successive number.
The process is repeated, with the instructor advancing through the master list until
sufficient words have been chosen for a complete spelling probe.
Materials needed for giving CBM spelling probes
o Student answer sheet with numbered lines for writing words
o Instructor wordlist with numbered spelling words
o Stopwatch
o Pencils for students
Administration of CBM spelling probes
The examiner distributes answer sheets to all the students in the group.
(Note: These probes may also be administered individually). If the students are in
grades 1-3, the lined answer sheet should be numbered from 1 to 12. For student is
grades 4-8, the answer sheet should be numbered 1 to 17.
The examiner says to the students:
I am going to read some words to you. I want you to spell the
words on the sheet in front of you. Write the first word on the
first line, the second word on the second line, and so on. I'll
give you (7 or 10) seconds to spell each word. When I say the
next word, write it down, even if you haven't finished the last
one. You will receive credit for each correct letter written. Are
there any questions? (Pause) Let's begin.
The examiner says the first word and starts the stopwatch. Each
word is repeated twice. Homonyms are used in a sentence to
clarify their meaning (e.g., "Lead. The pipe was made of lead.
CBM Workshop Manual
Jim Wright
Page 2-21
Chapter 2: Administration and Scoring Of CBM Probes
Lead.")
A new word is announced each (7 or 10) seconds for a total time
of 2 minutes. After every third word for younger children and
every fifth word for older children, the teacher says the number
of the word. (e.g., "Number 5. Basket. Basket.") The examiner
or assistants check students while they are writing to ensure that
they are writing on the correct line.
After 2 minutes, the examiner says, Stop. Put your pencils
down.
Scoring
The scoring of CBM spelling probes is similar to that of other CBM measures
in that it is designed to give credit to the student for even partial competencies.
Instead of giving credit for words only when all letters are correct, CBM views
spelling words as being made up of smaller units called letter-sequences. Correct
letter-sequences are pairs of letters in a word that are placed in the proper sequence.
Therefore, if a student is able to put at least some letters in the proper sequence, that
child will be given partial credit for a word. The CBM method of scoring words is
also quite sensitive to short-term student gains in spelling skills.
To compute the number of correct letter sequences in a spelling word, the
instructor first assumes that there is a space-holder, or "phantom letter," at the
beginning and end of each word. For each pair of letters that appear in correct
sequence, the teacher places a caret (^) above that letter-pair. The initial and final
"phantom letters" are also counted in letter sequences. The word 'talk' is scored in
Figure 2.15 for all possible correct letter sequences:
Fig. 2.15: An illustration of scoring for correct letter sequences.
__ T A L K __
Correct Letter Sequences = 5
The initial and final space-holders, or"phantom letters,"
are included as part of correct letter sequences
As a shortcut when computing possible number of correct letter sequences in a
word, the teacher can simply count up the number of letters that make up the word
and add 1 to that number. The resulting figure will represent the total letter
sequences in the word. For example, 'talk' has 4 letters. By adding 1 to that amount,
we see that it contains 5 letter-sequences.
The following scoring rules will aid the instructor in determining the number of
correct letter sequences (CLS) of spelling words:
CBM Workshop Manual
Jim Wright
Page 2-22
Chapter 2: Administration and Scoring Of CBM Probes
Omitted letters will affect the letter-sequence count:
Example
Correct:
Incorrect:
_^t^r^a^i^n^_
_^t^r^a n^_
CLS = 6
CLS =4
Inserted letters will not be included in the letter-sequence count:
Example
Correct:
Incorrect:
_^d^r^e^s^s^_ CLS = 6
_^d^r^e a s^s^_ CLS =5
In words with double letters, if one of those double letters has been omitted,
only the first letter written is included as a correct letter sequence:
Example
Correct:
Incorrect:
_^t^a^p^p^i^n^g^_
_^t^a^p i^n^g^_
CLS = 8
CLS =6
Initial letters of proper nouns must be capitalized to be included in the lettersequence count:
Example
Correct:
Incorrect:
_^M^o^n^d^a^y^_
_ m o^n^d^a^y^_
CLS =7
CLS =5
In words with internal punctuation (e.g., apostrophes, hyphens), those
punctuation marks are separately counted as letters when calculating the
letter-sequence count:
Example
Correct:
Incorrect:
CBM Workshop Manual
_^c^a^n^'^t^_
_^c^a^n t^_
Jim Wright
Page 2-23
CLS =6
CLS =4
Chapter 2: Administration and Scoring Of CBM Probes
Reversed letters are counted when calculating correct letter-sequences unless
those reversals appear as another letter:
Example
Correct:
Incorrect:
_^ ^e^l^l^o^w^_
_ q r^e^t^t^y^_
CLS =7
CLS =5
Summary
Well-researched and standardized CBM procedures have been established for
reading, mathematics, writing, and spelling. Regardless of the subject area to be
assessed, CBM requires that the instructor first establish a measurement pool of
potential items (e.g., reading passages, spelling words) from which to create
randomly selected CBM probes. Reading probes are scored according to words
correctly read aloud per minute. Three separate reading passages are given and the
median, or middle, score is selected as the value that best represents the student's
"true" rate of fluency in the reading material. Math probes consist of single- and
multiple-skill worksheets and have a two-minute time limit. Credit is allowed for
each correctly written digit that appears below the line. Writing probes are
completed in a three-minute period and offer several scoring options: compositions
can be scored according to total words written, number of letters written, number of
correctly spelled words, and number of correct writing sequences. Spelling probes
are administered in a two-minute span, although the number of words given in
that time varies according to grade. Spelling words are scored according to number
of correct letter-sequences.
CBM Workshop Manual
Jim Wright
Page 2-24
Chapter 3: Charting and Interpreting CBM Data
3
Charting & Interpreting CBM Data
Introduction
Because CBM converts student academic behaviors into numbers (e.g.,
number of words read correctly per minute), teachers can easily chart the resulting
data over time to create a series of data-points that represent a targeted student's rate
of academic progress. In this chapter, instructors will learn how to set up CBMmonitoring charts, how to establish academic performance-goals for a student, and
how to use CBM data gathered on an ongoing basis to determine the effectiveness of
a child's educational program.
Setting up the CBM chart
Before CBM scores can be readily interpreted, they first need to be converted
into a visual display. By graphing fluency scores over time as data-points on a
graph, the instructor can actually see rates of progress rather than trying to discern
trends from tables of abstract numbers. The first step in charting CBM data
requires that the teacher set up a progress-monitoring graph. There are several
points to be determined before the chart can be created. At the outset, the teacher
must decide what type(s) of academic
Fig. 3.1: Labeling the CBM chart
behaviors are being measured. In
addition to behaviors, the instructor
Academic behaviors and time-limit are
will want to include the time-limit of
listed on the vertical axis of the chart
the CBM probe used to collect the data.
For example, a chart may measure
40
' correctly read words per minute'
since that represents both the type of
35
behavior to be measured and the timelimit of the CBM reading probe. Labels
listing academic behaviors and time
30
limits are placed on the vertical axis of
the graph. Numbers are also listed on
the vertical axis, representing a range
25
of frequency of academic behaviors
observed. If teachers are using an allpurpose graph for children with a wide
20
range of skills, they may want to
include a
correspondingly wide range of numbers on the vertical axis. For example, a teacher
who has students in her 2nd-grade classroom reading between 20 words and 130
words per minute in grade-appropriate material might want to number the graph
to accommodate both the slowest and fastest readers. On the other hand, graphs
CBM Workshop Manual
Jim Wright
Page 3-1
Chapter 3: Charting and Interpreting CBM Data
can also be prepared for individual children and be numbered with their more
limited performance ranges in mind.
Next, the instructor chooses the number of instructional weeks over which
CBM data will be graphed. For regular-education students, the instructor may vary
the length of the monitoring-period to match their educational program (e.g., 10
Fig. 3.2: Labeling the CBM chart
Horizontal axis numbered by successive weeks
1
2
3
4
5
Weeks of Instruction
Horizontal axis labeled by date
1/2
1/9
1/16
1/23
Weeks of Instruction
weeks, 25 weeks). Teachers of special-education children may choose to maintain
a graph through the school year until annual reviews. The horizontal axis of the
graph is labeled "Weeks of Instruction" and may list successive weeks by number
(e.g., "1, 2, 3. . ."), by date or using both labels.
Charting baseline data
After the graph has been prepared, the teacher can chart initial data of the
student's performance on a selected type of CBM probe. To obtain this initial, or
baseline, data, the instructor administers CBM in a targeted subject area and scores it
according to the guidelines found in chapter 2 of this manual. The resulting score
can then be entered onto the chart. It should be remembered, though, that a child's
performance on an isolated CBM probe stands only as an estimate of that student's
"true" level of ability. While a single data-point is sufficient to yield a general
Fig. 3.3: Selecting median value of baseline data
When 3 data-points are
gathered as baseline
information, the median
point stands as the best
estimate of the student's
actual academic fluency.
35
30
25
20
approximation of the student's ability, the teacher can have greater confidence in
the estimate if at least 3 CBM probes are given over the space of a week or so to
collect baseline information. Having charted 3 data-points, the instructor can then
choose the middle, or median, score as a good approximation of the child's actual
level of academic fluency, as seen in Figure 3.3.
Setting a performance goal
Next, the teacher will set a long-term CBM performance goal for the student.
CBM Workshop Manual
Jim Wright
Page 3-2
Chapter 3: Charting and Interpreting CBM Data
A performance goal is the rate of increase in skills-fluency that the child is expected
to achieve by the end of a monitoring period. It represents a teacher's estimate of
the gains in basic skills that a child will achieve over a predetermined number of
weeks. Computing a long-term performance goal can be done easily by using a
simple formula. First, the teacher obtains CBM baseline data about a student's
fluency in a targeted academic area and charts this information. Then, the teacher
decides how quickly the student's fluency-rate should increase each week in a
successful learning program. The teacher also determines how many weeks the
student will be monitored using a certain type of CBM probe. To calculate the longterm rate of skills increase, the instructor multiplies the expected rate of
improvement per week by the number of weeks that the student will be monitored.
The resulting figure is added to the baseline to give the instructor a performance
goal.
Table 3.1
Calculating a CBM Performance Goal
1. Estimated increase in fluency per week X Number of instructional
weeks = ______
2. Add product from step 1 to student baseline data (using the median
data-point)
Sample Calculation for CBM Reading
1. Estimated increase of 3 words per week in reading fluency X 10 weeks
= 30 words
2. Add product of step 1 (30 words) to baseline of 26 words
Performance goal = 56 words per minute by the end of 10
instructional weeks
To illustrate the process, let's calculate a sample performance goal in CBM reading.
As shown in Table 3.1, a student is found to be reading aloud passages from a 2ndgrade reader at a baseline rate of 26 words per minute. The teacher estimates that
the child should be able to increase reading fluency by approximately 3 words per
instructional week. In addition, the instructor has chosen to monitor the student
over 10 instructional weeks. The teacher multiplies 3 words per week (of increased
fluency) by the 10 instructional weeks to arrive at an estimate of 30 words increase in
reading fluency at the end of the monitoring period. The 30-word increase is then
added to the 26 words from the baseline to arrive at a performance goal of 56
correctly read words per minute by the end of the 10th week of monitoring.
Charting an aimline
When the teacher has calculated a student's performance goal, that goal will
be placed on the CBM chart. The teacher marks the performance goal with an 'X'
on the last instructional week during which the student will be monitored (on the
far right side of the chart). A line is then drawn connecting the student's baseline
CBM Workshop Manual
Jim Wright
Page 3-3
Chapter 3: Charting and Interpreting CBM Data
performance to his or her performance goal. This line is called the "aimline." It
stands as a visual reminder of how quickly the student is expected to increase
academic skills.
Fig. 3.5: CBM Monitoring Graph for a 2nd-grade student
80
Performance
Goal
70
60
X
Aimline
50
Baseline : 26 correct
words per minute (as
represented by the
circled median datapoint).
Performance Goal
:
56 words per minute
40
Monitoring Period
:
10 instructional weeks
30
Baseline Data
20
0
2
4
8
10 12
14
Weeks of Instruction
6
The sample CBM reading chart above displays baseline data, performance goal and
aimline for a 2nd-grade student.
Evaluating data: Informal guidelines
When sufficient data-points have been added to a progress-monitoring chart,
the instructor is ready to interpret the charted information. Much of the meaning of
the data-points on a chart can be determined by simply glancing at the way that
those points are distributed on the graph. Several informal indicators are presented
below for drawing conclusions from graphed data about the effectiveness of an
instructional intervention (program change).
Degree of change in "level" of data-points
The teacher looks at the average "level" at which data-points are clustered on
the graph both before and after a program change has been put into place. If the
Fig. 3.6: Comparing level of points before and
after intervention
Minimal jump in level
CBM Workshop Manual
Substantial jump in level
Jim Wright
Page 3-4
Chapter 3: Charting and Interpreting CBM Data
intervention is immediately successful, there may be a marked change in the level
of points after the intervention. Typically, educators are looking for increases in
level after a program change, but there are situations (for example, when charting a
student's rate of reading errors) in which a decrease in level may be desired.
Variability of data-points
Instructors would prefer that a program change bring about a stable, steady
improvement in the student's academic behaviors. This pattern of consistent
progress is evident when data-points on the graph are relatively tightly
Fig. 3.7: Comparing variability of points
Extreme variability
Limited variability
clustered and display only a limited amount of variability. In contrast, data with a
high degree of variability would demonstrate inconsistency, a sign that the student's
performance could not be easily predicted on any given day.
Overlap of data-points
It can be assumed that, if a program change has had a decisive impact on a
child's academic behaviors (for example, improving reading fluency), there should
Fig. 3.8: Overlap of points before and after intervention
Substantial overlap
Minimal overlap
be minimal overlap between data-points collected before and those obtained after
the intervention has gone into effect. Certainly, some overlap is to be expected,
particularly in the early stages of a program-change. That overlap should decrease
or disappear, though, as the child develops increased fluency in academic skill.
Evaluating data: Formal procedures
While informal methods of evaluating data can be useful, the instructor will
greatly enhance the power of CBM by consistently applying decision-rules to charted
data. Decision-rules are firm guidelines for interpreting the "pattern" of data-points
on a graph. By using decision-rules on a regular basis with CBM data, the teacher
CBM Workshop Manual
Jim Wright
Page 3-5
Chapter 3: Charting and Interpreting CBM Data
will constantly be checking the student's progress to be sure that the child is
increasing skill-levels at the expected rate. Research has shown that instructors who
simply chart CBM information find that their students do moderately better in
targeted academic areas. However, those teachers who systematically use decisionrules to interpret charted CBM data and guide them in instructional decisionmaking achieve marked improvements in student learning-rates.
3 data-point decision-rule
As a means of interpreting CBM information, the 3 data-point decision-rule is
the simplest to use, an important consideration when teachers are working with
hand-charted data. Using the 3 data-point rule, the teacher reviews the charted CBM
data on a regular basis (see Figure 3.9). If the 3 most recent data-points are found to
lie below the aimline at any time, the instructional intervention is altered to
encourage an increased rate of learning. If 3 successive data-points are found to lie
above the aimline, the aimline is adjusted upward to reflect the more ambitious
learning rate. If the 3 most recent data-points are found to be clustered both above
and below the aimline, the teacher can assume that the student is progressing at an
optimal rate, and no changes in the instructional program are called for.
Fig. 3.9: Applying the 3 data-point decision-rule
If 3 successive data points lie
above the aimline, the instructor
adjusts the aimline upward.
If 3 successive data points lie
below the aimline, the instructor
changes the instructional
intervention to boost learning.
If 3 successive data points lie
around the aimline, the instructor
makes no changes.
Plotting a trendline using the Tukey method
The 3 data-point rule provides only a very short-range estimate of a child's
progress in CBM. Some instructors elect instead to gather a larger number of datapoints before applying a decision-rule. When at least 7-8 data-points have been
collected, the teacher may use the Tukey method (named after the statistician who
invented the procedure) to plot a trendline, or line of improvement, that shows the
CBM Workshop Manual
Jim Wright
Page 3-6
Chapter 3: Charting and Interpreting CBM Data
approximate rate of progress that a student is achieving. The instructor may then
compare the trendline to the aimline to make decisions about the effectiveness of an
instructional intervention.
To plot the trendline using the Tukey method, the teacher first counts up the
data-points on the graph and draws two vertical lines that divide the data-points
evenly into 3 groupings. (If the number of data-points does not exactly divide into 3
parts, the groupings should be approximately equal. For example, if the chart
contains 11 data-points, they can be divided into groups of 4, 3, and 4 data-points.)
Next, the instructor concentrates on the first and third sections of the graph,
ignoring the middle section. In each of the two selected sections, the teacher finds
the median point on the X (horizontal) and Y (vertical) axes and marks an "X" on
the graph at the place where those points intersect. To locate the median time (e.g.,
instructional week) on the horizontal axis of a section, the teacher looks at the span
of weeks in which data was collected. For example, if data-points appear for weeks 15 in the first section, the teacher considers the middle, or median, point to be 3.0. To
locate the median number of observed behaviors on the vertical axis, the instructor
examines the data-points in the graph-section, selecting the median or middle,
value from among the range of points.
Fig. 3.10: Plotting a Trendline with the Tukey Method
80
Section 3
Section 1
70
60
50
X
Step 1: Divide the
data-points into 3 equal
sections by drawing 2
vertical lines. (If the points
divide unevenly, group them
approximately).
40
30
.
X
20
10
0
0
2
4
6
8
10
12
Instructional Weeks
Step 3: Draw a line through the two
"X's", extending to the margins of the
graph. This represents the trendline
or line of improvement.
14
Step 2: In the 1st and 3rd
sections, find the median
data-point and median
instructional week. Locate
the place on the graph where
the two values intersect and
mark with an "X".
Hutton, J.B., Dubes, R., & Muir, Steven.
(1992). Estimating trend in progress
monitoring data: A comparison of simple
line-fitting methods. School Psychology
Review, 21, 300-312.
When the instructor has found and marked the point of intersect of median X and Y
values in both the first and third sections, a line is then drawn through the two
CBM Workshop Manual
Jim Wright
Page 3-7
Chapter 3: Charting and Interpreting CBM Data
points, extending from the left to the right margins of the graph. By drawing a line
through the 2 X's plotted on the graph, the teacher creates a trendline that provides
a reasonably accurate visual summary of CBM progress. If the trendline falls below
the aimline, a change of program is indicated. If the trendline is above the aimline,
the aimline should be adjusted upward to reflect an accelerated learning rate. If the
trendline matches the aimline, no changes are recommended.
Interpreting CBM data: The case of Alyssa
Let's use a sample case to illustrate how CBM can assist a teacher in
determining how effective an instructional intervention is for a specific child.
Although this case is fictional, it closely resembles actual case histories of local
students whose skills were tracked throughout the school year using CBM.
A teacher in a 2nd-grade classroom has decided to use CBM to monitor the
academic progress of Alyssa, a student having difficulties with reading. Alyssa is 8
years old and is repeating the 2nd grade. As she begins the present school year,
Alyssa is placed in the lower of two 2nd-grade basal readers used in her classroom.
Step 1: Identifying the problem
The first step for the instructor who wishes to use CBM to monitor the
academic progress of a child-at-risk is to identify the presence of a learning problem.
In our example, Alyssa's teacher notes that Alyssa seems to read much more slowly
than many children in her classroom. Based on this informal but important
observation, her teacher decides that Alyssa has enough difficulty reading gradeappropriate texts to warrant her investigating the student's problems with reading
more closely.
Fig. 3.11: Use of classroom CBM norms
100
Classroom
CBM reading
norms
80
Alyssa's
reading
rate
60
40
20
0
CBM Workshop Manual
Jim Wright
Page 3-8
Chapter 3: Charting and Interpreting CBM Data
Before she can determine how delayed Alyssa's reading skills are in
comparison to those of classmates, Alyssa's teacher decides that she first needs to
obtain a grade-appropriate standard of reading fluency. So the teacher gathers CBM
norms in reading in her classroom. She finds that, on the average, children in her
room are able to read 84 correct words aloud per minute in the early 2nd-grade basal
reader. In contrast, Alyssa is able to read only 34 words per minute. From this
comparison (Figure 3.11), it is obvious that Alyssa has a significant delay in reading
skills when compared to classmates.
Step 2: Creating a CBM monitoring procedure
The next step for her teacher is to set up an individual program to monitor
Alyssa's reading progress through CBM. In Alyssa's case, her instructor decides to
monitor the student's reading fluency using CBM probes taken from goal-level
reading material. Instructors who measure CBM reading fluency in basal texts
often create CBM probes from a text above the one in which the child is presently
placed. The ensures that the student's results are not influenced by prior exposure
to the text. Also, research indicates that children reading in goal-level material will
still show appropriate reading growth if their reading program is effective.
Therefore, throughout the monitoring period, Alyssa will read passages weekly
chosen at random from the more advanced of the two 2nd-grade basal readers.
Furthermore, her reading rate will be charted to determine if Alyssa is actually
increasing her reading fluency at an adequate rate.
Step 3: Charting initial data
First, however, initial, or baseline, information about Alyssa's reading rate
must be gathered in the more advanced 2nd-grade basal text in which she will be
Figure 3.12: Charting Alyssa's initial reading-fluency data
80
70
60
50
Baseline
40
(Median
Data-point)
CRW Per Min
30
20
0
2
4
6
8
10
12
14
Weeks of Instruction
CBM Workshop Manual
Jim Wright
Page 3-9
Chapter 3: Charting and Interpreting CBM Data
monitored. Her teacher administers three separate CBM reading probes to Alyssa
over the course of a week and chooses the median performance of 29 correctly read
words per minute as the most accurate estimate of her reading fluency in the later2nd-grade reader. This information is placed on a chart as a baseline data-point
(Figure 3.12) to show Alyssa's reading fluency before the intervention has been put
into place.
Step 4: Setting a performance goal
Now, Alyssa's teacher is ready to set a CBM performance goal for her student.
The instructor has already found that Alyssa is able to read 29 correct words per
minute in the later-2nd-grade reader. The next question to be answered is how
quickly the student's reading rate should increase each week in a successful learning
program. Her teacher uses her own instructional knowledge to estimate that Alyssa
has the ability to increase reading fluency by about 2-1/2 words per week. She also
decides that CBM reading probes are to be given over the span of 10 weeks of
instruction.
To compute Alyssa's performance goal, the teacher simply multiplies the
expected weekly rate of increase in fluency on the CBM reading measure by the
number of weeks that the student's reading progress will be monitored.
After multiplying the 2-1/2 words increase per week by the 10 weeks of
proposed instruction, the instructor calculates that at the end of the monitoring
period, Alyssa should be reading 25 additional words per minute. To compute the
final reading fluency goal, Alyssa's teacher simply adds the 25 additional words per
minute to the 29 words-per-minute baseline figure to arrive at a 10-week reading
goal of 54 words per minute. This proposed goal is marked with an "X" at the 10th
instructional week on the CBM chart shown in Figure 3.13..
Figure 3.13: Setting Alyssa's reading-fluency performance goal
80
Performance
Goal
70
X
60
50
CRW Per Min
40
Aimline
30
20
0
2
4
6
8
10
12
14
Weeks of Instruction
CBM Workshop Manual
Jim Wright
Page 3-10
Chapter 3: Charting and Interpreting CBM Data
Her teacher then draws a line connecting Alyssa's baseline performance to
her learning goal. This line is called the "aimline." Because the aimline stands as a
visual reminder of how quickly this individual student is expected to increase
academic skills over time, it allows the teacher continually to compare the student's
projected and actual rates of instructional progress as measured through CBM
Step 5: Creating and implementing an instructional intervention
Alyssa's teacher next creates an instructional intervention. She decides to
take advantage of a tutoring program that her school has established in which adult
volunteers are matched with selected students who require extra help in reading.
An adult reading tutor is assigned to work with Alyssa individually in the
classroom for two 30-minute periods per week. The tutor regularly previews new
vocabulary words with Alyssa that will be appearing in her reading book. Also,
because it is often effective in increasing reading fluency, listening passage preview
is selected as an additional intervention for Alyssa. During each tutoring session,
the tutor will read aloud from a section of Alyssa's basal reader while the student
silently reads along. Then Alyssa will read the same section of text aloud, with the
tutor correcting her reading as needed.
Step 6: Tracking academic growth through CBM
Meanwhile, at regular intervals during the intervention, Alyssa's teacher
readministers CBM reading probes and continues to chart the results. Typically,
instructors track student skills through CBM once or twice weekly. Within a few
short weeks, the instructor will have graphed enough data-points to draw
conclusions about the child's rate of learning progress.
Step 7: Interpreting charted data
As the CBM data is charted, it must be interpreted. While there are a number
of decision-rules that Alyssa's instructor could use to determine the effectiveness of
the student's reading program, she decides to apply the 3 data-point decision-rule,
which is quite simple to use with hand-charted data. (This rule is reviewed on page
3-6.) With 5 data-points charted, Alyssa teacher compares her actual rate of
increase with her aimline. Her teacher discovers that Alyssa is advancing
somewhat more slowly than she had expected, as can be seen by the 3 data-points in
a row that are found to be below the aimline in Figure 3.14. It is apparent that her
present instructional intervention is not as effective as Alyssa's teacher had hoped.
Having reviewed Alyssa's CBM chart, her instructor decides to alter the
student's reading program in an effort to help her to increase her reading fluency
more quickly. Among other changes, her teacher asks Alyssa's tutor to spend part of
their tutoring time creating books. Alyssa writes out the text of the book with some
help from the tutor and draws pictures to illustrate it. Both her teacher and tutor
observe that Alyssa appears very motivated by the book-writing activity.
CBM Workshop Manual
Jim Wright
Page 3-11
Chapter 3: Charting and Interpreting CBM Data
Figure 3.14: Applying the 3 data-point decision rule to Alyssa's chart
80
3 Data-Point
Decision Rule
70
X
60
50
CRW Per Min
40
30
20
0
2
4
6
8
10
12
14
Weeks of Instruction
As 3 successive
data-points are
found to lie below
the aimline, the
instructor decides
to implement a
program change.
On Alyssa's chart, her teacher places a heavy line to mark the program change that
she has put into place. The marking of program changes on a CBM chart makes it
Figure 3.15: Marking a change in Alyssa's educational program
80
Program
Change
70
X
60
50
CRW Per Min
40
30
20
0
2
4
6
8
10
12
14
Weeks of Instruction
easier for instructors to compare the effectiveness of various instructional
interventions that are tried with a particular student.
Her instructor continues to administer weekly CBM reading probes to Alyssa,
CBM Workshop Manual
Jim Wright
Page 3-12
Chapter 3: Charting and Interpreting CBM Data
charting the data regularly and comparing Alyssa's expected and actual rates of
progress in reading fluency. Periodically applying the 3 data-point decision rule,
Alyssa's teacher sees that the data-points recorded on the chart after the program
change fall consistently both above and below the aimline. The more favorable
distribution of the data-points indicates that Alyssa is now steadily making progress
in building reading fluency. Therefore, her teacher decides that no further program
Figure 3.16: Alyssa's completed CBM chart
Because the final
data-points
are evenly
spread around the
aimline, Alyssa's
teacher decides that
her reading
intervention has
been successful.
80
70
X
60
50
40
CRW Per Min
30
20
0
2
4
6
8
10
12
14
Weeks of Instruction
changes are necessary. Throughout the rest of the monitoring period, Alyssa
continues to increase her reading fluency at the expected rate; her present
instructional intervention is therefore judged to be a success.
Summary
CBM data gathered over time can be charted to provide a visual record of the
child's relative rate of progress. In preparing a graph for progress-monitoring, the
vertical axis is labeled according to the academic behavior to be measured and the
time limit for the probe. The horizontal axis is labeled according to the number of
instructional weeks during which monitoring will take place. Ideally, at least three
initial CBM data-points are graphed, with the median point taken to represent the
student's baseline performance before an instructional intervention is begun. The
instructor calculates a performance goal for the student and plots an aimline
connecting the child's present rate of fluency to the performance goal. As the
instructional intervention is put into place and early data-points are charted, the
teacher can informally evaluate the data, for example looking at the change in level
or degree of variability, and overlap of the data-points. When enough data-points
have been charted, formal decision-rules are used to evaluate progress. By using the
3 data-point rule or by plotting a trendline according to the Tukey method,
CBM Workshop Manual
Jim Wright
Page 3-13
Chapter 3: Charting and Interpreting CBM Data
instructors can judge whether the child is achieving the expected rate of growth in
academic skills.
CBM Workshop Manual
Jim Wright
Page 3-14
Chapter 3: Charting and Interpreting CBM Data
Just for Practice . . .
Compute a trendline for the chart using the Tukey method.
80
70
60
50
.
40
30
20
0
2
4
6
8
10
Weeks of Instruction
CBM Workshop Manual
Jim Wright
12
14
Page 3-15
Chapter 3: Charting and Interpreting CBM Data
Just for Practice . . .
Compute a trendline for the chart using the Tukey method.
80
70
60
50
.
40
30
20
0
2
4
6
8
10
Weeks of Instruction
CBM Workshop Manual
Jim Wright
12
14
Page 3-16
Chapter 4: Research, Classroom, and Schoolwide CBM Norms
4
Research, Classroom & School-wide CBM Norms
Introduction
An essential component of CBM is the setting of performance-goals for
individual children. However, instructors using CBM in their classrooms may
initially be uncertain about how to select such goals for their targeted students. How
can the teacher judge whether a particular child's fluency in reading, for example, is
advanced, average, or delayed in comparison to the reading skills of classmates? In
this chapter, we will review several methods that teachers can use to determine
typical levels of performance in basic skill-areas. Instructors may choose to rely
upon (1) research norms, (2) classroom norms, or (3) school-wide norms when
determining average skill levels for children in a designated grade. While each
approach has both advantages and limitations, all of the methods of norming
supply the instructor with a useful estimate of grade-appropriate levels of
proficiency in basic skills. By using any one of these estimates as a "yard-stick"
against which to compare the skills of a targeted student, the teacher can decide with
some confidence whether that child has a learning problem requiring special
attention and, if so, what educational progress the student must make to move up
into the average range of academic skills.
Research Norms
Several researchers have completed studies that have yielded estimates of
students' expected fluency in reading, mathematics, and written expression across
grade levels. An advantage of these norms is their convenience. Teachers can apply
them immediately, without having to gather additional normative data of their
own. One drawback of these published norms, though, is that they rely on a
research sample of students whose skills may or may not resemble those of a
particular classroom. Also, the CBM materials used by researchers to measure
students' academic skills would not be identical to those prepared by individual
teachers using CBM. Even with these limitations, however, these research norms
can supply a teacher with conservative estimates of academic fluency which they
can use to screen the academic skills of selected children. By comparing the
performance of a targeted student to research norms, the instructor can determine
whether that student has acquired at least the minimal proficiency in gradeappropriate curriculum materials to function successfully.
Reading
The tables below provide estimates of oral reading fluency at various grade
levels. In the manner of informal reading inventories, the charts distinguish
CBM Workshop Manual
Jim Wright
Page 4-1
Chapter 4: Research, Classroom, and Schoolwide CBM Norms
among frustration, instructional, and mastery rates of proficiency in reading. The
student operating at the frustration level in a reading book tends to decode words
quite slowly and may commit a large number of errors, even with considerable
teacher support. As a result, that child can be expected to have difficulty both
comprehending the text and keeping up with fellow readers in the classroom.
When a child is reading instructional-level material, the student is able to decode
relatively quickly with only minimal help from the instructor and makes few
errors. Students placed in texts that they have clearly mastered are able to read
independently at a fluent rate and to adequately comprehend passages without
assistance from others.
Table 4.1: CBM research norms for reading fluency
GRADES 1 THROUGH 3
LEVEL
FRUSTRATION
MEDIAN ERRORS
MEDIAN WORDS
CORRECT PER MINUTE PER MINUTE
29
8 or more
INSTRUCTIONAL
30-49
3-7
MASTERY
50 or more
2 or fewer
GRADES 4 AND UP
LEVEL
FRUSTRATION
MEDIAN ERRORS
MEDIAN WORDS
CORRECT PER MINUTE PER MINUTE
49
8 or more
INSTRUCTIONAL
50-99
3-7
MASTERY
100 or more
2 or fewer
Research norms from Deno, S.L., & Mirkin, P.K. (1977). Data-based
program modification: A manual. Reston, VA: Council for Exceptional
Children.
In order to make use of these research norms in reading, the teacher first randomly
selects 3 basal reading passages from a basal reader suitable to a student's grade
placement and administers a CBM reading probe (as outlined in Chapter 2 of this
manual). To determine the student's level of reading fluency, the instructor
compares the median number of words read correctly by the child, as well as the
median error rate, to the research-norm values on the chart. For example, a student
CBM Workshop Manual
Jim Wright
Page 4-2
Chapter 4: Research, Classroom, and Schoolwide CBM Norms
who was found to be reading a median of 26 words per minute with 9 errors in a
2nd-grade reading book would best be characterized as working at the frustration
level in that particular text. In general, these research norms supply a teacher with
useful estimates of reading fluency. However, they should be applied cautiously to
1st-grade students, because beginning readers as a group typically display widely
varying rates of acquisition of reading skills.
Completing a survey-level assessment in reading using research norms
Teachers who assess reading fluency using CBM may wish to know not only
how well a child may be reading in texts appropriate to an individual classroom, but
also at what grade-level the child reads most comfortably. Using the research norms
in reading, the instructor can carry out a survey-level CBM reading assessment.
With this approach, the teacher gives the child passages from texts of various grades,
beginning with reading material from the student's present classroom curriculum.
Median oral reading rates are obtained at each grade level. These median reading
rates are then compared to the research norms to determine the child's instructional
reading level.
If the child demonstrates mastery or instructional reading proficiency on the
initial CBM reading probe, the instructor gives probes from successively more
advanced grades until the frustration level is reached. If the student operates at the
frustration level on grade-appropriate material, however, the teacher then drops
back and gives reading probes from successively lower grade levels until the child
reaches the mastery level. In most cases, then, the survey-level assessment will
show the instructor the grade-level materials in which the child reads with mastery,
as well as the range of texts in which the student can operate instructionally and the
point in the basal series in which the child encounters frustration in reading.
For example, let's assume that a 4th-grade teacher completed a survey-level
reading assessment for Allen, a boy in her classroom who was having difficulty
keeping up with his reading group. The results show that Allen was able to
Table 4.2: CBM Survey-level Reading Assessment for Allen H.
Correctly Read
Errors
Basal Text
Words Per Minute
Per Minute
1st-grade
78
3
2nd-grade
36
6
3rd-grade
26
11
4th-grade
24
8
read at the mastery level in the 1st-grade text and at the instructional level in the
2nd-grade reader. However, his performance in the 3rd- and 4th-grade books
suggests that, because he is reading below the cut-off point for basic fluency as
outlined in the research norms, Allen is working at the frustration level in both
texts. In Figure 4.1, the frustration, instructional, and mastery levels of the research
norms are represented as regions on a graph. Allen's performance at each gradelevel is represented by a dot. It can be surmised from this survey-level assessment
that Allen's most appropriate placement is in 2nd-grade reading material. His
CBM Workshop Manual
Jim Wright
Page 4-3
Chapter 4: Research, Classroom, and Schoolwide CBM Norms
teacher may respond to the information by moving Allen into more basic reading
texts in which he can more readily build reading fluency.
Particularly at the lower grades, basal reading series often assign more than
one reading text per grade level. Of course, teachers may decide to administer CBM
Fig. 4.1: CBM survey-level reading assessment--Research norms
6
5
4
3
2
1
FRUST
INSTR
MASTERY
FRUST
INSTR
MASTERY
FRUST
INSTR
MASTERY
FRUST INSTR
MASTERY
FRUST INSTR
MASTERY
FRUST INSTR
MASTERY
= Allen's
Performance
0
20
40
60
80
100
120
140
CORRECTLY READ WORDS PER MINUTE
reading probes from each basal when carrying out a survey-level assessment.
However, to streamline the process somewhat, the instructor may instead give
passages from a representative basal at each grade level. For example, in the
Fig. 4.2: Selecting representative basal texts for a survey-level reading assessment
Silver Burdett & Ginn Reading Series
Basal 1: First Pre-Primer
Basal 2: Second Pre-Primer
1st-Grade Texts
Basal 3: Third Pre-Primer
Basal 4: Primer
Basal 5: 1st-Grade Reader
2nd-Grade Texts
Basal 6
Basal 7
3rd-Grade Text s
Basal 8
Basal 9
CBM Workshop Manual
Jim Wright
Page 4-4
Chapter 4: Research, Classroom, and Schoolwide CBM Norms
Silver Burdett & Ginn basal reading series, there are 9 basals that span grades 1-3.
Because teachers might find it overly time-consuming to administer CBM probes
from each basal when completing a survey-level assessment, they may choose a
single text as the standard for each grade. In the illustration above, the circled texts
are those that the instructor decided were most representative of each grade level.
Note that, when two basals were available at a grade level (e.g., 2nd grade), the
instructor chose the lower, or less advanced, basal. As a general rule, it is usually
best to choose the easier material at a given grade-level in instances when the
teacher must select between less and more difficult academic objectives for CBM
probes. By settling on the more basic objectives, the instructor can then be even
more sure that the student who fails to achieve basic fluency in CBM probes is truly
lacking in important educational skills.
Mathematics
As with reading fluency, research norms for math (computational) fluency
are presented as three levels of performance: frustration, instructional, and mastery.
Table 4.3: CBM research norms for math (computational) fluency
GRADES 1 THROUGH 3
LEVEL
FRUSTRATION
INSTRUCTIONAL
MASTERY
DIGITS CORRECT
PER MINUTE
0-9
10-19
20 or more
DIGITS INCORRECT
PER MINUTE
8 or more
3-7
2 or fewer
GRADES 4 AND UP
LEVEL
DIGITS CORRECT
PER MINUTE
DIGITS INCORRECT
PER MINUTE
FRUSTRATION
0-19
8 or more
INSTRUCTIONAL
20-39
3-7
MASTERY
40 or more
2 or fewer
Research norms from Deno, S.L., & Mirkin, P.K. (1977). Data-based
program modification: A manual. Reston, VA: Council for Exceptional
Children.
CBM Workshop Manual
Jim Wright
Page 4-5
Chapter 4: Research, Classroom, and Schoolwide CBM Norms
To make use of the mathematics research norms, the teacher gives the student
either a single- or multiple-skills worksheet containing math facts. (The math CBM
probe is administered according to the directions in Chapter 2 of this manual.) The
teacher then compares the number of correct digits and errors on the student's math
sheet with the norms in the table on the previous page to determine the child's
relative proficiency in the selected computational objective(s).
Completing a survey-level assessment in mathematics using research norms
Teachers can gain a general idea of a student's functioning in computational
objectives across grade-levels by completing a survey-level assessment in
mathematics. As the first step in such an assessment, the instructor examines the
computational goals outlined in the school district math curriculum. (Teachers can
also turn to pages 2-25 through 2-27 of this manual for a comprehensive list of
computational objectives matched to the appropriate grades.) The instructor selects
one or two representative objectives from several grade levels, prepares worksheets
based upon these objectives, and administers them to the student. The resulting
scores are then compared to the research norms to determine the child's relative
mastery of math skills across grade-levels.
To illustrate the method of giving a survey-level assessment in math, we
return again to our example of Allen. His 4th-grade teacher decides to conduct a
survey-level assessment in math skills, selecting the following computational goals
at several grade-levels:
Table 4.4: Selecting computational goals for a survey-level
mathematics assessment
Grade 2
Add a two-digit number to a two-digit number--no regrouping
Grade 3
Subtract a one-digit number from a two-digit number with
regrouping.
Grade 4
Multiply a two-digit number by a one-digit number with no
regrouping.
His teacher then creates several separate math worksheets, each containing
problems from one of the chosen computational goals. The worksheets are given to
Allen to complete under standardized CBM conditions. The results are then
Table 4.5: CBM Survey-level Mathematics Assessment for Allen H.
Grade-Level
Math Skill
2nd-grade
3rd-grade
4th-grade
CBM Workshop Manual
Correct Digits
Per Minute
52
47
34
Jim Wright
Incorrect Digits
Per Minute
3
1
2
Page 4-6
Chapter 4: Research, Classroom, and Schoolwide CBM Norms
compared to the research norms. The chart on the following page presents the
research norms as regions on a graph. Allen's performance at various grade-levels
is plotted relative to the norms for each grade. It is immediately apparent from this
survey-level assessment that Allen has little difficulty with computational skills.
Fig. 4.3: CBM survey-level mathematics assessment--Research norms
6
5
4
3
2
1
FRUST
INSTR
MASTERY
FRUST
INSTR
MASTERY
FRUST
INSTR
MASTERY
FRUST INSTR
MASTERY
FRUST INSTR
MASTERY
FRUST INSTR
MASTERY
= Allen's
Performance
0
10
20
30
40
50
60
CORRECT DIGITS PER MINUTE
He demonstrates mastery of typical 2nd- and 3rd-grade math objectives and is
working comfortably within the instructional level in 4th-grade math curriculum
material.
Written expression
The norms for written expression presented here list average numbers of
words written in 3 minutes for grades 1-6. The examiner administers a CBM writing
probe, scores it for the number of words that appear in the composition, and
compares the individual student's results to the research norms. Unlike the norms
presented for reading and math computation, these writing norms do not include
ranges of frustration or mastery. Also, although there are four separate methods
presented in chapter 2 of this manual for scoring CBM writing probes, these norms
are intended only for the simplest and quickest of those scoring approaches: total
words written.
CBM Workshop Manual
Jim Wright
Page 4-7
Chapter 4: Research, Classroom, and Schoolwide CBM Norms
Table 4.6: CBM research norms for written expression
GRADE
WORDS WRITTEN
IN 3 MINUTES
1
15
2
28
3
37
4
41
5
49
6
53
Research norms from Mirkin,P.K., Deno, S.L., Fuchs, L., Wesson, C.,
Tindal, G., Marston, D., and Kuehnle, K. (1981) Procedures to develop
and monitor progress on IEP goals. Minneapolis: University of
Minnesota, Institute for Research on Learning Disabilities.
Completing a survey-level assessment in written expression using research norms
Undertaking a survey-level assessment in writing is considerably faster than
in other academic areas. The teacher simply scores the child's single writing probe
and compares the number of words correctly spelled to the various grade levels to
find the highest grade at which the targeted student's score falls within the fluent
range. We will assume, for instance, that Allen's teacher gave him a writing probe
as a routine part of her CBM assessment. She found that he was able to write 31
correctly spelled words during the timed session. The instructor then charted his
single writing score across grade levels, noting the highest grade in which Allen's
scores still lay within a range signifying fluency in writing. She found that,
according to the research norms, Allen wrote at a rate that would be considered
fluent for a 2nd-grade student but fell below the fluency range for the 3rd and 4th
grades. While this is only preliminary information, the teacher may conclude that
CBM Workshop Manual
Jim Wright
Page 4-8
Chapter 4: Research, Classroom, and Schoolwide CBM Norms
Fig. 4.4: CBM survey-level writing assessment--Research norms
NON-FLUENCY
6
FLUENCY
NON-FLUENCY
5
FLUENCY
NON-FLUENCY
4
FLUENCY
NON-FLUENCY
3
FLUENCY
NON-FLUENCY
2
FLUENCY
NON-FLUENCY
1
0
10
20
FLUENCY
30
40
50
60
70
TOTAL WORDS WRITTEN IN 3 MINUTES
= Allen's
performance
(31 words)
Allen would benefit from greater emphasis on writing skills to increase his
proficiency in written language.
Classroom Norms
When teachers compile classroom CBM norms, they can gain direct estimates
of average abilities in basic-skill areas for those children presently under their
instruction. Classroom norms offer obvious advantages over research norms. First,
the average level of academic ability often varies considerably among classrooms at
a given grade-level, even when one compares rooms within the same school
building. Each classroom comprises a unique learning environment, having its
own range of educational resources and student skill Thus, an instructor can benefit
from knowing how proficient typical children from his or her classroom are in basic
academic competencies.
Once the teacher has an idea of the "average" student level of performance in
reading, writing, spelling, and math objectives for a particular classroom, that
instructor can then administer similar probes to children who show learning delays,
to determine how far they might lie from the classroom average. In other words,
classroom norms can help teachers both to better identify those students who may
have limited proficiency in academic areas and to better define the degree of
academic delays. Also, classroom norms can be used by the instructor to set
performance goals for individual students who are to be monitored over time using
CBM Workshop Manual
Jim Wright
Page 4-9
Chapter 4: Research, Classroom, and Schoolwide CBM Norms
CBM probes. These performance goals would be placed on a graph, representing the
teacher's expectation of how quickly the student's fluency in academic skills should
grow over a set number of instructional weeks. (For a more complete account of
CBM performance goals and their use in tracking student academic progress, see
chapter 3 of this manual.)
Creating a measurement net
As the first step in norming a classroom, the examiner must decide what
basic-skill areas to assess. CBM probes in the selected subject areas comprise the
measurement net. As the name implies, a measurement net is an array of CBM
assessment materials chosen by the instructor to "capture" important data about
average student competencies in academic areas. The teacher determines both the
number of skill-areas and the individual curriculum objectives that will be assessed.
Before putting together a measurement net for norming a classroom,
instructors should carefully review chapter 2 of this manual, which outlines the
selection of curriculum performance objectives, preparation of CBM probe materials
in various academic areas, and administration of those probes under standardized
conditions. Teachers, of course, must be fully aware of the range of curricular goals
for students at their grade level.
Once the measurement net has been assembled for a particular classroom
norming, it will ideally contain a mix of CBM probes to assess typical student
performance in (1) curriculum goals that are presumed to have been mastered and
(2) curriculum material that is presently being taught. Sometimes instructors
question whether a particular educational objective might be too "easy" to include
in the classroom norming. In most cases, it is a good idea to include a few such basic
learning goals, if only to ensure that children have mastered these fundamental
skills. For example, a 4th-grade teacher who wants to assess his classroom using
several math computation objectives might include a worksheet featuring 2-digit
addition with regrouping to check that the average child in the room has achieved
fluency in this skill.
The 2nd-grade measurement net shown below contains goals selected from
the 1st-grade curriculum, as well as objectives suitable for the 2nd grade. The
teacher decided that she wanted to include the 1st-grade probes as a check to ensure
that her classroom was fluent in lower-level academic skills.
Our sample measurement net illustrates a central point regarding the
instructor's role in gathering classroom norms: The teacher has considerable
latitude in determining the nature and extent of the norming process in his or her
own classroom. There is no "right" or "wrong" approach to classroom norming.
Any type of CBM probe that an instructor feels will give information useful in
future instructional planning or program monitoring can be included in the
classroom norming. For instance, the 2nd-grade teacher in the example chose to
evaluate student fluency in reading, math, spelling, and writing. However, she may
have decided instead to evaluate only reading and math, omitting the other areas.
She also selected a single math objective from the 1st-grade curriculum but could
CBM Workshop Manual
Jim Wright
Page 4-10
Chapter 4: Research, Classroom, and Schoolwide CBM Norms
Table 4.7: Sample measurement net for 2nd-grade classroom norming
Reading:
Three 150-word passages chosen at random from Basal 5
(A New Day) of the Silver Burdett & Ginn reading series (1st-grade
curriculum objective).
Three 150-word passages chosen at random from Basal 6
(Garden Gates) of the Silver Burdett & Ginn reading series. (2ndgrade reader)
Mathematics:
(1) single-skill math worksheet. Addition (1-digit terms) with
sums < 10 (1st-grade curriculum objective).
(1) single-skill math worksheet. Addition (2-digit terms) without
regrouping. 100 problems.
(1) single-skill math worksheet. Subtraction (2-digit terms) without
regrouping. 100 problems.
Spelling:
12 spelling words selected at random from a comprehensive list of
new vocabulary introduced in Basal 6 (early 2nd-grade reader) of
the Silver Burdett & Ginn reading series.
Writing:
Appropriate story-starter.
instead have picked 3 objectives from that curriculum if she had wished for more
extensive information about classroom performance in supposedly mastered
material. (Note: For ease of administration, it is recommended that instructors
gather the various CBM materials to be used in the norming into test booklets. )
Choosing students for classroom norming
When selecting children for the classroom CBM norms, the teacher defines
the sampling pool, that is, the larger group of students in the classroom from which
a smaller group is to be selected to participate in the norming process. Only students
who are not presently classified as learning handicapped and who receive no
special-education services are included in the sampling pool. special-education
students are excluded from classroom CBM norms because the purpose of those
CBM Workshop Manual
Jim Wright
Page 4-11
Chapter 4: Research, Classroom, and Schoolwide CBM Norms
norms is to determine the typical skill-levels of those children in the classroom who
receive no additional (special-education) support. In other words, classroom norms
are intended to give the instructor an estimate of the average academic skill-levels a
child should possess to make adequate educational progress without extra support
services. Children with diagnoses of learning disability, emotional disturbance,
speech impairment, and other special-education classifications would not be
included in the sampling pool. However, students would be placed in the sampling
pool if they have no special-education diagnosis but receive Chapter I remedial
reading or math services.
Methods of selecting students
There are three methods that teachers can use for selecting students to take
part in classroom norms:
1. Random selection from the sampling pool--The teacher first prepares a
comprehensive class list, containing student names and also information about any
children identified as having special-education diagnoses. The instructor crosses off
the names of those students receiving special-education services. Next, the teacher
chooses students at random from those remaining on the class list until a sufficient
number have been selected for the norming. In classrooms with 20 to 40 children, a
sample size ranging between 5 and 10 students will be sufficient to allow for a useful
estimate of academic skills. A strength of the random-sampling approach is not
only that it will yield a median classroom estimate of proficiency in designated
academic areas, but also that the sampling procedure will give the teacher a sense of
the range of skills among children in the room. For more specific guidance in
selecting a random sample, the reader is referred to Appendix A of this manual.
2. Use of a middle reading group--As a quick sampling method, the instructor can
simply use the students from the middle reading group from the classroom as the
CBM norming sample. A strength of this sampling approach is that the students
selected can already be assumed to have reading skills falling within the average
range for the class. A drawback, though, is that the children assessed will not display
an overall range of academic fluency representative of the entire class. As with
other selection procedures, students who receive special-education services of any
kind are excluded from the norming group. Also, the sample size should be
between 5 and 10 children for a classroom of 20-40 students. If the middle reading
group is large (e.g., 9 students) and the teacher wishes to choose a smaller number of
children from that group for the CBM norming, those students should be selected at
random from the larger reading group.
3. Mixed administration: Splitting the assessment between the entire class and a
randomly selected subgroup--Some instructors adopt a mixed strategy when
completing classroom CBM norms. The entire class is given CBM writing,
mathematics, and spelling probes, which are well suited to group administration.
A subset of that class (approximately 5-10 students) is randomly selected and
individually administered CBM reading probes. This mixed approach to sampling a
CBM Workshop Manual
Jim Wright
Page 4-12
Chapter 4: Research, Classroom, and Schoolwide CBM Norms
classroom has at least 2 points to recommend it. Because assessment in math,
spelling, and writing takes only a short period of time to give to a whole classroom,
the teacher can quickly measure the relative skill levels of all students in the room.
Also, sampling the entire class in certain subject areas allows the instructor to have
confidence that the data collected during those sections of the CBM norming are a
very accurate estimate of the classroom's true range of abilities. A disadvantage of
the mixed administration method is that the larger number of probes resulting from
using the entire class as the norming group will require increased instructor time to
score.
When using this method of classroom norming, the instructor can include
children with special-education diagnoses in the group administration for
convenience, although scores from those students would not ordinarily be included
in the scoring and norming process. The smaller group of children chosen for the
reading assessment would be picked at random from the measurement pool of
typical students in the room.
Interpreting CBM classroom data: Computing median and range of performance
To interpret the scores from a classroom norming, teachers need to determine
both the median student performance and the range of scores that are obtained. The
median score, of course, represents the best estimate of the average level of
classroom fluency in the targeted educational skill. The range between the lowest
and highest scores, on the other hand, gives the instructor some idea of how great
the variations of skill-levels are among typical children in the classroom. Although
several student sampling methods can be used for classroom norming, the CBM
data resulting from any of these methods are treated in the same manner. After
scoring the probes in each subject area, the teachers places the scores in rank order.
If there are an odd number of scores (e.g., 7), the teacher selects the middle score as
representing the median performance. If there are an even number of scores (e.g.,
8), the instructor locates the 2 middle scores, adds them together and divides by 2 to
arrive at the median value.
In the example below, the results of a CBM norming in reading are presented
for children selected at random from a 2nd-grade classroom. The teacher chose to
sample a smaller sub-group of the class for the individual reading assessments:
Fig. 4.5: Choosing the median value from odd number of scores
45
52
70
89
104
Classroom Median = 70 Correctly Read Words
Because an odd number of children were sampled, the middle score of 70 correctly
read words per minute is circled as the median value. This number represents the
most accurate estimate of the average fluency rate in reading for the classroom. The
scores range from 45 to 104 words per minute, suggesting the degree of variation in
reading fluency that exists among typical students in the room.
CBM Workshop Manual
Jim Wright
Page 4-13
Chapter 4: Research, Classroom, and Schoolwide CBM Norms
In the same classroom, the teacher administered writing probes to the entire
group of 18 typical children:
Fig. 4.6: Choosing the median value from even number of scores
4 9 12 13 14 14 14 15 15 17 17 17 18 19 21 21 22 22
Since an even number of students completed the writing exercise, the instructor
first arranged the scores in rank order, then circled the two middle scores of 15 and
17 correctly spelled words. Next, she added the circled scores and divided by 2 to
arrive at the median figure of 16 correctly spelled words in 3 minutes as an indicator
of average writing fluency for that particular classroom. Again, the spread of scores
(which vary from 4 to 22 words) allows the teacher to gain a general idea of the
range of student writing abilities among typical children in the class.
Using CBM classroom norms for problem identification and instructional planning
Teachers can apply the information derived from CBM classroom norms in a
variety of ways. Many instructors use these norms to aid in identifying individual
learning problems. For example, if a particular student is having difficulty with a
targeted academic skill, the instructor may give the child a series of CBM probes and
compare that student's performance to classroom averages. To more clearly see a
comparison between the skill-levels of an individual child and the classroom
average, a teacher can prepare a chart that depicts both the CBM median and range
of performance of the classroom in a single academic skill. The targeted student's
performance is then plotted on the same chart. For example, the 2nd-grade
instructor who completed CBM norms for her classroom created a chart showing
the results of the reading assessment. She marked the median score with a heavy
line and represented the range of performance as a shaded region of the graph.
Because the teacher was concerned about the apparently delayed reading skills of
Fig. 4.7: 2nd-grade classroom CBM norms in reading -- October 1991
Correctly read words per minute
Range and median chart
Performance
of targeted student
Range of classroom
performance
Median score
X
20
30
40
50
60
70
80
90
100
110
120
Correctly Read Words Per Minute
one of her students, she then gave that child a CBM probe in reading. By placing his
median score on the same chart with the classroom scores, the instructor was able to
see clearly how far the child fell below the average reading level for the room. Since
CBM Workshop Manual
Jim Wright
Page 4-14
Chapter 4: Research, Classroom, and Schoolwide CBM Norms
the child's reading rate was found to lie below that of even the lowest-performing
typical student sampled, his teacher realized that he would probably require extra
intervention to boost his proficiency in reading. Similar charts could be prepared
for any academic areas in which classroom CBM norms have been collected.
Additional considerations
During classroom CBM norms, the instructor should be sure that the room is
reasonably quiet and free of distractions. If the whole class is participating in any of
the CBM probes, it is also a good idea to have another adult in the room to help
with distributing and collecting materials and so forth.
Classroom CBM norms can be gathered whenever the instructor feels the
need for the information. However, a more regular sampling plan offers the
advantage of documenting increasing classroom proficiency in basic skill-areas as
the school year progresses. Possible sampling plans might call for classroom
normings in September, January, and May, or in October, February, and June.
Combining research and classroom norms
Research and classroom norms have features that complement each other.
While classroom norms allow the instructor to see just how delayed a student may
be in comparison to the class average for a selected academic area, research norms
are also useful because they let the teacher determine a student's placement relative
to other grade levels. An example using reading scores will illustrate how both
types of norms can be effectively combined in a single assessment.
Marsha and Karen teach in a classroom that is structured according to an
unusual inclusionary model. Children from two regular-education grades (11 from
the 5th-grade and 12 from the 6th grade) are combined with 14 children with
handicapping conditions who would traditionally have been placed in selfcontained classrooms. Their adoption of this model grew out of the conviction of
the teachers that special-education students learn best (1) when given appropriate
learning support and (2) when allowed to mix with typical students in both
academic and social contexts. However, it was something of a challenge for Karen
and Marsha to provide optimal educational programming for all the children,
because the educational skills in the classroom ranged from readiness (early 1stgrade) to 8th grade.
To help them more accurately determine what the spread of skills was in
their room, the instructors decided to gather classroom CBM norms. They chose to
collect norms separately for the 5th- and 6th-grade groups and also to complete
individual assessments for each of the children with handicapping conditions. The
measurement net that they put together included passages from grade-appropriate
reading books, spelling and writing probes, and several math probes.
When it was time to assess average reading skills among the 5th-grade
students, the teachers first compiled a list of those children who received no specialeducation services. From the list of 11 students, they selected 5 and administered
them passages from the 5th-grade reading book. After ranking the reading scores of
each student in ascending order, they found that the median reading rate for the 5th
CBM Workshop Manual
Jim Wright
Page 4-15
Chapter 4: Research, Classroom, and Schoolwide CBM Norms
Fig. 4.8: 5th-grade Classroom CBM norms in reading -- April 1992
Correctly read words per minute
Range and median chart
Median Score (119 wpm)
Samuel's reading rate
(49 wpm)
X
60
60
50
60
70
80
90
100
110
120
130
140
150
160
Correctly Read Words Per Minute
grade group in their classroom was 119 correctly read words per minute with an
average of 1 error. They also completed a survey-level reading assessment of
Samuel, a student with an identified learning handicap. In 5th-grade reading
material, Samuel was able to read 49 correct words per minute with an average of 5
errors per passage. Because he was found to read at less than half the rate of
classmates, it was apparent that Samuel had difficulties in reading in comparison to
other children in his class.
His teachers next compared Samuel's reading rates in material from earlier
grades to research norms. According to these norms, he was able to read with
Fig. 4.9: Example of using research norms to extend information in
conjunction with classroom norms
6
5
4
3
2
1
FRUST
INSTR
MASTERY
FRUST
INSTR
MASTERY
FRUST
INSTR
MASTERY
FRUST INSTR
MASTERY
FRUST INSTR
MASTERY
FRUST INSTR
MASTERY
0
20
40
60
80
100
120
140
CORRECTLY READ WORDS PER MINUTE
= Samuel's
performance
mastery from 2nd- and 3rd-grade material and to read within the instructional range
on 4th-grade passages. On text taken from the 5th-grade reader, Samuel performed
at the borderline between instructional and frustration levels. Using the norms as a
guide, his instructors could assume that Samuel's present decoding skills indicated
CBM Workshop Manual
Jim Wright
Page 4-16
Chapter 4: Research, Classroom, and Schoolwide CBM Norms
that a 4th-grade reader would be his most suitable placement in the basal series.
This example also emphasizes the contrast in estimates of fluency between research
and classroom norms. For example, while research norms suggest that a reading
rate of 49 correctly read words per minute represents the threshold of basic fluency
for most children, Samuel's classmates were able to read an average of 119 words per
minute, more than double that rate. It is probable that, in some classrooms, even
children who have achieved basic fluency will seem to have impaired skills--if only
because they work at so much slower a rate than classmates.
Schoolwide Norms
Although classroom CBM norms give good information about the average
level of academic skills in a selected room, teachers and other school professionals
may also want to know the typical levels of educational proficiency across an entire
grade in a school building. These school-wide norms are valuable because they can
serve as a common point of comparison for children in the same grade who come
from different classrooms. If all teachers at a certain grade level are interested in
group CBM norms, they will also find that gathering those norms school-wide
represents a more efficient use of time than compiling equivalent norms in a
number of separate classrooms.
The steps involved in preparing for, gathering, and displaying the results of
school-wide CBM norms are presented only briefly here. For a fuller treatment of
these steps, the reader is referred to Dr. Mark Shinn's (1989) book, Curriculumbased measurement: Assessing special children (New York: Guilford Press). The
book is an excellent introduction to the use of CBM normative data to screen
children for possible learning problems, but Chapter 4 is especially useful as a
blueprint for setting up a plan for assessing entire grade-levels using CBM
procedures. Teachers preparing to gather school-wide CBM norms are also
encouraged to consult first with a school psychologist or other support person in
their building who has training in the administering and scoring of educational
tests. Among other types of assistance, these auxiliary personnel can monitor the
school-wide norming to ensure that a random sampling plan is followed when
choosing students and that standardized procedures are observed during
administration of CBM probes. They can also work with teachers to interpret the
resulting information.
Creating a measurement net
As with classroom CBM norms, the collecting of school-wide norms requires
initially that teachers put together a measurement net for each grade to be assessed.
Instructors have considerable latitude regarding the actual skills that they choose to
measure, but by following some basic guidelines, they will be assured of the greatest
amount of useful information. First, teachers should consult district curricula,
scope-and-sequence charts, and appropriate student texts when generating a list of
curriculum goals to be included in the measurement net. It is also a good idea to
put together a mix of probes for the targeted grade level that assesses supposedly
CBM Workshop Manual
Jim Wright
Page 4-17
Chapter 4: Research, Classroom, and Schoolwide CBM Norms
mastered academic skills, as well as current curriculum objectives. Including both
easier and more difficult assessment materials in the measurement net will allow
teachers to gain knowledge of student performance in a wide range of skills, a
guarantee that they do not overlook any possible gaps in children's mastery of skills.
For example, a team of instructors collecting school-wide norms for the 2nd grade in
a building may select a simple-addition mathematics worksheet as part of their
measurement net. Although simple sums are in fact a 1st-grade curriculum goal, it
may be revealed during the scoring of the worksheets that the 2nd-grade students
are not very fluent on this basic computational objective. As a result, the teachers
could then choose to spend some of their instructional time reviewing addition
skills with their classes.
Choosing students for the school-wide norming
Teachers should obtain a list of all the students in the grade. Only those
students who presently have no diagnosis of an educational handicapping condition
are included in the school-wide norming, so children with special-education
classifications are crossed off the grade list. Then students are chosen at random
from the list, with care taken that each child has an equal chance of being selected.
As a rule, between 15 and 20 percent of the students at each grade-level should be
included in the norming, and a minimum of 20 students should be selected.
Conditions for testing
The site chosen for completing the school-wide norms should allow
comfortable seating for at least 20 children. As with any setting used for academic
assessment, the lighting should be adequate , the area should be reasonably quiet,
with limited distractions. At least 2 adults should be present when group probes are
administered, one to read instructions and time the probes and the other to
distribute materials, monitor student behaviors, and provide other help as needed.
For ease of administration, booklets should be prepared in advance, made up of
probes to be administered to the group.
Because reading probes are given individually, it is helpful to have additional
adults assist in administering these probes. Reading assessments can be given to
children at the time that the norm group is assembled, or examiners can arrange at a
later time to take students individually from their classrooms for a brief period
(about 5 minutes per student) to complete reading probes. The period for collecting
school-wide norms at any grade level should not exceed a week (including the
collecting of individual reading data). If the data-gathering exceeds this time-limit,
it is possible that students assessed near the end of the period will have had an
opportunity in the mean time to acquire increased fluency in skills, potentially
distortingthe results of the school-wide norming.
Frequency of school-wide norms
Once school-wide CBM norms have been collected, they remain relatively
current indicators of school skills for about 3-4 months. After that point, the
majority of students have increased their fluency in academic areas to so great a
degree that it is necessary to gather new norms. Ideally, school-wide norms in CBM
CBM Workshop Manual
Jim Wright
Page 4-18
Chapter 4: Research, Classroom, and Schoolwide CBM Norms
should be updated three times per school year. Some schools have adopted a
schedule for norming in September , January, and May of each year, while other
buildings or districts complete normings in October, February, and June.
Interpreting CBM school-wide norms
After all CBM probes have been given and scored, the scores for probes in
each subject area are placed in rank order and the median value is selected as the
best estimate of the grade average in that curriculum objective. Median values are
the most important information that school-wide norms yield, but instructors may
also be interested in noting the range of scores for each probe.
Because school-wide norms result in so many scores, manual recording and
analysis of those scores can be time-consuming. Instead teachers may want to make
use of one of the basic statistics packages that are now available. These software
programs can simplify the process of ordering and storing the data from school-wide
norms; they can also greatly enhance the interpretation of CBM scores. For example,
instructors may want to know the range of scores that are typical of the central twothirds of the students in a grade-level (the so-called "average range"). Using a
statistics program, it is a simple matter to compute standard deviations for the scores
obtained from each CBM probe. The range defined by one standard deviation above
to one standard deviation below the mean score of a CBM probe represents the span
of scores to be expected from two out of three children in the grade. Keeping this
range in mind, the instructor can better compare a targeted child's performance to
the typical performance of other children at his or her grade-level. Statistical
programs can also compute box-plots (visual displays of interquartile, or median,
values) and other treatments of data that are easily interpreted and very useful for
purposes of group comparison.
Gathering school-wide norms: An example
Recently, a school psychologist working at a large urban elementary school in
central New York decided to gather school-wide norms using CBM. He had been
using CBM extensively in his own educational assessments and wanted to have a
set of CBM norms for each grade. With such norms, the building's Pupil Service
Team would be able to compare the performance of any student at risk of academic
failure to the appropriate skill-level for that student's grade. To begin with, the
school psychologist needed to establish a measurement net of CBM probes that
would be used to assess children in each grade in reading, mathematics, spelling,
and written expression. The psychologist reviewed curricula used by the district for
each of the academic areas. He also interviewed teachers and his school's
instructional specialist for further guidance in assembling a suitable measurement
net.
To assess reading fluency, the school psychologist used passages chosen at
random from the district basal series. In mathematics, several computational probes
were selected for each grade, with at least one of those probes made up of problems
that were presumed to have been mastered according to the guidelines of the math
curriculum. Spelling probes were made up of wordlists chosen at random from a
commercial spelling program (Scott Foresman). Written-expression probes were
CBM Workshop Manual
Jim Wright
Page 4-19
Chapter 4: Research, Classroom, and Schoolwide CBM Norms
prepared using grade-appropriate story starters.
Once the assessment materials had been put togther, the psychologist
randomly selected students from grades 1-6 to participate in the school norming
procedure. He obtained a computer listing of all children attending the school,
grouped alphabetically according to grade. First, the names of students receiving
special-education services were removed from the list, since the norms were
intended to represent average academic skills of children who do not require
additional educational support. Then for each grade, the psychologist chose names
at random from the list using a random-number table (see Appendix A of this
manual for a description of the random-selection procedure). Because he wanted at
least 20 children per grade as a representative norming sample, the psychologist
selected 25 students from each grade-list, with the 5 additional students included to
take into account children from the sample group who might be absent or otherwise
unable to participate on the day of the norming. In all, about 120 children were to be
assessed in these school norms.
The school cafeteria was set aside as the CBM testing site, since this was the
only free area of the building that had sufficient room for 20 children to be tested at
one time. Several staff members and a parent volunteer with training in the
administration of CBM probes assisted in the collecting of the data. Two successive
mornings were reserved for completing the building CBM norms. Students chosen
from each grade were brought together to the cafeteria, and CBM mathematics,
writing, and spelling measures were administered to the group by the datacollection team. Then adult examiners met with children individually to complete
the CBM reading probes. Each grade required about 45 minutes to complete all the
CBM materials.
Once probes had been given to all grades and scored, the psychologist entered
the scores into a statistical software package. The use of the software made the task
of recording, organizing, and interpreting the data from across grade-levels much
easier than trying to complete the same process by hand. (After all, with a
minimum of 4 CBM probes given to each child and a total of 120 children
participating in the school norming, one could expect at least 480 individual scores
that needed to be organized and interpreted!)
The school psychologist decided to summarize each grade-level's norm
results by visually representing the median and range of the data. Figure 4.10
displays CBM reading norms for grades 1-6. The median rate of reading fluency at
each grade-level is indicated by a heavy vertical line, while the total range of fluency
for the grade-sample is shown as a gray bar. The illustration shows clearly that
reading fluency increases with each grade level and also that gains in fluency are
most dramatic in the earlier grades. The school psychologist and other members of
the building's staff found the CBM school norms to be useful in a number of ways.
With the norms in place, students found to have difficulty with reading fluency
could be given a survey-level assessment. Their reading rate in basals from various
grade-levels could be compared to the school norms to determine the mastery,
instructional, and frustration levels of the students at risk when compared to the
CBM Workshop Manual
Jim Wright
Page 4-20
Chapter 4: Research, Classroom, and Schoolwide CBM Norms
Fig. 4.10: CBM reading fluency norms
for an elementary school (Grades 1-6) October 1991
1ST GRADE (WORD LIST)
2ND GRADE
3RD GRADE
4TH GRADE
5TH GRADE
6TH GRADE
0
50
100
150
200
250
Correctly Read Words Per Minute
median reading performance of peers. The charted school norms also underscored
the fact that, although every grade contains readers with a wide range of ability, the
majority of those students are considered to be "normal" readers. In other words,
the school norms served as a reminder to the school staff that varying academic
skill-levels among children is a normal occurrence that should be expected in any
classroom and appropriately programmed for.
Summary
There are several kinds of normative information about CBM skills that
instructors can collect and refer to when attempting to understand "average"
academic-skill levels at various grades. Research norms are estimates of typical rates
of student fluency in CBM reading, writing, and math computation tasks that have
been published in education journals. Research norms have the advantage of
requiring no additional work in gathering information about local (classroom or
grade) norms. A disadvantage is that they offer only a general approximation of
basic fluency in various academic skills and do not give an accurate picture of the
typical abilities of children in a particular educational setting.
Classroom norms are collected from regular-education students in a single
classroom. Teachers must select one of several sampling plans when selecting
children for classroom norms: (1) random small-group; (2) middle reading group; or
(3) combination of large- and small-group. A measurement net is assembled,
consisting of the important curriculum objectives to be assessed. Resulting scores
are placed in rank order to determine both the median score and range of scores
representing the typical spread of abilities in a classroom. Although classroom
norms give an accurate indication of the average skills in a single room, the norms
cannot be applied to other rooms with different children.
CBM Workshop Manual
Jim Wright
Page 4-21
Chapter 4: Research, Classroom, and Schoolwide CBM Norms
School-wide norms are the most comprehensive of CBM normative data,
representing estimates of fluency in academic skills for entire grade-levels. Like
norms gathered in the classroom, school-wide norms require the establishment of a
measurement net and a random sampling procedure for choosing typical students
for assessment. Median scores and ranges of scores are determined for each CBM
probe. Statistical programs are available that can both simplify the data collection
process and increase the ability of the instructor to interpret the resulting
distribution of scores.
CBM Workshop Manual
Jim Wright
Page 4-22
Chapter 5: Advanced Applications of CBM
5
Advanced Applications of CBM
Introduction
Once educators who have been trained in curriculum-based measurement
begin to use it routinely in their classrooms, they quickly discover additional useful
applications of CBM. This chapter will discuss two important aspects of CBM that
have the potential to be of immediate help to teachers. First, we will examine the
use of CBM data and monitoring procedures to write clear, outcome-based IEP goals.
Also included is a review of several commercial software programs which can allow
instructors to create monitoring materials more easily and to automate the charting
and interpreting of CBM information. Finally, several recent case studies are
presented in which teachers used CBM to make important decisions about students'
educational programming.
Creating IEP Goals Using CBM
Special-education teachers are faced with additional responsibilities for
predicting and documenting student academic growth than are instructors in
regular-education classrooms. Federal and state regulations state that those children
identified as having educational handicaps are entitled to an individual education
program (IEP) tailored to meet their specific learning needs. Teachers of children
with special needs formulate yearly IEP goals for these students. IEP goals specify
particular educational skills to be taught, and also include criteria for judging
mastery of the objectives. But teachers and administrators in special education
have voiced frustrations with present approaches to the writing of IEP goals. While
many teachers write consistent and clear goals, a review of IEP's shows that goals too
often fluctuate between extremes: they are either so vaguely worded as to provide
little guidance in day-to-day programming or are overly ambitious, attempting to
catalogue individual learning objectives in overwhelming detail.
Several features of CBM make it well-suited as a starting-point for creating
salient IEP goals. CBM is tied to specific, explicitly stated academic behaviors (e.g.,
number of words read correctly per minute) that can be measured with accuracy.
Rules of administration are standardized, allowing results of similar probes given
over several months to be compared directly. Because CBM emphasizes the setting
of fluency goals as a routine part of the monitoring process, special-education
teachers can conveniently incorporate these estimates of learning progress into IEP
goals.
Deciding between short- and long-term IEP objectives
As instructors contemplate the use of CBM as a starting point in preparing IEP
goals, they must first decide whether they will monitor short- or long-term learning
CBM Workshop Manual
Jim Wright
Page 5-1
Chapter 5: Advanced Applications of CBM
objectives. Short-term objectives consist of discrete academic sub-skills that one
might expect a student to master within a relatively short period. Short-term CBM
goals in reading, for example, may include the successive mastery of the Dolch PrePrimer and Primer wordlists, while short-term math goals may focus on mastery of
addition problems with sums < 10 and subtraction problems with 2 single-digit
terms. One advantage of short-term learning objectives is that they match the dayto-day curriculum more closely than more generalized objectives. Also, teachers of
children with severe learning handicaps may find short-term goals to be quite
sensitive to small but significant gains in their students' skills. Teachers
monitoring with short-term CBM goals are required, however, to prepare a fresh
range of materials whenever their student moves into a new short-term objective.
Also, data collected for different short-term CBM objectives cannot be charted on the
same graph and compared directly. As a result, a teacher may be able to see shortterm gains demonstrated in targeted skills but would not obtain a unified chart that
documents rate of academic growth across the school year.
Long-term CBM IEP goals are tied to more general learning objectives. A
long-term CBM goal in reading fluency, for instance, might be put into place that
requires the student to be monitored using reading passages selected from a basal
reader more advanced than the child's present reading level. Similarly, a long-term
math goal may seek to boost a student's computational fluency on a mix of gradeappropriate number problems. Progress toward that long-term math goal could be
measured on a weekly basis by giving the student mixed-skill computational probes.
A strength of long-term CBM IEP objectives is that they allow the instructor
to chart data and plot a visual record of increase in academic fluency over a long
period--even through the entire school year, if necessary. Teachers may also find it
less time-consuming to prepare materials for long-term CBM goals, because once
they invest the initial time to prepare a single collection of probes, instructors can
continue to draw from that collection for monitoring materials. In addition, longterm CBM objectives accurately reflect general academic growth (e.g., increase in
reading fluency), independent of specific sub-skills being taught in the classroom.
A drawback of long-term CBM goals, however, is that they may result in a
"floor effect" for students with very delayed skills. A floor effect simply means that
the materials being used to monitor student growth are so difficult for an individual
child that he or she is not able to show meaningful academic growth when
measured. Imagine, for example, that a student has mastered ten sight-words when
first assessed but has not yet developed the ability to phonetically decode words.
That child may experience a floor effect if given probes to read taken from a 2nd-grade reader. Stated another way, although she may be making real progress in
acquiring sight-words and skills in phonics, the extent of the student's reading
progress would most likely be masked by the difficulty of the relatively advanced
reading passages in which the student is being measured.
The decision to use short- or long-term CBM objectives when preparing IEP
objectives remains with the instructor. Either approach (or even a combination of
the two) may be best suited for a particular child. As a rule of thumb, though, longterm CBM objectives appear to be most often used with children in regulareducation settings, while both short- and long-term goals are found to be
CBM Workshop Manual
Jim Wright
Page 5-2
Chapter 5: Advanced Applications of CBM
appropriate in special-education classrooms.
A formula for writing CBM IEP goals:
The actual writing of CBM IEP goals is rather simple, particularly for the
instructor who has already gone through the systematic process of gathering CBM
information on a targeted student in the manner outlined in the first four chapters
of this manual. When writing an IEP goal for CBM, the special-education teacher
merely condenses into a single sentence the essential points of the CBM monitoring
program. There are three elements that are included in the IEP goal: (1) the
standardized conditions under which the CBM probe is to be given; (2) the behavior
that is to be measured; and (3) the performance criterion that the instructor has set
to indicate mastery of the measured academic skill.
1. Conditions. The introductory phrase of the CBM goal sums up the essential,
standardized conditions according to which the academic skill will be measured.
This phrase will include the amount of time allotted for the student to achieve the
fluency goal (most often presented as number of weeks until annual review).
There will also be mention of the specific materials from the student's curriculum
used to measure academic progress, as well as a summary description of other
essential features of the CBM administration.
Several CBM IEP goals written by local teachers appear below. The section of each
goal outlining conditions has been set off in bold-face type:
In 30 instructional weeks, when given a randomly selected
passage from level 10 (Silver Secrets) of the Silver Burdett
& Ginn reading series, the student will read aloud at 90
correct words per minute with no more than 5 errors.
In 30 instructional weeks, when given a worksheet of 40
randomly selected problems (addition of a 2-digit number
to a 2-digit number with no regrouping), the student will
write a total of 25 correct digits with 90 percent overall
accuracy on problems attempted.
In 30 instructional weeks, when given a story starter and 3
minutes in which to write, the student will write a total of
40 correctly spelled words.
2. Behavior. The behavior presented in the CBM IEP goal is that through which the
instructor measures academic fluency in a selected academic area. On probes
intended to measure reading fluency, for example, the relevant behavior is reading
aloud, while on written expression probes, the behavior of interest is writing.
In the CBM IEP goals below, the section of each goal outlining behaviors has been
set off in bold-face type:
CBM Workshop Manual
Jim Wright
Page 5-3
Chapter 5: Advanced Applications of CBM
In 30 instructional weeks, when given a randomly selected
passage from level 10 (Silver Secrets) of the Silver Burdett
& Ginn reading series, the student will read aloud at 90
correct words per minute with no more than 5 errors.
In 30 instructional weeks, when given a worksheet of 40
randomly selected problems (addition of a 2-digit number
to a 2-digit number with no regrouping), the student will
write a total of 25 correct digits with 90 percent overall
accuracy on problems attempted.
In 30 instructional weeks, when given a story starter and 3
minutes in which to write, the student will write a total of
40 correctly spelled words.
3. Performance Criterion. The criterion is that part of the goal which represents the
standards that the instructor will use in judging the student's attainment of a
fluency-goal in a selected academic area. The criterion is expressed as a minimum
number of correctly completed academic behaviors (e.g., "40 correctly read words",
"30 correct digits"). The instructor may also decide to specify the maximum
allowable number of errors as a criterion for mastery (e.g., "with no more than 3
errors"). Or, rather than focusing on errors, the teacher may instead choose to
include an accuracy criterion, presented as a percentage of correct answers (e.g.,
"with 90 percent accuracy").
The section of each goal outlining one or more performance criteria has been set off
in bold-face type in the CBM IEP goals below:
In 30 instructional weeks, when given a randomly selected
passage from level 10 (Silver Secrets) of the Silver Burdett
& Ginn reading series, the student will read aloud at 90
correct words per minute with no more than 5 errors.
In 30 instructional weeks, when given a worksheet of 40
randomly selected problems (addition of a 2-digit number
to a 2-digit number with no regrouping), the student will
write a total of 25 correct digits with 90 percent overall
accuracy on problems attempted.
In 30 instructional weeks, when given a story starter and 3
minutes in which to write, the student will write a total of
40 correctly spelled words.
The procedures set forth in this section for writing CBM IEP goals are intended for
CBM Workshop Manual
Jim Wright
Page 5-4
Chapter 5: Advanced Applications of CBM
use by teachers of children with special needs. However, instructors in regulareducation classrooms may want to follow similar guidelines when summarizing
monitoring guidelines for specific students. Educators from a variety of educational
settings find that they can better visualize their expectations for student progress by
framing those expectations in terms of a single "goal-oriented" sentence--one that
outlines conditions, behaviors, and criteria for mastery for projected academic
outcomes.
CBM-Related Software
Increasingly, teachers have access to computers to assist them in instructional
planning, teaching, and program monitoring. As educational software becomes
more accessible, instructors find opportunities to match children with appropriately
selected computer programs in basic skills and content areas to allow those students
time for individual drill and practice. Computers excel at organizing data and
transforming it into visual displays such as graphs and charts. Software is also
available that quickly creates basic skill worksheets (e.g., math worksheets). Because
of its utility, the computer has great potential for reducing the time and work
required to implement a successful CBM monitoring program in a classroom or
school building. This section will review examples of commercial software that can
be of substantial benefit to instructors exploring the uses of CBM. However, the few
programs discussed here by no means comprise a comprehensive list of software
with CBM applications; readers are encouraged to look through educational catalogs
for information about additional useful programs.
Charting data and generating trendlines
Many computer programs are now available that have the ability to chart
CBM information, while a number of such programs also have the capacity to plot
trendlines and carry out more sophisticated interpretation of the data. One program
expressly designed for CBM users is Sheri, created by Performance Monitoring
Systems. The program, which runs on the Apple II computer family, gives the
teacher the option of setting a goal and aimline for an individual student. Once the
data have been keyed into the program, Sheri will plot a graph displaying the data
and will also plot a trendline (similar to those reviewed in Chapter 3) to summarize
the upward or downward "trend" of the data. An updated graph can be printed after
each new data-point is entered. The program will even allow the user to plot two
separate values on one chart (a useful feature for the teacher who wants to see
correctly read words and errors per minute displayed on the same graph).
Among additional features, Sheri has an internal calendar, so that data from
CBM probes can be paired with the dates on which they were collected. When a
progress-monitoring graph is printed, it has a running calendar along the horizontal
(X) axis, allowing the user to quickly determine the duration of the monitored
intervention and the approximate dates that individual data-points were collected.
Because the program has word-processing capabilities, instructors can enter
descriptions of initial instructional interventions and of program changes. Along
CBM Workshop Manual
Jim Wright
Page 5-5
Chapter 5: Advanced Applications of CBM
with graphs, Sheri is also capable of printing compact "reports" that present all
recorded instructional interventions and summarize the data of CBM probes in a
neat table for easy reference. For the teacher who wishes to use CBM to monitor a
relatively large group of students, the Sheri program can be very useful as a tool for
organizing and interpreting data.
Those interested in obtaining more information about Sheri can write to:
Performance Monitoring Systems
133 SE 2nd Avenue
PO Box 148, Cambridge, MN 55008.
The phone number for the company is:
(612) 689-2688.
Another solution for automating much of the charting and analysis of data
can be found in spreadsheet software. These programs are widely available and
often have the capacity to generate line-graphs and even trendlines. There are also
an increasing number of easy-to-use statistical packages that can plot both linegraphs and trendlines. It is worth exploring whether any suitable software is
available within your school district or building to assist you in managing your
CBM information.
Automated testing and scoring
A software package has recently become available that goes a considerable
way toward automating the entire CBM process. Monitoring Basic Skills Progress,
or MBSP, is a collection of three programs that use the Apple II computer to
monitor student performance in reading, mathematics, and spelling. In the reading
program, the student sits down at the computer and inserts both a student disk and
a "Stories" disk. The program automatically administers a timed cloze passage from
the "Stories" disk matched to the student's reading ability. The cloze passage uses a
multiple-choice format, with passages randomly selected by the computer from a
measurement pool of items included as part of the software.
At the end of each timed administration, the computer scores the student's
performance. A teacher can review student data at any time throughout the school
year, calling up a chart which displays the student's cumulative plotted data.
Instructors may set a goal and aimline for each child. The software also generates a
trendline summarizing student progress when sufficient data-points have been
charted. Another feature of MBSP is that it applies decision rules to the collected
data, giving teachers prompts in the form of messages on the screen. The program
may advise them, for example, to raise the goal line for a successful reader or to
change the instructional intervention for a child who is performing below
expectations. The math and spelling software differ somewhat from the reading in
administration procedures, but all MBSP programs have the same charting and data
interpretation features.
With the MBSP math program, a routine assessment begins with the student
completing a paper-and-pencil worksheet while being timed by the computer.
Worksheets contain a mix of computation problems suitable for the student's grade
or instructional level. When the child's testing time expires, the student keys all
answers into the computer, which then scores the worksheet and automatically
CBM Workshop Manual
Jim Wright
Page 5-6
Chapter 5: Advanced Applications of CBM
charts the resulting CBM data. Worksheets covering all elementary grades are
included in a book that comes with the program.
The MBSP spelling software requires that a "reader" (e.g., instructor,
classroom assistant, peer tutor) read off spelling words to a targeted child while that
student types the words into the computer. The computer times the operation,
giving the student a limited number of seconds to type each word. When the timed
test is finished, the computer scores the probe for correct letter-sequences and charts
the results. Lists containing spelling words for various grade-levels accompany the
program.
Teachers who would like more information about the MBSP programs can
write to:
Pro-Ed
8700 Shoal Creek Boulevard
Austin TX 78758-9965
The phone number for Pro-Ed is:
(512) 451-3246.
Creating CBM probe materials in math, reading, and spelling
Since making up probes is typically the most time-consuming part of CBM,
teachers can benefit from programs that generate materials for academic progressmonitoring. Several examples of software are presented here for use in making up
math, reading (word list), and spelling probes.
An excellent program for creating mathematics worksheets on the Apple II
computer family is the Mastering Math Worksheet Generator, or MMWG. It allows
the teacher to select computational objectives in addition, subtraction,
multiplication, and division. Once objectives have been chosen, the instructor can
request single-skill or multiple-skill worksheets corresponding to those objectives.
MMWG will create any desired number of unique worksheets based on a teacher's
specifications and will also print answer keys. A sister program to MMWG, which
creates worksheets for more advanced computation (e.g., addition of fractions), is
called Conquering Math Worksheet Generator. Both programs were designed by
the Minnesota Educational Computing Corporation (MECC), an organization that
produces educational software for schools. A large number of school districts across
the nation have licensing agreements that permit them to copy MECC software on
site. If your school district participates in the Direct License program, you can obtain
the software through them. If you wish instead to order products directly from
MECC, you can write to:
MECC
3490 Lexington Avenue North
St. Paul, MN 55126
The MECC information phone number is:
(612) 481-3500
Twin programs produced by Performance Monitoring Systems give
instructors the ability to produce math, reading (word list), and spelling probes with
CBM Workshop Manual
Jim Wright
Page 5-7
Chapter 5: Advanced Applications of CBM
an Apple II computer. The Continuous Assessment Program--Mathematics is
similar to the MECC software described above. It will create single-skill worksheets
in all basic computation areas and also offers considerable flexibility in choosing
particular types of problems. The Continuous Assessment Program--Reading &
Spelling requires that the instructor type master-lists of reading vocabulary or
spelling words into the computer. Using the items from each master-list as a
measurement pool, the software will then generate random lists that can be used as
CBM spelling probes or as word lists for the measurement of reading fluency. The
CAP programs can be obtained at the Performance Monitoring Systems address
given above.
CBM Case Studies
In the next section, several actual case studies are presented which illustrate
how CBM can be used to make decisions about the effectiveness of instructional
interventions. The purpose of these examples is to give instructors a living sense of
the usefulness of CBM as a tool for monitoring the academic progress of children.
Wayne: A successful reading intervention
Wayne was an 8-year-old boy found to be reading at the 1st-grade level at the
start of the year. His teacher placed him in a DISTAR reading group. Wayne also
attended reading lab twice per week and was included in a supplementary wholelanguage group made up of delayed readers in his classroom. Baseline data on
Wayne's reading fluency was gathered, using passages taken from the early 2ndgrade reader (basal 6) of the Silver Burdett & Ginn reading series. That reading book
was selected as goal-level material in which Wayne would be monitored.
Fig. 5.1: Charted CBM reading data for Wayne R. :
Successful intervention
Basal 6
100
Basal 7
Baseline
80
Grade-wide
median reading
rate
X
60
Program
Change
Aimline
40
CRW
Errors
20
0
B
1
3
5
7
9
11
Instructional Weeks
CBM Workshop Manual
Jim Wright
Page 5-8
Chapter 5: Advanced Applications of CBM
Results revealed that, at the outset of his reading program, Wayne was able
to read 60 correct words per minute in basal 6 with 10 errors. Grade-wide CBM
norms were also collected; it was discovered that Wayne's grade-mates were
able to read an average of 85 correct words per minute in the same text, with a
average of 4 errors.
His teacher decided that Wayne should be able to increase his reading fluency
by about 3 words per instructional week. His instructor also expressed a willingness
to advance him into the next basal at the point that Wayne's reading performance
matched that of peers. The accompanying graph displays Wayne's reading progress
over approximately 10 weeks. He made steady progress throughout his
instructional program. That progress can be surmised by the relatively even
distribution of data-points around the aimline in the section of the graph in Figure
5.1 labeled "Basal 6." Wayne's progress was so strong, in fact, that by week 6 he was
able to exceed the grade-wide reading rate (represented at the top of the graph as a
horizontal gray line) and to decrease his number of errors.
Because of his strong reading growth, Wayne's teacher promoted him into
the next reading book. She monitored him for four more weeks. Since these
additional data-points seemed to indicate that Wayne was able to function
instructionally within that more advanced basal text, his teacher was satisfied with
his reading performance and discontinued CBM monitoring.
Ellen: Lack of expected progress despite a change of program
Not all students monitored through CBM show uniform rates of progress.
Because of differences in their ability and school experience, children display
considerable variation in rates of academic growth. This next example documents a
less-than-favorable learning outcome. The case is presented in some depth, because
it highlights the value of CBM in helping educators to identify those students with
such severe delays in acquisition of academic skills that those delays can be said to
constitute a learning handicap.
Ellen was just beginning the 2nd grade, having been retained in the 1st grade
the previous year because of limited reading skills. A survey-level CBM reading
assessment indicated that Ellen read most comfortably at the later 1st-grade level.
Along with the child's lagging reading skills, her teacher was concerned at signs that
Ellen became anxious when asked to read aloud, appeared to be self-conscious about
her limited reading skills, and would seem to make elaborate efforts to hide those
more limited reading abilities from classmates (e.g., picking up a book beyond her
abilities and pretending to read it in full view of the class). Her teacher decided to
place Ellen in the early 2nd-grade reader, despite the fact that this placement was
somewhat more advanced than was indicated by the child's level of reading
fluency. The instructor reasoned that, since Ellen had already spent the past two
years in the 1st-grade reading books, she would be very discouraged upon being
placed in the same basic texts for a third year. The teacher also thought that Ellen
might feel singled out and "different" if she could not read in the same book as
classmates.
However, other resources were put into place to strengthen her reading skills
and to support Ellen in this advanced reading placement. She attended reading lab
twice per week. Ellen was also assigned a reading tutor, an adult volunteer who
CBM Workshop Manual
Jim Wright
Page 5-9
Chapter 5: Advanced Applications of CBM
met with her individually for three 30-minute periods per week. Tutorial
instruction consisted of activities intended to give Ellen drill-and-practice
opportunities in reading. In particular, the tutor reviewed with Ellen stories that
would soon be covered in her reading group. It was hoped that by practicing stories
in advance, Ellen would be able to read aloud with greater competence in her group.
In order to gauge her progress in reading fluency, Ellen was monitored on a
weekly basis, using passages from the early 2nd-grade reader (basal 6) of the Silver
Burdett & Ginn reading series. This was the same book in which she was placed for
instruction. The decision was made to monitor Ellen in instructional material
because it would give the teacher regular feedback about how the student was
coping with the demands of her present reading program. The tutor had been
trained in administration of CBM and agreed to administer reading probes to Ellen.
It was decided that Ellen's estimated rate of progress in reading fluency should be set
at 3 additional words per week, an ambitious but not unachievable goal for a
regular-education student with additional reading assistance. (The aimline has
been omitted from the accompanying chart.)
From the outset, Ellen's reading performance showed a high degree of
fluctuation. For example, even her baseline data-points ranged from 32 to 45 words
per minute, suggesting a pattern of unpredictability in her reading rate from week
to week. After the first seven weeks of data representing Ellen's reading progress
had been graphed, a trendline was generated using computer software (see the
section of the grap in Figure 5.2 labeled "Intervention 1"). The trendline showed an
average increase in reading fluency of about a word per week, a substantially slower
rate of progress than her teacher had hoped for. There was also considerable
overlap between the baseline data-points and those collected during the first weeks
of intervention. Although the charted progress was somewhat disappointing, both
Ellen's teacher and parents were able to report that she had shown an improved
Fig. 5.2: CBM reading data for Ellen B. : Monitoring
of unsuccessful interventions
60
Intervention 1
Intervention 2
Negative trendline
indicates declining
measures of reading
fluency
Baseline
50
40
30
Positive trendline
still shows insufficient progress
20
CRW
Errors
10
0
B1 B2B3 1
3
5
7
9
11
13
15
Instructional Weeks
CBM Workshop Manual
Jim Wright
Page 5-10
Chapter 5: Advanced Applications of CBM
attitude toward reading since the beginning of the intervention, including greater
participation in the reading group and an increased readiness to attempt to read
simple texts independently at home.
In an attempt to accelerate Ellen's reading fluency, changes were instituted in
her reading program. Ellen's tutor continued to preview stories with her from the
reading book, but also recorded and reviewed error words with Ellen at each
meeting. The reading lab instructor devoted a larger amount of time each session
to a review of phonics skills. In the classroom, Ellen's instructor tried to get her
involved in informal but rewarding reading activities, such as writing stories and
reading to younger children in a neighboring classroom. When eight additional
data-points had been graphed, however, the resulting trendline displayed a
decreasing trend (see the section of the graph labeled "Intervention 2" in Figure 5.2).
At the very least, Ellen had made no apparent gains since the implementing of the
program change and--in fact--appeared to have actually lost ground when compared
to her earlier reading progress. Ellen's individual data-points also continued to
show substantial variation over time.
After examining the 15 weeks of CBM monitoring data, her teacher decided
to consult with the school's Pupil Service Team about Ellen's documented lack of
progress in reading fluency. They discussed the possibility that Ellen might have a
learning handicap which prevented her from making reading gains typical for
children her age. A learning evaluation was completed. Formal test data supported
the teacher's conclusion that Ellen was severely delayed in reading ability. The
student was diagnosed as having a learning disability in reading and assigned
resource assistance for an hour per day. The CBM data supplied by her teacher had
provided very useful information about the extent of Ellen's learning handicap.
Her failure to make adequate progress in reading was carefully documented,
providing educators with important evidence that Ellen would most likely require
additional remedial services to become a fluent reader in grade-appropriate
material.
Rachel and Thomas: Mixed outcomes
A major reason that CBM holds such potential for instructors is that it gives
timely feedback about the effectiveness of specific interventions for increasing
student fluency in basic academic skills. After all, even the most experienced
teacher cannot predict with certainty beforehand that a particular intervention is
well-suited for an individual student. Since every intervention is based on a
hypothesis (i.e., that a certain teaching approach will be effective with a targeted
child), the hypothesis can be tested through the gathering, charting, and interpreting
of CBM data. It may be helpful to review a case in which CBM was used to monitor
the performance of two children who were receiving identical mathematics
instruction. In this example, the resulting CBM data plainly distinguished between
a student who benefited from the intervention and one that failed to make
significant progress.
Rachel and Thomas were part of an 8-student math group composed of the
lowest-skilled students from two classrooms. The group met daily for 30 minutes.
The teacher structured her instruction around a DISTAR mathematics program.
CBM Workshop Manual
Jim Wright
Page 5-11
Chapter 5: Advanced Applications of CBM
Consequently, each lesson included frequent repetition of concepts, and
opportunities for students to repeat important information and to demonstrate
understanding. In order to monitor the progress of her students through CBM, the
teacher prepared a series of single-skill math probes. She chose to monitor the
children using a math objective in which they were currently being instructed-subtraction with 2 double-digit terms and no regrouping. Twice per week the
instructor opened the group by having the students complete a math probe. She
Fig. 5.3: Comparison of CBM math data for two students
(Subtraction with double-digit terms / no regrouping).
50
Thomas's trendline
reveals a strongly
positive trend.
40
30
Baseline
data-points
Thomas
Rachel
20
Rachel's trendline
shows a slight decline
in math fluency.
10
0
B1 B2 B3 1
2
3
4
5
Instructional Weeks
also set a fluency goal of 3 additional digits per week, based on her knowledge of the
skills of the group members. (Aimlines have been omitted from the
accompanying chart.)
The median baseline data-points (Figure 5.3) show that, when first evaluated,
Thomas was writing an average of 4 more correct digits than Rachel in a 2-minute
period. However, a review of the charted data after 4-1/2 weeks showed that the
gap in computational fluency between the two students had widened greatly.
While his trendline demonstrates that Thomas had increased his fluency on those
math problems by an average of 18 digits, Rachel's trendline shows a slight decrease
in fluency. In only several weeks, CBM was able to give the teacher valuable
information about the widely varying impact of her instructional program on
students.
Summary
Advanced applications of CBM include the writing of IEP objectives and use
of computer software. An alternative method of writing IEP goals can be adopted,
using the CBM monitoring procedure as a framework. CBM IEP statements contain
CBM Workshop Manual
Jim Wright
Page 5-12
Chapter 5: Advanced Applications of CBM
references to the conditions under which the program monitoring will take place,
the specific academic behavior that will be measured, and the criterion set for
successful completion of the objective. Computer software is now on the market
that automates the administration and scoring of CBM probes, while programs are
also available that automatically chart CBM data and generate trendlines. Teachers
can also rely on selected software to prepare probe materials, greatly reducing the
time investment needed to implement CBM in the classroom. Several case studies
presented in this chapter demonstrate how CBM can be used to make decisions
about the effectiveness of instructional interventions in applied settings.
CBM Workshop Manual
Jim Wright
Page 5-13
Appendix A: Random-number Table
APPENDIX A: The random-number table: A method for choosing truly
random samples
Random sampling is a fundamental part of curriculum-based measurement.
When teachers select students for classroom or school-wide CBM norms, they must
be sure to avoid bias in their choice of children to include in the norming sample.
Used in the context of random sampling, bias refers to any specific pattern that a
person may follow when choosing elements from a larger group. When bias is
present in the selection process, the resulting sample cannot be considered random.
But what is the underlying reason for insisting so strongly on random
sampling, particularly when choosing children to be in CBM norm groups? The
purpose of such groups is to give the instructor an idea of typical classroom or
grade-wide abilities in academic skills. However, if only those students with a
certain trait (e.g., "good" reading skills) are considered, the resulting group can no
longer be thought of as reflecting the typical, or "average," skills of the larger
classroom or grade. Put another way, we will have chosen a biased sample group.
While instructors might be on guard against obvious sources of bias in
sampling, caution is also required to prevent hidden bias from creeping into the
selection process. Imagine that a teacher decides to avoid bias by "just randomly
choosing" names from a student roster to include in a CBM norm group.
Although the instructor believes the process to be random, it is more likely that the
teacher is actually following a hidden pattern in selecting students. For example,
the instructor may unknowingly be choosing more students from the beginning or
end of the list than from the middle. Although not intentional, the resulting
sample may very well be biased. Now consider the situation of a teacher who looks
at a sample of students chosen from a class roster and decides to "adjust" the list to
include a more "representative" group of readers for the room. Again, bias has
been introduced into the selection process, because the instructor has altered the
composition of the CBM norm group to match that teacher's preconceived notions
of a typical range of readers.
Since bias can so easily contaminate the selection process and compromise the
usefulness of CBM norms, it is recommended that teachers use a random-number
table when choosing members of a norming sample or putting together other
random groupings. Although it is specifically presented here as a means of
choosing random CBM norm groups, the systematic random selection process
outlined below can be adopted for creating random samples of any kind (e.g., for
choosing passages from a basal reader for CBM probes). The procedure is simple and
straightforward:
1. Prepare the master list. The instructor first prepares a list, grouping all the
elements from which the sample group will be chosen. If a CBM norm group is to
CBM Workshop Manual
Jim Wright
Appendix A-1
Appendix A: Random-number Table
be selected from a regular-education classroom, the teacher removes from the class
list any students presently receiving special-education services. Students
remaining on the roster make up the initial selection list.
2. Consult the random-number table. The teacher turns to the random number
table in this appendix. (The table was generated by a computer statistics program,
and the numbers in it were randomly selected and arranged.) Starting at any point
in the table, the instructor moves from left to right, reading off the numbers that
appear. It is a good idea to start at varying points in the table each time that it is
used. If "0" is selected, the instructor moves one digit to the right of the 0 and uses
that number instead. If two-digit numbers are required for selection, the teacher
simply moves along the table, choosing two numbers at a time and reading them as
a single two-digit number (e.g., choosing "2" and "1" in sequence and reading them
as "21", or selecting "0" and "4" and reading them as "4").
3. Match random numbers to elements on the master list. For each number, the
teacher counts down the equivalent spaces on the master list, choosing the item
that corresponds to the random number. The process is then repeated until
enough elements have been chosen to make up the sample group. Each time, the
instructor uses the most recently selected element in the list as the starting-point
for counting off by the next random number.
For example, if a teacher encounters the number 4 in the random-digit table,
the instructor would count down the class roster, choosing the fourth student as a
member of the norm group. Then, using the most recently chosen student as the
new starting point, the teacher would read off the next random number from the
table and count down the proper number of spaces to select another student,
repeating the process until a sufficient number of names have been selected to
make up the sample group.
Example of a random selection of students for a classroom group
A teacher has made arrangements to gather CBM norms for his 4th-grade
classroom. When the time comes to choose a sample group, he decides that the
CBM norms will be collected from 7 typical students chosen at random. He first
examines his class roster and crosses off those children in his room who currently
have special-education needs (Figure A-1).
CBM Workshop Manual
Jim Wright
Appendix A-2
Appendix A: Random-number Table
Fig. A-1: Students receiving special-education services are eliminated
from the class list
4th-grade
Classroom 109
Ms. Norton
Abbott, Joseph......................Speech Impaired
Accardo, Jonathon
Bartholomay, Andrea.................Learning Disabled/Reading
Bayne, Christopher
Craig, Rodney
D'Arrigo, Daniel
Falge, Dorothy
Fenner, Richard
Hatalak, Susan
Hatch, Jolene
James, Laura
Jeffreys, Richard....................Learning Disabled/Math
Kyle, Valerie
Purtell, Michael
Quino, William
Randolph, Anna
Ruston, Blaire
Sherlock, Tammi.....................Visually Impaired
The instructor then consults the random number table in this appendix. He
arbitrarily picks the ninth line in the number-table and sees the following string of
numbers.
Fig. A-2: Line from random-number table
1 0 4 6 0 5 3 6 1 1 0 0 2 2 7 0 1 1 5 1 9 8 0 3
Seeing that the first number appearing in the series is "1," the teacher counts down
one name from the top of the list. (When counting, he skips those names that
have been omitted because they receive special-education services.) So beginning
his count with "Accardo, Jonathon," the teacher counts down one name, stopping
at "Bayne, Christopher." This student (Figure A-3) is selected as the first member of
the norming group. The instructor returns to the number table and finds that the
CBM Workshop Manual
Jim Wright
Appendix A-3
Appendix A: Random-number Table
Fig. A-3: Students are randomly chosen, using numbers from the
random number-table
4th-grade
Classroom 109
Ms. Norton
Abbott, Joseph......................Speech Impaired
Accardo, Jonathon
Bartholomay, Andrea.................Learning Disabled/Reading
Bayne, Christopher
Craig, Rodney
Counting off by numbers taken from
D'Arrigo, Daniel
the random-number table, the
Falge, Dorothy
Fenner, Richard
instructor chooses members of the
Hatalak, Susan
norm group from the list of typical
Hatch, Jolene
students.
James, Laura
Jeffreys, Richard....................Learning Disabled/Math
Kyle, Valerie
Purtell, Michael
Quino, William
Randolph, Anna
Ruston, Blaire
Sherlock, Tammi.....................Visually Impaired
next number is "0." He simply moves one digit to the right, finding the number
"4." Once again, he counts down the list, coming to rest at "Fenner, Richard," who
is included in the norm group. The process is repeated until the required number
of students have been selected.
CBM Workshop Manual
Jim Wright
Appendix A-4
Appendix A: Random-number Table
Random-number Table
7 2 2 7 1 2 8 3 1 6 3 4 5 4 2 4 0 3 7 5 4 1 6 1
1 9 1 8 7 1 2 2 4 6 6 6 7 2 8 8 2 4 3 2 1 3 5 0 1
8 4 3 2 5 4 1 0 9 2 8 3 8 4 0 2 2 7 5 0 2 6 9 6
4 1 6 8 1 8 6 5 7 7 2 1 1 8 0 3 1 4 2 0 3 5 4 0
8 1 5 5 7 9 4 8 7 4 2 8 8 5 4 2 1 6 7 5 6 6 8 4 9
1 2 8 4 3 2 0 8 1 5 5 8 0 1 1 2 1 5 4 9 4 4 4 3
1 2 5 1 0 5 4 4 2 9 3 7 1 7 9 3 0 2 7 2 5 2 9 9
5 1 5 5 0 8 9 5 6 9 0 4 6 3 8 6 9 5 9 5 4 7 6 2 9
1 0 4 6 0 5 3 6 1 1 0 0 2 2 7 0 1 1 5 1 9 8 0 3
6 1 3 3 2 4 6 4 5 1 4 7 3 0 5 0 7 5 7 5 6 3 9 0
1 8 3 6 4 9 7 9 9 8 5 9 1 8 6 2 3 7 8 4 1 0 9 9
3 5 6 3 7 8 1 4 8 2 9 2 5 3 8 3 4 1 9 9 3 9 1 3
8 7 2 7 4 4 4 5 9 2 0 7 0 0 7 8 9 2 1 6 5 7 0 7 6
2 9 0 4 3 8 6 3 3 9 7 5 1 2 1 3 1 9 8 6 2 9 3 3
1 3 6 3 1 7 2 8 7 1 8 4 6 4 3 8 9 3 3 0 9 9 1 4
0 6 5 7 2 5 7 0 2 4 8 7 8 1 6 7 7 7 2 3 4 5 7 4 9
6 9 8 2 7 5 1 7 8 9 0 2 0 8 1 8 0 7 2 8 8 1 9 5 0
9 2 5 8 2 4 1 0 3 2 3 5 7 7 0 8 3 5 3 2 6 9 8 9
3 4 0 4 7 8 9 2 5 4 2 9 1 6 2 6 7 7 9 3 6 9 8 8
9 9 6 9 7 4 0 1 4 0 7 6 8 6 3 7 9 9 8 3 6 7 1 3
9 5 3 6 5 1 4 1 3 6 7 3 3 0 9 6 0 0 5 4 8 4 5 6
4 1 0 7 6 6 8 9 5 7 4 9 6 4 2 8 6 4 2 4 0 9 2 2 9
CBM Workshop Manual
Jim Wright
Appendix A-5
Appendix B: CBM Fluency Charts
APPENDIX B: CBM fluency charts based on research norms
The following charts present CBM research norms in reading, mathematics, and
writing, as visual displays, representing ranges of student performance. They can be
photocopied and used for completing survey-level assessments of individual
students as outlined in Chapter 4.
CBM Workshop Manual
Jim Wright
Appendix B-1
Appendix B: CBM Fluency Charts
CURRICULUM-BASED MEASUREMENT
RESEARCH NORMS -- READING
Student Name__________________________________
S c h o o l _ _ _ _ _ _ _ _ _ _ _ _ Grade_______
City Reading Level _____
Room_____
Basal Placement: _____
CBM SURVEY-LEVEL READING ASSESSMENT--RESEARCH NORMS
6
5
4
3
2
1
FRUST
INSTR
MASTERY
FRUST
INSTR
MASTERY
FRUST
INSTR
MASTERY
FRUST INSTR
MASTERY
FRUST INSTR
MASTERY
FRUST INSTR
MASTERY
0
20
40
60
80
100
120
140
CORRECTLY READ WORDS PER MINUTE
Research norms from Deno, S.L., & Mirkin, P.K. (1977). Data-based
program modification: A manual. Reston, VA: Council for Exceptional
Children.
CBM Workshop Manual
Jim Wright
Appendix B-2
Appendix B: CBM Fluency Charts
CURRICULUM-BASED MEASUREMENT
RESEARCH NORMS -- MATHEMATICS
Student Name__________________________________
S c h o o l _ _ _ _ _ _ _ _ _ _ _ _ Grade_______
Room_____
City Math Level _____
CBM SURVEY-LEVEL MATH ASSESSMENT--RESEARCH NORMS
6
5
4
FRUST
INSTR
MASTERY
FRUST
INSTR
MASTERY
FRUST
INSTR
MASTERY
FRUST INSTR
MASTERY
2
FRUST INSTR
MASTERY
1
FRUST INSTR
MASTERY
3
0
10
20
30
40
50
60
CORRECT DIGITS PER MINUTE
Research norms from Deno, S.L., & Mirkin, P.K. (1977). Data-based
program modification: A manual. Reston, VA: Council for Exceptional
Children.
CBM Workshop Manual
Jim Wright
Appendix B-3
Appendix B: CBM Fluency Charts
CURRICULUM-BASED MEASUREMENT
RESEARCH NORMS -- WRITING
Student Name__________________________________
S c h o o l _ _ _ _ _ _ _ _ _ _ _ _ Grade_______
Room_____
CBM SURVEY-LEVEL WRITING ASSESSMENT--RESEARCH NORMS
NON-FLUENCY
6
FLUENCY
NON-FLUENCY
5
FLUENCY
NON-FLUENCY
4
FLUENCY
NON-FLUENCY
3
FLUENCY
NON-FLUENCY
2
FLUENCY
NON-FLUENCY
1
0
10
20
FLUENCY
30
40
50
60
70
TOTAL WORDS WRITTEN IN 3 MINUTES
Research norms from Mirkin,P.K., Deno, S.L., Fuchs, L., Wesson, C.,
Tindal, G., Marston, D., and Kuehnle, K. (1981) Procedures to develop
and monitor progress on IEP goals. Minneapolis: University of
Minnesota, Institute for Research on Learning Disabilities.
CBM Workshop Manual
Jim Wright
Appendix B-4
Appendix C: Progress-monitoring Charts
APPENDIX C: Progress-monitoring charts for CBM
Six blank CBM progress-monitoring charts appear in this appendix. The charts
differ both in the maximum number of academic behaviors that can be charted (50,
100, and 200) and the number of instructional weeks over which the monitoring
will take place (10 and 20 weeks). Instructors may want to experiment with several
charts to find those that best meet their needs.
CBM Workshop Manual
Jim Wright
Appendix C-1
Appendix C: Progress-monitoring Charts
50/10
CURRICULUM-BASED MEASUREMENT DATA CHART
Student Name__________________________________
__ Reading
__Mathematics
__Spelling
City Math Level: _____ __Writing
S c h o o l _ _ _ _ _ _ _ _ _ _ _ _ Grade_______
City Reading Level _____
Room_____
50
40
30
20
10
0
B1
B2
B3
1
2
3
4
5
6
7
8
9
10
INSTRUCTIONAL WEEKS
Data Table: Record CBM data in the table below prior to charting.
Week #
B1
B2
B3
Date
CBM Data
Week #
Date
CBM Data
Week#
Date
/ /
/ /
/ /
/ /
/ /
/ /
/ /
/ /
/ /
/ /
/ /
/ /
/ /
/ /
/ /
/ /
/ /
/ /
/ /
/ /
/ /
/ /
/ /
/ /
CBM Workshop Manual
Jim Wright
Appendix C-2
CBM Data
Appendix C: Progress-monitoring Charts
100/10
CURRICULUM-BASED MEASUREMENT DATA CHART
Student Name__________________________________
S c h o o l _ _ _ _ _ _ _ _ _ _ _ _ Grade_______
City Reading Level _____
__ Reading
__Mathematics
__Spelling
__Writing
Room_____
City Math Level: _____
100
90
80
70
60
50
40
30
20
10
0
B1
B2
B3
1
2
3
4
5
6
7
8
9
10
INSTRUCTIONAL WEEKS
Data Table: Record CBM data in the table below prior to charting.
Week #
B1
B2
B3
Date
CBM Data
Week #
Date
CBM Data
Week#
Date
/ /
/ /
/ /
/ /
/ /
/ /
/ /
/ /
/ /
/ /
/ /
/ /
/ /
/ /
/ /
/ /
/ /
/ /
/ /
/ /
/ /
/ /
/ /
/ /
CBM Workshop Manual
Jim Wright
Appendix C-3
CBM Data
Appendix C: Progress-monitoring Charts
200/10
CURRICULUM-BASED MEASUREMENT DATA CHART
Student Name__________________________________
__ Reading
__Mathematics
__Spelling
City Math Level: _____ __Writing
S c h o o l _ _ _ _ _ _ _ _ _ _ _ _ Grade_______
City Reading Level _____
Room_____
200
180
160
140
120
100
80
60
40
20
0
B1
B2
B3
1
2
3
4
5
6
7
8
9
10
INSTRUCTIONAL WEEKS
Data Table: Record CBM data in the table below prior to charting.
Week #
B1
B2
B3
Date
CBM Data
Week #
Date
CBM Data
Week#
Date
/ /
/ /
/ /
/ /
/ /
/ /
/ /
/ /
/ /
/ /
/ /
/ /
/ /
/ /
/ /
/ /
/ /
/ /
/ /
/ /
/ /
/ /
/ /
/ /
CBM Workshop Manual
Jim Wright
Appendix C-4
CBM Data
Appendix C: Progress-monitoring Charts
50/20
CURRICULUM-BASED MEASUREMENT DATA CHART
Student Name__________________________________
__ Reading
__Mathematics
__Spelling
City Math Level: _____ __Writing
S c h o o l _ _ _ _ _ _ _ _ _ _ _ _ Grade_______
City Reading Level _____
Room_____
50
40
30
20
10
0
B1
B2
B3
2
4
6
8
10
12
14
16
18
20
INSTRUCTIONAL WEEKS
Data Table: Record CBM data in the table below prior to charting.
Week #
B1
B2
B3
Date
CBM Data
Week #
Date
CBM Data
Week#
Date
/ /
/ /
/ /
/ /
/ /
/ /
/ /
/ /
/ /
/ /
/ /
/ /
/ /
/ /
/ /
/ /
/ /
/ /
/ /
/ /
/ /
/ /
/ /
/ /
CBM Workshop Manual
Jim Wright
Appendix C-5
CBM Data
Appendix C: Progress-monitoring Charts
100/20
CURRICULUM-BASED MEASUREMENT DATA CHART
Student Name__________________________________
S c h o o l _ _ _ _ _ _ _ _ _ _ _ _ Grade_______
City Reading Level _____
__ Reading
__Mathematics
__Spelling
__Writing
Room_____
City Math Level: _____
100
90
80
70
60
50
40
30
20
10
0
B1
B2
B3
2
4
6
8
10
12
14
16
18
20
INSTRUCTIONAL WEEKS
Data Table: Record CBM data in the table below prior to charting.
Week #
B1
B2
B3
Date
CBM Data
Week #
Date
CBM Data
Week#
Date
/ /
/ /
/ /
/ /
/ /
/ /
/ /
/ /
/ /
/ /
/ /
/ /
/ /
/ /
/ /
/ /
/ /
/ /
/ /
/ /
/ /
/ /
/ /
/ /
CBM Workshop Manual
Jim Wright
Appendix C-6
CBM Data
Appendix C: Progress-monitoring Charts
200/20
CURRICULUM-BASED MEASUREMENT DATA CHART
Student Name__________________________________
__ Reading
__Mathematics
__Spelling
City Math Level: _____ __Writing
S c h o o l _ _ _ _ _ _ _ _ _ _ _ _ Grade_______
City Reading Level _____
Room_____
200
180
160
140
120
100
80
60
40
20
0
B1
B2
B3
2
4
6
8
10
12
14
16
18
20
INSTRUCTIONAL WEEKS
Data Table: Record CBM data in the table below prior to charting.
Week #
B1
B2
B3
Date
CBM Data
Week #
Date
CBM Data
Week#
Date
/ /
/ /
/ /
/ /
/ /
/ /
/ /
/ /
/ /
/ /
/ /
/ /
/ /
/ /
/ /
/ /
/ /
/ /
/ /
/ /
/ /
/ /
/ /
/ /
CBM Workshop Manual
Jim Wright
Appendix C-7
CBM Data
Appendix D: Computational Goals
APPENDIX D: List of computational goals
COMPUTATIONAL GOALS OF MATH CURRICULUM (ADAPTED FROM SHAPIRO, 1989)
The computational skills listed below are arranged in ascending order of difficulty. Please identify(1)
the skills which you have instructed in the classroom, (2) the skills that the student has mastered, and
(3) the skills with which the student is currently having difficulty.
MASTERED : Place a check under the M column indicating the skills which the student has mastered.
INSTRUCTED
DIFFICULTY
difficulty.
M
I
__
__
__
__
: Place a check under the I column indicating the skills which you have instructed.
: Place a check under the D column indicating the skills with which the student is having
D
Grade 1
__
__
1. Add two one-digit numbers: sums to 10.
2. Subtract two one-digit numbers: combinations to 10.
Grade 2
__
__
__
__
__
__
__
__
__
__
__
__
__
__
__
__
__
__
__
__
__
__
__
__
__
__
__
3.
4.
5.
6.
7.
Add two one-digit numbers: sums 11 to 19.
Add a one-digit number to a two-digit number--no regrouping.
Add a two-digit number to a two-digit number--no regrouping.
Add a three-digit number to a three-digit number--no regrouping.
Subtract a one-digit number from a one- or two-digit number:
combinations to 18.
8. Subtract a one-digit number from a two-digit number--no regrouping.
9. Subtract a two-digit number from a two-digit number--no regrouping.
10. Subtract a three-digit number from a three-digit number--no
regrouping.
11. Multiplication facts--0's, 1's, 2's.
Grade 3
__
__
__
__
__
__
__
__
__
__
__
__
__
__
__
__
__
__
12.
13.
14.
15.
16.
17.
__
__
__
18.
__
__
__
19.
__
__
__
20.
__
__
__
21.
Add three or more one-digit numbers.
Add three or more two-digit numbers--no regrouping.
Add three or more three- and four-digit numbers--no regrouping.
Add a one-digit number to a two-digit number with regrouping.
Add a two-digit number to a two-digit number with regrouping.
Add a two-digit number to a three-digit number with regrouping
from the units to the tens column only.
Add a two-digit number to a three-digit number with regrouping
from the tens to the hundreds column only.
Add a two-digit number to a three-digit number with regrouping
from the units to the tens column and from the tens to the hundreds
column.
Add a three-digit number to a three-digit number with regrouping
from the units to the tens column only.
Add a three-digit number to a three-digit number with regrouping
from the tens to the hundreds column only.
CBM Workshop Manual
Jim Wright
Appendix D-1
Appendix D: Computational Goals
M
I
D
__
__
__
__
__
__
__
__
__
__
__
__
__
__
__
__
__
__
__
__
__
__
__
__
__
__
__
__
__
__
__
__
__
__
__
__
22. Add a three-digit number to a three-digit number with regrouping
from the units to the tens column and from the tens to the hundreds
column.
23. Add a four-digit number to a four-digit number with regrouping in
one to three columns.
24. Subtract two four-digit numbers-no regrouping.
25. Subtract a one-digit number from a two-digit number with
regrouping.
26. Subtract a two-digit number from a two-digit number with
regrouping.
27. Subtract a two-digit number from a three-digit number with
regrouping from the units to the tens column only.
28. Subtract a two-digit number from a three-digit number with
regrouping from the tens to the hundreds column only.
29. Subtract a two-digit number from a three-digit number with
regrouping from the units to the tens column and from the tens to
the hundreds column.
30. Subtract a three-digit from a three-digit number with regrouping
from the units to the tens column only.
31. Subtract a three-digit number from a three-digit number with
regrouping from the tens to the hundreds column only.
32. Subtract a three-digit number from a three-digit number with
regrouping from the units to the tens column and from the tens to
the hundreds column.
33. Multiplication facts--3 to 9.
Grade 4
__
__
__
__
__
__
__
__
__
__
__
__
__
__
__
__
__
__
__
__
__
__
__
__
__
__
__
__
__
__
__
__
__
__
__
__
__
__
__
34. Add a five- or six-digit number to a five- or six-digit number with
regrouping in any columns.
35. Add three or more two-digit numbers with regrouping.
36. Add three or more three-digit numbers with regrouping
with regrouping in any columns.
37. Subtract a five- or six-digit number from a five- or six-digit
number with regrouping in any columns.
38. Multiply a two-digit number by a one-digit number with no
regrouping.
39. Multiply a three-digit number by a one-digit number with no
regrouping.
40. Multiply a two-digit number by a one-digit number with no
regrouping.
41. Multiply a three-digit number by a one-digit number with regrouping.
42. Division facts--0 to 9.
43. Divide a two-digit number by a one-digit number with no remainder.
44. Divide a two-digit number by a one-digit number with remainder.
45. Divide a three-digit number by a one digit number with remainder.
46. Divide a four-digit number by a one-digit number with remainder.
CBM Workshop Manual
Jim Wright
Appendix D-2
Appendix D: Computational Goals
M
I
D
__
__
__
__
__
__
__
__
__
Grade 5
47. Multiply a two-digit number by a two-digit number with regrouping.
48. Multiply a three-digit number by a two-digit number with
regrouping.
49. Multiply a three-digit number by a three-digit number with
regrouping.
List of computational goals taken from Shapiro, Edward S. (1989). Academic
skills problems: Direct assessment and intervention. New York: Guilford
Press.
CBM Workshop Manual
Jim Wright
Appendix D-3
Appendix E: CBM Reading-Fluency Record Form
APPENDIX E: Record form for CBM reading fluency
The record form in this section may be used by instructors to keep an accurate
record of children's reading fluency, number of errors, and accuracy in decoding on
CBM reading probes. Consult page 2-8 of this manual for an example of a completed
record form.
CBM Workshop Manual
Jim Wright
Appendix E-1
Appendix E: CBM Reading-Fluency Record Form
CBM Reading-Fluency Recording Sheet
Student Name___________________ Grade/Unit________________
Reading Level_____________
Current Basal Placement_______
--------------------------------------------------------------------------------------------------------------------Basal Number:_______
Date________
Correctly
Percent
Read Words
Errors
Accuracy
Story Name:__________________
_________
_____
______
Story Name:__________________
_________
_____
______
Story Name:__________________
_________
_____
______
CBM Workshop Manual
Jim Wright
Appendix E-2
Appendix F: Suggestions for further reading
APPENDIX F: Suggestions for further reading
Instructors who are interested in knowing more about curriculum-based
measurement and related direct-assessment approaches are encouraged to consult
the following books:
Shinn, Mark R. (Ed.) (1989). Curriculum-based measurement: Assessing special
children. New York: Guilford Press.
Shapiro, Edward S. (1989). Academic skills problems: Direct assessment and
intervention. New York: Guilford Press.
The sampling of articles listed below provides additional general information
about CBM and its use in regular and special education classrooms.
Deno, S.L. (1985). Curriculum-based measurement: The emerging
alternative. Exceptional Children, 52, 219-232.
Deno, S.L. & Fuchs, Lynn S. (1987). Developing curriculum-based
measurement systems for data-based special education problem
solving. Focus on Exceptional Children, 19 (8) 1-16.
Fuchs, L.S. & Fuchs, D. (1986). Curriculum-based assessment of progress
toward long-term and short-term goals. The Journal of Special
Education, 20, 69-82.
Fuchs, D., Fuchs, L., Benowitz, S., & Barringer, K. (1987). Norm-referenced
tests: Are they valid for use with handicapped students?
Exceptional Children, 54, 263-271.
Fuchs, L. S., Deno, S.L., & Mirkin, P.K. (1984). The effects of frequent
curriculum-based measurement and evaluation on pedagogy, student
achievement, and student awareness of learning. American
Educational Research Journal, 21, 449-460.
Fuchs, L.S. & Deno, S.L. (1991). Paradigmatic distinctions between
instructionally relevant measurement models. Exceptional Children,
57, 488-500.
Fuchs, L.S. & Deno, S.L. (1992). Effects of curriculum within curriculumbased measurement. Exceptional Children, 58, 232-243.
CBM Workshop Manual
Jim Wright
Appendix F-1
Appendix F: Suggestions for further reading
Further reading
Fuchs, L.S. & Fuchs, D. (1986). Linking assessment to instructional intervention:
An overview. School Psychology Review, 15, 318-323.
Fuchs, L.S. & Fuchs, D. (1989). Enhancing curriculum-based measurement
through computer applications: Review of research and practice.
School Psychology Review, 18, 317-327.
Gickling, E. & Thompson, V. (1985). A personal view of curriculum-based
assessment. Exceptional Children, 52, 205-218.
Marston, D. & Magnusson, D. (1985). Implementing curriculum-based
measurement in special and regular education settings. Exceptional
Children, 52, 266-276.
Marston, D., Mirkin, P., & Deno, S. (1984). Curriculum-based measurement:
An alternative to traditional screening, referral, and identification.
The Journal of Special Education, 18, 109-117.
CBM Workshop Manual
Jim Wright
Appendix F-2


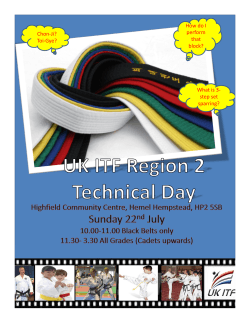


© Copyright 2026