
Biology& 160 Laboratory Manual Green River Community College
Biology& 160 Laboratory Manual Green River Community College Biology& 160 Laboratory Manual Mr. Brumbaugh 1 Spring 2014 Preface This manual has been compiled and written for your enjoyment and learning as you work through the Biology& 160 course. The exercises selected by your instructor are meant to accentuate your learning of the basic concepts, ideas, and hypotheses concerning cellular biology. Each exercise should reinforce the learning that is taking place within the confines of the lecture portion of the course. The exercises are designed to give you a “hands on” feel for the material presented in lecture. Please take to heart the following suggestions for your successful completion of Biology& 160. Spend time before lab reading each assigned laboratory thoroughly. This will allow you to organize your time during lab and to foresee pitfalls and pratfalls that could prevent you from completing the lab within the prescribed timeframe. As you prepare for the lab, jot down questions about concepts or procedures that you would want answered to facilitate your lab experience. Most labs will have pre-lab questions’, answer them to the best of your ability prior to lab to assist your understanding. Come prepared to discuss or turn-in the pre-lab questions. If you are assigned to an activity research group, plan a meeting time each week prior to the day of the lab to finalize the understanding of the procedures for the lab. Before leaving lab ensure that you have a good understanding of the principles so that you can finish the write-up or answer the questions associated with that lab. Approach lab with an open mind for learning and attempt to see the application of the information and the relatedness to the lecture material. Have fun and use the time to maximize your learning of the concepts of biology. Biology& 160 Laboratory Manual Mr. Brumbaugh 2 Spring 2014 Biology& 160 Laboratory Manual Green River Community College Table of Contents and Appendices Please Take Note!! It is your responsibility to read each assigned lab prior to coming to the lab and to answer any pre-laboratory questions or tasks associated with the individual labs. Laboratory Exercises Safety and Emergency Procedures Laboratory 1 Principles of the Scientific Method Laboratory 2 Enzyme Activity Laboratory 3 Microscope Techniques Laboratory 4 Cellular Diversity Laboratory 5 Transporting Across Boundaries Laboratory 6 Energy Harvest – Fermentation in Yeast Laboratory 7 Mitosis and Online Karyotyping Laboratory 8 Mendelian Genetics Laboratory 9 Modeling DNA Structure, Replication, & Protein Synthesis Laboratory 10 Paper Project Handout pg. 05 pg. 07 - 22 pg. 23 - 40 pg. 41 - 60 pg. 61 - 71 pg. 73 - 85 pg. 87 - 97 pg. 99 - 105 pg. 107 - 119 pg. 121 - 134 pg. 135 - 138 Appendices Appendix Appendix Appendix Appendix Appendix Appendix A B C D E F Biology& 160 Laboratory Manual Mr. Brumbaugh How to Graph Scientific Data? How to Convert to the Metric System? How to Cite References in Papers How to Draw or make a Scientific Plate or Drawing? How to Make an Oral Presentation? How to Search the Literature? 3 pg. 139 - 140 pg. 141 pg. 142 - 144 pg. 145 - 147 pg. 148 - 149 pg. 150 - 152 Spring 2014 First blank page to be used for Cell Biology Doodling Biology& 160 Laboratory Manual Mr. Brumbaugh 4 Spring 2014 Biology Laboratory: Safety and Emergency Procedures 1. No open food or drink is permitted in laboratory rooms at any time, whether a lab is in progress or not. No eating, drinking, chewing of gum or tobacco is permitted. Never taste anything at all while in the laboratory rooms, unless it is a part of the lab activity (such as PTC paper). 2. Know the locations of the eye wash and shower stations, fire alarm, fire extinguisher, first aid kit, and emergency exits. 3. If you have any allergies (including latex and bee stings), please inform your instructor so that we can be aware of your needs during lab activities and field trips. 4. Safety instructions are given at the beginning of each lab activity. Always arrive on time so that you know what you are supposed to do and are informed of any specific safety concerns or safety equipment associated with the day’s lab activity. 5. Wear any required personal protective equipment and appropriate attire for lab activities and field trips (lab coat, apron, goggles, rain gear, etc.). 6. Stash book bags safely so that they won’t trip people. 7. Report all illnesses, injuries, breakages, or spills to your laboratory instructor immediately. 8. Clean broken glass (glass that is not contaminated with any chemical reagents, blood, or bacteria) can be swept up using the dust pan and placed in the broken glass container. If the glass is contaminated in any way, keep the area clear to prevent tripping or laceration hazards, and consult your instructor for proper disposal guidance. A broken glass flow-chart is available in the lab to help you decide what to do. 9. Notify your instructor if any of the equipment is faulty. 10. Clean up your entire work area before leaving. Put away all equipment and supplies in their original places and dispose of reagents and infectious materials in the designated receptacles. Disinfect your work surface if the lab activity involved any infectious materials. 11. Use the appropriate waste containers provided for any infectious or hazardous materials used in lab. 12. Safety information reagents used in the lab activities can be found in the Material Safety Data Sheets (MSDS), which are available in a binder in the lab. Know the location of the MSDS binder. We (faculty and students) should be fully aware of the properties of the reagents we are using. Please use the MSDSs. If you cannot find the MSDS for the reagent you are using in lab, inform your instructor. They are also relatively easy to find online. A Google keyword example is “Sodium Chloride MSDS.” 13. Use caution with the lab chairs because they are on casters, they can roll away when you are standing at your workstation. Make sure your chair is where you expect it to be before sitting down. Do not use your chair as a means of moving from one part of the lab to the other. 14. Wash your hands before and after concluding the day’s lab activities. 15. Notify your instructor if you harm/hurt yourself or notice a change in your health during lab. 16. I have read these procedures and agree to follow them this quarter. Signature: Biology& 160 Laboratory Manual Mr. Brumbaugh . Date: 5 . Spring 2014 Page to be used for Cell Biology Doodling Biology& 160 Laboratory Manual Mr. Brumbaugh 6 Spring 2014 Laboratory 1: Principles of the Scientific Method Pre-lab Assignment Before coming to lab carefully read the following pages on the Principles of the Scientific Method and Appendix A then answer the pre-lab questions (pages 21 & 22). Be prepared to hand in your responses to the pre-lab questions at the start of lab. Perspectives Biology is a dynamic field of study whose aim is to unravel the mysteries of life itself. Throughout history, humans have been curious about the world around them. Through the millennia people have observed the natural world and have asked, “Why?” Those that have advanced our biological knowledge the most, whether the great scientists of the centuries before us, such as Robert Hooke (discovered cells in 1665) and Charles Darwin (co-developer of the theory of evolution by natural selection in 1859), or modern molecular biologists such as James Watson and Francis Crick (discovered the structure of DNA in 1953), have certain traits in common. They had inquiring minds, great powers of observation, and they used a systematic approach to answer the questions that intrigued them, the scientific method, which is similar to how you look at the world. In this course you will have ample opportunity to develop your scientific skills. The weekly laboratory exercises are designed not only to stimulate your curiosity and heighten your powers of observation, but also to introduce you to and allow you to practice the scientific method. This laboratory activity will allow you to practice the scientific method as you study the factors that influence your heart rate and level of physical fitness. Let’s first learn a bit about the scientific method in more detail. Scientific Method The scientific method is neither complicated nor intimidating, nor is it unique to science. It is a powerful tool of logic that can be employed any time a problem or question about the world around us arises. In fact, we all use the principles of the scientific method daily to solve problems that pop up, but we do it so quickly and automatically that we are not conscious of the methodology. In brief, the scientific method consists of Observing natural phenomena Asking a question based on one’s observations Constructing a hypothesis to answer the question Testing the hypothesis with experiments or pertinent observations Drawing conclusions about the hypothesis based on the data resulting from the experiments or pertinent observation Publishing results (hopefully in a scientific journal!) Deveolping theories with your collegues about phenomena that have overwhelming statistical support Consolidation of theories to formulate a law of nature (not very many) Observations The scientific method begins with careful observation. An investigator may make observations from nature or from the written work of other investigators, which are published in books or research articles in scientific journals, available in the storehouses of human knowledge, libraries. Biology& 160 Laboratory Manual Mr. Brumbaugh 7 Spring 2014 Let’s use the following example as we progress through the steps of the scientific method. Suppose that over the last couple of years you have been observing the beautiful fall colors of the leaves on the vine maples that grow in your yard, on campus, and in the forests in the Cascade Mountains. You note that their leaves turn from green to yellow to orange to red as the weather turns progressively colder and the days get shorter and shorter. However, the leaves do not always go through their color changes on exactly the same days each year. Questions It is essential that the question asked is a scientific question. I.e. The question must be testable, definable, measurable and controllable. For example, one would have a tough time trying to test the following question; “Did a supernatural force such as God create all life on earth?” Moreover, since the concept of God has many different meanings and definitions, it is difficult to define what or who God is from a science standpoint. Since this question is not a scientific question, and hence not testable, the courts of the United States have ruled that “creation science” should not be taught in science classes as has been demanded by various groups in this country. However, that’s not to say that God did not create life, it’s just not testable from a science viewpoint, but rather, a matter of faith. Now, back to the vine maple example...Being a curious and inquisitive person you ask, “What’s causing or stimulating the vine maple’s leaves to change color?” Hypotheses The next step in the scientific method is to make a hypothesis, a tentative answer to the question that you have asked. A hypothesis is an educated guess that is based on your previous observations. It’s a trial solution to your question that you will test through experimentation. Hypotheses are often stated in an “If... then...” statement. Now back to the vine maples. You have noted that vine maples change color in the fall on approximately the same dates each year, but this varies by a week or two each year. You hypothesize, since air temperature is not constant each year in the fall, the progressively cooler days in fall are responsible for stimulating the color changes. Therefore, you develop and wish to test the following hypothesis: If progressively cooler temperatures are responsible for stimulating the color changes in the leaves of vine maples, then vine maples placed in a artificially cooled growth-house should go through the same color changes as would the vine maples in nature, even if the length of day/night are held constant via artificial lighting. Testing Hypotheses via Experiments or by Pertinent Observations The next step of the scientific method is to design an experiment or make pertinent observations to test the hypothesis. In any experiment there are three kinds of variables. Independent variable: The independent variable is the single condition (variable) that is manipulated to see what impact it has on a dependent variable (measured factor). The independent variable is the factor that causes the dependent variable to change. E.g. the temperature the trees are exposed to is the independent variable in this vine maple example. The independent variable is the factor (i.e. experimental condition) you manipulate and test in an experiment. A great challenge when designing an experiment is to be certain that only one independent variable is responsible for the outcome of an experiment. As we shall see, there are often many factors (known as control variables) that can influence the outcome of an investigation. We attempt, but not always successfully, to keep all of the controlled variables constant and change only one factor, the independent variable or control treatment, when conducting an experiment. Once the parameters or limits (such as the amount, intensity, volume, or etc.) of the independent variable have been delineated then the independent variable becomes a controlled treatment for the experiment. Biology& 160 Laboratory Manual Mr. Brumbaugh 8 Spring 2014 Dependent Variable: The thing measured, counted, or observed in an experiment. E.g. the color of leaves is the dependent variable in this vine maple example. Hopefully there wold be only one variable that would change due to the manipulation of the independent variable but alas this is not usually the case and many outcomes can be measured. Doing exhausted background literature searches can alleviate this issue but does a new unpredicted outcome nullify the experiement? No it just means that the design must be evaluated. Control Variables: These are the variables that are kept constant during an experiment. It is assumed that the selected independent variable is the only factor affecting the dependent variable. This can only be true if all other variables are controlled (i.e. held constant). In the vine maple example: species of vine maple, age and health of the trees used, length of day, environmental conditions such as humidity, watering regime, fertilizer, etc. It is quite common for different researchers, or for that matter, the same researcher, to get different and conflicting results while conducting what they think is the very same experiment. Why? They were unable to keep all conditions identical, that is, they were unable to control all controlled variables. In an experiment of classical design, the individuals under study are divided into two groups: an experimental group that is exposed to the independent variable (e.g. the group of trees that are exposed to the varying temperatures), and a control group that is not. The control group would be exposed to the identical conditions as the experimental group, but the control group would not be exposed to the independent variable (e.g. the control group of vine maples would be kept at a constant temperature, everything else would remain identical.) Sometimes the best test of a hypothesis is not an actual experiment, but pertinent observations. One of the most important principles of biology, Darwin’s theory of natural selection, was developed and supported by his extensive observations of the natural world. Since Darwin’s publication of his theory, a multitude of experiments and repeated observation of the natural world continue to support Darwin’s theory. Conclusion Making conclusions is the next step in the scientific method. You use the results and/or pertinent observations to test your hypothesis. However, you can never completely accept or reject a hypothesis. All that one can do is state the probability that one is correct or incorrect. Scientists use the branch of mathematics called statistics to quantify this probability. Publication in a Scientific Journal Finally, if the fruits of your scientific labor were thought to be of interest and of value to your peers in the scientific community, then your work would be submitted as an article for publication in a scientific journal. The goal of the scientific community is to be both cooperative as well as competitive. Research articles both share knowledge and provide enough information so that the results of experiments or pertinent observations described by those articles may be repeated and tested by others. It is just as important to expose the mistakes of others, as it is to praise their knowledge. Continuing the Discovery An important hypothesis may become a theory after it stands up consistently to repeat testing by other researchers. A scientific theory is a hypothesis that has yet to be falsified and has stood the test of time. Hypotheses and theories can only be supported, but cannot be proved true by experimentation and careful observation. It is impossible to prove a hypothesis or theory to be true since it takes an infinite number of experiments to do this, but it only takes one experiment to disprove a hypothesis or a theory. If the theory gains widespread support researchers may posit the theory into a law of nature. Why do we have so few laws of nature because scientific Biology& 160 Laboratory Manual Mr. Brumbaugh 9 Spring 2014 knowledge is dynamic, forever changing, and evolving as more and more is learned and techniques change how we gather and evaluate data. Heart Rate and Fitness Exercise Goals of Lab Exercise Learn proper graphing technique To learn and apply the steps of the scientific method to answer questions concerning physical fitness Use a computer and heart rate monitor to measure the human heart rate Determine the effect of body position on heart rates Determine the effect of exercise on heart rates Correlate the fitness level of individuals with factors such as gender, age, the amount of daily exercise, or other factors identified by students. Introduction The Circulatory System The circulatory system is responsible for the internal transport of many vital substances in humans, including oxygen, carbon dioxide, and nutrients. The components of the circulatory system include the heart, blood vessels, and blood. Heartbeats result from electrical stimulation of the heart by the pacemaker (sino atrial node or SA Node), located in the heart’s inner wall of the right atrium. Although the electrical activity of the pacemaker originates from within the heart, nerves outside of the heart can influence the rhythmic sequence of impulses produced by the pacemaker. Many things might affect the rate of the heart’s beating, including the physical fitness of the individual, the presence of drugs such as caffeine or nicotine in the blood, or the age of the person. The increase in heartbeat rate during exercise can be measured by monitoring the individual’s heart rate. As a rule, the maximum heart rate of all individuals of the same age and sex is about the same, yet the time it takes individuals to reach that maximum level while exercising varies greatly. Since physically fit people can deliver a greater volume of blood in a single cardiac cycle than unfit individuals, they usually can sustain a greater work level before reaching the maximum heart rate. Physically fit people not only have less of an increase in their heart rate during exercise, but their heart rate recovers to the resting rate more rapidly than unfit people. In this experiment, you will evaluate your physical fitness. An arbitrary rating system will be used to “score” fitness during a variety of situations. Tests will be made while in a resting position, in a prone position, as well as during and after physical exercise. Let’s now take a look at the Scientific Method. Materials Computer Stepping platform, 9” high Lab Manual Caution! Go-Link Interface Hand held Heart Rate Monitor 1 textbook per table Heart Rate Monitor Program Recorded Metronome Do not attempt this exercise if physical exertion will aggravate a health problem. Inform your instructor of any concerns that you may have and if you experience any issues following the exercise. Biology& 160 Laboratory Manual Mr. Brumbaugh 10 Spring 2014 Procedure Developing a Question, Hypothesis, and Experimental Procedure 1. In teams of 4, take a few minutes to discuss several specific questions about an independent variable related to cardiovascular fitness peculiar to your group. 2. Write your group’s best question and hypothesis in and “If…, then…” format on the Report Sheet (page 15) and contribute your group’s hypothesis on the front white board. 3. Determine which hypothesis that the entire class will attempt to answer. Record this question on the Report Sheet. 4. Develop a testable hypothesis of the “If..., then...” format. Record this hypothesis on the Report Sheet. 5. Design an experiment that will test this hypothesis. All teams will perform the same experiment. List five generalized steps of the experimental design on the Report Sheet. 6. Cardiovascular fitness will be assessed by determining and comparing the heart rate while standing, reclined, going from a reclined to a standing position, before and after physical activity, and the amount time needed to recover from the exercise as outlined in steps 1 18, under Collecting Data from Test Subjects below. 7. Each group should recruit one subject for treatment 1 and another subject for treatment 2. One test subject will complete steps 1 – 18 under the direction of the investigators (other group members) and then the other subject will be tested. One investigator (one of your partners) should record your data on the Report Sheet. The Set Up 1. Prepare the computer for data collection by opening the Biology with Computers software as follows: Plug the hand held heart rate sensors into the Go-Link connector then go to Start click on Programs Vernier open Logger Pro 3.5 File Biology with Vernier open “Exp. 27” Heart Rate & Fitness. 2. Have your first test subject grasp the sensors while sitting, ensuring that the arrow direction on the sensor matches the direction of the arrow on the receiver and are within 3 to 4 ft. of each other. Click the COLLECT button and continue collecting until the test subjects’ heart rate is steady and within the normal range for the individual—usually between 55 and 85 beats per minute. 3. Click on the STOP button to stop data collection when you have determined that all equipment is functioning properly. 4. To obtain the average heart rate, maximum heart rate, etc.: Select “Analyze” on the menu bar at the top of the screen and click on “Statistics”. This will place a table onto the graph, find the mean in the box, and this is the number you will record on the data table during each of the experimental tests. 5. Erase the data from this run and begin the experiment with your first subject. Collecting Data from Test Subject 1. 2. 3. Start with either subject (treatments 1 or 2) and follow steps 2 - 18. After step 18, each group should repeat steps 2-18 with a subject representing the other treatment category. Instruct the test subject to stand upright, click the COLLECT button, and begin taking data with the Heart Rate Monitor program. Wait until the heart rate becomes stable, record for I minute, and then record the subject’s heart rate in the proper column in Table 6A or 6B (page 16 or 17, respectfully) based on your assigned group number. Compare the subject’s standing heart rate to the values in Table 1. Assign fitness points based on Table 1 and record on the Report Sheet. Biology& 160 Laboratory Manual Mr. Brumbaugh 11 Spring 2014 Beats per minute < 60 – 70 71 -80 81 – 90 91 -100 Fitness points 12 11 10 9 Beats per minute 101 – 110 111 – 120 121 -130 131 -140 Fitness Points 8 7 6 4 Table 1 Fitness Points for Standing Heart Rate Use this table to assign fitness points based on the subject’s standing heart rate. 4. 5. Instruct the subject to recline on a clean table with their feet on the table and knees bent. Wait until the heart rate becomes stable, record for 1 minute, and then record the subject’s heart rate on the Report Sheet. The subject should remain reclined until step 6. Compare the subject’s average reclining heart rate to the values in Table 2, assign fitness points based on Table 2, and record the points on the Report Sheet. Beats per minute < 50 – 60 61 – 70 71 – 80 Fitness points 12 11 10 Beats per minute 81 – 90 91 – 100 101 -110 Fitness Points 8 6 4 Table 2 Fitness Points for Reclining Heart Rate Use this table to assign fitness points based on the subject’s reclining heart rate. 6. 7. 8. 9. Instruct the test subject to quickly stand up next to the lab table and remain still. Measure the subject’s peak heart rate upon standing (takes a few moments and will appear in the heart rate box on the screen) and then record it on the Report Sheet. Have subject return to reclining position until step 9. Find how much the heart rate increased after standing by subtracting the reclining rate value in Step 4 from the peak standing value in step 6. Assign fitness points corresponding to your reclining to standing heart rate in Table 3 and record the fitness points on the Report Sheet. STOP data collection. Have the test subject stand and begin COLLECTING heart rate data. Wait until the heart rate becomes stable (Initial standing heart rate), and then record the subject’s heart rate on the Lab Report Sheet. Ave. Reclining rate (beats/min) 50–60 61–70 71–80 81–90 91–100 101–110 0–10 12 12 11 10 8 6 Heart Rate Increase after Standing 11–17 18–24 25–33 11 10 8 10 8 6 9 6 4 8 4 2 6 2 0 4 0 0 34+ 6 4 2 0 0 0 Table 3 Fitness Points for Reclining to Standing Use this table to assign fitness points based on the subject’s reclining to standing heart rate changes. 10. While holding the hand held sensor devices have the test subject step up and down on a low platform about 8 to 10 inches from the ground as follows: Step to place the right foot on the step and then the left Step down with the right and then the left Repeat for the three minute test 11. Use a pace set at 96 beats per minute to ensure that all subjects maintain a constant step rate. The test subject should make one-foot movement for each beat of the metronome. The instructor will provide a metronome recording for the class. Biology& 160 Laboratory Manual Mr. Brumbaugh 12 Spring 2014 12. Record on the Report Sheet the subject’s average heart rate after 3 minutes of exercise. When the subject has completed the step exercise, quickly move to Step 13. 13. With a stopwatch or clock, begin timing to determine the test subject’s recovery time. During the recovery period, the test subject should remain standing and still. Monitor the heart rate and STOP timing when the rate returns to the Initial standing heart rate value before the start of the step test (recorded in Step 6). Record the recovery time on the Report Sheet. 14. Assign fitness points based on the information in Table 4. Record the fitness point value on the Report Sheet. Recovery Time (seconds) Fitness Points 14 12 10 8 6 4 6 0–30 31–60 61–90 91–120 121-150 > 150 Heart rate stabilized at a higher rate than the average standing value before starting the step test Heart rate did not fall to within 6 to 10 beats/min. of the initial rate within 150 seconds after the cessation exercise 4 Table 4 Fitness Points for Recovery Time Fitness points based on the subject’s total heart rate recovery time. 15. To calculate the endurance heart rate, subtract the initial standing heart rate before exercise (Step 6) from the average heart rate during exercise (Step 12). Record this heart rate increase in the endurance row on the Report Sheet. Standing rate (beats/min) 60–70 71–80 81–90 91–100 101–110 111–120 121–130 131+ 0–10 12 12 12 10 8 8 6 5 Heart rate increase after exercise 11–20 21–30 31–40 12 10 8 10 8 6 10 7 4 8 6 2 6 4 1 4 2 1 2 1 0 1 0 0 41+ 6 4 2 0 0 0 0 0 Table 5 Fitness Points for Endurance Fitness points based on the subject’s endurance rate. 16. Assign fitness points based on Table 5 and record the value on the Report Sheet. 17. Total fitness points for subject and use Figure 1 to determine an arbitrary fitness level and record on the Report Sheet. Do not save data to the computer. 18. Repeat steps 2 - 17 with a new test subject for the other treatment category. 19. As a group answer the questions on the Report Sheet (pages 15 through 20) and turn in one report sheet packet per group next week at the start of the lab. Fitness Scale Low Fitness 20 Very Fit Fit 30 40 50 60 Figure 1 Fitness Scale Use this scale is to chart the arbitrary fitness level for each subject. Biology& 160 Laboratory Manual Mr. Brumbaugh 13 Spring 2014 Page to be used for Cell Biology Doodling Biology& 160 Laboratory Manual Mr. Brumbaugh 14 Spring 2014 Report Sheet Lab Section: Principles of the Scientific Method Exercise Group Names: . . . . . Question, Hypothesis, and Experiment: From Developing a Question, Hypothesis, and Experimental Procedure: Group Work: 1. Your group’s best question: Your group’s hypothesis: Class Work: 2. Hypothesis proposed by the class: Summary of the experimental procedure designed by the class (five steps): 3. List below the various components of the experiment designed by the class Dependent variable(s): Independent variable(s): Controlled variable(s): Control treatment: Biology& 160 Laboratory Manual Mr. Brumbaugh 15 Spring 2014 Data: Treatment 1: Situation: Group Number Standing heart rate (beats/min) Reclining heart rate (beats/min) Peak heart rate upon standing (beats/min) Initial standing heart rate just before step test (beats/min) Heart Rate Average after step test (beats/min) Recovery time (seconds) Endurance (beats/min) Heart Rate 1 2 3 4 5 6 Fitness Points 1 2 3 4 5 6 Total fitness points Average total fitness points for treatment 2 Arbitrary Fitness Level Table 6A Treatment #1 Data Table Record your heart rate and fitness points on this table captured from Treatment #1 subject. Miscellaneous Notes and Observations: Biology& 160 Laboratory Manual Mr. Brumbaugh 16 Spring 2014 Data: Treatment 2: Situation: Group Number Standing heart rate (beats/min) Reclining heart rate (beats/min) Peak heart rate upon standing (beats/min) Initial standing heart rate just before step test (beats/min) Heart Rate Average after step test (beats/min) Recovery time (seconds) Endurance (beats/min) Heart Rate 1 2 3 4 5 6 Fitness Points 1 2 3 4 5 6 Total fitness points Average total fitness points for treatment 2 Arbitrary Fitness Level Table 6B Treatment #2 Data Table Record your heart rate and fitness points on this table captured from Treatment #2 subject. Miscellaneous Notes and Observations: Biology& 160 Laboratory Manual Mr. Brumbaugh 17 Spring 2014 Graphing the Data: 1. Read carefully “Graphing of Data” in Appendix A, obtain a piece of appropriate graphing paper, and then construct a graph that will assist you in interpreting the results from this investigation: Graph total fitness points for subjects 1-6 for treatment 1. Graph total fitness points for subjects 1-6 for treatment 2. Graph average total fitness points for treatment 1. Graph average total fitness points for treatment 2. Appropriately label the graph with a figure number, title, and descriptive sentence. 2. Summarize the trends in fitness displayed on your graph by referring to the data displayed on your graph (Refer to the data by its figure number). 3. Construct an additional graph to reveal some other trend from your research. For example recovery time, pulse rate before and after exercise, or heart rate after exercise. Use the graphing information to assist your design (Appendix A). 4. Summarize the trends in fitness displayed on your graph by referring to the data displayed on your graph. (Refer tothe data by its figure number). Biology& 160 Laboratory Manual Mr. Brumbaugh 18 Spring 2014 Conclusions: 1. Does the data support or refute the hypothesis proposed by the class? Explain using data from the experiment (Refer to the data by its figure number). 2. Using your data (Refer to the data by its figure number), are there additional conclusions one could draw from this experiment? 3. Explain why an experiment has only one independent variable, and identify the independent variable for this experiment? 4. How could this experiment be improved to get results that would allow the formulation of more valid conclusions? Give specific ways the experiment could be improved! Biology& 160 Laboratory Manual Mr. Brumbaugh 19 Spring 2014 Application Questions: 1. When subjects moved from a standing position to a reclining position, how did their heart rate change, by how much, how do you account for this change, and was the result what you predicted? (Refer to the data by its figure number) 2. When subjects moved from a reclining position to a standing position, how did their heart rate change, by how much, how do you account for this change, and was the result what you predicted? (Refer to the data by its figure number) 3. Why does research indicate that most heart attacks occur as people get out of bed after a night’s sleep? 4. Why would athletes need to work longer and harder before their heart rates were at the maximum value? Biology& 160 Laboratory Manual Mr. Brumbaugh 20 Spring 2014 Pre-Lab Report Sheet Lab Section: . Principles of the Scientific Merthod Exercise Name: . Before coming to lab carefully read the previous pages on the Principles of the Scientific Method then answer these pre-lab questions. Be prepared to hand in your responses to the prelab questions at the start of lab. 1. Restate the following hypothesis in an “If-Then” statement. Hypothesis: Students that study two-hours outside of class for every one-hour in class usually get better grades than students that study half that amount of time. 2. Identify the independent and dependent variables in the following experiments: Pea plant height measured daily for 30 days. Dependent variable: Independent variable: Number of leaves found on pea plants 5 days after having been treated with gibberellic acid. Dependent variable: Independent variable: 3. Suggest a control treatment for each of the following two experiments: Pea plants are sprayed with 5ml. aqueous solution of gibberellic acid and their height determined daily after the spraying. Control treatment: Pulse rate is determined after 3 minutes of aerobic exercise. (Hint: the control is what the heart rate after exercise will be compared to.) Control treatment: Biology& 160 Laboratory Manual Mr. Brumbaugh 21 Spring 2014 4. Should the data obtained from the following experiment be plotted as a line graph or a bar graph? Briefly explain your reasoning: Pea plant height measured daily for 30 days. (See Appendix A for help.) Line graph or Bar Graph (circle one) Explain why you came to this conclusion? 5. Write a question, a hypothesis, and identify the independent, dependent and three control variables that you would like to investigate in this experiment (heart rate experiment). See pages of the Perspectives for help. Biology& 160 Laboratory Manual Mr. Brumbaugh 22 Spring 2014 Lab 2: Enzyme Activity Lab Pre-lab Assignment Before coming to lab read carefully the following pages on Enzyme Activity and Appendix A then answer the pre-lab questions at the end of this lab (pages 39 & 40). Be prepared to hand in your responses to the pre-lab questions at the start of lab. Perspective Life without enzymes is unimaginable. In the absence of enzymes, the energy required by your muscles simply to open your lab manual would take years to accumulate. Due to the action of enzymes, the thousands of chemical reactions occurring in your cells at this very moment are being completed in a fraction of a second rather than the years or decades that would otherwise be required. Without enzymes, for example, the energy required for you to simply blink your eye would take years to be produced. Enzymes are biological catalysts, meaning that they speed up chemical reactions within the parameters of a biological system. Enzymes accomplish this feat by lowering the activation energy of a reaction, the energy needed to begin a reaction (Figure 1). Enzymes for the most part are protein organic catalysts. Like all catalysts, enzymes are not destroyed nor altered by the reaction. Enzymes are extremely efficient and a single enzyme molecule may be used over and over again. One enzyme molecule may catalyze a specific chemical reaction thousands of times every second. Because of this high rate of activity, only a very small amount of enzyme is needed to act on a relatively large amount of substrate, the substance on which the enzyme acts. Reaction with Enzyme Reaction without Enzyme Activation Energy without Enzyme Activation Energy with Enzyme Energy Initial Potential Energy of Substrate(s) Energy Released by Reaction Final Potential Energy of Product(s) Extent of reaction Figure 1 Diagram of Enzyme Activity Enzymes increase the rate of a chemical reaction by decreasing the activation energy, the energy required to initiate a reaction. In an enzyme catalyzed reaction a substrate molecule first interacts with the active site of the enzyme by forming weak hydrogen bonds with the substrate, forming an enzyme-substrate complex (E-S C) (Figure 2 A & B). The substrate is then converted into one or more products and then released from the enzyme. The interaction between the substrate and the active site reduces the activation energy (the minimum kinetic energy required by the reactant(s) for a reaction to occur) of the reaction, thereby increasing the fraction of molecules with sufficient kinetic energy to react. As a consequence, the rate of reaction increases dramatically. Enzyme catalyzed reactions may proceed from a hundred thousand to 10 million times faster than they would without the enzyme present! The following equation depicts this process: Enzyme + Substrate Biology& 160 Laboratory Manual Mr. Brumbaugh E-S Complex 23 Enzyme + Product Spring 2014 Enzymes use various mechanisms to lower the activation energy required either for a catabolic or an anabolic reaction to proceed. They can do this by: 1) bond straining of the substrate molecule to increase the probability of bond breakage (Figures 2A). 2) hold the substrate molecule(s) in such a way to bring reacting parts of the molecule(s) close to one another to increase the probability of a reaction (Figures 2B), 3) side groups of the amino acids within the active site of the enzyme may act as proton donors or acceptors to help promote acid-base reactions involving the substrate, or 4) an enzyme may temporarily react with the substrate molecule to form an unstable intermediate that then readily undergoes a second reaction to generate some product along with an unchanged enzyme ready to undergo further catalysis reactions. Product Molecules Substrate Active Site Enzyme Enzyme-Substrate Complex Enzyme-Product Complex Enzyme Upon release of products, each enzyme molecule acts on another substrate molecule. Figure 2A Enzyme Activity This figure is an example of an enzymatic catabolic reaction. Substrate Molecules Product Molecule Active Site Enzyme Enzyme-Substrate Complex Enzyme-Product Complex Figure 2B Enzyme Activity This figure is an example of an enzymatic anabolic reaction. Enzyme activity is influenced by many factors or parameters. The most common factors are temperature and pH. Maintaining these factors around some set point is extremely important to the shape of the active site. Most organisms have a preferred temperature and pH range in which they survive (homeostasis) and their enzymes usually function best within this very narrow temperature or pH range. If the environment of the enzyme is too acidic or basic, cold or hot, the activity of the enzyme may be altered due to a change in the three-dimensional shape of the enzyme (conformation). This is called denaturation which is the unraveling or structural changes within the enzymes structure (What bonds are disrupted?). This may be temporary or permanent depending on the degree of the environmental change and the time the enzyme is exposed to this Biology& 160 Laboratory Manual Mr. Brumbaugh 24 Spring 2014 change. In either case, a denatured enzyme no longer has the necessary shape to interact with the substrate effectively, thus lowering the effectiveness of the enzyme. In this experiment you will investigate the enzyme action on hydrogen peroxide, H2O2. H2O2 is a natural byproduct of aerobic metabolism. H2O2 is quite toxic to most organisms since its production leads to the formation of hydroxyl free radicals, one of the most damaging of all free radicals. Free radicals react with and damage all biological molecules they collide with, including DNA. Fortunately, most of the H2O2 produced is detoxified by converting it to harmless oxygen gas and water in the organelle called a peroxisome. The reaction within the peroxisome is as follows: 2 H2O2(aq) 2 H2O(l) + O2(g) Although this reaction occurs spontaneously, enzymes increase the rate considerably. At least two different enzymes are known to catalyze this reaction: catalase, found in all animals (including most tissues in the human body) and protists, and peroxidase, found in plants. A great deal can be learned about enzymes by studying the rates of enzyme-catalyzed reactions. In this experiment, you will measure the rate of catalase activity under various conditions, such as different concentrations of enzyme, pH values, and temperatures. The rate of a chemical reaction may be determined by either measuring the rate at which the substrate disappears, or by determining the rate of appearance of the product. In this experiment the rate of decomposition of H2O2 will be determined by measuring the appearance of oxygen by monitoring the pressure of oxygen gas formed as H2O2 is destroyed. If a plot of pressure vs. time is made, it should appear similar to that of Figure 3. Figure 3 Pressure versus the Decompostion of H2O2 Note that at the start of the reaction (i.e. t=0) there is no product formation and the pressure is the same as the atmospheric pressure. After a short time, oxygen accululation at a rather constant rate. The slope of the curve at this initial time is consatant and is called the initial time. As the substrate, hydrogen peroxide, is decomposed it sconecntration decreases which results in fewer E-S collisions. Hence the rate of O2 production decreases over time. Enzyme Activity Exercise Goals of Lab Exercise To understand the basic relationship between enzyme structure and function To learn techniques for making serial dilutions and related chemical equipment To learn technigues to use a computer to measure the O2 prodcution rate from the enzyme catalase Biology& 160 Laboratory Manual Mr. Brumbaugh 25 Spring 2014 Procedure Materials Computer and Safety Goggles Go-Link Interface & Gas Pressure Sensor Stopper assembly fitted with tubing 250ml beaker of tap water at room temp. Basting bulb, thermometer, & test tube rack 5 - 18 X 150 mm test tubes Lab Manual 3.0 % H2O2 & Catalase enzyme suspension 2 - 10ml Graduated cylinders Water bath (set at 37oC) & ice Buffer solutions of pH 3, 5, 7, 9, and 11 Solutions with dropper pipette 600 or 1000 ml beaker 1 Textbook per table Procedure: (Perform all experiments in teams of four) Wear safety goggles during this experiment to prevent eye and skin contamination or possible irritation. The Set Up for all experiments 1. Prepare the computer for data collection by opening the Biology with Computers software as follows: Plug the Biology Gas Pressure Sensor into the Go-Link connector. Go to Start click on Programs Find Vernier Software open Logger Pro 3.5.0 File “Open” Biology with Vernier open Exp. 6B - “Fermentation Pressure”. Verify the vertical axis has pressure scaled from ~90 to ~130kPa, and the horizontal axis has time scaled from 0 to 3 minutes. 2. Connect the stopper tubing assembly to a large test tube and ensure that all connections are “finger tight” and do not leak. A pressure reading of ~ 99 to ~103 kPa should appear when the sensor is open to the atmosphere (Figure 4A). 3. Adjusting the Valves to the Pressure Sensor: Open the valve on the rubber stopper assembly so that it is open to the atmosphere (Figure 4A). Do this by turning the handle of the valve on the rubber stopper so that it is in a vertical position. Figure 4B shows the closed position used when monitoring the CO2 generated by the enzyme. Figure 4A Valve Setting Valve open to the atmosphere. Figure 4B Valve Setting Valve closed to the atmosphere. Part A. The Effect of Enzyme Concentration on Reaction Rate Introduction Enzyme reactions occur because of the random collisons between substrate molecules and the enzyme. Obviously as the concentration of enzymes changes these collisions will occur with increased frequency, but issues arise when considering that with each E-S C reaction more product is produced. The question then becomes how can one maximize the number of collsions to form ES C’s? 1. Set up as above and then proceed to step 2. Biology& 160 Laboratory Manual Mr. Brumbaugh 26 Spring 2014 2. Prepare a water bath (Figure 5) at your table for the enzyme solution to ensure that the enzyme will remain at a constant and controlled temperature when collecting data. To prepare the water bath combine warm and cool water in a 1-liter beaker until it reaches room temperature. Fill the beaker with water until the beaker is ¾ full, but won’t spill over when the test tube containing the enzyme and substrate is placed in it. Make sure to keep the water temperature constant at about 20oC. Thermometer Pressure Sensor Pressure Sensor Figure 5 Experimental Set-up This diagram shows the reaction vessel in a water bath maintained at a constant temperature. 3. Place five test tubes in a rack and label them 1, 2, 3, 4, and 5. Use a 10 ml graduated cylinder to add (Wear Safety Goggles!) 3.0 ml of deionized water (dH2O)and 3.0 ml of 3.0 % H2O2 to each test tube as indicated in Table 1. Important! Be ready to proceed immediately to steps 5 - 9 before adding the enzyme suspension to the substrate, H2O2, in step 4! Test tube No. Volume of 3.0 % H2O2 (ml) Volume of dH2O (ml) Drops of Enzyme Suspension 1 2 3 4 5 3.0 3.0 3.0 3.0 3.0 3.0 3.0 3.0 3.0 3.0 2 5 10 15 0 Table 1 Contents of test tubes 1-5 This table shows the volumes of the various solutions placed into the various test tubes for this experiment. 4. Use a clean dropper pipette to add 2 drops of enzyme suspension to Test Tube 1. Be sure the enzyme does not fall against the sides of the test tube. Steps 5 - 9 should be completed as rapidly as possible! 5. With the valve of the stopper assembly open (Figure 4A), quickly insert the stopper assembly firmly into the test tube. Firmly twist the stopper for an airtight fit. 6. Constantly and gently swirl the suspension to thoroughly mix its contents. The reaction should begin. 7. Close the system to the atmosphere (Figure 4B). Do not tamper with the fittings once you have completed this step. 8. Begin collecting data by clicking the COLLECT button. Constantly and gently swirl the suspension while collecting data (This helps to liberate the oxygen gas from the solution and helps to keep the contents mixed well). Monitor the temperature of the water bath to ensure that it does not change by more than one degree. 9. Collect data until you are certain that there is a linear relationship between the pressure and time—this usually takes less than a minute. If the pressure exceeds 130 kPa, stop Biology& 160 Laboratory Manual Mr. Brumbaugh 27 Spring 2014 10. 11. 12. 13. the computer by clicking the STOP button. Open the air valve on the stopper assembly to avoid it popping off! Determination of the Rate of Reaction. The slope of the line on the monitor is equal to the rate of decomposition of H2O2 by catalase. Use the computer to calculate the slope as follows: Move the cursor to the point where the pressure values begin to have a linear relationship. Hold down the mouse button. Drag the cursor to the end of the linear section of the curve (Figure 6) and release the mouse button. Click the Linear Fit button to perform a linear regression. A floating box will appear with the formula for a best fit line. Click on the box and set the number of decimal places to give the slope 3 significant figures. The equation for the line displayed on the monitor is y = mx + b, where y is the variable on the y-axis, pressure (in kPa), x is the variable on the x-axis, time (in minutes), m is the slope of the line = rate of reaction (in kPa/min), b is the y-intercept (the pressure at t = 0; i.e. atmospheric pressure in kPa). Record on Table 4 (page 33) the slope of the line to 3 significant figures, m, as the rate of H2O2 decomposition by catalase. Close the linear regression floating box. Figure 6 Pressure vs. Time The determination of the rate of decomposition of H 2O2 by catalase activity (i.e. the slope) as a plot of Pressure vs. Time Important! Depending on the rate of the reaction with two drops of enzyme suspension, we may have to change the number of drops of enzyme suspension needed for tubes 2-4! 14. Continue with test tubes 2 through 5 by following steps 1 – 13 using these new enzyme concentrations: add 5 drops of the enzyme solution to test tube 2, add 10 drops of the enzyme solution to test tube 3, add 15 drops of the enzyme solution to test tube 4, and do not add any enzyme to the solution in Test Tube 5 (Why?). 15. Answer questions of Part A in the Report Sheet pages 33 and 34 as a group. Part B. The Effect of Temperature on an Enzymes’ Reaction Rate Introduction The rate of a chemical reaction increases as temperature rises, in part because molecular velocity is increased (Brownian Motion). This means that substrate molecules collide more frequently with the active site of enzyme molecules. Generally, according to the Q10 rule, a 10oC rise in temperature results in a two-fold increase in the rate of a chemical reaction. However, the activity of an enzyme is dependent upon the proper three-dimensional structure, and high temperatures may irreversibly denature an enzyme. The optimum temperature for enzyme activity, therefore, may vary depending on the structure of the enzyme, its source, and the nature of the substrate. Biology& 160 Laboratory Manual Mr. Brumbaugh 28 Spring 2014 The Set Up 1. Follow steps 1, 2, and 3 under Set Up for all experiments on page 26 to begin. 2. Obtain 4 test tubes and use 10 ml graduated cylinders to add (Wear Safety Goggles!) 3.0 ml of 3.0 % H2O2 and 3.0 ml of dH2O to each tube, as shown in Table 2. These tubes will be incubated in water baths at 10.0oC (tube 1), 20.0oC (tube 2), 37.0oC (tube 3), and 75.0oC (tube 4). Label each tube with its tube number and the temperature of the water bath that it will be placed in. Record the actual temperature of each water bath in Table 4. Test tube No. Temperature Volume of 3.0 % H2O2 (ml) Volume of dH2O (ml) o 1 10.0 C 3.0 3.0 2 20.0oC 3.0 3.0 o 3 37.0 C 3.0 3.0 4 75.0oC 3.0 3.0 Table 2 Contents of test tubes 1-4 This table shows the volumes of the various solutions placed into the various test tubes for this experiment. 3. Measurement of the rate of reaction at 10.0oC: Prepare a 10.0oC water bath by placing ice and water in a 600-ml beaker (Figure 5). Record the actual temperature of the water bath in Table 4 and keep the temperature constant. 4. Place test tube 1 in the cold water bath until the temperature of its contents reaches 10.0oC (about 5 -10 minutes) 5. Obtain a clean test tube and label it tube 1E (“E” stands for enzyme). Add about 1 to 2 ml of enzyme solution to tube 1E and then place it in the 10.0oC water bath until the enzyme solution reaches 10.0oC (about 5-10 minutes). (Why equilibrate the enzyme and substrate to To before the reaction begins?) 6. When ready add 5 drops of the enzyme solution from tube 1E to test tube 1, and proceed immediately to steps 5 - 13 under the concentration steps. 7. Measurement of the rate of reaction at 20.0oC: Prepare a 20.0oC water bath (Figure 5) and record the actual temperature of the water bath on Table 4 (keep To constant). 8. Place test tube 2 in the water bath until the temperature of its contents reaches 20.0oC (about 5-10 min.). 9. Obtain a clean test tube and label it tube 2E. Add about 1 to 2 ml of enzyme solution to tube 2E and then place it in the 20.0oC water bath until the enzyme solution reaches 20.0oC (about 5-10 minutes). 10. When ready to proceed immediately add 5 drops of the enzyme solution from tube 2E to test tube 2 and repeat steps 5 - 13 under the concentration steps. 11. Measurement of the rate of reaction at 37.0oC: Prepare a 37.0oC water bath (Figure 5) by placing hot tap water in a 600-mL beaker and record the actual temperature of the water bath in Table 4 (keep To constant). 12. Place Test Tube 3 in the 37.0oC water bath until the temperature of its contents reaches 37.0oC (about 5-10 minutes). 13. Obtain a clean test tube and label it Tube 3E. Add about 1 to 2 ml of enzyme solution to tube 3E and then place it in the 37.0oC bath until the enzyme solution reaches 37.0oC (about 5-10 minutes). 14. When ready to proceed immediately add 5 drops of the enzyme solution from tube 3E to test tube 3 and repeat steps 5 - 13 under the concentration steps. 15. Measurement of the rate of reaction at 75.0oC: Place Test Tube 4 in the thermostatically controlled 75.0oC water bath in the back of the room until the temperature of its contents reaches 75.0oC (about 5-10 minutes). Biology& 160 Laboratory Manual Mr. Brumbaugh 29 Spring 2014 16. Obtain a clean test tube and label it tube 4E. Add about 1 to 2 ml of enzyme solution to tube 4E and then place it in the thermostatically controlled 75.0oC water bath until the enzyme solution reaches 75.0oC (about 5-10 minutes). 17. Prepare a 75.0oC water bath (Figure 5) by placing water from the thermostatically controlled 75.0oC water into a 600-ml beaker, and record the actual temperature of the water bath in Table 4 (keep To constant). 18. When ready to proceed immediately add 5 drops of the enzyme solution from tube 4E to test tube 4 and repeat steps 5 - 13 under the concentration steps. 19. Answer questions of Part B in the Report Sheet pages 34 and 35 as a group. Part C. The Effect of pH on an Enzymes’ Reaction Rate Introduction The pH of the solution an enzyme is in can influence the three-dimensional shape of the enzyme. Every enzyme has an optimum pH at which it is most active. Most enzymes function best in solutions that are near neutral (pH 6-8), but several work in the more basic (pH 8-12) or the more acidic range (pH 2-6). In this experiment you will determine the optimum pH for the activity of catalase. The Set Up 1. Follow steps 1, 2, and 3 under Set Up for all experiments on page 26 to begin. 2. All trials will be performed in a water bath at room temperature: Prepare a water bath at room temperature (Figure 5). 3. Place five clean test tubes in a rack and label them pH 3, pH 5, pH 7, pH 9, and pH 11. Use 10 ml graduated cylinders to add (Wear Safety Goggles!) 3.0 ml of each pH buffer to each test tube, as in Table 3. Test Tube 1 2 3 4 5 pH of buffer pH 3 pH 5 pH 7 pH 9 pH 11 Volume of buffer (ml) 3.0 3.0 3.0 3.0 3.0 Volume of 3.0 % H2O2 (ml) 3.0 3.0 3.0 3.0 3.0 Table 3 Contents of test tubes 1-5 This table shows the volumes of the various solutions placed into the various test tubes for this experiment. 4. Add 5 drops of the enzyme suspension to 3.0 ml pH 3 buffer and wait a minimum of 5 minutes for the enzyme to be affected by the buffer (Why?), then add 3.0 ml 3.0% H2O2, and repeat steps 5 - 13 under the concentration steps. Record data in Table 4. 5. In the tube labeled pH 5, add 5 drops of the enzyme solution and wait at least 5 minutes to allow the enzyme to be affected by the buffer. Now add 3.0 ml 3.0% H2O2, and repeat steps 5 - 14 under the concentration steps. Record data in Table 4. 6. In the tube labeled pH 7, add 5 drops of the enzyme solution and wait at least 5 minutes. Now add 3.0 ml 3.0% H2O2, and repeat steps 5 - 13 under the concentration steps. Record data in Table 4. 7. In the tube labeled pH 9, add 5 drops of the enzyme solution and wait at least 5 minutes. Now add 3.0 ml 3.0% H2O2, and repeat steps 5 - 13 under the concentration steps. Record data in Table 4. Biology& 160 Laboratory Manual Mr. Brumbaugh 30 Spring 2014 8. In the tube labeled pH 11, add 5 drops of the enzyme solution and wait at least 5 minutes. Now add 3.0 ml 3.0% H2O2, and repeat steps 5 - 13 under the concentration steps. Record data in Table 4. 9. Answer questions of Part C in the Report Sheet pages 35 as a group. 10. Answer the additional questions on pages 36 and 37 of the Report Sheet as a group. Part D. Clean Up Introduction Remember a clean lab is a happy lab and one that captures all the points. Procedure (Perform in teams) 1. Clean your test tubes with soap and water, rinse them with distilled water, turn them upside down, and place them in a rack to drain and dry. 2. Clean with water (moist towelette) and dry your lab table. 3. Make sure the lab supply carts are neat, clean, and orderly. Biology& 160 Laboratory Manual Mr. Brumbaugh 31 Spring 2014 Page to be used for Cell Biology Doodling Biology& 160 Laboratory Manual Mr. Brumbaugh 32 Spring 2014 Report Sheet Lab Section: . Enzyme Activity Exercise Group Names: . . . . Results: Part A Effect of enzyme concentration on the rate of H2O2 decomposition Test tube label Rate (kPa/min) Misc. Notes and Comments Tube 1: 2 Drops Enzyme Tube 2: 5 Drops Enzyme Tube 3: 10 Drops Enzyme Tube 4: 15 Drops Enzyme Tube 5: Part B No Enzyme Effect of temperature on the rate of H2O2 decomposition Test tube label Rate (kPa/min) Misc. Notes and Comments o Tube 1: 10.0 C o Tube 2: 20.0 C o Tube 3: 37.0 C o Tube 4: 75.0 C Part C Effect of pH on the rate of H2O2 decomposition Test tube label Tube 1: pH 3 Tube 2: pH 5 Tube 3: pH 7 Tube 4: pH 9 Tube 5: pH 11 Rate (kPa/min) Misc. Notes and Comments Table 4 Data for Parts A – C Use this table to record your data in your lab notebook from the enzyme activity experiments. Part A: Effect of Enzyme Concentration on Enzyme Function 1. On a separate sheet of paper, using Excel or by hand, make a graph of the rate of enzyme activity vs. enzyme concentration. Recall that the dependent variable is plotted on the y-axis, the independent variable on the x-axis. Label the graph fully and give it a proper title. Biology& 160 Laboratory Manual Mr. Brumbaugh 33 Spring 2014 2. Restate the hypothesis you made for this part of the experiment. Does the data support or refute your hypothesis? Summarize what can be concluded from the data. Quote your figure to support the conclusions that you make. Your summary should include a discussion on how changing the catalase concentration affects the rate of the decomposition of hydrogen peroxide and why changing the catalase concentration affects the rate of reaction. 3. Use the experimental results to predict the effect on the rate of reaction if one increases the amount of enzyme to 20 drops. How about 100 drops? Explain your reasoning and quantify your response. 4. What was the purpose of conducting the experiment using tube 5? Explain. 5. List two possible weaknesses and improvements, if any, for this part of the experiment. Part B: Analysis of Results: Effect of Temperature on Enzyme Function 1. On a separate sheet of paper, using Excel or by hand, make a graph of the rate of enzyme activity vs. temperature. Recall that the dependent variable is plotted on the y-axis, the independent variable on the x-axis. Label the graph fully and give it a proper title. 2. Restate the hypothesis you made for this part of the experiment. Does the data support or refute your hypothesis? Summarize what can be concluded from the data. Quote your figure to support the conclusions that you make. Your summary should include a discussion on how changing the temperature affects the rate of the decomposition of hydrogen peroxide and why changing the temperature affects the rate of reaction. Biology& 160 Laboratory Manual Mr. Brumbaugh 34 Spring 2014 3. Use the data collected in this experiment to calculate Q10 for catalase: Q10 equals the rate of reaction at a given temperature divided by the rate at a temperature 10oC lower. How closely does the catalase follow the Q10 rule? 4. List two possible weaknesses and improvements, if any, for this part of the experiment. Part C: Analysis of Results: Effect of pH on Enzyme function 1. Using Excel or by hand, make a graph of the rate of enzyme activity vs. pH. Recall that the dependent variable is plotted on the y-axis, the independent variable on the x-axis. Label the graph fully and give it a proper title. 2. Restate the hypothesis you made for this part of the experiment. Does the data support or refute your hypothesis? Summarize what can be concluded from the data. Quote your figure to support the conclusions that you make. Your summary should include a discussion on how changing the pH affects the rate of the decomposition of hydrogen peroxide by catalase and why changing the pH affects the reaction rate. 3. List two possible weaknesses and improvements, if any, for this part of the experiment. Biology& 160 Laboratory Manual Mr. Brumbaugh 35 Spring 2014 Application Questions: 1. Hot springs at Yellowstone National Park owe their beautiful color to Cyanobacteria (archaebacteria) that live in these very hot (e.g. ~90oC) pools of water. Predict, and then draw a plot of Reaction Rate vs. Temperature for cyanobacteria. Indicate clearly the shape of the curve, and show quantitatively the optimum temperature. 2. Almost all of the food humans eat is digested by more than a dozen different enzymes in the alkaline environment (about pH 8) of the 6-meter long small intestine. Predict and then draw in the space below a plot of Reaction Rate vs. pH for a typical intestinal enzyme. Indicate clearly the shape of the curve and show quantitatively the optimum pH. 3. Apply what you have learned in this lab exercise to explain why patients with high fevers feel tired and listless. 4. Some individuals who have been submerged in near freezing water for long periods of time (e.g. 30 minutes) have survived. Apply what you have learned in this lab exercise to try to explain why this is possible. Biology& 160 Laboratory Manual Mr. Brumbaugh 36 Spring 2014 5. Roughly one in four people suffer from lactose intolerance. These individuals have a genetic predisposition that results in a deficiency of lactase, the enzyme that digests lactose, the principle sugar found in milk and milk products. Lactase levels usually start to decline when a child is between 18 and 36 months. Ingestion of milk and milk products may then result in cramps, flatulence, and severe diarrhea. Lactaid ™ tablets, a synthetic version of lactase, can be used by individuals suffering from lactose intolerance to digest the lactose in milk before the milk is consumed, thus lowering the production and expulsion of gas, and eliminating diarrhea. The question is although Lactaid ™ tablets contain a very small amount of lactase, why are they very effective in digesting large amounts of lactose? 6. Does anyone know what this figure represents? Biology& 160 Laboratory Manual Mr. Brumbaugh 37 Spring 2014 Page to be used for Cell Biology Doodling Biology& 160 Laboratory Manual Mr. Brumbaugh 38 Spring 2014 Pre-Lab Report Sheet Lab Section: . Enzyme Activity Lab Name: . Before coming to labs carefully read the previous pages on Enzyme Activity then answer these pre-lab questions. Be prepared to hand in your responses to the pre-lab questions at the start of lab. 1. Use your knowledge of chemistry and that of enzyme activity in cells gained by reading the perspectives section to this lab experiment to explain why the rate of enzyme activity is fastest at the start of an enzyme catalyzed reaction and gradually declines as the reaction proceeds? 2. Under what conditions would the rate of enzyme activity (e.g. catalase’s activity) in a cell remain constant and not decline? Explain. 3. Read the procedures for Parts A, B, & C and write a hypothesis for each section then summarize (part A completed) what will be done in each part in the spaces below. Part A. Effect of Enzyme Concentration on Enzyme Function Hypothesis: Biology& 160 Laboratory Manual Mr. Brumbaugh 39 Spring 2014 Summary of the Procedure for Part A (Example) The effect of enzyme concentration on the rate of decomposition of hydrogen peroxide will be investigated by monitoring the pressure of oxygen gas produced with a gas pressure sensor hooked up to a computer. Five test tubes containing aqueous solutions of H2O2 (3.0 ml water and 3.0 ml 3.0 % H2O2 in each tube) will be prepared. After setting up the apparatus as illustrated in figures 45 and (stopper assembly valve open to the atmosphere), add 2 drops of the enzyme suspension to tube #1, stopper immediately, and mix thoroughly. Close the stopper assembly air valve to the atmosphere as in figure 6B, and begin measuring the gas pressure by clicking on the start button. Data will be collected until a linear relationship is observed. The rate of the reaction will then be determined graphically by using computer software as explained by step 12 of the procedure. The above procedure will be repeated using 5 drops of enzyme suspension in tube 2, 10 drops in tube 3, and 15 drops in tube 4, and with no enzyme in tube 5. Part B. Effect of Temperature on Enzyme Function Hypothesis: Summary of the Procedure for Part B Part C. Effect of pH on Enzyme Function Hypothesis: Summary of the Procedure for Part C Biology& 160 Laboratory Manual Mr. Brumbaugh 40 Spring 2014 Lab 3: Microscope Techniques Lab Pre-lab Assignment Before coming to lab carefully read the following pages on Microscope Techniques and Appendices B and D, then answer the pre-lab questions at the end of this lab (pages 59 & 60). Be prepared to hand in your responses to the pre-lab questions at the start of lab. Perspective The Microscope Structure The microscope is one of the principal tools of the biologist. Without the microscope, many of the great discoveries of biology would never have been made. The compound light microscope (Figure 1) is the type of microscope most commonly used. Proper, comfortable use of the instrument demands practice. The practice afforded you in this exercise depends upon familiarity with the parts of the microscope and with their interactions. Ocular: These contain lens that magnify (usually 10x) the specimen. Revolving Nosepiece: Device used to change magnifying lenses (objectives). Objective Lens: Magnifying lenses usually ranging from 4x to 100x (oil immersion lens). Sub-stage Condenser: This adjustable device gathers the light rays from the light source and focuses them onto the specimen stage. Iris Diaphragm: This lever adjusts to control the amount of light shown onto the specimen. Coarse and Fine Focus Knobs: These adjustable knobs are used to focus the specimen. The course focus knob is only used with the 4x objective. Figure 1 Compound Light Microscope A typical compound light microscope used in many biology labs. Microscope Features Magnification is an important attribute of a light microscope. It is important to know how much you are magnifying an object (Why?). To compute the total magnification of any specimen being viewed multiply the power of the eyepiece (ocular lens) by the power of the objective lens Biology& 160 Laboratory Manual Mr. Brumbaugh 41 Spring 2014 being used. For example, if the eyepiece magnifies 10x and the objective lens magnifies 40x, then 10 x 40 gives a total magnification of 400x. The compound microscope has certain limitations. Although the level of magnification is almost limitless, the resolution (or resolving power) is not. Resolution is the ability to discriminate two objects close together as being separate. The human eye can resolve objects about 100 µm apart (note: 1 µm = 1 micrometer = 1 millionth of a meter). Under ideal conditions the compound microscope has a resolution of 0.2 µm. Objects closer than 0.2 µm are seen as a single fused image. Resolving power is determined by the intensity and physical properties of the visible light that enters the microscope. In general, the greater the amount of light delivered to the objective lens, the greater the resolution. The size of the objective lens aperture (opening) decreases with increasing magnification, allowing less light to enter the objective lens. Thus, it is often necessary to increase the light intensity at the higher magnifications. Any microscopic object viewed has depth as well as length and width. While the lens of your eye fully adjusts to focus on an object being viewed and provides you with a three dimensional interpretation, the lenses of a microscope are focused mechanically and can only “see” in two dimensions, length and width. For example, if the specimen you are examining has three layers of cells, you will only be able to focus on one cell layer at a time. In order to perceive the relative depth of a viewed specimen, use the fine adjustment to focus through the object (i.e. the three cell layers) to build a mental three-dimensional picture of your specimen. When you view an object under the microscope you will observe that it lies inside a circular field of view (Field of View). Each different magnification lens has a different sized field of view. If you determine the diameter of the field of view you can estimate the size of an object seen in that field. As you increase the magnification, the field of view (and diameter) gets proportionately smaller. As a consequence, an object that appears small under scanning power may appear large under high power. The actual size of the object did not change only the space in which you placed it for viewing. Part B of the procedure discusses how to determine the diameter of the field of view and how to estimate the size of a specimen viewed with a microscope. Although the oil immersion lens (100x) when used properly offers the ability to view objects at high magnification (1000x), the objects viewed in this lab exercise do not warrant its use. As its name implies, an oil immersion lens requires a drop of immersion oil to be in contact between the lens and the slide for the lens to function effectively. Since immersion oil has the same refractive index as glass, it prevents the scattering of light as light passes from the glass slide to the objective lens (also made of glass). Poor resolution is the result if the immersion lens is used without oil since light will be bent (and thus scattered) as it passes from the slide to air, and then through the objective because air and glass bend light differently as a result of having different refractive indexes. Compound Light Microscope Techniques 1. Care of the Microscope Carry the microscope with both hands, one hand under the base, and the other on the arm. When getting ready to put the microscope away, always return it to the low power or scanning power objective, lower the stage, and wrap the cord securely around the base. It is generally best to clear your lab table of items that are not being used. Never clean microscope lenses with anything other than lens paper. Other papers will scratch the lens. Please inform the instructor of any microscope damage or irregularity in its operation as soon as possible. Do not return a faulty microscope without first informing the instructor. You are responsible for the microscope while you are using it. Treat it with care! Biology& 160 Laboratory Manual Mr. Brumbaugh 42 Spring 2014 2. Getting Started Place the scanning power or the low-power objective (4x) in position over the stage by turning the nosepiece to which the objectives attach. In changing from one objective to another, you will hear a click when the objective is set in proper position. Make certain that the lenses are clean. Dirty lenses will cause a blurring or fogging of the image. The high power and ocular lenses are the lenses that most often get dirty. To clean a microscope lens place a drop of lens cleaning fluid on a piece of lens paper, wipe the lens with a gentle circular motion, and then dry with a fresh piece of lens paper. Plug in the electrical cord to turn on the sub-stage light. If equipped with a light switch, turn it to the on position. If equipped with a rheostat (dimmer switch), dim the light source to a pale yellow color. Raise the condenser (below stage) as high as it will go by turning the sub-stage adjustment knob for maximum light. Do not turn or move the chrome screws under the stage attached to the condenser apparatus as these either hold or adjust the condenser alignment. Open the iris diaphragm the black lever attached to the condenser. When looking through the ocular you should see a white circular field of view that is evenly illuminated. 3. Viewing Objects Make certain that the scanning power objective len (4x) and is clicked properly in place. Lower the stage away from the objective len with the coarse adjustment knob. Place a prepared slide by opening the slide holding apparatus on the stage and placing the slide into the apparatus so that is secured against the back edge of the apparatus. Move part of the slide with the object to be viewed directly above the brightly illuminated sub-stage condenser. Viewing the stage from the side, use the coarse adjustment knob to raise the stage until the stop prevents raising the stage further. Looking through the eyepieces (ocular) lower the stage slowly by turning the coarse adjustment knob away from you until the object is in focus. It should take less than a quarter of a turn to bring the image into focus. When it is difficult to find a specimen to focus on (e.g. when examining amoeba), bring the edge of the cover slip into the center of the field of view, and then try focusing on the edge. Then search the slide for the desired specimen. Use the fine adjustment to bring the object into sharp focus. Adjust the amount of light with the iris diaphragm and intensity of light with the condenser for optimum viewing. Too much or too little light adversely affects the quality and contrast of the image viewed! 4. Changing the Objectives Ensure that the object you want to view at a higher magnification is in the center of the field of view (Why?) and sharply focus the object. Switch to the next highest power objective by grasping the nosepiece (not the objective lenses) and turning until the new objective is over the stage and clicked into position. Watch from the side of the stage to ensure that the objective lens does not touch the slide. Since most microscopes are par focal the object should be in focus or almost in focus after the change of objectives. Par focal means that little refocusing is needed when moving from one lens to another. Only fine adjustments may be required. Only use the fine adjustment at high power! To avoid damaging the lens, never use the coarse adjustment when the high-power objective is in place. Biology& 160 Laboratory Manual Mr. Brumbaugh 43 Spring 2014 Adjust the amount and intensity of light for optimum viewing. The amount of light may need to be increased since less light passes through the objective at higher magnification. The working distance is the distance between the specimen viewed and the objective lens of the microscope. As you increase magnification the working distance becomes less and less. The objective will be almost touching the cover slip when properly focused at high power. 5. Preparing a Wet Mount Slide Place a drop of dH2O on a clean slide with a dropper. Put the object in the water drop. Lower one edge of the cover slip to the edge of the water drop as shown in the illustration (Figure 2). Lower the cover slip slowly to avoid air bubbles. A gentle tapping will usually remove any bubbles that may be present. Blot any excess water with a paper towel. More water can be added with a dropper at the edge of the cover slip. Do not let your specimen dry out. Figure 2 Wet Mount Preparation This figure demonstrates the correct techniquefor making a wet mount slide. 6. Removing the Slide from the Stage Switch the objective to the scanning lens (4x). Lower the stage using the coarse adjustment, open the slide holder, and remove the slide. Disposal of Wet Mounts: Discard the plastic cover slips in the trash, wash the slide with soap and rinse the slide with tap water, rinse a second time using dH2O, and then place the slide to dry on the towel labeled “Wet Clean Slides” on the instructor’s table at the back of the lab. Prepared slides: Return to their proper location within the plastic slide container on the lab supplies cart. Microscope Techniques Exercise Goals of Lab Exercise To identify and use the various parts of a compounged light microscope To understand and learn how to calculate microscope field diameters and estimate specimen size To learn proper techniques when using a compound light microscope To learn and apply the steps to make to successfully make microscope slides Procedure Important! This can be a time consuming laboratory activity and to use your lab time efficiently read the following procedure before attending lab. I. Microscope Operation Biology& 160 Laboratory Manual Mr. Brumbaugh 44 Spring 2014 Introduction Read the previous pages to familiarize yourself with the basic operation of a compound light microscope. There are multiple tasks in this laboratory, work together to complete all of the sections and the Report Sheet. Turn in the Report Sheet next week as a team. Materials Common Use Items on the Center Table Lens Paper and Lens cleaning solution Metric Rulers Clean microscope slides Cover slips Eye droppers Dropper bottle of water Forceps (tweezers) Scissors Part A. Observation of a Newsprint Letter Introduction In this exercise you will learn to use the microscope to examine a familiar object, a selfprepared slide of a newsprint letter. Refer to the previous sections to make and view a wet mount of a letter cut from newsprint. Practice adjusting your microscope to become proficient in locating a specimen, focusing clearly, and adjusting the light for optimum viewing. Materials needed for Part A Microscope slide and cover slip Procedure Newsprint letter Compound light microscope (Perform individually or in teams) 1. Using Table 1 (page 56) record the magnification of each of your microscope’s objectives lenses and the ocular lenses. 2. Determine and then record in Table 1 the total magnification when using each objective. 3. Make a wet mount of a lower case letter that you have cut from a newspaper. 4. Place the wet mount of the letter on the stage of the microscope so that the letter is right side up as you look at the slide of the letter with the naked eye from behind the microscope. 5. Observe under scanning power (i.e. the lowest power objective, 4x), and then low power (10x objective). Keeping the image of the letter within the field of view, use the slide adjustment knobs to move the stage from left and then to the right. Now move it away from you and then towards you. 6. Observe under high power. Don’t forget to adjust the light intensity with the diaphragm and the condenser to get optimum viewing conditions after changing objectives. 7. Answer questions 1 through 11 on pages 55 and 56 of the Report Sheet. 8. Clean your slides with soap, water, and rinse with dH2O, dispose of the cover slip in the trash, and return the slides to drying paper. Part B. Determining the Size of the Microscope Field of View Introduction Often the size of the objects you are observing under the microscope need to be estimated. Because these objects are usually too small to permit direct measurement, it will be convenient for you to learn a method to indirectly measure them. Measurement of the diameter of the field of view for the different objective magnifications will enable you to estimate the size of the things viewed under the microscope. Materials needed for Part B Compound Light Microscope Biology& 160 Laboratory Manual Mr. Brumbaugh Plastic Metric Ruler 45 Spring 2014 Procedure (Perform individually or in teams) 1. Using the scanning objective (4x objective), place a graduated edge of a plastic metric ruler across the mid-line (diameter) of the field of vision (Figure 3). Bring the edge of the ruler into focus. Record in Table 1 the diameter in both millimeters (mm) and in micrometers (µm), the most common units of measurement in microscope work. The following relationships are useful when converting between micrometers and millimeters: 1 mm = 1000µm 1 µm = 0.001 mm Field of View App. 4.5 mm Metric Ruler (mm) Figure 3 Microscope Field Diameter Measurement Hypothetical determination of the diameter of the field of view with a metric ruler. 2. Calculate the diameter of the field of view for the other objectives of your microscope and record your results in Table 1. How to Calculate the Diameter of the Field of View at Higher Magnifications: Once you have experimentally determined the diameter of the field of view for the scanning and/or low powers you can calculate the diameters of the fields of view for the rest of the objective lenses. Recall that the diameter of the field of view gets proportionately smaller as the magnification increases. If, for example, the diameter of the field of view were 3.0 mm at a total magnification of 20x, the diameter of the field of view at 100x would be 5 times less, i.e. 0.6 mm or 600 µm. Why? 100x is five times greater than 20x, thus the field of view at 100x must be 5 times less: 3.0 mm/5 = 0.6 mm, which equals 600 µm. Once you know the field of view diameter, you should be able to estimate the size of any organism found within that field. See questions 6-8 in the Pre-lab Exercises to get some practice calculating field diameters and estimating the sizes of critters viewed with a microscope. 3. Use this information to answer questions 12 through 17 on page56 and 57 as a group. Part C. Depth Perception: Depth of Field Introduction It is important to remember that by using the coarse and fine adjustments you bring the microscope into focus at many different levels. At each setting you can see clearly only one plane of the object. To see other planes clearly, e.g. to see different layers of cells in a sample of tissue, you must change the focus with the fine adjustment. Materials for Part C Compound Light Microscope Prepared slide of crossed threads Procedure (Perform individually or in teams) 1. Obtain a prepared slide with three colored crossed threads. Biology& 160 Laboratory Manual Mr. Brumbaugh 46 Spring 2014 2. How many threads can you bring into focus simultaneously using the scanning objective? 3. Repeat with the low power objective (10x), and finally with the high power objective (40x). Don’t forget to adjust the diaphragm and the condenser to get optimum viewing conditions after changing objectives. Use this information to answer question 18 on page 57 of the report sheet as a group. II. Viewing Living Cells Introduction In the following exercises you will observe the cell structures that are common to all eukaryotic cells: plasma membrane (also known as a cell membrane), nucleus (a membrane bound structure that contains the genetic material), and the gelatinous cytoplasm (the area of the cell between the plasma membrane and the nucleus; all other cell organelles float within the cytoplasm). However, all cells are not alike. The organelles found within a specific cell are dependent on the function of the cell. Likewise, the functions of a cell are dependent upon the organelles present! Moreover, some organisms are unicellular (composed of one cell) with all living functions (e.g. digestion, respiration, excretion, reproduction, etc.) performed by the organelles in that one cell. Other organisms are aggregates (random, temporary, or clusters) of cells. Organisms that are a permanent cluster containing predictable and consistent number of cells are called colonies. Simple colonies have no physiological inter-connection but maintain a predictable multicellular structure. Complex colonies have cells that are physiologically inter-connected, with moderate specialization of groups of cells. Multicellular organisms have large numbers of cells with specialized structure and function. In a multicelled organism, no one cell can exist by itself for long since it is dependent on other cells, tissues, and organs to carry out the many life processes that it by itself cannot perform. There is strong evidence that suggests that the first organisms to evolve were unicellular organisms, from which evolved all of the more complex forms of life: aggregates, colonial organisms, and the multicellular forms of life. Part A. Viewing Unicellular Eukaryotic Organisms: Paramecium caudatum and Amoeba proteus Introduction Unicellular eukaryotic organisms are found in the Kingdom Protista. Organisms in Kingdom Protista are either photosynthetic autotrophs (can make their own food via photosynthesis) and/or heterotrophs (obtain food their food by the consumption of other organisms or their byproducts). In this part you will observe the following heterotrophic protists: Paramecium caudatum and Amoeba proteus, commonly found in freshwater ponds. Paramecium caudatum (Figure 4) are free moving organism for the most part which use a covering of cilia beating in unison to move forward or backward (for a short time if they happen to run into an object) to attack prey. The cilia are support by a thickened material which lies just inside the cell membrane called the pellicle. Their prey is most commonly bacteria but they can also ingest some forms of algae. Food is moved toward a mouth like structure by the cilia that is found within what is called the oral goove that runs along the one side of the organism where it is engulfed and moved to the “gullet” area of the cells body. Food is then distributed throughout the cell’s body via a vacuole tht serves as a transporter and a digester or sorts. The vacuole empties as it moves through the cell and eventually reaches an “anal pore” where it is eliminated. Some Paramecium can live as symbionts Biology& 160 Laboratory Manual Mr. Brumbaugh 47 Spring 2014 with other organisms where it is thought that they are afforded some protection and support by their symbiont. These simple single celled organisms do practice osmoregulation via a contractile vacuoles that can fill with water and other molecules (like ???) and contracted to to empty and refill to rergulate their solvent to solute ratios. Figure 4 Parmecium Diagram and Image The picture is a representative of the Genus Paramecium and can be used to show the basic cellular structures. Images and Drawings courtesy of http://8fb80e.medialib.glogster.com/media/018b6f15a6558aa512ad51f8491d896b7829f4894929bed0d0f80 c21faa9250b/paramecium-labelled.jpg and http://www.savalli.us/BIO385/Diversity/01.ProtozoaImages/ParameciumLabel.jpg Amoeba (Figure 5) uses a strategy called amoeboid movement to get around its environment. This movement is characterized as a sort of oozing of the cytoplasmic material within the organisms cell membrane in one direction after anchoring it membrane to intracellular fibers at two locations. Once anchored the free flowing cytoplasm pushes the untethered membrane forward and the rest of the cell follows. By extending these “pseudopodia” (false feet) the cell releases the anchors and the rest of the membrane “catches up”. Notice the similarities and dissimilarities of strucutres between these two protists. Both are quite successful in their strategy for life and have carved out niches for themselves in the same habitat. When examining these organisms ask your selves questions about their existence and what makes them successful and do these organisms move purposefully and if they do what is the stimulus to get them to move in a particular direction? Figure 4 Amoeba Diagram and Image The shape of an amoeba constantly changes as it uses pseudopodia to both move and ingest food by phagocytosis (Latin for “cell feeding”). . Images and Drawings courtesy of http://www.sridianti.com/cdn/wp-content/uploads/2011/07/struktur-amoeba.jpg and http://microbewiki.kenyon.edu/images/thumb/1/18/Amoeba_2.jpg/400px-Amoeba_2.jpg Materials for this Exercise Compound Light Microscope Lab Notebook Procedure Clean microscope slides Paramecium cultures Cover slips Amoeba cultures (Perform in teams of two) 1. Prepare a wet mount of an Paramecium and follow steps 2 - 7 and 13, while your partner prepares a wet mount of Amoeba and follows steps 8 - 13. Share the slides. Biology& 160 Laboratory Manual Mr. Brumbaugh 48 Spring 2014 2. Place the Paramecium culture under the dissecting microscope and note the Paramecium swimming freely in the culture container. They are fast so wait for them to come into the field of view and shift the light source switch from illuminating from below to above and note any behavioral changes in the Paramecium. 3. Use the pipette labeled for use with this culture to transfer a drop of several Paramecium to a clean slide and cover with a clean cover slip. They are usually along the bottom of the container 4. Use low or scanning power of your compound microscope to scan the entire slide to locate an Paramecium. They are often found near debris and other protists on which they feed. If you have troubles finding an Paramecium make a fresh slide and/or consult your instructor and/or other students for help. Use the diaphragm and/or condenser to create contrast (i.e. significantly decrease the amount of light). 5. Center the Paramecium in the field of view, then switch to high power. 6. Make an accurate sketch of your Paramecium (Figure 4) on a separate sheet of paper at high power. Label the drawing with a figure legend (figure number, title, and description) and including the magnification and scale. 7. Identify and neatly label on your sketch the following structures: Plasma membrane, Cilia, Cytoplasm, Nucleus, Contractile vacuole(s), Food vacuole, Oral Groove, Gullet, and Pellicle. 8. Place the Amoeba culture under the dissecting microscope and focus on the bottom of the dish. The Amoeba should appear as a light, irregular shaped organism on the bottom of the container. Shift the light source switch from illuminating from below to above and note any behavioral changes in the Amoeba. 9. Use the pipette labeled for use with this culture to transfer a drop of several Amoeba to a clean slide and cover with a clean cover slip. They are usually along the bottom of the container. 10. Use low or scanning power of your compound microscope to scan the entire slide to locate an Amoeba. They are often found near debris and other protists on which they feed. If you have troubles finding an Amoeba make a fresh slide and/or consult your instructor and/or other students for help. Use the diaphragm and/or condenser to create contrast (i.e. significantly decrease the amount of light). 11. Make an accurate sketch of your Amoeba (Figure 5) on a separate sheet of paper at high power. Label the drawing with a figure legend (figure number, title, and description) and including the magnification and scale. 12. Identify and neatly label on your sketch the following structures: Plasma membrane, Cytoplasm, Nucleus, Contractile vacuole(s) (used to osmoregulate water and solute inside the cell), Food vacuole, and Pseudopodia or “false feet” used during the process of motility and phagocytosis (literally: cell eating or feeding). 13. Clean your slides with soap, water, and rinse with dH2O, dispose of the cover slip in the trash, and return the slides to drying paper. 14. Turn in drawings with the report sheet pages next week as a group report. Part B. Viewing Aggregate and colonial Eukaryotic Organisms: Scenedesmus and Volvox. Introduction In contrast to unicellular organisms, colonial organisms are critters consisting of a group of cells that are to a small extent dependent upon one another. The organisms observed in this part of the lab Scenedesmus and Volvox show although, not obvious, an increasing degree of interaction and dependence on their constituent cells. What kinds of interactions do you think would benefit Biology& 160 Laboratory Manual Mr. Brumbaugh 49 Spring 2014 the cells by forming a interaction? Refer to the captions and illustrations of Figures 5 and 6 as you observe these organisms under the microscope. Figure 5 Scenedesmus Diagram and Image Scenedesmus is an aquatic algae commonly found in polluted water and in aquaria. It is a simple colony often consisting of four to eight cells that are permanently united by their cellulose cell walls. Although not visible under normal conditions, the plasma membrane is located just inside the cell wall. . Images and Drawings courtesy of http://cronodon.com/images/Scenedesmus_labeled.jpg and http://www.dr-ralfwagner.de/Bilder/Scenedesmus_quadricauda-PH.jpg Figure 6 Volvox Diagram and Image Volvox is an aquatic alga commonly found in ponds, lakes, and aquaria. It is a complex colony of 500 to 500,000 cells (depending on the species) that are permanently interconnected by cytoplasmic strands to form a spherical colony. Often found on Volvox colonies are daughter colonies, small clusters of cells that will eventually leave the parent colony to form an independent colony. . Images and Drawings courtesy of http://www.photomacrography.net/forum/userpix/569_NUM10061_1.jpg Materials for this Exercise Compound Light Microscope Clean microscope and Depression slides Procedure Cover slips Dissecting Light Microscope Volvox Cultures Scenedesmus Cultures (Perform in teams) 1. Prepare a wet mount of an Scenedesmus and follow steps 2 - 5 and 11, while your partner prepares a wet mount of Volvox and follows steps 6 - 11. Share the slides. 2. Use the pipette labeled “Scenedesmus” to obtain a drop from the Scenedesmus culture. Place the drop on a clean microscope slide and cover with a clean cover slip. 3. Observe under low and then with high power. 4. Make an accurate sketch on the drawing paper of Scenedesmus (Figure 5). Label the drawing with a figure legend (figure number, title, and description) and including the magnification and scale. 5. Identify and neatly label on your sketch the following structures: Cell Wall, Plasma membrane, Cytoplasm, Nucleus, Vacuole (sugar storage container), Chloroplast Biology& 160 Laboratory Manual Mr. Brumbaugh 50 Spring 2014 (photosynthetic organelle), Spines (transparent projections found at each end of the colony), and any other cell structures that may be visible. 6. Use the pipette labeled “Volvox” to obtain a drop from the Volvox culture. Place the drop on a clean depression slide and cover with a clean cover slip. A depression slide is used to prevent the rather large colony from being crushed by the cover slip. 7. Observe under low and then with high power. 8. Make an accurate sketch on the paper of a Volvox colony (Figure 6). Label the drawing with a figure legend (figure number, title, and description) and including the magnification and scale. 9. Identify an individual cell and neatly label on your sketch the following structures: Cell Wall, Plasma membrane, Cytoplasm, Flagella, Vacuole, Chloroplast, Nucleus, Cytoplasmic strand (Interconnections between adjacent cells of the colony), Daughter Colonies (Small spherical clusters of cells that are formed by the asexual reproduction of the colony’s cells; eventually released from the colony to form a new colony), and any other cell structures that may be visible. 10. Clean your slides with soap, water, and rinse with dH2O, dispose of the cover slips in the trash, and return the slides to the drying paper. 11. Turn in drawings with the report sheet pages next week as a group report. Part C. Viewing Multicelled Eukaryotic Organisms: Daphnia magna & Spirogyra Cells Introduction Multicellular organisms have evolved greater structural complexity by combining cells into larger units: Tissues, organs, and organ systems. In short, there is a division of labor between many tissues and organs to carry out all of the life processes that normally occur in “simple” unicellular organism! The cells of multicellular organisms are specialized to carry out a specific function. A tissue (e.g. Muscle tissue) consists of a many cells of a similar type that work together to perform a common function. Different types of tissues are organized together to form functional units called organs (e.g. The heart consists of cardiac muscle tissue, nervous tissue, vascular tissue, epithelial tissue, etc.). Organ systems consist of different organs operating together to perform various tasks (e.g. the digestive system involves several organs cooperating with each other: Liver, gall bladder, stomach, large and small intestines, etc.). The multicelled organisms we will look at today in lab come from the kingdoms of Protistan and Animalia. The Spirogyra (Figure 7) is a multicelled protistan that lives in most freashwater ponds as photoautotrophs floating freely in the quite areas of freashwater ponds, streasm, or lakes. They are recognized most often as clumps of green threads gently floating near the surface of the water. Many fish and other amaller heterotrophs feed on their numbers, but left unchecked they can gwor as large mats of ehse thin threads mingled together. The animal example is a small crustacean called Daphnia magna. Crustaceans are multicelled members of the animal phylum called arthropoda which also includes the insects, millipeds, and centipeds as well as the crustaceans. You should be able to visualize a number of organs and delineate their organ systems in these small transparent animals. Biology& 160 Laboratory Manual Mr. Brumbaugh 51 Spring 2014 Figure 7 Spyrogyra Diagram and Image Note the strucutres of the Spyrogyra on the Drawing and then the actual strucutres on the image. . Images and Drawings courtesy of http://cronodon.com/images/Spirogyra_diagram_labeled.jpg and http://protist.i.hosei.ac.jp/pdb/images/Chlorophyta/Spirogyra/group_B/sp_03.jpg Figure 8 Daphnia magnus Diagram and Image Note the strucutres of the Daphnia magnus on the Drawing and then the actual strucutres on the image. . Images and Drawings courtesy of http://art.biev.net/archives/358 and Image from a former student Materials for this Exercise Compound Light Microscope Clean Microscope and Depression slides Procedure Cover slips Transfer Pipette Freshwater algae: Spirogyra Freshwater animal: Daphnia magna (Perform in teams) 1. Prepare a wet mount of an Spirogyra and follow steps 2 - 4 and 8, while your partner prepares a wet mount of Daphnia magna and follows steps 5 - 8. Share the slides. 2. Use a transfer pipette to place a sample of the freshwater algae, Spirogyra, on a clean slide, cover with cover slip, and observe with low and high power. 3. Make an accurate sketch on the paper of a strand of Spirogyra. Label the drawing with a figure legend (figure number, title, and description) and including the magnification and scale. 4. Identify and neatly label on your sketch the following structures: Cell Wall, Cytoplasm, Chloroplast, Vacuole, Nucleus, and any other cell structures that may be visible. 5. Use a pipette to place a sample of the freshwater crustacean, Daphnia magna, on a clean depression slide, cover with cover slip, and observe with low and high power. 6. Make an accurate sketch on the paper of a strand of Daphnia magna. Label the drawing with a figure legend (figure number, title, and description) and including the magnification and scale. 7. Identify and neatly label on your sketch the following structures: Compound Eye, Carapace (outer ectoskeleton), Antennae, Swimming Legs, Heart, Intestine, Anus, Mouth, and any other cell structures that may be visible. 8. Clean your slides with soap, water, and rinse with dH2O, dispose of the cover slips in the trash, and return the slides to drying paper. Biology& 160 Laboratory Manual Mr. Brumbaugh 52 Spring 2014 III. Clean Up Introduction Remember a clean lab is a happy lab and one that captures all the points. Materials for this Exercise Sink Elbow Grease Procedure Soap Drying Techniques Running Water (Perform in teams) 1. Clean your slides with soap, water, and rinse with dH2O and dispose of the cover slip in the trash, and place them on the drying paper. 2. Dispose of used plastic cover slips properly into the trash or take them home to retile your bathroom spaces. Dispose of glass cover slips in the broken glass box in the front of lab. 3. Rotate the nosepiece of your microscope to low power, wind-up the cord around the base of the neck, ensure the microscope is clean and dry, and then return it to the cabinet. 4. Clean and dry your lab table. 5. Make sure the lab supply carts are neat, clean, orderly, and happy. Biology& 160 Laboratory Manual Mr. Brumbaugh 53 Spring 2014 Page to be used for Cell Biology Doodling Biology& 160 Laboratory Manual Mr. Brumbaugh 54 Spring 2014 Report Sheet Lab Section: . Microscope Techniques Exercise Group Names: Note: . . . . Perform procedures that can only be done in the lab before doing procedures or answering questions that can be performed outside of the biology laboratory! 1. Using low-power (4x) compare the position and orientation of the image of the letter as seen through the ocular with the position of the letter as seen on the slide without using the microscope. What two orientation differences of the image are there compared to looking at the object with the naked eye? In the circle below use a sharp pencil to make a simple sketch of the letter as viewed under lowpower. Letter viewed at magnification x 2. While looking through the oculars slowly move the slide away from you and then towards you by using the stage control knobs. Which way does the image move? (Place answer here) 3. While looking through the oculars, slowly move the slide from right to left using the stage control knobs. Which way does the image move? (Place answer here) 4. Make a rough estimate of how much of the letter is visible when viewed under high power? (Give a percent based on the differences in the size of the field of views) (Place answer here) 5. Does the switch from low power (4x) to high power 40x) change the position of the image? (Place answer here) 6. Why is it necessary to center your object (or the position of the slide you wish to view) before changing to high power (40x)? (Place answer here) 7. Under high power (40x) is the illumination brighter or less bright than it is with low power? (Place answer here) 8. Move the iris diaphragm lever in each direction while observing the field. What happens? (Place answer here) Biology& 160 Laboratory Manual Mr. Brumbaugh 55 Spring 2014 9. Is it more desirable to increase or decrease the light when changing to a higher magnification? (Place answer here) 10. What is the approximate actual height in millimeters and microns (µm) of your letter? Height = mm = µm (Place answers here) 11. Fill in Table 1. Low Power Magnification of Objective Lens Total Magnification Field Size (diameter) Field Size (diameter) Medium Power High Power Oil Immersion x x x x x x x x mm mm mm mm µm µm µm µm Table 1 Part B and C Data Fill out this table to show the Magnification and Field Size dimensions for your microscope. Use the following hypothetical data for the following four microscopes to answer questions 12 – 13 below. Microscope Number 1 2 3 4 Objective Lens Ocular Lens 25X 15X 20X 40X 5X 10X 10X 5X 12. If a slide showing the same types of living organisms is examined with each of the microscopes, in which two microscopes will the microbes appear to move with the same degree of rapidity? Record the microscope number on the line below. (Place answer here) 13. Given that each slide had the same density of microbes, with which microscope would you expect to observe the greatest number of microbes at any given instant? (Place answer here) 14. What is meant by resolution (resolving power), magnification and depth of field of a microscope? Biology& 160 Laboratory Manual Mr. Brumbaugh 56 Spring 2014 15. A hypothetical microscope you are using has the following objective magnifications: low power objective 3x, medium power objective 12x and high power objective 30x. If the diameter of the low power objective field is 6000 µm (micrometers), what is the diameter of the field of view at medium power in micrometers. Show your work below. Work: Answer: 16. You observe an object whose length is 1/4 the diameter of the high power field of view of the hypothetical microscope in #15 above. What is its length in micrometers? Show your work below. Work: Answer: 17. Calculate the length of the following microscopic objects. For credit show how you arrived at your answers in the spaces provided. Base your calculations on the following field sizes: Low power: 4.5 mm; Medium power: 1.9 mm; High power: 0.45 mm a. Object seen in low power field: A B Estimated length: µm A b. Object seen in medium power field: B Estimated length: µm C c. Object seen in high power field: C Estimated length: µm 18. Suppose a slide were set up with Yellow, Blue, and Red threads that cross at a single, which thread would come into focus first if you positioned the stage as close to the low power objective lens as possible and then brought the slide into focus? Circle the letter of the correct response. A. Yellow first B. Blue first C. Red first. D. All three colors at once. Biology& 160 Laboratory Manual Mr. Brumbaugh 57 Spring 2014 Page to be used for Cell Biology Doodling Biology& 160 Laboratory Manual Mr. Brumbaugh 58 Spring 2014 Pre-Lab Report Sheet Lab Section: . Microscope Techniques Exercise Name: . Before coming to lab carefully read the previous pages on Microscope Techniques then answer these pre-lab questions. Be prepared to hand in your responses to the pre-lab questions at the start of lab. A.Why is it necessary to center your object (or the position of the slide you wish to view) before changing to high power? Complete the table below and use the data to answer questions B and C. Microscope Number 1 2 3 4 Objective Lens 25x 15x 20x 40x Ocular Lens 5x 10x 10x 5x Total Magnification B. Given that each slide had the same density of microbes, with which microscope would you expect to observe the greatest number of microbes at any given instant? Why? C. If a slide showing the same organism is examined with each of the microscopes, above, with which two microscopes will the microbe appear to move with the same degree of rapidity? Why? microscope will it appear to move the slowest? Why? D.What is meant by resolution (resolving power) of a microscope? E. After switching from one objective to another, why is it often necessary to readjust the diaphragm and the condenser? Biology& 160 Laboratory Manual Mr. Brumbaugh 59 Spring 2014 Use the data in the table below for a hypothetical microscope to answer questions F - H. Objective Used Low power Medium power High power Oil immersion Total Magnification 30x 150x 300x 1500x Diameter of Field of View 6000µm F. Calculate the diameter of the field of view at medium, high, and oil immersion. Record your answers in the table above, and show and/or explain your work below. G. You observe an object whose length is 1/4 the diameter of the medium power field of view of the hypothetical microscope in the table above. What is its length in microns? ____________ in millimeters, mm? _______________. Show and/or explain your work below. Biology& 160 Laboratory Manual Mr. Brumbaugh 60 Spring 2014 Lab 4: Cellular Diversity Pre-lab Assignment Before coming to lab carefully read the pages on Cellular Diversity and Appendices B and D, then answer the pre-lab questions (page 71). Be prepared to hand in your responses to the pre-lab questions at the start of lab. Perspectives With the advent of the microscope a strange new world opened to scientist of the late 1600’s. The life of tiny organisms suddenly came into view. An early British microcopist named Robert Hooke coined a term “cellulae” to describe the structures he viewed with his simple microscope. This new tool helped to call into question long held beliefs about the structure of the various organisms that inhabited the earth. Linnaeus classified organisms, but he only dealt with two kingdoms (Which ones?). The microscope revealed that these organisms contained thousands of smaller structures apparently working together for the organism to maintain its life, plus they discovered thousands of single celled organisms termed “Animamicules” in what seemed to be clean water. Today we divide organisms into five kingdoms: Monera, Protistan (algae and protozoans), Fungi, Plantae, and Animalia. In the mid 1800’s, a zoologist (Theodore Schwann) and a botanist (Matthus Schleiden) proposed the first two points of what is known as the Cell Theory of Life. Their two main points were: 1) all living organisms are made of cells, and 2) the cell is the smallest unit of life. Twelve years later Rudolf Virchow disproved a long held belief that living organisms spontaneously generated from inanimate objects and proposed that cells can only arise from pre-existing cells. Another critical development in the study of cells was the advent of harvesting various dyes of plant pigment molecules, heavy metals, and such to stain the various cellular parts to further increase the contrast of a cells various molecular parts. Today we have added using radiolabelled dyes and antibody labeled markers to yield even more specific contrast to further elucidate the structure/function relationship found within cells. Cells can be defined as groups of macromolecules contained by a membrane that are organized to perform specific functions for the “cell” or the cell is the smallest level of organization that can be considered to be alive. There are two primary types of cells: prokaryotic and eukaryotic. Prokaryotic (pro = before) cells are the more primitive type, and their most distinguishing feature is the lack of a nucleus and all other membranous (membrane bound) organelles. In bacteria and other prokaryotic cells, the DNA and other molecules are free floating in the gelatinous cytoplasm. There are 3 primary types of bacterial cells, which are differentiated based upon their shape. A bacillus (pl. bacilli) is rod-shaped, a coccus (pl. cocci) is spherical and a cell that is spiral shaped is called a spirellum (pl. spirelli). We will be examining bacterial cells of all three shapes in this lab. Eukaryotic cells have evolved many specialized internal structures called organelles (“little organs”). Most organelles are membranous, though a few are not. Organelles provide separate areas or compartments for all of the different reactions and processes that are required to maintain a living cell/organism. Organelles fall into 4 basic categories: manufacture (nucleus, endoplasmic reticulum (s and r), and Golgi apparatus), breakdown (lysosomes and peroxisomes), energy processing (mitochondria and chloroplasts) & support (cell membrane, cilia, flagella, and various vacuoles (containers)). All protistan, fungal, plant, and animal cells are eukaryotic. In your microscopy lab, you observed several examples of eukaryotes, including algae. This group of organisms includes both photosynthetic (use sunlight energy to generate organic molecules) and heterotrophic (need to ingest most organic molecules) members of Kingdom Biology& 160 Laboratory Manual Mr. Brumbaugh 61 Spring 2014 Protista. About one third of the members contain chloroplasts making them photosynthetic. Euglena is a member of Kingdom Protista containing chloroplasts. In most other ways, however, euglenoids are unlike other green algae. They do not have cell walls. Their cells have a proteinaceous structure immediately below the plasma membrane (pellicle) that provides shape while allowing for flexibility. Euglenoids store food (as starch) in an organelle called the paramylon, which is usually suspended in the cytoplasm. Euglenoids may have an anterior eye spot. We will examine Euglena (Figure 1) in this lab as a representative of the very diverse Kingdom Protista. Figure 1 Image and Diagram of a Euglena This figure shows the labeled parts of a protistan called a Euglena. http://bio1151.nicerweb.com/Locked/media/ch28/28_07Euglena-L.jpg As we move into the other kingdoms of the eukaryotic world we start with the Kindgom Fungi. Historically fungi were considered to be plants. Molecular and structural evidence, however, indicate that they are actually more closely allied with the animals. Fungi are all heterotrophic, and live either as saprophytes (organisms that decopose other organisms), parasites (organisms which exist by utilizing another organism), or in mutualistic (organisms living in a way that benefits both organisms) partnerships with other organisms mainly plants. Fungi have cell walls made of chitin and, with the exception of some unicellular species, have bodies composed of filaments called hyphae. Masses of hyphae are called a mycelium. In today’s lab we will examine two common types of Fungi, Penicillium (Figure 2) and yeast. Penicillium will have extensions on the ends of some mycelia called conidiophores (broom shaped structures for reproduction) that contain conidia (reproductive cells). Have you ever left an orange in the refrigerator so long that it turns blue and fuzzy? The blue fuzz is a fungus called Penicillium. The blue coloration is due to a type of asexual spore called conidia. Members of this genus are the source of penicillin, the first antibiotic to be identified and used in medicine. This genus also puts the “blue” in blue cheese. Spores are single cells that are dispersed by the parent fungus as a means of asexual reproduction. In fungi, these spores (conidia) are produced in special structures called conidiophores. Yeast (Saccharomyces cerevisiae) is a single-celled fungus that is added to bread dough to make it rise or used to ferment sugars into alcohol. Although yeast can reproduce sexually, they can also reproduce asexually in a process called budding. Biology& 160 Laboratory Manual Mr. Brumbaugh 62 Spring 2014 Figure 2 Diagram and Image of Penicillium Structure This diagram and picture shows the structure of the fungus Penicillium. http://chicora.org/images/mold_drawing.jpg and http://faculty.clintoncc.suny.edu/faculty/michael.gregory/files/bio%20102/bio%20102%20lectures/fungi/pe nicillium_conidia_X_400.jpg We will look next at a representative of the plant Kingdom; Elodea canadensis (Figure 3). It is a freshwater aquatic plant. It is native to North America but is an invasive species in most of the rest of the world. Elodea spends most of its life cycle entirely underwater, providing habitat for many protists and aquatic insects. Figure 3 Elodea canadensis This figure shows a representative sample of Elodea canadensis. http://upload.wikimedia.org/wikipedia/commons/e/ec/Elodea_canadensis.jpeg There is an extremely intimate connection between structure and function when discussing living organisms. This is true at all levels of organization, but it is extremely striking at the cellular level (remember that structure determines function, change the structure and you change the function). Complex multicelluled organisms have developed differentiation of cells (a process that changes the access of gene sequences for different cells) based upon their function. Cells that do a particular function have a structure that best allows them to do that function. In this lab we will be looking at the following human cell types (the number in parentheses is the total magnification under which you are to view each specimen): Blood (400X), Neurons (400X), Bone (400X), and Skelelal Muscle (400X). These cells will represent Kingdom Animalia in this lab. With these cells we will attempt to uncover the relationship between structure and function. Biology& 160 Laboratory Manual Mr. Brumbaugh 63 Spring 2014 Cell Diversity Exercise Goals of Lab Exercise Demonstrate competency with utilizing a light microscope including the visualization of both prokaryotic and eukaryotic cells Compare and contrast prokaryotic and eukaryotic cell structures Describe the structure of the major cell organelles and discuss how that structure facilitates the organelle’s specific functions Demonstrate slide preparation, size estimation of microscopic samples, and identification of stained and unstained structures Introduction The wide diverisity if cells relates to the varied types of habitats and niches which can be found in the environment. The development of the microscope opened the ability to view a wide range of cell strategies from the single celled to the multicelled organism. Development of the skillful use of a compound light microscope is one of the primary tools used by cell biologists. Procedure Materials Common Use Items on the Center Table Compound Light Microscope Metric Rulers Clean microscope slides Cover slips Prepared specimen slides Dropper bottle of water Janus Green Stain Scissors Elodea samples Part A: Prokaryotic Cells – Domain Bacteria and Archeabacteris I. Kingdom Monera 1. Obtain a slide of mixed bacteria from the slide box on your table and do a computer search for images of bacteria shapes. 2. Using oil immersion techniques locate a representative of each of the three types of bacterial shapes (bacilli, cocci, and spirelli). 3. On a separate sheet of paper make a drawing of each type of prokaryotic cell using oil immersion (1000X) magnification. Label each drawing with a figure legend (figure number, title, and description) and including the magnification and scale. 4. Answer questions 1 through 4 on your Report Sheet (page 67) to be turned in individually next week. Part B: Domain Eukarya I. Kingdom Protista 1. Place a drop of Euglena culture on a clean slide with a cover slip. Observe individual motile cells carefully at 400X. Make sure that the iris diaphragm is wide open, allowing the most light through. If the Euglena is not moving, let them sit on the slide for 3-5 minutes. The heat from the light will wake them up! Make a sketch of one Euglena on a separate sheet of paper as above. Be sure to label the cell membrane, nucleus, vacuoles (food and contractile), chloroplasts, eye spot, and flagellum. The eye spot is a tiny red dot and the flagellum will appear as a quivering on one end of the cell. Label each drawing with a figure Biology& 160 Laboratory Manual Mr. Brumbaugh 64 Spring 2014 legend (figure number, title, and description) and including the magnification and scale. Do a computer search for images of Euglena shapes. 2. Answer questions 1 through 4 on your Report Sheet (page 68) to be turned in individually next week. II. Kingdom Fungi 1. Observe a prepared slide of Penicillium at 400X. Make a sketch on a separate sheet of paper and label the mycelia, conidia, and conidiophores. Do a computer search for images of Penicillium shapes. 2. Observe a prepared slide of yeast or make a wet mount of live yeast. On a separate sheet of paper draw budding yeast cells at 400X. Do a computer search for images of budding yeast shapes. 3. Label each drawing with a figure legend (figure number, title, and description) and including the magnification and scale. 4. Answer questions 1 and 2 on your Report Sheet (page 68) to be turned in individually next week. III. Kingdom Plantae 1. Place a single Elodea leaf on your slide and view the rectangular cells under 400X magnification. Do a computer search for images of Elodea. Look for cells exhibiting any internal movement. Scan the cells in your leaf until you find one demonstrating an obvious flowing movement of the chloroplasts around the edges of the rectangular cells. If you don’t see any chloroplast movement, add a drop of dH2O to the leaf and replace the cover slip. Wait 3 minutes and look again for movement. This movement is called cytoplasmic streaming. It is facilitated by the same two proteins responsible for muscle contraction in animals (actin and myosin). Describe the movement of the chloroplasts on your Report Sheet. 2. Remove the cover slip, add a drop of Janus Green on top of the leaf and replace the cover slip. Janus Green is a ‘vital’ stain. It colors the living mitochondria and membranes of the nucleus and vacuole making them more visible. Allow the slide to sit for 5-10 minutes for the stain to absorb into the cells. 3. Observe the plant cells under the 400X magnification, and make sure that your iris diaphragm is completely open, letting a maximum amount of light through. Locate a nucleus (if you haven’t already). Often they will be found against one side of the cell in which case they will be hemispherical in outline. Look carefully for tiny spherical structures about 10% of the diameter of the disc of the chloroplasts. These are mitochondria. 4. On a separate sheet of paper sketch several cells. In one cell label the chloroplasts, mitochondria, vacuole, cell wall, and nucleus. Label each drawing with a figure legend (figure number, title, and description) and including the magnification and scale. 5. Answer questions 1 through 5 on your Report Sheet (page 69) to be turned in individually next week. IV. Kingdom Animalia: Human Tissues 1. Observe prepared slides of skeletal muscle, neuron, blood smear, and bone of human cells. Do a computer search for images of each of these tissues to assist with labelling and orientation or the tissue. 2. Evaluate each slide in terms of tissue organization such as: 1) Is the tissue mainly cellular in structure, 2) Are the cells packed closely together or separated, 3) Does it look fibrous with what looks like dead air spaces between the fibers or is the space filled with material (ground substance), 4) Does the tissue appeard to be layered with different densities or organization Biology& 160 Laboratory Manual Mr. Brumbaugh 65 Spring 2014 of material, 5) Does it look like it is strong (lots of fibers) or weak (fewer fibers), 6) do all the fibers (if any) all run in the same direction (be careful because you maybe looking at longitubinal versus cross sections), and 7) Overall use your super powers of observation and description to explain to someone that is not seeing what you are seeing what the tissue looks like. 3. On a separate sheet of paper make a drawing of each cell type on your results sheet, labeling what structures you can. Label each drawing with a figure legend (figure number, title, and description) and including the magnification and scale. 4. Answer questions 1 and 2 on your Report Sheet (page 70) to be turned in individually next week. 5. Below is a copy of the field sizes for our microscopes, as determined in the Microscopy lab. Use the information in of magnification and field diameter (Table 1) to estimate the length of one bacillus bacterium, one Euglena, one yeast cell, one Elodea cell, and one red blood cell. List the organisms in order from largest to smallest on your report sheet (page 69). Low Power Medium Power High Power Oil Lens Objective Lens Mag. 4x 10x 40x 100x Total Mag. 40x 100x 400x 1000x Field Size (dia.) 4.5mm 1.8mm 0.45 mm 0.18 mm Field Size (dia.) 4500µm 1800µm 450µm 180µm Table 1 Magnification and Field Size This table shows the Magnification and Field Size dimensions for your microscope to allow for more accurate scaling of your viewed specimens. *The protist and plant selections above were adapted & reproduced from the University of Wisconsin BOT 130 lab manual, with the permission of Mike Clayton. Biology& 160 Laboratory Manual Mr. Brumbaugh 66 Spring 2014 Report Sheet Lab Section: . Cellular Diversity Exercise Name: . Part A: Prokaryotic Cells – Domain Bacteria and Archaebacrteria, Kingdom Monera 1. What specific structures are most obviously lacking in prokaryotic cells compared to eukaryotic cells? 2. What strategies or mechanisms do prokaryotes use for energy capture and release (Bioenergetics)? 3. What structures are found in both plant and bacterial cells but not animal cells? 4. How do prokaryotes reproduce? Biology& 160 Laboratory Manual Mr. Brumbaugh 67 Spring 2014 Part B: Domain Eukarya I. Kingdom Protista 1. Describe the movement of Euglena 2. Describe how a flagellum operates to move the cell? 3. Do the cells have an anterior or posterior flagellum and explain the adaptive advantage to this position of the flagella? 4. How might the eye spot and the cells’ motility be adaptive for a photosynthetic organism? II. Kingdom Fungi 1. Explain the adaptive advantage for a fungus to have a chitinous cell wall? 2. Cite some commercial uses of the members of the fungal kingdom. Biology& 160 Laboratory Manual Mr. Brumbaugh 68 Spring 2014 III. Kingdom Plantae 1. Describe the distribution and movement of the chloroplasts within an Elodea cell as their movements would relate to time of day or weather patterns. 2. Describe the process and name the organelle by which plants turn light into energy? 3. Cite two examples of structures/organelles that are found in plant cells but not in animal cells. 4. What substances are found in the cell walls of plants? 5. Why would animal cells and some protists not require a cell walls but plants, fungus, other protists, and monerans require a cell wall structure? Biology& 160 Laboratory Manual Mr. Brumbaugh 69 Spring 2014 IV. Kingdom Animalia: 1. Label the following structures on the animal cell diagram below: nuclear membrane, nucleolus, chromatin (chromosomes), nuclear pore, rough endoplasmic reticulum, ribosomes, smooth endoplasmic reticulum, mitochondrion, Golgi apparatus, lysosome, plasma membrane, vesicle, centrosome (centrioles), cytoskeleton, cilia, and microvilli. 2. On a separate sheet of paper make a table to describe the function for each of the organelles and structures identified on the figure of the animal cell. Approximate size of cells, in order from largest to smallest: Organism Size (in µm) Biology& 160 Laboratory Manual Mr. Brumbaugh 70 Spring 2014 Pre-Lab Report Sheet Lab Section: . Cellular Diversity Exercise Name: . Before coming to labs carefully read the previous pages on Cellular Diveristy then answer these pre-lab questions. Be prepared to hand in your responses to the pre-lab questions at the start of lab. 1. Describe what is meant by the cell theory. 2. What is the difference between a prokaryotic cell and a eukaryotic cell? 3. Organize the eukaryotic cellular organelles into four basic categories? Name others that don’t fit into these categories? 4. Give specific examples of organisms found in each of the five kingdoms? 5. What are spores and what purpose do they serve? 6. What is cytoplasmic streaming? In what organism will we observe this? Biology& 160 Laboratory Manual Mr. Brumbaugh 71 Spring 2014 Page to be used for Cell Biology Doodling Biology& 160 Laboratory Manual Mr. Brumbaugh 72 Spring 2014 Laboratory 5: Transporting Across Boundaries Pre-lab Assignment Before coming to lab carefully read the pages on Transporting Across Boundaries, then answer the pre-lab questions (page 85) and define the terms at the end of the perspectives section on a separate sheet of paper. Be prepared to hand in your responses to the pre-lab questions and the defintions at the start of lab. Perspectives A good way to think about the movement of substances into or out of a cell is to envision the system that you are studying as being different compartments separated by a membrane barrier that is permeable (allows movement across) to certain substances, and impermeable (allows no movement across) to other substances. The substances are referred to as the solute and the dissolving solution (usually water) is referred to as the solvent. In these experiments the barrier (either a dialysis sac or cell membrane) acts as a semi-permeable membrane. Your task is to determine what solute molecules are allowed to move across the membrane or not. The movement of solute across a semi-permeable living membrane can either be an active transport process (requiring the use of energy in the form of ATP) or a passive transport process (requiring no energy). This lab will investigate passive processes. Smaller, non-polar molecules can move across a membrane by passing between the phospholipid molecules of the membrane (called simple diffusion). While smaller, polar molecules, and ions (charged atoms) can move through specific protein pores embedded into the membrane (called facilitated diffusion). Both of these routes are classified as passive transport because they require no energy input by the cell. The mechanisms or forces that drives this process is Brownian motion (random molecular movement) and a favorable concentration gradient (more of one solute on one side of the membrane than that same solute on the other side). If all other factors are constant, then eventually the solute will come to equilibrium (balance) across the membrane. Osmosis is a special term for passive transport that describes the movement of a solvent (usually water) across a semi-permeable membrane by diffusion through protein channels (aquaporins). The force that moves the water, though, is not the water concentration, but rather the solute concentration across the membrane. The solute in this case is termed an osmotically active substance (OAS) and can be any molecule dissolved in the solvent. The trick is to measure the total OAS and then to measure the solutes that are able to move across the semi-permeable membrane (remember they will reach their own equilibrium). By comparing the difference between the permeability of the OAS, you can then predict the OAS concentration at equilibrium and be able to predict the net movement of water. Three terms are used to describe the relationship between OAS concentration across a membrane: hypertonic, hypotonic, and isotonic. A hypertonic condition would have more OAS outside the cell, a hypotonic condition would have more OAS inside the cell, and an isotonic condition would have a balance of OAS across the membrane. Because of the differences or similarities of concentration, water will move to the area of higher OAS and could cause radical changes in the shape of the cell. Hypertonic solutions cause the cell to lose water and shrink in size (crenate); hypotonic solution causes them to gain water and expand (lysis), while isotonic has no net movement of water and therefore there is not a gross change in cell shape. How would changing a cell from solution to solution affect cell function? The key to understanding this exercise is to figure out 3 things. 1. What concentration gradients you have created? 2. In which direction will the net flow of given molecules travel within their concentration gradient or in which direction will the net flow of molecules within their concentration gradient try to flow? Biology& 160 Laboratory Manual Mr. Brumbaugh 73 Spring 2014 3. To which type of molecule is the membrane permeable? Be able to define each of the following terms: solvent, solute, semi-permeable membrane, passive transport, active transport, concentration gradient, osmosis, osmotic concentration, osmotically active substance, simple diffusion, hypertonic, hypotonic, isotonic, and transport proteins. Exercise: Transporting Across Boundaries Goals of this Lab Exercise To understand the mechanisms used to move substances across membranes Understand the factors that can influence rates of transport across membranes Define terms associated with moving substances across membranes Apply the principles of moving materials across membranes to medical or environmental issues Introduction Through a series of demonstrations and exercises, the principles of moving substances across membranes will be studied. Each exercise will reveal a different yet related aspect of movement into and out of cells. Bear in mind that these principles are put into practice continually by cells trying to function and maintain homeostasis in an ever changing environment. Whether that environment includes existing as a single celled protistan, like a Euglena, or a multi-celled animal, like a homo sapien, each cell needs to practice the principles for moving molecules into or out of its cellular body or run the risk of cellular death or at the minimum, disruption of cellular function. Each group will gather data to complete Part A, three members of the group will complete Part B, and one member of the group will complete Part C. Share the data from all parts and turn in the Report Sheet at the beginning of the next lab as one group. Procedure Part A. Demonstrations of Molecular Movements through Different Media The following demonstrations are used to show the process of molecular movements via Brownian motion. The first is movement through a semi-permeable membrane, the third is through a semi-solid (agarose) medium, and finally through a living membrane. Demonstrations Students will not set-up the following demonstrations but will be required to write hypotheses before coming to lab on page 85 question 4 and take measurements for each demonstration Thistle-tube demonstration. The dialysis tubing, which is a semi-permeable membrane, contains a concentrated sugar solution, and a blue dye. This sac was then lowered into a beaker filled with water only. What principle does this demonstration illustrate? The petri dish filled with agarose gel to which two different dyes were added. This represents the third demonstration of movement through a semi- solid media. Measure the halo distance of movement for each dye as it moves through the media. Are there differences in the rate and total movement of each dye and why? The third demonstration shows the results after potato slices were left in different solutions for about one day. Feel the slices in each test tube and explain what could have happened to the potato slices Answer questions under Part A 1, 2, and 3 on the Report Sheet page 79. Biology& 160 Laboratory Manual Mr. Brumbaugh 74 Spring 2014 Part B. Diffusion Across Non-Living Membrane Materials 1 small funnel and eye droppers laboratory balance 2 moistened (dH2O) dialysis sacs 5% I2KI (Lugol’s) solution Safety goggles Procedure The set-up! 1 - 10ml. graduated cylinder pieces of string 40% glucose solution I2KI solution 3 Standard sized test tubes wax pencil and scissors 2 - 400 ml. Beakers 10% NaCl solution Benedict’s reagent & AgNO3 Small plastic beakers (Perform in teams of four) 1. Formulate a hypothesis about the movement of the various solutes across the dialysis sac. Write them down on page 80. 2. Construct the experimental set up illustrated in Figure 1. Divide up the labor involved for the various steps among your group members. Wear Safety Goggles! 400ml beaker dH2O or I2KI Glucose and NaCl or Starch Close Dialysis Tube Figure 1 Dialysis Tubing Set-up Diagram for the investigation of the permeability of dialysis tubing. 3. Obtain two 25 cm length of dialysis tubing that have been soaked in dH2O, fold over one end about 3 cm from the end, and tie it securely with string to form a leak proof bag that is open at one end. 4. Roll the open end of each tube between your thumb and forefinger until it opens and insert a funnel. To one bag (Sac 1) add about 5 ml of 40% glucose solution followed by about 5 ml of the salt solution and to the other sac (Sac 2) add 10ml of starch solution. Carefully remove excess string and tubing from each end of the sacs (Why?). 5. Rinse the sacs under running tap water to remove any solution from the outside of the sacs and blot the sacs dry. 6. Determine the mass of the sacs in grams with a laboratory balance (found at the front end of each side bench. Place your sac into the the plastic weigh boat and zero the scale before weighing your sample. Record the weights in Table 1 (page 79). 7. Record the tubidity and color of the each sac fluid and beaker contents in data Table 1. 8. Add about 200-250ml of deionized water to a clean 400ml beaker (Beaker 1) and 200250 ml of I2KI to another clean 400ml beaker (Beaker 2). 9. Place Sac 1 in Beaker 1 and place Sac 2 in Beaker 2 and note the start time. Be sure that the sac is completely submerged in the solution of the beaker. 10. After 45 to 60 minutes, remove the dialysis sacs, rinse, and dry as in step 5. Observe the sac’s for color changes and note in Table 1. Weigh the sacs and their contents and record the mass in grams in Table 1. Biology& 160 Laboratory Manual Mr. Brumbaugh 75 Spring 2014 11. Chemically analyze for the presence of solute by following the steps under chemical analysis below and record the data in your lab notebook. 12. Prepare a boiling water bath that will be ready for use after sac 1 has been soaked for the 45-60 minutes: Place a couple of boiling chips in another 400 ml beaker, fill half way with tap water, and place on a hot plate turned to its highest setting. Once the water comes to a boil, reduce the heat so the water simmers gently. Tip! While the dialysis sac soaks for 45-60 minutes proceed to Parts A and C and then return to steps 1-7, below. Chemical Analysis! 1. Benedict’s test for the presence of sugar in the Solutions. Wear Safety Goggles! Caution! Benedict’s Reagent is very caustic. It can burn holes in clothing and digest skin!! Wear goggles for eye protection! Clean up spills immediately after first neutralizing with vinegar. If spilled on your skin (it feels slippery and begins to burn after several minutes) wash thoroughly with tap water. Report all accidents to the instructor. 2. Label three clean test tubes: control, sac, and beaker and add five drops of Benedict’s reagent to each test tube. 3. Use a clean eyedropper to put five drops of dH2O in the “control” test tube. 4. Use scissors to cut off one end of the sac 1 and drain into a small plastic beaker. With a clean eye dropper, put 5 drops of sac 1 solution in the “sac” test tube. 5. Use a clean eyedropper to put 5 drops of beaker 1 solution in the “beaker” test tube. 6. Heat all three test tubes in a boiling water bath for about 2-3 minutes. 7. Record the colors of the solutions in your Table 2 (page 79). 8. Add one dropper full of AgNO3 (silver nitrate) to the remaining beaker water (beaker 1) and note the results in Table 2. 9. Note the presence or absence of starch in the sac (sac 2) and the beaker (beaker 2) by noting any color changes in Table 2. 10. Answer questions 1 through 7 on pages 80 and 81. Clean Up! 1. Dispose of the used and excess Benedict’s reagent in the “Benedict’s Waste” container located on the lab hood. 2. Wash all other solutions down the drain with tap water. 3. Wash glassware with soap, water, rinse with dH2O, and then let the glassware air dry on the racks by the back sink. 4. Place used dialysis tubing and string in a wastebasket or take them home to MOM. Part C. Diffusion of a solvent through a Living Membrane The purpose of this part is to demonstrate the action of a “living” semi-permeable membrane. How do things pass through a cells membrane? What precautions must a cell take to ensure homeostasis and maintain functions, while still being an active vibrant cell? Think of how the principles demonstrated here can be applied to the normal and abnormal environments cells can find themselves involved with and yet still can maintain their lives. Remember to formulate hypotheses for each situation in the following part of this exercise. Biology& 160 Laboratory Manual Mr. Brumbaugh 76 Spring 2014 Materials Compound Light Microscope Samples of Red Blood Cells Microscope slides Samples of Elodea Cover slips and scissors Solutions A, B, and C Procedure: Red Blood Cells and Osmosis 1. Write down a hypothesis for each of the conditions A, B, and C on page 81, question 1. 2. Label four microscope slides A, B, C, and D. 3. Place a drop of blood on slide D with a cover slip and observe the shape of the red blood cells. Record you observations in the Report Sheet in Table 3 (page 81). 4. Place a drop of solution A on slide A, add a cover slip. Place the slide on the stage and add a drop of blood to the edge of the cover slip. Capillary action should move the blood under the cover slip. Watch blood cells at the edge of the advancing blood as they meet solution A, then record your observations in Table 3. 5. Repeat step 4 for solutions B and C. 6. Wash the slides in soap and water, dry and place them on the bench coat next to the sink. 7. Answer questions 2 through 5 on page 82 on the Report Sheet. Procedure: Plant cells and Osmosis 1. Write down a hypothesis for each of the conditions A, B, and C on page 82, question 1. 2. Use scissors to section one Elodea leaf into three pieces and then place a piece of Elodea leaf with a drop of water from the solution the sprigs of Elodea are being held on a microscope slide and add a cover slip. Place the slide on a microscope stage, observe the shape of the cells, and record your observations in Table 4 on page 83 of the Report Sheet. 3. Follow steps 4 through 6 above substituting Elodea leaf piece and answering question 2 through 5 on page 83 on the Report Sheet. 4. When finished with Elodea leaf pieces place them on a paper towel to let them dry out and dispose of them into the trash. 5. Answer the additional questions on page 83 on a separate sheet of paper. Biology& 160 Laboratory Manual Mr. Brumbaugh 77 Spring 2014 Page to be used for Cell Biology Doodling Biology& 160 Laboratory Manual Mr. Brumbaugh 78 Spring 2014 Report Sheet Lab Section: . Transporting Across Boundaries Exercise Group Names: . . . . Part A. Demonstrations. Record your data and answer the following questions. 1. What is the principle demonstrated by the thistle-tube demo? 2. What is the principle demonstrated by the agar plates and dyes? How can you explain the differences (if any) in the movement of the two different dyes? Write your measurements in the space below 3. What is the principle demonstrated by the potato slices? Why do you think the slices felt different (if they did.)? Part B. Diffusion through a Non-Living Membrane Treatment Color & Tubidity of Sac & Beaker Beginning Weight (gm.) Final Weight (gm.) Sac 1: 40% glucose and NaCl solution soaked in dH2O Sac 2: 10% Starch solution soaked in I2KI water Table 1 Weights of Dialysis Tubes Beginning Weights of dialysis sacs containing various solutions and Final Weights of dialysis sacs after being soaked in various solutions for 1 hour. Sac and Test Performed Test results for sac content (present or absent) Test results for beaker content (present or absent) Sac 1: Benedicts test for Glucose Sac 1: Silver nitrate test for NaCl Sac 2: Iodine test for Starch Table 2 Chemical Analysis of Dialysis Tubes Results of Benedicts, Silver nitrate, and Iodine Tests on the various sacs and their solutions. Biology& 160 Laboratory Manual Mr. Brumbaugh 79 Spring 2014 Answer the following questions concerning the movement of molecules across a semipermeable membrane. 1. State a hypothesis for each of the sac conditions. 2. In which situations or sacs did a Net Osmosis occur? Explain your reasoning? 3. Based on your data and your knowledge of chemical structures list the relative sizes in the order of largest to smallest of the following molecules: Glucose, Starch, NaCl, and water. 4. What part of a living cell is represented by the dialysis sac? For the next two questions use the terms diffusion and/or osmosis, hypotonic, isotonic, and/or hypertonic in your answer. 5. Considering the results of Sac 1, explain the results you observed. Biology& 160 Laboratory Manual Mr. Brumbaugh 80 Spring 2014 6. Was there a net movement in either directionof material occurring in Sac 2? Why or why not? 7. What single characteristic of the semi-permeable membrane (dialysis sac) used in the lab determines which substances can pass through them? Explain yoiur answer in terms of molecular size. Part C. Diffusion through a Living Membrane Condition D (blood only) Appearance and Condition of Red Blood Cells A B C Table 3 RBC Data Observations of the potential changes in cell structure of Red Blood Cells in test solutions. 1. Write a hypothesis for each of the conditions using your experiences with non-living membranes. Biology& 160 Laboratory Manual Mr. Brumbaugh 81 Spring 2014 2. Which of the three solutions was hyper-tonic to the red blood cells? Explain your answer. 3. Which of the three solutions was hypo-tonic to the red blood cells? Explain your answer. 4. Which of the three solutions was isotonic to the red blood cells? Explain your answer. 5. What conditions within the human body might lead to results similar to those you experienced here? Condition Appearance and Condition of Elodea Cells A B C Table 4 Spirogyra Data. Observations of the potential changes in cell structure in Elodea Cells in test solutions. 1. Write a hypothesis for each of the conditions using your experiences with non-living membranes. Biology& 160 Laboratory Manual Mr. Brumbaugh 82 Spring 2014 2. Which of the three solutions was hyper-tonic to the Elodea cells? Explain your answer. 3. Which of the three solutions was hypo-tonic to the Elodea cells? Explain your answer. 4. Which of the three solutions is isotonic to the Elodea cells? Explain your answer. 5. Would you expect pond water to be isotonic, hypo-tonic, or hyper-tonic to Elodea cells and why? Additional Questions: The external membrane of fish is semi-permeable. As is true for all animals, the materials that can pass freely without the aid of intra-membrane transport proteins are oxygen, carbon dioxide, and water. Any charged molecule such as Na+, Cl-, and any large molecules, such as sugars, requires the aid of transport proteins. All animals have salt (Na+, Cl-) in their blood. Answer the following questions on a separate sheet of paper. 1. What transport action could spontaneously occur across the external membrane of freshwater fish? Explain? 2. Now consider saltwater fish. What transport action could spontaneously occur in the external membrane of saltwater fish? Explain? Only consider the situation where the salt concentration is higher in the surrounding water than in the fish. 3. Using your text, or some other means, define both positive and negative feedback. Our bodies have the ability to sense potentially dangerous changes in blood pressure. When our blood pressure drops, our pituitary gland releases a hormone which enhances the ability of our kidneys to reabsorb water, thus making our urine more concentrated. Is this positive or negative feedback? Explain? Biology& 160 Laboratory Manual Mr. Brumbaugh 83 Spring 2014 Page to be used for Cell Biology Doodling Biology& 160 Laboratory Manual Mr. Brumbaugh 84 Spring 2014 Pre-Lab Report Sheet Lab Section: . Transporting Across Boundaries Exercise Name: . Use the diagrams below to determine the concentration gradients and expected direction of net flow for all the different molecules in each set-up. Determine the concentration gradient for each molecule type. Then draw an arrow showing the “expected” net movement of each molecule in the set-up. In each of these examples NaCl is permeable, while sucrose is impermeable to the membrane. A 100% H2O 35% NaCl 65% H2O B 100% H2O C 70% H2O, 10% sucrose, 20% NaCl 40% sucrose 60% H2O 60% NaCl 35% H2O 5% sucrose 1. Describe the net movements of the molecules in Condition A above. 2. Describe the net movement of the molecules in Condition B above. 3. Describe the net movement of the molecules in Condition C above. 4. Write out a hypothesis for each demonstration described in this exercise on pages 74. Make sure your each hypothesis is in the correct format! Biology& 160 Laboratory Manual Mr. Brumbaugh 85 Spring 2014 Page to be used for Cell Biology Doodling Biology& 160 Laboratory Manual Mr. Brumbaugh 86 Spring 2014 Laboratory 6: Energy Harvest – Fermentation in Yeast Pre-lab Assignment Before coming to lab carefully read the pages on Energy Harvest – Fermentation in Yeast and Appendix A then answer the pre-lab questions (page 97). Be prepared to hand in your responses to the pre-lab questions at the start of lab. Perspectives In this lab activity you will determine which sugars (monosaccharide versus disaccharide) are best metabolized by yeast under anaerobic conditions and then propose hypotheses to explain why some sugars are metabolized but not others. Cultures around the world have for millennia used yeast fermentation to produce bread and alcoholic beverages. Yeast are able to metabolize some foods, but not others. In order for an organism to make use of a potential source of food, it must be capable of transporting the food into its cells and have the proper enzymes capable of breaking the food’s chemical bonds in a useful way. Sugars are vital to all living organisms. Yeasts are capable of using some, but not all sugars as a food source. Yeast can metabolize sugar in two ways, aerobically, with the aid of oxygen, or anaerobically, without the aid of oxygen. When the yeast respire glucose aerobically, oxygen gas is consumed at the same rate that CO2 gas is produced—there would be no change in the gas pressure in a test tube. The net equation for the more than two dozen steps involved in the aerobic respiration of glucose is: Enzymes C6Hl2O6(aq) + 6 O2(g) 6 H2O(l) + 6 CO2(g) + energy (36-38 ATP) Glucose oxygen water carbon dioxide Although the aerobic fermentation of sugars is energetically much more efficient, in this experiment we will set the conditions so that the yeast can only complete the reactions anaerobically. When yeast ferments the sugars anaerobically, however, CO2 production will cause a change in the pressure of a closed test tube, since no oxygen is being consumed. We can use this pressure change to monitor the rate of respiration and metabolic activity of the organism. A gas pressure sensor will be used to monitor the fermentation of sugar. The alcoholic fermentation of glucose is described by the following net equation: Enzymes C6Hl2O6(aq) glucose 2 CH3CH2OH(aq) ethanol + 2 CO2(g) + energy (2 ATP) carbon dioxide Both anaerobic fermentation and aerobic respiration are multi-step processes that involve the transfer of energy stored in the chemical bonds of glucose to bonds in Adenosine TriphosPhate, (ATP). The energy stored in ATP can then be used to perform cellular work: provide energy for biosynthetic reactions (e.g. growth and repair processes), move objects across membranes, etc. All organisms (i.e. monerans, protists, fungi, plants, and animals) utilize aerobic respiration and/or anaerobic respiration (fermentation) to produce ATP to power their cellular processes. Note that ethanol is a by-product of alcoholic fermentation (Figure 1). Ethanol, a 2-carbon alcohol, is also known as ethyl alcohol and, less correctly, simply as “alcohol”. Since yeast do not have the enzymes needed to metabolize ethanol, much of the energy stored in the molecules of glucose is trapped in the molecules of ethanol and is unavailable for use by yeast cells. The Biology& 160 Laboratory Manual Mr. Brumbaugh 87 Spring 2014 complete breakdown of glucose to carbon dioxide and water in aerobic respiration yields much more energy than alcoholic fermentation: 36-38 ATP, versus only 2 ATP molecules produced by anaerobic respiration. Ethanol molecules produced by alcoholic fermentation diffuse from yeast cells into the surrounding aqueous environment. Since ethanol is harmful to cellular membranes yeast cells will die if ethanol concentrations reach a critical level, usually a concentration of about 12%. Figure 1 Glucose Summary Reactions Summary of three of the many possible fates of the 6-carbon sugar glucose under anaerobic and aerobic conditions. When anaerobic respiration occurs in animals (Figure 1) it is known as lactic acid fermentation since lactic acid, a 3-carbon organic acid, is the end product. Like alcoholic fermentation, lactic acid fermentation produces only 2 ATP. Perhaps if ethanol were produced anaerobically in animals more people would take up anaerobic sports such as sprinting or weight lifting! Since lactic acid is toxic to cells, anaerobic respiration can only occur for short periods of time in animals. In the presence of oxygen each lactic acid can be broken down to carbon dioxide and water. Aerobic respiration (Figure 2) occurs in three stages: glycolysis (involves soluble enzymes in the cytoplasm), Kreb’s cycle (uses soluble enzymes in the matrix of mitochondria), and the electron transport chain (a chain of reduction/oxidation paired proteins found embedded into the inner membrane of the mitochondria). Alcoholic and lactic acid fermentation involve only glycolysis. Since both the Kreb’s cycle and the electron transport chain require oxygen to function, neither process can occur under anaerobic conditions. Glucose Plasma Membrane Glucose NAD+ Cytoplasm Glycolysis NADH ATP Without O2 Present Ethanol + CO2 or Lactic Acid Pyruvate Mitochondrion O2 Present (Not drawn to scale!!) O2 Present Kreb’s Cycle NADH FADH2 CO2 ATP Carrier Proteins of the Electron Transport Chain ATP O2 H2O Figure 2 Glucose Metabolism Pathways Aerobic cellular respiration consists of glycolysis, Kreb’s cycle, and the electron transport chain. Anaerobic respiration involves only glycolysis and regenerates NAD + by either reducing pyruvate to produce lactic acid (animals), or by decarboxylating pyruvate to produce acetaldehyde (not shown) and then reducing acetaldehyde to produce ethanol. Under aerobic conditions the NADH produced by glycolysis enters the mitochondria of the cell where it becomes oxidized to regenerate NAD+ by donating electrons to the electron transport chain, which results in the production of nearly 90% of the 36-38 ATP molecules produced per glucose molecule metabolized aerobically. Biology& 160 Laboratory Manual Mr. Brumbaugh 88 Spring 2014 Exercise: Energy Harvest – Fermentation in Yeast Goals of this Lab Exercise Describe alcoholic fermentation and aerobic respiration, noting the reactants and products, and the relative energy efficiency of each Use a biology gas pressure sensor to determine which sugars are best metabolized anaerobically by yeast Propose reasonable hypotheses to explain why yeast can metabolize some sugars but not others Introduction Today’s exercise will afford you the opportunity to measure the rate of fermentation activity by yeast using different sugars. The equipment we will use measures the CO2 that is produced by the fermentation process. The production volume over time will be monitored and graphed by a computer program ready for your interpretation and analysis. The critical steps involve your ability to maintain a tight and consistent seal during each “run” of the exercise. Without a tight seal the CO2 produced leaks from the equipment and your data will be skewed. As with any experiment, the collection of the data is the easy part, but a clear understanding of the principles involved pose the greatest challenge. Make sure you understand the introductory material. Materials Computer Go-Link Interface Vernier Gas Pressure Sensor Yeast suspension Basting bulb, thermometer, test tube rack Dropper bottles of: 5.0 % of glucose and sucrose Stopper assembly fitted with tubing 10ml Graduated cylinder o Water bath (set at 37 C) 1L beaker (for water bath) 2 - 18 X 150 mm test tubes and a 5ml Pipette Dropper bottles of: 5.0 % of lactose and fructose Procedure The Set Up 1. Prepare the computer for data collection by opening the Biology with Computers software as follows: Plug the CO2 gas sensor into the Go-Link connector. Go to Start click on Programs Vernier open Logger Pro 3.5 File Biology with Vernier open “Exp. O6” Enzyme Pressure. The vertical axis has pressure scaled from ~90 to ~130kPa. The horizontal axis has time scaled from 0 to 15 minutes. 2. Adjusting the Valves to the Pressure Sensor. Open the valve on the rubber stopper assembly so that it is open to the atmosphere (Figure 3A) and use the closed position when monitoring the CO2 generated by the yeast (Figure 3B). Figure 3A Open postion the atmosphere. Biology& 160 Laboratory Manual Mr. Brumbaugh Valve open to Figure 3B Closed postion Valve closed to the atmosphere. 89 Spring 2014 3. Prepare a water bath (Figure 4) at your table for the yeast to ensure that the yeast will remain at a constant and controlled temperature (Why?) when collecting data under data collection below. To prepare the water bath combine warm and cool water in a 1-liter beaker until it reaches 38 – 39oC. Fill the beaker with water until the beaker is ¾ full, but won’t spill over when the test tube containing the yeast and sugar is placed in it. Make sure to keep the water temperature constant at about 37oC. Figure 4 Experimental Set-up Experimental Set-up with reaction vessel in a water bath maintained at a constant temperature. 4. Obtain two large test tubes and label them 1 and 2. 5. Wear Safety Goggles when transferring regents. 6. Use a graduated cylinder to put 2.5ml of one of your assigned sugars into test tube 1. Bring the sugar in test tube 1 up to the 37oC temperature in your water bath. You will do two “runs” for each of the groups assigned sugars and gather data from other groups to complete Table 1 (page 93) on the Report Sheet 7. Obtain the yeast suspension from the thermostatically controlled water bath in the back of the room. Constantly and Gently swirl the yeast suspension to mix the yeast that has settled to the bottom. Use a 5ml. pipette to put 2.5 ml of yeast into test tube 1. 8. Constantly and Gently swirl the yeast suspension while incubating for 10 minutes in the water bath at your table (ensure the To is at 37oC) 9. After incubation place the rubber stopper assembly firmly into Test Tube 1 and open to the atmosphere (Figure 3A) while Constantly and Gently swirling the yeast suspension in your water bath. The stopper is connected to the large test tube that goes to the pressure sensor. Check that all connections are tight and then place test tube into your water bath. Be sure to keep the temperature of the water bath constant. If you need to add more hot or cold water, first remove about as much water as you will be adding or the beaker may overflow. Use a basting bulb to remove excess water. Data Collection 1. Close the system to the atmosphere (Figure 3B). 2. Begin collecting data by clicking the green COLLECT button. Important: Constantly and Gently swirl the test tube while collecting data. This helps to liberate the carbon dioxide gas from the solution and helps to keep the contents mixed well. Monitor the temperature of the water bath. Be sure that it does not change by more than one degree. 3. Collect data until you are certain that there is a linear relationship between the pressure and time. Depending on the activity of the yeast, this usually takes 1 to 3 minutes. If the pressure exceeds 130 kPa, stop the computer by clicking the red STOP button. Open the air valve on the pressure sensor (Figure 3A) to prevent it from popping off! Data Analysis 1. Follow the procedure from step 11 of Lab 2 on page 28 to determine the rate of fermentation and record this value in Table 1 of the Report Sheet (page 93) for the sugar and your group number. Biology& 160 Laboratory Manual Mr. Brumbaugh 90 Spring 2014 2. Repeat using the same sugar and then perform two “runs” of your other assigned sugar. Your group will be doing a total of four runs or two for each sugar. 3. Share your group’s data with the class and gather their data. Report 1. Turn in a group Report Sheet packet as a team next lab by answering the Report Sheet questions on pages 93 through 95. 6 Biology& 160 Laboratory Manual Mr. Brumbaugh 91 Spring 2014 Page to be used for Biological Doodling Biology& 160 Laboratory Manual Mr. Brumbaugh 92 Spring 2014 Report Sheet Lab Section: Energy Harvest - Fermentation in Yeast Exercise Group Names: . . . . . Data: Group No. Sugar Used Glucose Glucose Glucose Glucose Glucose Glucose Sucrose Sucrose Sucrose Sucrose Sucrose Sucrose Lactose Lactose Lactose Lactose Lactose Lactose Fructose Fructose Fructose Fructose Fructose Fructose Rate (kPa/min) Table 1 Fermentation Exercise Data collected from the class. Rate (kPa/min) Average per sugar This table shows the fermentation rates of various sugars by yeast Analysis and Questions of Results: 1. Graph (your Figure 1) the class data on a separate piece of graph paper to show the average rate of respiration vs. sugar type. Label the graph fully and give it a proper title (Appendix A). On the back of your graph interpret the trends seen on your graph by referring to your figure. Biology& 160 Laboratory Manual Mr. Brumbaugh 93 Spring 2014 2. Considering the results of this experiment, can yeast utilize all of the sugars equally well? Quote specific numerical values and your figure to answer this question. 3. Hypothesize why some sugars were not metabolized while other sugars were metabolized? 4. Hypothesize why the sugars that were metabolized were metabolized at different rates? Biology& 160 Laboratory Manual Mr. Brumbaugh 94 Spring 2014 Refer to the perspectives of this lab to answer the following questions. 1. Write the overall balanced chemical equation for both aerobic respiration and anaerobic respiration of glucose by yeast. 2. Explain why are there different numbers of ATP produced when yeast metabolize glucose aerobically vs. anaerobically. Biology& 160 Laboratory Manual Mr. Brumbaugh 95 Spring 2014 Page to be used for Biological Doodling Biology& 160 Laboratory Manual Mr. Brumbaugh 96 Spring 2014 Pre-Lab Report Sheet Lab Section: . Energy Harvest - Fermentation in Yeast Exercise Name: . Before coming to labs carefully read the previous pages on Energy Harvest - Fermentation in Yeast then answer these pre-lab questions. Be prepared to hand in your responses to the pre-lab questions at the start of lab. 1. Define the following terms: aerobic respiration and anaerobic respiration? 2. Outline the steps or processes involved in the two types of respiration you defined in question 1 (see Figure 2). 3. Using your textbook or other sources, explain how enzymes are of critical importance to the processes involved in respiration. 4. Speculate as to why yeast ferment pyruvic acid (make alcohol) differently from animals (make lactic acid). Biology& 160 Laboratory Manual Mr. Brumbaugh 97 Spring 2014 Page to be used for Biological Doodling Biology& 160 Laboratory Manual Mr. Brumbaugh 98 Spring 2014 Laboratory 7: Mitosis and Online Karyotyping Pre-lab Assignment Before coming to lab carefully read the pages on Mitosis and Online Karyotyping, then answer the pre-lab questions (page 105). Be prepared to hand in your responses to the pre-lab questions at the start of lab. Perspectives In the late 1800’s new techniques to visualize cellular structure exploded with the discovery of vital stains and dyes. Most plant cells were fairly easy to visualize since most contain pigment molecules for photosynthesis, but animal cells were another matter. When viewed under a microscope lens sub-cellular structures, called organelles, were seen as simply the grainy consistency of the cytoplasm. When scientists would apply different pigments harvested from different plants the graininess took on a distinct form. Organelles could now be distinguished and studied as separate structures. Differences in cellular function could be attributed to the number and types of organelles found in various cells. By the end on the century scientist were using not only pigments from plants to stain cells, but were beginning to use heavy metals linked to pigments to further increase contrast to delineate structure. Dyes and stains became almost as an important discovery as the light microscope. The new technology of stains allowed a number of scientists to peer into cells like they could not have done before their discovery. One scientist, Walter Fleming, noted in salamander ovary cells that dark staining condensations appeared within the nucleus. These condensations were then separated toward opposite poles of the cell (“Dance of the Bodies”) just prior to the cell splitting into two new cells. He eloquently described the continuous stages of a process called mitosis. Today’s technology in the field of genetics and how genes affect the phenotype of an individual started years ago (mid-1800’s) with the work of Gregor Mendel. His work with pea plants set the stage for how chromosomes are sorted and passed from generation to generation. In the early part of the 1900’s another geneticist, Thomas Morgan, working with fruit flies (Drosophila melangastor) developed a technique called karyotyping that allowed him to visualize the structure of chromosomes. This technique harvested chromosomes from cells arrested between prophase and metaphase or pro-metaphase of mitosis, after being treated with colchicine, the chromosomes are then stained with a vital stain called giemsa, photographed, enlarged, and matched based on staining patterns and size. This technique of karyotyping is used today to show the potential for genetic abnormalities within the genome of an individual. The specificity of the technique has been refined through the use of more specific stains (spectral analysis) which adhere to specific sites within the DNA molecules to further highlight the differences between chromosomes and even individual gene sequences. Although possibly the most important for the ensuring of daughter cells receiving the correct amount of chromosomal material, mitosis is simply a small portion timewise, of the life span of a cell. Following a nuclear division the cytoplasm is separated by a process called cytokinesis. In this process the animal parental cell aligns proteins called actin along the equator in animal cells and the proteins contract to pinch the opposite membranes together forming a cleavage furrow to separate the daughter cells. In plant parental cells vacuoles containing cell wall material are lined across this plate. These eventually coalesce together to form a cell plate (eventually a cell wall) between the daughter cells (I wonder why we have always called them daughters and not sons?). Once cytokinesis is completed the cells move into G1 and the remaining portions of what is called the cell cycle. Biology& 160 Laboratory Manual Mr. Brumbaugh 99 Spring 2014 The cell cycle (Figure 1) is divided into interphase, division, and cytokinesis or the life span of an individual cell. Interphase is further subdivided into the G1 period, (normal cell growth and function); the S period, (DNA duplication); and the G2 period, synthesis of proteins involved with division and cytokinesis). During interphase the normal day-to-day activities of the cell are carried out and the cell is said to be functioning normally. Figure 1 Cell Cycle This figure demonstrates the divisions of the cell cycle of eukaryotic cells. Courtesy of http://staff.jccc.net/pdecell/celldivision/images/cellcycle.gif Exercise: Mitosis and Online Karyotyping Goals of this Lab Exercise To understand the mechanisms of the cellular process called mitosis To understand the process and application of the technique called karyotyping To apply this knowledge to issues in today’s society in relationship to karyotyping Introduction In the following laboratory and an on-line activity you will play the role of a cell biologist and cytogenetic technician and complete the karyotype for three patients, then use these karyotypes to evaluate and diagnose each patient. Be careful! The emotional and physical well being of each patient is in your hands……or almost in your hands! Materials (per group of four students) Compound light microscope Slides of onion root tips (Allium) Biology& 160 Laboratory Manual Mr. Brumbaugh Slides of white fish blastula PC computer with internet access 100 Spring 2014 Procedure Part 1. Visualizing the mitotic phases 1. Set-up two light microscopes at your lab table. 2. Have one group member obtain a prepared white fish blastula slide and another member a prepared onion root tip slide from the center table. 3. Under high power (40x), identify each pase of mitosis, draw each phase on a separate sheet of paper by making a table to show the comparative differences, and label (using the terms chromatin, sister chromatids, chromosomes, spindle tubules, centromere, and centrioles) the different stages of mitosis (interphase, prophase, metaphase, anaphase, and telophase) for a plant and animal cell. 4. With the assistance of your lab mates, identify two differences in the strategies between animal and plant mitotic and cytokinetic strategies. 5. Use your textbook, lab partners, or instructor to assist you. Label the table with a figure legend (figure number, title, and description) and including the magnification and scale. Part 2. On-line karyotyping Go to the Biology Project at: http://www.biology.arizona.edu/ Scroll down and click on “Human Biology”. Scroll down to “Activities” and then click on “Web Karyotyping”. Read the introduction and then complete the assignment as described. Record your responses on Table 1 page 103 of the Report Sheet. 5. Go to: http://www.scirus.com 6. Search for a karyotyping website and answer the questions of page 103. 1. 2. 3. 4. Part 3. On-line Onion Root Tips: Phases of the Cell Cycle This activity is a digital version of a classic microscope lab. You will classify cells from the tip of an onion root into the appropriate phases of the cell cycle, and then count up the cells found in each phase. You can use those numbers to predict how much time a dividing cell spends in each phase. In the process of doing this you will become familiar with the cell cycle and the process of mitosis and its stages, which are, oddly enough, the major goals of this activity! 1. Go back to the Biology Project at: http://www.biology.arizona.edu/ 2. Scroll down and click on “Cell Biology”. 3. Scroll down to “Activities” and then click on “On-line Onion Root Tips: Phases of the Cell Cycle”. 4. Read the introductory pages (about 3 total) and then complete the assignment as described. Record your responses in Table 2 of the Report Sheet page 103. Part 4. New Methods in Karyotyping: The Spectral Karyotype In this activity you will learn about a new technique for diagnosing chromosomal abnormalities, spectral karyotyping”. This technique is exciting because of its many applications, but also full of many controversial societal issues. On your report sheet are three questions pertaining to the old and new methods of karyotyping. Answer these questions on the report sheet as you do the following on-line reading assignment. 1. Go back to the Biology Project at: http://www.biology.arizona.edu/ 2. Scroll down and click on “Human Biology”. 3. Scroll down to “Activities” and then click on “New Methods in Karyotyping” 4. Read the introduction. Biology& 160 Laboratory Manual Mr. Brumbaugh 101 Spring 2014 5. To learn about the methods involved click on “Methods” at the bottom of the “Introduction” page. 6. To learn about some of the possible applications of this new method click on “Applications” at the bottom of the “Methods” page. 7. Don’t forget to answer questions 1-3 located in the Report Sheet page 104. 8. Turn in an individual Report Sheet with your darwings of the animal and plant mitotic cells. Biology& 160 Laboratory Manual Mr. Brumbaugh 102 Spring 2014 Report Sheet Lab Section: . Mitosis & Online Karyotyping Exercise Name: Part 2. . Web Karyotyping Data Patient Notation Diagnosis A B C Table 1 Web Karyotyping Data Information in this table shows the results of a web karyotyping exercise. Internet Search URL of Site: http:// . Title of Site: . Describe an interesting idea you learned at this site: Part 3. On-line Onion Root Tips: Phases of the Cell Cycle Interphase Prophase Metaphase Anaphase Telophase Total Number of Cells 36 Percent of Cells 100% Table 2 Mitotic and Cell Cycle Data Information in this table shows the number of cells in each phase of mitosis based on the results of an On-line Onion Root tip study. Tips: Phases of the Cell Cycle. What can be concluded about cellular tasks from the data collected above as it relates to cells in the cell cycle? Biology& 160 Laboratory Manual Mr. Brumbaugh 103 Spring 2014 Part 4. New Methods in Karyotyping: The Spectral Karyotype 1. Explain how each of the following karyotyping methods work. The “old” method, Giemsa Dye Karyotyping: The “new” method, Spectral Karyotyping using fluorescent dyes: 2. List and then in your own words briefly discuss at least four possible applications of spectral karyotyping. 3. Identify and very briefly describe at least three controversial societal issues associated with spectral karyotyping. You will need to do some thinking here since the Biology Project website does not discuss any of the many issues involved. Biology& 160 Laboratory Manual Mr. Brumbaugh 104 Spring 2014 Pre-Lab Report Sheet Lab Section: . Mitosis & Online Karyotyping Exercise Name: . Before coming to labs carefully read the previous pages on Mitosis and Online Karyotyping then answer these pre-lab questions. Be prepared to hand in your responses to the pre-lab questions at the start of lab. 1. Using your text, outline the steps or phases of mitosis by describing the major events of each phase of the process. 2. Cite reasons why cells would undergo mitosis and how does mitosis fit into the cell cycle. 3. Suggest how the use of stains could be applied to reveal other cellular processes such as photosynthesis, cellular respiration, or meiosis? 4. During which phase of mitosis are chromosomes harvested for karyotyping and why? Biology& 160 Laboratory Manual Mr. Brumbaugh 105 Spring 2014 Page to be used for Biological Doodling Biology& 160 Laboratory Manual Mr. Brumbaugh 106 Spring 2014 Laboratory 8: Mendelian Genetics Pre-lab Assignment Before coming to lab carefully read the pages on Mendelian Genetics, then define the words at the end of the introduction section (page 108) on a separate sheet of paper to facilitate completing this lab. Using your text or other sources begin to answer the questions associated with each activity. Be prepared to hand in your definitions at the start of lab. Perspectives In 1866 an Austrian monk, Gregor Mendel, presented the results of painstaking experiments on the inheritance patterns of garden peas. Those results were heard, but probably not understood, by Mendel’s audience. Now, more than a century later, Mendel’s work seems elementary to modern–day geneticists, but its importance cannot be over stated. The principles generated by Mendel’s pioneering experimentation are the foundation for genetic counseling so important today to families with health disorders having a genetic basis. It’s also the framework for the modern research that is making inroads in treating diseases previously believed to be incurable. In this era of genetic engineering the incorporation of foreign DNA into chromosomes of unrelated species—it easy to lose sight of the basics of the process that makes it all possible. Geneticists depict an individual’s genetic make–up in a variety of different ways depending on the particular set of alleles they are working with. This may be unfortunate for the casual observer or the novice, but there are some commonalties that help to diffuse potential obfuscations. The most common system for identifying and relating genetic make–up is the use of capital and lower case letters. For instance at a particular locus (site) you have an allele (an alternative expression of a gene received from a parent). The dominant allele (a characteristic seen with an increased frequency in a defined population) would be expressed by a capital letter, say “B” and the recessive allele (a characteristic seen with a decreased frequency in a defined population and masked by the dominant allele) by the lower case letter “b”. Homozygous dominant individuals would be indicated by the notation BB and homozygous recessive individuals by the notation bb. Heterozygous individuals, those that have one dominant allele and one recessive allele, would be indicated by the notation Bb. For the genetics of the ABO blood groups we use the capital letter “I” and then superscript the letter “I” with capital A’s, or B’s, or O’s to represent the alleles presence (IA, IB, IO). A similar type of notation occurs for other types of co-dominant genetic traits. Sometimes the apostrophe symbol is used to denote expression of a certain trait. Consider the following example of patterned baldness. Phenotypes Women Genotypes Men b´b´ Bald Bald b´b Bald Non-bald bb Non-bald Non-bald The apostrophe in the above table acts as an indicator of dominance in males and an indicator of recessives in women. What this actually denotes is the carrying of the trait for baldness on the b gene. Another type of notation is the use of the symbols plus (+) and minus (-). The plus sign would indicate that the allele for the expression of a particular trait is present (usually the wild type or normal allele) and the minus sign would indicate that it is not present (or that some mutated form of the normal gene is present. Sometimes we use the phrase wild type and symbol “wild” as a Biology& 160 Laboratory Manual Mr. Brumbaugh 107 Spring 2014 superscript to indicate the presence of the dominant naturally occurring allele. Often times you will see other sequences of letters that indicate the presence or absence of certain alleles. These short sequences are acronyms for a description of what the allele causes to be seen in the phenotype. In the case of simple dominance where a single dominant allele will mask the expression of a single recessive allele another nuance is added to the symbolic systems discussed. For example, a gene at a single locus controls tongue rolling. Individuals that can roll their tongues can have a genetic constitution of either RR or Rr. Non tongue rollers have a genetic constitution of rr. If you observe a person who can roll his tongue, what is his/her genetic constitution? Well without looking at the parents maybe for more than one generation back and/or one or more generations of progeny the answer is either RR or Rr. This is because you receive half of your genes from each parent. So, if one is uncertain, how do you express the genetic constitution of these individuals? The answer is R ? . We know they can roll their tongue so we know that at least one of their alleles is the dominant R allele. Exercise: Mendelian Genetics Goals of this Lab Exercise To understand the mechanisms of Mendelian Genetics To understand the process and application of the technique used by geneticists Be able to apply this knowledge to pedigree and karyotyping analysis Introduction Through a series of activities we will examine some of the principles of genetics and techniques developed by geneticists to predict mating outcomes and understand how genetic information is passed from generation to generation. Before coming to lab, refer to your textbook or other references and write definitions for the following words: chromosome, genes, locus, allele, dominant allele, recessive allele, genotype, phenotype, gamete, haploid, diploid, monohybrid, dihybrid, homozygous, heterozygous, and homologous chromosomes. Materials Pages 109 through 119 Procedure 1. Pair up with a classmate. 2. Do each of the activities and answer the questions in the space provided. 3. Turn in the completed Report Sheet as a pair. Biology& 160 Laboratory Manual Mr. Brumbaugh 108 Spring 2014 Report Sheet Lab Section: . Mendelian Genetics Exercise Group Names: . . Activity A. Tongue rolling (Able to form a U-shape when sticking out their tongue.) 1. What is the phenotype of an individual whose genotype is RR? 2. What is the phenotype of an individual whose genotype is Rr? 3. What is the phenotype of an individual whose genotype is rr? 4. What are your phenotype and genotype for tongue rolling? The distribution of alleles during the formation of gametes was one of the principles described by Gregor Mendel. It is called the Law of Segregation. The two alleles of a gene segregate, or separate, from each other so that each one ends up in a different gamete. 1. If a person’s genotype is RR, what are the genotypes of the resulting gametes? 2. If the person’s genotype is rr, what are the genotypes of the resulting gametes? 3. If the person’s genotype is Rr, what are the genotypes of the resulting gametes? 4. If your phenotype was tongue roller, what would you have to find out in order to know your genotype for sure? Activity B. Ear Lobes An unattached earlobe (F) is dominant to attached earlobes (f). We can only guess at the biological significance of the kind of earlobe might make. Did your grandmother or mother use yours a lot? 1. What is the phenotype of an individual whose genotype is FF? 2. What is the phenotype of an individual whose genotype is Ff? Biology& 160 Laboratory Manual Mr. Brumbaugh 109 Spring 2014 3. What is the phenotype of an individual whose genotype is ff? 4. What is your phenotype and genotype with respect to earlobe attachment? 5. If a person’s genotype is FF, what are the genotypes of the resulting gametes? 6. If the person’s genotype is ff, what are the genotypes of the resulting gametes? 7. If the person’s genotype is Ff, what are the genotypes of the resulting gametes? 8. If your phenotype was unattached earlobe, what would you have to find out in order to know your genotype for sure? 9. Joe Buxtawhody and the members of his immediate family have attached earlobes. His maternal grandfather has unattached earlobes. What is the genotype of his maternal grandfather? 10. His maternal grandmother is no longer living. What could have been the genotype of his maternal grandmother? Activity C. Ability to taste PTC, predicting an outcome PTC (phenylthiocarbamide) is an anti-thyroid drug that prevents the thyroid gland from incorporating iodine into the thyroid hormone. The ability to taste PTC is associated with the functioning of the thyroid gland. As with many patterns of inheritance, the nature of the relationship between “tasting” and disease is unknown. The ability to taste PTC is an autosomal (non sex shromosome linked) trait. Tasting (T) is dominant to non-tasting (t). 1. Can you taste PTC? 2. What is your genotype? 3. How do you know? When the genotypes of the parents are known, we may determine what gametes the parents can make and in what proportion the gametes will occur. This information allows us to predict the genotypes and phenotypes of the offspring. The prediction is simply a matter of listing all the Biology& 160 Laboratory Manual Mr. Brumbaugh 110 Spring 2014 possible combinations of gametes. In this section your will be doing monohybrid (one trait) crosses. By convention, the parental generations are called P. The first generation of offspring is called F1. F stands for filial, which refers to a son or daughter, so F1 is the first filial generation. If members of the F1 generation are crossed, their offspring are called the F2 generation and so on. Predict the results of the following cross using T and t to denote tasting and non-tasting, respectively. P generation TT x TT 1. What genotypes will be found in the F1 generation? 2. What phenotype(s) will be found in the F1 generation? 3. Explain why you made these predictions. Predict the results of the following cross: P generation TT x tt 1. What genotypes will be found in the F1 generation? 2. What phenotype(s) will be found in the F1 generation? 3. Explain why you made these predictions. The previous examples were fairly simple since the parents were only able to produce one type of gamete. However, the complexity escalates rapidly when parents can produce more than one type of gamete. To deal with the presence of more than one type of gamete we employ the Punnett square. This technique was developed by the geneticist Reginald Punnett in 1910 as a means of showing the probabilities of progeny outcomes. Consider the cross between the F1 progeny above, Tt, to produce the F2 generation. The F1 Cross is Tt x Tt 1. What type or kind of gametes can the first parent produce? 2. What kind of gametes can the second parent produce? Biology& 160 Laboratory Manual Mr. Brumbaugh 111 Spring 2014 3. The Punnett square would look like this. T t T t 4. Fill in the Punnett square. 5. What are the possible genotypes in the F2 generation? 6. What are the phenotypes of each genotype in the F2 generation? 7. What is the genotypic ratio of this cross? 8. What is the phenotypic ratio of this cross? 9. Joe cannot taste PTC, but both his mother and his father can taste PTC. Do a Punnett square to calculate the expected phenotypic ratio among Joe’s siblings. Activity D: The chromosomal basis of independent assortment using a dihybrid model Genes that are located on the same chromosome are linked with each other. If genes are located on separate, non-homologous chromosomes, they are not linked, or unlinked. Unlinked genes separate independently during meiosis (gamete formation). For example, consider the allelic pair T and t and a second allelic pair F and f. If the T gene and the F gene are not linked, their alleles can be found in any combination in the gametes. That is, the T allele can be in the same gamete as either the F allele or the f allele. This is Mendel’s Law of Independent Assortment. The word assortment in this case refers to the distribution, or sorting, of alleles into gametes. Assume the circle below represents a cell. Finish drawing the cell adhering to the following conditions: a diploid cell, with two homologous pairs of chromosomes, with two unlinked genes called T and F, and the cell is heterozygous with respect to both of these genes. 1. What is the genotype of this cell? Biology& 160 Laboratory Manual Mr. Brumbaugh 112 Spring 2014 2. The T gene is for tasting PTC and the F gene is for unattached earlobes. What is the phenotype of the individual represented by this cell? 3. Recall that when this cell undergoes meiosis, each gamete receives one member of each homologous pair. List the possible combinations of alleles that will be found in the gametes. 4. In what proportion would you expect these gametes to occur? Activity E. Predicting the outcome of a dihybrid cross The resulting phenotypic ratios in the F2 generation of a dihybrid cross (2 traits) can be quite different than those observed from a monohybrid cross. But the process is essentially the same. First you list all possible gametes each parent and subsequent parents can produce. Second, you then assign the gamete possibilities to the Punnett square and fill it in. Finally you count the progeny and determine the number of progeny in each phenotypic category. Remember, when determining the types of gametes possible, each gamete must have one member of each homologous pair of chromosomes. For example, if you are considering a T gene (ability to taste PTC) and an F gene (unattached earlobe), each gamete must have one allele for the T gene (either T or t) and one allele for the F gene (either F or f). 1. What type of gametes will the following genotypes produce? Genotype: TTFF Genotype: TtFF Genotype: ttFf Genotype: TtFf Gametes Gametes Gametes Gametes . . . . Cross or mate a homozygous tasting and unattached earlobe parent with a homozygous nontasting attached earlobe parent? 2. What are the genotypes of these two parents? 3. What type of gametes can each parent produce? 4. How many different types of gametes can each parent produce? Record the genotypes of the gametes each parent can produce. Biology& 160 Laboratory Manual Mr. Brumbaugh 113 Spring 2014 5. Construct the Punnet square that shows the cross between the parents. This can be tricky if you don’t understand gamete production from the parents. 6. What are the possible genotype(s) of the F1 progeny? 7. What are the phenotype(s) of the F1 progeny? 8. How many different types of gametes can the F1 parent produce? Record the genotypes of the gametes each parent can produce. 9. Construct the Punnet square to show the possible outcomes of a dihybrid cross between a mating of the F1 offspring (Do not do this at home unless you are a pea plant!). 10. What is the expected genotypic ratio of the F2 progeny? 11. What is the expected phenotypic ratio of the F2 progeny? 12. What would the expected phenotypic ratio of the F2 progeny be if the T gene and the F gene were linked in the F1? Biology& 160 Laboratory Manual Mr. Brumbaugh 114 Spring 2014 13. A couple with the genotypes TtFf and TtFf have 16 children. Twelve of them can taste PTC and have unattached earlobes; the other 4 can’t taste PTC, 2 of the 4 have attached earlobes and 2 of the 4 have unattached earlobes. Why doesn’t this family match the expected ratio? (Hint: If the probability of having a male child is 50% why can one family have 7 daughters and no sons?) Activity F. The ABO blood groups ABO blood groups are the most commonly known blood groups. Rh factor is another commonly known blood group. But in all fairness humans are much more complicated than that. There are currently over 300 different types of blood factors known to hematologists. ABO is an acronym for the three types of alleles an individual may potentially have. Of course a diploid individual can only have 2 alleles. The genotypes and phenotypes of different combinations of the three alleles are given in Table1. Phenotypes A B AB O Genotypes AA, AO BB, BO AB OO Table 1 Blood Types These are the most common blood type phenotypes and genotypes seen in humans. Notice that phenotypes A and B can have two possible genotypes. Notice also that blood types AB and O only have 1 possible type of genotypes. This situation is a pattern of inheritance referred to as co-dominance. The allele A is dominant to the allele O. The allele B is dominant to the allele O, but the allele A is co-dominant to the allele B, hence the phenotypic blood type AB. The Rh blood factor’s pattern of inheritance is the case of simple dominance that we have been assuming in this lab till now. The Rh blood factor is inherited as a single pair of alleles. Rh positive (Rh+) is dominant to Rh negative (Rh-). Answer the following questions. 1. A boy wonders if he is adopted. He compares his blood type to those of his parents. a. If the father is blood type AB and the mother is blood type O, what blood types would indicate that the child might have been adopted? b. If the father is blood type A and the mother is blood type B would blood typing help the boy determine if he was adopted? 2. If you are Rh+ can you know your genotype for sure? Why? 3. If you are Rh+ and everybody in your family is Rh+ (parents, siblings, offspring) what is/are your probable genotype(s)? Why? Do you know your genotype with absolute certainty? Explain. Biology& 160 Laboratory Manual Mr. Brumbaugh 115 Spring 2014 Activity G. Color Blindness Color blindness is a sex–linked (Table 2) recessive trait. Sex linked means that the trait would be localized to one of the two se chromosomes. The possible genotypes and phenotypes are given below. Females Genotypes XBXB Phenotypes normal vision Males Genotypes X BY Phenotypes normal vision XBXb normal vision XbY color blind XbXb color blind Table 2 Sex Linkage These are the most common designation for color blindness in humans. 1. Are you color blind? 2. If you are (or were) color blind, what is your genotype? 3. If you are a female and are not color blind, you can judge whether you are homozygous or heterozygous by knowing if any member of your family is color blind. a. If your father is color blind, what is your genotype? . b. If your mother is color blind what is your genotype? . c. If you know of no one in your family who is color blind, what is your probable genotype? . 4. The only member of Josephine’s family who is color blind is her brother. a. What is her brother’s genotype? . b. Her father’s genotype? . c. Her mother’s genotype? . d. What is Josephine’s genotype if she later has a color-blind son? . Activity H. Determine the genotype of the unborn Through genetic counseling, it is sometimes possible to identify parents who are likely to produce children with genetic disorders. And then it is sometimes possible to test fetal cells to determine if the newborn does indeed have the disorder. Pedigree charts can be constructed to show the inheritance of a genetic disorder within a family. Thereafter, it may be possible to determine whether any particular individual has an allele for that disorder. Then a Punnett square can be done to determine the chances of a couple producing an affected child. This process is called analysis by pedigree charts. Biology& 160 Laboratory Manual Mr. Brumbaugh 116 Spring 2014 Some genetic disorders are discovered following amniocentesis, a procedure that allows a physician to withdraw a portion of the amniotic fluid and thereby fetal cells by means of a long needle. The fetal cells are cultured and then a karyotype of the chromosomes is prepared. A karyotype shows all the chromosomes of the individual arranged by homologous pairs (analysis by karyotyping, refer to Lab 8 for information about karyotyping). Homologous chromosomes have the same size and shape. Karyotypes can show genetic aberrations. For instance, in humans, if you have an extra chromosome 21 you will have Down syndrome. Geneticists can now map human chromosomes, that is, they can find the exact loci for various genes. If the exact locus for a mutant gene causing a genetic disorder is known, geneticists can make copies of the gene and use these copies to test the chromosomes for the disorder. This is called analysis by genetic markers and involves the use of DNA probes (the copies of mutant genes) and restriction enzymes that cleave the DNA into manageable sizes for analysis. Analysis by pedigree charts There are three types of inheritance patterns you need to be aware of to complete this portion of the activity. Autosomal dominant shows with an increased frequency in a defined population Autosomal recessive shows with a decreased frequency in a defined populaiton Sex–linked recessive A trait that is an autosomal (trait is associated with one of the chromosomes number 1 through 22) dominant trait only needs one copy of the allele for the individual to be affected. A trait that is an autosomal recessive trait will require two copies of the recessive trait to be present in order for the individual to be affected. Sex–linked recessive traits primarily affect men not that women are totally excluded but the likely–hood of a women being affected is high. Look at the following table (Table 3) to see the possible genotypes and phenotypes for some common single gene inheritance patterns. Inheritance Pattern Autosomal Dominant Autosomal Recessive Sex–linked Recessive Genotype BB Bb bb BB Bb bb XBXB XBXb XbXb XBY XbY Phenotype Affected Affected Not affected Not affected Not affected Affected Normal female Normal female Affected female Normal male Affected male Table 3 Pedigree Analysis These are the most common designations for pedigree assignment in humans. Consider the following three pedigrees. Determine the pattern of inheritance and indicate the probable genotype for each individual in each pedigree (the analysis). Biology& 160 Laboratory Manual Mr. Brumbaugh 117 Spring 2014 Pedigree #1 I 1 Male 2 Female Unaffected II 1 2 Affected 3 III 1 Analysis: (Why did you label the genotypes of the family members the way you did?) Pedigree #2 I 1 2 3 4 II 1 2 3 4 5 III 1 Analysis: Biology& 160 Laboratory Manual Mr. Brumbaugh 118 Spring 2014 Pedigree #3 I 1 2 3 4 II 1 2 3 4 5 III 1 Analysis: Biology& 160 Laboratory Manual Mr. Brumbaugh 119 Spring 2014 Page to be used for Biological Doodling Biology& 160 Laboratory Manual Mr. Brumbaugh 120 Spring 2014 Laboratory 9: Modeling DNA Structure, Replication, & Protein Synthesis Pre-lab Assignment Before coming to lab carefully read the pages on Modeling DNA Structure, Replication & Protein Synthesis, then answer the pre-lab questions (pages 133 and 134). Be prepared to discuss and hand in your responses to the pre-lab questions at the start of lab. Perspectives This investigation differs from those you have completed up to this point. You will use various kinds of models to learn how DNA controls the activities of cells. Many scientists use models to understand biological processes. Watson and Crick used models to figure out the structure of DNA and scientists use models today to study biological problems, from the structure of proteins to making predictions concerning how environmental factors may influence entire ecosystems. In this investigation, you will work collaboratively with your partners to propose a structure for DNA, show how DNA is replicated, show how DNA acts as a template to make RNA, and show how RNA is used as a template to make protein. To accomplish these tasks you will use models of the building blocks of DNA, RNA, and protein to represent DNA replication and protein synthesis. Though it comes as no surprise that the composition of DNA between different organisms is different, it is not immediately obvious why the muscle cells, blood cells, and brain cells of any one particular vertebrate are so different in their structure and composition when the DNA of every one of their cells is identical. This is the key to one of the most exciting areas of modern cell biology. In different cell types, different sets of the total number of genes (genome) are expressed. In other words, different regions of the DNA are "active" in the muscle cells, blood cells, and brain cells, while other regions remain inactive or unaccessable to the cell. To understand how this difference in DNA activity can lead to differences in cell structure and composition, it is necessary to consider what is often known as the central dogma of molecular biology (Figure 1): "DNA copied into RNA and RNA is read into protein”. In molecular terms, a gene is that portion of DNA that encodes for a single protein. The dictum "one gene makes one protein" has required some modification with the discovery that some proteins are composed of several different polypeptide chains, but the "one gene makes one polypeptide" rule does hold. Central Dogma of Biology: DNA RNA Protein (Product) Phenotype Figure 1 Central Dogma The central dogma of biology states that DNA contains a genetic code that allows it to make copies of itself that can be read into a protein to define a phenotype.. An essential group of proteins, called enzymes, act as biological catalysts and regulate all aspects of cell metabolism and conspire to complete the steps of DNA replication and protein synthesis or essentially they regulate you. Their role in DNA replication and protein synthesis are vital in maintaining the integrity of these molecules to ensure continued functioning of the cell. In fact the structure of the enzyme is encoded into the DNA molecule. The Structure of DNA: Nucleotide strands DNA is a double helix shaped molecule, with about 10 nucleotide pairs per helical turn (Figures 2 and 3) in an anti-parallel arrangement (5’ to 3’ and 3’ to 5’). Each spiral strand consists of nucleotide molecules composed of a phosphate group (P), a sugar (deoxyribose) (S), and attached base (B) or P-S-B, that is connected to a complementary strand by hydrogen bonding between paired bases, adenine (A) with thymine (T) and guanine (G) with cytosine (C). Two Biology& 160 Laboratory Manual Mr. Brumbaugh 121 Spring 2014 hydrogen bonds (weak non-covalent bonds) connect adenine and thymine, while guanine and cytosine are connected by three. James Watson and Francis Crick first described this structure in 1953. Figure 2 DNA Structure DNA is a double stranded molecule, each strand consisting of a chain of nucleotides. Each nucleotide consists of a phosphate group, a deoxyribose sugar, and a nitrogen containing base (Guanine Cytosine, Adenine, or Thymine). Weak hydrogen bonds between the bases of each strand hold the two strands together. Figure 3 DNA Structure An illustration of the double helical structure of the DNA molecule. Nucleic acids are long, chain-like molecules formed by the linking together of smaller molecules called nucleotides. The nucleic acid DNA or deoxyribonucleic acid is the material from which genes are made. Watson and Crick used information gathered by other researchers to make models of DNA in 1953. Their models led them to make one of the greatest scientific discoveries of the last century, the determination of the structure of DNA. Chemical analyses of DNA prior to the 1950’s had shown that DNA is constructed from building blocks called nucleotides. Chemists found that a nucleotide is composed of the following covalently linked together: a sugar (deoxyribose), one phosphate group, and a nitrogen base (P-SB). Notice the polarity of DNA and RNA. There is always a 3’ and 5’ prime end of each strand (Figure 4) due to the number sequence of the carbons in the nucleotide sugar (Figure 5). The phosphate is always attached to the 5’C of the nucleotide sugar (either deoxyribose or ribose) and the nucleotide base is always attached to the 1’C of the sugar. This orientation leaves the 3’C Biology& 160 Laboratory Manual Mr. Brumbaugh 122 Spring 2014 available to attach to the next nucleotide (P-S-B) at its phosphate end (5’C). Why is this specific orientation required in both DNA and RNA? Figure 4 Representation of DNA Replication The two strands of the original DNA molecule separate, and then each serves as a template in the formation of two new DNA molecules that will have the identical base sequence as the one original DNA molecule. Figure 5 Sugar Carbon Ring Numbering Each carbon in a sugar ring is numbered starting with the carbon to the right of the oxygen in the ring. DNA Replication: Semi-conservative replication To reproduce a cell must first copy and transmit its genetic information (DNA) to all of its progeny. To do so, DNA is replicated, following the process of semi-conservative replication (Figure 4) by laying down the new bases in a 5’ to 3’ direction by reading the original strand in a 3’ to 5’ direction. Because of this orientation the replication process follows one strand in a straight forward direction(leading strand) while the opposite strand is read in short sequences (called Okasaki fragments) in the opposite direction from the leading strand but in the correct direction in terms of 5’ to 3’ (lagging strand). Each strand of the original molecule acts as a template for the synthesis of a new complementary DNA molecule. In the last section of their paper, Watson and Crick added this statement: “It has not escaped our notice that the specific base pairing we have postulated immediately suggests a possible copying mechanism for the genetic material”. The process they were thinking of involved the separation of the two strands of DNA by an enzyme known as DNA Helicase. Once open another enzyme called RNA Primase lays down a short sequence using RNA bases as a primer to direct the enzyme called DNA polymerase III to read the original strand and lay down the appropriate base in the opposite position to build a new strand of DNA. Another enzyme called DNA polymerase I comes along and reads the primers as RNA and subsequently removes this portion and adds the appropriate DNA bases to complete the new strand and finally DNA Ligase ties all the loose ends together such that two single-stranded sections of DNA are formed from one double-stranded molecule or from replication. The key is the consistence to hopefully avoid copyingissues or mutations. Biology& 160 Laboratory Manual Mr. Brumbaugh 123 Spring 2014 DNA RNA: Transcription RNA is produced using DNA as a pattern. During this process, called transcription, the genetic code is transferred from DNA to RNA. During transcription the two strands of a DNA molecule become separated by a group of enzymes known as transcriptions factors along part of the molecule’s length by binding to a region known as a promoter region. One strand, the non-coding strand, remains inactive (maybe used at another time), but the other, the coding strand, is used as a template to synthesize RNA, a single stranded molecule. The enzyme responsible for transcription, RNA polymerase, like DNA polymerase, can only build RNA in the 5’ to 3’ direction (Why?). Therefore, transcription begin at the 3’ (sugar) end of the DNA molecule strand that is going to be read by pairing each DNA nucleotide with its RNA complement. The base pairing rules are the same as in DNA, except Uracil pairs with Adenine since RNA does not contain Thymine. The process is completed when the transcription factors read a terminator region. Before the synthesis of a protein begins, the corresponding RNA molecules messenger (mRNA), transfer (tRNA), and ribosomal (rRNA) are produced by RNA transcription (Figures 5 and 6) by reading the DNA strand in a 3’ to 5’ direction and laying RNA bases down in 5’ to 3’ direction. One strand of the DNA double helix is used as a template (coding strand) by the enzyme RNA polymerase to synthesize RNA. The RNA’s migrate from the nucleus to the cytoplasm. During this step, RNA’s goes through different steps of maturation including splicing out non-coding sequences (called introns (these regions do not code for product as far as we now know)) from coding sequences (called exons (both sides of the DNA code for product in these regions)) and adding a GTP cap (not shown) to the 3’ end and a poly A tail (not shown) to the 5’ end of the molecule. The coding sequence of the mRNA can be described as units of three nucleotides called codons. Figure 5 DNA Transcription RNA polymerase faithfully copies DNA to produce RNA molecules. Figure 6 DNA Transcription During transcription the two strands of a DNA molecule become separated along part of the molecule’s length. Only one of the two strands of DNA, the coding strand (the bottom strand in this case) acts as a template during transcription. The enzyme RNA polymerase reads the coding strand to produce a single stranded RNA molecule by following the base pairing rules used in DNA, with one exception—since thymine is not found in RNA, uracil pairs with adenine. Biology& 160 Laboratory Manual Mr. Brumbaugh 124 Spring 2014 Take Note... Transcription produces three major types of RNA which all get transported from the nucleus through a nuclear pore to the cytoplasm of the cell. Ribosomal RNA (rRNA): Combines with proteins in the cytoplasm to form ribosomes, the protein making factories of the cell. Messenger RNA (mRNA): Brings the instructions for protein synthesis (the genetic code) from DNA in the nucleus to the ribosomes. Transfer RNA (tRNA): Combine with amino acids in the cytoplasm and transport them to the ribosome where tRNA interacts with ribosomes and mRNA to link the amino acids together to form proteins. There is a different tRNA molecule for each of the 20 amino acids. Each tRNA molecule consists of about 75 nucleotides. At one end of each tRNA molecule is a three base sequence called the anticodon, that are complementary to one of the codons in mRNA. An activating enzymecalled aminoacyl-tRNA synthetase can attach a specific amino acid to the opposite end (3’) of the tRNA molecule. This enzyme is specific for a particular amino acid and a particular tRNA: each tRNA can carry only one kind of the 20 naturally occurring amino acids. RNA Protein: Translation The process of translation begins with the binding of a ribosome to the mRNA at the start codon, AUG. The ribosome proceeds to slide down the mRNA molecule reading its message three bases (i.e. one codon) at a time (Figure 7). During this stage, complexes, composed of an amino acid linked to tRNA, sequentially bind to the appropriate codon in mRNA by forming complementary base pairs with the anticodon of the transfer RNA (tRNA). The ribosome(containing a short strabnd of rRNA) moves from codon to codon along the mRNA as amino acids are added one by one, translated into polypeptide sequences dictated by DNA and represented by mRNA. At the end, a release factor binds to the stop codon, terminating translation and releasing the complete polypeptide (protein) from the ribosome. Since one specific amino acid can correspond to more than one codon, the genetic code is said to be redundant. Figure 7 RNA Translation or Protein Synthesis During protein synthesis, ribosomes move along the mRNA molecule and "read" its sequence three nucleotides at a time (codon) from the 5' end to the 3' end. Each amino acid is specified by the mRNA's codons. Each codon pairs with a specific anticodon, a sequence of three complementary nucleotides at one end of a tRNA molecule. Since each tRNA molecule carries a specific amino acid at one end, the order of codons on the mRNA molecule determines the order of amino acids to be linked together during protein synthesis. Proteins then are long chains of amino acids constructed by varied arrangements of the 20 different amino acids. As the proteins are released from the ribosome, they fold into unique shapes (conformation) that depend on the particular sequence of amino acids in the chain. Hence, it is the protein’s primary structure (i.e. the order of the amino acids in the protein), which is encoded in the gene and faithfully transcribed to produce mRNA, which in turn is translated by ribosome’s into an amino acid chain, that determines the three-dimensional structure of a protein, Biology& 160 Laboratory Manual Mr. Brumbaugh 125 Spring 2014 and thus its particular function. The human body possesses some 30,000 different kinds of proteins and several million copies of many of these. Each plays a specific role. For example, hemoglobin carries oxygen in the blood; actin and myosin interact to generate muscle movement, and acetylcholine receptor molecules mediate chemical transmission between certain nerve and muscle cells. The versatility of proteins, the workhorse molecules of the cell, stems from the immense variety of molecular shapes that can be created by linking amino acids together in different sequences. The smaller proteins consist of only a few dozen amino acids, whereas the larger ones may contain in excess of 200 amino acids, all linked together in a linear chain by peptide bonds. There exact sequence dictated by DNA and represented by mRNA is constructed through the joint processes of transcription and translation. Translation of the mRNA molecule involves each type of RNA. The ribosome (40S and 60S template) is attached to the mRNA by reading a start codon. The shape of the ribosome allows for only two tRNA’s to match their individual anti-codons to respective codons within the ribosome at one time. These matching sites are called the ribosome P and A sites, respectively. Enzymes found outside the ribosome detach the amino acid bonded to the first amino acid and attach it the second tRNA’s amino acid. The ribosome is then shifted to open the next codon and the steps repeat to lengthen the building protein one amino acid at a time, until a stop codon (no tRNA matches the codon of the three stop codons) is read at the end of the mRNA. Once the stop codon is read the resulting protein is released (What happens to it to become functional?) from the last tRNA, the ribosome is removed, and the message is recycled. Figure 9 and Table 1 are based on the three codon bases of mRNA. The Genetic Code: Three Base Sequences The process of identifying the sequence of amino acids in a protein, then reading them back into mRNA codons, and then to DNA base sequences began in the 1930’s by work done by Tatum and Beadle. In 1961 Nirenberg proved that by repeatedly linking uracil (UUUUUUU) into an mRNA the resulting protein contained only one amino acid (phenylalanine). From this beginning molecular biologists have identified the amino acid that is associated with each of the mRNA codons. The following figures (Figure 8 and 9 plus Table 1) show this relationship and also identifies the special start and stop codons. Since RNA is constructed from four types of nucleotides, there are 43 or 64 possible triplet sequences or codons. One of these codons plays a dual role in mRNA. If AUG is read in the mRNA sequence it signifies placing a methionine in that position, but when the AUG is placed at the beginning of the mRNA it also indicates where the rRNA is attached to begin the process of translation or the start codon. Three other codons (UAA, UAG, or UGA) specify the termination of the polypeptide chain and are called the "stop codons" (What happens to each of the RNA’s when translation is completed?). The remaining 61 codons are used to specify the other 19 different amino acids. Therefore, most of the amino acids are represented by more than one codon and the genetic code is said to be redundant, except for UGG (codes for tryptophan) (Why?). Figure 8 Translation The Pairing of a Codon in mRNA with an Anticodon of the tRNA inside a ribosome with rRNA (not shown). Biology& 160 Laboratory Manual Mr. Brumbaugh 126 Spring 2014 Figure 9 The Genetic Code The three bases of an mRNA codon are designated here as the first, second, and third bases, reading in the 5' to 3' direction along the mRNA. Note that UGG is the only codon for the amino acid tryptophan, but most amino acids are specified by two or more codons. For example, both UUU and UUC code for the amino acid Phenylalanine. When either of these codons is read by a ribosome moving along an mRNA molecule, Phenylalanine will be incorporated into the growing protein molecule. Think of UUU and UUC as synonyms in the genetic code. Note that AUG codes for the amino acid methionine but also functions as a “START” signal for ribosomes to begin translating the mRNA at that location. Three of the 64 codons function as "STOP" signals. Any one of these termination codons marks the end of the genetic message. Ala: Alanine Cys: Cysteine Arg: Arginine Asn: Asparagine Asp: Aspartic acid Gln: Glutamine Glu: Glutamic acid Gly: Glycine His: Histidine Ile: Isoleucine Leu: Leucine Lys: Lysine Met: Methionine Phe: Phenylalanine Pro: Proline Ser: Serine Thr: Threonine Val: Valine Trp: Tryptophan Tyr: Tyrosine Table 1 Amino Acid Abbreviations This table shows the abbreviations for each of the twenty different amino acids that are used to build proteins coded for in the DNA Exercise: Modeling DNA Structure, Replication, & Protein Synthesis Goals of this Lab Exercise Describe the components of DNA and RNA nucleotides Explain how DNA is replicated within a cell and use models to model the process Explain how DNA is transcribed to produce RNA and use models to model the process Explain how mRNA is translated into protein and describe the role of each of the following in the process: mRNA, tRNA molecules, amino acids, and ribosomes Determine the amino acid sequence of a protein when given the base order of the coding or non-coding strand of a gene Biology& 160 Laboratory Manual Mr. Brumbaugh 127 Spring 2014 Compare and contrast the possible effects each of the following point mutations have on the amino acid sequence of a protein: a single base substitution, a single base deletion, and a single base addition Introduction This lab is actually divided into four activities that are reliant on each other. For you to complete each of the activities a clear understanding of the perspectives section is imperative. Discuss the answer to the pre-lab questions with your classmates to ensure that you have a grip on the ideas supporting this lab before proceeding. You will be working with a group and a puzzle kit to demonstrate the structure of DNA and the processes of DNA replication and protein synthesis. Ask questions to clarify these concepts. Sometimes it is relatively easy to take puzzle tiles and organize them into the resulting puzzle without ever appreciating the under lying process or the picture. Materials DNA Replication and Protein Synthesis modeling kit with directions Clear desk space to build models Procedure Activity A. Modeling DNA Structure 1. Follow the instructions provided by your instructor and answer the appropriate questions on your Report Sheet to understand DNA Structure. 2. Once all group members understand the structure of DNA, call your instructor, demonstrate the model, and have them sign Table 2 (page 130) on the Report Sheet. Activity B. Modeling DNA Replication 1. Follow the instructions provided by your instructor and answer the appropriate questions on the Report Sheet to understand DNA Replication. 2. Once all group members understand the replication process of DNA, call your instructor, demonstrate the model, and have them sign Table 2 (page 130) on the Report Sheet. Activity C. Modeling Protein Synthesis = Transcription 1. Follow the instructions provided by your instructor and answer the appropriate questions on your Report Sheet To understand DNA Transcription. 2. Once all group members understand the transcription process of DNA, call your instructor, demonstrate the model, and have them sign Table 2 (page 130) on the Report Sheet. Activity D. Modeling Protein Synthesis = Translation 1. Follow the instructions provided by your instructor and answer the appropriate questions on your Report Sheet To understand RNA Translation 2. Once all group members understand the translation process of mRNA, call your instructor, demonstrate the model, and have them sign Table 2 (page 130) on the Report Sheet. Activity E: Group Report Sheet 1. As a group complete the questions on pages 129 through 132 and turn in one set at the start of the next lab. Biology& 160 Laboratory Manual Mr. Brumbaugh 128 Spring 2014 Report Sheet Lab Section: Modeling DNA Structure, Replication, & Protein Synthesis Exercise . Group Names: . . . . The following questions should be answered as you build the model to represent DNA, replicate DNA, and synthesize a protein. Activity A. 1. To which carbon of the nucleotide sugar does the nitrogen base and the phosphate group attach? 2. If the “backbone” of one strand runs 5’ to 3’, what is the orientation of the opposing strand? 3. How are the nucleotides arranged in the DNA molecule? 4. How does DNA replicate and why is maintaining molecular orientation critically important? 5. What is a mutation and how is it reproduced? 6. How does a deoxyribose sugar differ from a ribose sugar? 7. List two ways to tell that this is a model of DNA and not RNA. Biology& 160 Laboratory Manual Mr. Brumbaugh 129 Spring 2014 Complete the table below using the principles discovered in Activities B through D. Noncoding Strand Coding Strand 3’ - C G G T C C A G T C C A - 5’ m-RNA Amino acid sequence of peptide 8. What individual molecules contain the code, the codon, and the anti-codon sequences within their structure? 9. Where is the eukaryotic cellular site of transcription and translation? 10. What could happen to the protein after construction but before it becomes functional? Instructor’s Signature Modeling DNA Structure Modeling DNA Replication Modeling Transcription Modeling Translation Table 2 Instructor’s Signature You need to obtain your instructor’s signature in each box once your group has shown knowledge for each portion of the lab. Application Questions: 1. The DNA sequence below (top of next page) is part of the non-coding strand of the -globin (beta globin) gene that codes for a small portion of hemoglobin, the protein that transports oxygen in your blood. Within the box write the base sequence of the coding strand in the table below - Indicate the 5’ and 3’ ends. Now record the base sequence that would result if this section of the -globin gene were to be transcribed - Indicate the 5’ and 3’ ends. Finally, use the table of the genetic code (Figure 9 and Table 1) to translate this mRNA into protein. List in the table below the order of the amino acids that would be found in the resulting peptide below the codon sequence in the mRNA. Biology& 160 Laboratory Manual Mr. Brumbaugh 130 Spring 2014 Non-coding Strand of -globin gene 5’ - A C C C A G A G G T T C T T T - 3’ Coding Strand m-RNA Amino acid sequence 2. The entire -globin chain has 146 amino acids. What would be the minimum number of nucleotides in the mRNA that would encode the -globin protein? Explain your reasoning: 3. How many tRNA molecules will be needed to translate the -globin mRNA into protein? Explain your reasoning: 4. List the base sequence of the anticodon for each of the tRNA molecules needed to translate the -globin mRNA into protein in the table below. Anticodon Base sequence in anticodon of tRNA 1st 2nd 3rd 4th 5th Table 3 tRNA Anticodons Counter match anticodons with the codons in the example mRNA above. 5. Determine the effects of the following mutations on the -globin gene. Use the three letter amino acid abbreviations (Table 1) to write the sequence of amino acids that would result if there was a mutation in which an “A” has substituted for the underlined C of the noncoding strand of the -globin gene. Note: Any changes to the non-coding strand will always affect the coding strand! Base sequence of coding strand of the mutant DNA: . Base sequence of the new mRNA: . Amino acid sequence: . 6. What would be the amino acid sequence if an “A” substituted for the underlined G? Base sequence of coding strand of the mutant DNA: . Base sequence of the new mRNA: . Amino acid sequence: . Biology& 160 Laboratory Manual Mr. Brumbaugh 131 Spring 2014 7. What would the amino acid sequence be if you deleted the underlined C of the non-coding strand? Base sequence of coding strand of the mutant DNA: . Base sequence of the new mRNA: . Amino acid sequence: . 8. What can you conclude about the impact on a protein from these two types of mutations? (I.e. How does a point mutation that involves the substitution of a single base affect a protein compared to a point mutation involving the deletion of a single nucleotide?) Explain the reasoning behind your response. Biology& 160 Laboratory Manual Mr. Brumbaugh 132 Spring 2014 Pre-Lab Report Sheet Lab Section: Modeling DNA Structure, Replication, & Protein Synthesis Exercise . Name: . Before coming to labs carefully read the previous pages on DNA Structure, DNA Replication, DNA Transcription, and RNA Translation then answer these pre-lab questions. Be prepared to hand in your responses to the pre-lab questions at the start of lab. 1. Explain how it is possible for you to have so many different kinds of cells in your body (e.g. muscle cells, skin cells, liver cells, etc.) when nearly all of the cells contain the same 46 molecules of DNA (chromosomes). 2. Explain in your own words your understanding of the central dogma of biology. 3. Answer each of the following questions. What is the primary structure of a protein? Of what importance is the primary structure of a protein? What ultimately determines the primary structure of a protein? What is a mutation? During what process are mutations most likely to occur? Why do mutations affect the primary structure of a protein? Biology& 160 Laboratory Manual Mr. Brumbaugh 133 Spring 2014 4. Describe in your own words the structure of DNA. 5. Describe in your own words how DNA makes copies of itself. (I.e. Describe DNA replication.). 6. Protein synthesis involves two processes, transcription and translation. Describe in your own words how each process occurs. Transcription Translation Biology& 160 Laboratory Manual Mr. Brumbaugh 134 Spring 2014 Laboratory 10: Paper Project Handout Perspectives Each person will work in a group of about 4 people on a project that addresses a topic related to cellular biology (suggestions can be found on pages 137 & 138). It can be a scientific question or a question arising from the application of scientific advances to societal problems. For this assignment, the topic must have some interesting cell biology associated with it. When presenting various aspects of the topic, it is important that there is a biological basis to support the premise. The group will select a topic and then divide the topic into four subcategories. For example the group decides to investigate Stem cell research. They could then divide up the overarching topic into the history of stem cell research, definition and discussion of the process of stem cell research, the protagonist’s side of stem cell research, and the antagonist’s side of stem cell research. Each student will find their own references, write a four page narrative summary paper on their individual topic, and finally the group will organize an oral presentation to present their research to their lab section. The Paper Project consists of five graded assignments: Project References (Appendix C and Appendix F), Initial Draft of Paper, Final Draft of Paper, and a Group Oral Presentation (Appendix E). Each of these four assignments is described on the pages that follow. Refer to the table below for dues dates and how each assignment contributes towards your quarter grade. Assignment Basis for Grade 1. Project References 2. Initial Draft of Paper 3. Final Draft of Paper One list per person (Individual grade) One paper per person (Individual grade) One paper per person (Individual grade) One plan per group (Group grade) 4. Group Oral Presentation Points for Assignment 10 points Due Dates for 60 points At the start of your lab during week 5 At the start of your lab during week 7 At start of lab of week 9 70 points At start of lab of week 9 30 points This assignment is to give you the opportunity to use the knowledge you have gained or will gain throughout this course and kind of bring the ideas to bear by presenting a body of evidence to support your premise. Approach this project with the vigor of attempting to move your peers into a realm of questing knowledge. Procedure Assignment 1: Project References = 10 points Each group member will individually: 1. Turn in a typed list of the references they have found, with at least 4 being referred, and with the title of the paper on the page. The list should be in the proper format outlined in Appendix C. Using the Holman Library (See Appendix F) The GRCC Library offers excellent electronic methods for finding reference materials for your projects. Most can be accessed directly via the World Wide Web. The GRCC Library Catalog contains all of the books at the college, but books are probably not the best source for this project. Most of your references should be periodicals as they are usually more specific and up-to-date. There are several searchable electronic databases available for your use. A GRCC librarian will be Biology& 160 Laboratory Manual Mr. Brumbaugh 135 Spring 2014 happy to assist you in determining the databases most appropriate for your project. You may find that some of the periodicals that would be of greatest help for your project are not available through the GRCC Library. If this is the case, please talk to a librarian about how to get copies of articles that you need from other libraries in the region. Often you can get what you need in a couple of days. The references you pick are not all created equally! The best source is information from the scientists who conducted the study. Try to find information of this type—much of it may be too technical but you should be able to glean some information from it. The second best source is popular science journals such as Scientific American, Science News, American Scientist, or Discover. Most of your references will probably be of this type. Since these periodicals are devoted to science, they tend to be better sources of information than general magazines such as Time or Newsweek. General popular references such as newspapers and general magazines may sometimes be helpful but don’t limit yourself to these. Each person should try to find at least 4 references of high quality. Remember that part of your grade for your paper is based on the quality of your references. The World Wide Web also provides an excellent source of materials. Web pages vary in quality enormously, so you should take care to use sources that provide accurate information. Look carefully for the biases of the authors. Many news magazines, newspapers and journals now publish on the web. These will tend to be more reliable than individually published web pages. The latter may be very useful, though, particularly if they cite references. Do not limit yourself to material that is strictly web based. Every scientific publication provides an “Instructions to Authors” that describes the format for the references section and all other requirements for papers they will accept. The format for citing references varies slightly from one scientific publication to another. By following the guidelines as outlined in Appendix C you will insure your citations are cited correctly. Assignments 2 & 3: Draft and Final Paper Project = 30 and 60 points Every member will turn in a paper on one aspect of your group’s topic using the references you have found. This report should be about 4 pages typed and double-spaced. Your title page, figures, and references should be on additional pages. High quality papers are expected. Use a word processor and save your electronic version of the paper until after you receive your grade. Computer crashes are not an excuse for late papers. Make back-up copies of your paper as storage disks are unreliable. It’s a good idea to keep a hard-copy too. The initial draft of your paper is due at the beginning of lab during the 7th week. You should bring 2 copies of your paper to lab. One copy will be turned in and the second copy will be given to another member of the class. You will read another class member’s paper, make comments on the paper and return it to the writer. The final version of your paper is due at the start of lab during the ninth week of class. You will receive two grades for your paper: a rough grade and a final grade. The rough paper grade will be based on the quality of your rough draft of your paper, as well as the quality of the comments you receive when evaluated by your peers in class. The final draft of your paper will be graded more carefully. You should staple your rough paper (with comments) and my grade rubric to the back of your final paper. Assignment 4: Group Oral Presentation = 70 points The final component of this assignment is the group oral presentation (see Appendix F). This should be a means for your group to communicate your new found knowledge to your peers in (hopefully) a convincing manner. Each member will be involved in the presentation by presenting a united front of ideas to the audience. What material to present after all, a presentation is meant for conveying information? You need to know the topic as a whole, as well as the specific aspects of it. For example, if you were Biology& 160 Laboratory Manual Mr. Brumbaugh 136 Spring 2014 giving a presentation on vaccines against HIV, you need to have a thorough knowledge of the HIV life cycle and the human immune system’s response to HIV, as well as a specific knowledge about how vaccines against HIV might work and why they so are controversial. How to organize the material; organized information is easier to remember for you and easier to understand for others (Use the rubric in the syllabus for assistance). Notes are fine, but don’t write a paper—an organized outline or a list is much more useful for a presentation. IMPORTANT: Eye contact with the audience is essential—do not read directly from your notes, PowerPoint presentation, etc.—use them only as quick reminders as to what you want to discuss—do not use them as a “crutch,” only as an occasional aid. How to present the information; there are many ways to present material. The best format is the one that allows you to convey information clearly. A controversial topic might involve a debate format, and statistics might be presented best graphically, etc. Use visual aids to facilitate the audience’s understanding of your presentation. You can use PowerPoint, overhead projector transparencies, video clips, etc. I can help you use these, but only if you notify me well in advance of your presentation. Your group’s presentation should be about 15 minutes long—add to this an additional 5 minutes for questions/class discussion. This works out to about 5 min. per person for a threeperson group; 3-4 min. per person for four person group, etc. You may incorporate various styles; debate, skit, lecture, poster presentation, etc., or you can stick to one style. Do not to read a prepared paper or lengthy note cards. DO NOT give too much information, but, rather, summarize the important points in a thoughtful manner. Go slowly, and emphasize main points. Use visual aids to facilitate the audience’s understanding of your presentation. You can use PowerPoint, overhead projector transparencies, video clips, etc. I can help you use these, but only if you notify me well in advance of your presentation. How to get started! Search existing literature, start early because searches take time (See Appendix F). You need to know what information is available, as well as hot or controversial topics in the fields. To gain a comprehensive view of the field, I recommend starting with a book chapter or a review article. Use the reference sections from those to find more detailed information. Moreover, there are many links at the class website that may prove useful. Come talk to me in person. You can get a lot of feedback from me at any point during the preparation. Added benefit is that you can figure out my preliminary evaluation of your presentation, so that you will know how much and what kind of work you have to do quality work. Organize your work. You are working with others. Clearly organizing and designating responsibility for each is extremely important. I recommend getting together regularly (e.g. 2-3 times week for at least 30 min. each), so that you can give each other update on how things are going. Your group will be scored by the rubric found in your syllabus for the group presentation. Possible topics for the paper: Biological Basis for Human Races: Is there a biological basis for dividing people into races? Genetic Modification of Food Crops: Are GM foods safe to eat? Genetic Engineering of Organisms (e.g. plants, animals, or microbes): Do the benefits outweigh the possible drawbacks? The Puzzle of Hypertension in African-Americans: Why is high blood pressure the leading cause of health problems among black Americans while the people of western Africa have among the lowest rates of hypertension anywhere in the world? Somatic Cell Gene Therapy: Should somatic cell gene therapy be used to treat genetic diseases? Biology& 160 Laboratory Manual Mr. Brumbaugh 137 Spring 2014 Slowing Human Aging: Is it possible to slow down the aging process? Genetic Basis of Aging: How important are genes in determining life expectancy? Alzheimer's disease: Is a cure imminent? Why are more women than men affected by it? Abortion Pill: Is the use of RU 486 harmful to woman's health? Should it be banned? Attention-Deficit Hyperactivity Disorder: Is there are genetic basis to the neurological abnormalities involved with ADHD? Hormone Replacement Therapy: Should postmenopausal women use hormone replacement therapy (HRT) to reduce/prevent osteoporosis? Human Cloning: Should human cloning research be allowed/funded by the federal government? Human Fetal Tissue Research: Should the federal government allow/fund medical research involving human fetal tissue obtained from aborted fetuses and umbilical cords or are there alternative sources for stem cells for medical research? Homosexuality: Is there a genetic basis for homosexuality? Thrill/Novelty Seeking: Is there a genetic basis for thrill or novelty seeking? Obesity: Is there a genetic basis for obesity? Genetic Basis of Heart Disease: Are national differences in rates of heart disease environmentally or genetically caused? What is the role of a dietary cholesterol and fat in heart disease? Alcoholism/Substance abuse: Is there a genetic basis for alcoholism/substance abuse? Alternative Cancer Therapies: Traditional (chemotherapy and radiation) vs. alternative/experimental therapy do cancer patients have an alternative to the devastating effects of chemotherapy and radiation therapy? Safety of Food Additives: Do food preservatives/additives pose a significant health risk (e.g. cancer, developmental problems, etc.)? Are they being regulated properly? Hormone use by the food industry: Is it a human health hazard to eat food products derived from hormonally treated animals? Depression: What is the biological cause of depression? Child Abuse: Should mothers of drug-addicted babies/fetal alcohol syndrome be prosecuted for child abuse? Cloning for Medicine: Hype or a possible reality? Genetic Basis of Athletic Performance: Can anyone become a world class athlete if they train properly? What role(s) do genes of the athlete play? Nutritional supplements: Is it worth the expense to take nutritional supplements? (e.g. Vitamin supplements, melatonin, anti-oxidants, etc.) Genetic Testing and Screening: Should widespread testing for cystic fibrosis (or other genetic diseases) be implemented? Biology& 160 Laboratory Manual Mr. Brumbaugh 138 Spring 2014 Appendix A: How to graph scientific data? Often the first step in analyzing the results of an experiment is the presentation of the data in the form of a graph. A graph is a visual representation of the data, which assists in bringing out and finding the possible relationship(s) between the independent and dependent variables. Examination of a graph makes it much easier to see the effect the independent variable has on the dependent variable(s). Accurate and clearly constructed graphs will assist in the interpretation and communication of your data, and when presenting a well-documented argument supporting or falsifying your hypothesis in the final steps of a scientific investigation. All graphs should be easy to interpret and labeled fully. The following guidelines will help you construct a proper graph. Graphing tips 1) Use graph paper of a high quality. 2) A ruler should be used to draw axes and to plot data neatly and accurately. 3) Always graph the independent variable on the x-axis (horizontal axis), and the dependent variable on the y-axis (vertical axis). 4) The scales of the axes should be adjusted so that the graph fills the page as much as possible. The axes often, but not always, start at zero. Choose your intervals and scales to maximize the use of the graph paper. Intervals should be logically spaced and easy to interpret when analyzing the graph (e.g. intervals of 1’s, 5’s, or 10’s are easily interpreted, but non-integer intervals (e.g. 3.25’s, 2.33’s, etc.) are not. To avoid producing a graph with a lot of wasted space a discontinuous scale is recommended for one or both scales if the first data point is a large number. Simply add two tic marks between the zero and your lowest number on one or both axes to show that the scale has changed. 5) Label both axes to indicate the variable and the units of measure. Write the specific name of the variable. Do not label the axes as the dependent variable and independent variable. Include a legend if different colors are used to indicate different aspects of the experiment. 6) Graphs (along with drawings and diagrams) are called figures and are numbered consecutively throughout a lab report or scientific paper. Each figure is given a number, a title that describes contents, and an informative sentence giving enough information for the figure to be understandable apart from the text (e.g. Figure 1 Temperature and Leaf Color Change The relationship between the change in vine maple leaf color and changes in ambient temperature). Generally, this information is placed below the figure or graph. 7) Choose the type of graph that best presents your data. Line and bar graphs are the most common. The choice of graph type depends on the nature of the variable being graphed. Line Graphs are used to graph data that only involves continuous variables. A continuous variable is capable of having values over a continuous range (i.e. anywhere between those that were measured in the experiment). For example, pulse rate, temperature, time, concentration, pH, etc. are all examples of continuous variables (Figure 1). Making Line Graphs 1) Plot data as separate points. Make each point as fine as possible and then surround each data point with a small circle. If more than one set of data is plotted on the same graph, distinguish each set by using circles, boxes, triangles, etc. 2) Generally, do not connect the data points dot to dot. Draw smooth curves, or if there appears to be a linear relationship between the two variables, draw a line of best fit. Biology& 160 Laboratory Manual Mr. Brumbaugh 139 Spring 2014 3) If more than one set of data is plotted on a graph, provide a key of legend to indicate identify each set. Label the graph as a figure; give it an informative title, and a descriptive sentence. Figure 1 pH Effects on Lactase Note that a line graph was used to graph the data because both variables, pH and the rate of digestion, are continuous variables. Bar Graphs are used if the data involves a discrete variable (non-continuous variable). A discrete variable, unlike a continuous variable, cannot have intermediate values between those measured. For example, a bar graph (Figure 2) would be used to plot the data in an experiment involving the determination of chlorophyll concentration (chlorophyll concentration is a continuous variable) found in the leaves of different tree species (The discrete variable is the species of tree). Bar graphs are constructed using the same principles as for line graphs, except that the vertical bars are drawn in a series along the horizontal axis (i.e. x-axis). In the example below, a bar graph was used to graph the data because tree species is a discrete variable since it is impossible to have a value or species between those used. Figure 2 Chlorophyll Concentrations The chlorophyll concentrations were measured mg/grams of leaf in the leaves of three tree species. Biology& 160 Laboratory Manual Mr. Brumbaugh 140 Spring 2014 Appendix B: How to convert to the metric system? Larger Unit 1 km = 103 m = 1000 m 1 m = 100 m 1 cm = 10-2 m = 0.01 m 1 mm = 10-3 m = 0.001 m 1 m = 10-6 m = 0.000001 m 1 nm = 10-9 m = 0.000000001 m Tips for Metric Conversion: 1. When converting from a larger unit of measure to a smaller unit of measure (e.g. from kilometers, km to meters, m) move the decimal to the right. This results in a larger number. 2. When converting from a smaller unit of measure to a larger unit of measure (e.g. from m to km) move the decimal to the left. This results in a smaller number. 3. See below to determine how many decimal places to move. Smaller Unit Figure 4 Metric System Relationships This figure shows the conversion relationships of common metric measurements. Determination of the number of decimal places to Move The number of decimal places moved is equal to the magnitude difference between the exponents of the two units of measure. The exponent scale below illustrates the relationship between exponents. -6 -5 m -4 -3 -2 -1 mm cm 0 m 1 2 3 km 4 Examples 1. 9.25 km =?? mm km to mm is a large to small unit conversion, so the decimal must move to the right. The magnitude of difference between the exponents of each unit of measure is 6: km = 103, mm = 10-3; Therefore: 3 - (-3) = 6 So the decimal place moves to the right six places giving 9,250,000 mm (or 9.25 x 10 6 mm) 2. 450 µm =?? mm µm to mm is a small to large unit conversion, so the decimal must move to the left. The magnitude of difference between the exponents of each unit of measure is 3: µm = 10-6, mm = 10-3; Therefore: -3 - (-6) = 3 So the decimal place moves to the left three places giving 0.45 mm Biology& 160 Laboratory Manual Mr. Brumbaugh 141 Spring 2014 Appendix C: How to cite references in papers? In-Text Citations There are typically not footnotes or endnotes in scientific writing as there are in humanities and the social sciences. Instead, all citations occur in the text in parenthetical format, with the author(s) and date of publication. Use the following as an example: Parsons (1996) found that naked mole rats dig six times faster in desert soils than dung beetles dig through dung. Alternatively, Naked mole rats dig six times faster in desert soils than dung beetles dig through dung. (Parsons 1996). Or, Naked mole rats dig six times faster in desert soils than dung beetles dig through dung. (1) This notation (1) refers the reader to the bibliography which is sequentially numbered and each citation from this author is referred to in this fashion. It's that simple! Be sure to list any sources you cite in the text in the Literature Cited section, and only those that you cite. As a rule of thumb, if there is more than one author of a source, simply use the first author's last name, followed by et al. (e.g. [Parsons et al. 1996]). This is Latin for "and others". The complete list of authors will appear in the full citation at the end of your paper. Literature Cited or Bibliography Your Literature Cited should appear in alphabetical order by first author, and by year if there are multiple sources by the same author(s). Underline journal and book titles, but not the titles of individual articles in journals or edited (multi-authored) books. Use the following as examples for citing various kinds of sources (with thanks to M. Weis): Citing Journal and Magazine Articles Format Author(s). Publication year. Article title. Journal title volume: pages. Examples Smith, D.C. and J. Van Buskirk. 1995. Phenotypic design, plasticity and ecological performance in two tadpole species. American Naturalist 145: 211-233. Ahlberg, P.E. 1990. Glimpsing the hidden majority. Nature 344: 23. Epel, D. and R. Steinhardt. 1974. Activation of sea-urchin eggs by a calcium ionophore. Proc. Natl. Acad. Sci. (USA) 71: 1915-1919. Citing Sites on the Internet Often electronic sources are a challenge to cite because they often lack critical information. You should do your best to provide as much of the following as possible. The complete web address should be presented so that anyone else could easily visit the same website. Attempt to include the following elements (not all elements appear on all Web pages): 1. author(s) (last name, first initial) 2. date created or updated 3. title of the page 4. title of the complete web site (if different from the page) 5. URL (full web address) Biology& 160 Laboratory Manual Mr. Brumbaugh 142 Spring 2014 6. the date accessed. Format Author's last name, First initial. (date created or updated). Title of the page. Title of the complete site. [Online]. Available: http://full.web.address. [Date accessed]. Example Hammett, P. (1997). Evaluating web resources. Ruben Salazar Library, Sonoma State University. [Online]. Available: http://libweb.sonoma.edu/Resources/eval.html. [March 29, 1997]. Citing Books Format Author(s). Publication year. Book Title, edition if known. Publisher, Place of publication, number of pages. Example Purves, W.K., G.H. Orians and H.C. Heller. 1995. Life: The Science of Biology, 4th edition. Sinauer Associates, Inc., Sunderland, MA, 1195 pp. Citing Book Chapters Format Author(s). Publication year. Chapter title. In: Book title (Author(s)/editors, first name first) Place of publication, pages. Example Jones, C.G. and J.S. Coleman. 1991. Plant stress and insect herbivory: Toward an integrated perspective. In: Responses of Plants to Multiple Stresses (H.A. Mooney,W.E. Winner & E.J. Pell, editors), Academic Press, San Diego, pp. 249-280. Citing Newspaper Articles Format Author(s). Date (Year/Month/Day). Article title. Newspaper title Section: Page: Column. Example Bishop, J. E. 1982 November 4. Do flies spread ills or is that claim merely a bugaboo? The Wall Street Journal 1: 1: 4. Williams, M. 1997 January 5. Teaching the net. Seattle Times C: 1: 2. Citing Newspaper Articles with no Identifiable Author Format Anonymous. Date (Year/Month/Day). Article title. Newspaper title Section: page: column. Example Anonymous. 1977 September 6. Puffin, a rare seabird, returns to where many were killed. The New York Times 3:28:1. Citing a Video Format Title of video (videocassette). editor or director. Producer’s name, producer. [Location of Production]: Organization responsible for production, Year. Example New horizons in esthetic dentistry (videocassette). Wood, R. M., editor. Visualeyes Productions, producer. [Chicago] : Chicago Dental Society, 1989. Biology& 160 Laboratory Manual Mr. Brumbaugh 143 Spring 2014 Citing a Government report Format Author/Agency (if no author). Publication year. Title. Publisher, Place of publication, number of pages. Example Mitchell, R.G., N.E. Johnson and K.H. Wright. 1974. Susceptibility of 10 spruce species and hybrids to the white pine weevil (Sitka spruce weevil) in the Pacific Northwest. PNW-225. U.S. Department of Agriculture Forest Service, Washington, D.C., 8 pp. Biology& 160 Laboratory Manual Mr. Brumbaugh 144 Spring 2014 Appendix D: How to Draw or Make a Scientific Plate or Drawing? Why draw? It is not the objective of this course to “make you into an artist” or even to have you produce drawings of professional quality, even though many of you are capable of such work. It is expected, however, that each student will produce clear and accurate drawings of the organisms and structures that she/he actually observes. Drawing is a tool that will help you focus on what you are really seeing at deeper level that maybe you have seen before. Drawing is a tool that will draw you closer to the body plans of organisms and maybe for the first time open up to you a whole new world. Seeing things for the first time the way they really are is very exciting. It’s amazing how many times we look at something but don’t really see it. Drawing “makes it so.” Drawing will make the vocabulary of science more tangible and available to you. What is bilateral symmetry in the sagittal plane of the anterior section of pineal glands of a frog really mean? Does it mean something special for frog growth and development or is it just an accident. The metaphase plate formed during mitosis in root tips can actually be visualized bringing the boring humdrum words from the text into a vibrant exciting reality, right now! Drawing will show you how things work. The functionality of different parts will be revealed. As you look at a filter feeding daphnia filtering it’s dinner from its aqueous environment you will discover why it is shaped the way it is shaped and “oh yeah” what those parts are for. Those parts will become more than just parts to you. You will find, as the quarter progresses that it becomes easier to make good, acceptable drawings as you develop your powers of observation and become familiar with certain basic drawing techniques. You will also discover that the preparation of these drawings is an excellent way to study specimens, for in order to make acceptable drawings you must observe in detail the form, structure, and interrelation of parts of the object being drawn. Your drawing will record observations clearly and concisely that would require several pages of descriptions to duplicate. Further, you will find your drawings to be excellent review materials, especially since many of the living organisms studied in the laboratory will available to you only during certain laboratory periods, and your drawings will be the only record of personal observations that you have. You will be permitted to use these drawings for study purpose. Make all your drawings directly from the specimens or slides and complete each drawing in the laboratory. Do not merely copy drawings of your neighbor or plates from the textbook. Textbook illustrations are often idealized, or may represent different species from those you are studying in the laboratory and thus do not look like your specimen. Procedure 1. Before you do anything else, study the material to be drawn. From what angle are you going to prepare the drawing? Frequently, the laboratory instructions often direct you to prepare a drawing from a specific viewpoint, such as a cross section of the sagittal plane of the anterior section of a pineal gland. Often times the angle that is chosen depends on specific functions to be studied or maybe just a key feature used in identification of the species. 2. Notice what the outline of the entire object to be drawn? 3. Notice what structures are present (how many, how many different kinds). 4. Notice how the structures are interconnected or interrelated? 5. Notice everything that might help you draw the critter or critter part that is in front of you, like; folds and creases connection shapes holes, hairs, and hides et cetra, et cetra, et cetra Biology& 160 Laboratory Manual Mr. Brumbaugh 145 Spring 2014 6. After you have observed in detail the object to be drawn, you may begin the drawing. At first you may find the following steps helpful, so do not hesitate to refer to this section as you prepare your drawings. 7. Determine the size that you are going to make the drawing. The size will be determined by the size of the drawing paper (usually 8.5x11) and the shape of the object drawn. Remember that the completed drawing will have labels so be sure to leave enough space so that the finished drawing will not look crowded. The amount of magnification, or reduction, of your drawing from the actual size of the specimen is always indicated as part of the title (e.g. x1/2 or x3). 8. Determine how you are going to place the drawing on the paper. Through convention, either the anterior end (at or toward the head) or the dorsal surface (at or toward the back) is placed toward the top of the drawing. 9. Construct, by measuring the specimen with your millimeter scale and reducing or enlarging to appropriate lengths, any guide lines that you may find useful. Such guide lines should be lightly made and erased when the drawing is completed. In drawing bilaterally symmetrical structures you may find it convenient to draw a median guide line. 10. Construct outlines marking borders of the entire specimen to be drawn. At first these should be thin, light lines until you have worked out the proper form and proportions. The finished lines should be definite and continuous. Where two lines meet or cross, make them continuous, not with one or more ends showing. To show structures lying beneath other structures, use dotted lines. All light sketch lines should be erased. Fill in the details in their proper place in the outline. 11. The dedicated drawer will use drawing pencils of medium harness (3H or 4H). Softer leads will smear, and harder leads tend to cut the drawing paper. Usually do not use ink or colored pencils unless so instructed or as a final step in the preparation. Since no biological structures in nature ever have perfectly straight borders, do not use a rule to make any lines in your finished drawing. 12. In general, do not use shading. When necessary to do shading, use stippling only. Stippling involves making small dots with the tip of the pencil while holding the pencil at right angles to the paper. In stippled drawings ridges and prominences are indicated by the absence of stippling; depressions and lower parts of curved surfaces are indicated by evenly spaced dots of uniform size placed progressively closer together as the depression becomes deeper. 13. Sometimes an insert to show a close-up of a particular part of the specimen is included on the plate. This is done to show greater detail of the critter to emphasize structure function relationships or key features for identification. The same process for drawing the entire specimen should be applied to drawing the structures that appear on the insert. 14. Label the completed drawing. The labels consist of the student identification information, (name, section, date, et cetra), the plate number and title, and the names of the structures or parts illustrated. The student identification information will be placed in the upper right hand corner of the plate; the plate number and title centered at the bottom of the page; and the names of the parts placed in vertical column, parallel to each other and to the top and bottom of the page, to the right of the drawing. Solid straight lines should lead from the label to the structure. All labels should be neatly printed. 15. Make a legend that would indicate the actual size of the specimen in the drawing. this is called a scale. For example the distance between Los Angeles, CA and Seattle, WA on some maps may be only one inch but by reading the scale of the map one inch is actually about 3,000 miles. By attaching a scale to the drawing the reader is given a perspective from which to interpret the relative size of the specimen. Biology& 160 Laboratory Manual Mr. Brumbaugh 146 Spring 2014 Avoid the following common mistakes in drawing; 1. Making the drawings to diagrammatic–they should be good representations of the actual structures as seen in your specimen. 2. Poorly proportioned–the various parts and the whole should show the same size relationship that they have in the specimen. 3. Making the drawings too small 4. Incomplete or inaccurate labels. 5. Indefinite or “fuzzy lines.” 6. Coarse, heavy lines or uneven lines resulting from use of dull pencils or from careless work. 7. Unnecessary lines or lines without meaning. Voila, a drawing that you can treasure for the rest of your life and aid you in the successful completion of this class. YES! Will it be easy or totally rad at first. For some students yes, for others not so much. But if you stick to it things will happen, you will start to understand things about the world around you that you never noticed before. MENTAL SAFARI, WOW!! You will be doing what you came here for, learning. Biology& 160 Laboratory Manual Mr. Brumbaugh 147 Spring 2014 Appendix E: How to make an Oral presentation? Oral presentations are an important means of presenting the results of your research to other scientists. We will use the same format that biologists use to present experimental findings at colleges and universities (where they are also known as “seminars") and for presentations when they attend national meetings of scientific organizations. As such, you will gain experience with a standard oral report format that you will use throughout your career as a biologist. Everyone realizes it can be uncomfortable to speak in front of a group, and it is especially hard the first time. You’ll make some mistakes—that’s part of the learning process. Please realize that any questions that you are asked by your classmates or instructor are not meant to be taken personally. So, don’t be afraid of questions and comments—they are intended to further our understanding of your scientific investigation. The comments and questions made by one’s peers are important tools used by the scientific community to assist in evaluating the validity of a researcher’s experimental design, results, and conclusions. The best preparation for presentations is to understand what you did, especially why you set the experiment up the way you did in order to answer a specific scientific question. Each group will give an oral presentation about their experiment. It should be organized in a manner similar to scientific reports, with the following sections: 1. Introduction Include such things as any background information needed for the audience to understand the experiment, the reasons for doing the experiment, and your hypothesis. In addition, use the background information to stimulate audience interest in the question that your group researched. 2. Materials and Methods Include your experimental design. Describe the design of your experiment, especially the variables, treatments, and controls. In addition, give a very brief overview of the major procedures you performed. Be sure to consider your audience: all the groups did an experiment involving alcoholic fermentation using the Vernier gizmos, so there is no need to repeat the “standard” procedures or protocols involved. Include procedures that are different from the standard protocol, and be sure to present enough of your protocol so that everyone is clear as to exactly what you did and why. 3. Results The Results should be a clear and concise display of your data. Your data should be distilled down to the important facts, and not necessarily every piece of data you collected. Use figures (e.g. graphs) and/or tables to present the major trends in the data. Be sure to note whether each trend was significant or not significant. Make sure figures and tables are easy to read and interpret, especially from a distance. 4. Discussion: Return to the question you posed in the introduction and use the results of the study to answer that question (e.g. “We cannot conclude that the caffeine dose in a single cup of coffee influences blood pressure in college aged subjects, since we found no significant difference in blood pressure between the caffeinated and decaffeinated treatment groups.”). Interpret your results fully, but be careful not to make conclusions that go beyond what your data supports: What does your data show? What can be concluded from the results of your investigation? Do your results support your hypothesis or hypotheses? Do you have reason to believe your results were inaccurate or accurate are they reliable or unreliable? How could the experimental design be improved? What would you do next time to investigate the problem further? Biology& 160 Laboratory Manual Mr. Brumbaugh 148 Spring 2014 Things to Consider while Preparing for your Presentation Each person in your group must speak during the presentation: For groups of 2, each person should present two of the sections above. For groups of 3, each person should present at least one of the sections above. In short, divide the responsibilities of the oral presentation equitably amongst your group members. Due to time constraints your group’s presentation should last no more than 20 minutes. Plan to speak for 12 - 15 min. so we will have 3 - 5 min. for questions and discussion with the rest of the class. Visual aids are critical to the success of your presentation. Use transparencies or PowerPoint slides to present important questions, methodological steps, results, and conclusions. Overhead transparencies and pens can be obtained from the campus bookstore and most stationary stores. Check with your instructor to see if he/she has any to loan you. You may find it helpful to keep the following questions in mind while preparing your presentation; a a a a Do you clearly state the question you are trying to answer? Is it clear what you did to try and answer your question? Do you explain your results, especially inconsistent or unexpected results? Do you convey why you did the different conditions in your experiment? Delivery of the Presentation b b b b Speak loudly and clearly Interact with your visual aids by pointing to key features as you describe them Try to maintain eye contact with the audience Avoid distracting behaviors, clothes, and accessories, For example, do not chew gum, lean on the podium, twirl your hair, or wear hats or distracting clothing Evaluation of the Presentation Your group’s presentation will be critiqued in two ways, by your classmates and by your instructor. Your classmates will not grade you — these comments are to help you. Each person in class will review every group by responding to the following two questions: 1) What were the strengths of this group?, and 2) What improvements could be made by this group? When making comments about the presentation of others, keep in mind: 1) The four questions listed on the previous page under the discussion, 2) Whether the group was organized, if everyone participated, if their conclusions were valid, etc., and 3) Comments and suggestions are meant to be a helpful and not a slap in the face. Evaluation by Your Instructor In addition to all of the categories above, your instructor will be interested in..... e How clearly you present your material e Whether you display understanding of what you did and why you did it, and if the data support your conclusions. e You will receive a group grade. Your instructor will announce the number of points involved, But the important thing is to become comfortable talking in front of a group and to have fun with your presentation. e Use the rubric in your syllabus for direction. Acknowledgment: Adapted from handouts authored by Dr. Valerie Banschbach, Dr. Mark Stanback and Dr. Patricia Peroni of Davidson College. Many passages were taken directly from these handouts. Biology& 160 Laboratory Manual Mr. Brumbaugh 149 Spring 2014 Appendix F: How to search the Literature? Not all articles are created equally! The most reliable articles are from scientific journals and from the individual who conducted the study. There are 1000’s of scientific journals in the world that deal with the many fields of science. Journals publish the results of original scientific research. When scientists believe they have something of value to communicate to other scientists, they submit their work for publication. Peers that are associated with a particular society will then review it. Societies usually consist of scientists associated with universities and colleges around the world. If the research is judged to be of high quality and of value, it will be published in the society’s journal. (Note: The Audubon Society, the National Geographic Society, Wikipedia, nor the Wall Street Journal are scientific journals, reputable but not scientific!) Although much of the information in a scientific journal may be quite technical, you should be able to glean some information from it. After journals, the next best source is a popular science magazine (e.g. Scientific American, Science News, American Scientist, Discover, etc.). Since these periodicals are devoted to science, they tend to be better sources of information than general magazines such as Time or Newsweek. General popular references such as newspapers and general magazines may sometimes be helpful but don’t limit yourself to these since the information may be of unreliable quality and/or incomplete. There at several useful databases to periodicals available for your use. Some databases require the use of a computer in the Information Commons upstairs in the Holman Library (e.g. InfoTrac Health Index, an excellent database for our purposes); others are accessible from any campus computer connected to the GRCC network (e.g. ProQuest Direct). The one we will have you use is ProQuest Direct. How to find articles in ProQuest: Start Netscape Navigator or Microsoft Internet Explorer and go to Holman Library's Research Data Base Links. You should find ProQuest Direct on the list of databases (it's the second one from the top). Another way to get to ProQuest: Go to the Holman Library’s home page at http://www.greenriver.edu/library/. Under “Research Tools” click on the “Databases” link. You should find ProQuest Direct on the list of databases (it's the second one from the top). Now click on Search ProQuest Direct. You are now on the Select Database screen in ProQuest. If you want to restrict your search to Peer Reviewed Articles (i.e. articles in scientific journals), then before you type in your search terms, find where it says "Peer Reviewed" on the screen, and check the box next to this. This will limit your search to Peer Reviewed articles. Type your search criteria in the search box and click the "Search" button. Don't forget to cite each of your articles correctly by following the guidelines for citing references in Appendix C. How to find books: Start Netscape Navigator or Microsoft Internet Explorer and go to Holman Library's home page at http://www.greenriver.edu/library/ Click on the "Online Catalog" link. Click on the "Basic Search" link. Type your search in the Search For: box, select "Keyword" in the Search In: box, and then click the "Search" button. Biology& 160 Laboratory Manual Mr. Brumbaugh 150 Spring 2014 Unable to find a relevant book in the Holman Library, try searching at other libraries in the area by following one or more of the links at the library site. If you are not successful finding a book related to your topic in the Holman Library or the other libraries in the area try using ProQuest and restrict your search to books. Still having problems finding a book related to your topic? Try searching amazon.com. If possible, cut and paste into your Word document a short summary, description, abstract, etc. about a book related to your topic. When citing the book you found within your Word document be sure to follow the guidelines in Appendix B. Excellent Biology Web Sites—Compiled by Ken Marr, GRCC Biology Dept. http://www.google.com (One of the best search engines around!) http://www.scirus.com (One of the search engines used by scientists to seek other science works) http://www.sciam.com/ (Scientific American magazine: An extremely high quality science magazine containing articles written by experts in their field of study—One of my favorites) http://www.newscientist.com (A high quality science magazine with a biological sciences focus—Another one of my favorites!) http://www.scicentral.com/ (An excellent resource for any area of science and technology—one of my favorites—I receive weekly notices of recent papers that are of interest to me—this service is free.) http://www.sciencenews.com (A high quality science magazine with a biological sciences focus) http://ublib.buffalo.edu/libraries/units/sel/collections/ejournal2.html (Links to electronic versions of over 900 journals on the Web, covering all areas of science and technology. The content of these electronic journals varies, from full text to table of contents for the majority of journals.) http://biochemlinks.com/bclinks/bclinks.cfm (A guide with links to some of the best biological sciences and chemistry sites on the web-- including some journals and science related magazines; Includes free science related clip art and links to free clip art) http://www.nejm.org/content/index.asp (New England Journal of Medicine—one of the world’s premier medical journals) http://www.ncbi.nlm.nih.gov/Omim/ (Online Mendelian Inheritance in Man: OMIN is a database that contains summaries about every human gene so far investigated. You can obtain the official gene name, the official abbreviation, the gene map locus (where the gene is located on a certain chromosome), and information about the gene. Moreover, you can click on buttons that will give you articles in Medline (a database for medically related journals), a list of genes near the one you are interested in (a gene map), DNA sequences (DNA), and other information. Another useful site is Genbank at http://www.ncbi.nlm.nih.gov/ http://www.nlm.nih.gov/ (Medline: A database of the National Library of Medicine, part of the National Institutes of Health (NIH). This the largest collection of medical information in the world, containing more than 9 million references from medical journals from all over the world. http://cancer.med.upenn.edu/ (Oncolink: the first of its kind on the Internet—an excellent site that disseminates cutting edge information relevant to the field of oncology (cancer research). Aims to educate health care personnel, patients, and other interested parties.) http://www.quackwatch.com/ (“A Guide to Health Fraud, Quackery, and Intelligent Decisions;” An interesting site that helps one to distinguish between legitimate healthcare treatments and quackery—The physician responsible for this site has written many books and scientific papers over the years. His ideas are very mainstream—perhaps too mainstream? Some of the views expressed may not be totally objective. At times he has quite harsh comments concerning “alternative medicine.”) Biology& 160 Laboratory Manual Mr. Brumbaugh 151 Spring 2014 http://www.audubon.org/ (Audubon is a high quality magazine that deals with environmental issues and wildlife conservation) http://www.biomednet.com/hmsbeagle (This is one of my favorites—A weekly publication that covers many of the more important advances in the biological sciences. Requires membership— which is free as is an email subscription) home page of the H.M.S. beagle: http://www.biomednet.com/home http://genetics.nature.com/ (a journal produced by Nature…Gives you access to the contents, but you must pay to see the text of the articles—Available for free in the libraries of most research universities) http://www.nature.com/ (Nature is a very prestigious scientific journal. This site gives you access to the contents. Although some parts of the site are free, you must pay to see the text of the articles—but they are available for free in the libraries of most research universities) http://flybase.bio.indiana.edu/ (FlyBase: a comprehensive searchable database for information on the genetics and molecular biology of Drosophila—the fruit fly) http://www.exploratorium.edu/exhibits/mutant_flies/mutant_flies.html (Has pictures and descriptions of mutant fruit flies) Coeloplana Biology& 160 Laboratory Manual Mr. Brumbaugh 152 Spring 2014
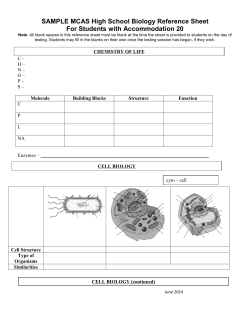


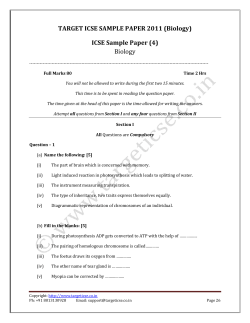


© Copyright 2026