
Massachusetts Consolidated Assessment and Listing Methodology (CALM) Guidance Manual July 2012
Massachusetts Consolidated Assessment and Listing Methodology (CALM)
Guidance Manual
July 2012
Prepared by:
Massachusetts Division of Watershed Management
Watershed Planning Program
CN 405.0
Commonwealth of Massachusetts
Executive Office of Energy and Environmental Affairs
Richard K. Sullivan, Jr., Secretary
Massachusetts Department of Environmental Protection
Kenneth L. Kimmell, Commissioner
Bureau of Resource Protection
Bethany A. Card, Assistant Commissioner
Table of Contents
I.
INTRODUCTION ............................................................................................................................................. 1
II.
WATER QUALITY STANDARDS .................................................................................................................... 2
III.
DATA ACCEPTABILITY .................................................................................................................................. 6
IV.
USE ASSESSMENT DECISION PROCESS .................................................................................................. 7
Aquatic Life Use ................................................................................................................................................. 9
Fish Consumption Use ..................................................................................................................................... 28
Shellfish Harvesting Use .................................................................................................................................. 30
Primary Contact Recreational Use ................................................................................................................... 32
Secondary Contact Recreational Use .............................................................................................................. 35
Aesthetics Use ................................................................................................................................................. 37
Causes and Sources of Use Impairments ....................................................................................................... 38
V.
CONSOLIDATED REPORTING ................................................................................................................... 40
The Assessment Database (ADB) ................................................................................................................... 40
The Integrated List of Waters ........................................................................................................................... 40
Spatial Documentation ..................................................................................................................................... 42
VI.
REFERENCES .............................................................................................................................................. 44
List of Appendices
Appendix A. Typical cause(s) and source(s) of use impairments (Aquatic Life, Fish Consumption, Shellfish
Harvesting, Primary Contact Recreation, Secondary Contact Recreation, and Aesthetics) based on the
indicator(s) used to make the use impairment decisions .......................................................................................A1
List of Tables
Table 1. Summary of Massachusetts Surface Water Quality Standards ............................................................... 3
Table 2. Aquatic Life Use assessment decision indicator summary by weight of evidence gradient ................... 26
Table 3. Brief description of the five list categories of assessed waters used by MassDEP for the
Integrated List of Waters ........................................................................................................................................ 41
List of Figures
Figure 1. Components of Consolidated Assessment and Listing Methods Guidance Manual ............................... 1
Figure 2. MassDEP, DWM, Consolidated Reporting Process Schematic .............................................................. 1
Figure 3. Flow diagram for evaluating nutrient enrichment and causes of impairment ........................................ 38
Figure 4. MassDEP geo-referenced waterbody segment locations and 2010 listing category ............................ 42
Figure 5. MassDEP Assessment Database (ADB) data associated with geo-referenced waterbody
segment locations .................................................................................................................................................. 43
Massachusetts Consolidated Assessment and Listing Methodology 2012 Guidance Manual
Page ii
I.
INTRODUCTION
The Massachusetts Consolidated Assessment and Listing Methodology (CALM) Guidance Manual was prepared to
satisfy reporting requirements pursuant to Sections 305(b), 314, and 303(d) of the Federal Clean Water Act (CWA)
and to fulfill the Performance Partnership Agreement (PPA) between the Environmental Protection Agency (EPA)
and the Massachusetts Department of Environmental Protection (MassDEP). This manual contains a brief summary
of the Massachusetts Surface Water Quality Standards (SWQS) that define the goals for water quality in the state
(MassDEP 2006), the requirements for assessing the quality of data to be used for CWA reporting, the methods of
reviewing water quality data and information used by the MassDEP Division of Watershed Management (DWM)
analysts to make use assessment decisions, and the use of the EPA’s Assessment Database (ADB) for consolidated
reporting and the generation of the 2012 Massachusetts Integrated List of Waters report (Figure 1).
The CWA directs states to monitor and
report on the condition of their water
resources. This water quality reporting
process is an essential aspect of the
Nation's water pollution control effort. It is
the principal means by which the EPA,
Congress, and the public evaluate existing
water quality, assess progress made in
maintaining and restoring water quality,
and determine the extent of remaining
problems. The directives of the CWA and
the process by which the MassDEP DWM
staff implemented the consolidated
reporting for the 2012 cycle are illustrated
in Figure 2 and are described in more
detail in this document.
Section 305(b) codifies the process
whereby waters are evaluated with
respect to their capacity to support
designated uses as defined in the SWQS.
These uses include Aquatic Life, Fish
Consumption, Drinking Water, Shellfish Harvesting, Primary (e.g., swimming) and Secondary (e.g., boating) Contact
Recreation, Aesthetics, Agricultural, and Industrial (MassDEP 2006). The 305(b) process entails assessing the water
quality conditions suitable to attain each of these uses, where applicable, for rivers, lakes and coastal waters in the
state and identifies, wherever possible, causes and sources of use impairment.
Through the 2012 reporting cycle the MassDEP has documented assessment decisions and the data used to make
them in individual watershed assessment reports (http://www.mass.gov/dep/water/resources/wqassess.htm) (Figure
2.). For the 2010 and 2012 reporting cycles the assessment decisions themselves have been stored in the EPAdeveloped Access database, the ADB V2.3.1.
This tool is now used by the MassDEP for
producing the Integrated List of Waters report
and for providing the electronic data to the
EPA. The Integrated List of Waters report
allows states to provide the status of all their
assessed waters in a single, multi-part list -each waterbody or segment thereof is listed in
one of five categories. Development of
Category 5, which is the “List of Impaired
Waters” mandated in Section 303(d) of the
CWA (the 303(d) List), includes a more
rigorous public review and comment process
than does reporting under the remaining four
categories and the final version of this List
must be formally approved by the EPA.
Massachusetts Consolidated Assessment and Listing Methodology 2012 Guidance Manual
Page 1
II.
WATER QUALITY STANDARDS
The Massachusetts Surface Water Quality Standards (SWQS) serve as the foundation for the state’s water quality
management program -- 305(b) water quality assessments, 303(d) lists of impaired waters, TMDLs, National
Pollutant Discharge Elimination System (NPDES) permits, and nonpoint-source management measures. The SWQS
1) define the goals for a waterbody by designating the most sensitive uses for which the surface waters of the
Commonwealth shall be enhanced, maintained and protected; 2) prescribe minimum water quality criteria required to
sustain the designated uses (both numeric and narrative criteria); and 3) include provisions for the maintenance and
protection of existing uses and high quality waters (antidegradation policy), which may include the prohibition of
discharges (MassDEP 2006). These regulations should undergo public review every three years. The surface waters
are segmented and each segment is assigned to one of the six classes described below (314 CMR 4.05 and 4.06 in
MassDEP 2006). Each class is identified by the most sensitive and, therefore, governing water uses to be achieved
and protected. Other waters not specifically designated in 314 CMR 4.06 or listed in the tables to 314 CMR 4.00
(commonly referred to as “unlisted waters” by DWM analysts) are Class B for inland waters and Class SA for coastal
and marine waters. Inland fisheries designations and coastal and marine shellfishing designations for unlisted waters
shall be on a case-by-case basis as necessary. Surface waters may be suitable for other beneficial uses, but shall be
regulated by MassDEP to protect and enhance both existing (attained in waterbody on or after November 28, 1975)
and designated uses.
CLASSIFICATION OF MASSACHUSETTS SURFACE WATERS – RIVERS, LAKES, ESTUARIES
INLAND WATER CLASSES
CLASS A - These waters include waters designated as a source of public water supply and their tributaries.
They are designated as excellent habitat for fish, other aquatic life and wildlife, including for their reproduction,
migration, growth and other critical functions, and for primary and secondary contact recreation, even if not
allowed. These waters shall have excellent aesthetic value. These waters are protected as Outstanding
Resource Waters.
CLASS B - These waters are designated as a habitat for fish, other aquatic life, and wildlife, including for their
reproduction, migration, growth and other critical functions, and for primary and secondary contact recreation.
Where designated in 314 CMR 4.06, they shall be suitable as a source of public water supply with appropriate
treatment (“Treated Water Supply”). Class B waters shall be suitable for irrigation and other agricultural uses
and for compatible industrial cooling and process uses. These waters shall have consistently good aesthetic
value.
CLASS C - These waters are designated as a habitat for fish, other aquatic life and wildlife, including for their
reproduction, migration, growth and other critical functions, and for secondary contact recreation. These waters
shall be suitable for the irrigation of crops used for consumption after cooking and for compatible industrial
cooling and process uses. These waters shall have good aesthetic value.
COASTAL AND MARINE CLASSES
CLASS SA - These waters are designated as an excellent habitat for fish, other aquatic life and wildlife,
including for their reproduction, migration, growth and other critical functions, and for primary and secondary
contact recreation. In certain waters, excellent habitat for fish, other aquatic life and wildlife may include, but is
not limited to, sea grass. Where designated in the tables to 314 CMR 4.00 for shellfishing, these waters shall be
suitable for shellfish harvesting without depuration (Approved and Conditionally Approved Shellfish Areas).
These waters shall have excellent aesthetic value.
CLASS SB - These waters are designated as a habitat for fish, other aquatic life and wildlife, including for their
reproduction, migration, growth and other critical functions, and for primary and secondary contact recreation. In
certain waters, habitat for fish, other aquatic life and wildlife may include, but is not limited to, seagrass. Where
designated in the tables to 314 CMR 4.00 for shellfishing, these waters shall be suitable for shellfish harvesting
with depuration (Restricted and Conditionally Restricted Shellfish Areas). These waters shall have consistently
good aesthetic value.
CLASS SC - These waters are designated as a habitat for fish, other aquatic life and wildlife, including for their
reproduction, migration, growth and other critical functions, and for secondary contact recreation. They shall also
be suitable for certain industrial cooling and process uses. These waters shall have good aesthetic value.
The Massachusetts SWQS prescribe minimum water quality criteria to sustain the existing and designated uses.
These criteria are summarized in Table 1. Furthermore, the standards describe the hydrological conditions at which
water quality criteria must be applied (MassDEP 2006). In rivers the lowest flow conditions at and above which
aquatic life criteria must be applied are the lowest mean flow for seven consecutive days to be expected once in ten
years (7Q10). In waters where flows are regulated by dams or similar structures the lowest flow conditions at which
aquatic life criteria must be applied are the flows equal to or exceeded 99% of the time on a yearly basis or another
equivalent flow that has been agreed upon (see Mass DEP 2006 for more detail). In coastal and marine waters and
for lakes the MassDEP will determine on a case-by-case basis the most severe hydrological condition for which the
aquatic life criteria must be applied.
Massachusetts Consolidated Assessment and Listing Methodology 2012 Guidance Manual
Page 2
Table 1. Summary of Massachusetts Surface Water Quality Standards ( MassDEP 2006, MA DPH 2002, FDA
2003).
Dissolved
Oxygen
Temperature
Class A Cold Water Fishery (CWF) and Class B Cold Water Fishery (BCWF) and Class SA: 6.0 mg/L
Class A and Class B Warm Water Fishery (BWWF) and Class SB: 5.0 mg/L
Class C: Not <5.0 mg/L at least 16 hours of any 24-hour period and not <3.0 mg/L at any time.
Class SC: Not <5.0 mg/L at least 16 hours of any 24-hour period and not <4.0 mg/L anytime.
For all classes, where natural background conditions are lower than the criteria stated for each class, DO
shall not be less than natural background conditions. Natural seasonal and daily variations that are
necessary to protect existing and designated uses shall also be maintained.
Class A CWF: <68°F (20°C) based on the mean of the daily maximum temperature over a seven day period
in cold water fisheries, unless naturally occurring and T due to a discharge <1.5°F (0.8°C).
Class A WWF: <83°F (28.3°C) and T due to a discharge <1.5°F (0.8°C).
Class BCWF: <68°F (20°C) based on the mean of the daily maximum temperature over a seven day period
in all cold water fisheries, unless naturally occurring, and T due to a discharge < 3°F (1.7°C)
Class BWWF: <83°F (28.3°C) and T due to a discharge <5°F (2.8°C) in rivers (based on the minimum
expected flow for the month) and T due to a discharge <3°F (1.7°C) in the epilimnion (based on the
monthly average of maximum daily temperatures) in lakes,
Class C and Class SC: <85°F (29.4°C) and T due to a discharge <5°F (2.8°C)
Class SA: <85°F (29.4°C) nor a maximum daily mean of 80°F (26.7°C) and T due to a discharge <1.5°F
(0.8°C)
Class SB: <85°F (29.4°C) nor a maximum daily mean of 80°F (26.7°C) and T due to a discharge <1.5°F
(0.8°C) between July and September and <4.0°F (2.2°C) between October and June.
For all classes, natural seasonal and daily variations that are necessary to protect existing and
designated uses shall be maintained. There shall be no changes from natural background conditions that
would impair any uses assigned to each class, including those conditions necessary to protect normal
species diversity, successful migration, reproductive functions or growth of aquatic organisms.
For CWF waters, where a reproducing cold water aquatic community exists at a naturally higher
temperature, the temperature necessary to protect the community shall not be exceeded and natural daily
and seasonal temperature fluctuations necessary to protect the community shall be maintained.
pH
Solids
Color and
Turbidity
Oil and Grease
Taste and Odor
Aesthetics
Class B, C, SA, SB, and SC: See MassDEP 2006 for language specific to alternative effluent limitations
relating to thermal discharges and cooling water intake structures.
Class A, Class BCWF and Class BWWF: 6.5 - 8.3 SU and 0.5 outside the natural background range.
Class C: 6.5 - 9.0 SU and 1.0 outside the natural background range.
Class SA and Class SB: 6.5 - 8.5 SU and 0.2 SU outside the natural background range.
Class SC: 6.5 - 9.0 SU and 0.5 SU outside the natural background range.
There shall be no change from natural background conditions that would impair any use assigned to each
class.
All Classes: These waters shall be free from floating, suspended, and settleable solids in concentrations or
combinations that would impair any use assigned to each class, that would cause aesthetically objectionable
conditions, or that would impair the benthic biota or degrade the chemical composition of the bottom.
All Classes: These waters shall be free from color and turbidity in concentrations or combinations that are
aesthetically objectionable or would impair any use.
Class A and Class SA: Waters shall be free from oil and grease, petrochemicals and other volatile or
synthetic organic pollutants.
Class SA: Waters shall be free from oil and grease and petrochemicals.
Class B, Class C, Class SB and Class SC: Waters shall be free from oil, grease, and petrochemicals that
produce a visible film on the surface of the water, impart an oily taste to the water or an oily or other
undesirable taste to the edible portions of aquatic life, coat the banks or bottom of the water course, or are
deleterious or become toxic to aquatic life.
Class A and Class SA: None other than of natural origin.
Class B, Class C, Class SB and Class SC: None in such concentrations or combinations that are
aesthetically objectionable, that would impair any use assigned to each class, or that would cause tainting or
undesirable flavors in the edible portions of aquatic life.
All Classes: All surface waters shall be free from pollutants in concentrations or combinations that settle to
form objectionable deposits; float as debris, scum or other matter to form nuisances; produce objectionable
odor, color, taste or turbidity; or produce undesirable or nuisance species of aquatic life.
Massachusetts Consolidated Assessment and Listing Methodology 2012 Guidance Manual
Page 3
Table 1. Summary of Massachusetts Surface Water Quality Standards ( MassDEP 2006, MA DPH 2002, FDA
2003).
Toxic Pollutants
Nutrients
All Classes: All surface waters shall be free from pollutants in concentrations or combinations that are toxic
to humans, aquatic life or wildlife. For pollutants not otherwise listed in 314 CMR 4.00, the National
Recommended Water Quality Criteria: 2002, EPA 822-R-02-047, November 2002 published by EPA
pursuant to Section 304(a) of the Federal Water Pollution Control Act, are the allowable receiving water
concentrations for the affected waters, unless the Department either establishes a site specific criterion or
determines that naturally occurring background concentrations are higher. The Department shall use the
water quality criteria for the protection of aquatic life expressed in terms of the dissolved fraction of
metals when EPA’s 304(a) recommended criteria provide for use of the dissolved fraction (see Mass DEP
2006 for more detail regarding permit limits, conversion factors, site specific criteria).
Unless naturally occurring, all surface waters shall be free from nutrients in concentrations that would cause
or contribute to impairment of existing or designated uses and shall not exceed the site specific criteria
developed in a TMDL or as otherwise established by the Department pursuant to these Standards.
Bacteria
(MassDEP 2006
and MA DPH
2002)
Class A:
At water supply intakes in unfiltered public water supplies: either fecal coliform shall not exceed 20
organisms/100 ml in all samples taken in any six month period, or total coliform shall not exceed 100
organisms/ 100 ml in 90% of the samples taken in any six month period. If both total and fecal coliform
are measured, then only the fecal coliform criterion must be met.
Class A criteria
apply to the
Drinking Water
Use.
Class A other waters, Class B:
Where E. coli is the chosen indicator at public bathing beaches as defined by MA DPH:
The geometric mean of the five most recent E. coli samples taken within during the same bathing
season shall not exceed 126 colonies/ 100 ml and no single sample taken during the bathing season
shall exceed 235 colonies/ 100 ml (these criteria may be applied on a seasonal basis at the
Department’s discretion).
Where Enterococci are the chosen indicators at public bathing beaches:
The geometric mean of the five most recent samples taken during the same bathing season shall not
exceed 33 colonies /100 ml and no single Enterococci sample taken during the bathing season shall
exceed 61 colonies /100 ml.
Class B and SB
criteria apply to
Primary Contact
Recreation Use
while Class C
and SC criteria
apply to
Secondary
Contact
Recreation Use.
For other waters and, during the non bathing season, for waters at public bathing beaches:
The geometric mean of all E. coli samples taken within the most recent six months shall not exceed
126 colonies/ 100 ml typically based on a minimum of five samples and no single sample shall exceed
235 colonies/ 100 ml. These criteria may be applied on a seasonal basis at the Department’s
discretion.
The geometric mean of all Enterococci samples taken within the most recent six months shall not
exceed 33 colonies/ 100 ml typically based on a minimum of five samples and no single sample shall
exceed 61 colonies/ 100 ml. These criteria may be applied on a seasonal basis at the Department’s
discretion.
Class C:
The geometric mean of all E. coli samples taken within the most recent six months shall not exceed
630 E. coli/ 100 ml, typically based on a minimum of five samples and 10% of such samples shall not
exceed 1260 E. coli/ 100 ml. This criterion may be applied on a seasonal basis at the discretion of the
Department.
Class SA:
Waters designated for shellfishing:
Fecal coliform bacteria shall not exceed a geometric mean (Most Probable Number (MPN) method) of
14 organisms/100 ml, nor shall more than 10% of the samples exceed an MPN of 28 organisms/100
ml, or other values of equivalent protection based on sampling and analytical methods used by the
Massachusetts Division of Marine Fisheries and approved by the National Shellfish Sanitation Program
in the latest revision of the Guide for the Control of Molluscan Shellfish Areas (more stringent
regulations may apply, see 314 CMR 4.06(1)(d)(5)).
Class SB:
Waters designated for shellfishing:
Fecal coliform median or geometric mean MPN shall not exceed 88 organisms/100 ml, nor shall more
than 10% of the samples exceed an MPN of 260 organisms/100 ml or other values of equivalent
protection based on sampling and analytical methods used by the Massachusetts Division of Marine
Fisheries and approved by the National Shellfish Sanitation Program in the latest revision of the Guide for
the Control of Molluscan Shellfish Areas (more stringent regulations may apply, see 314 CMR
4.06(1)(d)(5)).
Class SA and Class SB:
At public bathing beaches, as defined by MA DPH:
No single Enterococci sample taken during the bathing season shall exceed 104 colonies /100 ml and
Massachusetts Consolidated Assessment and Listing Methodology 2012 Guidance Manual
Page 4
Table 1. Summary of Massachusetts Surface Water Quality Standards ( MassDEP 2006, MA DPH 2002, FDA
2003).
the geometric mean of the five most recent Enterococci samples taken within the same bathing
season shall not exceed 35 colonies /100 ml.
At public bathing beaches during the non-bathing season and in non bathing beach waters:
No single Enterococci sample shall exceed 104 colonies/ 100 ml and the geometric mean of all
samples taken within the most recent six months, typically a minimum of five samples, shall not exceed
35 colonies/ 100 ml. These criteria may be applied on a seasonal basis at the discretion of the
Department).
Class SC:
The geometric mean of all Enterococci samples taken within the most recent six months shall not
exceed 175 colonies/ 100 ml, typically based on the five most recent samples, and 10% of such
samples shall not exceed 350 colonies/ 100 ml. This criterion may be applied on a seasonal basis at
the discretion of the Department.
Note: Italics are direct quotations. criterion (referring to a change from natural background conditions) is applied to
the effects of a permitted discharge.
It should be noted here that waterbodies affected by combined sewer overflow (CSO) discharges are qualified in the
standards, however, unless a variance has been granted that states otherwise, excursions from criteria are not
allowed during storm events (designated uses still need to be sustained).
Antidegradation Policy
The third component of the SWQS is the antidegradation rule that contains provisions designed to preserve and
protect the existing beneficial uses and to minimize degradation of the state’s water quality. These provisions restrict
or prohibit the authorization of wastewater discharges to critical resource waters. Most notable is the Outstanding
Resource Water (ORW) designation that applies to all Class A waters and certain Class B, Class SA and Class SB
waters. These waters exhibit exceptional socio-economic, recreational, ecological and/or aesthetic qualities. ORWs
include, but are not limited to, Class A public water supplies and their bordering vegetated wetlands and vernal pools
certified as such by the Massachusetts Division of Fish and Game. Other waters designated as ORWs may include
those protected by special legislation, as well as selected waters found in National Parks, State Forest and Parks, or
Areas of Critical Environmental Concern (ACECs).
Massachusetts Consolidated Assessment and Listing Methodology 2012 Guidance Manual
Page 5
III.
DATA ACCEPTABILITY
The availability of appropriate and reliable scientific data and technical information is fundamental to the 305(b)
reporting and 303(d) listing process. It is EPA policy (EPA Classification No. CIO 2106.0) that any individual or group
performing work for or on behalf of the EPA needs to establish a quality system to support the development, review,
approval, implementation, and assessment of data collection operations. The MassDEP’s Quality Management Plan
ensures that environmental data are of known and documented quality and are suitable for their intended use.
Although the MassDEP relies most heavily on data collected as part of the DWM’s ambient water quality monitoring
program, “external” data from other state and federal agencies, local governments, drinking water utilities, volunteer
organizations and other sources are also solicited and considered when making assessment decisions. Results of
the MassDEP’s monitoring efforts, combined with all other reliable information, constitute the basis for making water
quality assessments in accordance with the requirements set forth in Section 305(b) and 303(d) of the CWA.
Each year, the MassDEP-DWM monitors selected surface waters throughout the Commonwealth for chemical,
physical and biological parameters of interest (e.g., nutrients, E. coli bacteria, dissolved oxygen, temperature, benthic
macroinvertebrates, chlorophyll a, algae, fish tissue contaminants and fish communities). These data are collected
by trained DWM staff following DWM’s programmatic monitoring Quality Assurance Project Plan (QAPP), including
field and laboratory Standard Operating Procedures (SOPs). In addition to MassDEP’s Wall Experiment Station
laboratory, the DWM often uses contract labs for sample analysis. All labs are evaluated for analytical accuracy and
precision using double-blind QC samples, Proficiency Testing (PT) materials and/or inter-laboratory comparison
testing. Resulting water quality data are evaluated against QAPP data quality objectives (DQOs) following DWM
SOPs. These procedures involve detailed analysis of all available information, such as field notes, survey conditions,
field and lab QC data and audit results that could affect data quality. Following QC-level and project-level reviews,
water quality data are accepted, accepted with qualification, or censored. Through a separate review process, the
DWM’s biological data (benthic macroinvertebrate, algae, periphyton, fish communities) are evaluated in light of
QAPP data quality objectives, as well best professional judgment regarding the quality of the data. For fish toxics
data, the DWM relies predominantly on QC review at the laboratory to assess usability. The DWM’s most recent
validated data are utilized for making the use assessment decisions. Ideally these data are 5 years old or less; the
DWM data used for the 2012 reporting cycle are 9 years old or less.
Section B.9 of the DWM’s programmatic monitoring QAPP addresses the use of secondary or external data. The
MassDEP evaluates each potential secondary data source using the following preliminary criteria: 1) adherence to an
acceptable QAPP, including a laboratory Quality Assurance Plan (QAP); 2) use of a state-certified (or as otherwise
acceptable to the MassDEP) analytical laboratory ; and 3) reporting of sample data, QC data, metadata and other
pertinent information in a citable report. Meeting these criteria provides a basic level of confidence that the data were
generated using appropriate field sampling and analytical methods and that the data were assessed by the group for
accuracy, precision, representativeness and completeness. External group data meeting the criteria are then further
reviewed by one or more DWM staff to verify that the group’s DQOs were met based on the QC data provided. These
DQOs are then compared to the DWM’s DQOs to look for any large discrepancies that could affect acceptability. Notes
regarding each review are documented on a standard external data review form. In cases where additional information
is needed, the external group is contacted for the information. If available information is deemed insufficient to
complete the review, the data source is rejected. Data can also be rejected due to poor or undocumented QAPP
implementation, lack of project documentation, incomplete reporting of data or information, poor quality control
results and/or project monitoring objectives unsuitable for MassDEP assessment purposes. Data are rejected as a
whole or in part, depending on the results of the external data review. Best professional judgment is used to make the
final determination regarding data validity and usability to assess water use support. External data are not qualified in
any way; the data are either considered acceptable for use (without qualification) or rejected. External data greater
than 5 years old, with few exceptions, are generally considered unusable for assessment decisions.
Massachusetts Consolidated Assessment and Listing Methodology 2012 Guidance Manual
Page 6
IV.
USE ASSESSMENT DECISION PROCESS
The Massachusetts Surface Water Quality Standards (SWQS) designate the most sensitive uses for which the surface
waters of the Commonwealth shall be enhanced, maintained and protected. The determination of whether or not a
waterbody supports each of the uses designated in the SWQS is a function of the type(s), quality and quantity of
available current information. The EPA provides guidelines to states for making their use support determinations and
recommends that states prepare their 2012 Integrated Reports (IRs) (available at
http://www.epa.gov/owow/tmdl/guidance.html) consistent with previous guidance including the EPA’s 2006 IR
Guidance (Keehner 2011), which supplements earlier EPA IR memoranda and guidance (EPA 2002, Grubbs and
Wayland III 2000, Regas 2003, 2005, 2006, Schwartz 2009, and Wayland III 2001). While the SWQS (Table 1)
prescribe minimum water quality criteria to sustain the designated uses, numerical criteria are not available for every
indicator of pollution. Best available guidance from available literature may be applied in lieu of actual numerical criteria
(e.g., freshwater sediment data may be compared to Guidelines for the Protection and Management of Aquatic
Sediment Quality in Ontario 1993 by D. Persaud, R. Jaagumagi and A. Hayton). Excursions from criteria due solely
to “naturally occurring” conditions (e.g., slightly low pH in some areas) do not constitute violations of the SWQS.
The designated uses of Massachusetts surface waters are described below (MassDEP 2006).
DESGNATED USES OF MASSACHUSETTS SURFACE WATERS
AQUATIC LIFE - suitable habitat for sustaining a native, naturally diverse, community of aquatic flora and fauna,
including, but not limited to, wildlife and threatened and endangered species and for their reproduction, migration,
growth and other critical functions. Two subclasses of aquatic life are also designated in the SWQS for freshwater
bodies: Cold Water Fishery - capable of sustaining a year-round population of cold water aquatic life, such as trout;
Warm Water Fishery - waters that are not capable of sustaining a year-round population of cold water aquatic life. In
certain [estuarine] waters, excellent habitat for fish, other aquatic life and wildlife may include, but is not limited to,
seagrass.
FISH CONSUMPTION - pollutants shall not result in unacceptable concentrations in edible portions of marketable fish
or for the recreational use of fish, other aquatic life or wildlife for human consumption.
DRINKING WATER - used to denote those waters used as a source of public drinking water. They may be subject to
more stringent regulation in accordance with the Massachusetts Drinking Water Regulations (310 CMR 22.00). These
waters are designated for protection as Outstanding Resource Waters under 314 CMR 4.04(3).
SHELLFISH HARVESTING (in SA and SB segments) – Class SA waters where designated shall be suitable for
shellfish harvesting without depuration (Approved and Conditionally Approved Shellfish Areas); Class SB waters
where designated shall be suitable for shellfish harvesting with depuration (Restricted and Conditionally Restricted
Shellfish Areas).
PRIMARY CONTACT RECREATION - suitable for any recreation or other water use in which there is prolonged and
intimate contact with the water with a significant risk of ingestion of water. These include, but are not limited to, wading,
swimming, diving, surfing and water skiing.
SECONDARY CONTACT RECREATION - suitable for any recreation or other water use in which contact with the
water is either incidental or accidental. These include, but are not limited to, fishing, including human consumption of
fish, boating and limited contact incident to shoreline activities. Where designated, secondary contact recreation also
includes shellfishing, including human consumption of shellfish. Human consumption of fish and shellfish are assessed
as the Fish Consumption and Shellfish Harvesting uses, respectively.
AESTHETICS - all surface waters shall be free from pollutants in concentrations or combinations that settle to form
objectionable deposits; float as debris, scum or other matter to form nuisances; produce objectionable odor, color, taste
or turbidity; or produce undesirable or nuisance species of aquatic life.
AGRICULTURAL - suitable for irrigation or other agricultural uses
INDUSTRIAL – suitable for compatible industrial cooling and process uses.
Massachusetts Consolidated Assessment and Listing Methodology 2012 Guidance Manual
Page 7
As part of the 305(b) reporting process, each designated use (*see exception note below*) of the surface waters in the
state for each waterbody segment (called an assessment unit or AU in the assessment database) is individually
assessed as support or impaired. When too little current data/information exist or no reliable data are available, the
use is not assessed. It is important to note that not all waters are assessed. Many small and/or unnamed ponds,
rivers, and estuaries have never been assessed. The status of their designated uses has never been reported to the
EPA in the Commonwealth’s 305(b) Report or the Integrated List of Waters nor is information on these waters
maintained in the assessment database (ADB). These waterbodies are also considered not assessed.
*Exception Note: There are three uses - Drinking Water, Agricultural, and Industrial - not assessed for 305(b)
reporting purposes by DWM analysts. The Drinking Water Use denotes those waters used as a source of public
drinking water. These waters may be subject to more stringent regulation in accordance with the Massachusetts
Drinking Water Regulations (310 CMR 22.00). They are designated for protection as Outstanding Resource Waters
in 314 CMR 4.04(3). The MassDEP’s Drinking Water Program (DWP) has primacy for implementing the provisions of
the Federal Safe Drinking Water Act (SDWA). Except for suppliers with surface water sources for which a waiver from
filtration has been granted (these systems also monitor surface water quality), all public drinking water supplies are
monitored as finished water (tap water). Monitoring includes the major categories of contaminants established in the
SDWA: bacteria, volatile and synthetic organic compounds, inorganic compounds and radionuclides. The DWP
maintains current drinking supply monitoring data. The suppliers currently report to the MassDEP and the EPA on the
status of the supplies on an annual basis in the form of a consumer confidence report
(http://yosemite.epa.gov/ogwdw/ccr.nsf/Massachusetts). While the EPA does provide guidance to assess the status of
the Drinking Water Use (impairment decision if there is one or more advisories, more than conventional treatment is
required, or there is a contamination-based closure of the water supply), this use is currently not assessed by DWM
analysts. Rather, information on the drinking water source protection and finished water quality can/should be
obtained at http://www.mass.gov/dep/water/drinking.htm and from local public water suppliers. The Agricultural and
Industrial uses have never been assessed or reported on to date.
The guidance used to assess the Aquatic Life, Fish Consumption, Shellfish Harvesting, Primary and Secondary Contact
Recreation and Aesthetics uses are provided in the following pages of this manual. For each of these designated uses
the background and context information on the data /indicators used for making the use assessment decision are
provided. Depending on the water body type, assessment decision trees for the use assessment indicator(s) are
also given. When too little data or information are available the use is not assessed.
Massachusetts Consolidated Assessment and Listing Methodology 2012 Guidance Manual
Page 8
Aquatic Life Use
Waters supporting the Aquatic Life Use should be suitable for sustaining a native, naturally diverse,
community of aquatic flora and fauna. This use includes reproduction, migration, growth and other critical
functions. Two subclasses of aquatic life are designated in the SWQS for freshwater bodies -- Cold
Water Fishery - capable of sustaining a year-round population of cold water stenothermic aquatic life,
such as trout, and Warm Water Fishery - waters that are not capable of sustaining a year-round population of cold water
stenothermic aquatic life. In estuarine waters, excellent habitat for fish, other aquatic life and wildlife may include, but is
not limited to, seagrass (MassDEP 2006).
Use Assessment Decision-Making Process:
Results from biological (and habitat), toxicological, physico-chemical, sediment, and body burden investigations are
all considered in assessing the Aquatic Life Use. The type, quality, and amount of data generated for each of these
indicators are first evaluated to determine if they are appropriate for use in the assessment decision-making process.
Very often only one of the indicators is represented in the available data set or data from one indicator is obviously
superior to the others. In these cases use support decisions are made based solely or mostly on one indicator.
However, in cases where data are available from multiple indicators and the data are of equal quality the biological
community data, in most cases, outweigh all other types in the decision-making process because they are
considered an integration of the effects of pollutants and other conditions over time. Under these circumstances the
biological community data, particularly those generated by a RBP III multi-metric analysis (Plafkin et al. 1989) or, in
the case of Cold Water Fisheries, the fish population data are usually considered by the MassDEP to be the best and
most direct measure of the Aquatic Life Use. Since toxicological testing data also measure biological response to
environmental stressors in the absence of biological community data they are given more weight than direct
measurements of physico-chemical stressors. Thus, assuming all data are of equal quality, the weight-of-evidence
gradient for data used by the MassDEP analysts follows this continuum -- biological (including habitat) data first,
followed by toxicological data, followed by chemical (physico-chemical, sediment chemistry data, whole-fish tissue
residue) data.
The background and context information for the indicators used in the Aquatic Life Use assessment decision process
are provided below in the order of the weight-of-evidence gradient used by MassDEP. Within each indicator a
summary decision tree (i.e., support decision and impairment decision) is provided. When too little data or
information are available, the Aquatic Life Use is not assessed. An overall summary of the indicators and the
decision process used by the MassDEP analysts for making the Aquatic Life Use assessment decisions can be
found in Table 2 (see end of this use assessment guidance).
Massachusetts Consolidated Assessment and Listing Methodology 2012 Guidance Manual
Page 9
Benthic macroinvertebrate data (rivers) The benthic macroinvertebrate
sampling data generated by DWM biologists are usually from 100organism subsamples, which are analyzed by a multimetric approach
based on a modification of Rapid Bioassessment Protocol III (RBP III)
metrics and scoring (Plafkin et al. 1989). [Note: occasionally other
sampling regimes are employed (e.g., in deep rivers or where kick
sampling is inappropriate or impractical, multi-plate samplers may be
used).] Sampling takes place during the months of July through
September when baseflows are at their lowest of the year and water
quality is presumed to be at its worst. The sampling index for a specific
watershed also approximates historical sampling periods for that
watershed, when possible. Metric values for each station are scored based
on comparability to a reference station, and scores are totaled. The percent
comparability of total metric scores for each study site to those for a preselected least impaired reference station (i.e. “best attainable” condition)
yields an impairment score for each site. The RBP III analysis separates
sites into four categories (% of reference condition): non-impaired (>83%),
slightly impaired (54 – 79%), moderately impaired (21 – 50%), and severely
impaired (<17%). Reference station sites and sites determined to be nonimpaired or slightly impaired based on the RBP III analysis are assessed
as supporting the Aquatic Life Use. Moderately and severely impaired
RBP III sites are assessed as non-support. Occasionally, sample
attributes may be noted by DWM biologists that influence an assessment
decision (e.g., biologists note hyperdominance by a pollution tolerant
species even though the RPB III analysis indicated only slight impairment.
In this case a determination of “impaired” may be made).
The DWM’s benthic macroinvertebrate monitoring results are typically
summarized in a technical memorandum by watershed. These
memoranda combine habitat assessment information and the analysis of
multi-metric benthic community characteristics for comparison to
previously established reference station data (RBPIII analyses). Qualityassured external sources of benthic macroinvertebrate survey reports are
occasionally available from outside parties (e.g., other state/federal
agencies, consultants, watershed associations, NPDES permittees).
Use is Supported
Non-impaired/most slightly
impaired RBP III analysis,
reference sites
Use is Impaired
Moderately impaired/severely impaired RBP III
analysis, slightly impaired RBP III with special
condition (e.g., hyperdominance by pollution
tolerant sp.) as noted by DWM biologists
Benthic macroinvertebrate data (lakes) – Not currently utilized to evaluate
Aquatic Life Use of lentic waters.
Benthic macroinvertebrate data (estuaries) DWM analysts occasionally
utilize external sources of benthic macroinvertebrate data combined with
other water quality monitoring data when making Aquatic Life Use
assessments of estuarine waterbodies. While no standardized multi-metric
analysis is currently employed, some quantitative benthic sampling has been
conducted in Massachusetts estuaries (e.g., Massachusetts Water
Resources Authority (MWRA) and Massachusetts Estuaries Project (MEP)
projects). Sample attributes typically reported include number of species,
number of individuals, diversity (H’), evenness (E), and organism-sediment
relationship (e.g., opportunistic, deep burrowers, etc.). The overall analyses
reported by these external data sources are utilized to make Aquatic Life Use
attainment decisions.
Use is Supported
High number species, high number
individuals, good diversity and
evenness, moderate to deep
burrowing, tube dwelling organisms
present, as reported from external
data sources.
Background/context:
MassDEP DWM Benthic
Macroinvertebrate Biomonitoring
Quality Assurance Project Plan
(MassDEP 2005)
The biological sampling methodology is
described in an SOP (MassDEP 2007)
and is based on the USEPA Rapid
Bioassessment Protocols (RBPs) (Plafkin
et al. 1989). The main objectives of
biomonitoring are: (a) to determine the
biological health of streams within the
watershed by conducting assessments
based on aquatic macroinvertebrate
communities; and (b ) to identify
problem stream segments so that
efforts can be focused on developing or
modifying NPDES and Water
Management Act permits, storm water
management, and control of other
nonpoint source (NPS) pollution.
A regional reference station approach
is currently used for comparisons to site
data…this is useful in assessing
nonpoint source (NPS) pollution
impacts (e.g., physical habitat
degradation), including NPS pollution
at upstream sites as well as suspected
impacted sites downstream from
known point source stressors…benthic
data from some stations are not
compared to a regional reference
station due to considerable differences
in stream morphology, flow regimes,
and drainage area, or simply lack of a
suitable reference site.
A site-specific sampling approach
(downstream study site compared to
an upstream reference site) is
occasionally employed for an
assessment of a known impact site
(e.g., point source discharge), provided
that the stations being compared share
basically similar instream and riparian
habitat characteristics…
Use is Impaired
Low number species, low number
individuals, poor diversity and evenness,
shallow dwelling opportunistic species or
near absence of benthos, thin feeding zone,
as reported from external data sources.
Massachusetts Consolidated Assessment and Listing Methodology 2012 Guidance Manual
Page 10
Background/context:
MassDEP DWM Fish Collection
Procedures for Evaluation of Resident
Fish Populations Standard Operating
Procedures (MassDEP 2011a)
Monitoring of the fish assemblage is an
integral component of the Massachusetts
DEP water quality management program,
and its importance is reflected in state
stream class and use-support
designations. Assessments of the fish
assemblage must measure the overall
structure and function of the
ichthyofaunal community to adequately
evaluate biological integrity and protect
surface water resource quality.
Species composition classifications:
Tolerance Classification - Tolerant,
Moderately Tolerant, Intolerant
Classification of tolerance to
environmental stressors similar to that
provided in Plafkin et al. (1989), Barbour
et al. (1999), and Halliwell et al. (1999).
Final tolerance classes are those provided
by Halliwell et al. (1999).
Macrohabitat Classification Macrohabitat Generalists, Fluvial
Specialists, Fluvial Dependents
Classification by common macrohabitat
use as presented by Bain (1996) modified
regionally following discussions between
MassDEP and MA DFG fishery biologists.
Cold Water Species: brook, brown and
rainbow trout; Atlantic salmon; slimy
sculpin; longnose sucker; American brook
lamprey; and burbot
Warm Water Fluvial
Specialist/Dependent Species:
blacknose dace, fallfish, common shiner,
white sucker, longnose dace, creek
chubsucker, tessellated darter, bridle
shiner, creek chub, shortnose sturgeon,
Atlantic sturgeon, blueback herring,
American shad, margined madtom,
spottail shiner, eastern silvery minnow,
mimic shiner
Fish population data (rivers) MassDEP biologists use electrofishing gear
(i.e., backpack or barge shockers) to sample fish from 100 m reaches of
wadeable streams. Specimens that can be identified in the field are
counted, examined for external anomalies, (i.e., deformities, eroded fins,
lesions, and tumors) and this information is recorded on field data sheets.
The procedures generally follow the protocols outlined in the RBP V (Plafkin
et al. 1989 and Barbour et al. 1999), however, these call for the analysis of
the data generated from fish collections using an established Index of Biotic
Integrity (IBI) similar to that described by Karr et al. (1986). Since no formal
fish IBI for Massachusetts currently exists, the data provided by the DWM’s
sampling effort are used to qualitatively assess the general condition of the
resident fish population as a function of the overall abundance (number of
species and individuals) and species composition classifications (see inset
for more detail) (MassDEP 2011a). MassDEP analysts also utilize fish
population sampling data available from the Massachusetts Department of
Fish and Game’s (MA DFG), Division of Fisheries & Wildlife (MassWildlife)
(MassWildlife 2008).
When evaluating the status of the Aquatic Life Use in lotic waters based on
fish population information, the data are evaluated using the following
approach as developed by the DWM’s fisheries biologists: For waters
designated Class B Cold Water Fishery or for those waters on MA DFG’s
“Coldwater Fishery Resource List”, the fish population should contain
multiple age classes (indicative of reproducing populations) of any cold
water fish (see inset). In a Class B Warm Water Fishery, the fish population
should be well represented by fluvial specialist/dependents species (see
inset). The Aquatic Life Use is assessed as impaired in Class B, Cold Water
Fisheries, if no fish were found or cold water species were absent. In Class
B, Warm Water Fisheries, the Aquatic Life Use is assessed as impaired if no
fish were found or fluvial fish were absent or relatively scarce (few numbers).
Prior to any impairment decision based on the fish population data the
sources are reviewed for any notes regarding sampling efficiency or other
problems encountered by the field sampling crews that may have resulted in
less than optimal sampling effectiveness. In waterbodies where poor
sampling efficiencies were noted the Aquatic Life Use would not be
assessed based on the fish population data. The presence of external
anomalies (i.e., deformities, eroded fins, lesions, tumors -- DELTS) are noted
and, if found in >10% of the sample, follow-up histology may be conducted
to evaluate pollution-related conditions.
Use is Supported
Cold Water Fishery
Multiple age classes (indicative of
reproducing populations) of any cold
water fish
Use is Supported
Warm Water Fishery
In lotic environments the fish
population should be well
represented by multiple age classes
of fluvial specialist/dependents
species
Use is Impaired
Cold Water Fishery
No fish found or cold water species
absent, DELTS with abnormal fish
histology
Use is Impaired
Warm Water Fishery
No fish found or fluvial fish were absent or
relatively scarce (few numbers), DELTS
with abnormal fish histology
Fish population data (lakes, estuaries) –Not currently utilized to make
Aquatic Life Use support determination for either lentic or estuarine waters.
However, impact evaluations based on studies of site-specific fish population
data (e.g., those associated with large power plant type operations relating
to impingement and entrainment) and/or the presence of DELTS with
abnormal fish histology have been used to determine that the Aquatic Life
Use is impaired.
Use is Supported
None made
Use is Impaired
> 5% population losses estimated , DELTS
with abnormal fish histology
Massachusetts Consolidated Assessment and Listing Methodology 2012 Guidance Manual
Page 11
Habitat and flow data (rivers, lakes, estuaries)
Most often evaluations of in-stream habitat support the biological survey
results and enhance the interpretation of the biological data. When
biological communities are determined to be impaired from RBP analyses
obvious habitat stresses (e.g., sedimentation) are evaluated as possible
causes of the impairment. Occasionally, however, the habitat perturbations
themselves are severe enough to warrant an impairment decision. These
situations include absence of visible streamflow and/or dewatered
streambed in a perennial stream or dewatered lake due to artificial
regulation, extreme deviation from expected flows (e.g., channel status for
all but one stream during a survey noted as full but the one stream had little
flow), and lack of natural habitat structure (e.g., concrete channel,
underground conduit). Any anadromous fish passage structures that are
impassable are considered to be an impairment of the Aquatic Life Use.
[Note: if impediments to fish passage (such as dams) exist but no
structure has ever been built to allow fish passage, no impairment
decision is currently made.] Impacts associated with water intakes in
rivers, lakes, and estuaries (i.e., power plants, cooling water intake
structures) are evaluated on a case-by-case basis by DWM biologists by
looking at the thermal plumes --blockage of fish passage, potential
toxicity, and its attractable nature, as well as impingement, entrainment,
and fish returns. Evidence of impact(s) (i.e., determination of unhealthful
habitat or population impact) may result in a determination that the
Aquatic Life Use is impaired.
The sources of information that DWM analysts utilize to evaluate habitat
quality and streamflow conditions include the following: the DWM’s
habitat assessment field sheets and scores (see inset, usually reported in
technical memoranda), observations recorded on the DWM water quality
monitoring field sheets (water quality technical memoranda or the DWM’s
open files) , the United States Geological Survey (USGS) real-time and
historical streamflow data
(http://waterdata.usgs.gov/ma/nwis/current/?type=flow), and the MA DFG,
Division of Marine Fisheries (DMF) technical reports on surveys of
anadromous fish passage in coastal Massachusetts
(http://www.mass.gov/dfwele/dmf/publications/technical.htm#tr).
The MassDEP SWQS stipulate the most severe hydrologic conditions at
which water quality criteria must be applied to prevent adverse impacts of
discharges. For rivers, the lowest flow condition at and above which
aquatic life criteria must be applied is the lowest flow to be expected for
seven consecutive days during a 10-year period; the 7-day, 10-year low
flow (7Q10). The analysts must understand the hydrologic conditions
encountered during the surveys and evaluate them against the estimated
7Q10 flow. One of the following methods, in preferential order, may be
utilized to estimate the 7Q10: the USGS supported program called
StreamStats (provides estimated streamflow statistics for ungaged sites),
a drainage area ratio transform method, a flow factor estimate based on
drainage area, or DFLOW, a software program used by the EPA permit
writers. For lakes and estuaries the extreme hydrologic condition at which
the aquatic life criteria must be applied will be established by the
MassDEP on a case-by-case basis.
The presence of dams, flood control projects, water supply withdrawals,
hydropower projects, and intake structures are considered potential
habitat alterations.
Use is Supported
No direct evidence of severe physical
habitat or stream flow regime
alterations, functioning anadromous
fishways present
Background/context:
MassDEP DWM Benthic
Macroinvertebrate Biomonitoring
Quality Assurance Project Plan
(MassDEP 2005)
Habitat qualities are scored using
a modification of the evaluation
procedure in Plafkin et al. (1989).
Most parameters evaluated are
instream physical attributes often
related to overall land use and are
potential sources of limitation to the
aquatic biota. Key physical
characteristics of the water body and
surrounding land use include the
following:
instream cover, epifaunal substrate,
embeddedness, sediment deposition,
velocity/depth combinations, channel
flow status, right and left bank
vegetative protection, right and left
bank stability, right and left bank
riparian vegetative zone width.
Habitat parameters are scored,
totaled, and compared to a regional
reference station and/or a sitespecific control (upstream reference)
station to provide a final habitat
ranking.
Streamflow Conditions (MassDEP
2005b): “Historically, river surveys
conducted by DWM staff were
typically performed during low-flow,
dry-weather conditions which
generally represented the worstcase scenario with respect to the
assessment of impacts on receiving
water quality from point discharges.
Today, increased attention is given
to the identification and control of
nonpoint pollution, and survey
methods are changing to reflect this
shift in emphasis. For example,
wet-weather sampling may provide
the most reliable information
pertaining to nonpoint pollutant
loadings from stormwater runoff
and, when compared with dryweather survey data, may further
distinguish the effects of point and
nonpoint pollution sources.”
Use is Impaired
Physical habitat structure impacted by
anthropogenic stressors (e.g., lack of flow,
lack of natural habitat structure -- concrete
channel, underground conduit), nonfunctioning anadromous fishway present
Massachusetts Consolidated Assessment and Listing Methodology 2012 Guidance Manual
Page 12
Background/context:
MassDEP Eelgrass Mapping Project
(MassGIS 2008 and Costello and
Kenworthy 2011)
Seagrass beds are critical components
of shallow coastal ecosystems. They
provide food and cover for important
fauna and their prey, their leaf canopy
calms the water, filters suspended
matter and together with extensive
roots and rhizomes, stabilizes
sediment. Eelgrass, Zostera marina, is
the most common seagrass present on
the Massachusetts coastline. The
other species found in embayments is
Ruppia maritima, widgeon grass,
which is present in areas of less
salinity along the Cape Cod and
Buzzards Bay coast.
Eelgrass bed mapping data (estuaries)
The primary biological information used to make assessment decisions for
the Aquatic Life Use in marine or estuarine waters is obtained from
estimated eelgrass bed maps based on surveys conducted by the
MassDEP, Wetlands Conservancy Program (WCP), as part of the
Eelgrass Mapping Project. Currently the best available information on the
general eelgrass extent in Massachusetts come from these various
eelgrass (seagrass) mapping efforts, which are available as data layers
through the MassGIS (http://www.mass.gov/mgis/eelgrass.htm,
http://www.mass.gov/mgis/eelgrass0607.htm) or MassDEP (51grass.shp).
The earliest available data are from 1951, although these data were only
anecdotally validated. The subsequent statewide seagrass mapping
project was conducted in three phases beginning in 1994 and ending in
2007. Data acquisition and image interpretation are detailed in Costello
and Kenworthy (2011). The initial mapping phase was conducted between
1994 and 1996 encompassing 46 embayments and portions of seven
open-water near-shore areas. Remapping was conducted in 29 of the 46
embayments between 2000 and 2002. The third mapping effort in 33 of
the 46 embayments was carried out in 2006 and 2007.
Often considered a sentinel species for
evaluating ecosystem health, the
distribution and abundance of eelgrass
beds can be documented with aerial
photographs, digital imagery and field
verification. Much of the MA coast has
a sandy substrate which provides a
useful color contrast to map the darker
seagrass photo signatures. Accuracy
estimates of this quantitative mapping
project were reported to be >85% for
the 1994-1996 effort and had improved
to 94% in the 2006-2007 effort. These
eelgrass data layers are currently the
best available information on general
eelgrass extent in Massachusetts.
The percent of eelgrass within a waterbody segment area is calculated by
DWM analysts for each mapping period available using ArcMap analysis
tools. The delineated waterbody segment shape is intersected with each
available eelgrass mapping data layer and the size of the eelgrass bed(s)
within the waterbody segment area is calculated. The percentage of the
waterbody segment area comprised of eelgrass bed is then calculated
and, from these analyses, changes over the different mapping periods can
be estimated. Analysts must still consider the relative presence of beds
and whether change (i.e., loss) may be due to “natural” movement of beds
either within, or adjacent to, a waterbody segment area. Since the 1951
data layer has confidence values provided for each bed, only those areas
indicated with a high level of confidence should be used when making
comparisons with data from subsequent years. Depending on the data
years available for a waterbody an evaluation can be made as to whether
or not beds are fairly stable or if there is loss.
With appropriate temporal and spatial
scaling, monitoring environmental
quality and mapping the changes in
seagrass distribution and abundance
can provide scientists and managers
with a sensitive tool for detecting and
diagnosing environmental conditions
responsible for the loss or gain of
seagrasses. For example, unlike
situations where degraded optical
water quality reduces light penetration
and threatens plants mostly in the
deeper water, the effects of multiple
stressors associated with
eutrophication cause more widespread
losses of eelgrass which are not just
confined to the deepest edges of the
seagrass beds.
Assessment decisions are based on whether or not the eelgrass beds
within the waterbody segment area are stable or are being lost. If the beds
are increasing or fairly stable (i.e., either no or minimal loss) the segment is
considered to be supporting the Aquatic Life Use. When the analyses
show that there has been a total loss of beds (no matter what size) within a
segment area the Aquatic Life Use is assessed as impaired. Our definition
of “substantial decline” up to this point in time has been based on
comparisons of the percent eelgrass in the segment area from the earliest
through the most recent mapping period(s). For example, if the percentage
of the segment area determined to be eelgrass was 50% in 1951, but only
45% in the most recent evaluation (e.g., 2007) we consider this a 5% loss.
Losses equal to or exceeding a value of 10% based on this method is
considered a “substantial decline”. When the confidence associated with
the1951 data was not high and/or when more recent data were not
available no assessment decision was made.
Use is Supported
Eelgrass bed habitat in segment area
is increasing or fairly stable (i.e., no or
minimal loss)
Use is Impaired
Substantial decline (more than 10% of the
in bed size or total loss of beds no matter
their size)
Massachusetts Consolidated Assessment and Listing Methodology 2012 Guidance Manual
Page 13
Non-native aquatic species data (rivers, lakes)
(not used to date for estuaries)
Waters supporting the Aquatic Life Use are suitable for sustaining a
native, naturally diverse, community of aquatic flora and fauna.
Non-native (or exotic) species, unlike the natural biota, have few or no
controls, are often extremely invasive (dominating and/or eliminating
native biota), and can displace a healthy and desirable aquatic
community and produce economically and recreationally severe impacts
even though no other change has occurred in the watershed (Mattson et
al. 2004). Therefore, the presence of an introduced, non-native aquatic
species in a waterbody is considered an impairment of the Aquatic Life
Use.
DWM analysts use three main data sources to acquire information on
the presence of non-native aquatic macrophytes or other aquatic
organisms. They are: the herbicide application/permit file database
maintained by the DWM, a non-native plant spreadsheet maintained by
the Massachusetts Department of Conservation and Recreation (DCR),
Lake and Pond Program staff periodically provided on request, and
DWM survey field sheets. Occasionally information from watershed
volunteer groups or private companies is also utilized.
The herbicide database files maintained by DWM staff occasionally note
the presence of non-native aquatic macrophyte infestation(s) in a
waterbody. When using this data source, however, there is a need to
verify the identification of the non-native(s) listed in herbicide license
applications since contractor identifications may not always be credible.
The DCR, Lake and Pond Program, staff maintains a spreadsheet on
the presence of non-native aquatic macrophytes and provides this
spreadsheet to the DWM on request. Finally, DWM survey field sheets
are reviewed since survey crews note the presence of any non-native
plants observed during the surveys.
The presence of a non-native wetland or semi-terrestrial macrophyte(s)
(e.g., Phragmites sp., Lythrum salicaria) is not usually considered an
impairment of the Aquatic Life Use unless they have eliminated the open
water area of the waterbody. In waterbodies where active aquatic plant
management has occurred it is particularly important to have up-to-date
information to accurately reflect the conditions during the time period in
which the assessment is conducted. In these cases the mere historical
presence of a non-native species may not be appropriate for an
automatic impairment decision.
Use is Supported
Non-native aquatic species absent
Use is Impaired
Non-native aquatic species present
Background/context:
MassDEP Surface Water
Quality Standards (MassDEP
2006) and Guide to Selected
Invasive Non-native Aquatic
Species in Massachusetts
(MA DCR 2007)
The Massachusetts Surface
Water Quality Standards (2006)
definition of Aquatic Life is “A
native, naturally diverse,
community of aquatic flora and
fauna including, but not limited
to, wildlife and threatened and
endangered species.” Since all
waters are designated as
habitat for aquatic life, DWM
analysts use the presence of
non-native aquatic organisms
as an impairment of the Aquatic
Life Use.
According to the MA DCR
(2007), non-native (exotic)
species have been introduced
to our region in a variety of
ways including: hitching rides in
ship ballast water, accidental
release from aquariums,
escape from water gardens and
intentional introduction. Exotic
species are further spread
unintentionally by boaters when
plant fragments are tangled on
boats, motors, trailers, fishing
gear, and dive gear. Some
species, including the zebra
mussel, have a microscopic
larval form that can travel
undetected in ballast water,
cooling water, live-well water
and bait bucket water to new
locations. Once an exotic
species is established, it is
almost impossible to eradicate
and very expensive to control.
The best way to protect a
waterbody is through
prevention, education, early
detection and rapid response.
Massachusetts Consolidated Assessment and Listing Methodology 2012 Guidance Manual
Page 14
Background/context:
Draft Sampling Plan for Year 2010
Periphyton Percent Cover and
Biomass Monitoring in the Northeast
Region Watersheds (MassDEP
undated)
Periphyton (or attached algae) are a
useful biological indicator of water
quality. The fast growing algae are
sessile and take-up their entire nutrient
and mineral needs from the water
column. They are important primary
producers in streams and are critical in
oxygen production as well as carbon
dioxide use and have been used by
many to examine changes in nutrient
(nitrogen and phosphorus) levels since
they integrate nutrient concentrations
over time… algal cover can be
estimated with a viewing bucket and
biomass can be measured using
chlorophyll a analysis. Exposure to low
nutrient levels over time will result in
algal populations represented by genera
that can utilize nutrients at that
concentration. These sites are also
likely to have reduced algal biomass.
Higher algal biomass is often found in
streams exposed to elevated nutrient
levels.
Harmful Blue-Green Blooms
(MassDEP 2010):
Blooms of cyanobacteria can be toxic to
humans and animals. Anabaena,
Nostoc, Microcystis, and Nodularia may
contain the hepatotoxin microcystin,
which can damage the liver. Others like
Aphanizomenon flos-aquae, Anabaena
circinalis and Cylindrospermopsis
raciborskii may carry the neurotoxin
saxitoxin. Counts of the cyanobacteria
are performed in order to determine if
the amount present would be enough to
indicate a moderate level of risk to the
public using the waterbody. The World
Health Organization (WHO 1999) has
found that when cyanobacteria cell
counts exceed 100,000 cells/ml the risk
is then considered moderate.
Massachusetts Dept. of Public Health
(MA DPH) (2007)…determined that a
cell count of 70,000 cells/mL would
correspond to a toxin level of
approximately 14 ppb which is the
current guideline for contact recreational
waters.” The MA DPH provides
guidance on harmful algal blooms in
fresh waterbodies
(http://www.neiwpcc.org/neiwpcc_docs/p
rotocol_MA_DPH.pdf).
Periphyton/algal blooms (rivers, lakes, estuaries)
Microalgae (also described as periphyton) typically appear as a thin film,
often green or blue-green, or as a brown floc (loose material without any
structure that breaks up when touched or removed). Macroalgae, the visible
filamentous forms of green algae, are the “nuisance” type algae. Natural
diversity and the presence of native species may not be sustained when
there are dense growths of a monoculture of a particular alga. Loss of parts
of the food web - vital for Aquatic Life Use support - may result from this
alteration. In addition, die-off and decomposition of large amounts of
biomass from macroalgae can fill in the interstitial sites in the substrate and
destroy this habitat for the benthic invertebrates, further compromising
aquatic life.
Currently no standardized reporting mechanism has been in place for
cyanobacteria data and/or posting information either in-house (MassDEP) or
on the MDPH website, nor is there any single source of data that DWM
analysts can utilize to acquire frequency and/or duration of blue-green algal
blooms. However, waterbodies with recurring frequent and/or prolonged
cyanobacteria blooms are considered to be impaired for the Aquatic Life
Use.
Visual estimates of the presence of phytoplankton blooms (particularly bluegreens), extensive cover of non-rooted aquatic macrophytes (particularly
duckweed or water meal covering >25% of the surface) are made by DWM
survey personnel during river and lake surveys and these data are recorded
on survey field sheets. These data are used, in part, to evaluate response
to nutrient enrichment (see water quality nutrient section). When the visual
determination of the percent substrate cover by filamentous algae within the
reach is below 40% the Aquatic Life Use is considered supported.
However, when the growth of filamentous algae exceeds 40% cover in the
stream reach it is considered as one of the indicators of enriched conditions.
The Massachusetts Estuaries Project (MEP), a major collaborative project
between the MassDEP and the School of Marine Science and Technology
(SMAST) at the University of Massachusetts Dartmouth, along with their
project partners including Coastal Zone Management, the Cape Cod
Commission, municipalities, Applied Coastal Research and Engineering,
Inc., and the USGS, have also generated a significant amount of chlorophyll
and enrichment indicator data for many estuarine systems in coastal
Massachusetts. Since this project is intended to develop site-specific
thresholds for these systems, their analyses are utilized to make Aquatic
Life Use attainment decisions for coastal segments.
Use is Supported
No/infrequent algal blooms or
growths; <25% cover noxious
aquatic plants (e.g. Lemna);
filamentous algal cover within
riffle/reach <40%
Use is Impaired
Frequent and/or prolonged algal blooms or
growths; cyanobacteria blooms that result
in advisories (recurring and/or prolonged);
>25% cover noxious aquatic plants (e.g.
Lemna); filamentous algal cover within
riffle/reach >40%
Massachusetts Consolidated Assessment and Listing Methodology 2012 Guidance Manual
Page 15
Toxicity testing data (rivers, lakes, estuaries)
The MassDEP DWM staff developed and maintain a toxicity testing
database (ToxTD) to manage external toxicity testing data (both
whole-effluent and ambient upstream sample data) submitted by
facilities as part of their National Pollutant Discharge Elimination
System (NPDES) permits. Validation procedures are implemented
prior to uploading final data to the database. MassDEP analysts
utilize this information for making Aquatic Life Use assessment and
permitting decisions. Testing frequency varies by facility and is
associated with the in-stream waste concentration of the discharge;
many Massachusetts facilities conduct quarterly testing, some conduct
tests twice per year, and some conduct tests on an annual basis or a
different schedule.
Survival information for test organisms exposed to ambient (rivers,
lakes, estuary) water samples utilized as either the dilution water or
site control during the whole effluent toxicity test is maintained in the
ToxTD database (MassDEP 2011b). Survival data for these test
organisms are recorded for exposures at 24 and 48 hours and at the
end of chronic test (~ 7-days) and are utilized by DWM analysts in the
Aquatic Life Use assessment decision. Survival information is
summarized for each test species since the last assessment was
completed for a given waterbody segment. The survival data
summary should include the number of tests conducted over the time
period specified and indicate the time of exposure (e.g., 48 hours, 7days, etc. depending on the test). It is the judgment of the DWM staff
that a survival rate of the test organisms exposed to the ambient river
water samples should be greater than or equal to 75% to warrant a
use assessment decision of support. When survival of test organisms
exposed to the river water samples is less than 75% these data are
further evaluated by looking at the frequency and magnitude (with
respect to temporal patterns) of the “low” survival events. The analyst
notes any pattern of problems (e.g., seasonal) and reviews associated
chemistry data to identify potential cause(s)/source(s). An impairment
decision for the Aquatic Life Use is typically made when the frequency
of low organism survival (i.e., <75%) occurs in more than 10% of the
test events since the last assessment was completed.
Whole effluent toxicity testing results are also typically evaluated for
compliance with permit requirements, species sensitivity, and any
other patterns that may be of note. For assessment purposes,
NPDES facility compliance with whole effluent toxicity test and other
limits may be used to identify possible causes/sources of impairment
but is not utilized, solely, for assessment decisions.
Other toxicity testing data sources may include EPA investigations or
testing done as part of waste site investigations and may also included
sediment toxicity testing results. Survival of test controls is always
reviewed for data quality assurance. Typically the average survival of
organisms exposed to the river water/sediment is calculated and any
other test results (e.g., statistically significant from controls) are also
noted but are not utilized for assessment decisions of impairment by
themselves.
Use is Supported
>75% survival of test organisms to
water column or sediment samples in
either 48 hr (acute) or 7-day exposure
(chronic) tests.
Background/context:
Whole Effluent Toxicity
(EPA 2011)
Whole Effluent Toxicity (WET) is
a term used to describe the
aggregate toxic effect of an
aqueous sample (e.g., whole
effluent wastewater discharge) as
measured by an organism's
response upon exposure to the
sample (e.g., lethality, impaired
growth or reproduction). WET
tests replicate the total effect and
actual environmental exposure of
aquatic life to toxic pollutants in
an effluent without requiring the
identification of the specific
pollutants. WET testing is a vital
component of water quality
standards implementation through
the NPDES permitting process
and supports meeting the goals of
the Clean Water Act (Section
402), "maintain the chemical,
physical and biological integrity of
the nation's waters”.
Freshwater organisms used in
WET tests include Ceriodaphnia
dubia (freshwater flea) and
Pimephales promelas (fathead
minnow). Estuarine organisms
used in WET tests include
Americamysis bahia (mysid
shrimp), and Menidia beryllina
(inland silverside). These species
serve as indicators or surrogates
for the aquatic community to be
protected, and a measure of the
real biological impact from
exposure to the toxic pollutants.
WET tests are designed to predict
the impact and toxicity of effluents
discharged from point sources
into receiving waters. WET limits
developed by permitting
authorities are included in NPDES
permits to ensure that water
quality criteria for aquatic life
protection (WET) are met.
Use is Impaired
<75% survival of test organisms to water
column or sediment samples in either 48 hr
(acute) or 7-day exposure (chronic) tests
occurs in >10% of test events.
Massachusetts Consolidated Assessment and Listing Methodology 2012 Guidance Manual
Page 16
Background/context:
MassDEP Monitoring Strategy
(MassDEP 2005b)
One of the DWM’s main programmatic
objectives is to conduct surface water
quality monitoring (collection of chemical,
physical and biological data) to assess the
degree to which designated uses, such as
aquatic life, are being met in waters of the
Commonwealth (CWA 305(b) purposes)
(MassDEP 2005a, MassDEP 2010a).
Massachusetts has selected a set of
monitoring program elements that utilize a
combination of deterministically and
probabilistically derived sampling
networks. Targeted designs may be used
to identify causes and sources of
impairments for reporting pursuant to
sections 305(b) and 303(d) of the CWA,
and to develop and implement control
strategies such as TMDLs, NPDES
permits, or Best Management Practices
(BMP). Furthermore, targeted monitoring
may provide data and information to define
new and emerging issues or to support the
formulation of water quality standards and
policies.
River & stream water quality surveys
generally consist of five or six monthly
sampling events from April 1 to October 15
(primary contact recreation period).
Typical analytes include pH, dissolved
oxygen (DO), temperature, conductivity,
turbidity, total suspended solids, true color,
chloride, nutrients (TP, TN, NH3-N),
dissolved metals and indicator bacteria (E.
coli for freshwater and Enterococci for
coastal areas). Lake surveys typically
include such limnological measurements as
chlorophyll a and Secchi depth, in-situ
measurements using metered probes, and
limited water quality sampling to provide
data for the calculation of TMDLs or the
derivation of nutrient criteria. Lake surveys
are generally conducted during the
summer months when productivity is high.
The use of single or multi-probe sondes for
physical and chemical monitoring is now
also an integral component of the DWM’s
ambient monitoring program. It allows for
the acquisition of short-term, attended
data, using hand-held multi-probe units in
the field, and long-term, unattended data
sets, using stand-alone multi-probe
loggers deployed for 2-6 days, to collect
continuous monitoring data for such
analytes as DO and temperature, pH, and
specific conductance. Continuous water
temperature monitoring units are also
available for deployments of three to four
months from June through September.
Deep-hole profiling for DO and
temperature in lakes are usually taken
between mid-July and early September to
reflect the worse-case conditions.
Water quality data (rivers, lakes, estuaries)
The MassDEP SWQS include specific numeric physical and chemical
water quality criteria adopted to protect aquatic life and human health from
the effects of pollution. The standards also contain narrative criteria for
other constituents (e.g., nutrients, toxics) that must also be evaluated as
part of the Aquatic Life Use attainment decision.
The analysis of water quality monitoring data for evaluating the Aquatic
Life Use depends, in part, on the data set(s) available. DWM analysts rely
most heavily on internal monitoring program data to assess use
attainment. Over the past 10 years the program has transitioned from a
targeted, synoptic survey program, consisting typically of a minimum of
three rounds of water quality sampling during the summer months, to a
more intensive (minimum of five rounds of water quality data during the
sampling season augmented with probe deployments) sampling program.
The quality-assured and validated sampling results of the MassDEP
DWM’s surveys are published in the form of technical memoranda/reports,
typically by watershed and/or sampling year. Water quality data published
online by the USGS (http://waterdata.usgs.gov/ma/nwis/qw/,
http://ma.water.usgs.gov/) are also available for stations across
Massachusetts and are utilized for making Aquatic Life Use assessment
decisions. There are also many other external sources of physicochemical water quality monitoring data (e.g., environmental consultants,
watershed and lake associations, and citizen monitoring programs, etc.).
All external data from these and other sources are reviewed for
quality/reliability according to the DWM’s external data validation
procedures and, so that when approved, they can also be utilized for
assessment decisions.
When analyzing data sets for determining use attainment the analyst
documents the total number of samples in the data set, the ranges of the
data, and, if appropriate, the number of measurements that did not meet
the criterion for each analyte. All validated, physico-chemical water quality
monitoring data are compared to appropriate criteria, as noted below
under individual analytes, from the MassDEP SWQS (MassDEP 2006).
Every attempt is made to consider the frequency, duration and magnitude
of exceedances from criteria or guidance in making impairment decisions.
However, since the data sets available are usually limited, it is often
difficult to have a clear picture of the frequency and/or duration of
exceedances. Under these circumstances a single high or low result can
skew the data, so an impairment decision is never based on a single
sample result.
Assessment guidance is presented below for the following indicators of
water quality conditions: dissolved oxygen, pH, temperature, nutrients, and
toxic/priority pollutants.
Massachusetts Consolidated Assessment and Listing Methodology 2012 Guidance Manual
Page 17
Dissolved oxygen (DO)
DO is a very important indicator of a waterbody's ability to support aquatic life. DO enters water by diffusion directly
from the atmosphere, by mechanical aeration (e.g., a spillway or dam), or as a result of photosynthesis by aquatic
plants and algae and is generally removed from the water by respiration of aquatic organisms and decomposition of
organic matter. Its solubility in water is mainly a function of temperature and pressure and content is reported in terms
of concentration (mg/L or ppm) or as a percentage of saturation (% saturation). DO exhibits natural daily and
seasonal fluctuations.
The MassDEP SWQS (2006) criteria for Dissolved Oxygen (DO) in mg/L are as follows:
Class A Cold Water Fishery (CWF) and Class B Cold Water Fishery (BCWF) and Class SA: 6.0 mg/L
Class A and Class B Warm Water Fishery (BWWF) and Class SB: 5.0 mg/L.
Class C: Not <5.0 mg/L at least 16 hours of any 24-hour period and not <3.0 mg/L at any time.
Class SC: Not <5.0 mg/L at least 16 hours of any 24-hour period and not <4.0 mg/L anytime.
For all classes…where natural background conditions are lower…DO shall not be less than natural background
conditions. Natural seasonal and daily variations that are necessary to protect existing and designated uses shall also
be maintained. There shall be no changes from natural background conditions that would impair any uses assigned to
each class, including those conditions necessary to protect normal species diversity, successful migration,
reproductive functions or growth of aquatic organisms. In cases where a segment has the qualifier “Aquatic Life”
added to the class, the Class C DO criteria are applied.
National criteria for DO (EPA 1986 and 1988) were derived using biological production impairment estimates to protect
survival and growth of aquatic life below which detrimental effects are expected. The national criteria accommodate an
exposure concept (frequency, magnitude and duration of condition). The national criteria daily minima (1.0 mg/L less
than the 7-day mean) were set to protect against acute (mortality) of sensitive species and they were also designed
to prevent significant episodes of continuous or regularly recurring exposures to dissolved oxygen at or near the
lethal threshold. DWM analysts use this daily minimum deviation (1.0 mg/L) from the criterion for impairment
decisions.
Rivers: DWM analysts compare worse-case DO data (i.e., early morning/pre-dawn attended probe measurements)
to the appropriate criterion (depending on a waterbody’s classification). A minimum of three, but preferably five,
sampling events during the summer sampling season is required. If all DO data meet (i.e., are above) the criterion,
DO is considered sufficient to support the Aquatic Life Use. When two or more measurements (any time of the day)
are below the DO criterion the analyst must consider whether or not the conditions are natural (e.g., wetland
influence) or not. The magnitude, (i.e., >1.0 mg/L below the criterion), frequency, and duration of the excursions
(e.g., non-consecutive vs. consecutive low DO measurements) must also be considered. DO is identified as a cause
of impairment if data indicate frequent (typically >10%), prolonged and/or severe excursion(s) from the criteria.
Lakes: Low DO is considered an impairment if the area exhibiting oxygen depletion is >10% of the lake surface area.
In deeper stratified lakes impairment decisions are sometimes made using one deep-hole DO profile during the later
part of the summer growing season. Data requirements for shallow, unstratified lakes follow those of river described
above.
Estuaries: DWM analysts compare DO data to the appropriate criterion (depending on a waterbody’s classification)
for surface water and depth measurements. If all DO data meet (i.e., are above) the criterion, DO is considered
sufficient to support the Aquatic Life Use. The analyst must evaluate the frequency and duration of excursions
(whether or not they exceed 10% of the measurements) as well as the magnitude of any excursions (i.e., >1.0 mg/L
below the criterion). DO is identified as a cause of impairment if data indicate frequent, prolonged and/or severe
excursion(s) from the appropriate criterion.
Note: DO as an indicator related to nutrient enrichment can be found in nutrients.
Rivers
No more than one
excursion from
criteria (minimum
three preferably
five measurements
representing critical
--i.e., pre-dawn,
conditions)
Use is Supported
Lakes
No/little depletion
(the criterion is met
in all depths over
>90% of the lake
surface area
during summer
season)
Estuaries
No/infrequent
(<10%) prolonged
or severe
excursions from
criteria in surface
or bottom waters
Rivers
Frequent (>10%)
and/or prolonged or
severe excursions
(>1.0 mg/L below
standards) from
criteria
Use is Impaired
Lakes
The criterion is not
met at all depths for
>10% of the lake
surface area during
periods of
maximum oxygen
depletion
Massachusetts Consolidated Assessment and Listing Methodology 2012 Guidance Manual
Estuaries
Frequent (>10%)
and/or prolonged or
severe excursions
(>1.0 mg/L below
standards) from
criteria
Page 18
pH.
The pH of water is a measure of its hydrogen ion (H+) concentration on a negative logarithmic scale, which ranges
from 0 to 14 standard units (SU). A pH value less than 7 indicates higher H+ content (acidic solutions), whereas pH
values above 7 denote alkaline solutions. Natural waters exhibit a wide range of pH values depending upon their
chemical and biological characteristics. Unpolluted river water usually has a pH between 6.5 and 8.5 SU (Hem
1970). In productive segments diurnal fluctuations in pH may occur as photosynthetic organisms take up dissolved
carbon dioxide during the daylight hours reducing the acidity of the water so pH increases. Respiration and
decomposition during the night produces CO2 that dissolves in water as carbonic acid, thereby lowering the pH.
The pH of water affects the solubility (amount that can be dissolved in the water) and biological availability (amount
that can be utilized by aquatic life) of chemical constituents such as nutrients (phosphorus, nitrogen, and carbon)
and heavy metals (lead, copper, cadmium, etc.).
The MassDEP SWQS criteria for pH are as follows:
Class A, Class BCWF and Class BWWF: 6.5 - 8.3 SU and 0.5 outside the natural background range.
Class C: 6.5 - 9.0 SU and 1.0 outside the natural background range.
Class SA and Class SB: 6.5 - 8.5 SU and 0.2 SU outside the natural background range.
Class SC: 6.5 - 9.0 SU and 0.5 SU outside the natural background range.
There shall be no change from natural background conditions that would impair any use assigned to each class.
Studies done to evaluate the acidity of surface waters in Massachusetts found geographical differences within the state
(Walk et al. 1991). The regions with the lowest average pH and acid neutralizing capacity (ANC) were the southeastern
and north-central areas of the state while the highest average pH and ANC were in the western-most area (the only
area with significant limestone deposits). Mattson et al. (1992) used the state map of bedrock formations produced by
Zen (1983) to delineate the boundaries between six regions of similar bedrock geology and water quality. According to
Portnoy et al. (2001) the seashore kettle ponds are naturally acid (varying between pH 4 and 6 SU) and have been
for millennia.
Rivers and Estuaries: MassDEP analysts compare pH data to the appropriate criteria range. If all pH data are within
the range the Aquatic Life Use is considered to be supported. When two or more measurements are outside the
range analysts must consider whether or not the conditions are natural given the tendency towards acidic conditions
described above (e.g., low pH in an wetland dominated sampling area based on field sampling notes and MassGIS
topographic maps, orthophotos, and/or land use coverage). The magnitude of the excursion (i.e., >0.5 SU below the
criterion), and the frequency of the excursions (e.g., non-consecutive vs. consecutive low or high pH measurements)
should be considered. pH is identified as a cause of impairment if data indicate frequent, prolonged and/or severe
excursion(s) from the criteria. The use may be impaired if criteria are exceeded in >10% of measurements that are
not considered to be due to natural conditions.
Lakes: An impairment decision can be made using one deep-hole probe profile during the summer growing season that
indicates an extreme excursion from the criteria range.
Rivers
No or slight
excursions (<0.5
SU) from criteria
(minimum five
measurements)
Use is Supported
Lakes
No or slight
excursions (<0.5
SU) from criteria
(minimum one
deep-hole profile
during summer
growing season)
Estuaries
No or slight
excursions (<0.5
SU) from criteria
(minimum five
measurements)
Rivers
Frequent (>10%)
and/or prolonged or
severe excursions
(>0.5 SU) from
criteria
Use is Impaired
Lakes
Excursion from
criteria (>0.5 SU)
summer growing
season
Massachusetts Consolidated Assessment and Listing Methodology 2012 Guidance Manual
Estuaries
Frequent (>10%)
and/or prolonged or
severe excursions
(>0.5 SU) from
criteria
Page 19
Temperature.
Most aquatic organisms are unable to internally regulate their core body temperature. Therefore, temperature exerts
a major influence on the biological activity and growth of aquatic organisms and the ability of organisms to tolerate
certain pollutants. Temperature is also important because of its influence on water chemistry. Temperature affects
the solubility of oxygen in water. Warm water holds less oxygen that cool water, so it may be saturated with oxygen
but still not contain enough for survival of aquatic life. The rate of chemical reactions generally increases at higher
temperature, which in turn affects biological activity. Some compounds are also more toxic to aquatic life at higher
temperatures.
The MassDEP SWQS criteria for temperature are as follows (MassDEP 2006):
Class A CWF: <68 F (20°C) based on the mean of the daily maximum temperature over a seven day period in
cold water fisheries, unless naturally occurring and T due to a discharge <1.5°F (0.8°C).
Class A WWF: <83°F (28.3°C) and T due to a discharge <1.5°F (0.8°C).
Class B CWF: <68°F (20°C) based on the mean of the daily maximum temperature over a seven day period in
all cold water fisheries, unless naturally occurring, and T due to a discharge < 3°F (1.7°C).
Class B WWF: <83°F (28.3°C) and T due to a discharge <5°F (2.8°C) in rivers (based on the minimum expected
flow for the month) and T due to a discharge <3°F (1.7°C) in the epilimnion (based on the monthly average of
maximum daily temperatures) in lakes.
Class C and Class SC: <85°F (29.4°C) and T due to a discharge <5°F (2.8°C).
Class SA: <85°F (29.4°C) nor a maximum daily mean of 80°F (26.7°C) and T due to a discharge <1.5°F (0.8°C).
Class SB: <85°F (29.4°C) nor a maximum daily mean of 80°F (26.7°C) and T due to a discharge <1.5°F (0.8°C)
between July and September and <4.0°F (2.2°C) between October and June.
For all classes, natural seasonal and daily variations that are necessary to protect existing and designated uses shall
be maintained. There shall be no changes from natural background conditions that would impair any uses assigned
to each class, including those conditions necessary to protect normal species diversity, successful migration,
reproductive functions or growth of aquatic organisms. Alternative effluent limitations established in connection with
a variance for a thermal discharge issued under 33 U.S.C § 1251 (FWPCA, § 316(a)) and 314 CMR 3.00 are in
compliance with 314 CMR 4.00. As required by 33 U.S.C. § 1251 (FWPCA, § 316(a)) and 314 CMR 3.00, for permit
and variance renewal, the applicant must demonstrate that alternative effluent limitations continue to comply with the
variance standard for thermal discharges.
Rivers: For waters designated as Cold Water Fisheries (CWF) the analyst evaluates if temperature measurements
meet the criterion (<20°C) particularly during the summer index period. When only small data sets are available the
Aquatic Life Use is assessed as support if there are no/infrequent/small excursions (1 to 2°C) from the criterion. With
the availability of deployed probe (long term) data sets the mean of the daily maximum temperatures over 7-day
periods should be < 20°C. The analyst should note the deployment period, the number of measurements, the
temperature range, and provide the number of 7-day periods the cold water criterion (20ºC) is exceeded (based on
rolling average calculations of 7-day mean of the daily maximum temperatures) out of the number of 7-day periods
during the deployment. Excursion from criteria should not be frequent or prolonged. With small data sets the analyst
must consider the frequency/magnitude of exceedances to evaluate if elevated temperature measurements are
enough to impair the Aquatic Life Use. However, more data are typically considered necessary to make an
impairment decision. For long-term data sets, the analyst should impair the Aquatic Life Use when the criterion is
frequently exceeded or by >2°C.
Rivers and Lakes: For Warm Water Fisheries (WWF) the analyst evaluates if temperature measurements meet the
criterion (<28.3°C) particularly during the summer index period. With small data sets the Aquatic Life Use is
assessed as support if there are no or infrequent excursions from the criterion. When deployed probe (long term)
data sets are available the maximum temperature and the total number of measurements should be determined as well
as the number of days, the number of hours exceeding 28.3°C, and the average number of hours when the
exceedances occurred. Excursions from criteria should not be frequent or prolonged. With small data sets the
analyst considers the frequency/magnitude of exceedances to evaluate if elevated temperature measurements are
enough to impair the Aquatic Life Use. For long-term data sets the analyst impairs the Aquatic Life Use if
temperatures frequently (>10% measurements) exceed 28.3°C in a waterbody or by >2°C.
Estuaries: The analyst evaluates if temperature measurements meet the criteria (<29.4°C and maximum daily mean
of 26.7°C). Impact of large thermal discharges: Site specific evaluations are made with regard to the rise in in-situ
temperatures due to the discharge. Changes over the ΔT criteria result in impairment decisions.
Use is Supported
Cold Water Fishery
Warm Water Fishery
no/infrequent/small
excursions (1 to 2°C)
above 20°C
no/infrequent excursions
above criteria (28.3°C)
Use is Impaired
Cold Water Fishery
Warm Water Fishery
criterion frequently
exceeded (>10%) or by
>2°C
Massachusetts Consolidated Assessment and Listing Methodology 2012 Guidance Manual
criterion frequently exceeded
(>10% measurements) or by
>2°C.
Page 20
Nutrients. The MassDEP SWQS include both narrative nutrient and aesthetic criteria (see excerpts below) that are
applicable to all surface waters (MassDEP 2006).
“Unless naturally occurring, all surface waters shall be free from nutrients in concentrations that would cause or
contribute to impairment of existing or designated uses and [concentrations] shall not exceed the site specific
criteria developed in a TMDL ….Any existing point source discharge containing nutrients in concentrations that
would cause or contribute to cultural eutrophication [defined elsewhere in the MassDEP SWQS as ‘The human
induced increase in nutrients resulting in acceleration of primary productivity, which causes nuisance conditions,
such as algal blooms or dense and extensive macrophyte growth, in a waterbody.’], including the excessive growth
of aquatic plants or algae, in any surface water shall be provided with the most appropriate treatment … to
remove such nutrients [point and nonpoint source controls] to ensure protection of existing and designated uses…”
And “All surface waters shall be free from pollutants in concentrations or combinations that settle to form
objectionable deposits; float as debris, scum or other matter to form nuisances; produce objectionable odor, color,
taste or turbidity; or produce undesirable or nuisance [growth or amount] species of aquatic life.”
To evaluate a waterbody for nutrient related impairment MassDEP analysts rely on multiple, supporting indicators as
evidence of nutrient enrichment. Biological indicators of nutrient enrichment include the presence of nuisance
growths of primary producers or population changes in certain critical species. Indications of high primary
productivity are often observed as changes to certain physico-chemical analytes, as well. The more combinations of
these indicators can be documented the stronger the case for the Aquatic Life Use to be assessed as impaired. And,
while total phosphorus or nitrogen concentration data, which are screened against 1986 EPA recommended “Gold
Book” criteria, are not currently utilized alone to determine impairment due to nutrient enrichment they help to
corroborate indicator data and can help to identify potential sources (e.g., release of phosphorus from anoxic
sediments). Nutrient enrichment is not considered to be problematic when indicators, as described above, are
absent even if nutrient concentrations exceed their recommended criteria. However, when the multiple, supporting
indicators show nutrient enrichment to be problematic and concentration data exceed their criterion, the nutrient is
also identified as a cause of impairment.
Rivers: DWM analysts currently support the Aquatic Life Use if there are no/limited observable nuisance growths of
algae in forms such as filamentous coverage, planktonic blooms, or mats, or macrophytes (particularly non-rooted
forms) during the summer index period (see periphyton/algal bloom indicator summary). When excessive growths
are observed the analyst also considers changes in physico-chemical data, such as: dissolved oxygen (concentration
and supersaturation), pH, and chlorophyll a. If a combination of these indicator data strongly suggests high
productivity/nutrient enrichment the Aquatic Life Use is assessed as impaired.
Lakes: Nutrient enrichment indicators in lake surface waters typically include the occurrence of planktonic blooms
(particularly bluegreens), extensive cover of non-rooted aquatic macrophytes (particularly duckweed or water meal
covering >25% of the surface), decreased Secchi disk transparency (<1.2 m), oxygen supersaturation (>125%),
elevated pH values >8.3 SU, and elevated chlorophyll a concentrations (frequently and substantially >16 µg/L). In
the absence of these indicators the Aquatic Life Use is assessed as support.
Estuaries: DWM analysts currently utilize areal coverage of seagrasses or other submerged aquatic vegetation and,
when available, the MEP habitat health indicator analysis. Assessment decisions are based on whether or not the
eelgrass beds within the waterbody segment area are stable or are being lost. For embayments in Southeastern
Massachusetts the MEP has also generated a significant amount of enrichment indicator data based on a weight-ofevidence approach that includes several response variables (e.g., eelgrass, infauna, macroalgae, chlorophyll a, DO,
Secchi disk, TN concentrations). Since this project is intended to develop site-specific nutrient (nitrogen) thresholds
for these systems, their overall analysis of habitat health are utilized to make Aquatic Life Use attainment decisions.
Rivers
No/ minimimal
amount visible
filamentous
algae, blooms,
mats
Use is Supported
Lakes
Estuaries
No/limited
Eelgrass bed habitat
observable
in segment area is
growths of
increasing or fairly
nuisance
stable (i.e., no or
algae or
minimal loss), MEP
macrophytes analysis indicates
support (excellent to
good/fair health)
Rivers
Combination of
indicators present:
excessive visible
nuisance algae
(filamentous, blooms,
mats), large diel
changes in
oxygen/saturation/pH,
elevated chlorophyll
a, elevated
Phosphorus (Total)
Use is Impaired
Lakes
Combination of
indicators present:
excessive visible
nuisance algae or nonrooted macrophytes,
low Secchi disk
transparency, high
oxygen supersaturation, elevated pH
elevated chlorophyll a,
elevated Phosphorus
(Total)
Massachusetts Consolidated Assessment and Listing Methodology 2012 Guidance Manual
Estuaries
Substantial decline
(> 10% of bed size
or total loss of beds
no matter their size,
MEP analysis
indicates moderately
to severely
degraded health due
to nitrogen
enrichment
Page 21
Toxic and other pollutants (Rivers, Lakes, Estuaries)
The MassDEP SWQS include a narrative statement pertaining to toxic pollutants (see excerpt below) that is
applicable to all surface waters (MassDEP 2006). To evaluate the potential for observing adverse biological effects
the water quality data for toxic and other pollutants (e.g., metals, ammonia, chlorine, polycyclic aromatic
hydrocarbons, chlorinated organics) are compared to their respective Water Quality Criteria (EPA 2009 available at
http://water.epa.gov/scitech/swguidance/standards/current/upload/nrwqc-2009.pdf). In general the EPA
recommends both acute (typically expressed as one-hour averages) and chronic (typically expressed as four-day
averages) to protect against short and long-term effects. For most toxicants the EPA also recommends that the
criteria should not be exceeded more than once every three years. For those analytes measured in the water
column a matrix of analytes and their respective acute and chronic criteria values is developed. When the ratio of the
pollutant to the criterion exceeds a value of 1.0 it is considered a concentration of concern. This ratio (a “Toxic Unit”
calculation) also provides the relative magnitude of the exceedance. Since concentrations above criteria often do not
result in toxicity the weight-of-evidence approach/gradient is followed by DWM analysts. Therefore, when they are
available and of at least equal data quality, the analysts rely more heavily on survival data from ambient toxicity tests
than on chemical concentration data.
“All surface waters shall be free from pollutants in concentrations or combinations that are toxic to humans, aquatic
life or wildlife. For pollutants not otherwise listed in 314 CMR 4.00, the National Recommended Water Quality
Criteria: 2002, EPA 822-R-02-047, November 2002 published by the EPA pursuant to Section 304(a) of the
Federal Water Pollution Control Act, are the allowable receiving water concentrations for the affected waters,
unless the Department either establishes a site specific criterion or determines that naturally occurring background
concentrations are higher. The Department shall use the water quality criteria for the protection of aquatic life
expressed in terms of the dissolved fraction of metals when the EPA’s 304(a) recommended criteria provide for
use of the dissolved fraction (see Mass DEP 2006 for more detail regarding permit limits, conversion factors, site
specific criteria).”
Metals. In-stream metals data were historically collected by the DWM during water quality monitoring surveys and
NPDES facilities still report these data as part of their Whole Effluent Toxicity Testing requirements. Much of these
data were utilized to make Aquatic Life Use assessment decisions. However, none of these historical data were
collected using “clean sampling techniques” and their validity for making use-impairment decisions came into
question in the late 1990s. Since that time DWM analysts have not been utilizing metals data as part of the water
quality assessment reporting. In 2007 an effort was initiated by the DWM to develop clean sampling techniques for
gathering in-stream dissolved metal data. It is expected that data generated using these procedures will be used in
making future Aquatic Life Use assessment decisions when they are validated and become available. In particular
these data will be used to evaluate whether or not historical impairment decisions, based on “non-clean technique”
metals data, were appropriate. When the criteria are hardness dependent the actual in-stream hardness data are
utilized to calculate the criteria.
Ammonia. According to the EPA (1999) the
EPA (1999) “regarding the dependence of the toxicity of
freshwater acute criterion for ammonia is
ammonia to aquatic organisms on various physicochemical
properties of the test water, especially temperature, pH, and
dependent on pH and fish species and the
ionic composition… in aqueous solution, ammonia primarily
chronic criterion is dependent on pH and
exists in two forms, un-ionized ammonia (NH3) and
temperature. At lower temperatures the
ammonium ion (NH4 +)…the individual fractions vary
chronic criterion is also dependent on the
markedly with temperature and pH…ammonia speciation
presence or absence of early life stages
also depends on ionic strength, but in fresh water this effect
(ELS) of fish. The EPA also recommends 30
is much smaller… These speciation relationships are
days as the averaging period for the
important to ammonia toxicity because un-ionized ammonia
ammonia chronic criterion and that within the
is much more toxic than ammonium ion…it was observed
30-day averaging period no 4-day average
that increased pH caused total ammonia to appear to be
concentration should exceed 2.5 times the
much more toxic… because it is a neutral molecule and thus
chronic criterion. Because the ammonia
is able to diffuse across the epithelial membranes of aquatic
criterion is a function of pH and temperature
organisms much more readily than the charged ammonium
the analyst should first screen results by
ion…ammonia is unique among regulated pollutants
using the highest pH and temperature
because it is an endogenously produced toxicant that
measurements taken in the watershed during
organisms have developed various strategies to excrete,
the course of the surveys to determine the
which is in large part by passive diffusion of un-ionized
conservative acute and chronic ammonia
ammonia from the gills…high external un-ionized ammonia
criteria. The concentration data can then be
concentrations reduce or reverse diffusive gradients and
compared to these basin-specific
cause the buildup of ammonia in gill tissue and blood”.
conservative ammonia criteria values. If data
exceed the criteria then the actual pH and temperature of the sample are used to calculate the sample-specific
ammonia criteria to which data are then compared. The analyst should note the number of exceedances as well as
Massachusetts Consolidated Assessment and Listing Methodology 2012 Guidance Manual
Page 22
the magnitude, frequency, and duration of exceedances. Frequent and/or prolonged (more than one acute or more
than 10% of the chronic criteria) or severe excursions from criteria are usually considered an impairment.
Chlorine. Chlorine is primarily used as a biocide to disinfect municipal wastewater effluents, to control fouling
organisms in cooling water systems, as a bleaching agent in textile mills and paper-pulping facilities, and in cyanide
destruction in electroplating and other industrial operations. The freshwater ambient water quality criteria for this
toxicant are expressed as total residual chlorine (TRC) --the sum of the concentrations of free and combined residuals
as measured by amperometric titration or an equivalent method. The EPA recommended acute criterion for TRC is
0.019 mg/L (one-hour average), and the chronic criterion for TRC is 0.011 mg/L (four-day average). Neither is to be
exceeded more than once every three years. The minimum quantification level for reporting TRC concentrations in the
NPDES permit and whole effluent toxicity (WET) test reports historically was 0.05 mg/L. Concentrations reported at or
below this minimum quantification level were considered by the EPA and the MassDEP to be meeting the criteria for
permitting and assessment purposes. However, if in-stream TRC concentrations exceed 0.05 mg/L the analyst should
note the number of times the TRC criteria (acute and chronic) are exceeded as well as the magnitude and frequency
of exceedances. Frequent and/or prolonged (more than one acute or more than 10% of the chronic criteria) or severe
excursions from criteria are usually considered an impairment. [Note: the most recent minimum quantification level for
TRC in NPDES permits and whole effluent toxicity testing guidelines is now 0.02 mg/L, so the assessment methodology
will be changed to this level in the future.]
DWM analysts evaluate whether or not there are exceedances of toxic and other pollutants by comparing the data to
their respective acute and chronic water quality criteria. Infrequent excursions (no more than a single exceedance of an
acute criterion or 10% samples exceeding a chronic criterion) are not considered an impairment. Frequent and/or
prolonged (more than one acute or more than 10% of the chronic criteria) or severe excursions from criteria is
considered an impairment unless a weight-of-evidence based decision suggests otherwise.
Use is Supported
Infrequent excursion from criteria (no
more than a single exceedance of
acute criteria or <10% samples
exceed chronic criteria)
Use is Impaired
Frequent and/or prolonged excursions from
criteria (more than a single exceedance of
acute criteria or >10% samples exceed
chronic criteria).
Massachusetts Consolidated Assessment and Listing Methodology 2012 Guidance Manual
Page 23
Background/context:
Sediment and tissue chemistry
(CCME 1999b)
Highly persistent, bioaccumulative
compounds, such as PCBs,
dichlorodiphenyltrichloroethane (DDT),
toxaphene, dioxin and furans, and
mercury, are not often detectable in
water because they readily partition into
other environmental media, including
sediment and biota (CCME 1999b).
Organochlorine compounds, which
include insecticides and PCBs, had been
in widespread use since World War II
but have since been restricted or banned
because of their toxic effects on wildlife
and human health. According to Coles
(1998) “They are resistant to
biochemical degradation…which
contributes to excessive buildup in
aquatic environments…they are prone to
atmospheric transport…have a high
affinity for sediment organic
matter…tend to partition strongly into the
lipid component of aquatic
organisms…they can be passed up the
food chain to higher trophic feeders
through bioaccumulation…the National
Academy of Science/National Academy
of Engineering’s (NAS/NAE)
recommended guidelines for the
protection of fish-eating wildlife apply to
whole fish tissue. These guidelines
were based on experimental studies
showing induction of eggshell thinning in
birds by DDT and metabolites. More
conservative guidelines for other
organochlorines were set by analogy to
DDT, based on their greater toxicity to
wildlife.”
Sediment quality data (rivers, lakes, estuaries)
The MassDEP SWQS do not currently contain numeric sediment quality
criteria. To evaluate the potential for adverse biological effects, surficial
sediment quality data for heavy metals, polyaromatic hydrocarbons
(PAHs), polychlorinated biphenyls (PCBs),and pesticides are compared to
the Canadian Interim Sediment Quality Guidelines (ISQL), which
represent the concentration below which adverse biological effects are
expected to rarely occur and the probable effect levels (PEL), which
represent the levels for which adverse biological effects are expected to
frequently occur (CCME 2002).
For those analytes measured in surficial sediment samples where ISQL
and PEL guidance are available a matrix of analytes and their respective
guidance values is developed. Ratios of the sediment concentration for
each analyte to its respective ISQL and PEL are then calculated. When
the ratio of the contaminant to the guideline exceeds a value of 1.0 the
concentration is considered to be of concern. To assess the overall
quality of the sediment at a site all of the ratios that exceed a value of 1.0
are added together. This sum is noted as the total factor over the ISQL
and/or PEL.
Sediment quality data alone are not typically used to assess the Aquatic
Life Use as impaired. However, when there are exceedances of sediment
screening values (ISQLs and/or PELs) along with other indicators of
impairment (e.g., fish tissue contamination or impaired biological
community) the analyst will use best professional judgment (BPJ) and
likely add the sediment screening value exceedances as a cause of
impairment for the Aquatic Life Use. It should be noted here that for
areas in Massachusetts where the sediments are known to be severely
contaminated and are undergoing remedial actions (e.g., Housatonic
River or Inner New Bedford Harbor.) sediment contamination is identified
as one source of the impairment.
Use is Supported
No/infrequent excursion of ISQL
guidelines and no other
indicators of impairment.
Use is Impaired
Frequent excursions over PEL
guidelines along with other evidence
of impairment, waterbodies known to
have sediment contamination
undergoing remedial actions.
Massachusetts Consolidated Assessment and Listing Methodology 2012 Guidance Manual
Page 24
Tissue residue data (rivers, lakes, estuaries)
Body burdens of chemicals in aquatic organisms (i.e., fish, shellfish,
invertebrates, and plants) also provide a mechanism to evaluate risk to
wildlife consumers of aquatic biota. According to Coles (1998) the
National Academy of Science/National Academy of Engineering
(NAS/NAE) guidelines based on whole fish for the protection of fisheating wildlife are as follows:
Total PCBs: < 500 g/kg (ppb) wet weight
Total DDT, DDE, DDD: < 1,000 g/kg (ppb) wet weight
Chlordane and Heptachlor epoxide: < 200 g/kg (ppb) wet weight
(also applies to total residues of aldrin, BHC, chlordane, dieldrin,
endosulfan, endrin, heptachlor, heptachlor epoxide, lindane, and
toxaphene either singly or in combination).
Rivers, Lakes: Residues of contaminants in whole body samples of
fish are compared to the NAS/NAE recommended guidelines based on
whole fish for the protection of fish-eating wildlife. If the concentration
of contaminants is below the guideline(s) (e.g., [total PCB] < 500 g/kg
(ppb) wet weight) then no impairment decision for the Aquatic Life Use
is made. However, if whole body burden residue(s) exceed the
recommended guideline(s), best professional judgment is used by the
analyst to evaluate whether or not an impairment decision is warranted.
While an impairment decision will not be made on one or a few samples,
an impairment decision will be made based on several samples
exceeding NAS/NAE guidelines combined with any other data types that
corroborate an impairment decision (see DELTS/abnormal fish histology
in Fish Population Section).
Use is Supported
Use is Impaired
Residue of contaminants in whole body Residue of contaminants in whole
samples do not exceed NAS/NAE
body samples frequently exceed
guidelines
NAS/NAE guidelines, DELTS with
abnormal fish histology.
Background/context:
Body Burdens
(CCME 1999c, 1999d, 2001c and 2000)
DDT, a chlorinated hydrocarbon insecticide,
was used world-wide since the 1940s to
control insects (CCME1999c). “DDT, as well
as its breakdown products, is highly lipophilic
and presents serious problems for wildlife
that feed at high trophic levels in the food
chain…for aquatic-based wildlife species,
food resources provide the main route of
exposure…exposure to DDT and its
metabolites [DDD and DDE] is known to
reduce longevity and alter cellular
metabolism, neural activity and liver
function…mutagenic and carcinogenic
effects, as well as adverse effects on
reproduction, growth, and
immunocompetence.”
Toxaphene “(chlorinated camphenes known as
campheclor, chlorocamphene, or
polychlorocamphene (PCC)) was developed in
1946 and used as a contact insecticide for
crops, as an herbicide and to control
ectoparasites on livestock… also applied to
lakes and streams in Canada and the northern
US to eliminate undesirable fish, lamprey, and
invertebrate communities…exposure to
toxaphene is known to induce adverse effects
on cardiovascular, hepatic, renal, endocrine,
immunological, and neurological systems, and
to decrease longevity in birds and
mammals…while contamination of surface
waters may continue to occur as a result of
erosion of toxaphene-contaminated soils,
atmospheric deposition is a main source”
(CCME 1999d).
Dioxin and Furans “(polychlorinated
dibenzo-p-dioxins (PCDDs) and
polychlorinated dibenzofurnas (PCDFs) are
planar tricyclic aromatic compounds…while
they have never been intentionally produced
they are byproducts formed as a result of
anthropogenic activities including waste
incineration, chemical manufacturing,
petroleum refining, wood burning,
metallurgical processes, fuel combustion
(autos), residential oil combustion, and
electric power generation…natural sources
include forest fires and volcanic activity…the
2,3,7,8-substituted PCDD/Fs are thought to
elicit most of their toxicity via the aryl
hydrocarbon (Ah) receptor, a protein present
in mammals, birds, and fish…by binding
however linkages between enzyme induction
and specific organ toxicity are unclear” (CCME
2001). Mortality and a multitude of sublethal
effects on organisms were described.
Methyl mercury, “the most toxicologically
relevant form, is a potent neurotoxicant for
animals and humans…It is produced through
the biological and chemical methylation of
inorganic mercury…Methyl mercury is not very
lipid soluble but it binds strongly with sulfhydryl
groups in proteins and is therefore readily
accumulated and retained in biological
tissues”.(CCME 2000).
Massachusetts Consolidated Assessment and Listing Methodology 2012 Guidance Manual
Page 25
Aquatic Life Use Assessment
Table 2. Aquatic Life Use assessment decision indicator summary by weight-of-evidence gradient.
Indicator for
Use is Supported
Use is Impaired
Aquatic Life Use Assessment
Benthic macroinvertebrate data
(rivers)
Benthic macroinvertebrate data
(estuaries)
Fish population data (rivers)
Fish population data
(lakes, estuaries)
Habitat and flow data
(rivers, lakes, estuaries)
Eelgrass bed mapping data
(estuaries)
Non-native aquatic species data
(rivers, lakes)
BIOLOGICAL MONITORING INFORMATION
Moderately impaired/severely impaired RBP
Non-impaired/most slightly impaired RBP III analysis, slightly impaired with special
III analysis, reference sites
condition (e.g., hyperdominance by pollution
tolerant sp.) as noted by DWM biologists
High # species, high # individuals, good
Low # species, low # individuals, poor
diversity and evenness, moderate to
diversity and evenness, shallow dwelling
deep burrowing, tube dwelling organisms opportunistic species or near absence of
present, as reported from external data
benthos, thin feeding zone, as reported from
sources
external data sources
Cold Water Fishery
Cold Water Fishery
Multiple age classes (or reproducing
No fish found or cold water species absent,
populations) of any cold water fish
DELTS with abnormal fish histology
Warm Water Fishery
Warm Water Fishery
In lotic environments the fish population No fish found or fluvial fish were absent or
should be well represented by fluvial
relatively scarce (few numbers), DELTS
specialist/dependents species
with abnormal fish histology
> 5% population losses estimated , DELTS
None made
with abnormal fish histology
Physical habitat structure impacted by
No direct evidence of severe physical
anthropogenic stressors (e.g., lack of flow,
habitat or stream flow regime alterations, lack of natural habitat structure such as
functioning anadromous fishways
concrete channel, underground conduit),
present
non-functioning anadromous fishway
present
Eelgrass bed habitat in segment area is
Substantial decline (more than 10% of the
increasing or fairly stable (i.e., no or
in bed size or total loss of beds no matter
minimal loss)
their size)
Non-native aquatic species absent
Non-native aquatic species present
Frequent and/or prolonged algal blooms or
growths of periphyton, cyanobacteria
Periphyton/algal bloom
blooms result in advisories (recurring
(rivers, lakes, estuaries)
and/or prolonged), >25% cover noxious
aquatic plants (e.g. Lemna), periphyton
cover within riffle/reach >40%
TOXICOLOGICAL MONITORING INFORMATION
>75% survival of test organisms to water <75% survival of test organisms to water
Toxicity testing data
column or sediment samples in either 48 column or sediment samples in either 48 hr
(rivers, lakes, estuaries)
hr (acute) or 7-day exposure (chronic)
(acute) or 7-day exposure (chronic) tests
tests.
occurs in >10% of test events.
PHYSICO-CHEMICAL WATER QUALITY INFORMATION
No excursions, a single excursion from
Frequent (>10%) and/or prolonged or severe
Water quality data - DO
criteria (minimum three preferably five
excursions (>1.0 mg/L below standards)
(rivers)
measurements representing critical --i.e.,
from criteria
pre-dawn conditions)
In deep lakes (with a hypolimnion) the
No/little depletion (the criterion is not
criterion is not met in a hypolimnetic area
Water quality data - DO
met in hypolimnetic area <10% of the
>10% of the lake surface area during
(lakes)
lake surface area during summer
maximum oxygen depletion (summer
season)
growing season)
No/infrequent prolonged or severe
Frequent (>10%) and/or prolonged or severe
Water quality data - DO
(<10%) excursions from criteria in
excursions (>1.0 mg/L below standards)
(estuaries)
surface or bottom waters
from criteria
Water quality data - pH
No or slight excursions (<0.5 SU) from
Frequent (>10%) and/or prolonged or severe
(rivers)
criteria (minimum five measurements)
excursions (>0.5 SU) from criteria
No or slight excursions (<0.5 SU) from
Water quality data - pH
Excursion from criteria (>0.5 SU) summer
criteria (minimum one deep-hole profile
(lakes)
growing season
during summer growing season)
Water quality data - pH
No or slight excursions (<0.5 SU) from
Frequent (>10%) and/or prolonged or severe
(estuaries)
criteria (minimum five measurements)
excursions (>0.5 SU) from criteria
Water quality data - temperature
Cold Water Fishery
Cold Water Fishery
(rivers and lakes)
no/infrequent/small excursions (1 to
criterion frequently exceeded (10%) or by
No/infrequent algal blooms or growths of
periphyton, <25% cover noxious aquatic
plants (e.g. Lemna), periphyton cover
within riffle/reach <40%,
Massachusetts Consolidated Assessment and Listing Methodology 2012 Guidance Manual
Page 26
Indicator for
Aquatic Life Use Assessment
Water quality data - temperature
(estuaries)
Water quality data
nutrient indicators
(rivers)
Water quality data
nutrient indicators
(lakes)
Water quality data
nutrient indicators (estuaries)
Water quality data
Toxic and other pollutants
(rivers, lakes, estuaries)
Sediment quality data
(rivers, lakes, estuaries)
Tissue residue data
(rivers, lakes, estuaries)
Use is Supported
2°C) above 20°C
Warm Water Fishery
no/infrequent excursions above criteria
(28.3°C)
No/infrequent/small excursions
(<29.4°C and maximum daily mean of
26.7°C)
No/ minimimal amount visible
filamentous algae, blooms, mats
Use is Impaired
>2°C
Warm Water Fishery
criterion frequently exceeded (10%
measurements) or by >2°C.
Criterion frequently exceeded, rise due to
discharge exceeds ΔT standards
Combination of indicators present:
excessive visible nuisance algae
(filamentous, blooms, mats), large diel
changes in oxygen/saturation/pH, elevated
chlorophyll a, elevated total phosphorus
(>0.05 to 0.1 mg/L “Gold Book”)
Combination of indicators present:
excessive visible nuisance algae or
macrophytes, low Secchi disk
No/limited observable growths of
transparency, high oxygen supernuisance algae or macrophytes
saturation, elevated pH elevated
chlorophyll a, elevated total phosphorus
(>0.025 mg/L “Gold Book”)
Eelgrass bed habitat in segment area is
Substantial decline (> 10% of bed size or
increasing or fairly stable (i.e., no or
total loss of beds no matter their size, MEP
minimal loss), MEP analysis indicates
analysis indicates moderately to severely
support (excellent to good/fair health)
degraded health due to nitrogen enrichment
Infrequent excursion from criteria (no
Frequent and/or prolonged excursions from
more than a single exceedance of acute
criteria (more than a single exceedance of
criteria or <10% samples exceed chronic acute criteria or >10% samples exceed
criteria)
chronic criteria).
SEDIMENT AND TISSUE RESIDUE INFORMATION
Frequent excursions over PEL guidelines
No/infrequent excursion of ISQL
along with other evidence of impairment,
guidelines and no other indicators of
waterbodies known to have sediment
impairment.
contamination undergoing remedial actions.
Residue of contaminants in whole body
Residue of contaminants in whole body
samples frequently exceed NAS/NAE
samples do not exceed NAS/NAE
guidelines, DELTS with abnormal fish
guidelines
histology.
Massachusetts Consolidated Assessment and Listing Methodology 2012 Guidance Manual
Page 27
Fish Consumption Use
The definition of “Secondary Contact Recreation” in the Massachusetts Surface Water Quality Standards (SWQS)
includes the statement that waters supporting the Secondary Contact Recreational Use are suitable for
“…Any recreation or other water use in which contact with the water is either incidental or accidental.
These include but are not limited to fishing, including human consumption of fish, boating and limited
contact incident to shoreline activities.” (MassDEP 2006). For the purpose of assessment and
305(b)/303(d) Integrated List reporting, however, the status of the Fish Consumption Use (human consumption of fish)
is reported as its own use rather than part of the Secondary Contact Recreational Use. Another part of the SWQS
states that “pollutants shall not result in unacceptable concentrations in edible portions of marketable fish or for the
recreational use of fish, shellfish, other aquatic life or wildlife for human consumption” (see 314 CMR4.05(5)(e)3b in
MassDEP 2006).
Use Assessment Decision-Making Process:
MassDEP DWM biologists have been conducting fish toxics monitoring since 1983. As the years passed it became
increasingly clear that the major problems in Massachusetts (as in the other New England States) were related to
either the widespread atmospheric deposition of mercury or to the historic use and disposal of PCBs (MassDEP
2010c). Currently, freshwater fish tissue contaminant testing in Massachusetts is conducted by the MassDEP in
cooperation with the MA Department of Public Health (MA DPH) and the Department of Fish and Game (MA DFG).
The three agencies work together as the Interagency Committee on Freshwater Fish Toxics Monitoring and
Assessment, through a Memorandum of Understanding (MOU) established in 1994, to facilitate the communication,
coordination, and dissemination of information pertaining to contaminants in freshwater fish (MassDEP 2010c). The
collaborative efforts of the MassDEP, the MA DPH, and the MA DFG ensure the state’s ability to conduct limited testing
and evaluation of contaminants in fish tissue for purposes of protecting public health and the environment. Each of the
three agencies named in this MOU has responsibilities unique to their mission. While the MassDEP provides much of
the field and analytical support (refer to background/context inset on next page for the MassDEP DWM Fish Toxics
Monitoring Program), all data are sent to the MA DPH and the MassDEP Office of Research and Standards (ORS) for
risk assessment and issuance of advisories, if appropriate. Ultimately, the MA DPH is responsible for decisions
regarding the need for and/or implementation of public health advisories.
In a June 03, 2009 press release MA DPH reminded consumers of statewide fish advisories in place:
Fish Consumption Advisory for Marine and Fresh Water Bodies (MA DPH 2009b)
Fish is good for you and your family. It may also protect you against heart disease. It is a good source of protein and it is
low in fat. A varied diet, including safe fish, will lead to good nutrition and better health. If you may become pregnant or
are pregnant or nursing, you and your children under 12 years old may safely eat 12 ounces (about 2 meals) per week of
fish or shellfish not covered in this advisory. This recommendation includes canned tuna, the consumption of which
should be limited to 2 cans per week. Very small children, including toddlers, should eat less. Consumers may wish to
choose to eat light tuna rather than white or chunk white tuna, the latter of which may have higher levels of mercury.
Otherwise, it is important to follow the Safe Eating Guidelines included in this advisory.’
Safe eating guidelines for pregnant women, women who may become pregnant, nursing mothers and children
under 12 years old: (contaminants of concern in parenthetical as noted by MA DPH and MassDEP analysts)
Do Not Eat: Freshwater fish caught in streams, rivers, lakes, and ponds in Massachusetts* (Hg)
Safe To Eat: Fish that are stocked in streams, rivers, lakes, and ponds in Massachusetts
Safe To Eat: Cod, haddock, flounder and pollock in larger amounts
Do Not Eat: Lobster from New Bedford Harbor (PCB)
Do Not Eat: Swordfish, shark, king mackerel, tilefish, and tuna steak (Hg)
Do Not Eat: Bluefish caught off the Massachusetts coast (PCB)
Do Not Eat: Lobsters, flounder, soft-shell clams and bivalves from Boston Harbor (PCB and other contaminants). This
Boston Harbor advisory is also recommended for people with weakened immune systems. NOTE: For
assessment purposes Boston Harbor is broadly defined to include all coastal waters that drain into it.
Safe eating guidelines for everyone
Do Not Eat: Fish and shellfish from the closed areas of New Bedford Harbor (PCB)
Do Not Eat: Lobster tomalley (PCB)
*More specific consumption advice is available for certain freshwater bodies that have been tested at: http://www.mass.gov/dph/fishadvisories
or by calling the Massachusetts Department of Public Health, Bureau of Environmental Health at 617-624-5757.
In addition to these statewide fish advisories, the MA DPH periodically (every one to three years) updates their
Freshwater Fish Consumption Advisory List. The most recent list was made available in October 2011 (MA DPH
2011). This list provides specific consumption advice for individual water bodies that is to be considered in addition to
the statewide advisories (MA DPH 2009b). This list identifies the waterbody, the town(s), the fish consumption advisory
language, and the hazard (see http://www.mass.gov/dph/fishadvisories). MassDEP analysts assess waterbodies that
have site-specific fish consumption advisories as impaired due to the hazard identified on the MA DPH list.
Massachusetts Consolidated Assessment and Listing Methodology 2012 Guidance Manual
Page 28
Background/context
MassDEP DWM Fish Toxics Monitoring
Program (MassDEP 2010c)
“Originally, monitoring was conducted either in
the vicinity of known or suspected waste sites
or in conjunction with much larger watershed
surveys to attempt to assess the potential for
bioaccumulative effects of past or present
wastewater treatment plant or other
discharges…the objective of DWM’s sampling
is primarily to screen edible fillets of fishes for
a variety of contaminants (i.e. mercury,
polychlorinated biphenyls (Aroclors), and
organochlorine pesticides). Due to the highly
variable concentrations of bioaccumulative
contaminants in fish tissue and the wide range
of environmental conditions which affect
bioaccumulation (bioconcentration,
bioaccumulation, and biomagnification),
screening is conducted in an effort to sample
as many of the Commonwealth’s waters as
possible during a given sampling season.
Although screening may not accurately predict
bioaccumulation patterns among a full range
of year classes of any given fish species,
sampling a three fish composite of average
sized individuals answers the questions with
regard to the presence/absence of any given
analyte and its relative concentration. All
screening analyses are performed at the
Senator William X. Wall Experiment Station
(WES). All data are sent to the MDPH and the
MassDEP Office of Research and Standards
(ORS) for assessment and advisory issuance
if appropriate…”
“In order to assess the level of contamination
present in fish of different trophic guilds and
habitat types, screening involves the collection
of three to five fish composites representing
fishes of three trophic groups (i.e. predators,
water column feeders, bottom feeders). Fish
species targeted include at a minimum;
largemouth bass, Micropterus salmoides,
and/or chain pickerel, Esox niger, (predators);
yellow perch, Perca flavescens, and/or white
perch, Morone americana, (water column
invertivores/omnivores); and bullhead,
Ameiurus sp. and/or common carp, Cyprinus
carpio, (bottom feeding omnivores). Averagesized fish (above legal length limit when
applicable) are analyzed as composite
samples. Additional species or substitute
species are chosen on a site-by-site basis.”
According to Grubbs and Wayland (2000) “For purposes of
determining whether a waterbody is impaired and should be
included on a section 303(d) list, EPA considers a fish or
shellfish consumption advisory…to be existing and readily
available data and information that demonstrates nonattainment of a section 101(a) “fishable” use when: 1. the
advisory is based on fish and shellfish tissue data.”
The assessment of the Fish Consumption Use is made using
the most recent fish consumption advisory lists issued by the
MA DPH Bureau of Environmental Health Assessment (MA
DPH 2009a, MA DPH 2009b, MA DPH 2011). Because of the
statewide advisories that affect both fresh and estuarine waters
in Massachusetts no surface waters can be assessed as
support for the Fish Consumption Use. Where a site-specific
advisory is in place (i.e., the waterbody is on the MA DPH
Freshwater Fish Consumption Advisory List) the Fish
Consumption Use is assessed as impaired. If no site-specific
advisory is in place the Fish Consumption Use is not
assessed. The guidance used to assess the Fish Consumption
Use is summarized below.
Fish Consumption Use Assessment
Use is Supported
Not applicable in
Massachusetts, precluded by
statewide advisories (Hg
and/or PCBs)
Use is Impaired
Waterbody has site specific MA
DPH Fish Consumption Advisory
with hazard (e.g., mercury, PCBs,
pesticides, DDT, etc.)
When waters are assessed as impaired for the Fish
Consumption Use due to elevated mercury and no source of
mercury other than atmospheric deposition is identified,
atmospheric deposition is listed as the source since it is
anticipated that the waterbody will be restored in accordance
with the Northeast Regional Mercury Total Maximum Daily
Load (TMDL) (Northeast States 2007). This TMDL is a
Federal Clean Water Act mandated document that identifies
pollutant load reductions necessary for regional waterbodies to
meet and maintain compliance with state and federal water
quality standards. It was prepared by the New England
Interstate Water Pollution Control Commission (NEIWPCC) for
the six New England States and New York and was approved
by the EPA in December 2007. The TMDL target for
Massachusetts is 0.3 ppm or less of methyl mercury in fish
tissue. The TMDL also called for a 75% reduction of in-region
and out of region atmospheric sources by 2010 and a 90% or
greater reduction in the future (NEIWPCC 2007). The TMDL
will be reassessed in the future based on an evaluation of new,
on-going monitoring and air deposition data. Final targets will
be determined at a later time. Waters for which MA DPH
mercury advisories have been issued since the approval date
of the TMDL are considered on a case-by-case basis for
coverage under that document.
Massachusetts Consolidated Assessment and Listing Methodology 2012 Guidance Manual
Page 29
Shellfish Harvesting Use
The definition of “Secondary Contact Recreation” in the Massachusetts Surface Water Quality Standards
includes the statement that “Waters supporting the Secondary Contact Recreational Use are suitable for
any recreation or other water use in which contact with the water is either incidental or
accidental….Where designated, secondary contact recreation also includes shellfishing, including
human consumption of shellfish” (MassDEP 2006). For the purpose of assessment and 305(b)/303(d)
Integrated List reporting, however, the status of the Shellfish Harvesting Use (human consumption of shellfish) is
reported as its own use rather than part of the Secondary Contact Recreational Use. In 314 CMR 4.05(5)(e)3b the
SWQS state that “pollutants shall not result in unacceptable concentrations in edible portions of marketable fish or for
the recreational use of fish, shellfish, other aquatic life or wildlife for human consumption” (MassDEP 2006).
Use Assessment Decision-Making Process:
Grubbs and Wayland (2000) provided states the
following guidance for 305(b)/303(d) reporting: “For
purposes of determining whether a waterbody is
impaired and should be included on a section 303(d) list,
EPA considers a shellfish consumption advisory, a
NSSP classification, and the supporting data, to be
existing and readily available data and information that
demonstrates non-attainment of a section 101(a)
“fishable” use when: 1. the advisory is based on fish and
shellfish tissue data. 2. a lower than “Approved” NSSP
classification is based on water column and shellfish
tissue data (and this is not a precautionary “Prohibited”
classification or the state water quality standard does not
identify lower than “Approved” as attainment of the
standard) 3. the data are collected from the specific
waterbody in question”.
The Massachusetts Department of Fish and Game
(DFG), Division of Marine Fisheries (MarineFisheries),
is responsible for implementing the Shellfish Sanitation
and Management Program (see inset). Based on the
results of their sanitary surveys, triennial evaluations
and annual reviews the MarineFisheries biologists
assign a sanitary classification to each shellfish
growing area. DFG’s designated shellfish growing area
is an area of potential shellfish habitat. Growing areas
are managed with respect to shellfish harvest for direct
human consumption, including commercial shellfishing.
The DFG classifications range from Approved
(shellfishing taking permitted) to Prohibited (no
shellfishing taking permitted) (see descriptions in inset
on next page). Administrative or Management
Closure’s may be assigned by DFG if sufficient work
has not been done to properly classify a growing area
or if the associated risks to the fishery cannot be
managed in a manner that ensures public health.
According to the SWQS (MassDEP 2006), the shellfish
harvesting goals for SA and SB waters are as follows:
Class SA waters, where designated, shall be
suitable for shellfish harvesting without depuration
(Approved and Conditionally Approved Shellfish
Areas);
Class SB waters, where designated, shall be
suitable for shellfish harvesting with depuration
(Restricted and Conditionally Restricted Shellfish
Areas).
MarineFisheries Shellfish Sanitation and
Management Overview (MA DFG undated)
The Shellfish Program has two primary missions,
public health protection and both direct and indirect
management of the Commonwealth's molluscan
shellfish resources. Public health protection is afforded
through the sanitary classification of all 1,745,723
acres of overlying waters within the states territorial
sea in accordance with the provisions of the National
Shellfish Sanitation Program (NSSP). The NSSP is the
federal/state cooperative program recognized by the
U.S. Food and Drug Administration (FDA) and the
Interstate Shellfish Sanitation Conference (ISSC) for
the sanitary control of shellfish produced and sold for
human consumption.
Public health protection is achieved as a result of
sanitary surveys of shellfish growing areas to
determine their suitability as shellfish sources for
human consumption. The principal components of a
sanitary survey include: 1) an evaluation of pollution
sources that may affect an area, 2) evaluation of
hydrographic and meteorological characteristics that
may affect distribution of pollutants, and 3) an
assessment of water quality.
Each growing area must have a complete sanitary
survey every twelve years, a triennial evaluation every
three years and an annual review in order to maintain
a classification, which allows shellfish harvesting.
Minimum requirements for sanitary surveys, triennial
evaluations, annual reviews and annual water quality
monitoring are established by the ISSC and set forth in
the NSSP. Each year water samples are collected at
2,320 stations in 294 growing areas in
Massachusetts's coastal waters at a minimum
frequency of five times while open to harvesting.
Water and shellfish samples are tested for fecal
coliform bacteria at two MarineFisheries laboratories
located in Gloucester and New Bedford using a Most
Probable Number (MPN) method (American Public
Health Association) for classification purposes and a
membrane filtration technique (usually M-tec) for
pollution source identification.
Massachusetts Consolidated Assessment and Listing Methodology 2012 Guidance Manual
Page 30
MarineFisheries Shellfish
Growing Area Classifications
(USFDA)
Approved - "...open for harvest of
shellfish for direct human
consumption subject to local rules
and regulations..." An approved
area is open all the time and closes
only due to hurricanes or other
major coastwide events.”
Conditionally Approved "...subject to intermittent
microbiological pollution..." During
the time the area is open, it is "...for
harvest of shellfish for direct human
consumption subject to local rules
and regulations…" A conditionally
approved area is closed some of
the time due to runoff from rainfall
or seasonally poor water quality.
When open, shellfish harvested are
treated as from an approved area.”
Restricted – “…area contains a
"limited degree of pollution." It is
open for "harvest of shellfish with
depuration subject to local rules
and state regulations" or for the
relay of shellfish. A restricted area
is used by DMF for the relay of
shellfish to a less contaminated
area.”
DWM analysts assess the Shellfish Harvesting Use with the most recent
and available MarineFisheries classification of the Shellfish Growing
Areas. The most recent GIS datalayer, available online at
http://www.mass.gov/mgis/dsga.htm, is dated September 30, 2009.
Shellfish Growing Areas that are under administrative or management
closures are not assessed. The guidance used by DWM analysts to
assess the Shellfish Harvesting Use is summarized below.
Shellfish Harvesting Use Assessment
Use is Supported
SA Waters: Approved
,
SB Waters: Approved,
Conditionally Approved, or
Restricted
Use is Impaired
SA Waters: Conditionally
Approved, Restricted, Conditionally
Restricted, or Prohibited
SB Waters: Conditionally Restricted
or Prohibited
An impairment decision for this use presumes that the cause is the
result of elevated fecal coliform bacteria in the water column and,
therefore, in shellfish. The source(s) of impairment may be identified
based on MarineFisheries reports and information, TMDL reports,
and/or BPJ of DWM analysts using orthophotos, land-use, and
urbanized area MassGIS datalayers.
It should be noted that whether or not a shellfish growing area was
classified as prohibited based on a precautionary measure (e.g.,
proximity of wastewater treatment discharge, marina) is not readily
available to the DWM analysts. To date impairment decisions have
been made based on the prohibited classification alone when, in fact,
no impairment decision should have been made for precautionary
prohibitions.
Conditionally Restricted "...subject to intermittent
microbiological pollution..." During
the time area is restricted, it is only
open for "the harvest of shellfish
with depuration subject to local
rules and state regulations." A
conditionally restricted area is
closed some of the time due to
runoff from rainfall or seasonally
poor water quality. When open,
only soft-shell clams may be
harvested by specially licensed
diggers (Master/Subordinate
Diggers) and transported to the
DMF Shellfish Purification Plant for
depuration (purification).”
Prohibited – “Closed for harvest of
shellfish.”
Massachusetts Consolidated Assessment and Listing Methodology 2012 Guidance Manual
Page 31
Primary Contact Recreational Use
Waters supporting the Primary Contact Recreational Use are suitable for any recreation or other water use
in which there is prolonged and intimate contact with the water with a significant risk of ingestion of water
during the primary contact recreation season. These include, but are not limited to: wading, swimming,
diving, surfing and water skiing (MassDEP 2006). For purposes of 305(b) reporting the “bathing season”
each year is defined as 1 April to 15 October.
Use Assessment Decision Making Process:
The assessment of the Primary Contact Recreational Use is based on sanitary (i.e., bacteria), safety (e.g., Secchi
depth) considerations, and/or aesthetics of the waters. DWM analysts assess this use as support when sanitary,
safety, and aesthetic (i.e., desirability) conditions are suitable (e.g., low bacteria densities, low turbidity, infrequent
beach closures/postings) and when aesthetics are good (e.g., narrative aesthetics criteria are met – see Aesthetics
Use assessment guidance for details). While the current bacteria criteria for Massachusetts surface waters include
both a geometric mean and a single sample maximum, the assessment decisions are based on whether or not the
geometric mean of bacteria samples collected within the “bathing season” meet the criterion for Primary Contact
Recreation (i.e., E. coli and/or Enterococci bacterial indicators for Class A, B, SA, SB waters) (MassDEP 2006).
Bacteria Standards
for Recreation
(EPA 2003)
“Fecal bacteria have been used as
an indicator of the possible
presence of pathogens in surface
waters and the risk of disease,
based on epidemiological evidence
of gastrointestinal disorders from
ingestion of contaminated surface
water or raw shellfish. Contact with
contaminated water can lead to ear
or skin infections, and inhalation of
contaminated water can cause
respiratory diseases. The
pathogens responsible for these
diseases can be bacteria, viruses,
protozoans, fungi, or parasites that
live in the gastrointestinal tract and
are shed in the feces of warmblooded animals… concentrations
of fecal bacteria, including fecal
coliforms enterococci, and
Escherichia coli, are used as the
primary indicators of fecal
contamination. The latter two
indicators are considered to have a
higher degree of association with
outbreaks of certain diseases than
fecal coliforms and were
recommended as the basis for
bacterial water quality standards in
the 1986 Ambient Water Quality
Criteria for Bacteria document (both
for fresh waters, enterococci for
marine waters). The standards are
defined as a concentration of the
indicator above which the health
risk from waterborne disease is
unacceptably high”.
E. coli bacteria
Enterococci bacteria
Geo mean <126 colonies/100 ml
Geo mean <33 colonies/100 ml Class A, B
Geo mean <35 colonies/100 ml Class SA, SB
[Note: Single sample maximum bacteria criteria are also in the SWQS however, the
geometric mean criterion is considered by DWM analysts to be a more robust and
appropriate measure for making the Primary Contact Recreational Use assessment
decision while the single sample is more appropriate for determining the need to close
beaches because of an immediate risk.]
An overview of the data types and the decision process used by DWM analysts
to make assessment decisions for the Primary Contact Recreational Use is as
follows.
Bacteria data (Rivers, Lakes, Estuaries)
For freshwater segments (rivers and lakes) the primary source of bacteria data is
the results of the DWM’s water quality surveys. The validated (quality-assured)
bacteria data from these surveys are usually published by the MassDEP DWM in
technical memoranda/reports. There are also many other external sources of
bacterial quality monitoring data (e.g., environmental consultants, watershed and
lake associations, and citizen monitoring programs, etc.). All external data from
these and other sources are reviewed for quality/reliability according to the
DWM’s external data validation procedures and, when approved, they can also
be utilized for assessment decisions. The MA DPH’s uncertainty associated with
accurate reporting of freshwater beach closure information (Beaches Bill
reporting) has precluded its use for making assessment decisions up to this
time.
The geometric mean of either E. coli and/or Enterococci data (minimum of five
sampling events) during each “bathing season” (1 April through 15 October) is
calculated for each sampling station by year. It is then compared directly to
standards (provided above). [Note: Geometric mean calculation used the
Method Detection Limit (MDL) when necessary.]
Aesthetics (Rivers, Lakes, Estuaries)
It should be emphasized here that because of the narrative aesthetics criteria,
which are applicable to all surface waters (see Aesthetics Use assessment
guidance for details) DWM analysts assess the Primary Contact Recreational
Use as impaired when the Aesthetics Use of a waterbody is assessed as
impaired.
Risk Assessment (Rivers, Lakes, Estuaries)
Occasionally site-specific health risk assessments performed by consultants, the
MA DPH, and/or MassDEP, Office of Research and Standards staff are utilized
to evaluate dangers posed to organisms and humans by contaminants in the
aquatic environment. Routes of exposure can include ingestions, dermal
Massachusetts Consolidated Assessment and Listing Methodology 2012 Guidance Manual
Page 32
contact, or respiration. When risk is calculated to be greater than acceptable (e.g., total hazard index value exceeds
a threshold of 1) some or all of the designated use(s) may be assessed as impaired for the contaminant of concern.
Beach Closures (Estuaries): The Beaches Bill monitoring program is a major data source of bacteria and beach
posting/closing information. Administered by the MA
DPH, communities are required to report their beaches
Beaches Bill (MA DPH 2010): “There are over 1,100
monitoring data (most beaches sampled weekly) and
public and semi-public bathing beaches in
decisions to post/close their beaches over the course of
Massachusetts, both freshwater and marine…bathing
each year’s beach season (see inset for details). MA
beach water quality is regulated by the Massachusetts
DPH publishes annual reports of these data and
Department of Public Health (MDPH) under
periodically (~ every two years) provides DWM analysts
Massachusetts General Law and the Code of
with a copy of their database (MA DPH 2011b). To
Massachusetts Regulations. These require that all
date the beach closing/posting information has been
public and semi-public bathing beaches (e.g., beaches
used by DWM analysts as a surrogate indicator of
at camps, campgrounds, hotels, condominiums,
water quality conditions rather than using the actual
country clubs) in the state be monitored for bacterial,
bacteria data for assessments. This surrogate was
and on occasion other environmental contamination
chosen by DWM analysts until such a time as all data
during the bathing beach season. The exact dates of a
quality assurance considerations (e.g., QAPP, QAQC,
given bathing season vary from beach to beach, and
sample collection, analysis, data quality and validation
are determined by the operators of each individual
procedures) for the bacteria data are in place. The
beach. Some beaches open as early as Memorial Day,
current assessment decision guidance for using these
but the majority begin operation when the school year
data is that at “public bathing beach” areas
ends in mid-June, and most close for the season during
postings/advisories should be neither frequent nor
the week of Labor Day. Most freshwater samples are
prolonged during the swimming season (the number of
analyzed at private laboratories hired by beach
days posted or closed should not exceed 10% during
operators or boards of health, while a small number are
the locally operated swimming season). DWM analysts
analyzed at municipal laboratories. The vast majority
calculate the number of days and the percentage of
of beach water sampling in Massachusetts is
time during each beach season (typically over a five
conducted by local boards of health, the Barnstable
year window or as an update to the last reporting cycle)
County Department of Health and the Environment,
that each marine beach was posted/closed. The
and the Massachusetts Department of Conservation
Primary Contact Recreational Use is assessed as
and Recreation (MDCR). Most marine beach samples
support if the marine beach(es) along the shoreline of
are analyzed at laboratories under contract with
an estuarine segment are posted for <10% of the
MDPH’s Bureau of Environmental Health (BEH). BEH
swimming season. If postings exceed 10% of the
utilizes federal Environmental Protection Agency
swimming season(s) the Primary Contact Recreational
(USEPA) funds to support these costs. Bathing water
Use will be assessed as impaired. Data for multiple
samples that are found to contain levels of bacterial
beaches located along the shoreline of a segment that
contamination in excess of regulatory standards are
may lead to conflicting assessment decisions are
termed exceedances. If water samples from a beach
handled on a case-by-case basis by the DWM analysts.
are found to be in exceedance of regulatory standards,
the beach waters must be closed. When this happens
Approved Shellfish Growing Area Classification
signs must be posted at access points to the beach
(Estuaries) Although the bacteria indicator species are
notifying the public that swimming is unsafe due to
different (i.e., fecal coliform bacteria for shellfish and
bacterial contamination. For marine beaches, the
Enteroccoci for bathing beach areas) an “approved”
public is also notified via the Beach Water Quality
shellfish growing area classification is indicative of
Locator, on the MDPH/BEH website, which is operated
excellent water quality (“Approved” areas are “open for
in collaboration with local health officials and MDPH
harvest of shellfish for direct human consumption
contract laboratories.4 Local health officials and
subject to local rules and regulations. An approved
MDPH/BEH contract laboratories collect and analyze
area is open all the time and closes only due to
the samples and perform a majority of the data entry
hurricanes or other major coastwide events” (see
onto the website. MDPH/BEH is notified of
additional detail in Shellfish Harvesting Use). DWM
exceedances within 24 hours (105 CMR 445.040).
analysts consider water quality to be excellent in terms
Beaches are to remain closed until their bacteria counts
of bacterial quality and, therefore, supportive of the
decrease to levels below the applicable standard, at
Primary Contact Recreational Use when the
which point the postings can be removed and
Massachusetts Department of Fish and Game's Division
MDPH/BEH is notified of the beach reopening.”
of Marine Fisheries (DMF) Shellfish Growing Area
Classification is “Approved” (MA DFG 2009). However,
when the Shellfish classification is anything less than
“approved” no use assessment determination for the Primary Contact Recreational Use can be made.
Massachusetts Consolidated Assessment and Listing Methodology 2012 Guidance Manual
Page 33
Primary Contact Recreational Use Assessment
Use is Supported
Use is Impaired
Rivers, Lakes
Estuaries
Geo mean bacteria below
criterion,
no aesthetic use impairment
Geo mean bacteria below
criterion ,
no aesthetic use impairment,
Beach Closures <10% season,
DMF “Approved” Shellfish
Growing Area Classification
Rivers, Lakes
Geo mean bacteria above
criterion ,
aesthetic use impairment
risk calculation exceeds
hazard threshold for
contaminant of concern
Massachusetts Consolidated Assessment and Listing Methodology 2012 Guidance Manual
Estuaries
Geo mean bacteria above
criterion ,
aesthetic use impairment
Beach Closures >10% season
risk calculation exceeds hazard
threshold for contaminant of
concern
Page 34
Secondary Contact Recreational Use
Waters supporting the Secondary Contact Recreational Use are suitable for any recreation or other water
use in which contact with the water is either incidental or accidental. These include, but are not limited
to:fishing, including human consumption of fish, boating and limited contact incident to shoreline
activities. Where designated, secondary contact recreation also includes shellfishing, including human
consumption of shellfish. [Note: For the purpose of assessment and 305(b) reporting the status of the
consumption of fish and shellfish are reported as the Fish Consumption and Shellfish Harvesting uses, respectively, and
not reported on as part of the Secondary Contact Recreational Use.] For purposes of 305(b) reporting the Secondary
Contact Recreational Use is assumed to occur year-round. Since water quality conditions during the Primary Contact
Recreational season are often considered representative of worse-case (e.g., higher temperatures, increases in
population density at bathing beaches) data collected during that season are considered appropriate for making
Secondary Contact Recreational Use assessment decisions.
Use Assessment Decision Making Process:
Similar to the Primary Contact Recreational Use assessment guidance, the assessment of the Secondary Contact
Recreational Use is based on sanitary (i.e., bacteria), safety (e.g., Secchi depth) considerations, and/or
aesthetic/practical usability of the waters. While the current bacteria criteria for Massachusetts surface waters
include both a geometric mean and a single sample maximum, the assessment decisions are based on whether or
not the geometric mean of bacteria
samples collected meet the criterion
E. coli bacteria
Enterococci bacteria
for Secondary Contact Recreation
Geo mean <630 colonies/100 ml
Geo mean <175 colonies/100 ml
(i.e., E. coli and/or Enterococci
Class C
Class SC
bacterial indicators for Class C, SC
waters) (MassDEP 2006).
[Note: While single sample maximum bacteria criteria are also ascribed in the SWQS, they are utilized for making
short term closure/posting decisions. The geometric mean criterion is considered by DWM analysts to be a more
robust and appropriate measure for making the Secondary Contact Recreational Use assessment decision.]
An overview of the data types and the decision process used by DWM analysts to make assessment decisions for
the Secondary Contact Recreational Use is as follows:
Bacteria data (Rivers, Lakes, Estuaries) For freshwater segments (rivers and lakes) the primary source of bacteria
data is the results of the DWM’s water quality surveys. The validated (quality-assured) bacteria data from these
surveys are usually published by the MassDEP DWM in technical memoranda/reports. There are also many other
external sources of bacterial quality monitoring data (e.g., environmental consultants, watershed and lake
associations, and citizen monitoring programs, etc.). All external data from these and other sources are reviewed for
quality/reliability according to the DWM’s external data validation procedures and, when approved, can also be
utilized for assessment decisions. The MA DPH’s uncertainty associated with accurate reporting of freshwater beach
closure information (Beaches Bill reporting) has precluded use assessment decisions with those data up to this time.
The geometric mean of either E. coli and/or Enterococci data (minimum of five sampling events) each year is
calculated for each sampling station by year. The results are then compared directly to standards (provided above).
[Note: Geometric mean calculations included the Method Detection Limit (MDL) when necessary.]
Aesthetics (Rivers, Lakes, Estuaries) It should be emphasized here that because of the narrative aesthetics
criterion, which is applicable to all surface waters (see Aesthetics Use assessment guidance for details), DWM
analysts assess the Secondary Contact Recreational Use as impaired when the Aesthetics Use of a waterbody is
assessed as impaired.
Beach Closures (Estuaries) The Secondary Contact Recreational Use is assessed as support if the marine
beach(es) along the shoreline of an estuarine segment are posted for <10% of the swimming season. If postings
exceed 10% of the swimming season(s) the Secondary Contact Recreational Use is not assessed using this indicator
data.
Approved Shellfish Growing Area Classification (Estuaries) DWM analysts consider water quality to be
excellent in terms of bacterial quality and, therefore, supportive of the Secondary Contact Recreational Use when the
Massachusetts Department of Fish and Game's Division of Marine Fisheries (DMF) Shellfish Growing Area
Classification is “Approved” (MA DFG 2009). However, when the Shellfish Growing Area Classification is anything
less than “approved” no use assessment determination for the Secondary Contact Recreational Use can be made.
Massachusetts Consolidated Assessment and Listing Methodology 2012 Guidance Manual
Page 35
Secondary Contact Recreational Use Assessment
Use is Supported
Rivers, Lakes
Geo mean bacteria below
criterion,
no aesthetic use impairment
Estuaries
Geo mean bacteria below criterion,
no aesthetic use impairment,
Beach Closures <10% season,
DMF “Approved” Shellfish Growing Area Classification
Massachusetts Consolidated Assessment and Listing Methodology 2012 Guidance Manual
Use is Impaired
Rivers, Lakes, Estuaries
Geo mean bacteria above criterion,
aesthetic use impairment
Page 36
Aesthetics Use
The narrative aesthetics criterion in the Massachusetts Surface Water Quality Standards states that
surface waters should be “free from pollutants in concentrations or combinations that settle to form
objectionable deposits; float as debris, scum or other matter to form nuisances; produce objectionable
odor, color, taste or turbidity; or produce undesirable or nuisance species of aquatic life” (MassDEP
2006). Waters supporting the Aesthetics Use are pleasing to the senses for both active and passive
activities: to look upon, to walk or rest beside, to contemplate, to recreate on, and should enhance the
visual scene wherever it appears (Federal Water Pollution Control Administration 1968).
Use Assessment Decision Making Process:
Aesthetic observations (Rivers, Lakes, Estuaries) An evaluation is often made regarding the aesthetic quality of a
waterbody based on information described in the field sheet metadata maintained by the DWM for their surveys. The
field sheet records provide good documentation of conditions that exist at a site whether indicative of nutrient
enrichment (e.g., algal growth/blooms) or other aesthetically objectionable conditions (e.g., deposits, sheens, odors,
color, turbidity (clarity), trash/debris, etc.). Field sheet survey information is recorded at each site during each survey
so analysts can determine the general magnitude and frequency of any objectionable conditions over the course of
the sampling period. It should be noted here that a waterbody will not be assessed as impaired for the occasional
presence of litter or debris in it, but rather for other more serious indicators of water quality degradation. External
sources of these types of data may include volunteer stream team/shoreline survey and lake reports. Additional
guidelines for interpreting aesthetic observations are provided below.
Planktonic algae blooms (Rivers, Lakes) The visual presence of planktonic blooms/mats/scums (particularly
bluegreens) are associated with aesthetically objectionable conditions. Depending on the severity of a bloom, water
could range from appearing slightly colored to resembling pea soup or paint. Additionally, the MA DPH (undated)
also recommends an advisory or closure of a waterbody to avoid contact with the water when a visible scum or mat
layer is present, cyanobacteria cell counts exceed 70,000 cells/ml, or when the microcystin level of lysed cells
exceeds 14 parts per billion (ppb) in order to protect public health. Their guidelines for evaluating potential health
concerns regarding cyanobacteria in fresh waterbodies in Massachusetts can be found online at
(http://www.mass.gov/eohhs/docs/dph/environmental/exposure/protocol-cyanobacteria.pdf).
Macroalgae (Rivers) Waterbodies with greater than 40% percent cover of macroalgae (filamentous green algae > 2
cm) may exhibit aesthetic impairment (Barbour et al. 1999). DWM analysts currently utilize this general guideline of
40% cover of the substrata in a riffle/run with visible filamentous forms of green algae to evaluate whether or not the
aesthetics of a stream reach is supported. When more than 40% of the substrates are covered by macroalgal
filaments the Aesthetic Use (and also the recreational use of the waterbody) is generally considered to be impaired
(i.e., excess algae growth).
According to the “Green Book” (Federal
Secchi disk depth (Lakes) The DWM applies the 4-foot (1.2 m)
Water Pollution Control Administration
Secchi disk transparency guideline as best professional judgment
1968) “(II. Criteria for desirable factors.
to indicate when conditions are unsafe for recreational use and
(a) For primary contact waters, clarity
undesirable aesthetically. When waters fail to meet this guideline
should be such that a Secchi disc is
it is felt that hazardous objects are not visible to someone diving
visible
at a minimum depth of 4 feet. In
(or falling) into the water and rescuers are unable to easily locate
“learn
to
swim” areas, the clarity should
a possible drowning victim. Currently the DWM accepts three
be
such
that a Secchi disc on the
Secchi disk transparency readings as a minimum acceptable
bottom
is
visible.
In diving areas, the
number of sampling events taken during the summer months
clarity
shall
equal
the
minimum required
when productivity is high. With few data points (n<10), however,
by safety standards, depending on the
DWM analysts will not impair a waterbody unless there is more
height of the diving platform or board”.
than one exceedance of the guideline. With >10 readings more
than 10% would need to exceed the guideline to be assessed as
impaired. This approach applies to cases where low Secchi disk transparency results from algal or non-algal
turbidity but does not include highly tannic, tea-stained waters with high color that may result in low Secchi readings.
This is considered to be a naturally-occurring condition resulting from associated wetland influence.
Macrophyte cover (Lakes) Determining whether recreational uses are impaired due to overabundant (i.e.,
undesirable or nuisance) growths of aquatic macrophytes or algae requires some judgment decisions. In the case of
macrophytes, a combination of factors is considered, including: the area of the lake that is covered, the percentage of
biovolume that is filled, the growth habit and type of species, and the dominance of the species within the plant
community. Areal coverage is considered excessive if more than 25% of the lake is affected, particularly if the area
encompasses bathing areas. Within the areas covered by plant populations the biovolume would need to be dense
(>50 – 75%) or very dense (>75 – 100%). There are certain species with growth habits that tend to grow from the
bottom to the surface in close proximity and, thus, fill the biovolume and cause a safety hazard for extended or
Massachusetts Consolidated Assessment and Listing Methodology 2012 Guidance Manual
Page 37
incidental contact with the water, as well as undesirable aesthetic conditions. Among the species with this growth
habit are non-natives, like Myriophyllum heterophyllum, M. spicatum, and Cabomba caroliniana but also native
species, like Ceratophyllum demersum or Elodea sp. Note that there are often cases where dense/very dense
macrophyte populations are found, but they are part of a diverse, naturally-occurring community. These cases do
not represent impairment. There are also cases where algae or certain floating macrophyte species, like Lemna sp.
or Wollfia sp., can “bloom” to cause unsafe and aesthetically undesirable conditions, almost always as a result of
increased enrichment. In these instances Secchi disk transparency readings can also be used to determine
impairment.
Macroalgae (Estuaries) No current guidelines developed.
Aesthetics Use Assessment
Use is Supported
Use is Impaired
Aesthetically objectionable conditions frequently observed
No aesthetically objectionable conditions; waterbodies
(e.g., blooms, scums, water odors, discoloration, taste,
are generally “free from pollutants in concentrations or
visual turbidity highly cloudy/murky, excess algal growth
combinations that settle to form objectionable deposits;
(>40% filamentous cover in rivers, nuisance growths >25%
float as debris, scum or other matter to form nuisances;
dense/very dense macrophytes or blooms in lakes), Secchi
produce objectionable odor, color, taste or turbidity; or
disk transparency < 4 feet at least twice during survey
produce undesirable or nuisance species of aquatic life”
season.)
Causes and Sources of Use Impairments
When a waterbody is assessed as impaired for a particular designated use the 305(b) reporting process requires that
the pollutant(s)/pollution causing the impairment and the source(s) of the pollutants/pollution be identified, if possible.
The EPA maintains lists of available cause codes (http://www.epa.gov/waters/adb/documents/ADB_CAUSE_LUT.xls ) and
source codes (http://www.epa.gov/waters/adb/documents/SOURCES_LUT.xls) that are available to states choosing to
store assessments in EPA’s Assessment Database (ADB).
The typical cause(s) of impairment used by DWM analysts for each designated use are based on the indicator(s)
used to make an impairment decision as described in the preceding use assessment guidance. As an example,
Figure 3 illustrates the decision process for identifying whether nutrient enrichment is present and, if so, the causes
of impairment.
Sources are the
discharges or activities
that contribute pollutants
or stressors resulting in
impairment of designated
uses in a waterbody.
Sources of impairments
may include both point
sources and nonpoint
sources of pollution. Point
sources discharge
pollutants directly into
surface waters from a
conveyance and include,
but are not limited to:
industrial facilities,
municipal sewage
treatment facilities,
combined sewer
overflows, and storm
sewers. Nonpoint
sources deliver pollutants
to surface waters from
diffuse origins. Nonpoint
sources include: urban
runoff that is not captured in a storm sewer, agricultural runoff, leaking septic tanks, and landfills. The source(s) of
impairment may be identified based on MarineFisheries reports (e.g., sanitary surveys) and information and/or BPJ
Massachusetts Consolidated Assessment and Listing Methodology 2012 Guidance Manual
Page 38
of DWM analysts using MassGIS datalayers (e.g., orthophotos, land-use, urbanized areas) for example, but in
general the actual sources of impairment are not confirmed until a TMDL or similar analysis is conducted on the
waterbody.
A summary of the typical cause(s) associated with the impairment decisions (based on the indicator(s) as
appropriate) and the typical source(s) of the impairment for each designated use used by DWM analysts can be
found in Appendix A.
Massachusetts Consolidated Assessment and Listing Methodology 2012 Guidance Manual
Page 39
V.
CONSOLIDATED REPORTING
Since 2001 the EPA has recommended that states combine their 305(b) and 314 water quality assessment reporting
elements with their 303(d) List of Impaired Waters into a consolidated Integrated List of Waters report. The
Integrated List of Waters report is submitted to the EPA every two years for review and, in the case of waters
identified pursuant to Section 303(d), EPA approval.
The Section 305(b) reporting process entails determining the attainment status of each of the designated uses,
where applicable, for rivers, lakes and coastal waters in the state, and identifying, wherever possible, causes and
sources of any use impairment. Use assessment determinations are made for each waterbody segment for which
adequate data and information are available. However, many waters are not assessed for one or more uses in any
given assessment cycle, and many small and/or unnamed streams and ponds have never been monitored and/or
assessed. Similarly, Section 314 of the CWA provides for cooperative agreements between federal, state and local
entities to restore publicly-owned freshwater lakes and ponds and protect them against degradation. During the late
1970s through the early 1990s diagnostic and feasibility (D&F) studies were completed for many lakes and ponds
throughout Massachusetts and were used in earlier 305(b) assessments and 303(d) listing decisions. Information from
these studies continues to carry over into new assessment and listing cycles unless new monitoring information results
in a change in their assessment and listing status. It should also be mentioned that information contained in the
nonpoint source assessment report, prepared in 1989 in accordance with the requirements of Section 319, is also
reflected in 305(b) and 303(d) reporting elements unless more recent information has resulted in a modification of the
original assessment.
Under Section 303(d) of the Clean Water Act, states, territories, and authorized tribes are required to develop lists of
impaired waters. These are waters that are too polluted or otherwise degraded to meet the state’s water quality
standards. The law requires that these jurisdictions establish priority rankings for waters on the lists and develop
TMDLs for these waters. A Total Maximum Daily Load, or TMDL, is a calculation of the maximum amount of a
pollutant that a waterbody can receive and still safely meet water quality standards. The formulation of the 303(d)
List includes a more rigorous public review and comment process than does reporting under Section 305(b), and the
final version of the list must be formally approved by the EPA.
The Assessment Database (ADB)
The EPA-developed Access database, the ADB (Version2.3.1), is a relational database designed for tracking water
quality assessment decision data, including use attainment status and causes and sources of impairment. The ADB
was designed to make the assessment and listing process accurate, straightforward and user-friendly for states,
tribes and other water quality reporting agencies. Finally, the ADB automates the production of reports required by
the CWA, which states submit to the EPA, thus reducing the burden of reporting under sections 305(b), 314 and
303(d). Massachusetts implemented the ADB for the 2010 listing cycle.
Currently in Massachusetts the ADB has been populated with basic segment information, use attainment decisions,
causes and sources of impairment, and the TMDL status for the final 2010 Integrated List of Waters. Much of the
information supporting the decision-making process, however, has not yet been entered (e.g., the level of data
quality (assessment documentation), dates of monitoring, comments on listing decisions, etc.). For future reporting
cycles, however, the plan is to add more of this information as time and resources allow.
The Integrated List of Waters
The ADB is used to generate output files, which are then assembled into an Integrated List of Waters in a single,
multi-part list. Each waterbody, or segment thereof, is listed in one of five categories (see Table 3) for brief
description of each List Category). It should be reiterated here that the ADB and its precursor databases never
contained an entry for every surface water or segment thereof in Massachusetts. Rather, waters represented are
only those for which assessments of one or more designated uses were actually completed at some time in the past.
As assessments are carried out in new waters they are added to the ADB, resulting in greater representation of
Massachusetts’ surface waters in future versions of the Integrated List of Waters. The MassDEP acknowledges that
with the new multi-part listing format, all surface waters could be categorized whether or not they have ever been
assessed. However, the time and resources are currently not available to add all of the surface waters in
Massachusetts to the ADB. Therefore, it is acknowledged that many of the Massachusetts surface waters that have
never been assessed are missing from the Massachusetts Integrated List of Waters report. By definition, they would
all be listed as Category 3.
Massachusetts Consolidated Assessment and Listing Methodology 2012 Guidance Manual
Page 40
Table 3. Brief description of the five list categories of assessed waters used by MassDEP for the Integrated
List of Waters.
The Integrated List of Waters -- categories of assessed waters
Category 1
Support and not threatened for all designated uses
Category 2
Support for some uses and not assessed for others
Category 3
Insufficient information to make assessments for any uses
Category 4
Impaired for one or more uses, but not requiring the calculation of a Total Maximum Daily Load
(TMDL); (impairment due to "pollution" such as low flow, habitat alterations or non-native species
infestations).
Category 5
Impaired for one or more uses and requiring a TMDL (impairment due to pollutant(s) such as
nutrients, metals, pesticides, solids and pathogens). This constitutes the 303(d) List.
List Categories 1 - 3
Integrated List categories 1-3 include those waters that are either unimpaired or not assessed with respect to their
attainment of designated uses. Often insufficient data and information exist to assess all designated uses of any
particular waterbody or segment. Furthermore, no Massachusetts waters are listed in Category 1 because a
statewide Department of Public Health advisory pertaining to the consumption of fish precludes any waters from
being in full support of the Fish Consumption Use as described previously in the use assessment decision process.
Waters listed in Category 2 were found to support the uses for which they were assessed, but other uses were not
assessed. Finally, Category 3 contains those waters for which insufficient or no information was available to assess
any uses. Waters for which assessments were determined to be insufficient for 303(d) listing were also included in
Category 3.
List Category 4
Waters exhibiting impairment for one or more uses are placed in either Category 4 (impaired but not requiring
TMDLs) or Category 5 (impaired and requiring one or more TMDLs) according to the EPA guidance. Category 4 is
further divided into three sub-categories – 4a, 4b and 4c – depending upon the reason that TMDLs are not needed.
Category 4a includes waters for which the required TMDL(s) has already been completed and approved by the EPA.
However, since the MassDEP chooses to list each segment in only one category, waters that have an approved
TMDL for some pollutants but not others remain in Category 5 until TMDLs are approved for all of the pollutants. The
CWA distinguishes between “pollutants” such as nutrients, metals, pesticides, solids and pathogens that all require
TMDLs and “pollution” such as low flow, habitat alterations or non-native species infestations that do not require
TMDLs. Non-pollutant stressors are marked with an asterisk in the Integrated List of Water report to distinguish them
from pollutants requiring TMDLs. Waterbodies impaired solely by “pollution” are included in Category 4c. The
restoration of these waters requires measures other than TMDL development and implementation. Waters that have
one or more approved TMDLs, but also continue to be impaired by non-pollutants, are listed in Category 4a.
List Category 5 – The 303(d) List of Impaired Waters Requiring Development of TMDL
While the EPA guidance provides the overall framework for a five-part list of waters, the development, submittal, and
review of Category 5 remains subject to the prevailing regulation governing the implementation of Section 303(d) of
the CWA. This regulation requires states to identify and list those waterbodies that are not expected to meet surface
water quality standards after the implementation of technology-based controls and, as such, require the development
of TMDLs. Specific cause(s) of the impairment (if known) are included in the 303(d) List. On some occasions
biological impairment is found but the cause of the impairment is unclear or unknown. In these cases the waterbody
segment is placed, by default, into Category 5 until further evidence can better define the cause.
Reporting on impaired waters as required by Section 303(d) includes a more rigorous public review and comment
process than does reporting under Section 305(b), and the final version of the list must be formally approved by the
EPA. Once a water body is identified as impaired by a pollutant, the MassDEP is required, based on Section 303(d)
of the CWA and the implementing regulations at 40 CFR 130.7, to develop a pollutant budget designed to restore the
health of the impaired water body. The process of developing this pollutant budget, generally referred to as a Total
Maximum Daily Load (TMDL), includes: identifying the cause (type of pollutant) and source (where the pollutant
comes from), determining how much of the pollutant is from direct discharges (point sources) or indirect discharges
(non-point sources), determining the maximum amount of the pollutant that can be discharged to a specific water
body to meet water quality standards, and developing a plan to meet that goal. In short, a TMDL is a clean-up plan
that is required under the CWA to restore water quality and enable waters to attain designated uses. The EPA tracks
the states’ progress with completing TMDLs in its Assessment and Total Maximum Daily Load (TMDL) Tracking and
Implementation System (ATTAINS), which can be accessed at http://www.epa.gov/waters/ir. This system assigns a
unique identification number to each approved TMDL. This number is included for reference in categories 4a and 5
of the Massachusetts Integrated List of Waters reports.
Massachusetts Consolidated Assessment and Listing Methodology 2012 Guidance Manual
Page 41
Waterbodies, or segments thereof, can be removed from Category 5, or delisted, when a TMDL is approved by the
EPA for that waterbody or segment. Waters with approved TMDLs move into Category 4a until it is determined that
they are no longer impaired. In addition, there are some instances when a previously listed waterbody can be
removed from the 303(d) List without calculating a TMDL, for example, when a new assessment reveals that the
waterbody is now meeting all applicable water quality standards.
Spatial Documentation
Another component of consolidated reporting is the spatial georeferencing of the river, lake, and estuary segments
(as illustrated in Figure 4). DWM analysts maintain geospatial information for each waterbody segment (or
assessment unit) stored in the ADB. Two georeferenced ArcMap shapefiles contain the geospatial documentation
delineating these waterbody segments. These two feature classes include an arc (primarily river) shapefile and a
polygon (primarily lake and estuary areas) shapefile. The geo-referencing of individual segments relied on linework
derived from the MassGIS 1:25,000 hydrography based on USGS topographic maps. Additional on-screen editing
was performed as needed using USGS topographic quadrangles and/or MassGIS color orthophotos as a base map
for all river segments. Occasionally National Oceanic and Atmospheric Administration nautical charts at several
scales and the
"Planimetry of
Harbors for the 1984
305(b) Report" were
utilized. Where
definitions were still
ambiguous after
using these
references, DWM
staff members were
consulted to define
and geo-reference
individual water
body segments. No
two river segments
overlap nor do any
two lake features
nor do any two
estuary features. In
addition to the
georeferenced
segment locations,
data from the ADB
can be related to
each shape and
spatially displayed.
This allows mapping
to display the
Massachusetts
Integrated List of
Waters by their
category (Figure 4) as well as the ability to obtain more detailed information for each segment (Figure 5). A table
generated from the ADB containing the support status for each individual use with associated cause(s) and source(s)
of impairment, as well as approved TMDL information, can be linked and displayed through the waterbody segment
(AU) shapefiles.
Massachusetts Consolidated Assessment and Listing Methodology 2012 Guidance Manual
Page 42
The Massachusetts 2010 Integrated List of Waters (305(b)/303(d)) data layers and all of the data elements (including
metadata) are available at the Commonwealth of Massachusetts' Office of Geographic Information (MassGIS)
website (http://www.mass.gov/mgis/wbs2010.htm). The datalayers for the 2012 Integrated List of Waters will be
developed by DWM analysts once the 2012 303(d) list (Category 5 waters) is approved by EPA.
Massachusetts Consolidated Assessment and Listing Methodology 2012 Guidance Manual
Page 43
VI.
REFERENCES
Bain, M.B. 1996. Fish Codes and Classes File Documentation, Sources, and Notes. Cornell University, Department
of Natural Resources, New York Cooperative Fish and Wildlife Research Unit. Ithaca, NY.
Barbour, M.T., J. Gerritsen, B.D. Snyder, and J.B. Stribling. 1999. Rapid bioassessment protocols for use in
wadeable streams and rivers: periphyton, benthic macroinvertebrates, and fish, second edition. EPA 841-B-99002U.S. Environmental Protection Agency. Washington, DC.
CCME. 1999b. Canadian tissue residue guidelines for the protection of wildlife consumers of aquatic biota:
Introduction. In: Canadian environmental quality guidelines, 1999, Canadian Council of Ministers of the
Environment. Winnipeg, MB, Canada.
CCME. 1999c. Canadian tissue residue guidelines for the protection of wildlife consumers of aquatic biota: DDT
(total). In: Canadian environmental quality guidelines, 1999, Canadian Council of Ministers of the Environment.
Winnipeg, MB, Canada.
CCME. 1999d. Canadian tissue residue guidelines for the protection of wildlife consumers of aquatic biota:
Toxaphene). In: Canadian environmental quality guidelines, 1999, Canadian Council of Ministers of the
Environment. Winnipeg, MB, Canada.
CCME. 2000. Canadian tissue residue guidelines for the protection of wildlife consumers of aquatic biota:
Methylmercury. In: Canadian environmental quality guidelines, 1999, Canadian Council of Ministers of the
Environment. Winnipeg, MB, Canada.
CCME. 2001. Canadian tissue residue guidelines for the protection of wildlife consumers of aquatic biota:
Polychlorinated dibenzo-p-dioxins and polychlorinated dibenzofurans (PCDD/Fs). In: Canadian environmental quality
guidelines, 1999, Canadian Council of Ministers of the Environment, Winnipeg.
CCME. 2002. Canadian Sediment Quality Guidelines for the Protection of Aquatic Life --Summary Tables Updated
2002. Canadian Council of Ministers of the Environment. Winnipeg, MB, Canada.
Coles, J.F. 1998. Organochlorine compounds in fish tissue for the Connecticut, Housatonic, and Thames River
Basins study unit, 1992-94. USGS Water-Resources Investigations Report 98-4075. U.S. Geological Survey,
National Water Quality Assessment Program, Water Resources Division, Marlborough, MA.
Costello, C.T and W.J. Kenworthy. 2011. Twelve-Year Mapping and Change Analysis of Eelgrass (Zostera marina)
Areal Abundance in Massachusetts (USA) Identifies Statewide Declines. Coastal and Estuarine Research
Federation [published by Springer online 20 January 2011. DOI 10.1007/s12237-010-9371-5].
EPA 1986. Quality Criteria for Water 1986. EPA 440/5-86-001. EPA Office of Water, Washington, D.C.
EPA 1988. Dissolved Oxygen Water Quality Standards Criteria Summaries: A compilation of State/Federal Criteria.
EPA 440/5-88/024. EPA Office of Water, Washington, D.C.
EPA 1999. 1999 Update of Ambient Water Quality Criteria for Ammonia. EPA-822-R-99-014. EPA Office of Water,
Washington, D.C.
EPA. 2002. Consolidated Assessment and Listing Methodology. Toward a Compendium of Best Practices.
Office of Wetlands, Oceans and Watersheds, US Environmental Protection Agency, Washington, D.C.
EPA. 2003. Bacterial Water Quality Standards for Recreational Waters (Freshwater and Marine Waters) Status
Report. EPA-823-R-03-008. U.S. Environmental Protection Agency, Office of Water, Washington, D.C.
EPA. 2009. National Recommended Water Quality Criteria. EPA Office of Water, Washington, D.C. available online
at http://water.epa.gov/scitech/swguidance/standards/current/upload/nrwqc-2009.pdf.
EPA. 2011. [Online]. NPDES System Whole Effluent Toxicity. U.S. Environmental Protection Agency. Retrieved 14
July 2011 from http://cfpub.epa.gov/npdes/wqbasedpermitting/wet.cfm
FDA. 2003. Guide for the Control of Molluscan Shellfish 2003 Revision. [Online]. Updated 12 November 2004.
United States Food and Drug Administration, Department of Health and Human Services, National Shellfish
Sanitation Program. http://www.cfsan.fda.gov/~ear/nss2-toc.html. Accessed 2005 December 5.
Massachusetts Consolidated Assessment and Listing Methodology 2012 Guidance Manual
Page 44
Federal Water Pollution Control Administration. 1968. Water Quality Criteria. [known as the Green Book]. Report
of the National Technical Advisory Committee to the Secretary of the Interior. Washington, D.C.
Grubbs, G.H. and R.H. Wayland III. 2000. Letter to Colleague dated 24 October 2000. EPA recommendations on
the use of fish and shellfish consumption advisories and certain shellfish growing area classifications in determining
attainment of water quality standards and listing impaired waterbodies under section 303(d) of the Clean Water Act.
United States Environmental Protection Agency; Office of Wetlands, Oceans and Watersheds; Washington, D.C.
Halliwell, D.B, Langdon, R.W., Daniels, R.A., Kurtenbach, J.P., and R.A. Jacobson. 1999. Classification of
Freshwater Fish Species of the Northeastern United States for Use in the Development of Indices of Biological
Integrity, with Regional Applications. pp. 301-338 in T. P. Simon (ed.). Assessing the Sustainability and Biological
Integrity of water Resources Using Fish Communities. CRC Press, Boca Raton, FL.
Hem, J.D. 1970. Study and Interpretation of the Chemical Characteristics of Natural Water. Second Edition. United
States Government Printing Office, Washington.
Howes, B.L., R. Samimy, and B. Dudley. 2003. Massachusetts Estuaries Project Site-Specific Nitrogen Thresholds
for Southeastern Massachusetts Embayments: Critical Indicators Interim Report Revised December 22, 2003.
University of Massachusetts Dartmouth, School of Marine Science and Technology (SMAST), Coastal Systems
Laboratory. New Bedford, MA and Massachusetts Department of Environmental Protection, Lakeville, MA.
Karr, J.R., K.D. Fausch, P.L. Angermeier, P.R. Yant, and I.J. Schlosser. 1986. Assessing Biological Integrity in
Running Waters: A Method and Its Rationale. Special Publication 5. Illinois Natural History Survey. Champaign, IL.
Keehner, D. 2011. Memorandum to Water Division Directors et al. dated March 21, 2011. Information Concerning
2012 Clean Water Act Sections 303(d), 305(b) and 314 Integrated Reporting and Listing Decisions. EPA Office of
Wetlands, Oceans and Watersheds, Washington, D.C.
MA DCR. 2007. A Guide to Selected Invasive Non-native Aquatic Species in Massachusetts. Revised March 2007.
Massachusetts Department of Conservation and Recreation, Lakes and Ponds Program. Boston, MA.
MA DFG. 2009. Designated Shellfish Growing Areas Datalayer – October 2009. Published by MassGIS in October
2009. Massachusetts Department of Fish and Game, Division of Marine Fisheries, Boston, MA.
MA DFG. undated. [Online]. Shellfish Sanitation and Management. Retrieved 27 October 2011 from
http://www.mass.gov/dfwele/dmf/programsandprojects/shelsani.htm
MA DPH. 2001. MA DPH Issues New Consumer Advisories on Fish Consumption and Mercury Contamination.
Massachusetts Department of Public Health, Bureau of Environmental Health Assessment, Boston, MA.
MA DPH. 2002. 105 CMR 445.000: Minimum Standards For Bathing Beaches, State Sanitary Code, Chapter VII
[Online]. Massachusetts Department of Public Health, Division of Community Sanitation Regulations and Statutes,
Boston, MA. Retrieved 19 September 2002 from http://www.state.ma.us/dph/dcs/csanregs.htm.
MA DPH. 2007. MDPH Guidelines for Cyanobacteria in Freshwater Recreational Waterbodies in Massachusetts.
Massachusetts Department of Public Health. Boston, MA [as cited in MassDEP 2010]
MA DPH. 2009a. Freshwater Fish Consumption Advisory List – October 2009. Massachusetts Department of
Public Health, Bureau of Environmental Health Assessment, Boston, MA. (List available online @
http://www.mass.gov/Eeohhs2/docs/dph/environmental/exposure/fish_consumption_advisory_list.pdf )
MA DPH. 2009b. Massachusetts Department Of Public Health Reminds Consumers Of State Fish Advisory – June
3, 2009. Massachusetts Department of Public Health, Bureau of Environmental Health Assessment, Boston, MA.
(Press release online @
http://www.mass.gov/?pageID=eohhs2pressrelease&L=4&L0=Home&L1=Government&L2=Departments+and+Divisi
ons&L3=Department+of+Public+Health&sid=Eeohhs2&b=pressrelease&f=090603_fish_advisory&csid=Eeohhs2 )
MA DPH. 2010. Marine and Freshwater Beach Testing in Massachusetts Annual Report: 2009 Season.
Massachusetts Department of Public Health Bureau of Environmental Health Environmental Toxicology Program,
Boston, MA.
2 MGL Chapter (C) 111, § Section (S) 5. See Appendix A.
Massachusetts Consolidated Assessment and Listing Methodology 2012 Guidance Manual
Page 45
3 105 CMR 445.000: Minimum Standards for Bathing Beaches (State Sanitary Code, Chapter VII). See
Appendix B.
MA DPH. 2011. Freshwater Fish Consumption Advisory List – October 2011. Massachusetts Department of Public
Health, Bureau of Environmental Health Assessment, Boston, MA. (List available online @
http://www.mass.gov/Eeohhs2/docs/dph/environmental/exposure/fish_consumption_advisory_list.pdf)
MA DPH. 2011b. Beaches Bill Reporting Database 2002 - 2010. Massachusetts Department of Public Health,
Environmental Toxicology Program, Boston, MA.
MA DPH. Undated. Freshwater Algae Blooms: Contributing Factors and Health Concerns. Poster [Online at
http://www.mass.gov/eohhs/docs/dph/environmental/exposure/algae/ccnhc-poster.ppt] Massachusetts Department
of Public Health, Bureau of Environmental Health, Boston, MA.
MassDEP. Undated. Draft Sampling Plan for Year 2010 Periphyton Percent Cover and Biomass Monitoring in the
Northeast Region Watersheds. CN370.0. Massachusetts Department of Environmental Protection, Division of
Watershed Management, Worcester, MA.
MassDEP. 2005. Quality Assurance Project Plan Benthic Macroinvertebrate Biomonitoring and Habitat Assessment.
CN226.0. Massachusetts Department of Environmental Protection, Division of Watershed Management, Worcester,
MA.
MassDEP. 2005a. Quality Assurance Program Plan Surface Water Monitoring & Assessment MADEP-Division of
Watershed Management 2005-2009. CN225.0, MS-QAPP-25 (Rev. #1). Massachusetts Department of
Environmental Protection, Division of Watershed Management, Worcester, MA.
MassDEP. 2005b. A Water Quality Monitoring Strategy for the Commonwealth of Massachusetts. CN203.0.
Massachusetts Department of Environmental Protection, Division of Watershed Management, Worcester, MA.
MassDEP. 2006. Massachusetts Surface Water Quality Standards (Revision of 314 CMR 4.00, effective December
29, 2006). Massachusetts Department of Environmental Protection, Boston, MA.
MassDEP. 2007. STANDARD OPERATING PROCEDURE Water Quality Monitoring In Streams Using Aquatic
Macroinvertebrates Revised November 2007. CN 039.2. Massachusetts Department of Environmental Protection,
Division of Watershed Management, Worcester, MA.
MassDEP. 2010a. Quality Assurance Program Plan Surface Water Monitoring & Assessment MassDEP-Division of
Watershed Management 2010-2014. CN365.0, MS-QAPP-27 (Rev. #1). Massachusetts Department of
Environmental Protection, Division of Watershed Management, Worcester, MA.
MassDEP. 2010. STANDARD OPERATING PROCEDURE Enumeration of Cyanobacteria in Water Samples. CN
150.0. Massachusetts Department of Environmental Protection, Division of Watershed Management, Worcester, MA.
MassDEP. 2010c. Quality Assurance Project Plan Fish Toxics Program. CN096.0. Massachusetts Department of
Environmental Protection, Division of Watershed Management, Worcester, MA.
MassDEP. 2011a. Standard Operating Procedure Fish Collection Procedures for Evaluation of Resident Fish
Populations (Method 003/11.20.95). CN75.1. Massachusetts Department of Environmental Protection, Division of
Watershed Management, Worcester, MA.
MassDEP. 2011b. Open files – ToxTD database retrievals. Massachusetts Department of Environmental
Protection, Division of Watershed Management. Worcester, MA.
MassGIS, 2008. DEP Eelgrass – February 2006 [Online]. MassGIS (MA Office of Geographic and Environmental
Information System, Executive Office of Energy and Environmental Affairs, Boston, MA). Retrieved 21 August 2008
from http://www.mass.gov/mgis/eelgrass.htm. Site last updated 11 April 2008.
MassWildlife. 2008. MDFW Fisheries Database Distribution Copy_093008. Massachusetts Department of Fish and
Game, Division of Fisheries & Wildlife, Westborough, MA.
Massachusetts Consolidated Assessment and Listing Methodology 2012 Guidance Manual
Page 46
Mattson, M.D., P.J. Godfrey, M.F. Walk, P.A. Kerr, and O.T. Zajicek. 1992. Regional Chemistry of Lakes in
Massachusetts. (Paper No. 92059). Water Resources Bulletin, American Water Resources Association, Vol. 28, No.
6, December 1992.
Mattson, M.D., P.J Godfrey, R.A. Barletta, and A.Aiello. 2004 Eutrophication and Aquatic Plant Management in
Massachusetts. Final Generic Environmental Impact Report. Edited by Kenneth J. Wagner. Massachusetts
Department of Environmental Protection, Division of Watershed Management, Worcester, MA and Massachusetts
Department of Conservation and Recreation, Boston, MA.
NEIWPCC. 2007. Northeast Regional Mercury TMDL Fact Sheet October 2007. [Online]. New England Interstate
Water Pollution Control Commission, Lowell, MA. Retrieved 23 January 2008 from
http://www.neiwpcc.org/mercury/mercurydocs/FINAL%20Northeast%20Regional%20Mercury%20TMDL%20Fact%20Sheet.pdf.
Northeast States. 2007. Northeast Regional Mercury Total Maximum Daily Load. Connecticut Department of
Environmental Protection, Maine Department of Environmental Protection, Massachusetts Department of
Environmental Protection, New Hampshire Department of Environmental Services, New York State Department of
Environmental Conservation, Rhode Island Department of Environmental Management, Vermont Department of
Environmental Conservation, New England Interstate Water Pollution Control Commission. October 24, 2007.
Persaud, D., R. Jaagumagi, and A. Hayton. 1993. Guidelines for the protection and management of aquatic
sediment quality in Ontario. Water Resources Branch, Ontario Ministry of the Environment, Ontario, Canada.
Plafkin, J.L., M.T. Barbour, K.D. Porter, S.K. Gross, and R.M. Hughes. 1989. Rapid bioassessment protocols for
use in streams and rivers: benthic macroinvertebrates and fish. EPA/444/4-89-001. U.S. Environmental Protection
Agency, Washington, D.C.
Portnoy, J.W., M.G. Winkler, P.R. Sanford & C.N. Farris. 2001. Kettle Pond Data Atlas: Paleoecology and Modern
Water Quality. Cape Cod National Seashore, National Park Service, U.S. Department of Interior. 119p.
Regas, D. 2003. Memorandum to Water Division Directors et al. dated July 21, 2003. Information Concerning 2004
Clean Water Act Sections 303(d), 305(b) and 314 Integrated Reporting and Listing Decisions. U.S. Environmental
Protection Agency; Office of Wetlands, Oceans and Watersheds, Washington, D.C.
Regas, D. 2005. Memorandum to Water Division Directors et al. dated July 29, 2005. Information Concerning 2006
Clean Water Act Sections 303(d), 305(b) and 314 Integrated Reporting and Listing Decisions. U.S. Environmental
Protection Agency; Office of Wetlands, Oceans and Watersheds, Washington, D.C.
Regas, D. 2006. Memorandum to Water Division Directors et al. dated October 12, 2006. Information Concerning
2008 Clean Water Act Sections 303(d), 305(b) and 314 Integrated Reporting and Listing Decisions. U.S.
Environmental Protection Agency; Office of Wetlands, Oceans and Watersheds, Washington, D.C.
Schwartz, S. 2009. Memorandum to Water Division Directors et al. dated May 5, 2009. Information Concerning
2010 Clean Water Act Sections 303(d), 305(b) and 314 Integrated Reporting and Listing Decisions. U.S.
Environmental Protection Agency; Office of Wetlands, Oceans and Watersheds, Washington, D.C.
USFDA. [Online]. National Shellfish Sanitation Program Guide for the Control of Molluscan Shellfish 2009, Section
IV. Guidance Documents, Chapter 11. Growing Areas .03 Sanitary Survey and the Classification of Growing Waters.
Retrieved 28 October 2011 from http://www.fda.gov/Food/FoodSafety/ProductSpecificInformation/Seafood/FederalStatePrograms/NationalShellfishSanitationProgram/ucm053724.htm
Page last updated 26 April 2011.
Walk, M.I., P.J. Godfrey, A. Ruby III, O.T. Zajicek, and M. Mattson. 1991. Acidity Status of Surface Waters in
Massachusetts. (revised May 13, 1991). University of Massachusetts, Water Resources Research Center, Blaisdell
House, and Department of Chemistry, Amherst, MA.
Wayland III, R.H. 2001. Memorandum to EPA Regional Water Management Directors, et al. dated 19 November
2001. Re: 2002 Integrated Water Quality Monitoring and Assessment Report Guidance. U.S. Environmental
Protection Agency; Office of Wetlands, Oceans and Watersheds; Washington, D.C.
Massachusetts Consolidated Assessment and Listing Methodology 2012 Guidance Manual
Page 47
WHO. 1999. Toxic Cyanobacteria in Water: A Guide to Their Public Health Consequences, Monitoring and
Management . I. Chorus and J. Bartram editors. World Health Organization. Spon Press. London [as cited in
MassDEP 2010]
Zen, E., 1983. Bedrock Geologic Map of Massachusetts. Massachusetts Department of Public Works, Boston, MA 2
sheets, scale 2:25,000 [as cited in Mattson et al. 1992.]
Massachusetts Consolidated Assessment and Listing Methodology 2012 Guidance Manual
Page 48
APPENDIX A
Typical cause(s) and source(s) of use impairments (Aquatic Life, Fish Consumption, Shellfish Harvesting,
Primary Contact Recreation, Secondary Contact Recreation, and Aesthetics) based on the indicator(s) used
to make the use impairment decisions.
Massachusetts Consolidated Assessment and Listing Methodology 2012 Guidance Manual
Page A1
AQUATIC LIFE USE IMPAIRMENT CAUSES AND SOURCES
Aquatic Life Use
Assessment
Indicators
Benthic
macroinvertebrate
data
Fish population
data
Habitat and flow
data
Eelgrass bed
mapping data
Non-native
aquatic species
data
Periphyton/algal
blooms
Use is Impaired
Typical Cause(s) of
Impairment
BIOLOGICAL MONITORING INFORMATION
Rivers
Moderately impaired/severely
impaired RBP III analysis, slightly
Aquatic Macroinvertebrate
impaired with special conditions (e.g.,
Bioassessments
hyperdominance by pollution tolerant
Organic Enrichment
sp.) as noted by DWM biologists
(Sewage) Biological
Estuaries
Indicators
Low #species, low # individuals, poor
Nutrient/Eutrophication
diversity and evenness, shallow
Biological Indicators
dwelling opportunistic species or near Combined Biota/Habitat
absence of benthos, thin feeding
Bioassessments
zone, as reported from external data
sources
Rivers - Cold Water Fishery
No fish found or cold water species
absent, DELTS with abnormal fish
Lack of a coldwater
histology
assemblage
Rivers - Warm Water Fishery
Fishes Bioassessments
No fish found or fluvial fish were
Fish Kills
absent or relatively scarce (few
Abnormal Fish deformities,
numbers), DELTS with abnormal
erosions, lesions, tumors
fish histology
(DELTS)
Lakes, Estuaries
> 5% population losses estimated ,
DELTS with abnormal fish histology
Fish-Passage Barrier
Low flow alterations
Habitat Assessment
(Streams)
Other flow regime alterations
Rivers, Lakes, Estuaries
Other anthropogenic
Physical habitat structure impacted
substrate alterations
by anthropogenic stressors (e.g.,
Physical substrate habitat
lack of flow, lack of natural habitat
alterations
structure such as concrete channel,
Sedimentation/Siltation
underground conduit), nonBottom Deposits
functioning anadromous fishway
Alteration in stream-side or
present
littoral vegetative covers
Petroleum Hydrocarbons
(Oil Spills)
Total Suspended Solids
Turbidity
Estuaries
Substantial decline (more than 10%
Estuarine Bioassessments
of the in bed size or total loss of beds
no matter their size)
Non-Native Aquatic Plants
Non-native Fish, Shellfish, or
Zooplankton
Rivers, Lakes
Eurasian Water Milfoil,
Non-native aquatic species present
Myriophyllum spicatum
Zebra mussel, Dreissena
polymorph
Rivers, Lakes, Estuaries
Frequent and/or prolonged algal
blooms or growths of periphyton,
Excess Algal Growth
cyanobacteria blooms result in
Nutrient/Eutrophication
advisories (recurring and/or
Biological Indicators
prolonged), >25% cover noxious
aquatic plants (e.g. Lemna sp.),
periphyton cover within riffle/reach
>40%
Massachusetts Consolidated Assessment and Listing Methodology 2012 Guidance Manual
Typical Source(s) of
Impairment
Municipal Point Source
Discharges
Dam or Impoundment
Unspecified Urban Stormwater
Impacts from Hydrostructure
Flow Regulation/Modification
Discharges from Municipal
Separate Storm Sewer
Systems (MS4)
Source Unknown
Municipal Point Source
Discharges
Dam or Impoundment
Source Unknown
Hydrostructure Impacts on
Fish Passage
Dam or Impoundment
Channelization
Streambank
Modifications/destabilization
Flow Alterations from Water
Diversions
Impacts from Hydrostructure
Flow Regulation/Modification
Habitat Modification - other
than Hydromodification
Loss of Riparian Habitat
Unspecified Urban Stormwater
Source Unknown
Source Unknown
Introduction of Non-native
Organisms (Accidental or
Intentional)
Source Unknown
Municipal Point Source
Discharges
Unspecified Urban Stormwater
Internal Nutrient Recycling
Discharges from Municipal
Separate Storm Sewer
Systems (MS4)
Source Unknown
Page A2
AQUATIC LIFE USE IMPAIRMENT CAUSES AND SOURCES
Aquatic Life Use
Assessment
Indicators
Toxicity testing
data
Water quality data
- DO
Water quality data
- pH
Water quality data
- temperature
Water quality data
nutrient
indicators
Use is Impaired
Typical Cause(s) of
Impairment
TOXICOLOGICAL MONITORING INFORMATION
Ambient Bioassays -- Acute
Aquatic Toxicity
Rivers, Lakes, Estuaries
Ambient Bioassays -<75% survival of test organisms to
Chronic Aquatic Toxicity
water column or sediment samples in
either 48 hr (acute) or 7-day
Sediment Bioassays -- Acute
exposure (chronic) tests occurs in
Toxicity Freshwater
>10% of test events.
Whole Effluent Toxicity
(occasionally used)
PHYSICO-CHEMICAL WATER QUALITY INFORMATION
Rivers
Frequent (>10%) and/or prolonged or
severe excursions (>1.0 mg/L below
standards) from criteria
Lakes
In deep lakes (with a hypolimnion),
the criterion is not met in a
Oxygen, Dissolved
hypolimnetic area >10% of the lake
Dissolved oxygen saturation
surface area during maximum oxygen
depletion (summer growing season)
Estuaries
Frequent (>10%) and/or prolonged or
severe excursions (>1.0 mg/L below
standards) from criteria
Rivers
Frequent (>10%) and/or prolonged or
severe excursions (>0.5 SU) from
criteria,
Lakes
pH, Low
Excursion from criteria (>0.5 SU)
pH, High
summer growing season,
Estuaries
Frequent (>10%) and/or prolonged or
severe excursions (>0.5 SU) from
criteria
Rivers - Cold Water Fishery
Criterion frequently exceeded
(>10%) or by >2°C
Rivers and Lakes - Warm Water
Fishery
Temperature, water
Criterion frequently exceeded (>10%
measurements) or by >2°C.
Estuaries
Criterion frequently exceeded, rise
due to discharge exceeds ΔT
standards
Rivers
Combination of indicators present:
excessive visible nuisance algae
(filamentous, blooms, mats), large
diel changes in
oxygen/saturation/pH, elevated
chlorophyll a
Chlorophyll-a
Excess Algal Growth
Phosphorus (Total)
pH, High
Secchi disk transparency
Turbidity
Dissolved oxygen saturation
Nutrient/Eutrophication
Biological Indicators
Lakes
Combination of indicators present:
excessive visible nuisance algae or
macrophytes, low Secchi disk
transparency, high oxygen supersaturation, elevated pH elevated
chlorophyll a
Secchi disk transparency
Chlorophyll-a
Excess Algal Growth
Phosphorus (Total)
Turbidity
Aquatic Plants
(Macrophytes)
Massachusetts Consolidated Assessment and Listing Methodology 2012 Guidance Manual
Typical Source(s) of
Impairment
Contaminated Sediments
Municipal Point Source
Discharges Source Unknown
Municipal Point Source
Discharges
Discharges from Municipal
Separate Storm Sewer
Systems (MS4)
Unspecified Urban Stormwater
Industrial Point Source
Discharge
Dam or Impoundment
Combined Sewer Overflows
Impacts from Hydrostructure
Flow Regulation/Modification
Source Unknown
Municipal Point Source
Discharges Source Unknown
Dam or Impoundment
Baseflow Depletion from
Groundwater Withdrawals
Source Unknown
Municipal Point Source
Discharges
Unspecified Urban Stormwater
Internal Nutrient Recycling
Discharges from Municipal
Separate Storm Sewer
Systems (MS4)
Non-Point Source
Urban Runoff/Storm Sewers
Source Unknown
Municipal Point Source
Discharges
Unspecified Urban Stormwater
Internal Nutrient Recycling
Discharges from Municipal
Separate Storm Sewer
Systems (MS4)
Page A3
AQUATIC LIFE USE IMPAIRMENT CAUSES AND SOURCES
Aquatic Life Use
Assessment
Indicators
Use is Impaired
Typical Cause(s) of
Impairment
Secchi disk transparency
Dissolved oxygen saturation
Nutrient/Eutrophication
Biological Indicators
Estuaries
Substantial decline (> 10% of bed
size or total loss of beds no matter
their size, MEP analysis indicates
moderately to severely degraded
health due to nitrogen enrichment
Nitrogen (Total)
Nutrient/Eutrophication
Biological Indicators
Chlorophyll-a
Excess Algal Growth
Typical Source(s) of
Impairment
Non-Point Source
Urban Runoff/Storm Sewers
Source Unknown
Municipal Point Source
Discharges
Unspecified Urban Stormwater
Internal Nutrient Recycling
Discharges from Municipal
Separate Storm Sewer
Systems (MS4)
Industrial Point Source
Discharge
On-site Treatment Systems
(Septic Systems and Similar
Decentralized Systems)
Septage Disposal
Source Unknown
Ammonia (Un-ionized)
Chlorine, Residual (Chlorine
Demand)
Municipal Point Source
Rivers, Lakes, Estuaries
Heavy metals* (e.g., arsenic, Discharges
mercury)
Highway/Road/Bridge Runoff
Water quality data Frequent and/or prolonged
PAHs*
(e.g., acenaphthene,
excursions
from
criteria
(more
than
a
(Non-construction Related)
toxic and other
naphthalene)
single exceedance of acute criteria or
pollutants
Combined Sewer Overflows
chlorinated organic* (e.g.,
>10% samples exceed chronic
Contaminated Sediments
aldrin, heptachlor)
criteria).
Source Unknown
Non priority pollutants” (e.g.,
choride, aluminum,
Sulfide-Hydrogen Sulfide)
SEDIMENT AND TISSUE RESIDUE INFORMATION
Sediment Screening Value
(Exceedence)
Arsenic, Cadmium,
Rivers, Lakes, Estuaries
Chromium (total), Copper, Contaminated Sediments
Frequent excursions over PEL
Lead, Mercury, Nickel,
Sediment quality
CERCLA NPL (Superfund)
guidelines along with other evidence
Zinc
data
Sites
of impairment, waterbodies known to
Petroleum Hydrocarbons'
Inappropriate Waste Disposal
have sediment contamination
Polycyclic Aromatic
undergoing remedial actions.
Hydrocarbons (PAHs)
(Aquatic Ecosystems)
Abnormal Fish deformities,
Rivers, Lakes, Estuaries
erosions, lesions, tumors
Contaminated Sediments
(DELTS),
Residue of contaminants in whole
Tissue residue
Inappropriate Waste Disposal
Abnormal Fish Histology
body samples frequently exceed
data
Releases from Waste Sites or
(Lesions)
NAS/NAE guidelines, DELTS with
Dumps Source Unknown
PCB in Fish Tissue
abnormal fish histology.
Polychlorinated biphenyls
* Asterisk indicates there are many possible contaminants that belong to these classes of pollutants, the cause of impairment
however is the individual pollutant (see EPA list of cause codes
http://www.epa.gov/waters/adb/documents/ADB_CAUSE_LUT.xls) for complete listing.
Massachusetts Consolidated Assessment and Listing Methodology 2012 Guidance Manual
Page A4
FISH CONSUMPTION USE IMPAIRMENT CAUSES AND SOURCES
Indicator for
Fish Consumption
Use Assessment
Impaired Decision
Cause(s)
Typical Source(s) of
Impairment
Waterbody has site specific MA
DPH Fish Consumption
Advisory with hazard (e.g.,
mercury, PCBs, pesticides,
DDT, etc.)
Mercury in Fish Tissue
PCB in Fish Tissue
Dioxin (including 2,3,7,8-TCDD)
(Pentachlorophenol (PCP)*
Chlordane
DDT
Polycyclic Aromatic
Hydrocarbons (PAHs) (Aquatic
Ecosystems)
Atmospheric Deposition Toxics
Contaminated Sediments
CERCLA NPL (Superfund)
Sites
Inappropriate Waste
Disposal
Releases from Waste Sites
or Dumps Source Unknown
SHELLFISH HARVESTING USE IMPAIRMENT CAUSES AND SOURCES
Indicator for
Shellfish
Harvesting Use
Assessment
Impaired Decision
SA Waters: Conditionally
Approved, Restricted,
Conditionally Restricted, or
Prohibited
SB Waters: Conditionally
Restricted or Prohibited
Cause(s)
Fecal Coliform
Polychlorinated biphenyls
Massachusetts Consolidated Assessment and Listing Methodology 2012 Guidance Manual
Typical Source(s) of
Impairment
Discharges from Municipal
Separate Storm Sewer
Systems (MS4)
Combined Sewer Overflows
Marina/boating Pumpout
Releases
Marina/Boating Sanitary Onvessel Discharges
Unspecified Urban Stormwater
Municipal Point Source
Discharges
Illicit Connections/Hook-ups to
Storm Sewers
Sanitary Sewer Overflows
(Collection System Failures)
On-site Treatment Systems
(Septic Systems and Similar
Decentralized Systems)
Source Unknown
Page A5
PRIMARY CONTACT RECREATIONAL USE IMPAIRMENT CAUSES AND SOURCES
Indicator for
Primary Contact
Recreational Use
Assessment
Impaired Decision
Geometric mean bacteria above
criterion,
aesthetic use impairment
Beach Closures >10% season
Cause(s)
Typical Source(s) of
Impairment
Enterococcus
Escherichia coli
Polychlorinated biphenyls**
Any applicable aesthetic causes
(see list below)
Municipal Point Source
Discharges
Combined Sewer Overflows
Municipal (Urbanized High
Density Area)
Discharges from Municipal
Separate Storm Sewer
Systems (MS4)
Unspecified Urban Stormwater
Wet Weather Discharges (NonPoint Source)
Illicit Connections/Hook-ups to
Storm Sewers
Urban Runoff/Storm Sewers
Waterfowl
Introduction of Non-native
Organisms (Accidental or
Intentional)
Source Unknown
** Example of risk calculation exceeds hazard threshold for (contaminant of concern)
PRIMARY CONTACT RECREATIONAL USE IMPAIRMENT CAUSES AND SOURCES
Indicator for
Secondary
Contact
Recreational Use
Assessment
Impaired Decision
Geometric mean bacteria above
criterion,
aesthetic use impairment
Cause(s)
Enterococcus
Escherichia coli
Any applicable aesthetic causes
(see list below)
Massachusetts Consolidated Assessment and Listing Methodology 2012 Guidance Manual
Typical Source(s) of
Impairment
Municipal Point Source
Discharges
Combined Sewer Overflows
Municipal (Urbanized High
Density Area)
Discharges from Municipal
Separate Storm Sewer
Systems (MS4)
Unspecified Urban Stormwater
Wet Weather Discharges (NonPoint Source)
Illicit Connections/Hook-ups to
Storm Sewers
Urban Runoff/Storm Sewers
Waterfowl
Introduction of Non-native
Organisms (Accidental or
Intentional)
Source Unknown
Page A6
AESTHETICS USE IMPAIRMENT CAUSES AND SOURCES
Indicator for
Aesthetics Use
Assessment
Impaired Decision
Aesthetically objectionable
conditions frequently observed
(e.g., blooms, scums, water odors,
discoloration, taste, visual turbidity
highly cloudy/murky, excess algal
growth (>40% filamentous cover
in rivers, nuisance growths >25%
dense/very dense macrophytes or
blooms in lakes), Secchi disk
transparency < 4 feet at least
twice during survey season.)
Cause(s)
Excess Algal Growth
Debris/Floatables/Trash
Foam/Flocs/Scum/Oil Slicks
Turbidity
Total Suspended Solids
Nutrient/Eutrophication Biological
Indicators
Organic Enrichment (Sewage)
Biological Indicators
Secchi disk transparency
Taste and Odor
Color
Oil and Grease
Sedimentation/Siltation
Massachusetts Consolidated Assessment and Listing Methodology 2012 Guidance Manual
Typical Source(s) of
Impairment
Municipal Point Source
Discharges
Unspecified Urban Stormwater
Municipal (Urbanized High
Density Area)
Combined Sewer Overflows
Internal Nutrient Recycling
Discharges from Municipal
Separate Storm Sewer
Systems (MS4)
Introduction of Non-native
Organisms (Accidental or
Intentional)
Source Unknown
Page A7


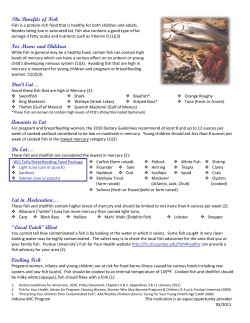

© Copyright 2026