
Statistics Guide for Research Grant Applicants
[Updated 2012]
Statistics Guide for Research Grant
Applicants
Authors (in alphabetical order)
Bland JM, Butland BK, Peacock JL, Poloniecki J, Reid F, Sedgwick P
Department of Public Health Sciences
St George's Hospital Medical School
Cranmer Terrace
London SW17 0RE
This handbook was funded by the South East Regional Office (SERO)
Research and Knowledge Management Directorate and is targeted at
those applying for research funding, from any source.
Table of Contents
Preface
Background
Content
Using the handbook
Statistical review
Development
A Describing the study design
Introduction
A-1.........................................................Type of study
A-1.1......................................................Type of study: Observational or experimental
A-1.2......................................................Combinations and sequences of studies
A-1.3......................................................Cohort studies
A-1.4......................................................Case-control studies
A-1.5......................................................Cross-sectional studies
A-1.5a....................................................Prevalence studies
A-1.5b....................................................The estimation of sensitivity and specificity
A-1.5c....................................................When to calculate sensitivity and specificity
A-1.5d....................................................Cross-sectional ecological studies
A-1.5e....................................................Studies of measurement validity, reliability and
agreement
A-1.6......................................................Confounding
A-1.6a....................................................Confounding or interaction
A-1.7......................................................Experiments and trials
A-1.8......................................................Randomised controlled clinical trials
A-1.9......................................................Pilot and Exploratory Studies
A-2.........................................................Follow-up
A-3.........................................................Study subjects
A-4.........................................................Types of variables
A-4.1......................................................Scales of measurement
A-4.2......................................................Types of data
A-4.3......................................................Methods of data collection
A-4.4......................................................Validity and reliability
A-4.4a....................................................Validity
A-4.4b....................................................Repeatability (test-re-test reliability)
A-4.4c....................................................Inter-rater reliability (inter-rater agreement)
B Clinical trials
B-1.........................................................Describing the patient group / eligibility criteria
B-2.........................................................Describing the intervention (s) / treatment (s)
B-3.........................................................Choice of control treatment / need for control
group
B-4.........................................................Blindness
B-4.1......................................................Double blind and single blind designs
B-4.2......................................................Placebos
B-5.........................................................Randomisation
B-5.1......................................................What is randomisation?
B-5.2......................................................When might we use randomisation?
B-5.3......................................................Why randomise?
B-5.4......................................................What is not randomisation?
B-5.5......................................................How do we randomise?
2
B-5.6......................................................Randomisation in blocks
B-5.7......................................................Randomisation in strata
B-5.8......................................................Minimisation
B-5.9......................................................Clusters
B-5.10....................................................Trial designs
B-5.10a..................................................Parallel groups
B-5.10b..................................................Crossover design
B-5.10c..................................................Within group comparisons
B-5.10d..................................................Sequential design
B-5.10e..................................................Factorial design
B-6.........................................................Outcome variables
B-7.........................................................Data monitoring
B-7.1......................................................Data monitoring committee
B-7.2......................................................When should a trial be stopped early?
B-8.........................................................Informed consent
B-8.1......................................................Consent
B-8.2......................................................Emergencies
B-8.3......................................................Children
B-8.4......................................................Mentally incompetent subjects
B-8.5......................................................Cluster randomised designs
B-8.6......................................................Randomised consent designs
B-9.........................................................Protocol violation and non-compliance
B-10.......................................................Achieving the sample size
B-11.......................................................After the trial is over
C Observational studies
C-1.........................................................Case-control studies
C-1.1......................................................Choice of control group in case-control studies
C-1.2......................................................Matching in case-control studies
C-2.........................................................Assessment bias
C-3.........................................................Recall bias
C-4.........................................................Sample survey: selecting a representative sample
C-5.........................................................Generalisability and extrapolation of results
C-6.........................................................Maximising response rates to questionnaire
surveys
D Sample size calculation
D-1.........................................................When should sample size calculations be
provided?
D-2.........................................................Why is it important to consider sample size?
D-3.........................................................Information required to calculate a sample size
D-4.........................................................Explanation of statistical terms
D-4.1......................................................Null and alternative hypothesis
D-4.2......................................................Probability value (p-value)
D-4.3......................................................Significance level
D-4.4......................................................Power
D-4.5......................................................Effect size of clinical importance
D-4.6......................................................One-sided and two-sided tests of significance
D-5.........................................................Which variables should be included in the sample
size calculation?
D-6.........................................................Allowing for response rates and other losses to
the sample
D-7.........................................................Consistency with study aims and statistical
analysis
3
D-8.........................................................Three specific examples of sample size
calculations & statements
D-8.1......................................................Estimating a single proportion
D-8.2......................................................Comparing two proportions
D-8.3......................................................Comparing two means
D-9.........................................................Sample size statements likely to be rejected
E Describing the statistical methods
E-1.........................................................Introduction
E-1.1......................................................Terminology
E-1.2......................................................Level of detail required
E-2.........................................................Is the proposed method appropriate for the data?
E-2.1......................................................'Ordinal' scores
E-3.........................................................Paired and unpaired comparison
E-4.........................................................Assumptions
E-4.1......................................................Transformations
E-5.........................................................Adjustment for confounding
E-6.........................................................Hierarchical or multilevel data?
E-6.1......................................................Analysing hierarchical data
E-7.........................................................Multiple testing
E-7.1......................................................Multiple testing: when does it arise?
E-7.2......................................................Multiple testing: why is it a problem?
E-7.3......................................................The Bonferroni correction
E-7.4......................................................How to deal with multiple testing
E-7.4a....................................................More than one outcome measurement in a
clinical trial
E-7.4b....................................................More than one predictor measurement in an
observational study
E-7.4c....................................................Measurements repeated over time (serial
measurements)
E-7.4d....................................................Comparisons of more than two groups
E-7.4e....................................................Testing the study hypothesis within subgroups
E-7.4f.....................................................Repeatedly testing the difference in a study as
more patients are recruited
E-8.........................................................Change over time (regression towards the mean)
E-9.........................................................Intention to treat in clinical trials
E-10.......................................................Cluster randomised trials
E-11.......................................................Collapsing variables
E-12.......................................................Estimation and confidence intervals
E-12.1....................................................Proportions close to 1 or zero
F General
F-1.........................................................Statistical expertise (statistical analysis)
F-2.........................................................Statistical software
F-3.........................................................Ethics
F-3.1......................................................The misuse of statistics
F-3.2......................................................Critical appraisal
F-3.3......................................................Studies involving human subjects
F-4.........................................................Other research issues
F-4.1......................................................Research governance
F-4.2......................................................Data protection
References
4
Appendix
1. Check list
2. Directory of randomisation software and services
(http://martinbland.co.uk/guide/randsery.htm)
5
Preface
Background
The aim of this handbook is to help applicants to appreciate some of the statistical pitfalls
that await them when constructing a grant proposal. It was written by the following six
statisticians based at St George's Hospital Medical School:
Martin Bland PhD - Professor of Medical Statistics
Barbara Butland MSc - Lecturer in Medical Statistics
Janet Peacock PhD - Senior Lecturer in Medical Statistics
Jan Poloniecki DPhil - Senior Lecturer in Medical Statistics
Fiona Reid MSc - Lecturer in Medical Statistics
Philip Sedgwick PhD - Lecturer in Medical Statistics
(Martin Bland is now Prof. of Health Statistics, University of York, and Janet Peacock is
Prof. of Medical Statistics, University of Southampton.)
All six authors routinely reviewed grant proposals for The South East Research and
Development Project Grant Scheme. This was a responsive funding scheme for the
South East Regional Office which ran for a number of years until it ended in October 2001.
The scheme was responsible for spending of approximately £1.2 million each year on new
and ongoing projects, all based on researchers’ own ideas. Its primary objective was the
production of new, high quality knowledge. It was open to anyone whose work was
relevant to the UK National Health Service (NHS). Up to 150,000 pounds was available
for each project, although the majority were smaller. The criteria stipulated that
applications were to be relevant to the NHS, to follow a clear, well defined protocol, would
withstand external peer review and that the findings would be generalisable to others in
the NHS. Although academic advice was available to applicants through Research and
Development Support Units (RDSU) in the Region and detailed guidance notes
accompanied the application form, a number of common statistical problems consistently
emerged. It is hoped that in summarising these statistical weak points the handbook will
be of use to those applying for research funding from any source and in the long term
reduce the number of proposals that are rejected by grant giving bodies purely on
statistical grounds. The handbook was commissioned and initially funded by the South
East Regional Office (SERO) Research and Knowledge Management Office Directorate
who provided comments and encouragement throughout the writing process. In this
respect the authors would particularly like to extend their thanks to John Newton and
Lesley Elliott.
Content
The process of constructing the handbook began with a pilot exercise. All six authors
retrieved their reviews for the last year to two years noting down recurring comments.
Based on the results of the pilot work a list of topics was drawn up to form the main
skeleton of the handbook. A few additional topics have since been added at the
suggestion of Colin Cryer (South East Institute of Public Health) a fellow statistical
reviewer for The Project Grant Scheme and Lyn Fletcher (Statistician, Oxford Research
and Development Support Unit).
Using the handbook
The handbook is not designed to teach statistics but to provide extra information to those
who already have a basic statistical knowledge. For example it assumes some
understanding of confidence intervals and significance testing but not statistical power or
sample size calculation. To help the beginner there are references to standard Medical
Statistics Textbooks. However, the handbook should not be viewed as an alternative to
discussing your proposal with a statistician prior to submission. Such a discussion is
6
strongly recommended. Rather, it is hoped that the handbook will make grant applicants
more aware of the right questions to ask and the right information to take along to a
statistical consultation and in addition, help them to understand any advice given. [Please
note that although the authors would welcome any comments on the content of the
guide, particularly correction of errors, they cannot give advice on projects]
It is not envisaged that the handbook should be read from cover to cover but rather that
the contents list or the checklist (Appendix 2) should be used to help the applicant
navigate through the book ignoring sections that have no bearing on their own research.
To facilitate this type of use the text is organised into many short reasonably selfcontained paragraphs, each with its own index code e.g. A-1.1. It is hoped that these
codes will be useful to reviewers, consulting statisticians and researchers alike. Each
paragraph may contain links to other related paragraphs as well as to useful references in
the literature and on the Web. The handbook is best suited to interactive use on the Web
although it may also be used effectively in printed form.
Statistical review
Another aim of the handbook is to try and clarify the sort of checklist that a statistician
might use in the process of reviewing a grant proposal. Most statisticians will not rigidly
follow any such list but the sort of things that they will be trying to extract from the text of
any grant proposal are as follows (this list is not exhaustive):
a) the basic study design(s) to see whether the applicant needs to have included
information on randomisation, confounding, hierarchical data etc and whether the design
is appropriate to the study aims.
b) the type of data the study will generate as without this information the statistician
cannot assess whether the applicant’s sample size calculation and proposed methods of
statistical analysis are appropriate.
c)the number of subjects that will be asked to take part in the study and the number it is
anticipated will be recruited as the figure from the sample size calculation should match
the latter and not the former.
d)the total number of outcome variables that the applicant plans to measure as this will
highlight potential problems in terms of multiple testing.
d)whether the sample size calculation and the proposed statistical analysis are based on
the same statistical tests. The applicant should therefore mention when reporting the
sample size calculation(s) the test(s) on which it is based.
e)whether the proposed statistical analysis includes the calculation of confidence intervals
as well as significance testing.
f)whether the applicants have the required statistical expertise for their proposed statistical
analysis.
g)sufficient information to replicate and so check the applicant’s sample size calculation.
Development
The handbook should be considered as a work in progress and the authors would
welcome any comments on the content of the guide, particularly correction of errors.
7
A. Describing the study design.
Introduction
A-1
Type of study
A-1.1 Type of study: Observational or experimental
A-1.2 Combinations and sequences of studies
A-1.3 Cohort studies
A-1.4 Case-control studies
A-1.5 Cross-sectional studies
A-1.5a Prevalence studies
A-1.5b The estimation of sensitivity and specificity
A-1.5c When to calculate sensitivity and specificity
A-1.5d Cross-sectional ecological studies
A-1.5e Studies of measurement validity, reliability and agreement
A-1.6 Confounding
A-1.6a Confounding or interaction
A-1.7 Experiments and trials
A-1.8 Randomised controlled clinical trials
A-1.9 Pilot and exploratory studies
A-2
A-3
Follow-up
Study subjects
A-4
A-4.1
A-4.2
A-4.3
A-4.4
A-4.4a
A-4.4b
A-4.4c
Types of variables
Scales of measurement
Types of data
Methods of data collection
Validity and reliability
Validity
Repeatability (test-re-test reliability)
Inter-rater reliability (inter-rater agreement)
Introduction
The section of an application, which is called Plan of Investigation (sometimes called
Subjects & Methods), is where applicants describe what they propose to do. The purpose
of the investigation and the background are described elsewhere, and presumably
establish that the research or development is a worthwhile idea in a deserving cause.
Here, however, the application needs to provide details of their proposed methods and
establish that the practical issues have been thought through. The reviewers want to know
that the study is both methodologically sound and feasible, and that the applicants are
capable of doing it (see F-1). Failure to discuss relevant practicalities will reduce the
plausibility of the proposal.
The precise topics that should be covered depend on the type of study. So it makes sense
to provide fairly early on an overall description of the study or experiment, preferably using
some standard terms for study design. This is one area where there is no need to be wary
of jargon, since all reviewers will be familiar with, and looking for an indication that the
study is a cross-sectional study, cohort study, double-blind randomised controlled trial, or
whatever.
8
A-1 Type of study
A-1.1 Type of Study: Observational or experimental
The most obvious distinction that can be made between studies is whether they are
experimental or observational. Experimental studies are what their name suggests,
experiments. They are studies in which the applicant has some control over the
experimental conditions and the way in which groups of subjects for comparison are
constructed. They also involve some sort of treatment or other intervention. Observational
studies on the other hand are studies in which subjects are observed in their natural state.
The groups of subjects that are compared are self-selected e.g. manual workers versus
non-manual workers or subjects with and without disease. Subjects may be measured and
tested (e.g. total cholesterol measured, disease status ascertained) but there is no
intervention or treatment (e.g. patients allocated to different exercise programs, patients
allocated to new drug or placebo). Observational studies include cohort studies, casecontrol studies, ecological studies, cross-sectional studies, prevalence studies and studies
of sensitivity and specificity.
To illustrate the difference we will consider the following scenario:
Scenario A-1.1:
One grant proposal containing in effect three different studies, two
observational and one experimental. The applicants are interested in the aetiology and
treatment of a disease affecting the knee. Briefly they plan to:
a) Compare leg measurements between subjects with and without disease
(Observational)
b) Compare leg measurements between the symptomatic and asymptomatic leg of
diseased individuals (Observational)
c) Randomly allocate subjects with disease to treatment or no treatment and compare
change in leg measurements over a period of 6 months between the two groups
(Experimental)
For further information on types of study see Bland (2000), Altman (1991) p74-106, and
also sections B and C of this handbook.
A-1.2 Combinations and sequences of studies
Sometimes the proposed research and development is a programme consisting of a
sequence or combination of overlapping studies with different study designs. Efficiencies
in time and cost can be achieved in this way. To keep the plan of investigation clear, it will
help if the design of the various studies can be separately described using in each case
the appropriate jargon for study design. This can be quite hard to do in some cases. The
promised savings have to be weighed against the decreased likelihood of success from
added complexity. The applicant should give careful thought to whether his powers of
description can make a complex programme seem simple. If not, there may be a better
chance of a simpler study with intermediate objective being funded - on the grounds that
the study is clearly feasible - rather than a programme of studies that is in principal more
resource efficient, but less clearly feasible.
A-1.3 Cohort studies
In a cohort study a population of subjects is identified by a common link (e.g. living in the
same geographical area, working in the same factory, attending the same clinic) and
information collected on the study subjects concerning exposure to possible causative
factors. The population is then followed forward in time to see whether they develop the
outcomes of interest. Cohort studies often occur where the exposures are potential risk
factors for disease (e.g. smoking, high blood pressure) and the outcomes are the
9
development of those diseases (e.g. lung cancer, IHD). For further information on cohort
studies see Breslow & Day (1987).
A-1.4 Case-control studies
A case-control study is one in which all the subjects with a given disease (or condition) in
a given population (or a representative sample) are identified and are compared to a
control group of subjects without the disease (or condition). They are compared in terms
of information on potential risk factors, which is collected retrospectively. One of the
problems inherent in case-control studies is how to select a comparable control group
(see C-1.1). For example you might choose to take a random sample of those without
disease from the population which gave rise to the cases. However, this assumes that a
list of subjects in the population (i.e. a sampling frame) exists. Sometimes one or more
controls are matched to each case so that cases and controls are comparable in terms of
variables such as age and sex. The variables used for matching are those that might
influence the disease, provided they are not part of the pathway by which the risk factors
under study are thought to influence the disease. However the use of matching tends to
complicate the subsequent statistical analysis (see C-1.2, E-5). Another problem inherent
in case-control studies is bias due to the retrospective nature of the risk factor information
(see C-2 and C-3). These issues and more are discussed in Breslow & Day (1980).
A-1.5 Cross-sectional studies
A cross-sectional study occurs where a population or sample of subjects is studied at a
single point in time e.g. the 2001 census. A sample survey is an example of a crosssectional study. One problem with a cross-sectional study is that it tells you little about the
order of events e.g. which came first, disease or exposure? Special types of crosssectional study include prevalence studies (see A-1.5a), cross-sectional ecological studies
(see A-1.5d) and studies of sensitivity and specificity (see A-1.5b, A-1.5c). For further
information see Altman (1991) p99-101.
A-1.5a Prevalence studies
A prevalence study is designed to estimate the prevalence of a particular disease /
condition / characteristic in a population of interest. Prevalence studies are sample
surveys where the primary aim is estimation. Clearly of major importance in this type of
study is obtaining a sample which is representative of the population of interest (see C-4
and C-5) and in making sure that results are not biased by a poor response rate (see C-6).
A-1.5b The estimation of sensitivity and specificity
These studies often arise when the aim is to evaluate the usefulness of a new screening
technique. It is often the case that a new ELISA assay has been produced to detect
disease and the applicants wish to compare the accuracy of this often quicker method of
ascertainment with that of cell culture (i.e. the 'gold standard'). Two groups are selected;
those with and without disease according to cell culture. The subjects are then tested
using the ELISA assay to determine which are test positive and test negative. Sensitivity
and specificity are then calculated as the proportion of those with disease that test positive
and the proportion of those without disease that test negative respectively. These studies
often require more subjects with disease than the applicant envisages (see section on
sample size calculation) and the need to do the ELISA test 'blind' to the results of cell
culture is often overlooked.
A-1.5c When to calculate sensitivity and specificity
If the diagnostic or screening test being assessed is intended to become the first available
prospective screening tool then determining the sensitivity and specificity against a gold
standard will be a constructive contribution. On the other hand, if the test is a candidate to
replace an established test, then both of these tests should be compared against the gold
10
standard. The new test will be preferable if both sensitivity and specificity turn out to be
superior to those of the established test. If one could be larger and the other smaller
(either as estimated or within confidence interval), it is then necessary to weigh the costs
(financial and other) of false positives and false negatives, before there is the basis for a
practical recommendation to adopt the new test.
It is sometimes important to calculate the positive predictive value (PPV) as well as
sensitivity and specificity. If the objective of a test is to identify a high risk group for whom
special and rather "expensive" treatment will be offered, i.e. high cost to supplier or
substantial downside to recipient, while the test negative group would continue to be
offered the standard treatment, then the positive predictive value (PPV) is more relevant.
This is the proportion of people testing positive, who are actually positive. If the PPV is
low, then a substantial number of false positives may be unnecessarily worried by a
potential diagnosis, or given expensive, unpleasant or time-consuming treatment they do
not need. There is a tendency for the PPV to be low when the prevalence of the condition
is low in the population being screened.
A-1.5d Cross-sectional ecological studies
A cross-sectional ecological study is one in which we are looking at correlations between
variables measured at a level higher than the one on which we want to make conclusions.
For example investigating the relationship between leukaemia and radon by correlating
the rate of leukaemia registration per million per year for several countries with their
estimated average level of radon exposure over the same period (Henshaw et al. 1990)
i.e. the unit of analysis is the country and not the individual. This type of study is
particularly prone to the effects of confounding (see A-1.6 and Lilienfeld & Lilienfeld 1980
p13-15).
A-1.5e Studies of measurement validity, reliability and agreement
Some studies investigate the properties of measurement methods. This can include
numerical measurements such as blood pressure, categorical observations such as health
status, and questionnaire based measurement scales such as those for anxiety. A study
of validity investigates the extent to which the measurement measures what we want it to
measure (Bland & Altman 2002). Here the issues are whether there is a genuine gold
standard or criterion by which the measurement method can be judged and if not how
validity can be investigated. Reliability concerns the extent to which repeated
measurements by the same method on the same subject produce the same result (Bland
& Altman 1996, 1996a, 1996b). These may be by the same observer or different
observers (observer variation) and may investigate reliability over time or the effect on
measurements of different parts of the measurement process. Particularly important here
are the selection of measurement subjects and the number and selection of observers. A
third type of study is of agreement between two methods of measuring the same quantity.
Here we are concerned with whether we can replace measurements by one method with
measurements using another method (Bland & Altman 1986). Several topics related to
the design and analysis of such studies are discussed by Bland
(http://martinbland.co.uk/meas/meas.htm).
A-1.6 Confounding
There are many drawbacks associated with the different types of observational study but
one that they all share is the potential for spurious associations to be detected or real
associations masked due to the effects of confounding factors. Confounders are generally
variables that are causally associated with the outcome variable under investigation and
non-causally associated with the explanatory variable of interest. Thus an observed
association between disease and a potential risk factor may simply be due to that factor
acting as a marker for one or more real causes of disease. That is why you cannot
11
conclude causality from an observational study. Confounding arises because in
observational studies we are not always comparing 'comparable' groups. For more
information see Breslow & Day (1980) p93-108.
A-1.6a Confounding or interaction
The term confounding (see A-1.6) should not be confused with interaction. An interaction
occurs if the nature (i.e. magnitude and direction) of the association between two variables
differs dependent on the value of some third variable. For example, the association
observed between gender and current asthma may differ with age since asthma tends to
be more common among males than females in childhood but not in later life (Burr 1993).
We say that there is an interaction with age. In general we are interested in describing
such interactions. A confounding variable by contrast, is a nuisance variable. In adjusting
for or designing out a confounding variable we assume that it does not influence the
association that it confounds. In other words, for any given value of the confounding
variable we assume that the magnitude and direction of the association of interest is the
same.
A-1.7 Experiments and trials
Experimental studies where the aim is to evaluate the effectiveness of a new treatment or
intervention are referred to as trials. If the study subjects are human with the same
medical condition the term clinical trial can be used (Pocock 1983). However, whether the
study 'subjects' are humans, mice or even administrative groups (e.g. general practices,
clinics) the same design considerations apply (see A-1.8 and Section B).
In trials (e.g. clinical trials) we have the ability to manipulate the situation to ensure that
groups are comparable. Uncontrolled trials i.e. those with a single treatment group and no
other group to act as a control are to be avoided. Without a comparison group there is no
way of knowing whether an overall improvement in outcome is due to the new treatment
or would have happened anyway in the absence of the new treatment. A further
discussion of why trials should be controlled and why subjects should be randomly
allocated to groups is given in A-1.8, B-3, B-5 and in Pocock (1983). For information on
cross over trials and other similar designs see B-5.10.
A-1.8 Randomised controlled trials
Randomised controlled trials are designed to compare different treatments or
interventions. Subjects are randomly allocated to groups so that groups are comparable at
the beginning of the study in terms of their distribution of potential confounding factors e.g.
age and sex (see B-5). The treatments/interventions are then administered and the
outcomes compared at the end of the follow-up period. There may be two groups or
several groups. There may be one treatment group and one control group, or two
treatment groups, or two treatment groups and 1 control group etc. The control group may
receive a placebo treatment to aid blinding of treatment allocation from both the study
subjects and those assessing outcome; although it may be considered unethical to have a
control group receiving placebo, or an untreated control group, if a proven treatment is
already in standard use (Rothman 2000 et al., F-3.3). If both the assessor and study
subject are blind to allocation then this is known as double-blind. Single-blind means that
one of the parties (i.e. study subject or assessor) is privilege to information on allocation
(see B-4). In Scenario A-1.1 (c) there is one intervention group and one control group.
Since the intervention group consists of some sort of training for which a placebo is not
easily constructed, the patient will be aware of the treatment allocation. However, the
person making the leg measurements can be kept in the dark provided they are not told
accidentally by the patient; a possibility which could be reduced by telling the patient to
keep that information quiet.
12
A-1.9 Pilot and exploratory studies
The term "pilot study" is often misused. A pilot is someone or something which leads the
way. A pilot study tests on a small scale something which will be used on a larger scale in
a larger study. Hence a pilot study cannot exist on its own, but only in relation to a larger
study. The aim of the pilot study is to facilitate the larger study; it is not a study in its own
right. Pilot studies may be used to test data collection methods, collect information for
sample size calculations, etc.
A pilot study should always have a main study to which it leads. This does not mean that
funding cannot be sought for a genuine pilot study apart from the main study for which it
leads. It may be that full funding cannot be sought until some pilot information is obtained,
perhaps relating to sample size or feasibility of data collection.
A pilot study does not mean a study which is too small to produce a clear answer to the
question. Funding organisations are unlikely to fund such studies, and rightly so. They
are poor research, conducted for the benefit of the researcher rather than society at large
(which pays for the grant).
Not all small studies are unjustified. It may sometimes be that an idea is at too preliminary
a stage for a full-scale definitive study. Perhaps a definitive study would require a multicentre investigation with many collaborators and it would be impossible to recruit them
without some preliminary findings. It may be that where no study has ever been done,
there may be insufficient information to design a definitive study. A smaller study must be
done to show that the idea is worth developing. What should we call such a study? A
pilot leads the way for others, someone who boldly goes where no-one has gone before is
an explorer. We need to explore the territory. Such a study is an exploratory study, rather
than a pilot, because we do not at this stage know what the definitive study would look
like.
A-2 Follow-up
Many studies including most cohort studies and randomised controlled trials are
prospective i.e. they have a period of follow-up. Surprisingly the length of proposed followup is often a piece of information that grant applicants leave out of their proposal. It may
be stated that measurements will be repeated every 3 months but without information on
the total length of follow-up, this tells us nothing about the number of measurements made
per patient. Information on length of follow-up is often crucial in assessing the viability of a
project. For example, let us suppose that when describing a proposed randomised
controlled trial of a treatment for a particular cancer, an 80% recurrence rate is assumed
for the untreated group and this figure is used in the sample size calculation (see D-8.2). If
the figure of 80% relates to recurrence over 5 years the calculation will yield the
appropriate sample size for a 5-year study. However, if the proposed length of follow-up is
only 2 years the resulting study will be hopelessly under-powered. Length of follow-up is
also important in trials where the effects of the intervention such as an educational
intervention, are likely to wear off over time. In this situation, assessing outcome only in
the immediate post-intervention period will not be very informative.
A-3 Study subjects
It is important to know where the study subjects come from and whether they are an
appropriate group to study to address the research question of interest. For example if a
disease is most prevalent in the young why is the study based on the middle aged? It is of
interest to know how the study subjects will be selected. For example are they a random
sample from some larger population or are they all patients attending a clinic between
certain dates? It is also important to specify any exclusion/inclusion criteria. The
applicants should also state how many subjects will be asked to participate and how many
13
are expected to agree. Remember, the sample size is the number that agree to participate
and not the number that are approached.
A-4 Types of variables
It is important to describe both the outcome and explanatory variables that will be
investigated in the proposed study by specifying the type of data and the scale of
measurement (see A-4.1, A-4.2 and Bland 2000). It is this sort of information that will help
determine the nature of any statistical analysis as well as the appropriate method of
sample size calculation.
A-4.1 Scales of measurement
i) Interval scale: data have a natural order and the interval between values has
meaning e.g. weight, height, number of children
ii) Ordinal scale: data have natural order but the interval between values does not
necessarily have meaning e.g. many psychological scores.
iii) Nominal scale: categorical data where the categories do not have any natural
order e.g. gender (male / female)
A-4.2 Types of data
Quantitative data: data measured on an interval scale
i) Continuous data: variable can take all possible values in a given range e.g.
weight, height
ii) Discrete data: variable can take only a finite number of values in a given range
e.g. number of children
Qualitative data: Categories, which may or may not have a natural, order (i.e.
measurements on nominal and ordinal scales)
A-4.3 Methods of data collection.
The quality of a study depends to a large extent on the quality of its data. The reviewer is
therefore interested in how the applicants plan to collect their information. If they propose to
use a questionnaire, how will the questionnaire be administered, by post (or otherwise
delivered for self-completion) or by interview? The use of an interviewer may aid the
completeness of data collection but bias may be introduced in some studies if the interviewer
is not appropriately blinded e.g. to case / control status in a case-control study (see C-2) or
treatment group in a clinical trial (see B-4). If the applicants propose to extract information
from records e.g. GP notes or hospital notes, how will this be done, by hand or by searching
databases or both? Again bias may arise if the extractor is not appropriately blinded (see C2). The applicants also need to ask themselves whether the mode of collection chosen will
yield sufficiently complete and accurate information. For example, by searching GP
databases you are unlikely to pick up complete information on casualty attendance. A single
blow into a spirometer does not produce a very reliable (see A-4.4b) assessment of lung
function and most studies use the maximum from 3 consecutive blows.
A-4.4 Validity and reliability.
Where possible information should be provided on the validity and reliability of proposed
methods of measurement. This is particularly important if a method is relatively new or is not
in common usage outside the applicant's particular discipline. For further information see A4.4a, A-4.4b, A-4.4c, Altman (1991) and Bland (2000).
A-4.4a Validity
By validity we mean does the method actually measure what the applicant assumes? For
example does a questionnaire designed to measure self-efficacy (i.e. belief in ones ability to
cope) on some ordinal scale actually measure self-efficacy? Even if validity has been
demonstrated previously, has it been demonstrated in an appropriate setting? For example a
14
method which has been validated for use among adults may not be valid if used among
children and validity does not always cross countries. Sometimes applicants reference a
questionnaire score that has been previously validated but they plan to use a modified
version. Of interest to the reviewer is whether these modifications have affected validity. This
may well be the case if the number of questions used to produce the score have been
reduced for ease of administration. For further information see Bland & Altman (2002).
A-4.4b Repeatability (test-retest reliability)
By repeatability we mean how accurately does a single measurement on a subject estimate
the average (or underlying) value for that subject? The repeatability of a measurement
therefore depends on the within-subject standard deviation, which can be calculated using a
sample of closely repeated (in time) measurements on the same subjects. The repeatability
coefficient is simply the within-subject standard deviation multiplied by 2.83 and is an
estimate of the maximum difference likely to occur between two successive measurements
on the same subject (see Bland & Altman 1986, 1996, 1996a and 1996b).
A-4.4c Inter-rater reliability (inter-rater agreement)
For methods of measurement in which the role of an observer is key, inter-rater reliability
should also be considered (Altman 1991 p403-409). In other words what sort of differences
in measurement are likely where you have the same subject measured by different
observers/raters? How closely do they agree? Substantial and unacceptable biases can
arise in a study if the same observer is not used throughout. Sometimes, however, the use of
more than one observer is the only practical option as for example in multi-centre clinical
trials. In such cases it is important to:
• try and improve agreement between observers (e.g. by training)
• use the same observer when making 'before' and 'after' measurements on the same
subject.
• in a clinical trial, to balance groups with respect to assessor and to make all assessments
blind (see Pocock, 1983 p45-48).
• in an observational study, to note down the observer used for each subject so that
observer can be adjusted for as a potential confounder in the analysis.
15
B. Clinical Trials
B-1
B-2
B-3
Describing the patient group / eligibility criteria
Describing the intervention (s) / treatment (s)
Choice of control treatment / need for control group
B-4
B-4.1
B-4.2
Blindness
Double blind and single blind designs
Placebos
B-5
B-5.1
B-5.2
B-5.3
B-5.4
B-5.5
B-5.6
B-5.7
B-5.8
B-5.9
B-5.10
B-5.10a
B-5.10b
B-5.10c
B-5.10d
B-5.10e
Randomisation
What is randomisation?
When might we use randomisation?
Why randomise?
What is not randomisation?
How do we randomise?
Randomisation in blocks
Randomisation in strata
Minimisation
Clusters
Trial designs
Parallel groups
Crossover design
Within group comparisons
Sequential design
Factorial design
B-6
Outcome variables
B-7
B-7.1
B-7.2
Data monitoring
Data monitoring committee
When should a trial be stopped early?
B-8
B-8.1
B-8.2
B-8.3
B-8.4
B-8.5
B-8.6
Informed consent
Consent
Emergencies
Children
Mentally incompetent subjects
Cluster randomised designs
Randomised consent designs
B-9
B-10
B-11
Protocol violation and non-compliance
Achieving the sample size
After the trial is over
Worth reading several times:
The CONSORT statement: a set of recommendations for improving the quality of reports
of parallel group randomized trials (http://www.consort-statement.org).
16
B-1 Describing the patient group and eligibility criteria
The proposal should contain a clear statement as to what patient group is to be treated in the
trial. For example, in a hypertension trial we should specify the range within which patients'
blood pressures should lie. This can take the form of a list of inclusion and exclusion criteria.
For example, in a trial of a low sodium, high potassium, high magnesium salt in older
subjects with mild to moderate hypertension subjects were recruited from a population based
cohort of non-hospitalised older inhabitants of a suburb of Rotterdam (Geleijnse et al. 1994).
All subjects had their blood pressure measured between 1990 and 1992. Men and women
aged 55-75 with a blood pressure above 140 mm Hg systolic or 85 mm Hg diastolic without
antihypertensive treatment (n=419) were invited by letter and telephone for re-measurement
of blood pressure. To be eligible for the trial subjects' systolic blood pressure had to be
between 140 and 200 mm Hg or diastolic pressure between 85 and 110 mm Hg at two
measurements one week apart. In addition, systolic blood pressure had to be not below 130
mm Hg and diastolic pressure not below 70 mm Hg.
Thus the inclusion criteria were:
•
•
•
•
•
Member of the Rotterdam cohort
Aged 55-75
Untreated BP above 140 mm Hg systolic or 85 mm Hg diastolic
Current BP between 140 and 200 mm Hg systolic or between 85 and 110 mm Hg
diastolic at two measurements one week apart.
Systolic pressure not below 130 mm Hg and diastolic pressure not below 70 mm Hg.
The exclusion criteria were:
•
•
•
•
•
History of myocardial infarction
Angina pectoris
Diabetes mellitus
Impaired renal function (serum creatinine concentration >200 mumol/l)
Eating a salt restricted diet on medical advice
Ethics committees often want to know about what provision will be made for non-Englishspeakers. Simply excluding them, while it makes things easy for the researcher, may not be
considered acceptable. If we can treat people, we can recruit them to clinical trials of those
treatments.
B-2 Describing the intervention(s) and treatments
It may appear self-evident, but it is important to describe the treatment to be tested clearly.
Remember that not all those reading your proposal will be clinically qualified, including
statisticians. The treatment description must be comprehensible by all. The nature of the
treatment may have implications for the trial design, for example for blinding (see B-4), which
may not be obvious to those outside your field. You are very close to the subject. You
should get someone completely outside the area to read your proposal for you.
B-3 Choice of control treatment and need for a control group
The essence of a trial or experiment is that we carry out a treatment and observe the result.
If we are not applying some form of intervention, it is not a trial but an observational study.
(see A-1.1) In a clinical trial we are concerned with a treatment to modify a disease process
in some way. This can be a medical or surgical treatment, or it might be a less direct
intervention, such as supplying treatment guidelines to GPs or carrying out a health
education programme.
17
To see whether a treatment has an effect, we usually need a control group. (This is not
always the case. No control group was used for the first administration of penicillin. The
effect was unlike anything ever seen before. Control was provided by general experience of
past cases. Controlled trials were carried out later when penicillin was applied to more minor
conditions, where the consequences of the infection were not so severe (Pocock 1983).
However, such revolutions are very rare and most advances are small. We cannot tell
whether a new treatment is effective from a single patient and the difference the treatment
makes may not be large.) We need to compare patients given the new treatment with a
group of patients who do not receive the new treatment. The latter are known as a control
group.
We need to have a control group which is comparable in all respects to the group of subjects
receiving the new treatment: in the same place at the same time with the same distribution of
disease severity and prognosis, and receiving the same care apart from the treatment of
interest. The most reliable way to do this is by random allocation (see B-5.1, B-5.5) or
minimisation (see B-5.8). Other methods, such as alternate allocation, should be avoided
(see B-5.4) and would need a strong justification in the proposal, as would methods which do
not meet all these criteria, such as patients seen at a different time or in a different place (see
B-5.4).
If we want to do a trial, we usually have a clear idea of what the treatment is which we wish
to test. The proposal must explain what this is and why we think it might work, but there is
rarely much problem in deciding what the treatment is to be. What treatment the control
group will receive may be more debatable. Should the control group receive a treatment at
all? If there is no current treatment available, then this question is easily answered: the
control group will be untreated, although we may need to apply a dummy treatment to
maintain the blindness (see B-4.2). Sometimes a new treatment is given in addition to an
existing treatment, the control group may then receive the existing treatment, with a suitable
dummy for the new treatment where appropriate. If there is an available treatment, the
current Declaration of Helsinki (http://www.wma.net/e/policy/b3.htm) says that:
“The benefits, risks, burdens and effectiveness of a new intervention must be tested
against those of the best current proven intervention, except in the following
circumstances:
• The use of placebo, or no treatment, is acceptable in studies where no current
proven intervention exists; or
• Where for compelling and scientifically sound methodological reasons the use of
placebo is necessary to determine the efficacy or safety of an intervention and the
patients who receive placebo or no treatment will not be subject to any risk of
serious or irreversible harm. Extreme care must be taken to avoid abuse of this
option.”
The exceptions were added following protests from researchers who want to do trials
where the best existing therapy is too expensive, specifically in HIV research in Africa
(Ferriman 2001) and from pharmaceutical researchers and drug regulators. (Tollman et al
2001). This did not appear satisfactory to some critics (Bland 2002a, Bland 2002b). Any
such trial will need a strong justification in the proposal.
Sometimes there is more than one possible control treatment. If we want to test a new
hypertension treatment, for example, should we compare this to an ACE-inhibitor, a betablocker, a diuretic, a salt restriction diet, exercise, or a combination of two or more of these?
And which ACE-inhibitor, beta-blocker, etc., should we use and at what dose? We must
beware of running a trial which is open to the criticism that the control treatment is not
18
appropriate or is not the best of its type. When there is a choice of control treatment the
protocol should contain a justification for the control treatment which has been chosen.
B-4 Blindness
B-4.1 Double blind and single blind designs
Bias in response can occur through subconscious effects. A patient's response may be
affected by knowing which treatment he is receiving, either through a belief that a
particular treatment is or is not beneficial or through a desire to please the clinician.
Further, an observer's evaluation may be affected by knowing which treatment a patient is
receiving, particularly in a trial comparing an active and an inert drug. For these reasons it
is preferable that neither the patient nor the assessor knows which treatment the patient is
receiving. This is known as double blind assessment. Sometimes it is only possible for
one party to be unaware of the treatment, in which case the trial is single blind. This most
often occurs when only the patient is blind because it is often impossible for the clinician to
be unaware of the treatment. For example if the intervention is a form of surgery.
Sometimes, the assessment can be done blind even when the patient and clinician cannot
be blinded. For example if the assessment is an x-ray which can be scored by an
independent observer who does not know which treatment the subject has received. It is
always best if the maximum degree of blindness is achieved and applicants should
describe exactly how this will be done.
It is also desirable that the person entering patients into the trial does not know which
treatment the next patient will receive. Ways of achieving this are described in section B-5.
Double blind trials clearly require that the treatments are indistinguishable to the patient
and to the assessor.
B-4.2 Placebos
If we wish to conduct a double blind trial to compare a new treatment with no treatment we
need to give the control group a dummy pill or placebo. This makes the two treatments
indistinguishable and prevents psychological effects whereby a patient's condition may
improve simply due to the knowledge that he is receiving a particular treatment. This
psychological response to treatment is known as the placebo effect. Placebo tablets
should be identical in appearance and taste to the active treatment, but be
pharmacologically inactive. The use of placebos enables us to assess any benefit or side
effects of the new treatment. The placebo effect can be very strong. For example in a trial
of analgesics three active drugs were compared with a placebo, but in addition each drug
was manufactured in four colours. It turned out that overall, the active treatments did
better than the placebos but strangely, red placebos were as effective as the active drugs
(Huskisson 1974).
Placebos can be used in non-drug trials but their use may not be ethical. For example in a
vaccination trial a saline injection could be used but may not be ethically acceptable.
Sometimes we may wish to compare two drugs which cannot be made to look alike. In this
case to maintain blindness we can use a double dummy - i.e. we give each patient two
drugs, the allocated active one and a placebo resembling the alternative one. An example
would be if we were to compare a tablet with a cream. Then each patient would get either
an active tablet plus a placebo cream or a placebo tablet plus active cream.
B-5. Randomisation
B-5.1 What is randomisation?
Randomisation or random allocation is a method of dividing subjects into groups in such a
way that the characteristics of the subject do not affect the group to which they are
19
allocated. To achieve this, we allow chance to decide which group each subject is
allocated to. Thus each subject is equally likely to be allocated to any of the available
groups and any differences between these groups happen by chance. In a clinical trial,
randomisation can be used to decide which treatment each subject should receive. For
example in a trial of a new treatment versus an existing treatment, randomisation can be
used to ensure that each subject has the same chance of receiving either the new or the
existing treatment.
B-5.2 When might we use randomisation?
We can use randomisation in any experimental study where we wish to compare groups
receiving different interventions. These can be studies of humans, animals, or some other
biological or organisational unit. A typical example where randomisation is used is for a
clinical trial comparing individuals receiving one of two treatments. We can also use
randomisation when we wish to assign individuals to more than two groups or when we
are assigning whole groups of individuals to different intervention groups. An example of
this would be assigning whole general practices to receive one of two different
interventions. This is known as cluster randomisation (see B-5.9)
B-5.3 Why randomise?
There are three reasons why randomisation is preferred in clinical trials. Firstly, we want to
be able to assess the difference between the treatments in an unbiased way. We want to
be able to conclude that any differences that we observe between the treatment groups
are due to differences in the treatments alone. We do not want differences between the
subjects themselves to confound the treatment differences. Without randomisation,
treatment comparisons may be prejudiced, whether consciously or not, by selection of
participants of a particular kind to receive a particular treatment (CONSORT statement
http://www.consort-statement.org). Random allocation does not guarantee that the groups
will be identical apart from the treatment given but it does ensure that any differences
between them are due to chance alone.
Secondly, randomisation facilitates the concealment of the type of treatment from the
researchers and subjects to further reduce bias in treatment comparison. (see B-4).
Thirdly, randomisation leads to treatment groups which are random samples of the
population sampled and thus makes valid the use of standard statistical tests based on
probability theory.
B-5.4 What is not randomisation?
Some trials have compared current patients receiving a new treatment with former
patients treated with an existing treatment. These patients are not randomly allocated.
Historical controls may differ from current patients in many ways and do not provide an
unbiased comparison to current patients given a new treatment (see B-3).
Another common approach is to use a method of systematic allocation. Examples include
alternate allocation (A B A B etc) and using date of birth or date of enrolment to study (e.g.
even date = A and odd date = B). We have seen grant applications and even papers in
journals which clearly state that the allocation was performed at random but where the
authors have then later indicated that subjects were allocated alternately to treatments.
While such schemes are in principle unbiased, problems arise from their openness since it
is well known that people with access to the procedure sometimes change the allocation,
albeit for altruistic purposes. For these reasons systematic allocation is not recommended
unless there is really no alternative.
B-5.5 How do we randomise?
20
The obvious and most simple way to randomise is to use a physical method. Physical
randomisation methods have been in use since the first Stone Age man cast a couple of
knucklebones. For example, we could toss a coin when a patient is recruited into the trial.
Randomisation is usually described in this way on patient information sheets. We do not
usually do this in practice, however. The main reason is the lack of an audit trail. We
cannot check back to ensure that the random allocation was done correctly. An external
observer could not be satisfied that the researchers had not tossed the coin again if they
did not like the result, for example. For these reasons` the random allocation should be
determined in advance. We could toss the coin in advance and produce a list of
allocations before any patients are recruited to the trial. This would be done by someone
who will not see any of the trial subjects and the allocation concealed from those recruiting
patients into the trial. In a large trial this would be extremely tedious.
Instead we use pseudorandom numbers generated by a mathematical process. There are
tables of random numbers, usually generated by a computer program, which can be used
to generate the random sequence. For example, given such a table we could choose a
random starting point in it by throwing dice or some other similar method. We then
produce a list of allocations by odd number = new treatment, even number = old
treatment. (Bland 2000 gives examples.) However, now that computers are so easily
available, we usually cut this stage out and use the computer directly. It is not difficult to
write a computer program to carry out random allocation. Our web directory of
randomisation software and services (see Appendix) lists some, including our own
completely free DOS program Clinstat. Such a program can print out a randomisation list
in advance. We think it is very important that the method of randomisation be
described in the application.
After the randomisation list has been prepared by someone who will not be involved in
recruitment to the trial, it must be made available to researchers. This can either be at
long range, by telephone from the clinic, or the randomisation can be physically present at
the recruitment point. One way to do this is to put the allocation into envelopes. It is
important that these envelopes be opaque, as there are well-attested cases of
researchers holding envelopes to a lamp in order to read what is written inside. For the
same reason these envelopes should be numbered so that the recruiter has to take the
next envelope. Shuffling envelope placed in a box is not a good idea. This is a physical
method which leaves no audit trail.
The researchers should not be given an open randomisation list, so that they know the
treatment to which the next potential recruit to the trial will be allocated. This is a really
bad idea. It has been shown that the differences in outcome between treatment groups
are considerably larger in trials where allocation is open in this way. It produces a clear
bias.
Long range allocation by telephone is suited to large trials and multi-centre trials in
particular. It requires that there be someone in the office to take the call. This may be
throughout normal office hours or twenty-four hours a day, depending on the disease
being studied. This is difficult for researchers to organise for their own trial, so we usually
use a commercial trials office for this. These provide a twenty-four hour phone line, often
computer operated, which gives the randomisation. Our web directory of randomisation
software and services (see Appendix) lists some service providers and their contact
details.
It is a good idea to keep track of randomisation. From time to time check that the
distribution of variables such as age, sex, important prognostic variables is similar in each
21
treatment group. This is particularly important when a third party is providing
randomisation by telephone.
B-5.6 Randomisation in blocks
If we wish to keep the numbers of subjects in each group very similar at all times, then we
use block randomisation. For example, suppose we have two treatments A and B and we
consider subjects in blocks of four at a time. There are six ways of allocating treatments to
give two A's and two B's:
1.AABB 2.BBAA 3.ABAB 4.BABA 5.ABBA 6.BAAB
If we use combinations of these six ways of allocating treatments then the numbers in the
groups can never differ by more than two at any point in the trial recruitment. We can
choose blocks at random to create the allocation sequence using random numbers (1
gives AABB, 2 gives BBAA, etc., and we ignore random numbers other than 1-6). Block
allocation can also be done using a computer. Our web directory of randomisation
software and services (see Appendix) lists some suitable programs.
In clinical trials it is best if those giving the treatments do not know how the randomisation
sequence was constructed to avoid their deducing in advance which treatment some
patients are to be allocated. For this reason larger block sizes of say 20 are sometimes
used in large trials. Such block sequences are virtually impossible to guess. A computer is
needed to generate such sequences.
B-5.7 Randomisation in strata
The aim of randomisation is that the groups of patients receiving different treatments are
as similar as possible with respect to features which may affect their prognosis. For
example we usually want our groups to have a similar age distribution since prognosis is
often related to age. There is however no guarantee that randomisation will give balanced
groups, particularly in a small trial. Although any differences will have arisen by chance,
they may be inconvenient and lead to doubts being cast as to the reliability of the results.
One solution to this problem is to use stratified randomisation at the outset for any
variables which are strongly prognostic. Another possible approach is to use minimisation
(see B-5.8)
In stratified randomisation we produce a separate randomisation list for each subgroup
(stratum) so that we get very similar numbers of patients receiving each treatment within
each stratum. For example if we were doing a trial of two alternative treatments for breast
cancer then we might want to take menopausal status into account. We would then take
two separate lists of random numbers and prepare two separate piles of sealed envelopes
for premenopausal and postmenopausal women. We may additionally use blocks (see B5.6) to ensure that there is a balance of treatments within each stratum. Stratified
randomisation can be extended to two or more stratifying variables. However, we can only
have a few strata, otherwise the subgroups produced will be too small.
B-5.8 Minimisation
In small studies with several important prognostic variables, random allocation may not
provide adequate balance in the groups. In addition, stratified allocation (see B-5.7) may
not be feasible due to there being too few subjects to stratify by all important variables. In
such studies it is still possible to achieve balance by using a technique called
minimisation. This is based on the idea that the next patient to enter the trial is given
whichever treatment would minimise the overall imbalance between the groups at that
stage of the trial. In the protocol, it is important to specify exactly which prognostic
variables are to be used and to say how they are to be grouped. For example just to say
22
that “age” will be used in not sufficient. The actual age groups need to be stated, for
example <50 and 50+.
Briefly minimisation works like this. The first patient is randomised to either A or B. When
subsequent patients are recruited and their prognostic characteristics noted, their
allocation is decided such that the overall balance in the groups at that point is optimised.
It is easiest to illustrate this with an example, for which we thank Sally Kerry. This was a
study in which 16 general practices were allocated to intervention and control groups.
There were three variables on which the groups should be balanced:
1. number of doctors in the practice,
2. number of patients in the practice,
3. number of long-term mentally ill patients.
These were grouped as follows:
1. number of doctors in the practice: 3 or 4 vs. 5 or 6,
2. number of patients in the practice: <8,600 vs. ≥8.600,
3. number of long-term mentally ill patients: <25 vs. ≥25.
The first practice had:
1. number of doctors: 4,
2. number of patients: 8,500,
3. number of long-term mentally ill: 23.
The two treatment groups were perfectly balanced at the outset, being empty, so there
was no reason to choose either group for the first practice. This practice was therefore
allocated randomly. It was allocated to Intervention. This gives the following table for the
minimisation variables:
Intervention Control
3 or 4 doctors
5 or 6 doctors
1
0
0
0
<8,600 patients
≥8.600 patients
1
0
0
0
<25 mentally ill
≥25 mentally ill
1
0
0
0
The second practice had:
1. number of doctors: 4,
2. number of patients: 7,800,
3. number of long-term mentally ill: 17.
23
From the table, we can see which allocation would reduce the imbalance. The second
practice would affect the highlighted rows:
3 or 4 doctors
5 or 6 doctors
Intervention Control
1
0
0
0
<8,600 patients
≥8.600 patients
1
0
0
0
<25 mentally ill
≥25 mentally ill
1
0
0
0
Imbalance
3
0
The imbalance is the sum of the totals in the highlighted rows. Clearly, putting practice 2
in the Intervention group would make the imbalances 6 and 0, whereas assigning it to
control would make them 3 and 3. The second practice was allocated to Control.
The groups were now perfectly balanced, so the third practice was allocated randomly.
This had characteristics
1. number of doctors: 5,
2. number of patients: 10,000,
3. number of long-term mentally ill: 24.
This practice was allocated to Intervention and the allocation was then:
Intervention Control
3 or 4 doctors
5 or 6 doctors
1
1
1
0
<8,600 patients
≥8.600 patients
1
1
1
0
<25 mentally ill
≥25 mentally ill
2
0
1
0
The fourth practice had:
1. number of doctors: 3,
2. number of patients: 3,400,
3. number of long-term mentally ill: 12.
24
This would affect the imbalance in the highlighted rows:
3 or 4 doctors
5 or 6 doctors
Intervention Control
1
1
1
0
<8,600 patients
≥8.600 patients
1
1
1
0
<25 mentally ill
≥25 mentally ill
2
0
1
0
Imbalance
4
3
The fourth practice was assigned to Control to make the imbalance totals 4 and 6, rather
than to Intervention, which would make them 7 and 3. This procedure continued until all
the 16 practices had been allocated. If the imbalance would be the same whichever group
the next practice went into, we would allocate randomly.
3 or 4 doctors
5 or 6 doctors
Intervention Control
5
3
5
3
<8,600 patients
≥8.600 patients
4
4
4
4
<25 mentally ill
≥25 mentally ill
4
4
4
4
The two groups are balanced on all three variables.
It may be objected that minimisation is not random. Also, it may be possible for the
patient's characteristics to influence the investigator's decision about recruiting that patient
to the trial, the investigator might know what treatment the patient would receive. We can
introduce an element of randomisation into minimisation. We use the minimisation
method to decide in which direction the subject should be allocated, but use unequal
randomisation to choose the actual treatment. For example, we might allocate in favour of
the allocation which would reduce imbalance with probability 2/3 or 3/4, and in the
direction which would increase imbalance with probability 1/3 or 1/4. Further details with
another worked example can be found in Pocock (1983).
Minimisation is most useful when a small and variable group must be randomised. Large
samples will be balanced after ordinary randomisation or can be stratified. In any case,
variables which are used in minimisation or stratification should be taken into account in
the analysis if possible, for example by multiple regression, as this will reduce the
variability within the groups (see E-6.2).
It is not necessary to minimise individuals in a trial by hand as there is a computer
program, Minim, which will do minimisation for you. Minim is available via our web
directory of randomisation software and services (see Appendix). Some clinical trials
services will provide telephone minimisation. Some of these are also listed on our web
directory.
B-5.9 Clusters
Sometimes we cannot allocate individuals to treatments, but rather allocate a group of
subjects together. For example, in a health promotion study carried out in general
25
practices, we might need to apply the intervention to all the patients in the practice.
Publicity may be displayed in the waiting room, for example. For another example, we
may need to keep groups of patients separate to avoid contamination. If we were
providing a special nurse to patients in a ward, it would be difficult for the nurse to visit
some patients and not others. If we are providing training to the patients or their carers,
we do not want the subjects receiving training to pass on what they have learned to
controls. This might be desirable in general, but not in a trial. For a third case, we may
provide an intervention to service providers, clinical guidelines for example. We evaluate
the intervention by collecting data from their patients.
A group of subjects allocated together to a treatment is called a cluster. Clusters must be
taken into account in the design (Kerry & Bland 1998b, Kerry & Bland 1998d, Kerry &
Bland 1998e, Bland 2000) and analysis (Altman & Bland 1997, Bland & Kerry 1997, Kerry
& Bland 1998, Kerry & Bland 1998c). The proposal should say how this is to be done (see
sections D and E-11). For example, the use of clusters reduces the power of the trial and
so requires an increase in sample size
B-5.10 Trial designs
B-5.10a Parallel groups
The simplest design for a clinical trial is the parallel group design where the two groups of
patients are studied concurrently. This is the most common design.
B-5.10b Crossover design
A crossover trial is one in which the patient is his own control. In other words, each patient
receives both (or all) treatments in sequence. The order in which the treatments is given is
randomised (see B-5.5). The main advantage of this design is that comparisons can be
made within subjects rather than between subjects as we have done before. This is
particularly useful for outcomes which are very variable between subjects. Crossover trials
clearly cannot be used for conditions which can be cured and are most suitable when the
effect of the treatment can be assessed quickly. There may be a carry-over of treatment
effect from one period to the next and so it may be necessary to have a 'wash-out' period
between the two treatments. If a cross-over design is proposed then the issue of a washout period needs to be discussed and the length of time used specified and justified if
appropriate.
B-5.10c Within group comparisons
Cross-over trials are within-patient designs. Another type of within-patient design is when
the two treatments are investigated concurrently in the same patients. It can be used for
treatments that can be given independently to matching parts of the body, such as eyes,
ears, limbs etc. This is a very powerful design but has obvious limited use.
A similar design is the matched pairs design, where pairs of subjects are matched for say,
age, sex etc. and the two treatments are allocated within pairs at random. Where there are
known important prognostic variables this design removes much of the between subjects
variation and ensures that the subjects receiving each treatment have similar
characteristics.
B-5.10d Sequential design
In sequential trials, parallel groups are studied and the trial continues until either there is a
clear benefit of one treatment or it is clear that no difference is likely to emerge. The data
are analysed after each patient's results are available and so the method is only
appropriate if the outcome is known fairly quickly. If there is a large difference between the
treatments then a sequential trial will be shorter than its equivalent parallel trial. The main
26
ethical advantage is that as soon as one treatment is shown to be superior then the trial is
stopped. Note that it is incorrect to analyse any parallel group design sequentially because
this would involve unplanned multiple testing (see E-7) and might therefore lead to false
significant results. The sequential nature of the analysis has to be built in at the design
stage such that the sample size calculations allow for the fact that multiple testing will take
place (see E-7.1, E-7.4f). Further details of sequential designs can be found in Whitehead
(1997).
B-5.10e Factorial designs
A factorial experiment is one where several factors are compared at the same time. To
make it possible to do this, each subject receives a combination of all the factors such that
all combinations are received by some subjects. An example is the EMLA trial of pain
relief prior to venepuncture (Nott MR, Peacock JL 1990), where 4 treatments were used
(EMLA at 5 and 60 mins before venepuncture, placebo and nothing). The other factors of
interest were size of needle (three) and sex. The study was designed to be balanced i.e.
with equal numbers of patients in each treatment/needle/sex combination. The design
enabled the researchers to investigate the effects of treatments, needle size and sex on
pain and also to look for interactions (see A-1.6a). Balanced designs are easier to analyse
statistically but with powerful computer programs unbalanced designs are not usually a
problem nowadays.
A factorial design is particularly suited to the investigation of factor interactions. However it
is sometimes proposed in an attempt to optimise statistical power when the number of
patients available for study is limited and it is assumed that the factor effects are additive
either on an arithmetic or logarithmic scale (i.e. no factor interactions). The assumption of
no interactions is a strong one and unless it can be fully justified in the proposal, the
reviewer would expect to see sample size calculations based on detecting interactions
rather than main factor effects. It should be remembered that in a factorial experiment
main factor effects are averaged over all combinations of levels of the other factors. If
factor effects are not additive and interactions are not of interest these estimates may not
be very useful.
B-6 Outcome variables
It is essential to specify the main outcome variable which will be used to decide the result
of the trial. This is usually called the primary outcome or primary endpoint. It is
important that only one primary outcome is chosen, such that if that variable is statistically
significant then it would be reasonable to conclude that the treatment under investigation
had ‘worked’ or was superior to its comparator.
Often trials will want to investigate a number of additional variables, perhaps related to
potential side effects. These too should be specified in advance and are called
secondary outcomes or secondary endpoints. Although statistical analysis is usually
performed on secondary outcomes, the interpretation is different from the result of
analysing the primary outcome. First, since there may be several secondary outcomes, it
is essential to allow for multiple testing (see E-7) so that a lone significant result is not
over-interpreted. Further, the trial would not usually conclude efficacy from statistical
significance in a secondary outcome alone. Significant results in secondary outcomes
must be interpreted as indicative of effects rather than providing conclusive evidence.
The main analysis of a trial should first answer the original questions relating to the
primary and secondary outcomes. Sometimes researchers wish to investigate other
hypotheses. Such results should be presented cautiously and with much less emphasis
than the main findings. This particularly applies to subgroup analyses where we might
seek out a group of patients in which the treatment is especially effective. If this analysis
was part of the original protocol then the interpretation of these analyses presents no
27
problem. However it may appear that a treatment works well in a particular subgroup
compared with other subgroups. In such a situation it is misleading to give undue
emphasis to this finding and not to mention that other subgroups were also tested. If we
really wish to identify a subgroup effect then we should do a multifactorial analysis (see E1.1) and look at interactions (see A-1.6a).
B-7 Data monitoring
B-7.1 Data monitoring committee
Most trials have a data monitoring committee which comprises a group of independent
specialists who meet at pre-specified intervals while the trial is in progress to check on the
trial progress and conduct. The committee will usually compare the outcome in the
different treatment groups to see if there is evidence for clear superiority of any one
treatment over the other(s). Adverse events are also monitored to ensure that these are
not excessive. It is best if the data monitoring committee is presented with the interim
data analyses blind to the treatment so that any decision to stop the trial early will not be
affected by the committee knowing which treatment appears to be superior.
B-7.2 When should a trial be stopped early?
This should only happen if the evidence for superiority is overwhelming. Since data
monitoring is conducted prior to the main trial analysis, and sometimes more than once,
the possibility of statistical significance is increased beyond the usual significance level,
0.05. Effectively the data are subject to multiple testing and so the critical value for
significance has to be modified to ensure that spurious significant differences are not
found and the trial stopped prematurely in error. It is common therefore for a strict critical
value of say, P<0.001 to be applied for data monitoring to ensure that the overall level of
significance is preserved. Further details of setting critical values for P to take account of
multiple testing can be found in Pocock (1983) and Whitehead (1997). Another reason
why a trial should not be stopped early unless a large, highly significant difference is
observed is that with less than the anticipated number of subjects the estimates will be
less precise. Thus they need to be very extreme to provide adequate and convincing
evidence for the scientific community. In the past, trials which have been stopped early
have been criticised subsequently and their results ignored.
B-8 Informed consent
B-8.1 Consent
The ethical principles which should govern the conduct of medical research are set out in
The Declaration of Helsinki (http://www.wma.net/e/policy/b3.htm), which has a lot to say
about information and consent. We recommend that all clinical researchers read it from time
to time. Any clinical trial which diverges from these principles must be justified very carefully
(see F3.3).
The proposal should say how subjects are to be recruited and how they are to give consent
to the trial. When we recruit subjects into a clinical trial, we usually need to ask for their
permission and co-operation. When we do this we must inform potential research subjects
as to the purpose of the trial, what may happen to them, in particular what may happen
which is different from treatment outside the trial, and potential risks and benefits to them. If
subjects will be forgoing treatment which they might otherwise have had, this must be
explained.
The information may be given orally, in the form of a video, or in writing. In any case the
information should be given additionally in writing, in clear, simple language, which is
unambiguous and honest. Subjects should be given an information sheet or leaflet which
28
can be kept. Writing such information sheets is not as easy as it looks. Research ethics
committees spend a lot of their time reviewing them. This written version is very important,
because people are often recruited into clinical trials under circumstances of great personal
stress. They may have just been told that they have a life-threatening disease, for example.
They may not recall any detail of what has been said to them, or even that they were asked
to take part in a clinical trial at all. The Association of the British Pharmaceutical Industry
gives some guidance (http://www.abpi.org.uk/Details.asp?ProductID=193).
If possible, subjects should have sufficient time between being informed about the trial and
their decision as to whether to take part to discuss it with others, such as their family. They
should be able to show their family members the information sheet and get their opinions.
Wherever possible, people entering clinical trials should sign a consent form to confirm that
they have been informed about the trial, agree to enter it, and understand that they can
withdraw at any time. The consent form should be separate from the information sheet, so
that the subject can retain the information when the form is returned. The subject should
retain a copy of the signed consent form too, to remind them that they have agreed to the
trial. It is not unknown for trial participants to deny having given consent, despite the
existence of a signed consent form.
B-8.2 Emergencies
Sometimes there is no time to allow potential subjects to discuss the pros and cons of the
trial with others. For example, a trial of neuroprotection in stroke would require the treatment
to be given as soon as possible after the stroke. Sometimes patients may be unconscious or
extremely confused. In such cases, assent may and should be obtained from relatives
accompanying the potential research subject, if any, but they cannot give consent on behalf
of any person who is usually mentally competent. Randomisation may be carried out and
emergency treatment begun and consent obtained later, if and when the subject is able to
give it. If the subject then refuses, they should be deleted from the trial.
B-8.3 Children
When the potential trial recruit is a child under the age of 16 years, consent must be
obtained from the child's parents or other legal guardians. There should be an information
sheet for parents and, where the child is old enough to read, one in language suitable for
children of the likely age. Assent should be obtained from the subjects themselves if they
are old enough to understand what is happening. Children may have to be treated against
their will with parental consent, but they should not become research subjects against their
will.
B-8.4 Mentally incompetent subjects
When potential research subjects are mentally or physically unable to consent, for example
through learning difficulties, mental illness, or paralysis, consent should be obtained from
their legal guardians. As for children, assent should also be obtained from the subjects
themselves wherever possible. Note that Clause 27 of the Declaration of Helsinki states that
"These individuals must not be included in a research study that has no likelihood of benefit
for them unless it is intended to promote the health of the population represented by the
potential subject, the research cannot instead be performed with competent persons, and the
research entails only minimal risk and minimal burden."
29
B-8.5 Cluster randomised designs
Consent is more difficult in cluster randomised designs. Because people are randomised as
a group, this is usually done without their consent. For example, in a general practice based
trial, all patients of the chosen type in a practice may be randomised to the same treatment.
In some such trials, it is impossible for patients to consent to treatment. For example, in a
trial where GPs are randomised to receive guidelines for treatment of a disease, patients
cannot agree to their GP being randomised or to receiving the guidelines. It has already
happened. Patients can only consent to provide data for the trial. If the cluster has been
randomised to receive an individual treatment, patients may still consent to or refuse
treatment as they would do outside a trial. For example, if the treatment is to run special
clinics, they can refuse to go to them when invited. For some treatments, such as health
promotion interventions in general practice, workplace or school, subjects cannot even do
that. All they can do is to refuse to listen. Some critics argue that cluster randomisation is
never ethical for this reason. If the funding body to which you apply takes this view, then you
will have to find another funder.
B-8.6 Random consent design
In this design we have a new treatment to be compared to a standard treatment and we do
not wish subjects in the control group to be informed about the new treatment. For example,
in the Know Your Midwife trial the new treatment was to have the same midwife carry out all
antenatal care, deliver the baby, and carry out all postnatal care. The control treatment was
standard care, where mothers would be seen by whoever was duty at the time, and may
never see the same midwife twice. The trial organiser thought that very few women would
be happy with standard care if they knew that the Know Your Midwife clinic existed. To save
them from disappointment, they were randomised to receive standard care, the control
group, or to be offered Know Your Midwife, the treatment group. Those offered Know Your
Midwife could then accept it or opt for standard care (which some did). All women were
asked to consent to a study of maternity services, so that data could be collected.
This is an example of a randomised consent design (Zelen 1979, 1990), where research
subjects are randomised and consent is then obtained to treatment and data provision, but
not to randomisation itself. Such a design would need a very strong argument if it were to be
used in a trial. Some critics argue that randomised consent is never ethical.
Randomised consent designs are analysed according to the principle of intention to treat
(see E-9). This gives the best test of significance, but a rather biased treatment estimate. In
addition, Zelen (1979) shows how better treatment estimates can be obtained, at the
expense of wider confidence intervals.
B-9 Protocol violation and non-compliance
Some patients may not have followed the protocol, either accidentally or deliberately (noncompliance) or their condition may have led to the clinician giving them an alternative
treatment to the one they were originally allocated to (protocol violation). The only safe
way to deal with these people is to keep all randomised patients in the trial i.e. to analyse
according to the randomisation. This will maintain the balance between the groups that the
original randomisation will have achieved and so ensure that the treatment groups are
comparable apart from the treatment received. This is known as analysing according to
the intention to treat (see E-9). An intention to treat analysis should be performed
wherever possible but may not be possible if some patients have dropped out of the trial.
In this case sensitivity analyses should be performed to assess the likely impact of the
missing data.
30
B-10 Achieving the sample size
The sample size required for a clinical trial is decided using standard methods of power
calculations or confidence interval width, as would be used for any other statistical study.
(see section D) However, a problem arises in clinical trials which is not so frequent in
observational designs. The agreed sample size may be very hard to recruit. We have
been involved with many clinical trials where recruitment has been much slower than
anticipated. Indeed, we would say that this is the norm. One possible result of this is a
request to the funders for an extension in time or for an extension in funding. Requests
for time are likely to be agreed, but requests for money may well be turned down on the
grounds that there is no point in throwing good money after bad. Another outcome may
be the premature ending of the trial with only a small fraction of the planned recruitment,
the analysis of a greatly under-powered trial and inconclusive findings.
Why does this happen? It is the common experience that as soon as a clinical trial
begins, potential patients melt away like snow in August. One reason for this might be
that patients refuse to consent to the trial. There is evidence to suggest that patient
compliance with clinical trials may be reducing as a result of adverse publicity about
medicine in general and trials in particular. However, much more likely is the failure of
recruiting staff to identify and approach potential research subjects. This may be because
of a lack of commitment to the project, which might be caused by honest doubts about the
safety or efficacy of the new treatment or by the view that the new treatment should be
used. For example, in a sequential trial of sublingual nitrate in myocardial infarction, the
statistician noticed that very few patients were dying, far fewer than the sample size
calculations had assumed. It was explained by all the patients being entered into the trial
having a good prognosis, based on the indicators used in the trial. High risk patients were
not being entered into the trial, but were being prescribed nitrates by admitting physicians.
Poor recruitment may also be because staff are too busy. If the clinical unit is under
pressure from excessive patient numbers or understaffing, the research project will be the
first thing to go. This is how it should be, of course, as the wellbeing of patients should be
our first concern, but it is pretty frustrating for the experimenter. Another problem can be
that other trials are already in progress in a unit. Staff may be unable to cope with or keep
in mind the needs to recruit to yet another trial, or there may be competition between trials
for the same patients. It is a good idea to check with potential collaborators what their
other trial commitments are.
Pilot studies (see A-1.9) are very helpful in sorting out some of these problems, as is
having a research leader who can visit trial sites regularly and maintain good contact with
staff actually concerned with recruitment. Funders may well be impressed by a proposal
which shows that this issue has been considered by applicants and some positive plans
exist for dealing with it. Also a good idea is to have recruitment targets (milestones) to
enable the research team to monitor how well recruitment is going, so that problems can
be detected as soon as possible.
B-11 After the trial is over
The current Declaration of Helsinki states that:
"At the conclusion of the study, patients entered into the study are entitled to be informed
about the outcome of the study and to share any benefits that result from it, for example,
access to interventions identified as beneficial in the study or to other appropriate care or
benefits." (Clause 33)
Of course this may not be possible or appropriate in many trials, such as treatments of acute
conditions. However, the proposal should contain a statement about this if the trial is a direct
31
patient treatment of a chronic condition. Is this going to take place and, if so, how will it be
funded and administered?
32
C. Observational Studies
C-1
Case-control studies
C-1.1 Choice of control group in case-control studies
C-1.2 Matching in case-control studies
C-2
C-3
C-4
C-5
C-6
Assessment bias
Recall bias
Sample Survey: selecting a representative sample
Generalisability and extrapolation of results
Maximising response rates to questionnaire surveys
C-1.1 Choice of control group in case-control studies
Consider a case-control study (see A-1.4) that is concerned with identifying the risks for
cardiovascular disease. Smoking history is an obvious variable worthy of investigation. In
case-control studies, one must first decide upon the population from which subjects will be
selected (e.g. a hospital ward, clinic, general population etc.). Where cases have been
obtained from a hospital clinic, controls are often selected from another hospital
population for ease of access. However, the latter scenario can introduce selection bias.
For example, if cases are obtained from a cardiovascular ward and smoking history is one
of the variables under investigation, it would be unsuitable to obtain controls from a ward
containing patients with smoking related disease e.g. lung cancer. The choice of a suitable
control group is fraught with problems both practical and statistical. These problems are
discussed in detail in Breslow & Day 1980. In general the ideal is to select as controls a
random sample from the general population that gave rise to the cases. However this
assumes the existence of a list of subjects in the population (i.e. a sampling frame exists)
which in many cases it does not.
C-1.2 Matching in case-control studies
Sometimes in a case-control study (see A-1.4) cases and controls are matched. You can
have 1-1 matching of one control for each case or 1-m matching of m controls per case.
The latter is often used to increase statistical power for a given number of cases (see
Breslow & Day 1980). For each case, 1 or more controls are found that have the same, or
very similar, values in a set of matching variables. Matching variables typically include age
and sex etc. Typically two or three matching variables are selected; anymore would make
the selection of controls difficult. It is hoped that by matching, any differences between
cases and controls are not a result of differences between groups in the matching
variables. The extent to which this aim is achieved depends to some extent on the
closeness of the matching. Here a balance has to be struck between matching as closely
as possible and what can be achieved. Pilot work (see A-1.9) may be useful in making this
judgement. When describing a matched case-control study in a grant application, it is not
sufficient to say that a control will be matched to each case for age for example. The
reviewer will want to know how closely - to within one year, to within 5 years etc? Also of
interest to the reviewer is how the controls will be selected (e.g. at random from a list of all
possible matches) and what happens when a control refuses. Will a second control be
selected as a replacement and how many replacements will be permitted?
The main purpose of matching is to control for confounding (see A-1.6). However it should
be appreciated that confounding factors can be controlled for in other ways (see E-5) and
these other ways become increasingly appealing when we consider some of the problems
associated with matching:
33
1) It is not possible to examine the effects of the matching variables upon the status of the
disease/disorder (either present or absent). Thus although the disease or condition of
interest will be related to the matching variables, the matching variables should not be of
interest in themselves.
2) If we match we should take the matching into account in the statistical analysis. This
makes the analysis quite complicated (see E-6.2, Breslow & Day 1980).
3) In a 1-1 matched case-control study matched pairs are analysed together and so
missing information on a control means that it's case is also treated as missing in the
statistical analysis. Similarly missing information on a case leads to the loss of information
on its matched control(s).
4) Bias can arise if we match on a variable that turns out to form part of the causal
pathway between the risk factor under study and disease. This bias is said to be due to
overmatching.
See Bland & Altman (1994c) and Breslow & Day (1980), for further discussion on
matching.
C-2 Assessment bias
Consider a case-control study where for example the interest may be to investigate an
association between diet and bowel cancer. Let us assume that diet is to be assessed by
an interviewer administered food frequency questionnaire. If the interviewer is aware of
the medical condition of the patients then this may lead to assessment bias, namely a
difference between the information recorded by the interviewer (assessor) and the actual
"truth". The interviewer may record poorer diets than actually consumed for those patients
with cancer. Assessment bias can be overcome if the assessor is 'blind' to the medical
condition, thus avoiding any manipulation of results either conscious or subconsciously
(although 'blinding' is difficult to do in a case-control study of cancer where interviews are
face to face). Assessment bias can even arise in a case-control study when data is being
extracted from medical records as the process of extraction may be influenced by the
knowledge of outcome (e.g. case or control). In this case 'blind' extraction is advocated.
C-3 Recall bias
This is a particular problem in both case-control studies (see A-1.4) and cross-sectional
studies (see A-1.5) when information is collected retrospectively, as the patients outcome
e.g. disease status, is known, and they are being asked to recall past events. Patient data
collected retrospectively may be of poor quality as it is based on the patient's ability to
recollect the past. In addition, their ability to recall may be influenced by their known
outcome and it is this difference in ability that may bias observed associations. If recall
bias is likely to be a problem then the grant applicants should at least consider alternative
methodologies. Could the data be collected from another source e.g. 'blind' extraction
from historical records? Would it be possible to undertake a prospective study where for
example exposure information is collected prior to and in the lack of knowledge of future
disease?
C-4 Sample survey: selecting a representative sample
We may be interested in demonstrating an association between unemployment and
current poor health. We might decide to undertake a cross-sectional study and obtain a
sample from a London Borough. The aim of the research would be to extrapolate our
findings from this sample to the population of the borough and then possibly nationally.
Therefore, our sample should be at least representative of the London borough population
from where it was obtained. In practice, we could only obtain a truly representative sample
through random sampling of the whole borough. Nonetheless, the sample would still only
be representative to a particular time period. It may even be difficult to extrapolate the
results to the same borough during another time period, and therefore possibly nationally.
34
Sometimes by chance a random sample is not as representative as we would like. For
example in our cross-sectional survey to investigate associations between unemployment
and current health it may be particularly important to ensure that we have an adequate
representation of all postal areas in the borough, thereby reflecting the socioeconomic
deprivation that exists. One way of doing this is to undertake stratified random sampling.
Stratified random sampling is a means of using our knowledge of the population to ensure
the representative nature of the sample and increase the precision of population
estimates. Post-code area would be known as the stratification factor. Usually we
undertake proportional stratified sampling. The total sample size is allocated between the
strata proportionally, with the proportion determined by the strata total size as a proportion
of the total population size. For example if 10% of the borough live in one postal code area
then we randomly select 10% of the sample from this strata.
Stratification does not depart from the principle of random sampling. All it means is that
before any selection takes place, the population is divided into strata and we randomly
sample in each strata. It is possible to have more than one stratification factor. For
example in addition to stratifying by post-code area, we may stratify by age group within
the post code area. Nonetheless, we have to be careful not to stratify by too many factors.
Stratified random sampling requires that we have a large population, for which all of the
members and their stratification factors are listed. Obviously as the number of stratification
factors increase then so also does the time and expense involved. Nonetheless we can be
more confident of the representative nature of the sample and thereby the generalisability
of the results.
C-5 Generalisability and extrapolation of results
All medical research is undertaken on a group of selected individuals. However, the
usefulness of any medical research is centred in the generalisation of the findings rather
than in the information gained about a group of particular individuals. Nonetheless, most
studies often use very restrictive inclusion criteria making it very difficult to generalise
results. For example, if the study subjects in a cross-sectional study concerned with
investigating associations between bowel cancer and diet were selected from an area that
was predominately social class IV or V, can the results be extrapolated to individuals in a
different social class? Such extrapolation of results is not obvious and the researchers of
such a study should have considered incorporating other geographical areas with a wider
range of social classes. Even if the study had such a sample, the reader of the journal
article must pay careful attention to the ethnicity of the study subjects before extrapolating
the results of a study conducted in the UK to say Asia. Observational studies are
conducted to investigate associations between risk factors and a disease or disorder,
rather than to find out anything about the individual patients in the study. See Altman &
Bland (1998), for further discussion on generalisation and extrapolation.
C-6 Maximising response rates to questionnaire surveys
The response rate to a questionnaire survey is the proportion of subjects who respond to
the questionnaire. Questionnaire surveys, particularly postal surveys, tend to have low
response rates (anything from 30%-50% is not unusual). The subjects that respond to
questionnaires differ from those that don't and so the results of a study with a low
response rate will not be seen as representative of the population of interest. Thus, if a
grant proposal includes a questionnaire survey the reviewers will be looking for ways in
which the applicants plan to maximise response. Response rates can be enhanced by
including self-addressed stamped envelopes, informing respondents of the importance of
the study and ensuring anonymity. If anonymity is not given, then response rates can also
be increased by following up the first posting with another copy of the questionnaire or
telephone call. Alternatively if anonymity is given then a second posting of the
35
questionnaire may result in duplication from some respondents. See Edwards et al (2002),
for a discussion on improving response rates to questionnaires.
36
D. Sample size calculations
D-1
D-2
D-3
When should sample size calculations be provided?
Why is it important to consider sample size?
Information required to calculate a sample size
D-4
D-4.1
D-4.2
D-4.3
D-4.4
D-4.5
D-4.6
Explanation of statistical terms
Null and alternative hypothesis
Probability value (p-value)
Significance level
Power
Effect size of clinical importance
One-sided and two-sided tests of significance
D-5
D-6
D-7
Which variables should be included in the sample size calculation?
Allowing for response rates and other losses to the sample
Consistency with study aims and statistical analysis
D-8
D-8.1
D-8.2
D-8.3
Three specific examples of sample size calculations & statements
Estimating a single proportion
Comparing two proportions
Comparing two means
D-9
Sample size statements likely to be rejected
D-1 When should sample size calculations be provided?
• Sample size calculations are required for the vast majority of quantitative studies
•
Sample size calculations are not required for qualitative research (note: this means
formal qualitative methods, such as content analysis, not simple descriptive projects
which are actually still quantitative.)
•
Sample size calculations may not be required for certain preliminary pilot studies (see
A-1.9). (However, such studies will often be performed prior to applying for funding)
If in any doubt, please check with the funding body – missing or inadequate sample size
calculations are one of the most common reasons for rejecting proposals.
D-2 Why is it important to consider sample size?
• In studies concerned with estimating some characteristic of a population (e.g. the
prevalence of asthmatic children), sample size calculations are important to ensure
that estimates are obtained with required precision or confidence. For example, a
prevalence of 10% from a sample of size 20 would have a 95% confidence interval of
1% to 31%, which is not very precise or informative. On the other hand, a prevalence
of 10% from a sample of size 400 would have a 95% confidence interval of 7% to 13%,
which may be considered sufficiently accurate. Sample size calculations help to avoid
the former situation.
•
In studies concerned with detecting an effect (e.g. a difference between two
treatments, or relative risk of a diagnosis if a certain risk factor is present versus
absent), sample size calculations are important to ensure that if an effect deemed to be
clinically or biologically important exists, then there is a high chance of it being
detected, i.e. that the analysis will be statistically significant. If the sample is too small,
37
then even if large differences are observed, it will be impossible to show that these are
due to anything more than sampling variation.
D-3 Information required to calculate a sample size
It is highly recommended that you ask a professional statistician to conduct the sample
size calculation.
Methods for the determination of sample size are described in several general statistics
texts, such as Altman (1991), Bland (2000), and Armitage, Berry & Matthews (2002). Two
specialised books are available which discuss sample size determination in many
situations. For continuous data, use Machin et al. (1998). For categorical data, use
Lemeshow et al. (1996). These books both give tables so simplify the calculation. For
sample size in sequential trials, see Whitehead (1997).
The actual calculations for sample size can be done using several computer programs.
Our free program Clinstat carries out calculations for the comparison of means and
proportions and for testing correlation. It is available via our web directory of
randomisation software and services (see Appendix). Many more options are provided by
the commercial package nQuery advisor, Elashoff (2000). A good free Windows program
is PS Power and Sample Size Calculations by William D. Dupont and Walton D. Plummer
(biostat.mc.vanderbilt.edu/twiki/bin/view/Main/PowerSampleSize).
Your sample size calculation depends on the following factors, which the statistician will
want to discuss with you: •
•
•
•
•
•
•
The variables of interest in your study, including the type of data (type of data is
expanded in sections A-4, A-4.1, and A-4.2)
The desired power*
The desired significance level*
The effect size of clinical importance*
The standard deviation of continuous outcome variables
Whether analysis will involve one- or two-sided tests*
Aspects of the design of your study: e.g. is your study ….
- a simple randomised controlled trial (RCT)
- a cluster randomised trial
- an equivalence trial (see D-7)
- a non-randomised intervention study (see B-5.10c)
- an observational study
- a prevalence study
- a study measuring sensitivity and specificity
- does your study have paired data?
- does your study include repeated measures?
- are groups of equal sizes?
- are the data hierarchical?
* Explanations of these terms are given below
Note 1: Non-randomised studies looking for differences or associations will generally
require a much larger sample in order to allow adjustment for confounding factors
within the analysis (see A-1.6, E-5).
Note 2: It is the absolute sample size which is of most interest, not the sample size as a
proportion of the whole population.
38
D-4 Explanation of statistical terms
D-4.1 Null and alternative hypothesis
Many statistical analyses involve the comparison of two treatments, procedures or subject
types. The numerical value summarising the difference of interest is called the effect. In
other study designs the effect may be represented by a correlation coefficient, an odds
ratio, or a relative risk. We declare the null and alternative hypotheses. Usually, the null
hypothesis states that there is no effect (e.g. the difference is zero; the relative risk is
one; or the correlation coefficient is zero), and the alternative hypothesis that there is an
effect.
D-4.2 Probability value (p-value)
The p-value is the probability of obtaining the effect observed in the study (or one
stronger) if the null hypothesis of no effect is actually true. It is usually expressed as a
proportion (e.g. p=0.03).
D-4.3 Significance level
The significance level is a cut-off point for the p-value, below which the null hypothesis will
be rejected and it will be concluded that there is evidence of an effect. The significance
level is typically set at 5%. (The significance level, although a p-value, is usually
expressed as a percentage: p=5% is equivalent to p=0.05). If the observed p-value is
smaller than 5% then there is only a small probability that the study could have observed
the data it did if there was truly no effect, and so it would be concluded that there is
evidence of a real effect.
A significance level of 5% also means there is up to a 5% probability of concluding that
there is evidence of an effect, when in fact none exists. A significance level of 1% is
sometimes more appropriate, if it is very important to avoid concluding that there is
evidence of an effect when in reality none exists.
D-4.4 Power
Power is the probability that the null hypothesis will be correctly rejected i.e. rejected when
there is indeed a real difference or association. It can also be thought of as “100 minus
the percentage chance of missing a real effect” – therefore the higher the power, the lower
the chance of missing a real effect. Power is typically set at 80%, 90% or 95%. Power
should not be less than 80%. If it is very important that the study does not miss a real
effect, then a power of 90% or more should be applied.
D-4.5 Effect size of clinical importance
This is the smallest difference between the group means or proportions (or odds
ratio/relative risk closest to unity) which would be considered to be clinically or biologically
important. The sample size should be set so that if such a difference exists, then it is very
likely that a statistically significant result would be obtained.
D-4.6 One-sided and two-sided tests of significance
In a two-sided test, the null hypothesis states there is no effect, and the alternative
hypothesis (often implied) is that a difference exists in either direction. In a one-sided test
the alternative hypothesis does specify a direction, for example that an active treatment is
better than a placebo, and the null hypothesis then includes both no effect and placebo
better than active treatment.
39
Two-sided tests should be used unless there is a very good reason for doing otherwise.
Expectation that the difference will be in a particular direction is not adequate justification
for one-sided tests. Medical researchers are sometimes surprised by their results. If the
true effect is in the opposite direction to that expected, this generally has very different
implications to that of no effect, and should be reported as such; a one-sided test would
not allow this. Please see Bland & Altman (1994), for some examples of when one-sided
tests may be appropriate.
D-5 Which variables should be included in the sample size calculation?
The sample size calculation should relate to the study’s primary outcome variable.
If the study has secondary outcome variables which are also considered important (as is
often the case), the sample size should also be sufficient for the analyses of these
variables. Separate sample size calculations should ideally be provided for each
important variable. (See also B-6 and E-7)
D-6 Allowing for response rates and other losses to the sample
The sample size calculation should relate to the final, achieved sample. Therefore, the
initial numbers approached in the study may need to be increased in accordance with the
expected response rate, loss to follow up, lack of compliance, and any other predicted
reasons for loss of subjects (for clinical trials see also B-10). The link between the initial
numbers approached and the final achieved sample size should be made explicit.
D-7 Consistency with study aims and statistical analysis
The adequacy of a sample size should be assessed according to the purpose of the study.
For example, if the aim is to demonstrate that a new drug is superior to an existing one
then it is important that the sample size is sufficient to detect a clinically important
difference between the two treatments. However, sometimes the aim is to demonstrate
that two drugs are equally effective. This type of trial is called an equivalence trial or a
'negative' trial. Pocock (1983) p129-130, discusses sample size considerations for these
studies. The sample size required to demonstrate equivalence will be larger than that
required to demonstrate a difference. Please check that your sample size calculations
relate to the study’s stated objectives, and are based on the study’s primary outcome
variable (see D-5).
The sample size calculation should also be consistent with the study’s proposed method
of analysis, since both the sample size and the analysis depend on the design of the study
(see section E). Please check the consistency between sample size calculation and
choice of analysis.
D-8 Three specific examples of samples size calculations
If your study requires the estimation of a single proportion, comparison of two means, or
comparison of two proportions, the sample size calculations for these situations are
(generally) relatively straightforward, and are therefore presented here. However, it is still
strongly recommended that you ask a statistician to conduct the sample size calculation.
D-8.1 Estimating a single proportion:
Note: The formula presented below is based on ‘normal approximation methods’, and,
unless a very large sample is planned, should not be applied when estimating
percentages which are close to 0% or 100%. In these circumstances ‘exact methods’
should be used. This will generally be the case in studies estimating the sensitivity or
specificity of a new technique, where percentages close to 100% are anticipated. Consult
a statistician (or at least a computer package) in this case. (See also E-12.1)
40
Scenario: The prevalence of dysfunctional breathing amongst asthma patients being
treated in general practice is to be assessed using a postal questionnaire survey.
(Thomas et al. 2001)
Required information: Primary outcome variable = presence/absence of dysfunctional breathing
‘Best guess’ of expected percentage (proportion) = 30% (0.30)
Desired width of 95% confidence interval = 10% (i.e. +/- 5%, or 25% to 35%)
The formula for the sample size for estimation of a single proportion is as follows: n = 15.4 * p * (1-p)
W2
where n = the required sample size
p = the expected proportion – here 0.30
W = width of confidence interval – here 0.10
Inserting the required information into the formula gives: n = 15.4 * 0.30 * (0.70) = 324
0.102
Suggested description of this sample size calculation: “A sample of 324 patients with asthma will be required to obtain a 95% confidence interval
of +/- 5% around a prevalence estimate of 30%. To allow for an expected 70% response
rate to the questionnaire, a total of 480 questionnaires will be delivered.”
D-8.2 Comparing two proportions: Note: The following calculation only applies when you intend to compare two groups of
the same size.
Scenario: A placebo-controlled randomised trial proposes to assess the effectiveness of
colony stimulating factors (CSFs) in reducing sepsis in premature babies. A previous
study has shown the underlying rate of sepsis to be about 50% in such infants around 2
weeks after birth, and a reduction of this rate to 34% would be of clinical importance.
Required information: Primary outcome variable = presence/absence of sepsis at 14 days after treatment
(treatment is for a maximum of 72 hours after birth). Hence, a categorical variable
summarised by proportions.
Size of difference of clinical importance = 16%, or 0.16
Significance level = 5%
Power = 80%
Type of test = two-sided
41
(i.e. 50%-34%)
The formula for the sample size for comparison of 2 proportions (two-sided) is as follows: n = [A + B]2 * [(p1*(1-p1)) + (p2* (1-p2))]
[p1-p2]2
where n = the sample size required in each group (double this for total sample)
p1 = first proportion – here 0.50
p2 = second proportion – here 0.34
p1-p2 = size of difference of clinical importance – here 0.16
A depends on desired significance level (see table) – here 1.96
B depends on desired power (see table) – here 0.84
Table of values for A and B
Significance
A
level
5%
1.96
1%
2.58
Power
B
80%
0.84
90%
1.28
95%
1.64
Inserting the required information into the formula gives: n = [1.96 + 0.84]2 * [(0.50*0.50) + (0.34* 0.66)] = 146
[0.16]2
This gives the number required in each of the trial’s two groups. Therefore the total
sample size is double this, i.e. 292.
Suggested description of this sample size calculation: “A sample size of 292 babies (146 in each of the treatment and placebo groups) will be
sufficient to detect a difference of 16% between groups in the sepsis rate at 14 days, with
80% power and a 5% significance level. This 16% difference represents the difference
between a 50% sepsis rate in the placebo group and a 34% rate in the treatment group.”
D-8.3 Comparing two means:
Note: The following calculation only applies when you intend to compare two groups of
the same size.
Scenario:
A randomised controlled trial has been planned to evaluate a brief
psychological intervention in comparison to usual treatment in the reduction of suicidal
ideation amongst patients presenting at hospital with deliberate self-poisoning. Suicidal
ideation will be measured on the Beck scale; the standard deviation of this scale in a
previous study was 7.7, and a difference of 5 points is considered to be of clinical
importance. It is anticipated that around one third of patients may drop out of treatment.
(Guthrie et al. 2001)
42
Required information: Primary outcome variable = The Beck scale for suicidal ideation. A continuous variable
summarised by means.
Standard deviation = 7.7 points
Size of difference of clinical importance = 5 points
Significance level = 5%
Power = 80%
Type of test = two-sided
The formula for the sample size for comparison of 2 means (2-sided) is as follows: n = [A + B]2 * 2 * SD2
DIFF2
where n = the sample size required in each group (double this for total sample)
SD = standard deviation, of the primary outcome variable – here 7.7
DIFF = size of difference of clinical importance – here 5.0
A depends on desired significance level (see table) – here 1.96
B depends on desired power (see table) – here 1.28
Table of values for A and B
Significance
A
level
5%
1.96
1%
2.58
Power
B
80%
0.84
90%
1.28
95%
1.64
Inserting the required information into the formula gives: n = [1.96 + 0.84]2 * 2 * 7.72 = 38
5.02
This gives the number required in each of the trial’s two groups. Therefore the total
sample size is double this, i.e. 76.
To allow for the predicted dropout rate of around one third, the sample size was increased
to 60 in each group, a total sample of 120.
Suggested description of this sample size calculation: “A sample size of 38 in each group will be sufficient to detect a difference of 5 points on
the Beck scale of suicidal ideation, assuming a standard deviation of 7.7 points, a power
of 80%, and a significance level of 5%. This number has been increased to 60 per group
(total of 120), to allow for a predicted drop-out from treatment of around one third”
43
D-9 Inadequate sample size statements
Example 1: “A previous study in this area recruited 150 subjects and found highly significant
results (p=0.014), and therefore a similar sample size should be sufficient here.”
Previous studies may have been ‘lucky’ to find significant results, due to random sampling
variation. Calculations of sample size specific to the present, proposed study should be
provided - including details of power, significance level, primary outcome variable, effect
size of clinical importance for this variable, standard deviation (if a continuous variable),
and sample size in each group (if comparing groups).
Example 2: “Sample sizes are not provided because there is no prior information on which to
base them.”
Every effort should be made to find previously published information on which to base
sample size calculations, or a small pre-study may be conducted to gather this
information.
Where prior information on standard deviations is unavailable, sample size calculations
can be given in very general terms, i.e. by giving the size of difference that may be
detected in terms of a number of standard deviations.
However, if funding is being requested for very preliminary pilot studies (see A-1.9), aimed
at assessing feasibility or gathering the information required to calculate sample sizes for
a full-scale study, then sample size calculations are not necessary.
Example 3: "The throughput of the clinic is around 50 patients a year, of whom 10% may refuse
to take part in the study. Therefore over the 2 years of the study, the sample size
will be 90 patients. "
Although most studies need to balance feasibility with study power, the sample size
should not be decided on the number of available patients alone.
Where the number of available patients is a known limiting factor, sample size calculations
should still be provided, to indicate either a) the power which the study will have to detect
the desired difference of clinical importance, or b) the difference which will be detected
when the desired power is applied.
Where the number of available patients is too small to provide sufficient power to detect
differences of clinical importance, you may wish to consider extending the length of the
study, or collaborating with a colleague to conduct a multi-centre study.
44
E. Describing the statistical methods
E-1
E-1.1
E-1.2
Introduction
Terminology
Level of detail required
E-2
E-2.1
Is the proposed method appropriate for the data?
'Ordinal' scores
E-3
Paired and unpaired comparison
E-4
E-4.1
Assumptions
Transformations
E-5
Adjustment for confounding
E-6
E-6.1
What are hierarchical or multilevel data?
Analysing hierarchical data
E-7
E-7.1
E-7.2
E-7.3
E-7.4
E-7.4a
E-7.4b
E-7.4c
E-7.4d
E-7.4e
E-7.4f
Multiple testing
Multiple testing: when does it arise?
Multiple testing: why is it a problem?
The Bonferroni correction
How to deal with multiple testing
More than one outcome measurement in a clinical trial
More than one predictor measurement in an observational study
Measurements repeated over time (serial measurements)
Comparisons of more than two groups
Testing the study hypothesis within subgroups
Repeatedly testing the difference in a study as more patients are recruited
E-8
E-9
E-10
E-11
Change over time (regression towards the mean)
Intention to treat in clinical trials
Cluster randomised trials
Collapsing variables
E-12
Estimation and confidence intervals
E-12.1 Proportions close to 1 or zero
E-1 Introduction
When reading through the statistical analysis section of a grant proposal, the reviewer is
looking for several things. Have the statistical methods been described adequately and in
terms that are unambiguous? Will the data generated by the study be measured on an
appropriate scale (see A-4.1) and be of an appropriate type (see A-4.2) for analysis by the
methods proposed? Will the assumptions made by the proposed methods hold and what
is planned if they do not? Will the proposed statistical methods take adequate account of
the study design and the structure of the data (e.g. serial measurements, hierarchical
data)?
E-1.1Terminology
When describing the proposed statistical methods it is appropriate and helpful to the
reviewer to use statistical terminology. However it is important that the applicant actually
understands the terminology and uses it appropriately if the description is to be
45
unambiguous. Very often applicants say that they plan a multivariate analysis when in fact
they mean a multifactorial analysis. These two types of analysis are appropriate in
different settings and are used to answer different questions. They also make different
assumptions. To add to the confusion the terms multivariate and multifactorial are
frequently used interchangeably and therefore incorrectly in the medical literature as well
as in grant proposals. So when and how should they be used? In any statistical technique
it is the outcome variable whose variation is being modelled and about whom assumptions
(e.g. data come from a Normal distribution) are made. The explanatory variable on the
other hand is assumed to take fixed values. A statistical method involving only one
outcome variable can be described as univariate and a method involving multiple outcome
variables as multivariate. Univariate analyses can be further divided into unifactorial if only
one explanatory variable is to be considered and multifactorial if multiple explanatory
variables are to be considered.
E-1.2 Level of detail required
It is important for the reviewer to be reassured that the applicants have thought in some
detail about how they will use their data to address their study aims. Often, however,
applicants concentrate on describing their study design and on calculating their sample
size but then dismiss their proposed statistical analysis using a single sentence. For
example, data will be analysed using the computer package SPSS or data will be
analysed using multivariate techniques or data will be analysed using multifactorial
methods. Such descriptions are completely inadequate. There are a wealth of statistical
techniques that can be run using SPSS or that can be described as multivariate or
multifactorial. The actual name of the technique intended should therefore be given
explicitly e.g. principal component analysis, multiple regression analysis etc. This
information is essential to the reviewer as although certain techniques may come under
the same umbrella term e.g. multifactorial, they are appropriate in very different settings.
For example, multiple logistic regression and multiple regression may both be described
as multifactorial but the latter can only be used when the outcome is a continuous variable
and the former when the outcome is a binary variable (two possible categories e.g. yes
and no) or the sum of binary variables (see Bland 2000, chapter 17).
E-2 Is the proposed method appropriate for the data?
When writing the statistical analysis section the applicants should be mindful of the type of
data that will be generated by their study (see A-4.1 and A-4.2). For example, if they have
one outcome variable measured across two independent groups of subjects is that
outcome variable continuous, ordinal, categorical or more specifically binary (only two
categories e.g. yes and no)? If the outcome is binary then in order to compare groups one
of the following statistical tests might be used: The Chi-squared test or Fisher’s Exact
Test. However if the outcome is continuous then the two-sample t test or the MannWhitney U test might be used. For an ordinal outcome variable the Chi-square test for
trend or the Mann-Whitney U test might be employed and finally for a non-ordered
categorical outcome the Chi-squared test might be used. Although the appropriateness of
each test will depend on other assumptions (see E-3 and E-4) in addition to data type, it is
clear that the two-sample t test is not appropriate for binary, categorical outcomes or noninterval data. (For further information on the significance tests mentioned see Armitage,
Berry & Matthews 2002, Altman 1991, Bland 2000)
E-2.1 'Ordinal' scores
A particular type of data of interest are scores that are formed by adding up numerical
responses to a series of questions in a questionnaire that has been designed to obtain
information on different aspects of the same phenomenon e.g. quality of life. Often each
question requires only a yes/no answer (coded Yes=1, No=0). The resulting scores are
not interval data and it is debatable whether they are even ordinal (see A-4.1 and A-4.2).
46
A positive response to Question A may add 1 to the overall score as may a positive
response to Question B, but since A and B are measuring two different aspects, what
does a difference in score of 1 actually mean?
When such scores are based on a large number of questions, they are often treated as if
they were continuous variables for the purposes of multivariate or multifactorial analysis
(see E-1.1). The main reason for this is the lack of any alternative methodology. However,
care should always be taken when interpreting results of such analyses and the problem
should not just be ignored. Where scores are based on only a few yes/no type questions
(say < 10) treating the score as continuous cannot be justified. Indeed some statisticians
would argue that 'ordinal' scores should never be treated as continuous data. Certainly for
unifactorial analysis, non-parametric methods should be considered (see Conover 1980).
E-3 Paired and unpaired comparison
Very often whether in a clinical trial or in an observational study (see A-1) there are two
sets of data on the same variable and it is of interest to compare these two sets. Of
primary importance is whether or not they can be considered to be independent of each
other. Dependence will arise if the two sets consist of measurements or counts made on
the same subjects at two different points in time. For example middle-aged men with lung
function measured at baseline clinic and 5-year follow-up. It can also arise in
observational studies if we have subjects with disease (cases) and subjects without
disease (controls) and each control is matched to each case for important confounding
factors such as age and sex. That is a 1-1 matched case-control study. With this type of
dependence the comparison of interest is the paired comparison (i.e. differences within
pairs). When the two sets of data are independent as for example when subjects are
randomly allocated to groups in a randomised trial or when two distinct groups (e.g. males
and females) are compared in an observational study, the comparison of interest is the
unpaired comparison (i.e. differences between groups).
The distinction is important as paired and unpaired comparisons require different
statistical techniques. Thus if the data are continuous (see A-4) representing some
measurement on two independent groups of subjects an unpaired t test (or Mann-Whitney
U test) might be used but if measurements are 'before' and 'after' measurements on the
same subjects a paired t test (or Wilcoxon Signed rank test) might be used. For binary
data i.e. data taking the values 0 and 1 only, the tests for unpaired and paired comparison
would be the Chi-squared test (or Fisher’s Exact Test) and McNemar's test respectively;
although the appropriateness of each test would depend on other assumptions holding as
discussed below (see E-4). (For further information on the significance tests mentioned
see Armitage, Berry & Matthews 2002, Altman 1991, Bland 2000)
E-4 Assumptions
It is often not appreciated that in order to formulate statistical significance tests certain
assumptions are made and that if those assumptions do not hold then the tests are
invalid. For example the unpaired t test (sometimes referred to as the two-sample t test)
assumes that data have been selected at random from two independent Normal
distributions with the same variance. The assumption of independence is satisfied if as
indicated above, data come from measuring two distinct/unmatched groups of subjects.
One simple way of checking that data come from a Normal distribution is to produce a
histogram of the data or to produce a Normal plot. A symmetrical bell shaped histogram or
a straight line of points on the Normal plot indicates Normality. To check for equal
variances it is worth just eyeballing the calculated standard deviations for each group to
see if they differ markedly. This is as good a method as any. Testing for a significant
difference between variances is of limited use as the size of difference that can be
detected with any degree of certainty is dependent upon sample size. Thus a large
47
sample size may detect a real though trivial difference in variance whereas a small sample
would miss a large important difference.
Other tests:
i) The paired t test (see E-3) assumes that differences between paired observations come
from a Normal distribution.
ii) The chi-squared test and McNemar's test (see E-2 and E-3) are large sample tests and
their validity depends on sample size. For small samples Fisher's exact test or an exact
version of McNemar's test may be required (several programs are available to do these
including StatXact by Cytel).
iii) Contrary to popular belief, tests based on ranks such as the Mann-Whitney U test or
the Wilcoxon signed rank test (see E-2 and E-3) also make assumptions and cannot be
used for very small samples (see Conover 1980).
E-4.1 Transformations
If a histogram of the data is not symmetrical and has a long tail to the right, the distribution
is described as positively skew. If the longer tail is to the left the distribution is said to be
negatively skew. If data appear to follow a positively skewed distribution but the proposed
statistical analysis assumes that data come from a Normal distribution then a logarithmic
transformation may be useful. We simply take logs of the basic data and use the logged
data in the analysis, provided a histogram of the logged data looks sufficiently symmetrical
and bell shaped i.e. provided the logged data come from a Normal distribution. If the
logged data do not appear to follow a Normal distribution then there are some other
transformations that can be tried e.g. the square root transformation. Very often a
transformation which restores Normality will also lead to equal variances across groups
(see Wetherill 1981)
If the data come from a negatively skew distribution or if transformations are not very
helpful then a non-parametric test based on ranks may be a more useful approach. The
non-parametric equivalent to the two-sample t test is the Mann-Whitney U test (see
Conover 1980 for more details of non-parametric tests).
E-5 Adjustment for confounding
When in an observational study we observe for example an association between good
lung function and vitamin C, we cannot assume that vitamin C is directly benefiting lung
function. There may be some other factor such as smoking which is inversely associated
with vitamin C and which has a direct effect on lung function. In other words smoking may
confound the association between vitamin C and lung function.
The effects of confounding can be adjusted for at the design stage in terms of matching
(see C-1.2) or stratified randomisation (see B-5.7) etc or at the analysis stage using
multifactorial methods (see E-1.1). A list of confounders and how they are to be adjusted
for should always form part of the section on proposed statistical methods. If the
applicants decide to adjust at the analysis stage then the collection of information on
confounding variables should form part of their plan of investigation. Some consideration
should also be given to how detailed this information needs to be. To adjust for smoking in
the lung function vitamin C example, something more than a 3 category variable of current
smoker, ex-smoker and non-smoker is required as both amount smoked and length of
time exposed may be important. If the applicants propose to adjust at the design stage
then they need to appreciate that this will build some sort of structure into their data which
will have implications for the statistical analysis (see E-6 and E-6.1). For example, in a 1-1
matched case-control study you cannot treat the cases and controls as two independent
samples but rather as paired samples (see E-3).
48
E-6 Hierarchical or multilevel data
This is where your data have some sort of hierarchy e.g. patients within GP practices,
subjects within families. We cannot ignore the fact that subjects within the same group are
more alike than subjects in different groups. This problem is one of a lack of
independence. Most basic significance tests (e.g. t tests) assume that within each group
being compared (e.g. treatment A or treatment B), the data are independent observations
from some theoretical distribution. For example the 2-sample t test assumes that the data
within each group are independent observations from a Normal distribution. If for example
the data are measurements of total cholesterol made on patients from a sample of general
practices, measurements of subjects in the same practice will tend to be more similar than
measurements of subjects from different practices. Hence the assumption of
independence fails.
E-6.1 Analysing hierarchical data
It is often the case that a carefully designed study incorporates balance by introducing a
hierarchical structure to the data. For example, in a case-control study you may match one
control of the same age and sex 1-1 to each case (see C-1.2). You then have case-control
pairs and below them in the hierarchy, the subjects within pairs. This matching should be
taken into account in the statistical analysis (see Breslow & Day 1980). In a clinical trial
you may stratify your subjects by age and randomly allocate subjects to treatments within
strata (see B-5.7). Strata should be adjusted for in the statistical analysis if we are to
maximise precision. In a cluster randomised trial (see B-5.9) you may randomly allocate a
sample of general practices to one of two interventions and measure outcome in the
patients. In this case, general practice should be used as the unit of analysis and not the
patient. In other words we have to summarise the outcome for each practice; we cannot
simply add up all the patients in the intervention practices and the non-intervention
practices (see Altman & Bland 1997, Bland & Kerry 1997, Kerry & Bland 1998, Kerry &
Bland 1998c).
Sometimes the hierarchical structure is there because you sample at one level and collect
data at another as for example, in a survey of old people's homes where each client at
each home in the sample is asked to take part. Some adjustment for clustering within
homes is required here, which may involve complex statistical methods such as multilevel
modelling (Goldstein 1995).
The reviewer is looking for some indication that the applicants appreciate the structure of
their data and how this will impact in terms of their proposed statistical analysis and the
likely complexity of that statistical analysis.
E-7 Multiple testing
E-7.1 Multiple testing: when does it arise?
Multiple significance testing arises in several ways:
(a) More than one outcome measurement in a clinical trial, e.g. in a trial of ventilation of
small neonates we might want to look at survival and time on ventilation. We may
want to look at the differences for each variable. (see B-6 and E-7.4a)
(b) More than one predictor measurement in an observational study, e.g. in a study of the
effects of air pollution on hospital admissions, we might need to consider the effects of
several pollutants and several lag times, i.e. pollution on the day of the admission, the
day before the admission, two days before, etc. If any of these is significant we want
to conclude that air pollution as a whole has an effect. (see E-7.4b)
49
(c) Measurements repeated over time (serial data), e.g. measurements of circulating
hormone level at intervals after the administration of a drug or a placebo. We may
want to look at the difference between groups at each time. (see E-7.4c)
(d) Comparisons of more than two groups, e.g. we may have three different treatments in
a trial, such as two doses of an active drug and a placebo. We may want to compare
each pair of groups, i.e. the two doses and each dose with placebo. (see E-7.4d)
(e) Testing the study hypothesis within subgroups, e.g. for males and females separately
or for severe and mild disease separately. (see B-6 and E-7.4e)
(f) Repeatedly testing the difference in a study as more patients are recruited. (see B5.10d, B-7.2 and E-7.4f)
If the main analysis of your study involves any of these, this should be described in the
proposal, together with how you intend to allow for the multiple testing.
E-7.2 Multiple testing: why is it a problem?
The problem is that if we carry out many tests of significance, we increase the chance of
false positive results, i.e. spurious significant differences or type I errors. If there are really
no differences in the population, i.e. all the null hypotheses are true, the probability that we
will get at least one significant difference is going to be a lot more than 0.05. (For
explanation of statistical terms see D-4).
For a single test when the null hypothesis is true, the probability of a false positive,
significant result is 0.05, by definition, and so the probability of a true negative, non
significant result is (1-0.05) = 0.95. If we have two tests, which are independent, i.e. the
variables used in the tests are independent, the probability that both tests are true
negative, not significant results is 0.952 = 0.9025. Hence the probability that at least one
of the two tests will be a false positive is 1-0.9025 = 0.0975, not 0.05. If we do k
independent tests, the probability that at least one will be significant is 1-0.95k.
For 14 independent tests, the probability that at least one will be significant is thus 10.9514 = 0.51. There would be a more than 50% chance of a spurious significant
difference.
Tests are independent in subgroup analysis, provided the subgroups do not overlap. If
the tests are not independent, as is usually the case, the probability of at least one false
positive will be less than 1-0.95k, but by an unknown amount. If we do get a false positive,
however, the chance of more than one false positive is greater than when tests are
independent. To see this, imagine a series of variables which are identical. Then the
chance of a false positive is still 0.05, less than 1-0.95k, but if one occurs it will be
significant for all the variables. Hence having several significant results does not provide
a reliable guide that they are not false positives.
E-7.3 The Bonferroni correction
One possible way to deal with multiple testing is to use the Bonferroni correction.
Suppose we do several tests, k in all, using a critical P value of alpha, the null hypotheses
all being true. The probability of at least one significant difference is 1 - (1 - alpha)k. We
set this to the significance level we want, e.g. 0.05. We get 1- (1 - alpha)k = 0.05.
Because alpha is going to be very small, we can use an approximation:
(1 - alpha)k = 1 - k alpha. Hence 1- (1 - alpha)k = 1 - (1 - k alpha) = 0.05.
Hence k alpha = 0.05 and alpha = 0.05/k. So if we do our k multiple tests and find that
one of them has P < 0.05/k, the P value for the composite null hypothesis that all k null
hypotheses are true is 0.05. In practice it is better to multiply all the individual P values by
k, then if any is significant (P < 0.05) the test of the composite null hypothesis is significant
50
at the 0.05 level, and the smallest modified P value gives the P value for the composite
null hypothesis (Bland & Altman 1995, Bland 2000a).
The Bonferroni correction assumes that the tests are independent. Applying the
Bonferroni correction when tests are not independent means that the P value is larger
than it should be, but by an unknown amount. Hence the power of the study is reduced,
also by an unknown amount. If possible, we look for other methods which take the
structure of the data into account, unlike Bonferroni.
If we are going to have multiple significance tests in our study, we should say in the
proposal how we are going to deal with them (see E-7.4).
E-7.4 How to deal with multiple testing
We could ignore the problem and take each test at face value. This would lay us open to
charges of misleading the reader, so it is not a good idea.
We could choose one test as our main test and stick to it. This is good in clinical trials but
can be impractical in other designs. It may ignore important information.
We could use confidence intervals (see E-12) instead of significance tests. This is often
desirable quite apart from multiple testing problems, but confidence intervals will be
interpreted as significance tests whatever the author may wish.
There are several better options, depending on the way multiple testing comes about (see
E-7.4a, E-7.4b, E-7.4c, E-7.4d, E-7.4e and E-7.4f).
E-7.4a More than one outcome measurement in a clinical trial.
We should keep the number of outcomes to a minimum, but there is a natural desire to
measure anything which may be interesting and then comparing the treatment groups is
almost irresistible. We can use the Bonferroni method (see E-7.3). We multiply each
observed P value by the total number of tests conducted. If any modified P value is less
than 0.05 then the treatment groups are significantly different. This tests a composite null
hypothesis, i.e. that the treatments do not differ on any of the variables tested. If we have
two or three main outcome variables where a difference in any of them would lead us to
conclude that the treatments were different, we should build this into sample size
calculations by dividing the preset type I error probability (usually 0.05) by the number of
tests. If we are going to carry out many tests on things we have measured, we should
state in the protocol that these will be adjusted by the Bonferroni method. Alternatively that
any such tests will be described clearly as hypothesis-generating analyses which will not
enable any firm conclusion to be drawn.
E-7.4b More than one predictor measurement in an observational study.
Usually we ignore this unless the variables are closely related making multiple testing a
real problem. When this is the case we can use the Bonferroni method (see E-7.3). We
should test each of our predictors and apply the correction to the P values. In a protocol,
we should use 0.05/number of tests as the type I error in sample size calculations. An
alternative would be to put the group of variables into a multifactorial analysis such as
multiple or logistic regression, and test them all together using the reduction in sum of
squares or equivalent. We would ignore individual P values. You need quite a lot of
observations to do this reliably.
E-7.4c Measurements repeated over time (serial measurements)
We should not carry out tests at each time point separately. Not only does this increase
the chance of a false positive but, as it uses the data inefficiently, it increases the chance
51
of a false negative also. There are several possible approaches. One is to create a
summary statistic (Bland 2000b, Mathews et al 1990) such as the area under the curve.
The peak value and time to peak can also be used, but as they do not use all the data
they may be less efficient, particularly the time to peak. On the other hand, they have a
direct interpretation. For data where the variable increases or decreases throughout the
observation the rate of change, measured by the slope of a regression line, may be a
good summary statistic. For a proposal, you should decide on the summary statistic you
are going to use. For your sample size calculation you will need an estimate of the
standard deviation and of the size of difference you wish to detect (much more difficult, as
you are using an indirect measure). A pilot study (see A-1.9) is very useful for this. There
are several other approaches, including repeated measures analysis of variance and
multilevel modelling (Goldstein 1995). These are more difficult to do and to interpret. The
research team should include an experienced statistician if these are to be used.
E-7.4d Comparisons of more than two groups.
We start off with a comparison of all groups, using analysis of variance or some other
multiple group method. If the groups difference is significant, we then go on to compare
each pair of groups. There are several ways to do this. One way would be to do t tests
between each pair, using the residual variance from the analysis of variance (which
increases the degrees of freedom and so increases the power compared to a standard t
test). This is called the least significant difference analysis. However, we are multiple
testing, the risk of false positives is high. We can apply Bonferroni, but this loses a lot of
power and as we are not testing a composite hypothesis it is not really appropriate. There
are several better and more powerful methods, which have the property that only one
significant difference should be found in 20 analyses of variance if the null hypothesis is
true, rather than one in 20 pairs of groups. These include the Newman Keuls range test
(see Armitage, Berry & Matthews 2002, Bland 2000), and Gabriel's test, suitable for
groups of unequal size (see Bland 2000). Different statistical packages offer different
methods for doing this, and you may be rather limited by your software. We will not try to
review this as it will change as new releases of software are issued. In your protocol you
should say which method you are going to use. Sample size calculations with more than
two groups are difficult. It should be acceptable if you use the method for two groups and
assume that if your sample is adequate for a comparison of two of your groups it will be
OK for all of them.
E-7.4e Testing the study hypothesis within subgroups.
There are two possible reasons for wanting to do this. First, we might want to see
whether, even though a treatment difference may not be significant overall, there is some
group of patients within which there is a difference. If so, we wish to conclude that the
treatment has an effect. The Bonferroni correction is required here, as we are testing a
composite hypothesis. As the tests are independent we should not experience loss of
power. Second, we might want to see whether the main study difference varies between
groups; for example, whether a treatment effect is greater in severe than in mild cases.
We should do this by estimating the interaction (see A-1.6a) between the main study
factor (e.g. treatment) and the subgrouping factor (e.g. severity). (Altman & Matthews
1996, Mathews & Altman 1996a 1996b) Separate tests within subgroups will not tell us
this. Not only do we have multiple testing, but we cannot conclude that two subgroups
differ just because we have a significant difference in one but not in the other. (Matthews
& Altman 1996a) Not significant does not mean that there is no effect.
E-7.4f Repeatedly testing the difference in a study as more patients are recruited.
This is a classic multiple testing problem. It is solved by adopting a sequential trial design
(see B-5.10d), where the multiple testing is built in and allowed for in the sample size
52
estimation. The testing is arranged so that the overall P value is 0.05. There are several
designs for doing this. Anyone using such designs should consult Whitehead (1997).
E-8 Change over time (regression towards the mean)
Problems occur if one of the aims of a study is to investigate the association between
change over time and initial value. Due to measurement error alone, those with high
values at baseline are more likely to have lower than higher values at follow-up and those
with low values at baseline are more likely to have higher than lower values at follow-up. A
spurious inverse association between change and initial value is therefore to be expected.
This phenomenon is an example of regression towards the mean (Bland & Altman 1994a,
1994b). If we are interested in any real association between change and initial value then
we must first remove the effects of regression towards the mean (see Hayes 1988).
If we are convinced that change over time depends on initial value then we may want to
adjust for initial value in any multifactorial analysis (see E-1.1). However if we have
change as the outcome variable and include initial value as an explanatory variable we
may introduce bias due to regression towards the mean. Such bias may be reduced by
adjusting for average ((initial + follow-up)/2) rather than initial value (Oldham 1962).
Although in observational studies (see A-1.1) any attempt to adjust for initial value may be
an over-adjustment due to the horse racing effect. The horse racing effect is basically the
tendency for individuals with faster rates of decline over time in the outcome measure of
interest (e.g. lung function) to have lower initial values because of past decline. (see
Vollmer 1988).
E-9 Intention to treat in clinical trials
In a randomised clinical trial subjects are allocated at random to groups. The aim of this is
to produce samples that are similar/comparable at baseline in terms of factors, other than
treatment, that might influence outcome. In effect they can be regarded as random
samples from the same underlying population. However as a clinical trial progresses some
patients may change treatments or simply stop taking their’ allocated treatment. There is
then a temptation to analyse subjects according to the treatment they actually received
rather than the treatment to which they were originally allocated. This approach though
appearing reasonable at first glance fails to retain the comparability built into the
experiment at the start by the random allocation. Patients that change or stop taking
treatment are unlikely to be 'typical'. Indeed they may well have changed because the
treatment they were on was not working or they were experiencing adverse side effects. It
is therefore important in the analysis of randomised controlled trials to adhere (and to be
seen to adhere) to the concept of analysis by intention to treat. This means that in the
statistical analysis all subjects should be retained in the group to which they were
originally allocated regardless of whether or not that was the treatment that they actually
received. A statement to this effect should be made when describing the proposed
statistical analysis for any randomised trial. (see also B-9)
E-10 Cluster randomised trials
When subjects are in clusters, such as GP practices, this must be taken into account in
the analysis plan (see B-5.9, E-6.1, E-6.2, Altman & Bland 1997, Bland & Kerry 1997,
Kerry & Bland 1998 and Kerry &Bland 1998c).
E-11 Collapsing variables
If information is collected on a continuous (see A-4.2) or pseudo-continuous variable then
in general it is this variable that should be used in any statistical analysis and not some
grouped version. If we group a continuous variable prior to analysis we are basically losing
information unless the variable has been recorded to some spurious level of precision and
grouping simply reflects a more realistic approach. The idea of grouping continuous
53
variables for presentation purposes is fine provided it is the full ungrouped variable that is
used in any significance testing. For example you may wish to present lung function by
5ths of the distribution of dietary fatty fish intake. However when testing for an association
between fatty fish and lung function the continuous fatty fish variable should be used. One
exception would be if some strong a priori reason existed for us to believe that any
association between fatty fish and lung function was step like or discontinuous rather than
following a straight-line or smooth curve. For example if we believed a priori that lung
function was influenced by any versus no intake of fatty fish but did not vary according to
the amount eaten. Another exception would be if very few people ate fatty fish. In either
case fatty fish could be analysed as a dichotomy (yes/no).
E-12 Estimation and confidence intervals
In most studies, even those primarily designed to detect as statistically significant a
difference in outcome between two groups, the magnitude of any difference or association
is of interest. In other words in most studies one of the study aims is estimation whether
we are estimating some beneficial effect of a treatment, the prevalence of a disease, the
gradient of some linear association, the relative risk associated with some exposure, or
the sensitivity of a screening tool etc. In all these examples we are attempting to estimate
some characteristic of a wider population using a single sample/study and we need to be
mindful that another study of the same size might yield a slightly different estimate. It is
therefore important when presenting estimates that we provide some measure of their
variability from study to study of the same size. This is done by the calculation of
confidence intervals. A 95% confidence interval is constructed in such a way that 95 times
out of 100 it captures the true population value that we are trying to estimate. A 90%
confidence interval will capture the true population value 90 times out of 100. Confidence
intervals are based on the standard error of the estimate and therefore reflect the
variability of the estimate from sample to sample of the same size. They give us some
idea of how large the true population value might be (i.e. the upper limit of the interval)
and how small it might be (the lower limit). Further if the interval is wide it tells us that we
do not have a very accurate estimate but if it is narrow then we have a good and useful
estimate.
In most studies therefore the calculation of confidence intervals should form an important
part of the statistical analysis and the fact that confidence intervals will be calculated and
how they will be calculated should form part of the section in the grant proposal on
proposed statistical methods. Normally 95% confidence intervals are calculated. If the
applicant envisages calculating say 90% confidence intervals or 99% confidence intervals
etc then some justification should be given. The method of calculation should always be
appropriate to the data. Further the validity of confidence intervals as with significance
tests depends on certain assumptions. For example if we use the t method to calculate a
95% confidence interval around the difference in two means (Bland 2000) then the basic
data should be continuous. Further, we assume (as for the two-sample t test; see E-4) that
data come from two Normal distributions with the same variance. The reviewer is looking
for some acknowledgement that the applicants are aware of assumptions and that they
have some idea of what they will do if assumptions do not hold (see Altman et al. 2000).
If estimation rather than significance testing is the primary aim of the study then
confidence intervals will also form an intrinsic part of any sample size calculations. Sample
size will be chosen such that population characteristics will be estimated with adequate
precision where precision is measured in terms of the width of confidence intervals (see
D-8.1 and Altman et al. 2000).
54
E-12.1 Proportions close to 1 or zero
When estimating a proportion close to 1 (e.g. 0.95, 0.92), as is often the case in studies of
sensitivity and specificity, or a proportion close to 0 (e.g. 0.05, 0.07), the 95% confidence
interval is unlikely to be symmetrical and should be calculated using exact rather than
large sample methods. A few programs are available to calculate exact 95% confidence
intervals including StatXact by Cytel and CIA (Altman DG et al. 2000). For the simple case
of a single proportion, we offer biconf, a free DOS program by Martin Bland
[http://martinbland.co.uk/soft/soft.htm]. (See also D-8.1). Robert Newcombe gives some
free Excel programs to do this and more
(http://www.cardiff.ac.uk/medic/aboutus/departments/primarycareandpublichealth/ourrese
arch/resources/index.html).
55
F. General
F-1
F-2
Statistical expertise (statistical analysis)
Statistical software
F-3
F-3.1
F-3.2
F-3.3
Ethics
The misuse of statistics
Critical appraisal
Studies involving human subjects
F-4
Useful websites
F-4.1 Research governance
F-4.2 Data protection
F-1 Statistical expertise (statistical analysis)
To some it may seem pointless to describe in detail a proposed statistical analysis for data
that are not yet in existence. It might be argued, that at this stage the correct approach is
difficult to judge, as without the data you cannot be sure of distributional properties (e.g.
whether a variable is Normally distributed) and therefore assumptions. However, all too
often statisticians are presented with data that they cannot analyse. The flaws in design
which lead to this problem only come to light when someone starts to think about how the
data can be analysed. How much better for all concerned if these flaws come to light at
the proposal stage. If applicants are not sure how to analyse their data, they should
consult a statistician.
Thinking about the statistical analysis or discussing it with a statistician brings home to
some researchers the need to buy in statistical expertise. How much statistical input is
required may vary from a few days of a statisticians time to enlisting a statistical
collaborator /co-applicant. Where the statistical methods are complex (e.g. multilevel
modelling) the statistical reviewer will be looking for some reassurance that the research
team has the ability to complete such an analysis and to interpret the results appropriately;
clearly a statistical collaborator would provide that reassurance.
F-2 Statistical software
Applicants need to make sure that they have access to the right statistical software or that
a request for the correct software is included in the grant proposal. There are many
commercial statistical software packages, e.g. STATA, SAS, SPSS, GENSTAT, StatXact,
MLWin, S-PLUS, BMDP, MINITAB, CIA, etc., but they do not all do the same things
and they vary both in their flexibility and in their complexity of operation. Free statistical
software is also available in the form of EPI INFO 2000 (http://www.cdc.gov/epiinfo) and
CLINSTAT (http://www.sghms.ac.uk/depts/phs/staff/jmb/jmbsoft.htm)
both of which can be downloaded from the web.
F-3 Ethics
F-3.1 The misuse of statistics
Altman (1991, 1982) argued forcefully that the misuse of statistics was unethical. The
term misuse of statistics covers both poor study design and inappropriate statistical
analysis. These are unethical as they can lead to conclusions that are erroneous or
misleading. At best, patients are inconvenienced and resources squandered for no good
reason. At worst patients are harmed through inappropriate clinical decisions based on the
erroneous research results.
56
F-3.2 Critical appraisal
Altman (1991, 1982) extends his ethical debate stressing the need for the results of
previous studies to be reviewed critically and not taken on face value. Without critical
appraisal erroneous results may lead to further research in a totally unhelpful direction.
This observation is particularly pertinent to grant applicants when compiling the
Background section of any research proposal. Results of previous research should not be
presented uncritically.
F-3.3 Studies involving human subjects
Studies involving human subjects, especially clinical trials, raise many ethical issues.
Guidance on these issues is contained in the Declaration of Helsinki
(http://www.wma.net/en/30publications/10policies/b3/). This declaration of ethical
principles was first adopted by the World Medical Association at its General Assembly
Meeting in Helsinki in 1964. It was updated in 1975, 1983, 1989, 1996, 2000, 2004, and
most recently in 2008. It is essential reading for any medical researcher, especially those
planning to conduct a clinical trial. Indeed mainstream journals consider it a condition of
publication that studies are conducted in accordance with the Declaration of Helsinki. How
the guidance offered by the Declaration should be implemented in practice still causes
some debate. Recently this focussed on the design of clinical trials where a proven
alternative exists to the new treatment under investigation. Rothman, Michels & Baum
(2000) argued that the new treatment should be compared with the proven alternative and
not with placebo and that the use of a placebo group in this particular situation is
unethical. At their meeting in Scotland in 2000, the World Medical Association adopted
this view which is now stated explicitly as principle No. 32 (see
http://www.wma.net/en/30publications/10policies/b3/ and B-3). For further information on
ethical considerations in clinical trials see sections B-1, B-3 and B-8 of this handbook.
F-4 Other research issues
F-4.1 Research governance
All research should be carried out to high scientific and ethical standards. Research
governance is the process by which these are ensured. Sponsors and funders of research
are expected to conform to these standards and to have procedures in place to ensure
that research projects for which they are responsible do, too
(http://www.dh.gov.uk/en/Publicationsandstatistics/Publications/PublicationsPolicyAndGui
dance/DH_4108962).
F-4.2 Data protection
All research on human subjects should be done under data protection principles, ensuring
the confidentiality of personal data and restricting the use of data to applications for which
consent has been given. In the UK, this is the responsibility of the Information
Commissioner (http://www.ico.gov.uk/). Applications should include a statement as to how
data protection principles and legislation will be compiled with.
57
References
(Starred references can be accessed via the web. Links are provided from the online
version of this guide)
Altman DG (1982) Misuse of Statistics is unethical. In Gore SM, Altman DG (eds.):
Statistics in Practice. British Medical Association, London.
Altman DG. (1991) Practical Statistics for Medical Research. Chapman and Hall, London.
*Altman DG, Matthews JNS. (1996) Interaction 1: Heterogeneity of effects. BMJ;313:486.
*Altman DG, Bland JM. (1997) Units of analysis. BMJ;314:1874.
*Altman DG. & Bland JM. (1998) Generalisation and extrapolation. BMJ;317:409-410.
Altman DG, Machin D, Bryant T, Gardner MJ. (2000) Statistics with confidence, 2nd ed..
British Medical Journal, London.
Armitage P, Berry G, Matthews JNS. (2002) Statistical Methods in Medical Research, 4th
ed.. Blackwell, Oxford.
*Bland JM and Altman DG. (1986) Statistical methods for assessing agreement between two
methods of clinical measurement. Lancet;i:307-310.
*Bland JM and Bland DG. (1994) One and two sided tests of significance. BMJ;309:248.
*Bland JM and Altman DG. (1994a) Regression towards the mean. BMJ;308:1499.
*Bland JM and Altman DG. (1994b) Some examples of regression towards the mean.
BMJ;309:780.
*Bland JM. & Altman DG. (1994c) Matching. BMJ;309:1128.
*Bland JM, Altman DG. (1995) Multiple significance tests: the Bonferroni method.
BMJ;310:170.
*Bland JM, Altman DG. (1996) Measurement error. BMJ;313:744.
*Bland JM, Altman DG. (1996a) Measurement error and correlation coefficients. BMJ;313:
41-42.
*Bland JM, Altman DG. (1996b) Measurement error proportional to the mean. BMJ;313:
106.
*Bland JM and Altman DG. (2002) Validating scales and indexes.BMJ;324:606-607.
*Bland JM, Kerry SM. (1997) Trials randomised in clusters. BMJ;315: 600.
*Bland JM, Kerry SM. (1998) Weighted comparison of means. BMJ;316:129.
Bland JM. (2000) An Introduction to Medical Statistics, 3rd ed.. Oxford University Press,
Oxford.
58
*Bland M. (2000a1) An Introduction to Medical Statistics, Oxford University Press, section
9.10.
*Bland M. (2000a2) An Introduction to Medical Statistics, Oxford University Press, section
10.7.
Bland JM. (2000b) Sample size in guidelines trials. Family Practice;17:S17-S20.
*Bland JM. (2002a) WMA should not retreat on use of placebos. BMJ;324:240.
*Bland JM. (2002b) Fifth revision of Declaration of Helsinki: Clause 29 forbids trials from
using placebos when effective treatment exists. BMJ;324:975.
Breslow NE and Day NE. (1980) Statistical Methods in Cancer Research: Volume 1 - The
analysis of case-control studies. IARC Scientific Publications No. 32, Lyon.
Breslow NE and Day NE. (1987) Statistical Methods in Cancer Research: Volume 1I - The
design and analysis of cohort studies. IARC Scientific Publications No. 82, Lyon.
Burr ML (1993): Epidemiology of Asthma. In Burr ML (ed.): Epidemiology of Clinical Allergy.
Monogr Allergy Vol 31,Basel, Karger. p 80-102.
Collett D. (1994) Modelling Survival data in Medical Research. Chapman & Hall, London.
*CLINSTAT software http://www.sghms.ac.uk/depts/phs/staff/jmb/jmbsoft.htm
Conover WJ. (1980) Practical Nonparametric Statistics, 2nd ed.. John Wiley & Sons, New
York.
*The CONSORT statement: revised recommendations for improving the quality of reports
of parallel group randomised trials. http://www.consort-statement.org
*Day SJ, Altman DG. (2000) Blinding in clinical studies and other studies. BMJ;321:504.
*Edwards P, Roberts I, Clarke M, DiGuiseppi C, Pratap S, Wentz R, Kwan I. (2002).
Increasing response rates to postal questionnaires: systematic review. BMJ;324:11831185.
Elashoff JD. (2000) nQuery Advisor Version 4.0 User’s Guide. Los Angeles, CA.
*Ferriman A. (2001) World Medical Association clarifies rules on placebo controlled trials.
BMJ;323:825
*Geleijnse JM, Witteman JCM, Bak AAA, den Breijen JH, Grobbee D E. (1994) Reduction in
blood pressure with a low sodium, high potassium, high magnesium salt in older subjects
with mild to moderate hypertension. BMJ;309: 436-440.
*Gibbons A. (2002) Performing and publishing a randomised controlled trial. BMJ;324:S131.
Goldstein H. (1995) Multilevel Statistical Models, 2nd ed.. Arnold, London.
*Guthrie E, Kapur N, Mackway-Jones K, Chew-Graham C, Moorey J, Mendel E, MarinoFrancis F, Sanderson S, Turpin C, Boddy G, Tomenson B. (2001) Randomised controlled
trial of brief psychological intervention after deliberate self poisoning. BMJ;323:135-138.
59
Hayes RJ. (1988) Methods for assessing whether change depends on initial value.
Statistics in Medicine;7:915-27.
Henshaw DL, Eatough JP, Richardson RB. (1990) Radon as a causative factor in
induction of myeloid leukaemia and other cancers. Lancet;335:1008-1012
Huskisson, E.C. (1974) Simple analgesics for arthritis. BMJ;4:196-200.
*Kerry SM, Bland JM. (1998) Analysis of a trial randomised in clusters. BMJ;316:54.
*Kerry SM, Bland JM. (1998b) Sample size in cluster randomisation. BMJ;316:549.
Kerry SM, Bland JM. (1998c) Trials which randomise practices I: how should they be
analysed? Family Practice;15:80-83
Kerry SM, Bland JM. (1998d) Trials which randomise practices II: sample size. Family
Practice;15:84-87
Kerry SM, Bland JM. (1998e) The intra-cluster correlation coefficient in cluster
randomisation. BMJ;316:1455.
Lemeshow S, Hosmer DW, Klar J, Lwanga SK. (1996) Adequacy of sample size in health
studies. John Wiley & Sons, Chichester.
Lilienfeld AM, Lilienfeld DE. (1980) Foundations of Epidemiology, 2nd ed.. Oxford University
Press, Oxford.
Machin D, Campbell MJ, Fayers P, Pinol A. (1998) Statistical Tables for the Design of
Clinical Studies, 2nd ed.. Blackwell, Oxford.
*Matthews JNS, Altman DG, Campbell MJ, Royston P. (1990) Analysis of serial
measurements in medical research. BMJ;300:230-235.
*Matthews JNS, Altman DG. (1996a) Interaction 2: compare effect sizes not P values.
BMJ;313:808.
*Matthews JNS, Altman DG. (1996b) Interaction 3: How to examine heterogeneity. BMJ;
313:862.
Nott MR, Peacock JL. (1990) Relief of injection pain in adults - EMLA cream for 5 minutes
before venepuncture. Anaesthesia;45:772-774.
Oldham PD. (1962) A note on the analysis of repeated measurements of the same subjects.
J Chron Dis;15:969.
Pocock SJ. (1983) Clinical Trials: A Practical Approach. John Wiley and Sons, Chichester.
*Rothman KJ, Michels KB, Baum M. (2000) For and against. Declaration of Helsinki
should be strengthened. BMJ;321:442-445.
*Thomas M, McKinley RK, Freeman E, Foy C. (2001) Prevalence of dysfunctional
breathing in patients treated for asthma in primary care: cross sectional survey.
BMJ;322:1098-1100.
60
*Tollman SM, Bastian H, Doll R, Hirsch LJ, Guess HA. (2001) What are the effects of the fifth
revision of the Declaration of Helsinki? BMJ;323:1417-1423.
Vollmer WM. (1988) Comparing change in longitudinal studies: adjusting for initial value. J
Clin Epidemiol;14:651-657.
Whitehead J. (1997) The Design and Analysis of Sequential Clinical Trials, revised 2nd
ed.. Chichester, Wiley.
Wetherill GB. (1981) Intermediate Statistical Methods. Chapman & Hall, London.
Zelen M. (1979) A new design for clinical trials. New Eng J Med; 300: 1242-1245.
Zelen M. (1992) Randomised consent designs for clinical trials: an update. Statistics in
Medicine;11:131-132.
61
Appendix 1
Checklist
Tick [✔] those that apply
Design
• Is the study observational? [ ]
(see A-1.1 and A-1.2)
If Yes
• Is it a cohort study? [ ]
(see A-1.3)
• Is it a case-control study? [ ]
(see A-1.4)
• Is it a cross-sectional study? [ ]
(see A-1.5)
If Yes to cross-sectional study
• Is it a prevalence study? [ ]
(see A-1.5a)
• Is it estimating sensitivity and specificity? [ ]
(see A-1.5b and A-1.5c)
• Is it an ecological study? [ ]
(see A-1.5d)
• Have you addressed the issue of confounding in your proposal? [ ]
(see A-1.6)
• Is the study experimental? [ ]
(see A-1.1, A-1.2)
If Yes
• Is the study a type of trial e.g. a clinical trial? [ ]
(see A-1.7, A-1.8)
If Yes
• Is the study a controlled trial
(i.e. is there a control group)? [ ]
(see A-1.8 and B-3)
• Is it a randomised trial
(i.e. are study subjects randomly allocated to groups)? [ ]
(see A-1.8 and B-5)
If Yes to randomised trial
• Is it important to have similar numbers in each randomisation
group? (you may need to use blocks) [ ]
(see B5.6)
• Are any known factors strongly prognostic? [ ]
(you may need to randomise in strata)
(see B5-7)
If Yes to strongly prognostic factors
• Is the proposed sample size small? [ ]
(see B-5.8)
• Are groups of individuals to be randomised together to the
same treatment? [ ]
(see B-5.9)
• Is this a cross over trial? [ ]
(see B-5.10b)
• Is the assessor blind? [ ]
(see A-1.8 and B-4)
• Are the study subjects blind? [ ]
(see A-1.8 and B-4)
• Is the study prospective? [ ]
(see A-2)
If Yes
• Have you specified the length of follow up? [ ]
(see A-2)
62
The Study Subjects
(see A-3)
• Have you described where they come from? [ ]
• Have you explained why they are an appropriate group? [ ]
• Have you described how the study subjects will be selected? [ ]
• Have you specified inclusion / exclusion criteria? [ ]
• Have you specified your proposed sample size taking into account refusals/drop-outs? [ ]
Types of Variables
(see A-4)
• Have you described all outcome and explanatory variables in terms of data type and scale of
measurement? [ ]
(see A-4.1 and A-4.2)
• Have you described how the data will be collected? [ ]
(see A-4.3)
• If using a questionnaire or a non-standard measurement, have you provided information on its
reliability and validity? [ ]
(see A-4.4, A-4.4a, A-4.4b, A-4.4c)
Sample Size
• Have you provided a sample size calculation? [ ]
(see D-1)
• Have you defined the outcome variable(s) used in the sample size calculation? [ ]
(see D-5)
• Have you defined the effect size which would be of clinical importance? [ ]
(see D-4.5)
• Have you described the power and significance level of the sample size calculation? [ ]
(see D-4.3 and D-4.4)
• Has your sample size made allowance for expected response rates and other sample
attrition? [ ]
(see D-6)
• Is your sample size consistent with the study aims? [ ]
(see D-7)
• Is your sample size consistent with the proposed analysis of the study? [ ]
(see D-7)
• Is your description of the sample size calculation adequate? [ ]
(See examples in D-8)
Statistical Analysis
• Have you described the proposed statistical methods using appropriate terminology? [ ]
(see E-1.1, E-1.2)
• Are the proposed methods appropriate for the types of data generated by your study? [ ]
(see E-2, E-2.1, E-11)
• Will the assumptions made by the proposed methods hold? [ ]
(see E-4, E-4.1)
• Do the proposed methods take account of the structure of the data set (structure such as hierarchy,
clustering, matching, paired data)? [ ]
(see E-3,E-6.1, E-6.2, E-10)
• Have important confounding factors been listed and methods of adjusting for them presented? [ ]
(see E-5)
• Will the proposed methods take account of multiple testing where appropriate? [ ]
(see E-7.1, E-7.2, E-7.3, E-7.4, E-7.4a, E-7.4b, E-7.4c, E-7.4d, E-7.4e, E-7.4f)
• Have biases due to measurement error been considered e.g. regression towards the mean? [ ]
(see E-8)
• Have details on the calculation of confidence intervals been provided? [ ]
(see E-12)
For clinical trials only
•Have you specified that your analysis will be by intention to treat? [ ]
(see E-9)
63
Appendix 2
Directory of randomisation software and services
This is a directory of randomisation software and services for clinical trials, including both
simple do-it-yourself software and 24 hour telephone randomisation services. It is
intended to help people planning and seeking funding for clinical trials.
If you know of other software or services which should be included, please email Martin
Bland [email protected] and they will be added to the directory. If your service is listed
here and you do not want it to be, please email Martin Bland and you will be removed.
This is an updated version of the Directory of randomisation software and services
previously held at running at St. George's Hospital Medical School.
This directory is partial. Exclusion from it does not imply that the service is inferior in any
way, just tell us who you are and we will include you. Inclusion in it does not imply that the
service has been approved by us. We take responsibility only for getting the links right.
Randomisation programs:
•
Clinstat is an old DOS program by Martin Bland, which is free. It is suitable for
small scale trials. It does blocked and unblocked allocations and random sampling.
Randomisation is found under main menu option 8. It prints simple lists of random
allocations. For stratified randomisation, just print a blocked randomisation list
separately for each stratum.
•
Minim is a DOS program by Stephen Evans, Simon Day and Patrick Royston. It
does allocation by minimisation very effectively and is free. The authors have
generously allowed us to put it on this site for downloading. It runs interactively
through your study, as this is how minimisation works.
•
Randomization.com is a free on-line randomisation program. It randomises while
you wait. It prints simple lists of random allocations.
•
GraphPad QuickCalcs, a free online calculator for scientists, offers simple random
allocation into equal-sized groups.
•
EDGAR, Experimental Design Generator And Randomiser, is a free on-line
randomisation program by James K. M. Brown (John Innes Centre). This is
designed for agriculture, and does Latin squares and split plots as well as simple
randomisation. It randomises while you wait. It prints lists of random allocations.
•
Stata is a commercial statistical analysis program. There is an add-on called
"ralloc", written by P. Ryan, that does blocked randomization, stratified
randomization, or both. Stata is a great program for analysis, though you would not
buy it just to randomise. In the UK, Stata is supplied by Timberlake Consultants.
•
PARADIGM Registration-Randomisation Software is a web-based package
produced by the Netherlands Cancer Institute and the UK Medical Research
Council Cancer Trials Office. It is free and runs through your study interactively.
•
KEYFINDER by Pete Zemroch is a menu-driven interactive program suitable for
statisticians. It produces factorial designs, including blocked and/or fractionalreplicate designs with user-specified confounding and aliasing properties.
KEYFINDER is available free of charge. (This link also leads to other advanced
statistical design programs.)
•
Iain Buchan's programme StatsDirect carries out randomisation into two groups
and in matched pairs, among many other statistical functions. The software is semi64
commercial, in that the revenue is used for more research in computational
statistics, but the cost is relatively low.
•
Random Allocation Software by Dr. Mahmood Saghaei, Isfahan University of
Medical Sciences, Iran, is a free downloadable program which carries out simple
and blocked random allocation.
•
Research Randomizer by Geoffrey C. Urbaniak and Scott Plous is a free net-based
program which generates sequences of random digits which can be used for a
variety of randomisation tasks. It can download randomisations in Excel format.
•
Adaptive Randomization, outcome-adaptive randomization program for clinical
trials from the M. D. Anderson Cancer Center, University of Texas. This is available
with much other statistical software on this site, including sample size and
predictive probability interim analysis software for randomized trials.
•
TENALEA (Trans European Network for Clinical Trials Services) is a free online
randomisation program and much more. TENALEA has been developed by the
Netherlands Cancer Institute and is currently in deployment phase, with a
European Union grant. This means that it can be offered free for non commercial
use.
•
Etcetera is one of Joe Abramson's free WinPepi programs for epidemiologists.
Randomisation is found under menu option A. The program offers simple and
balanced randomisation (unstratified or stratified), balanced randomisation of
successive blocks, an aid to minimisation, and random sequencing of procedures.
It prints lists of allocations.
•
RANDOM.ORG provides several on-line randomisation programs using random
numbers generated by atmospheric noise, rather than the pseudo-random number
algorithms used in most randomisation programs. It might not be the most suitable
program for randomised trials, but it is certainly Worth a look.
Randomisation services:
These provide trial support services including telephone randomisation. These are not
free. You must discuss your trial with the centre and agree their involvement before
applying for your grant. These services are not cheap. 10 pounds per patient randomised
is typical. They also provide many other collaborative services for trials. Some of these
organisations have their origins in academic research, others are purely commercial.
Telephone randomisation may be provided during normal working hours or 24 hours per
day. You should check what service you need and what the service provider offers. You
should also check what out-of-hours procedure they provide. This might be a voice
activated computer, a person sitting by the phone, or a phone directed to someone doing
something else.
•
York Trials Unit, Dept of Health Sciences, University of York. This group works in
collaboration with researchers on all aspects of trial design and analysis, including
telephone randomisation.
•
Birmingham Clinical Trials Unit offers customised minimisation randomisation
programs as well as a telephone service.
•
MRC/ICRF/BHF Clinical Trial Service Unit & Epidemiological Studies Unit,
University of Oxford, carries out large-scale collaborative trials.
•
The Clinical Trials Research Unit (CTRU) at the University of Leeds offers a wide
range of collaborative trial services.
65
•
The Health Services Research Unit (HSRU) at the University of Aberdeen offers a
24-hour automated telephone randomisation service. Please direct all enquiries to
Gladys McPherson [email protected] .
•
The Clinical Trial Support Unit at the University of Nottingham offers both web
based and telephone based randomization or minimization.
•
The Mental Health and Neuroscience Clinical Trials Unit at the Institute of
Psychiatry, King's College London, offers randomisation and other trials services to
mental health and neuroscience trials across the UK.
•
Clinical Trials Research Unit (CTRU), Faculty of Medical and Health Sciences,
University of Auckland, New Zealand offers 24 hour randomisation.
•
The NHMRC Clinical Trials Centre of the University of Sydney, Australia, provides
a randomisation service, available daily from 6 a.m. to 8 p.m. (24 hours a day for
acute cardiovascular trials).
•
Randomizer is a web-based online randomisation service provided by Medical
University of Graz. A fee is payable for this service.
•
Duke Clinical Research Institute (DCRI) Duke University Medical Center, USA,
offers Randomization: a 24-hour on-site, staffed randomization service with
interactive voice response system technology and emergency unblinding.
•
Rho, Inc. Randomization Systems and Services offer an interactive voice response
system for managing patient randomization during clinical trials, 24-hour.
•
Nottingham Clinical Research Limited (NCRL) provides a broad range of services
oriented to the Pharmaceutical and Biotechnology industries. As well as an
interactive voice response system NCRL provide statistics, data management,
monitoring and drug and materials storage & distribution. Main expertise is in large
cardiovascular outcome trials, in excess of 5000 patients.
•
Covance InterActive Trial Management Systems offers randomisation by an
interactive voice response system, oriented towards the pharmaceutical industry.
•
The Sealed Envelope is a web-based on-line random allocation system.
•
ClinPhone provides a service oriented towards the pharmaceutical industry,
offering data collection as well as randomisation by phone.
•
ASCOPHARM offer a variety of central randomisation systems for the
pharmaceutical industry.
•
IDDI (International Drug Development Institute) is a Belgian Central Service
Randomization Provider with offices in France and in the United States. Since
1991, IDDI has developed an expertise in Phase I through IV clinical trials mainly in
oncology, ophthalmology and cardiovascular.
•
Clarix LLC provides fully web-integrated Interactive Voice Response Systems
(IVRS), Electronic Data Capture (EDC) systems and a portfolio of web-enabled
technology solutions to streamline clinical trial management.
Thanks for the information to Joe Abramson, Doug Altman, Andrea Berghold, Jan
Brogger, Iain Buchan, Mike Clarke, Tim Cole, John Cook, Jon Cooke, Christian Coppe,
Simon Coulton, Cynthia Beck, Diana Elbourne, Matthew Gillman, Johnathan Goddard,
Jacqui Hill, Steff Lewis, Richard Martinez, Gladys McPherson, Caroline Murphy, John C.
66
Nash, Mark Nixon, Nicole Rensonnet, David Shuford, Pete Zemroch, and a couple of
Google searches.
67


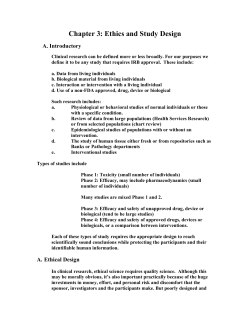


© Copyright 2026