
!! U. S. LOTIC PROPER FUNCTIONING CONDITION (PFC) CHECKLIST USER MANUAL
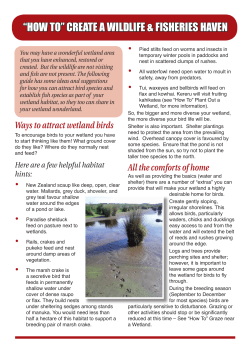
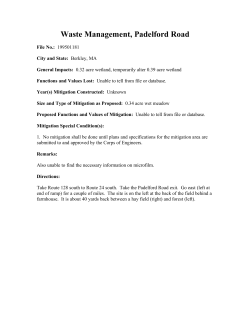
!!
U. S. LOTIC PROPER FUNCTIONING CONDITION (PFC) CHECKLIST
USER MANUAL
(Current as of 6/6/2014)
This user manual is intended to accompany the Lotic Proper Functioning Condition (PFC) Standard Checklist Form for
assessing proper functioning condition of riparian wetlands associated with systems having flowing water and (usually) a
defined channel. This document serves to assist data collectors in answering each item on the form and as an aid to the
database user in the interpretation of data presented. Another form entitled the Lentic Proper Functioning Condition (PFC)
Standard Checklist Form, with a different set of user guidelines, is to be used for lentic (still water) wetlands.
!
BACKGROUND INFORMATION
!
Flowing Water (Lotic) Wetlands vs. Still Water (Lentic) Wetlands
Cowardin and others (1979) point out that no single, correct definition for wetlands exists, primarily due to the nearly
unlimited variation in hydrology, soil, and vegetative types. Wetlands are lands transitional between aquatic (water) and
terrestrial (upland) ecosystems. Windell and others (1986) state, “wetlands are part of a continuous landscape that grades
from wet to dry. In many cases, it is not easy to determine precisely where they begin and where they end.”
!
In the semi-arid and arid portions of western North America, a useful distinction has been made between wetland types based
on association with different aquatic ecosystems. Several authors have used lotic and lentic to separate wetlands associated
with flowing water from those associated with still water. The following definitions represent a synthesis and refinement of
terminology from Shaw and Fredine (1956), Stewart and Kantrud (1972), Boldt and others (1978), Cowardin and others
(1979), American Fisheries Society (1980), Johnson and Carothers (1980), Cooperrider and others (1986), Windell and others
(1986), Environmental Laboratory (1987), Kovalchik (1987), Federal Interagency Committee for Wetland Delineation
(1989), Mitsch and Gosselink (1993), and Kent (1994).
!
Lotic wetlands are associated with rivers, streams, and drainage ways. Such wetlands contain a defined channel and
floodplain. The channel is an open conduit, which periodically or continuously carries flowing water, dissolved and
suspended material. Beaver ponds, seeps, springs, and wet meadows on the floodplain of, or associated with, a river or
stream are part of the lotic wetland.
!
Lentic wetlands are associated with still water systems. These wetlands occur in basins and lack a defined channel and
floodplain. Included are permanent (i.e., perennial) or intermittent bodies of water such as lakes, reservoirs, potholes,
marshes, ponds, and stockponds. Other examples include fens, bogs, wet meadows, and seeps not associated with a defined
channel.
!
Functional vs. Jurisdictional Wetland Criteria
Defining wetlands has become more difficult as greater economic stakes have increased the involvement of more politics and
less science. A universally accepted wetland definition satisfactory to all users has not yet been developed because the
definition depends on the objectives and the field of interest. However, scientists generally agree that wetlands are
characterized by one or more of the following features: 1) wetland hydrology, the driving force creating all wetlands, 2)
hydric soils, an indicator of the absence of oxygen, and 3) hydrophytic vegetation, an indicator reflecting wetland site
conditions. The problem is how to define and obtain consensus on thresholds for these three criteria and various
combinations of them.
!
Wetlands are not easily identified and delineated for jurisdictional purposes. Functional definitions have generally been
difficult to apply to the regulation of wetland dredging or filling. Although the intent of legislation is to protect wetland
functions, delineation of jurisdictional wetlands has relied largely on structural features or attributes. The hydrogeomorphic
(HGM) approach being developed by the US Corps of Engineers is intended to focus more specifically on wetland functions.
!
The prevailing view among many wetland scientists is that functional wetlands need to meet only one of the three criteria as
outlined by Cowardin and others (1979) (e.g., hydric soils, hydrophytic plants, and wetland hydrology). On the other hand,
jurisdictional wetlands need to meet all three criteria, except in limited situations. Even though functional wetlands may not
meet jurisdictional wetland requirements, they certainly perform wetland functions resulting from the greater amount of
water that accumulates on or near the soil surface relative to the adjacent uplands. Examples include some woody draws
!
Manual current as of 6/6/2014
1!
Check www.ecologicalsolutionsgroup.com for latest dataset and manual
occupied by the Fraxinus pennsylvanica/Prunus virginiana (green ash/chokecherry) habitat type and some floodplain sites
occupied by the Artemisia cana/Agropyron smithii (silver sagebrush/western wheatgrass) habitat type or the Pinus
ponderosa/Cornus stolonifera (ponderosa pine/red-osier dogwood) habitat type. Currently, many of these sites fail to meet
jurisdictional wetland criteria. Nevertheless, these sites do provide important wetland functions and may warrant special
managerial consideration. The current interpretation, at least in the western United States, is that not all functional wetlands
are jurisdictional wetlands, but all jurisdictional wetlands are functional wetlands.
!
Polygon Delineation
The lotic wetland inventory process incorporates data on a wide range of biological and physical categories. The basic unit of
delineation within which this data is collected is called a polygon. A polygon is the area upon which one set of data is
collected. One inventory form is completed (i.e., one set of data is collected) for each polygon. One or more (usually several)
polygons constitute a project. A lotic (riparian) polygon is an area adjacent to a waterway (stream or river). Polygons are
delineated on topographic maps by marking the upper and lower ends before observers go to the field. (The widths of most
riparian wetland zones are unknown before the inventory and cannot be pre-marked.) On topographic maps, most polygons
are usually drawn as a single line following the stream or river and are numbered sequentially proceeding downstream. It is
important to clearly mark and number the polygons on the topo map. Polygons are numbered pre-field (in the office) with
consecutive integers (1, 2, 3 . . . ). In cases where field inspection shows a need to change the delineation or to subdivide predrawn polygons, additional polygons should be numbered using alpha-numerics (e.g., 1a, 1b, 2a, 2b, etc.). When delineated
polygons are subsequently combined in the field, the combinations are to be identified by the hyphenated tags of both
combined parts (e.g., 1-2, 2-3, etc.).
!
If aerial photos are available, advance (pre-field) polygon delineations may be based on vegetation differences, geologic
features, or other observable characteristics. On larger systems with wide riparian areas, aerial photos may allow the pre-field
delineation of multiple polygons away from the channel. In these cases, where polygons can be drawn as enclosed units
(instead of just as a line), a minimum mapping unit of 5 or 10 acres (2 to 4 ha) should be used. The size of the minimum
mapping unit should be based on factors such as management capabilities and the costs and capabilities of data collection.
!
In the field, observers are to verify (ground truth) the office-delineated polygon boundaries. If the pre-assigned numbers are
used, be sure the inventoried polygons correspond exactly as drawn. Observers are allowed to move polygon boundaries,
create new polygons, or consolidate polygons if the vegetation, geography, location of fences, or width of the wetland zone
justify it. If polygon boundaries are changed, the changes must be clearly marked on the field copies of the topographic maps.
The original polygon numbers should be retained on the map for cross-reference. Polygons should not cross fences between
areas with different management.
!
Upper and lower polygon boundaries are placed at distinct locations such as fences, stream confluences, or stream meanders
that can be recognized in the field. Polygons should not cross fences between areas with different management. In most
cases, polygons are delineated 0.25-0.75 mi long. On smaller streams, polygons include the land on both sides of the stream.
On large rivers, or if property ownership or access differs, polygons may include only one side of a stream.
!
The outer boundaries of riparian polygons are at the wetland vegetative outer edges. These boundaries are sometimes clearly
defined by abrupt differences in the geography and/or vegetation, but proper determination often depends on experienced
interpretation of more subtle differences. The area to be assessed includes any terraces dominated by facultative wetland and
wetter plant species (Lichvar 2012), the active floodplain, and streambanks (Figure 1). Reference to the NWI list of plants
found in wetlands should not be necessary to determine the area for evaluation. The evaluator should simply focus on that
area which is obviously more lush, dense, or greener by being closer to the stream.
!
Manual current as of 6/6/2014
2!
Check www.ecologicalsolutionsgroup.com for latest dataset and manual
!!
!
Figure 1. A schematic example of a typical riparian zone cross section showing near-channel landform
features. NOTE: FAC (facultative), OBL (obligate), UPL (upland), etc. refer to categories of frequency a
species is found in wetlands (Lichvar 2012).
The location of the inner (or streamside) polygon boundary must be known (at least approximately), even on polygons that
span the stream. On most streams the area of the channel bottom is excluded from the polygon. (NOTE: The whole channel
width extends from right bankfull stage to left bankfull stage; however we need to include the lower banks in all polygons,
therefore consider for exclusion ONLY the relatively flat and lowest area of the channel—the bottom.) This allows data to be
collected on the riparian area while excluding the aquatic zone, or open water, of the stream. The aquatic zone is the area
covered by water and lacking persistent emergent vegetation. Persistent emergent vegetation consists of perennial wetland
species that normally remain standing at least until the beginning of next growing season, e.g., Typha species (cattails),
Schoenoplectus species (bulrushes), Carex species (sedges), and other perennial graminoids.
!
In many systems, large portions of the channel bottom may become exposed due to seasonal irrigation use, hydroelectric
generation, and natural seasonal changes such as are found in many prairie ecosystems. In these cases, especially the prairie
streams, the channel bottom may have varying amounts of herbaceous vegetation, and the channel area is included in the
polygon as area to be inventoried. Typically, these are the pooled channel stream type that has scour pools scattered along the
length, interspersed with reaches of grass, bulrush, or sedge-covered channel bottom. If over half (>50%) the channel bottom
area has a canopy cover of persistent vegetation cover (perennial species), taken over the entire length of the polygon as a
whole, then it qualifies for inclusion within the inventoried polygon area. If you are in doubt whether to include the channel
bottom in the polygon, then leave it out, but be sure to indicate this in the comment section. This is important so that future
assessments of the polygon will be looking at the same area of land.
!!
!
PFC FORM ITEM CODES AND INSTRUCTIONS
Polygon Data
The following are the codes and instructions for the individual data items on the form. All data items are to be recorded in the
field unless otherwise noted. Numbering corresponds to that of items on the form. Do not use — and do not leave items blank
NA means the item is not applicable to a particular polygon. NC means data was not collected for that item in a particular
polygon. Observers must write legibly and should limit use of abbreviations throughout to prevent confusion.
!
!
!
!
!
!
Record ID No. This is the unique identifier allocated to each polygon. This number will be assigned in the office when the
form is entered into the database.
Administrative Data
A1. Agency or organization collecting the data.
A2. Funding Agency/Organization.
A3a. BLM (Bureau of Land Management) State Office.
Manual current as of 6/6/2014
3!
Check www.ecologicalsolutionsgroup.com for latest dataset and manual
A3b. BLM Field Office/Field Station.
!
!
!
A3c. BLM Office Code (recorded in the office).
A3d. Is the polygon in an active BLM grazing allotment (recorded in the office)?
A3e, f. For BLM polygons, the BLM Office Code, whether the polygon is in an active BLM grazing allotment, and the
Allotment Number is supplied by the BLM. These items are entered into the computer in the office; the computer then
references a master list of Allotment ID’s to complete the remaining Allotment information. Because some polygons
incorporate more than one Allotment, space is provided to enter two sets of Allotment information. The master Allotment list
is periodically updated by the BLM National Applied Resource Sciences Center to make needed corrections.
!
!
!
!
!
!
!
!
!
!
A4. USDI Fish and Wildlife Service Refuge name.
A5. Indian Reservation name.
A6. USDI National Park Service Park/National Historical Site name.
A7. USFS (Forest Service) National Forest name.
A8. Other location.
A9. Year the field work was done.
A10. Date of field work by day, month, and year.
A11. Names of all field data observers.
NOTE: Information for items A12a-h is found in the office; field evaluators need not complete these items.
A12. The several parts of these items identify various ways in which a data record may represent a resampling of a polygon
that may have been inventoried again at some other time. The data in this record may have been collected on an area that
coincides precisely with an area inventoried at another time and recorded as another record in the database. It may also
represent the resampling of only a part of an area previously sampled. This would include the case where this polygon
overlaps, but does not precisely and entirely coincide with one inventoried at another time. One other case is where more than
one polygon inventoried one year coincides with a single polygon inventoried another year. All of these cases are represented
in the database, and all have some value for monitoring purposes, in that they give some information on how the status on a
site changes over time. This is done in the office with access to the database; field evaluators need not complete these
items.
!
!
A12a. Has any part of the area within this polygon been inventoried previously, or subsequently, as represented by any other
data record in the database? Such other records would logically carry different dates.
A12b. Does the areal extent of this polygon exactly coincide with that of any other inventory represented in the database? In
many cases, subsequent inventories only partially overlap spatially. The purpose of this question is to identify those records
that can be compared as representing exactly the same ground area.
!
!
!
!
!!
A12c. Does this record represent the latest data recorded for this site (polygon)?
A12d. If A12b is answered Yes, then enter the record ID number(s) of any other previous or subsequent re-inventories
(resampling) of this exact polygon for purposes of cross-reference.
A12e. Enter the years of any records recorded in item A12d as representing other inventories of this exact polygon.
A12f. Even though this polygon is not a re-inventory of the exact same area as any other polygon, does it share at least some
common area with one or more polygons inventoried at another time?
Manual current as of 6/6/2014
4!
Check www.ecologicalsolutionsgroup.com for latest dataset and manual
A12g. Enter the years of any other inventories of polygons sharing common ground area with this one.
!
!
!
!
!
!
!
A12h. If A12f is answered Yes, then enter the record ID number(s) of any other polygon(s) sharing common ground area with
this one.
A13a. Has a management change been implemented on this polygon?
A13b. If A13a is answered Yes, in what year was the management change implemented?
A13c. If A13a is answered Yes, describe the management change implemented.
Location Data
B1. State in which the field work was done (recorded in the office).
B2. County or municipal district in which the field work was done (recorded in the office).
B3. This field for allotment,range, or management unit is intended for entities other than the BLM to use for grouping
polygons by management unit. The BLM management units are grouped using the grazing allotment information in A3
above.
!
!
!
B4a. For lotic polygons the area is usually listed as a stream name, or other local designation that identifies the area where
the inventory is conducted. If possible, use a name that is shown on the 7.5 minute topographic map.
B4b. Record the name of the larger stream into which the stream containing the inventoried polygon flows.
B4c, d. Polygons are often grouped together for management purposes. For example, all polygons around Henry’s Lake in
the Idaho Falls Field Office could be identified as Group Name: Idaho Falls Field Office; Group Number: 1 (This information
is recorded in the office).
!
!
!
!
!
B5. Polygon number is a sequential tag identifying the portion of the area assessed. This is referenced to the map
delineations. Sequences normally progress from upstream to downstream (i.e., Polygon 1 is the most upstream.).
B6a. Upper end elevation (feet or meters).
B6b. Lower end elevation (feet or meters).
B7. Stream gradient (percent).
B8a. Record GPS coordinate locations at both the upper and lower ends of the polygon. These coordinates will be reported in
degrees latitude and longitude, along with the GPS projection and accuracy. While in the field, record the GPS waypoint
number. The actual values of degrees, minutes, and seconds, along with decimal degrees, will be derived from the stored date
in the GPS unit. NOTE: All of North America is latitude = North, and longitude = West.
!
!
B8b. Record an explanation of what the “other” waypoint location is intended to mark.
B9. Identity the hydrologic unit code(s) (HUC) associated with the reach of stream contained in the polygon are recorded.
The HUC data is obtained from the US Geological Survey (USGS) National Hydrography Dataset (NHD) (USGS 2012).
Based on the finest level of resolution available from the USGS for the stream reach, the levels of HUC information are
entered by the computer onto the form. The USGS has divided the nation into successively smaller hydrologic units, based on
drainage basins and watersheds. These units fit into hierarchical levels, uniquely identified by a pair of digits for each
successive level (i.e., an eight-digit number identifies a drainage at the fourth (subbasin) level; and a twelve digit HUC
identifies one at the sixth (subwatershed) level (Figure 2).
!
As defined by the USGS (2012), a hydrologic unit is “a drainage area delineated to nest in a multi-level, hierarchical
drainage system. Its boundaries are defined by hydrographic and topographic criteria that delineate an area of land upstream
from a specific point on a river, stream or similar surface waters. A hydrologic unit can accept surface water directly from
upstream drainage areas, and indirectly from associated surface areas such as remnant, non-contributing, and diversions to
!
Manual current as of 6/6/2014
5!
Check www.ecologicalsolutionsgroup.com for latest dataset and manual
form a drainage area with single or multiple outlet points. Hydrologic units are only synonymous with classic watersheds
when their boundaries include all the source area contributing surface water to a single defined outlet point.”
!
!
Provision is made on the data form for multiple HUC units, because a polygon may include all, or part, of more than one
HUC unit (especially when finer levels, such as the subwatershed [sixth] level, are identified).
The HUC data provided includes these items:
• HUC identification number to as many digits as have been delineated by USGS, down to the sixth level (12 digits);
• River miles of the stream from this HUC unit that fall within this polygon;
• Percent of the polygon stream reach that is located in this HUC unit (e.g., 100 percent if the entire polygon is all in
one HUC unit;
• Name of the region (first level of the HUC) (and its size in square miles);
• Name of the subregion (second level of the HUC) (and its size in square miles);
• Name of the basin (third level of the HUC) (and its size in square miles);
• Name of the subbasin (fourth level of the HUC) (and its size in square miles);
• Name of the watershed (fifth level of the HUC) (and its size in square miles); and
• Name of the subwatershed (sixth level of the HUC) (and its size in acres).
!
!
Manual current as of 6/6/2014
6!
Check www.ecologicalsolutionsgroup.com for latest dataset and manual
!
Figure 2. Hierarchy for the six nested levels of hydrologic units, as they are successively subdivided, and the numbering
scheme increases by two digits for each level of greater resolution (adapted from the USGS 2012)
!
Manual current as of 6/6/2014
7!
Check www.ecologicalsolutionsgroup.com for latest dataset and manual
!
Selected Summary Data
C1. Wetland type is a categorical description of the predominant polygon character. Select from the following list of
categories that may occur within a lotic system the one that best characterizes the majority of the polygon. Observers will
select only one category as representative of the entire polygon. If significant amounts of other categories are present,
indicate this in commentary field, or consider dividing the reach into two or more polygons.
!
——————————————————————————————————————————————————
Category Description
——————————————————————————————————————————————————
Perennial Stream. A stream or stretch of stream that flows continuously for most of most years. Perennial streams are generally fed in part
by springs or discharge from groundwater. Perennial streams are distinguished from larger rivers by size. Streams wider than 50 ft (15 m)
are considered rivers for the purpose of this inventory (see below).
Intermittent Stream. A stream or stretch of stream which flows only at certain periods of the year when it receives water from springs,
discharge from groundwater, or melting snow in mountainous areas. These streams generally flow continuously at least one month most
years.
Ephemeral Stream. A stream or stretch of stream that flows in normal water years only in direct response to precipitation. In normal years,
it receives no water from springs and no extended supply from melting snow or other surface source. Ephemeral streams are not in
contact with groundwater and normally do not flow continuously for as long as one month. Not all ephemeral streams support riparian
plant communities.
Subterranean Stream. A stream that flows underground for part of the stream reach. This occurs on systems composed of coarse textured,
porous substrates. Surface flow may disappear and re-emerge farther downstream.
Pooled Channel Stream. An intermittent stream that has significant channel pools after surface flow ceases. Pools are generally at
meander curves and are usually considerably deeper than the rest of the channel bottom. Water sources for the pools may be springs or
contact with subsurface groundwater. This stream type is typical of fine textured sedimentary plains in semi-arid regions where
headwater drainages lack the extended runoff of deep mountain snowpack. This stream type may not be apparent early in the season
when flow is continuous.
River. Rivers are generally larger than streams. They flow year around, in years of normal precipitation and when significant amounts of
water are not being diverted out of them. Those watercourses called rivers on topographic maps and/or those having bankfull channel
widths greater than 15 m (49 ft) will be classified as rivers for the purpose of this inventory.
Beaver Dams. A system that is predominantly characterized by beaver dams that change the character of the system from a regular flowing
channel to a stepped system of ponds where water is spread wide and flow velocity is apparent only at each dam outlet before it enters
the next pond. Water is still flowing through the riparian system.
Wet Meadow. This type of wetland may occur in either running water (lotic) or in still water (lentic) systems. A lotic wet meadow has a
defined channel or flowing surface water nearby, but is typically much wider than the riparian zone associated with the classes described
above. This is often the result of the influence of lateral groundwater not associated with the stream flow. Lotic and lentic wet meadows
may occur in proximity (e.g., when enough groundwater emerges to begin to flow from a mountain meadow, the system goes from lentic
to lotic). Such communities are typically dominated by herbaceous hydrophytic vegetation that requires saturated soils near the surface,
but tolerates no standing water for most of the year. This type of wetland typically occurs as the filled-in basin of old beaver ponds,
lakes, and potholes.
Spring/Seep. Groundwater discharge areas. In general, springs have more flow than seeps. This wetland type may occur in a running water
(lotic) or still water (lentic) system.
Irrigation Canal. Includes all types of canals and ditches associated with irrigation systems.
Other. Describe the water source (e.g., irrigation return flow, industrial discharge, etc.).
Upland. This designation is for those areas which are included in the inventoried polygon, but which do not support functional wetland
vegetation communities. Such areas may be undisturbed inclusions of naturally occurring high ground or such disturbed high ground as
roadways and other elevated sites of human activity.
——————————————————————————————————————————————————
!!
C2. The size (acres/hectares) of polygons large enough to be drawn as enclosed units on 1:20,000 or 1:50,000 scale maps is
determined in the office using a planimeter, dot grid, or GIS. For polygons too small to be accurately drawn as enclosed units
on the maps, and which are represented by line segments on the map along the drainage bottom, polygon size is calculated
using polygon length and average polygon width (items C5 and C7a).
!
!
C3a-d. Evaluators may be asked to survey some areas that have not been determined to be wetlands for the purpose of
making such a determination. Other polygons include areas supporting non-wetland vegetation types. A Yes answer indicates
Manual current as of 6/6/2014
8!
Check www.ecologicalsolutionsgroup.com for latest dataset and manual
that no part of the polygon keys to a riparian habitat type or community type (HT/CT). Areas classified in item D15 as any
vegetation type described in a riparian and/or wetland classification document for the region in which you are working are
counted as functional wetlands. Areas listed as UNCLASSIFIED WETLAND TYPE are also counted as functional wetlands.
Other areas are counted as non-wetlands, or uplands. The functional wetland fraction of the polygon area is listed in item C3c
in acres and as a percentage of the entire polygon area in item C3d.
!
C4. Some riparian areas do not contain an unvegetated, defined stream channel. In some cases, these polygons are in
ephemeral systems which may flow infrequently, but which do support riparian plant communities. In other cases, these
polygons may be associated with larger river systems that have wide floodplains where polygons may be delineated in areas
not adjacent to the channel.
!
!
C5. Channel length—the length of channel contained within or adjacent to the polygon—is measured by scaling from the
map. This data is considered accurate to the nearest 0.1 mile (0.16 km).
C6. In some cases, the polygon record is used to characterize, or represent, a larger portion of a stream system. The length
represented by the polygon is given. For example, a 0.5-mile polygon may be used to represent 4 miles of a stream. In the
case, 0.5 is the channel length of the polygon (item C5), and 4 miles is entered in item C6.
!
C7a. Record average width of the polygon, which on smaller streams corresponds to the width of the riparian zone. To
determine this width, subtract the width of the non-vegetated stream channel (item F9) from the distance between the two
opposite riparian/upland boundaries. In the case of very wide systems where the polygon inventoried does not extend across
the full width of the riparian zone (e.g., area with riparian vegetation communities lies outside the polygon), record the
average width of the polygon inventoried and make note of the situation in the narrative comments.
!
!
!!
C7b. Record the range of width (ft/m), narrowest to widest, of the riparian zone in the polygon.
C8. Record the Level 1 stream geomorphic characterization stream type, as defined by Rosgen (1994, 1996, 1998, 2006).
LOTIC PFC STANDARD CHECKLIST
!
For assistance and clarification in filling out and interpreting the checklist, refer to USDI BLM Technical Reference 1737-9
(Prichard and others 1993, revised 1995) and USDI BLM Technical Reference 1737-15 (Prichard and others 1998).
!
Photograph Data
NOTE: Take a number of photos upstream and downstream at each end of every polygon. This applies even to situations
where the polygon is at one end of an inventoried reach and one of the photos is taken into a non-inventoried area, as well as
situations in which another polygon is adjacent to the one being inventoried.
!
!
!
D1. Photos at the upstream end of the polygon. Take photos looking upstream and downstream. (Remember to record the lat/
long of the photo location.)
D2. Photos at the downstream end of the polygon. Take photos looking upstream and downstream. (Remember to record the
lat/long of the photo location.)
D3. Additional photos of the polygon. (A number of photos can be taken at each location. Remember to record the lat/long of
the photo location.)
!
Manual current as of 6/6/2014
9!
Check www.ecologicalsolutionsgroup.com for latest dataset and manual
LITERATURE CITED
!
American Fisheries Society, Western Division. 1980. Position paper on management and protection of western riparian
stream ecosystems. American Fisheries Society, Bethesda, Maryland, USA. 24p.
!
Boldt, Charles D., Daniel W. Uresk, and Keith E. Severson. 1978. Riparian woodlands in jeopardy on Northern High Plains.
In: Strategies for protection and management of floodplain wetlands and other riparian ecosystems (R. R. Johnson and J.
F. McCormick, Technical Coordinators). USDA Forest Service General Technical Report WO-12. Washington, DC, USA.
pp. 184-189.
!
!
Cooperrider, Allen Y., Raymond J. Boyd, and Hanson R. Stuart. 1986. Inventory and monitoring of wildlife habitat. USDI
Bureau of Land Management, Denver Service Center, Denver Colorado, USA. 858p.
Cowardin, L. M., V. Carter, F. C. Golet, and E. T. LaRoe. 1979. Classification of wetlands and deep water habitats of the
United States. USDI Fish and Wildlife Service, Office of Biological Services, Washington, DC, USA. Publication
Number FWS/OBS-79/31. 107p.
!
!
Environmental Laboratory. 1987. Corps of Engineers wetlands delineation manual. Technical Report Y-87-1. US Army
Engineer Waterways Experiment Station, Vicksburg, Mississippi, USA. 100p.
Federal Interagency Committee for Wetland Delineation. 1989. Federal manual for identifying and delineating jurisdictional
wetlands. US Army Corps of Engineers, US Environmental Protection Agency, USDI Fish and Wildlife Service, and
USDA Soil Conservation Service Cooperative Technical Publication, Washington, DC, USA. 76p.
!
!
Hansen, Paul L. and James B. Hall. 2002. Classification and management of USDI Bureau of Land Management’s riparian
and wetland sites in eastern and southern Idaho. Bitterroot Restoration, Inc., Corvallis, Montana, USA. 304p.
Hansen, Paul L., Robert D. Pfister, Keith Boggs, Bradley J. Cook, John Joy, and Dan K., Hinckley. 1995. Classification and
management of Montana’s riparian and wetland sites. Miscellaneous Publication No 54. Montana Forest and
Conservation Experiment Station, School of Forestry, University of Montana, Missoula, Montana, USA. 646p.
!
Hansen, Paul L., William H. Thompson, J. Gant Massey, and Max Thompson. 2008. Classification and management of
upland, riparian, and wetland sites of USDI Bureau of Land Management’s Miles City Field Office, eastern Montana
USA. Prepared for the USDI Bureau of Land Management Miles City Field Office, Miles City, Montana, USA. 640p.
plus 91p. of Appendix B (Indicator Species).
!
Johnson, R. R., and S. W. Carothers. 1980. Riparian habitats and recreation: interrelationships and impacts in the Rocky
Mountain region. Produced under agreement 53-82 FT-0-125 of the Eisenhower Consortium for Western Environmental
Forestry Research, Fort Collins, Colorado, USA. 109p.
!
!
!
Kent, Donald M. 1994. Applied wetlands science and technology. Donald M. Kent, editor. CRC Press, Inc., Lewis Publishers,
Boca Raton, Florida, USA. 436p.
Kovalchik, Bernard L. 1987. Riparian zone associations: Deschutes, Ochoco, Fremont, and Winema National Forests. USDA
Forest Service Region 6 Ecology Technical Paper 279-87. Pacific Northwest Region, Portland, Oregon, USA. 171p.
Lichvar, Robert W. 2012. The National Wetland Plant List. ERDC/CRREL TR-12-11. Cold Regions Research and
Engineering Laboratory, U.S. Army Engineer Research and Development Center. Hanover, New Hampshire, USA. 224p.
Available online at http://rsgisias.crrel.usace.army.mil/NWPL/#.
!
!
Mitsch, William J., and James G. Gosselink. 1993. Wetlands. Second Edition. Van Nostrand Reinhold, Publishers, New York,
New York, USA. 722p.
Prichard, Don, Hugh Barrett, Jim Cagney, Ron Clark, Jim Fogg, Karl Gebhardt, Paul L. Hansen, Brenda Mitchell, and Dan
Tippy. 1993 (revised 1995). Riparian area management: Process for assessing proper functioning condition. Technical
Reference 1737-9. USDI Bureau of Land Management Service Center. Denver, Colorado. USA. 52p.
!!
Manual current as of 6/6/2014
!
10
Check www.ecologicalsolutionsgroup.com for latest dataset and manual
Prichard, Don, John Anderson, Cindy Correll, Jim Fogg, Karl Gebhardt, Russ Krapf, Steve Leonard, Brenda Mitchell, Janice
Staats. 1998. Riparian area management: A user guide to assessing proper functioning condition and the supporting
science for lotic areas. Technical Reference 1737-15. USDI Bureau of Land Management Service Center. Denver,
Colorado. USA. 127p.
!
!
!
!
!
!
!
Rosgen, Dave L. 1994. A classification of natural rivers. Catena. 22: 169-199.
Rosgen, Dave. 1996. Applied River Morphology. Second edition. Wildland Hydrology. Pagosa Springs, Colorado, USA.
352p.
Rosgen, Dave and Lee Silvey. 1998. Field guide for stream classification. Wildland Hydrology. Pagosa Springs, Colorado,
USA. 193p.
Rosgen, Dave. 2006. Watershed assessment of river stability and sediment supply (WARSSS). Wildland Hydrology. Pagosa
Springs, Colorado, USA. 628p.
Shaw, S. P., and C. G. Fredine. 1956. Wetlands of the United States: Their extent and their value for waterfowl and other
wildlife. USDI Fish and Wildlife Service, Circular 39. Washington, DC, USA. 67p.
Stewart, R. E., and H. A. Kantrud. 1972. Classification of natural ponds and lakes in the glaciated prairie region. USDI Fish
and Wildlife Service, Research Publication 92. 57p.
Windell, John T., Beatrice E. Willard, David J. Cooper, Susan Q. Foster, Christopher F. Knud-Hansen, Lauranne P. Rink, and
George N. Kiladis. 1986. An ecological characterization of Rocky Mountain montane and subalpine wetlands. USDI Fish
and Wildlife Service Biological Report 86(11). National Ecology Center, Division of Wildlife and Contaminant Research,
Fish and Wildlife Service, US Department of the Interior, Washington, DC, USA. 298p.
!
United States Geological Survey (USGS).2012. Coordinated effort between the United States Department of AgricultureNatural Resources Conservation Service (USDA-NRCS), the United States Geological Survey (USGS), and the
Environmental Protection Agency (EPA). The Watershed Boundary Dataset (WBD) was created from a variety of sources
from each state and aggregated into a standard national layer for use in strategic planning and accountability. Available
URL: <http://datagateway.nrcs.usda.gov>.
!
Manual current as of 6/6/2014
!
11
Check www.ecologicalsolutionsgroup.com for latest dataset and manual


© Copyright 2026