
TREASURY MANAGEMENT FOR SACCOs PROCEDURE GUIDELINES AND TRAINING MANUAL
TREASURY MANAGEMENT FOR SACCOs PROCEDURE GUIDELINES AND TRAINING MANUAL April, 2007 This publication was produced for review by the United States Agency for International Development. It was prepared by Dr. Joachim Bald, Consultant, Frankfurt School of Financial Management for Chemonics International Inc. TREASURY MANAGEMENT FOR SACCOs PROCEDURE GUIDELINES AND TRAINING MANUAL The author’s views expressed in this publication do not necessarily reflect the views of the United States Agency for International Development or the United States Government. Rural SPEED A USAID funded project Contract No. PCE-I-00-99-00003-00, TO 826 This report submitted by Chemonics International Inc./April 2007 TREASURY MANAGEMENT FOR SACCOS TABLE OF CONTENTS 1 Background .................................................................................................1 2 Introduction and Overview.........................................................................2 3 Introduction to Liquidity Risk Management ............................................5 4 Measuring Liquidity on the Balance Sheet................................................9 5 Dynamic Liquidity Management Using Cash Flows ..............................17 6 Vault Cash Planning .................................................................................28 7 Internal Control & Cash Handling Procedures......................................36 8 Portfolio Credit Risk Management ..........................................................41 9 Designing a Treasury Management Policy .............................................46 10 Governance Issues ...................................................................................49 Appendices Appendix 1: Proposed Financial Reporting Format……………………52 Exercise 3: Ratio Comparison Across Institutions……………………55 Exercise 4: Long-Term Trend and Seasonality……………………….. 57 Rural SPEED TREASURY MANAGEMENT FOR SACCOS 1 BACKGROUND This document is the result of a visit to Uganda by the author in March 2007 upon invitation by the USAID Rural SPEED program. The two-week consulting intervention focused on treasury management practices within the rural Savings and Credit Cooperatives (SACCOs) who receive regular financial, training and consulting support through Rural SPEED. The consultant had the opportunity to work with Board members and management of all eight SACCOs in the Rural SPEED network during a two-day residential workshop in Masaka and also held in-depth working sessions with three individual SACCOs: Masaka Micro-Finance Co-Operative and Development Trust Ltd. (Mamidecot), Muhame Financial Services CoOperative Ltd., and Shuuku Co-Operative Savings and Credit Society. Together with the resident expert on treasury management at Rural SPEED, Mr. Eldard Ssebbale, the team strived to assemble some essential elements of treasury management that are relevant and appropriate for the stage of development and the material context that SACCOs operate in. Going in, we believed that treasury management for SACCOs would essentially amount to liquidity management combined with some elements of credit portfolio risk measurement. Interest rate risk concerns are negligible, as the loan portfolio is short-term and can re-price frequently, while on the liability side, SACCOs operate primarily with member capital and member sight deposits at minimal and contractually variable interest cost, as well as with small amounts of variable-rate and typically subsidized funding for special-purpose loan products. In the course of the workshop and the preceding individual work sessions, the SACCOs raised a number of practical treasury-related issues that went beyond the conventional scope of treasury management. We therefore included sections on internal control and cash handling procedures, practical governance concerns and some comments on staff retention and rotation. The following treasury management guidelines for SACCOs are designed as a practical toolkit and training document that should be useful for SACCO management and elected treasury officials in reviewing the basic elements of treasury in a SACCO environment. They could also easily become the basis for a formal treasury management policy adopted by the SACCO Board. Rural SPEED 1 TREASURY MANAGEMENT FOR SACCOS 2 INTRODUCTION AND OVERVIEW What is Treasury Management? The word treasury is used in many different contexts and can have quite a wide range of meanings: as a first reflex, some might think of treasury in a literal sense as the vault where the physical cash is kept and thus interpret treasury management narrowly as a set of cash handling procedures. Another traditional use of the word describes the financial function of a club, civic organization or the funding activities of a corporation. In a corporation, treasury often summarizes the tasks relating to working capital requirements and short-term investing and is distinguished from long-term funding handled by a separate corporate finance function. In financial institutions, treasury is generally understood very broadly as managing the entire intermediation function between equity capital and various types of liabilities on one side and the assets created with these resources on the other. The common denominator of all treasury activities in this broad sense is risk: measuring it, controlling it, diversifying it, hedging it. In a modern financial institution, be it Citibank or a member-owned microfinance institution, treasury management is risk management. Risk taking is at the heart of banking and microfinance. It is the conscious engagement in risks that constitutes the economic value of financial intermediation. SACCOs convert immediately available savings deposits into loans with longer maturities (maturity transformation). Individual savings deposits are also typically much smaller than an average loan, requiring multiple deposits to fund a single loan (size transformation). SACCOs convert savings deposits with an absolute expectation of safety and repayment into creditrisky loans to members (credit risk transformation). And finally, the loans a SACCO makes typically carry a fixed interest rate for their entire term, while the interest on savings deposits and - more importantly – on any additional borrowings from banks or microfinance support programs is variable and can be adjusted at any time according to changes in market interest rates (interest rate risk transformation). All of these financial transformations are risky. The key to successful treasury management is not to entirely avoid the risks, but to properly balance the risks against the rewards from potential profits. Identifying suitable trade-offs between risk and return is the core competence of the treasury management function. In practice it is easy to get blindsided by focusing on an attractive interest margin or the promise of a high return on equity , while underestimating the risks involved. We will devote the majority of this course to learning about instruments that help measure and manage the risk exposure. The first step towards this goal is to structure and classify the many risks that a financial institution faces. Rural SPEED 2 TREASURY MANAGEMENT FOR SACCOS Risk Overview Generally, bank treasury management is about measuring and controlling financial banking risks: liquidity, credit portfolio risk, capital adequacy and market risk. Compare Figure 1 below. Operational risks, that is anything that can go wrong with people, processes and systems, are typically dealt with outside of the definition of treasury. In working with SACCOs in Uganda, however, we found that there are a number of operational risk concerns that have direct implications for treasury management. This manual therefore discusses cash handling procedures as a way to minimize fraud and theft and also gives some advice on governance and control in member-owned financial institutions. Financial Financial Banking BankingRisks Risks Liquidity Risk Credit (Portfolio) Risk Capital Adequacy and Leverage Risk Market Risk Components Componentsof ofMarket MarketRisk Risk Interest Rate Risk Foreign Exchange Risk Equity Price Risk Most relevant risks for SACCOs in the context of Treasury Operational Operational Risk: Risk:people, people,processes, processes, systems systems Environmental Environmental Risk: Risk: competitive competitiveand andlegal legal risks risksetc. etc. Figure 1: Risk Landscape in Financial Institutions Since SACCOs generally do not hold trading positions in equity securities, equity price risk is not an important concern. We will also skip the market risks related to positions in foreign currency and derivatives, as SACCOs in Uganda are not permitted to and prudently should not engage in such transactions. In the following, we will briefly discuss capital adequacy / leverage risk and then focus on the two remaining most relevant financial risks for SACCOs: liquidity risk and credit portfolio risk. Capital Adequacy and Leverage Risk The primary function of a financial institutions’ equity capital is to support or absorb risk. When risks materialize and lead to losses, these losses are first offset against equity capital. Capital adequacy therefore is about determining whether an institution has sufficient amounts of equity in relationship to the risks it is exposed to. This question must be answered from both a regulatory and an economic perspective. Bank capital is very strictly regulated by governments and central banks. Being in compliance with minimum capital regulations, Rural SPEED 3 TREASURY MANAGEMENT FOR SACCOS however, is not enough to stay in business. Depositors and creditors look at the capital of a bank or SACCO as a safety cushion ensuring repayment of their claims. They will only place funds with the institution, if the equity capital appears large enough to absorb all losses that can realistically be expected to occur, i.e. if economic capital is adequate. Financial leverage is commonly defined as the effect of using debt financing on the owners’ return on equity. As a low margin business, banks rely heavily on debt (deposits, long-term borrowings, interbank purchased funds etc.) to improve the ultimate return on equity. Using high degrees of financial leverage is risky, because it increases the volatility of the residual net income and it increases the risk that an adverse business event consumes the equity and brings about bankruptcy. Exploiting financial leverage and providing generous equity coverage for adverse business eventualities are inherently conflicting goals. Hence, the eternal debate between shareholders/owners and regulators and creditors of financial institutions about the amount of equity to hold: owners would prefer to use as little equity as possible and work mostly with “other peoples’ money” as a way to improve returns, while creditors and depositors feel safer, if owners invest more of their own money as an equity risk buffer into the institution. For SACCOs, whose members hold the equity and also provide the vast majority of liabilities in the form of their deposits, the capital adequacy debate may appear not particularly relevant: it is all member money anyway, be it shares or deposits. And even loans are made only to members. Already, this is not entirely true, because a loan is generally much larger than the average share capital and deposit held by an individual member. The bigger the loan amount relative to the individual shareholding and parallel savings, the larger the temptation for the borrower to default on the loan. Yes, it is your own money that you are losing, but in actual fact it is mostly the other members’ money, because your individual loss compared to the loan amount is small. This problem of negative incentives becomes a very urgent concern, as soon as SACCOs take on substantial debt funding from banks or special microfinance support programs for onlending to members or to the general public. There is a danger that loan discipline deteriorates on the back of large amounts of “other peoples’ money”, particularly if the funding is coming from government sources. Having enough member money in the SACCO (i.e. capital adequacy) to maintain a healthy self-interest in the repayment of loans and to act as a loss cushion for the benefit of the external creditor are essential success factors in scaling up lending through SACCOs by means of special funding facilities. Rural SPEED 4 TREASURY MANAGEMENT FOR SACCOS 3 INTRODUCTION TO LIQUIDITY RISK MANAGEMENT Definitions Liquidity is the ability of a financial institution to honor all cash payment commitments as they fall due. These commitments can be met either by drawing from a stock of cash holdings, by using current cash inflows, by borrowing cash or by converting liquid assets into cash, see figure 2. Definitions Definitions Liquidity Ability to honor all cash payment commitments as they fall due. Use of: ¾ current cash inflows ¾ stock of cash holdings ¾ borrowing cash ¾ converting liquid assets into cash Figure 2: Definition of Liquidity Liquidity is important because not being liquid means bankruptcy. In the short-term, you can probably avoid liquidity problems simply by holding most of your assets in cash. In the long run, however, holding too much cash will also bankrupt you. Cash is a money loser because it does not earn enough to cover funding and administrative costs. Managing liquidity risk is about finding a middle way between having too much or too little cash. Liquidity risk is defined as the possibility of negative effects on the interests of owners, customers and other stakeholders of the financial institution resulting from the inability to meet current payment obligations in a timely and cost-efficient manner. Funding liquidity risk is the risk that the counterparties who provide the bank with short-term funding will withdraw or not roll over that funding creating a 'run on the bank' as depositors withdraw their funds. This is also often called an individual “name crisis”. For example, Guta Bank in Russia experienced such a run on its deposits in June 2004, see figure 3: Rural SPEED 5 TREASURY MANAGEMENT FOR SACCOS Figure 3: Retail Depositor Run on Guta Bank. Wall Street Journal June 2004. In order to discuss liquidity risk, it is useful to define more specifically what the liquid assets are that can be relied upon to meet payment obligations, see figure 4: Definitions Definitions Cash Assets Currency Bills and Coins (Vault Cash) + Demand and Transaction Deposits + Cash Items in the Process of Collection Liquid Assets Cash Assets + Other liquid items that can readily be sold for cash (e.g. money market deposits, treasury bills) Figure 4: Definition of Cash Assets vs. Liquid Assets Rural SPEED 6 TREASURY MANAGEMENT FOR SACCOS In commercial banks, the most common (non-cash) liquid assets are short-term loans covered by high-quality securities as collateral and investments in short-term government obligations. What makes these assets liquid is the fact that they can be sold in an active secondary market at a moment's notice, so that the cash value is often available for use the same day. Some MFIs are beginning to use money market deposits with other banks as a way to store liquidity while earning some interest on these idle funds. Exercise 1: Cash Assets vs. Liquid Assets Here is a list of random financial terminology. Try to classify each of the items on the list into one of the three categories (a) cash asset (b) liquid asset (but not a cash asset) or (c) neither a cash asset nor a liquid asset. 1) 2) 3) 4) 5) 6) 7) 8) 9) 10) 11) 12) 13) depreciation Ugandan Shilling bills in the safe (vault cash) a check received as repayment of a loan a microloan on your books stock holder's equity reserve for loan losses a deferred tax asset sight deposits with a commercial bank stock that the SACCO owns in a large industrial corporation an investment in 6-month government bills held by the SACCO a delinquent loan a wire transfer received by your bank in favor of the SACCO loan re-payment received in dollar bills at your satellite agency (c) (a) (a) (c) (c) (c) (c) (a) (c) (b) (c) (a) (a) Importance of Liquidity Liquidity is a vital condition for any business. The failure to meet payment obligations on time can trigger bankruptcy and gives creditors the right to take possession of the organization's assets. Liquidity is even more crucial for financial institutions because they are particularly vulnerable to unexpected and immediate payment demands. This is the nature of the loan making and deposit taking business. A bank cannot afford to send away a customer who wants to withdraw cash from his account with a "maybe tomorrow". To stay in business, a SACCO must be able to pay out legitimate withdrawals and credit requests instantly. Moreover, in the vast majority of daily transactions, the SACCO does not act on its own behalf, e.g. paying rent for bank offices or buying photocopy paper, but rather functions as a financial intermediary between savers and borrowers or as a payment agent for transfers between businesses or individuals. For this reason, the failure of a large financial institution can have far-reaching economic effects on the entire national financial system. Even the failure of a small village bank or a SACCO will affect the majority of individuals in that community directly or indirectly. Rural SPEED 7 TREASURY MANAGEMENT FOR SACCOS Once one SACCO goes under, depositors and creditors of other small financial institutions in the area will begin to wonder how safe their investments are and possibly start to withdraw their funds. Such domino effects can bring down even healthy institutions. If allowed to run unchecked, the chain reaction can bring about a liquidity crunch in the entire regional economy. The subsequent recession would severely affect the livelihood of most people in the area, many of whom may never have had any direct dealings with a SACCO or any other financial institution for that matter. It is important to keep in mind, however, that a liquidity crisis is almost always just the final manifestation of other deeper problems, i.e. the “symptom” rather than the “disease”. No financial institution ever goes bankrupt because of an error in liquidity management, such as by not ordering a large enough cash shipment for a busy withdrawal period. The crisis always starts with major losses in one of the principal business areas of the bank. For a SACCO, the underlying problem could be large loan losses, a major fraud or theft that become known to general public and raise doubts about the solidity of the institution. For this reason, liquidity is essentially synonymous with market confidence: as long as members, savers and the general public are confident that the SACCO can meet all of its obligations, the liquidity will never be challenged. But once rumors start to circulate and members and depositors become worried about the safety of their money, it becomes very difficult to head off a run on the institution and prevent collapse. Objectives of Liquidity Management Many microfinance institutions (MFIs) have set out on a development path towards becoming true financial intermediaries; offering not only loans, but a full range of banking services including savings, and transmission services. Dealing not only with the fluctuating demand for loans but also with erratic deposit variations makes the task of liquidity management quite complex and requires systematic planning. At the same time, the growing size of microfinance operations means that their financial stability has become an issue of regional economic importance. Liquidity therefore must be a top priority for every MFI. What constitutes good liquidity management and what are its objectives? The general goals of liquidity management are to: ¾ honor all cash outflow commitments on a daily and ongoing basis, ¾ minimize the cost of foregone earnings on idle liquidity, ¾ satisfy minimum reserve requirements and other regulatory liquidity standards, ¾ avoid additional cost of emergency borrowing and forced liquidation of assets. Rural SPEED 8 TREASURY MANAGEMENT FOR SACCOS 4 MEASURING LIQUIDITY ON THE BALANCE SHEET BALANCE SHEET RATIOS We will see later that only a detailed plan of future cash flows can give the necessary assurance that a financial institution will be able to meet its payment obligations, not just on average, but every day. Nonetheless, static balance sheet measures, usually expressed as a ratio between certain assets and liabilities, can have many useful applications for a MFI. Many banks use ratios in addition to detailed cash flow projections as a tool for high level planning and for formulating simple operating rules. External analysts, regulatory agencies and other stakeholders find them practical, because a ratio can give a quick indication of the overall liquidity position. Ratios make it easy to compare liquidity between different institutions or to calculate average liquidity for an entire sector of the financial industry. Ratios are also popular because of their limited data pre-requisites. It takes systematic planning and inputs from all parts of the MFI organization to draw up a credible cash-flow chart, but all you need in order to calculate a ratio is the last balance sheet. However, the real information value of a ratio lies not in its absolute number at a certain balance sheet date. Rather than looking at such a single snapshot, management should be concerned with the trends of the ratios over time. While ratios can seldom provide answers about changes in the MFI's liquidity or operational efficiency, marked trends in their development can point to questions that merit further investigation. Current Ratio Probably the best-known liquidity ratio is the Current Ratio, the quotient of current assets and current liabilities. Current assets and current liabilities are commonly defined as falling due within a year from the balance sheet date. Current Ratio = Current assets Current liabilities The current ratio is typically used by non-financial institutions. For a manufacturing business, for example, the current ratio essentially consists of cash, accounts receivable, and inventory as a percentage of accounts payable and other short term debt. This provides a good indication of the coverage of short-term payment obligations by assets that will self-liquidate over the same time period. Most organizations will strive for a ratio greater than one, as this indicates a certain liquidity cushion. For financial institutions, however, the current ratio has rather limited information value. The problem is that current assets include liquid assets (as per our earlier definition) plus shortterm loans to SACCO borrowers. This is not very practical, because it combines the liquidity safety stock with the most important use of liquidity, that is the loan portfolio. This is a particularly serious flaw, since most SACCOs lend predominantly short-term. One of the most important issues in liquidity management is to determine which proportion of the assets should be held as a liquidity reserve and how much can be loaned out. The current ratio is of no help in this regard. In fact, an institution that is completely "loaned-up" and has zero Rural SPEED 9 TREASURY MANAGEMENT FOR SACCOS liquidity would have the same current ratio as a MFI that has not made a single loan and holds all its current assets as vault cash. Liquidity Ratios for SACCOs Since the current ratio does not capture the essence of liquidity very well, let's take a systematic look at some of the other liquidity measures that have been developed specifically for use in financial institutions. We will distinguish three groups of ratios: asset liquidity measures, liability liquidity measures and combined asset-liability ratios. Most often, liquidity is stored in liquid assets. Asset liquidity measures therefore determine the proportions of different categories of liquid and non-liquid assets to the total asset volume. Cash Position Indicator The cash position indicator compares vault cash and demand deposits at other banks including the central bank to the total asset base of the institution at one moment in the time: Cash and deposits due from banks Cash Position Indicator = Total assets This ratio obviously ranges between 0 and 1, where a larger proportion of cash implies that the institution is in a stronger position to handle immediate cash needs. There is no simple rule as to what the value of the cash position indicator should be. Looking at the industry cross section of ratios for various institutions (Figure 6), one notices a wide range of observable year-end values. The limitations of such a snap-shot on December 31st are obvious: is this the seasonal low of cash after depositors withdrew their savings to prepare for Christmas or to cover expenses because of natural disasters, or is this the cash build-up in anticipation of an imminent draw-down of deposits for New Year festivities? Or does a 19.85% cash position at Türk Ekonomi Bankasi simply mean that Turkish banks have to hold higher minimum reserve requirements with the central bank than institutions in the Eurozone? Only after a careful assessment of the specific operating environment and the liquidity trends, can one attempt to judge whether a specific cash position indicator is appropriate for a particular MFI. Capacity Ratio The mirror image to the cash position is captured by the capacity ratio, which should be understood as an indirect liquidity indicator: Capacity Ratio = Net loans Total assets Net loans are defined as total loans minus the accumulated loan loss reserve. The capacity ratio indicates the extent to which an institution is loaned-up. The higher the capacity ratio, the lower the institution's liquidity. Even at zero liquidity, the capacity ratio will be less than Rural SPEED 10 TREASURY MANAGEMENT FOR SACCOS 1, because of the necessary investment in fixed assets. For many MFIs and SACCOs, however, the investment in fixed assets is quite small. The following ratios will look at liability liquidity rather than stored liquidity in the assets of the SACCO. Liability liquidity refers to the ease with which a financial institution can obtain new debt to acquire cash assets at low reasonable cost. A potential lender to a SACCO will look at the loan performance, capital base and the composition of the outstanding deposits and other liabilities. Everything else being equal, it will be easier to raise debt from commercial lenders, if the SACCO does not already have most of its business financed with short-term commercial borrowings or so-called purchased funds. It is preferable for a financial institution to rely on a large base of retail deposits as they are usually less costly and less volatile than commercial borrowings. Total Deposit Ratio Such a large base of retail deposits would be evidenced by a high total deposit ratio: Total Deposit Ratio = Total customer deposits Total assets The higher the total deposit ratio, the lower is the perceived liquidity risk because contrary to purchased funds, retail deposits are less sensitive to a change in interest rates or to a minor deterioration in business performance. When calculating customer deposits, it is important to exclude any potential inter-bank deposits or other short-term money market borrowings. Sometimes this distinction can become blurred as in the case of large brokered certificates of deposit (CDs) . When in doubt, the litmus test should be the interest rate sensitivity. If the MFI acquired the funds by bidding in an interest-rate competitive market, the CD should be classified as purchased funds and be excluded from the deposit base. Rural SPEED 11 TREASURY MANAGEMENT FOR SACCOS Purchased Funds Ratio The purchased funds ratio measures the amount of commercial short-term funding in relation to the total balance sheet volume. It is defined as: Short term borrowings + Purchased funds Purchased Funds Ratio = Total assets A large proportion of commercial short term borrowings and other purchased funds represents a liquidity risk, because this kind of hot money is very sensitive to interest rates and the perceived credit risk of the borrowing MFI. This funding is usually the first to dry up at the slightest appearance of financial difficulty, which again is when you would probably need it most. Loan-to-Deposit Ratio The loan-to-deposit ratio is a combined asset-liability measures of liquidity. Many financial institutions, financial analysts and regulators monitor loan-to-deposit ratios as a general measure of liquidity: Loan - to - Deposit Ratio = Net loans Total deposits Loans are considered less liquid assets, while deposits are understood as the primary source of funds. A high ratio indicates illiquidity, because in this case the bank would be fully loaned-up relative to its stable funding. Implicitly, it is assumed that new loans must be financed with large purchased liabilities. A low ratio suggests that a financial institution has additional liquidity, since it can grant new loans financed with stable deposits. Reserve Ratio Although there is no shortage of different liquidity indicators in commercial banking literature, surprisingly there is rarely mention of a ratio that compares cash assets to customer deposits. For MFIs, however, this is often the key question: how much cash should one hold against savings deposits? Many MFIs explicitly track this kind of reserve ratio and define liquidity rules on this basis. The World Council of Credit Unions, for example, recommends a 15% cash reserve on all customer deposits. A basic reserve ratio could be defined as: Reserve Ratio = Cash assets Customer deposits One could debate whether the numerator of the ratio should be cash assets or liquid assets. The idea of a liquidity reserve would obviously be best captured by including all liquid assets in the calculation. However, the analogy to a minimum reserve requirement imposed by the central bank is most obvious when limiting the numerator to vault cash and demand deposits Rural SPEED 12 TREASURY MANAGEMENT FOR SACCOS with other banks. It seems that it is this analogy to the regulatory minimum reserve that makes the reserve ratio such an attractive indicator for MFIs. Recommendations for SACCOs SACCOs are characterized by a professional organization with full-time management staff, an extensive lending operation and by large-scale deposit mobilization. SACCOs should therefore track the cash position indicator, the capacity ratio, the total deposit ratio and the reserve ratio. Those SACCOs that are actively using or are beginning to develop commercial short-term funding opportunities should also look at the purchased funds ratio. Figure 5 gives a snapshot of these liquidity ratio values for three USAID partner SACCOs in Uganda. Shuuku Mamidecot Muhame (Sep-06) Cash Position Indicator 6.87% 24.81% 12.70% Other Liquid Assets / Total Assets 0.00% 0.00% 0.00% Total Liquid Assets / Total Assets 6.87% 24.81% 12.70% Capacity Ratio 88.61% 67.21% 65.43% Total Deposits / Total Assets 24.76% 45.36% 43.18% Purchased Funds Ratio 0.00% 0.00% 0.00% Loan-to-Deposit Ratio 357.89% 148.16% 151.53% Reserve Ratio 27.74% 54.69% 29.42% Ratios as of 31-Dec-06 Figure 5: Liquidity Ratio Values for 3 Ugandan SACCOs The discussion on liquidity ratios beckons the question whether there are global benchmarks for what the target values for certain ratios should be. Unfortunately, there are no such universal benchmarks or rules of thumb about optimal liquidity ratios. This immediately becomes clear, if one looks at the wide range of observed values in the industry cross section in figure 6. Even a simple cash position indicator is heavily influenced by institutionspecific circumstances and is not easily generalized. One will readily accept that it makes no sense to look at the cash position in isolation without taking account of the size of other liquid assets that can quickly be turned into cash. More importantly, all balance sheet ratios fail to capture a very important element of liquidity management, i.e. the borrowing capacity of the institution. For banks and even Ugandan MDIs, much of the liquidity reserve is in their available short-term borrowing lines rather than in stored liquid assets. Also, one must bear in mind that an observed ratio on a certain balance sheet date is not necessarily an expression of that institution’s desired state of affairs. Why would Capitec Bank in figure 6 find it optimal to hold 45% of its assets in cash? It must be foregoing substantial interest by not investing these funds. The answer may simply be that Capitec just received the proceeds of a major capital transaction a few days before the balance sheet date and is in the process of investing these funds and then gradually will disburse more of the cash into earning assets. It is clear by now that simple balance sheet ratios cannot be a substitute for forward looking liquidity management in the sense of a cash flow plan that takes into account the particular Rural SPEED 13 TREASURY MANAGEMENT FOR SACCOS characteristics of the deposit supply and loan demand and any other operational cash flows in the institution. Nonetheless, liquidity ratios can be useful in formulating operating rules about safety margins and upper and lower limits that delineate the feasible space within which active cash-flow based liquidity management can operate. With these extensive cautions, now finally here are some recommended benchmarks that might serve as a starting point for defining operating rules in the SACCO’s liquidity management policy: ¾ Cash Position Indicator: min 10% ¾ Cash & Other Liquid Assets / Total Assets: min 15% ¾ Total Reserve Ratio = Cash & Other Liquid Assets / Total Deposits: min 25% ¾ Capacity Ratio: max 80% The binding constraints among the limits set above for the current business model of Ugandan SACCOs should be the Cash Position Indicator, Total Liquid Assets Ratio and their mirror image, the Capacity Ratio. Reserve ratios generally should not become binding until the SACCO is funded by a very high proportion of deposits. That is simply because a 15% Total Liquid Assets Ratio translates directly into a 30% Total Reserve Ratio if the SACCO is 50% funded by deposits. Note that Shuuku SACCO in figure 5 appears to be very highly invested in loans and runs a rather tight liquid assets position. If Shuuku wants to extend its lending operation, it should find additional outside funds or launch a savings mobilization campaign. Disbursing much further from the remaining liquidity might create excessive liquidity risk. Rural SPEED 14 TREASURY MANAGEMENT FOR SACCOS Banco Sol, Bolivia Grameen Bank, Bangladesh Prizma, Bosnia & Herzegovina Opportunity International, Serbia Pride Microfinance Ltd., Uganda Uganda Finance Trust FINCA Uganda Uganda Microfinance Ltd Dec-04 Dec-03 Dec-05 Dec-04 Dec-04 Dec-05 Dec-06 Feb-07 Dec-06 1.81% 0.98% 3.00% 2.20% 8.16% 1.37% 3.53% 11.41% 2.50% 8.02% 41.77% 10.99% 49.07% -/- 22.38% 3.15% 30.08% 31.63% 14.29% 22.09% 13.61% 15.26% 43.79% 66.29% 45.82% 75.22% 64.76% 86.17% 47.82% 55.95% 54.56% 58.39% 73.07% 66.19% 38.38% 49.13% 56.18% 77.90% 62.19% 71.20% 0.00% 0.04% 29.77% 35.20% 29.37% 25.59% 8.08% 15.24% 36.13% 32.73% 6.58% 0.00% 20.25% 4.30% 0.00% 0.15% 25.65% 4.01% 0.61% 22.92% 82.08% 105.82% 39.76% 89.13% 118.00% 58.83% 120.96% 90.95% n/a 127501.39% 187.97% 155.00% 198.81% 285.54% Loan-toDeposit Ratio 32.11% 21.73% 4.87% 5.82% 3.22% 1.26% 4.83% 3.08% n/a 3642.28% 11.85% 32.41% 8.51% 31.34% Reserve Ratio Liquidity Ratios – Industry Cross Section Tipperary Credit Union, Ireland Dec-05 2.86% 60.58% 70.04% 61.81% Total Deposit Purchased Ratio Funds Ratio Washington Mutual Dec-05 1.87% 4.79% 50.74% Capacity Ratio Bank of America Dec-05 14.38% 5.02% Cash Position Other Liquid Ass. / Indicator Total Assets Deutsche Bank AG Dec-05 19.85% Date Hamburger Sparkasse Dec-05 Organization Türk Ekonomi Bankasi 421.03% 9.11% 241.22% 68.52% 0.00% 6.32% 10.72% 84.25% 25.86% 57.73% 2.10% 7.87% 45.14% 7.67% Feb-06 Dec-05 Capitec Bank, South Africa Allied Bank Ltd., Pakistan Figure 6: Liquidity Ratios: Industry Cross Section 15 Rural SPEED TREASURY MANAGEMENT FOR SACCOS Exercise 2: Calculate Liquidity Ratios for Sample SACCO Sample SACCO Balance Sheet Shs '000 CAPITAL EMPLOYED Share Capital Reserves Shareholders' Funds Capital Grants Non-Current Liabilities Managed Funds Total Capital Employed 147,514 68,974 216,488 12,741 229,229 272,158 501,387 REPRESENTED BY: Non-Current Assets Current Assets Cash and Bank Customer Advances Receivables Stock Total Current Assets Current Liabilities Customer Desposits Payables Tax 44,864 350,160 948,641 63,392 4,502 1,366,695 640297 240315 29,560 910,172 Net Current Assets 456,523 Net Current & Non-Current Assets 501,387 Calculate the Cash Position Indicator, Capacity Ratio, Total Deposit Ratio, Purchased Funds Ratio, Loan to Deposit Ratio and Reserve Ratio on the above balance sheet. Solution: check the Mamidecot column in figure 5. It is also recommended to work Exercise 3 in the Appendix for an example of a ratio comparison across institutions. Rural SPEED 16 TREASURY MANAGEMENT FOR SACCOS 5 DYNAMIC LIQUIDITY MANAGEMENT USING CASH FLOWS It is a good start to measure liquidity or define operating rules by calculating certain balance sheet ratios based on historic data. For the most part, however, liquidity management must be forward looking. One cannot be sure that a SACCO will be able to cover all cash outflows on a specific day in the future simply by observing a 20% ratio of liquid assets to total deposits, for example. Assurance of future liquidity can only be achieved by deriving a detailed estimate of the size and timing of future cash inflows and outflows. For that purpose, one must draw up a timeline and fill in the projections of future cash flows. This is the essence of liquidity planning. The table in figure 7 conveys the basic concept of such a dynamic cash-flow chart. The individual cash flows are captured with their direction, their estimated size and the time interval in which they are expected to occur. Time Cash Flow Jan. 1 Savings Deposit Customer A Jan. 3 Jan. 4 ... +10 Disbursement Loan B -30 Repayment Loan C +40 Interest Payment Loan D Savings Withdrawal Customer E Jan. 2 +15 -5 -5 Branch Payroll Disbursement -60 Interest Payment Loan F +10 ...... Daily Cash Change Cumulative Cash Balance +5 +25 +5 -60 5 30 35 -25 Figure 7: Basic Idea of Dynamic Liquidity Planning based on Cash Flows Expected deposits from various customers, for example, are registered individually with a positive sign as a cash inflow. In contrast, expected loan disbursements to individual borrowers represent a cash outflow and are therefore shown as a negative figure. Even in a small single-branch SACCO, one will quickly realize that there are limitations to this bottom-up approach. There are just too many individual cash flow-relevant transactions. It is not feasible to predict the exact timing and size of each individual loan disbursement, interest collection, deposit transaction or remittance payment. Cash flows that occur often but in relatively small individual sizes will have to be approximated with statistical measures. We can then supplement these statistical forecasts with information about anticipated large individual transactions. The resulting timeline of Rural SPEED 17 TREASURY MANAGEMENT FOR SACCOS cash inflows and outflows allows us to calculate estimates of cumulative surpluses or deficits at specific points in time. These cash surpluses or gaps will then trigger appropriate liquidity management actions, i.e. either we invest excess cash or procure additional liquidity to cover shortfalls. Estimating Loan and Deposit Transactions To get started, we should ask ourselves what the most important categories of frequent, but small cash flows are in a SACCO operation. Typically, these will be loan disbursements and repayments as well as savings deposit transactions. That is why we project the cash-flows that are directly linked to these transactions as a first input to our dynamic liquidity planning model. Not only are these cash flows frequent and small when taken individually, they are also uncertain and cannot be directly controlled by SACCO management. The results of the dynamic liquidity planning model will therefore only be as good as our estimates about future cash flows. In order to predict future cash flows from loans and deposits, we need to first develop a clear understanding of the nature of the loan and deposit portfolios in a micro-finance environment. Most MFIs make small, uncollateralized working capital loans for tenors of less than one year. These loans are typically structured as installment loans requiring regular weekly or monthly payments of principal and interest. Many MFIs employ a graduation principle, where borrowers have to demonstrate their reliability by starting with very small loan amounts that are gradually increased with each successfully repaid credit. The use of the graduation principle already engenders an almost automatic growth trend in the loan portfolio. As we discussed before, great care should be taken not to interrupt this graduation chain even if liquidity is tight, since this would have dangerous consequences for the credibility of the institution. In addition to such a possible built-in loan-expansion factor, MFI management must strive to understand all other major determinants of its loan demand. How do the borrowers actually use the loans? Are the loans employed for working capital in a micro-business, as the loan application probably states, or are the funds used to finance seasonal or consumer spending instead? Sound data about the actual uses of loans will make it much easier to explain the seasonal and cyclical variations in loan demand. On the deposit side, it is well documented that even poor clients want to save and can accumulate funds that, if collected efficiently, will provide an attractive capital base for a MFI. In fact, it is the very poor who are particularly interested in the savings products to prepare for emergencies and unforeseen expenses. Poor households are often adverse to borrowing, even from a MFI, and prefer to invest their own savings instead of running the risk of not being able to repay a loan. Besides the need for emergency funds, common savings motives are school expenses, dowry, wedding costs, retirement etc. In addition to the safety of savings, which is always the primary concern of a saver, the second most important condition that micro-savers attach to their deposits is the immediate availability for withdrawal. Contrary to the apprehensions of many MFI managers, this does not mean that savers will indeed withdraw their funds frequently. Those who save to prepare for emergencies or to cover a specific, future expense will typically be very reluctant to take Rural SPEED 18 TREASURY MANAGEMENT FOR SACCOS out their money for lesser causes. Even after an emergency, the poor tend to replenish their savings accounts quickly. MFI managers often wonder how they can improve the stability of their deposit base while still allowing their many small savers immediate daily access to their funds. This can be done because of the great likelihood that many of the small individual transactions will offset each other. While one saver may experience an emergency and may withdraw his funds, two others might have just sold their products at the local market and make their weekly savings deposit. Conversely, the MFI would face a severe liquidity crisis, if most of its depositors were to be hit by an emergency at the same time, such as in a natural disaster. A natural disaster or a harvest failure could not only run down deposits but would also lead to an increased loan demand. Such correlation in client behavior can only be controlled by appropriate diversification. Many MFIs have begun opening branches to achieve diversification across different geographic areas. Fewer MFIs are aware of the liquidity risk of concentrating on a single socio-economic category of clients, who are often in the same line of business or subject to the same agricultural production cycles and thus display strongly-correlated cash-flow profiles. Projecting Net Liquidity Effects Before we start to project the cash flows of our lending and savings transactions, it should be pointed out that we will focus on the net liquidity effects of these transactions. In other words, the dynamic liquidity planning model will include projections of the outstanding loan portfolio on an aggregated basis, after having totaled expected new disbursements against planned repayments on old loans. The same principle applies to the deposit base. A widely used practical approach to estimating future loan and deposit development is to distinguish two components of total deposit and loan variability: a trend element and a seasonal component . The trend component represents the long-term growth rate of the loan portfolio and the deposit base. One could estimate these growth rates by fitting a trend curve through the deposit and loan totals for a long period of time (10 years, for example) using year-end or semi-annual balances as reference points. The seasonal component measures how deposits and loans behave in any given interval (month or week) due to seasonal factors as compared to the long-run growth trend increment. Rural SPEED 19 TREASURY MANAGEMENT FOR SACCOS Total outstanding loans Trend Seasonal deviation Total expected loans = Trend loans + seasonal deviation. Jan Feb Mar ... ... Nov Dec Figure 8: Decomposition of Loan Demand (or Deposit Supply) into Trend and Seasonal Elements Figure 8 shows an example of a loan portfolio that follows a long-term growth trend (depicted by the straight line) but is subject to strong seasonal fluctuations. During the early months of each year, loan demand tends to be higher than the average trend, while during the summer months it falls below the expected trend level. Deriving a 12-Month Forecast Figures 10 - 12 summarize the basic procedure for projecting changes in total loan and deposit volume over a 12-month planning horizon. The sample SACCO's year-end balance sheet, which serves as the reference point in the model, is provided in figure 9. Total loans and savings are forecasted monthly, using an annual trend growth rate and a seasonal variation index. In our example, deposits are expected to grow at a 6% annual rate and loans at 12%. These growth rates are calculated from historical data by fitting a trend line through the year-end balances. For simplicity, the annual loan and deposit growth trend is distributed linearly over the 12-month period, i.e. in UGS 8 Mio increments for deposits and UGS 14 Mio increments for loans. The seasonal variation is captured by a seasonal percentage index that is applied to the most recent December totals. It represents the average over five years of the ratios calculated on the figures for both loans and deposits by comparing the monthly actuals to the respective prior December numbers. Rural SPEED 20 TREASURY MANAGEMENT FOR SACCOS Reference Balance Sheet as of December 31, 2006 (UGS Millions) Assets Vault cash and due from banks Interest bearing deposits with banks Short-term investments Net loans outstanding Loans outstanding Loan loss Reserve Total current assets Premises, furniture and equipment Accumulated depreciation Other assets Total Assets 120 40 200 1,250 1,400 -150 1,610 500 -150 40 2,000 Liabilities Deposits Non-interest bearing transaction deposits Savings deposits Term deposits Short term borrowings Long-term debt 1,600 0 1,200 400 80 100 Total Liabilities 1,780 Member Equity Common Shares Retained Earnings 200 20 Total Member Equity 220 Total Liabilities and Member Equity 2,000 Figure 9: Reference Balance Sheet as of December 31, 2006 Rural SPEED 21 TREASURY MANAGEMENT FOR SACCOS End of Month Trend Deposits Seasonal Deposit Index Seasonal Adjustment Total Expected Deposits Jan. 1,608 99% - 16 1,592 Feb. 1,616 102% + 32 1,648 March 1,624 105% + 80 1,704 April 1,632 107% + 112 1,744 May 1,640 101% + 16 1,656 June 1,648 96% - 64 1,584 July 1,656 93% - 112 1,544 Aug. 1,664 95% - 80 1,584 Sept. 1,672 97% - 48 1,624 Oct. 1,680 101% + 16 1,696 Nov. 1,688 104% + 64 1,752 Dec. 1,696 100% 0 1,696 Figure 10: Deposit Forecast 2007 (UGS millions) In figure 10 our assumption about the growth trend of deposits is combined with a fictitious seasonal index. The seasonal index numbers are understood such that, independent of the general trend, January deposits average 99% of the prior December deposits. February deposits average 102% of the prior December volume etc. End of Month Trend Loans Seasonal Loan Index Seasonal Adjustment Total Expected Loans Jan. 1,414 101% + 14 1,428 Feb. 1,428 97% - 42 1,386 March 1,442 95% - 70 1,372 April 1,456 94% - 84 1,372 May 1,470 97% - 42 1,428 June 1,484 102% + 28 1,512 July 1,498 108% + 112 1,610 Aug. 1,512 106% + 84 1,596 Sept. 1,526 103% + 42 1,568 Oct. 1,540 99% - 14 1,526 Nov. 1,554 98% - 28 1,526 Dec. 1,568 100% 0 1,568 Figure 11: Loan Forecast 2007 (UGS, millions) Rural SPEED 22 TREASURY MANAGEMENT FOR SACCOS When comparing figures 10 and 11, we can clearly see a negative correlation between seasonal changes in deposits and loans. There is strong seasonal loan demand from May to September, which coincides with a seasonal run-down of deposits. This combination of increased loan demand and deposit loss leads to a high liquidity requirement during the summer months. End of Month ∆ Deposits ∆ Loans ∆ Cash = ∆ Deposits ∆ Loans Cumulative ∆ Cash Jan. -8 +28 -36 -36 Feb. +56 -42 +98 +62 March +56 -14 +70 +132 April +40 0 +40 +172 May -88 +56 -144 +28 June -72 +84 -156 -128 July -40 +98 -138 -266 Aug. +40 -14 +54 -212 Sept. +40 -28 +68 -144 Oct. +72 -42 +114 -30 Nov. +56 0 +56 +26 Dec. -56 +42 -98 -72 Figure 12: Estimated Liquidity Requirements 2007 (UGS, millions) Figure 12 presents the summary estimates of monthly cash needs. It is the change (∆) in the total balance of loans and deposits from month to month that produces the cash requirement. Obviously, the increase in loans from UGS 1,428 Mio at the end of May to UGS 1,512 Mio at the end of June does not mean that there was just one new loan for UGS 84 Mio paid out in June. In fact, the loan portfolio may very well have turned over entirely. The ∆ figure simply indicates that in total there were UGS 84 Mio more new loans paid out than repayments of principal received. A positive change in total loans thus signifies a subtraction from liquidity while a net inflow of deposits constitutes an addition to liquidity. The monthly change in cash is calculated as the difference between the change in deposits and the change in loans. The monthly additions or subtractions from cash are then totaled in the final column to provide the cumulative change in the cash position. For an example of how to combine a long-run trend estimate with a seasonal index using MS Excel we recommend to also work Exercise 4 in the Appendix. Rural SPEED 23 TREASURY MANAGEMENT FOR SACCOS Cash Flow from Interest Payments Loan and deposit transactions are not the only relevant cash flows that the liquidity manager needs to plan. Deposits earn interest and borrowers pay weekly or monthly interest in addition to principal installments. Unless the SACCO is in serious trouble, net interest income will be positive, and the liquidity planner can safely assume a steady trickle of additional liquidity accumulating from interest payments. Since we have already developed monthly forecasts for the loan and deposit balances, it is easy to derive the related interest revenue and expense estimate. We simply need to multiply the monthly loan balance with the average loan interest rate in order to calculate the cash inflow from loan interest for the month. Likewise, the total deposit balance for the month will be multiplied by the average deposit interest rate to forecast the interest expense per month. We can further refine this forecast if we distinguish between the individual loan types and various categories of deposits and then use the different product-specific interest rates. Alternatively, we can apply the weighted average interest rates to the total loan and deposit balances. In every case, the interest rates used should represent the contractual rate that is used to determine the actual payment obligation for the planning period. Adjusting the Cash Flow for Loan Losses Before we can combine all of our previous calculations to the total estimated change in cash from lending and deposit taking operations, we have to make one final adjustment for the cash effect of loan losses. Making an adjustment for loan losses in a cash flow plan might appear somewhat confusing. After all, the loan loss expense as it appears in the Income Statement is a non-cash item and thus should be excluded when estimating the cash flow from financial operations. Indeed, the loan loss expense is largely determined at the discretion of management and is intended to build up an accounting reserve for future and contingent loan losses. This number has no direct relationship to the actual cash loss from unpaid loans in the current period. We are interested here in estimating the size of the cash attrition from loan operations. You will recall that we based our forecast of the loan portfolio on gross loans before any allowance for loan losses. The idea was that only a net increase in outstanding loans represents a liquidity requirement, while the stock of loans might actually turn over several times during the year. This is only true as long as all loans are repaid when they fall due. Otherwise, the liquidity requirement increases by the amount of the lost loan. The cash attrition from the loan portfolio is determined by the repayment percentage and the turnover rate of the loans. Most MFIs closely track the percentage of loans that are repaid and find that this is a relatively stable proportion in the 90% to 98% range, depending on market conditions and the lending methodology. The turnover rate is simply the inverse of the average loan period. If the MFI grants loans with an average of six months term, then the turnover rate is twice per year or one sixth per month. The cash attrition is calculated as follows: Rural SPEED 24 TREASURY MANAGEMENT FOR SACCOS Cash attrition = Gross loan balance × Turnover rate × (1 - Repayment percentage) If we continue with a monthly planning interval and assume a 6-month average loan period with a 98% repayment rate, then the cash attrition on a gross loan balance of 1,500 would be given by: 1 Monthly cash attrition = 1,500 × × 0.02 = 5 6 Cash Flow from Operating Expenses In order to get a complete picture of the cash flows for the coming 12 months, we still have to incorporate the cash effect of non-interest operating expenses and revenues. Few MFIs will have noteworthy revenues apart from interest and similar fees and service charges. However, if a MFI has important income from consulting fees or collects rent on leased premises, for example, then these cash flows should obviously be included in the liquidity plan. In most cases, it will be sufficient to look at operating expenses only. Continuing with our example, we will look at last year's income statement as a reference point for the operating expenses forecast. The human resources committee expects an increase of 12% in the budget for staff salaries and benefits as of March 2007. All other expenses are subject to a steady inflation trend of 10% annually. In June 2007 the SACCO plans to open a new branch which will add UGS15,000 Mio to the annual base budget for salaries and benefits, UGS 6,000 to administration expenses and UGS 3,000 to rent. We further assume that all operating expenses are cash expenses, meaning that they actually represent a cash outflow during the accounting period. The only exception to this rule is the depreciation of fixed assets, which is a pure accounting expense and has no cash-flow consequence. Figure 13 summarizes the cash flow estimates from operating expenses for 2007. An annual inflation of 10% equals a monthly inflation rate of 1.10 1/12 - 1 = 0.797%. This rate is applied to the base of administrative expenses from last December to arrive at the January estimate: UGS20,000 / 12 x 1.00797 = UGS 1,680. In June, UGS 500 is added to the monthly base, which continues to grow at the rate of 0.797% per month. The same principles were applied to calculate the monthly installments of the occupancy and other operational expenses. Rural SPEED 25 TREASURY MANAGEMENT FOR SACCOS End of Month Salaries & Benefits Administration Expenses Occupancy Expenses Other Expenses Cash Total Jan. 10,000 1,680 1,680 420 13,780 Feb. 10,000 1,693 1,693 423 13,810 March 11,200 1,707 1,707 427 15,040 April 11,200 1,720 1,720 430 15,071 May 11,200 1,734 1,734 434 15,102 June 12,450 2,248 1,998 437 17,133 July 12,450 2,266 2,014 440 17,170 Aug. 12,450 2,284 2,030 444 17,208 Sept. 12,450 2,302 2,046 448 17,246 Oct. 12,450 2,320 2,062 451 17,284 Nov. 12,450 2,339 2,079 455 17,323 Dec. 12,450 2,358 2,095 458 17,361 Total 140,750 24,651 22,858 5,267 193,528 Figure 13: Monthly Estimates for Cash Operating Expenses 2007 (UGS millions) Long-Term Investing and Financing and Large Individual Cash Flows So far, we have accounted for the cash flow effects of the ongoing financial activities and the ordinary operating expenses of the sample SACCO. The only liquidity changes that still need to be included in the plan are the cash effects from long-term investing and financing and other large singular cash flows. These cash flows are relatively easy to predict because they are largely under the control of the SACCO management and are generally known well in advance. Unlike the small, but frequent cash transactions resulting from deposits and loans, cash flows in this category do not have to be statistically approximated. Instead, we can capture each one with its expected amount and the most likely time that it will occur. Examples of cash flows in this category include: ¾ cash proceeds from a capital increase or a long-term donor loan, ¾ dividend disbursements, ¾ tax payments, ¾ cash outlays for building a branch office or for purchasing computer equipment, ¾ cash purchase of shares in a cooperative organization that provides services to member SACCOs etc. Rural SPEED 26 TREASURY MANAGEMENT FOR SACCOS In figure 14, we compiled all individual cash flow effects considered thus far. This allows us to calculate the net periodic change in cash and the cumulative cash position. This is also called the net funding requirement. Financial Activities ∆ Deposits ∆ Loans Loan interest Loan fees/charges Deposit interest Interest on long-term debt Cash loan loss ∆ Cash from financial activities Operating Expenses Salaries & benefits Administration expenses Occupancy expenses Other oper. exp. ∆ Cash from operating expenses Long-term Inv./Fin. Share capital increase Dividends payment Tax payment Computer purchase New branch, tenant improvements Donor loan ∆ Cash long-term inv. & fin. Total ∆ Cash Total Cumulative ∆ Cash Jan Feb Mar April May June July Aug Sep Oct Nov Dec Total -8.00 -28.00 18.20 6.30 -4.00 56.00 42.00 18.60 6.10 -3.90 56.00 14.00 18.00 6.00 -4.10 40.00 0.00 17.80 6.00 -4.20 -88.00 -56.00 17.80 6.30 -4.30 -72.00 -84.00 18.60 6.70 -4.10 -40.00 -98.00 19.70 7.10 -3.90 40.00 14.00 20.90 7.00 -3.80 40.00 28.00 20.70 6.90 -3.90 72.00 42.00 20.40 6.70 -4.00 56.00 0.00 19.80 6.70 -4.20 -56.00 -42.00 19.80 6.90 -4.30 96.00 -168.00 230.30 78.70 -48.70 -0.58 -0.58 -0.58 -0.58 -0.58 -0.58 -0.58 -0.58 -0.58 -0.58 -0.58 -0.58 -7.00 -4.80 -4.60 -4.60 -4.60 -4.80 -5.00 -5.40 -5.30 -5.20 -5.10 -5.10 -5.20 -59.70 -20.88 113.62 84.72 54.42 -129.58 -140.38 -121.08 72.22 85.92 131.42 72.62 -81.38 138.56 -10.00 -1.68 -10.00 -1.69 -11.20 -1.71 -11.20 -1.72 -11.20 -1.73 -12.45 -2.25 -12.45 -2.27 -12.45 -2.28 -12.45 -2.30 -12.45 -2.32 -12.45 -2.34 -12.45 -2.36 -140.75 -24.65 -1.68 -0.42 -1.69 -0.42 -1.71 -0.43 -1.72 -0.43 -1.73 -0.43 -2.00 -0.44 -2.01 -0.44 -2.03 -0.44 -2.05 -0.45 -2.06 -0.45 -2.08 -0.46 -2.10 -0.46 -22.86 -5.27 -13.78 -13.81 -15.04 -15.07 -15.10 -17.13 -17.17 -17.21 -17.25 -17.28 -17.32 -17.36 -193.53 20.00 20.00 -2.00 -2.00 -10.00 -15.00 -2.00 -2.00 -10.00 -15.00 0.00 20.00 -34.66 119.81 -34.66 85.15 -4.00 0.00 0.00 0.00 0.00 65.68 39.35 -144.69 -157.52 -138.25 150.82 190.17 45.48 -112.03 -250.29 80.00 80.00 0.00 -10.00 -15.00 80.00 71.00 55.01 68.67 104.13 40.29 -18.74 -0.92 -195.28 -126.61 -22.47 17.82 -0.92 0.00 Figure 14: Cash Forecast Summary, Net Funding Requirements Figure 14 gives the liquidity manager a very concise view of the SACCO's projected cash position over the next year. This is what is expected to happen without any further intervention, i.e. in the absence of liquidity management. Obviously, the liquidity manager must procure additional cash to prevent the predicted cash-out in July and August by reducing short-term investments and/or borrowing short-term funds from banks or other microfinance support programs. The projected cash flows from these activities will in turn be added to the net funding requirements. It is only after this final step that the cumulative cash balances must strictly be positive and, moreover, must meet the minimum requirements set by management and by the regulatory authorities. In practice, it might be sufficient for SACCOs to forecast cash flows for just six months forward. However, the important point is that such as forecast must be maintained at least monthly by rolling it forward and rebasing it on the most recent actual values and by updating the forecast based on the current best estimates. This overall liquidity forecast should be complemented with a daily or weekly vault cash forecast for at least a rolling two week planning period. We will discuss vault cash planning in the following chapter. Rural SPEED 27 TREASURY MANAGEMENT FOR SACCOS 6 VAULT CASH PLANNING For SACCOs, vault cash (physical bills and coins) is a very important part of liquidity management. That is more so than in large commercial banks, where an ever increasing share of transactions occurs by non-cash means. In a SACCO, loan disbursements and repayments as well as deposit transactions are largely executed in physical currency. This means that most uses of liquidity and most contributions to liquidity pass through the vault. Let's imagine a one-unit village bank that has no links with the formal financial sector, not even an account with a local bank. The bank’s founders bring in their equity in cash bills. The clients deposit savings in cash and also take out and repay loans in physical money. Likewise, all operating expenses are paid in currency. Only in this extreme example, can we say that vault cash management is indeed equivalent to liquidity management. In the other extreme, some MFIs need no vault cash management at all, because they conduct business without ever touching physical cash. This is a practical option for MFIs that do not deal in retail deposits and operate in urban areas, where they can use accounts with commercial banks to disburse loans and receive payments. For those MFIs that have to hold some vault cash because of their remote location or the service expectations of their customers, the main question becomes: How much of our liquidity should we hold in bank deposits or other liquid assets and how much should we keep in the vault? We should note that, in practice, vault cash management has more dimensions than just the question of how much cash to hold. One also has to keep track of the denominations of the bills and coins. Moreover, many banks like to return "used" cash to a head office vault or even the central bank, where the money is checked for counterfeits, worn bills are sorted out and everything is neatly repackaged into standard lots. For the purposes of this manual, however, we will assume that the cash stock is in small enough denominations to satisfy all payment needs and that the SACCO will re-use the cash it receives from customers. How much then should we keep in the vault? One may actually consider holding the entire liquidity as vault cash thereby minimizing the risk of ever running out of currency. Obviously, this cannot work unless the SACCO fits the example of extreme cash reliance described above. Normally, a SACCO will have to maintain some liquidity in its accounts with other banks in order to clear checks and cover payment orders. All of the MFI's investing and financing activities, as well as many of the operating expenses, will also be transacted in book-money. Since the current accounts with other formal banks are the SACCO's connection to the formal financial system, a certain part of the liquidity must be held there. The Cost of Vault Cash When deciding the proportions of book balances versus physical cash holdings, we also have to consider that the vault is an expensive place to hold liquidity. Not only do we lose the interest otherwise earned on account balances. Physical cash is also exposed to the risk of theft and must be covered by costly insurance. Moreover, vault cash has storage and Rural SPEED 28 TREASURY MANAGEMENT FOR SACCOS handling costs (regular counting under four eyes etc.) and is limited by the physical size of the vault. In consequence, most banks actually lean towards holding as little as possible of their liquidity in vault cash while still avoiding stock-outs. Holding a large vault reserve is not the only way to prevent a shortfall of vault cash, however. One can achieve the same level of safety by ensuring that cash shipments can be brought in quickly and frequently. This could be as simple as sending an employee across the street to the branch of a formal bank to cash a check drawn on the SACCO's account. All cash shipments, even through such informal solutions, cost money. This cost is usually a fixed amount per transaction, independent of the size of the transport. Such shipment costs might include: the employee's time, that of the accompanying security guard, fuel and maintenance for the vehicle used, the time spent on counting the money and completing the documentation for the shipment etc. Obviously, the fixed cost of a cash shipment increases with the distance to the bank where the cash is ordered. Vault cash management is a trade-off between conflicting goals, very similar to what we encountered when first discussing overall liquidity management. Due to the substantial holding costs, one would like to reduce vault cash to a minimum. In order to meet all payment requests with reduced vault cash holdings, we would have to bring in cash and ship away cash more frequently. The problem with cash shipments is that their costs are largely fixed, regardless of the amount of currency transported. Therefore, it would be more efficient to make fewer larger shipments rather than many small ones. Fewer, larger shipments, however, will increase the average cash balance in the vault, leading to higher holding costs. The above clearly points to two of the most important factors in determining how much vault cash a bank should hold: (1) fixed shipment costs and, (2) vault cash holding costs. The third factor to consider is (3) some measure of cash demand. These three factors are enough to fully specify a vault cash model under a passive approach to vault planning. Passive Vault Cash Approach For now, let's assume the SACCO has gone through a general cash flow planning process as described in the previous chapter and is confident that it can meet all payment demands over the next 12 months. The only remaining question is the form in which the transactions will materialize. Is a particular cash inflow going to occur at the counter in physical cash or will the person submit a check? Will operating costs be paid in cash or by payment order? One reasonable approach to this problem is to simply wait and see what happens. Under this passive approach, the SACCO holds only a small safety stock of vault cash and keeps the majority of the liquidity in demand deposits with banks or in highly liquid investments. If the actual vault cash level falls below a certain minimum limit, a cash delivery is ordered in. If it reaches a certain maximum limit, cash is shipped away and credited to the SACCO's bank account. Since cash shipments have fixed costs, the SACCO would not allow very small shipments, but require an efficient shipment batch that falls between certain lower and upper limits. At this point, one could use statistical theory to compute optimal values for the lower and the upper cash limit and for the shipment size. Rural SPEED 29 TREASURY MANAGEMENT FOR SACCOS This is essentially what the Miller-Orr model does. Alternatively, one can use some rules of thumb to establish the same types of vault cash parameters. The Miller-Orr Control Limit Model The Miller-Orr model is based on the same passive vault cash management scenario as described above. Instead of formulating rules of thumb about the lower and upper cash limits and efficient order sizes, this model derives an optimal solution that will minimize the total cost of vault cash. The Miller-Orr model assumes that the daily movements of the vault cash balance are the consequence of many individual actions that to the financial institution appear random. On any given day, the cash balance either goes up or down, independent of the prior day's change. In probability theory, this situation is known as a random walk. The model uses the statistical properties of the random walk and combines these with the cost functions of transportation expenses and holding costs. On the basis of these assumptions, one can calculate an upper and a lower cash limit as well as an optimal return point. The optimal values in the Miller-Orr model are usually calculated for a lower cash limit of zero. A positive lower limit can subsequently be incorporated into the results by simply shifting the model parameters up in parallel. The optimal return cash level is given by: 13 ⎛ 3 × Order cost × Variance of daily vault balance ⎞ ⎜ ⎟ 4 × Daily holding cost of vault cash ⎝ ⎠ Upper limit Optimal return point Lower limit Rural SPEED Cash shipped out Cash shipped in 30 TREASURY MANAGEMENT FOR SACCOS Figure 15: Passive Vault Planning with Lower and Upper Control Limits The upper control limit is three times the optimal return cash level: Upper Control Limit = 3 × Optimal return cash level We will skip the mathematical justification for the optimal results according to the Miller-Orr model. It is easy to see, however, that the inputs into the formula are consistent with our intuitive argumentation about the important factors influencing vault cash levels in the "passive" approach. The formula explicitly takes account of the holding costs of vault cash and the fixed costs per shipment order. The cash demand is represented by the variance of daily changes in the cash position. The variance is calculated as the mean of the quadratic deviations from the average: 1 n ∑ (x i − x) 2 n i =1 where n is equal to the number of days sampled, xi is the vault cash balance of day i, and x is equal to the average daily balance over all periods under consideration. The variance is a measure of the volatility of vault cash demand. A larger variance leads to a higher return cash level, a higher upper control limit and thus to larger cash shipment batches. Using the Miller-Orr Model Figure 15 illustrates the use of the Miller-Orr model. The cash manager only takes action when the cash balance pierces either the upper or the lower control limit. When this happens, the difference between the actual cash balance and the optimal return cash level is the amount of cash either transferred to or transferred from the SACCO vault. Most likely, the SACCO will specify a minimum balance larger than zero. This minimum becomes the lower limit just as in figure 15. The upper control limit and the optimal return cash level then simply move up in parallel by the amount of the lower limit. Let's walk through the Miller-Orr model with a simple example. The vault manager estimates the fixed ordering costs at $100 per transaction, the total annual holding cost of cash is 30% and the variance of daily cash balances is $35,000. For now, we hold the minimum cash reserve at zero and then calculate the optimal return cash level and the upper control limit as follows: 13 ⎛ 3 × $100 × $35,000 ⎞ Optimal return level = ⎜ ⎟ 4 × 0.30 365 ⎝ ⎠ = $1, 473 Upper control limit = 3 × $1,473 = $ 4,419 If the vault manager wants to maintain an "iron" reserve of $1,000 at all times, the revised vault cash parameters become: Rural SPEED 31 TREASURY MANAGEMENT FOR SACCOS Lower Control Limit = $1,000 Optimal Return Level = $2,473 Upper Control Limit = $5,419 Vault Cash Management Based on Specific Cash Flow Projections So far, our approach to vault cash management has been characterized by the assumption that the daily inflows and outflows of vault cash are random. This is not unrealistic given the many unknown factors that influence the amount and timing of vault cash demands. However, there should be a way to include some of the knowledge about the expected trend and seasonal factors that helped us develop the general cash flow forecast. The advantage of this prior knowledge about vault cash movements is that we can now anticipate a cash need and plan our cash shipments in a pro-active way, instead of just waiting until we hit the lower control limit. This means, for example, that the target cash level at the end of period one is given by the required minimum plus the expected net outflow in period two. The vault cash system depicted in figure 16 uses a minimum vault cash reserve of UGS 20 Mio that should be observed at all times and a minimum shipment increment of UGS 7.5 Mio. The target balance at the end of day one is equal to the minimum reserve plus the expected outflow during period two. If a net inflow is expected for period two, the target balance at the end of the previous period is simply equal to the minimum reserve. The shipment order triggered in a particular period is rounded up to the next round shipment lot size of UGS 7.5 Mio. Rural SPEED 32 TREASURY MANAGEMENT FOR SACCOS Sample Branch X WEEKLY VAULT CASH PLANNER Date Week No. 4/9/2007 15 Monday Tuesday Wednesday Thursday Friday Total for Week Last Closing Vault Balance (Friday) Net Post-Close Transactions Pending Cash Shipments (in transit) 30,000,000 500,000 - Opening Cash Balance 30,500,000 34,550,000 31,150,000 31,850,000 28,650,000 30,500,000 8,000,000 1,000,000 500,000 9,500,000 7,000,000 500,000 500,000 100,000 8,100,000 8,000,000 200,000 500,000 8,700,000 7,000,000 1,000,000 500,000 100,000 8,600,000 15,000,000 2,000,000 45,000,000 4,700,000 100,000 17,100,000 300,000 52,000,000 4,000,000 3,000,000 4,000,000 500,000 800,000 650,000 12,950,000 3,000,000 2,000,000 5,000,000 600,000 800,000 100,000 11,500,000 7,000,000 2,000,000 5,000,000 700,000 800,000 15,500,000 3,000,000 2,000,000 5,000,000 800,000 800,000 200,000 11,800,000 4,000,000 2,000,000 3,000,000 1,000,000 1,600,000 100,000 11,700,000 21,000,000 11,000,000 22,000,000 3,600,000 4,800,000 1,050,000 63,450,000 Add: Less: Loan Collections Savings Deposits Western Union Receipts Other cash receipts Total Receipts Disbursements - Loan Product 1 Disbursements - Loan Product 2 Disbursements - Loan Product 3 Savings Withdrawals Western Union Disbursements Other cash expenses Total Disbursements Weekly Net Vault Cash Flow - 3,450,000 - 30,000,000 500,000 3,400,000 - 6,800,000 - 3,200,000 5,400,000 - 11,450,000 Forecasted Closing Balance 27,050,000 31,150,000 24,350,000 28,650,000 34,050,000 19,050,000 Maximum Vault Limit Minimum Vault Limit Target Vault Level 50,000,000 20,000,000 27,500,000 50,000,000 20,000,000 27,500,000 50,000,000 20,000,000 27,500,000 50,000,000 20,000,000 20,000,000 50,000,000 20,000,000 27,500,000 50,000,000 20,000,000 27,500,000 Cash Delivery / Deposit Triggered 7,500,000 Closing Balance after Shipments 34,550,000 31,150,000 7,500,000 31,850,000 28,650,000 34,050,000 15,000,000 34,050,000 Figure 16: Weekly Vault Cash Planning Format Initially, a SACCO might want to introduce such a vault forecast framework by planning in weekly increments rather than on a daily basis. This can simply be done by collapsing the columns in figure 16 to the single “Total for the Week” column that would need to be filled out by the branch manager before the end of the week for the coming week. The experience of the branch managers and other staff who work directly with clients and understand the particular cash flow patterns of their clientele is essential in deriving reliable forecasts of cash requirements. The vault cash plan should not be compiled mechanically by a single person at head office, but needs to be informed by regular input from the front line staff. It also helps to hone the accuracy of the cash flow planning if one regularly compares previous forecasts with the materialized actual cash flows. With experience, the average accuracy of the forecasts should improve. Figure 17 contains a simple evaluation framework that can be used to compare actual vault cash results with the previous week’s forecast. Rural SPEED 33 TREASURY MANAGEMENT FOR SACCOS Sample Branch X FORECAST PERFORMANCE Date Forecast Week 15 4/10/2007 Actual Week 15 Actual / Forecast Target Range Opening Cash Balance 30,500,000 30,500,000 100.00% Add: Loan Collections Savings Deposits Western Union Receipts Other cash receipts Total Receipts 45,000,000 4,700,000 500,000 300,000 50,500,000 43,000,000 5,200,000 300,000 500,000 49,000,000 95.56% 110.64% 60.00% 166.67% 97.03% 80% - 125% Disbursements - Loan Product 1 Disbursements - Loan Product 2 Disbursements - Loan Product 3 Savings Withdrawals Western Union Disbursements Payroll Disbursement Service Other cash expenses Total Disbursements 21,000,000 11,000,000 22,000,000 3,600,000 1,000,000 4,000,000 1,050,000 63,650,000 20,578,000 10,500,000 15,500,000 3,200,000 1,200,000 4,000,000 1,080,000 56,058,000 97.99% 95.45% 70.45% 88.89% 120.00% 100.00% 102.86% 88.07% 87% - 115% Less: Net Vault Cash Flow - 13,150,000 - 7,058,000 Figure 17: Vault Cash Forecast Performance Measurement In the example above, the SACCO has postulated accuracy ranges for the total receipts and total disbursement values. The targets acknowledge that receipts tend to be less predictable and a +/- 25% variation range already represents reasonable accuracy. On the disbursement side, the SACCO has good visibility of the loan disbursements for the coming week and therefore limits the acceptable error of the forecasts to only +/- 15%. Millions Figure 18 shows a useful visualization of the upper and lower vault limits and current cash balances per branch as developed by a micro-deposit taking institution (MDI) in Uganda. Branch Cash Analysis 140 120 100 80 60 40 20 0 ADJ BR2 BMB BR3 BKY BSA BR5 BSK BR6 BWR CORP HO BR9 KJS BR10 KST BR11 KYG BR12 KBG BR13 KSZ BR14 KSR BR15 KGR BR16 LWR BR17 LTD BR18 MTN BR19 NKW BR20 RSR TRY TRR ZBW BR1 BR4 BR7 BR8 BR21 BR22 BR23 Min - Max Current Cash Current Cash and Buffer Checks Figure 18: Sample Branch Vault Cash Analysis This MDI uses buffer checks as a means for branches to rapidly replenish their vault should the need arise. These buffer checks are pre-signed for a standard shipment amount (say UGS Rural SPEED 34 TREASURY MANAGEMENT FOR SACCOS 7.5 Mio) and are drawn on the MDI’s Head Office account with a commercial bank. The commercial bank maintains a branch in the location of the MDI branch office, such that the MDI can easily send an authorized staff member to the commercial bank branch to cash the buffer check, should the actual cash balance approach the lower vault limit. Rural SPEED 35 TREASURY MANAGEMENT FOR SACCOS 7 INTERNAL CONTROL & CASH HANDLING PROCEDURES An Internal Control System refers to all the policies and procedures adopted by the managers of an entity to help ensure, as far as is practical, the orderly and efficient conduct of its business. Internal controls promote the objectives of management: ¾ profitability, ¾ adherence to management policies, ¾ safeguarding of assets, ¾ prevention and detection of fraud and error, ¾ accuracy and completeness of accounting records, ¾ timely preparation of reliable financial information, and ¾ discharge of legal responsibilities. The internal control system extends beyond matters relating directly to the accounting system and comprises the control environment and control procedures. The control environment is the overall attitude, awareness, and actions of the board of directors and managers regarding the internal control system and its importance. A strong control environment - for example, one with tight budgetary controls and an effective internal audit function - can significantly complement specific control procedures. Factors reflected in the control environment include: ¾ The function of the board of directors and its committees, ¾ Management’s philosophy and operating style, ¾ The organizational structure and methods of assigning authority and responsibility, ¾ Management’s control system, including the internal audit function, and ¾ Personnel policies and procedures, and the segregation of duties. Control procedures are policies and procedures (in addition to the control environment) that management has established to achieve the entity’s specific objectives. Control procedures include: ¾ Reporting, reviewing, and approving reconciliations, ¾ Checking the mathematical accuracy of records, ¾ Approving and controlling documents, ¾ Comparing internal data with external sources of information, ¾ Comparing cash, security, and inventory accounts with accounting records, ¾ Limiting direct physical access to assets and records, ¾ Comparing financial results and budgeted amounts, Rural SPEED 36 TREASURY MANAGEMENT FOR SACCOS ¾ Controlling computer information systems by o establishing controls over changes to computer programs o limiting access to data files o Maintaining and reviewing control accounts and trial balances. Examples of Fraud in Microfinance How They Did It How It Was Found Out Loan officer sets up 90 ghost group loans in “successful” high growth branch. Repays loans from new loans. Collusion with Tip from an employee. supervisor and regional internal auditor. Loan officer in rural program makes fictitious loans. Increase in delinquency noticed by Repayment comes from new loans, which soon become the central office and investigated. delinquent. Collusion with accountant. Damage Done $900,000 $100,000 Loan officer sets up 18 fictitious loans for personal use. The loans become delinquent. USAID officer wants to show a high volume branch for a visit by the $2,500 Ambassador. A client selected for the visit does not exist. Loan officer pays a micro entrepreneur to use his name and address to originate a loan for his own personal use. No payments are made. Increase in delinquency reports for that officer was noticed by the central office and investigated. Unknown Loan officer charges his clients a fee to apply to the loan program. Officer keeps the fee. Tip from a client $100 Trusted administrative officer purchased computers and furniture at higher than market prices, receiving a kickback. Officer leaves to take on a better job. When new furniture is purchased months later, new administrator discovers the high prices paid by the prior employee Unknown An employee takes cash from petty cash over the weekend. Missing funds discovered in a cash $100 count exercise the next workday. Internal audit department reviews Loan officer collects repayments from clients and keeps a reports daily and discovers portion of the payment. Records only half paid on the books. insufficient repayment from clients of one loan officer. Loan officer under suspicions Loan officer in rural area disburses and collects loans in cash. because of sloppy paperwork. Officer keeps some of the repayments. Argues that he lost Delinquency increases and central loan payment receipts. Most clients do not ask for receipts. office investigates. $500 $3,000 Trusted credit manager makes 13 large loans to small business clients and takes back a major portion of the loans for personal use. Manager has authority to approve loans. Increase in delinquency noticed on these larger loans. Collections attorney investigates. Cashier steals last group loan payment of the day. Does not record payment on the system, but stamps clients’ receipt as paid. Trusted financial manager transfers funds to his personal bank account, intending to repay soon. He is then switched to another management job. Credit officer notices group has not paid its loan. Visits group and $100 discovers the fraud. New financial manager discovers the missing funds, and the former $10,000 manager admits the theft. Branch manager authorizes loans to relatives who do not repay. When delinquency rises, he makes more new loans to reduce the delinquency rate. When delinquency rises again, he steals from petty cash to repay loans. Increase in delinquency is noted by central office. Accountant conducts $10,000 a surprise visit and discovers the missing petty cash. $6,000 Figure 19: Cases of Fraud in Microfinance (Source: Joyce Lehman, Summer Academy 2006) The list of examples of fraud cases in Figure 18 should give a flavor of the reality that microfinance in general and SACCOs in particular are not immune to theft and fraud. Upon Rural SPEED 37 TREASURY MANAGEMENT FOR SACCOS just a handful of perennial fraud schemes:ghost loans, closer inspection, the variety of examples in figure 18 can actually be reduced to just a handful of: ¾ shorting receipts and pocketing the difference, ¾ inflating expenses and receiving kickbacks, ¾ charging “handling fees” or taking bribes on the side while carrying out official business. The examples show that the need for internal control and vigilance against breach of trust by staff and management is real. Effective internal control procedures counteract fraud in three important ways: they deter fraud by lessening the opportunity and temptation for staff, they improve the odds for detecting fraudulent or negligent behavior and they provide the vast majority of honest staff with a due process for documenting their compliance and discharging their responsibility. Nowhere is the temptation larger than in the areas of an institution that deal directly with physical cash. Hence, SACCOs need very specific procedures for cash handling that are enforced upon management and all staff with potential access to cash. Specific Cash Handling Procedures Whoever is involved in any transfer of cash from one person to another must take extra care. Thus the need for proper policies, guidelines and procedures in the day-to-day transactions. The following is a first check-list with advice for cashiers: ¾ Before start of day, be sure you have a clear mind, you are sober and composed. ¾ Be in the till at least 15 minutes before opening. ¾ At all times the cashiers’ till must be locked whether in or out. ¾ By end day, a cashier should be able to remember the first customer served in the morning and the last customer before close of business. This applies to all staff involved in cash handling and any other transaction on behalf of the institution. ¾ Beware of counterfeit notes which may be presented to the cashier as deposits. Look for tips from Bank of Uganda and your commercial correspondent bank on how to detect counterfeits. Rural SPEED 38 TREASURY MANAGEMENT FOR SACCOS Figure 20: Cash Handling Procedures. C = Constant, D = Daily, W = Weekly, Q = Quarterly. 39 Rural SPEED TREASURY MANAGEMENT FOR SACCOS Figure 20 ctd.: Cash Handling Procedures. C = Constant, D = Daily, W = Weekly, Q = Quarterly. 40 Rural SPEED TREASURY MANAGEMENT FOR SACCOS Following is a detailed inventory of cash handling procedures compiled by an experienced practitioner in banking in Uganda. Rural SPEED 41 TREASURY MANAGEMENT FOR SACCOS 8 PORTFOLIO CREDIT RISK MANAGEMENT We define Credit Risk as the potential change in net asset value due to changes in the perceived ability of counterparties to meet their contractual obligations. The above may appear like a very abstract definition when one could have said that credit risk occurs when a borrower does not pay back the loan. We chose the more complex definition, because it makes clear that credit risk arises much earlier than the final failure to pay becomes visible. It concerns changes in the mere probability of default of individual borrowers and the portfolio as a whole. The borrowers may all still be making payments and are current on their loans, but due to a change in the local economy (e.g. you lend mostly to maize farmers and maize prices are falling because of a bumper harvest in neighboring countries) the average likelihood of default over the next 12 months in your portfolio has increased from 5% to 10%. Moreover, credit risk is not about what your institution believes its default risk situation is. It is about the perceptions others have about the quality of your loan portfolio. Depositors, funders and other creditors all look to the quality of the SACCOs loan portfolio as the primary indicator of creditworthiness. If there are doubts about the quality of the portfolio, it will be hard to mobilize or retain deposits or to qualify for a funding facility with a microfinance sponsor. This is a very important linkage between credit risk and liquidity risk (= market confidence). Within the overall credit risk, we can distinguish two important dimensions: transaction risk and portfolio risk. Transaction risk refers to individual loans and essentially measures two aspects: (1) the probability that the borrower will be able to repay, and (2) the quality of procedures, such as borrower selection and loan administration, which should maximize the likelihood of repayment. Controlling transaction credit risk is the core business of the microfinance movement and most MFIs have good credit risk assessment and loan loss mitigation strategies in place. The critical area where many MFIs can still make improvements is loan portfolio risk. The risk of the entire loan portfolio is not simply the summation of all individual loan risks. Portfolio risk assessment must take into account the effects of diversification. Simply put, diversification is about having many different types of loan clients whose payment behavior is independent from each other. If all your clients are providing tourist services, then a decline of tourism due to bad weather or unfavorable exchange rates may lead to a wave of loan losses. The same exchange rate problem that keeps foreign tourists away, however, may make it more lucrative to import the food products that your street vendor clients are selling to local customers. Diversification of your client base thus allows you to offset losses in one area with an improved outlook in another. There are several key components to a comprehensive diversification strategy. First, one must avoid concentrating on a few large borrowers, who would risk bringing the whole bank down if they failed. This is usually not a problem for a SACCO because of its mission to provide microcredit to small entrepreneurs. Secondly, a SACCO should try to diversify the sectors of activity that it finances. One should avoid a mono-culture of only coffee farmers or only boda-boda drivers, for example. And thirdly, it is important to diversify across Rural SPEED 42 TREASURY MANAGEMENT FOR SACCOS geographic regions. This is in part linked to the second issue of industry diversification. In a region where banana plantations are the economic backbone, it is not enough to diversify by lending to small retail merchants in the same area. If the banana business goes downhill, so will the rest of the services and small merchants in the region. Geographic diversification thus facilitates effective industry diversification. In addition, it also provides protection against the effects of large natural disasters, which might impact the economy of an entire region. The problem with diversification across industries and geographic areas is that micro-lending has often been successful, precisely because the institutions know their local customers personally and understand their business and their economic environment. A MFI that ventures outside of its home market and industry expertise risks losing loans because it lacks information about the area and the creditworthiness of clients. A simple solution to this dilemma is to cooperate with MFIs in other geographic areas. MFIs could exchange loan participations or swap parts of their loan portfolios to give each other access to the earning potential and credit risk of their client base. The individual loans would still be screened and serviced locally by the originating institution. A more sophisticated variation of this same idea is to buy formally securitized loan portfolios from MFI issuers in other regions. Measuring and Reporting Loan Portfolio Quality We now turn to the question how to measure the quality of a loan portfolio as a whole and how to communicate these data to various stakeholders, most importantly the SACCO Board and general membership as well as outside creditors, regulators and microfinance support agencies. Ex ante probabilities of default are very hard to measure. This would require statistical scorecards and extensive credit bureau information on every borrower. In microfinance practice, one starts with the most tangible credit risk information available on every borrower: did the individual pay the installments due or not. If he/she is in arrears (i.e. has missed installments) how many payments or how many days is the loan in arrears? The assumption implicit in this payment experience measure of credit quality is that the more installments an individual has missed, the lower the probability of receiving the next payment and certainly of collecting the entire loan balance within the loan term. The most useful statistic on the arrears status of a loan portfolio is the Portfolio-at-Risk. It summarizes the capital balance of all loans impacted by arrears of a particular severity. Thus the currency value reported is not just the amount of installments missed or in arrears, but the entire balance outstanding of the loans that have arrears in the cut-off amount or higher. Reporting just the arrear amount tends to flatter the portfolio and creates the impression that only the overdue installments are the problem and that the rest of the loan outstanding is somehow still ok. That is not true, however, because we know that the deeper a loan is in arrears, the less likely it is that any of the outstanding balance will be collected. Hence the entire balance of the loan is “portfolio-at-risk”. Rural SPEED 43 TREASURY MANAGEMENT FOR SACCOS PORTFOLIO ANALYSIS Current ≤ 30 days late >30d & ≤60d Portfolio at Risk - Shilling Values >60d & ≤90d >90d & ≤120d >120d & ≤180d > 180 days Total Capital Balance of Advances Impacted by Arrears Product 1 / Branch 1 Product 2 / Branch 2 Product 3 / Branch 3 - - - - - - - - Total Capital Balance of Advances - - - - - - - - Portfolio at Risk - Numbers of Loans Loans Impacted by Arrears Product 1 / Branch 1 Product 2 / Branch 2 Product 3 / Branch 3 - - - - - - - - Total Number of Loans - - - - - - - - Figure 21: Portfolio-at-Risk Reporting Template Alongside of the payment performance on the existing portfolio, the SACCO should always report the new loan origination or “production” trends, because this is where the future financial performance of the SACCO is determined. Are enough new loans in a sufficient diversity being created to maintain or grow the existing portfolio? It is easy to gloss over cash flow problems in a lending institution for a while by limiting new disbursements and simply collecting down an existing book until all of a sudden, the cash stops coming in. The loan production overview as per the template in Figure 22 gives management and stakeholders a clear view of loan origination trends that would send an early warning signal, if a SACCO was starting to simply live off the substance without replenishing the portfolio. Figure 22: Loan Production Overview Template Finally, we suggest that SACCOs start compiling regular monthly “vintage” reports. Vintage reports combine the month-by-month loan production perspective with the portfolio-at-risk view of the credit quality. This is a simple yet very powerful early-warning tool that is used widely by consumer lending companies and large microlenders. Vintage reports can be meaningfully interpreted as soon as there are at least 30 (better >100) new loans made each month and per product that one wants to distinguish in the analysis. LOAN PRODUCTION OVERVIEW Jan Feb Mar Apr May Jun Jul Aug Sep Oct Nov Dec Total ytd Shilling Value of Disbursements Product 1 / Branch 1 Product 2 / Branch 2 Product 3 / Branch 3 - - - - - - - - - - - - - Total Shilling Value Disbursed - - - - - - - - - - - - - Product 1 / Branch 1 Product 2 / Branch 2 Product 3 / Branch 3 - - - - - - - - - - - - - Total Number of Loans Disbursed - - - - - - - - - - - - - Number of Loans Disbursed The basic idea of a vintage report is that it looks at each month’s loan production as a separate loan portfolio or crop (vintage) of loans that is tracked separately in terms of payment performance. Imagine that your SACCO changed its loan policy in February and Rural SPEED 44 TREASURY MANAGEMENT FOR SACCOS that the loans made since February perform drastically worse than your previous book. If you look only at the overall arrears and portfolio-at-risk statistics, it would take a long time for these new loans to bring down the overall portfolio quality to an extent that is more than just a month-to-month statistical aberration. However, if you look at each monthly vintage separately, the effect of the changed credit policy would have become obvious much earlier, allowing your SACCO to take corrective action before more damage is done. Figure 23 shows such a graphical vintage report taken from the annual report of African Bank, a commercial microlender in South Africa. Figure 23: Vintage Curve Analysis – African Bank, South Africa African Bank defines non-performing loans as advances that have missed three or more monthly installments, i.e. as portfolio-at-risk90d+. Each colored line represents the portfolio-at-risk as a percentage of total disbursements for the loans originated in a particular month. As the “vintage” ages, more loans fall into arrears and then the portfolio-at-risk stabilizes, as the bad payers have been identified and the good payers keep paying down their loans. Maximum loan terms at African Bank rarely exceed 18 months. Therefore, 18 months into the life of a vintage, only the bad payers remain on the book. As legal collections and recoveries are kicking in, the “bad” book outstanding in terms of original balance disbursed gradually declines again. It is remarkable how predictable the proportion of bad payers in the book of African Bank is. This is the result of substantial statistical research and conscious risk calibration in their underwriting practices. It allows African Bank to reliably predict defaults at about 14% of original disbursements. In fact, it is known that African Bank has recently relaxed its scorecard in order to write more loans ahead of some new legal limits on interest rate charges. This effect is clearly visible in the more recent vintages (the shorter lines) that seem to curve up to a final value of 15%-16% bad debt. Rural SPEED 45 TREASURY MANAGEMENT FOR SACCOS For a SACCO without the benefit of sophisticated behavioral scorecards and detailed payment histories from a credit register, we can expect the vintage curves to have a much wider dispersion than at African Bank. Nonetheless, one can expect certain seasonal patterns to emerge or maybe one could see different bad rate trends on a per product or per branch basis. Even without such narrowly converging trends as at African Bank, there is tremendous value in a vintage analysis for SACCOs because of the ability to detect an outlier trend in a particular month (and product / branch) very early on. The three simple statistics proposed here (Loan Production Overview, Portfolio-at-Risk, Vintage Analysis) already make a concise and powerful reporting package on the lending operations of the SACCO. This package should regularly be reviewed by management and the Board and can even be presented to the full annual membership assembly. From our observations, SACCOs often report too much detail in form of print-outs of debtor lists that make it difficult to derive a synthesis, particularly for the volunteer officers. Portfolio information must be aggregated and show the side-by-side progress over time in order to become meaningful to stakeholders. These arguments also apply to the general financial statement disclosure in the form of Income Statement, Balance Sheet and possibly a cash flow statement. Not all the financial statements prepared by SACCOs that we have seen are easily readable and conform to the usual presentation for financial institutions. Some income statements, in particular, are laid out more like those for a typical agricultural or manufacturing cooperative rather than for a savings-and–loans business. In Appendix 1, we propose a financial statement format that is currently used by MDIs in Uganda and represents a common standard for financial institutions. In addition to the easily readable aggregation of the line items, we believe this format is useful for management and stakeholders, because it includes a side-by-side comparison of the monthly or quarterly statements as well as year-to-date actual versus budget columns. This puts the financial statements into context and allows for a more productive discussion about performance trends at Board level. Rural SPEED 46 TREASURY MANAGEMENT FOR SACCOS 9 DESIGNING A TREASURY MANAGEMENT POLICY If we look back to figure 1 and the relevant risks for SACCOs within the conventional scope of treasury management, it becomes clear that very likely the only additional policy required is for the area of liquidity management. Every SACCO will already have written policies and procedures for dealing with credit risk from a transactional perspective. This existing credit policy should simply be upgraded to include the tools and reporting procedures for credit portfolio risk as suggested in the previous chapter. Likewise, the existing manuals for cash handling procedures and general internal controls may benefit from a completeness check against the ideas presented in chapter 7. Most SACCOs in Uganda will at this stage not have any specific policies and procedures on liquidity management, however. In the following, we will therefore focus on the ingredients of an appropriate liquidity management policy for SACCOs. So far in this manual, we reviewed the fundamental concepts and practical building blocks of liquidity management. A liquidity policy is the final missing element that describes how liquidity management activities are integrated into the organization with proper assignment of roles and responsibilities. Like any fundamental policy, a liquidity management policy should be formulated by the executive management and deliberated with the Finance & Administration Committee, adopted by the full SACCO Board and ratified by the general shareholder assembly. Next, we will discuss the main points to be covered by such a liquidity policy: (1) The first order of business is to establish who has responsibility for liquidity management in the SACCO. Often, this will be the chief accountant, finance director or general manager. A deputy must be assigned and authorized to stand in for the primary liquidity manager during absences. (2) The SACCO Board must decide the scope of authority and the signatory powers assigned to the liquidity manager(s). Given that liquidity management often requires swift action, routine operations should be within the authority of the individual manager and only unusually large transactions should require special authorization from the Finance & Administration Committee. Note that general signature authority and internal control rules still apply, i.e. even routine decisions about short-term investments and cash movements should always carry two authorized signatures. (3) Along with the size of transactions and signature requirements, the liquidity policy should define what acceptable liquidity instruments are: On the asset side, these certainly include Uganda Shilling vault cash and balances with financial institutions. On bank balances, the question arises as to which banks are allowable and for what amounts. Obviously, a small SACCO cannot afford to spread its cash balances over too many correspondent banks, if it wants to be taken seriously as an important depositor. Yet, management has to set limits for the maximum exposure to an individual correspondent, particularly when dealing with small banks or even other microfinance institutions, who represent more than a negligible credit risk. Further, the policy must spell out the types, maximum maturities and the issuers of those securities (such as treasury bills) that are considered legitimate liquid investments. Rural SPEED 47 TREASURY MANAGEMENT FOR SACCOS On the liability side, the policy has to define what constitutes an allowable funding instrument. Generally, a liquidity manager will only have authority to borrow short-term in the form of an overdraft facility, for example. One may also set up guidelines about the desired variety of counter-parties and instruments, in order to ensure sufficient diversification of funding sources. Just to be clear, the policy should also spell out that liquidity instruments on the asset and the liability side may only be denominated in local currency. The SACCO should not incur foreign currency risk through the actions of the liquidity manager. (4) The liquidity policy should describe the general methodology for liquidity planning. For the dynamic cash flow forecast, one must specify the time horizon, the level of detail, and the intervals at which the cash flow plan is updated. In regard to vault cash planning, the policy might indicate whether management intends to follow a passive vault cash philosophy or prefers an active anticipatory management style as proposed in this manual. (5) The Board should adopt a set of operating parameters that reflect the level of liquidity risk the SACCO is prepared to accept. Below are some examples of useful operating parameters: ¾ Establish minimum and maximum limits for holdings of cash assets. These could be defined as an absolute number or on a floating scale using the cash position indicator, for example. ¾ Define minimum and maximum levels of vault cash for each branch vault. Again, these may be expressed either in absolute units or as a relative measure such as the vault cash reserve ratio. ¾ Fix a maximum percentage of the available credit lines that the liquidity manager is allowed to borrow in the course of ordinary business. The idea is to always maintain some unused borrowing capacity. ¾ Define a ceiling for expensive and volatile commercial short-term funding using the purchased funds ratio. (6) Communication channels must be established upwards to the Finance & Administration Committee and the full Board and downwards between the liquidity desk and the branch managers and cashiers. The policy should define the format and frequency of liquidity reports that go to management, the Finance & Administration Committee and the full Board. (7) The SACCO should fix a schedule for regular revisions of vault cash levels. It is important to involve the branch managers and cashiers in this process, so that their experience from dealing with customers is incorporated into the plan. (8) The policy should implement an early warning system that requires all business units to notify the liquidity desk of any upcoming transactions above a certain size that affect the cash position. This would apply equally to expected outflows and inflows, regardless of whether they will occur in vault cash or book currency. Rural SPEED 48 TREASURY MANAGEMENT FOR SACCOS (9) Finally, the policy should also address the actions the SACCO will take to head off a liquidity crisis that may arise following a reputation event, a major theft or fraud or after an increased incidence of loan losses. Rural SPEED 49 TREASURY MANAGEMENT FOR SACCOS 10 GOVERNANCE ISSUES In our interactions with SACCO managers and treasurers in Uganda, we regularly encountered questions about the practical working relationships between professional fulltime staff and elected officials on the Board: how can volunteer board members effectively discharge their responsibility to supervise the actions of management and staff of the SACCO? How much should managers involve Board members in the daily running of the SACCO? Are Board members still independent, if a large part of their income is derived from Board sitting fees? In the following, we therefore go beyond the immediate scope of treasury management and offer a number of selective comments on governance, control and fraud prevention issues that SACCOs might find helpful in guiding the interactions between elected officials and full-time management and staff. Figure 24 shows the typical stylized organizational structure of a Savings and Credit Cooperative in Uganda. Formal authority in the orgchart flows from the top, the general membership, via the shareholder assembly to the Board and its committees and on to the executive management and staff. Although this seems obvious, it is important to keep the flow of authority in mind in the daily business activities of the SACCO: the general manager is not the owner of the institution. The general manager has been tasked with the daily running of the SACCO activities and with managing the other staff, but he/she must answer to the Board, who are ultimately responsible to the membership for the proper oversight over the finances and business practices of the SACCO. Typical Typical SACCO SACCO Organizational OrganizationalStructure Structure General Membership Representative Annual Shareholder Assembly Board of Directors Ms. xx, Chairwoman Mr. xx, Vice Chairman Ms. xx, Treasurer Additional Members of of the Board theMember Board Member of the Board Member of the Board Executive Committee Loans Committee Finance & Administration Committee Supervisory & Audit Committee Savings Mobilization Committee Full-Time Executive Management General Manager Accountant Operations Supervisor Branch Manager Professional Staff Figure 24: Typical SACCO Orgchart Rural SPEED 50 TREASURY MANAGEMENT FOR SACCOS The Annual Shareholder Assembly is the highest organ of the SACCO. It elects volunteer officers to serve on the Board of Directors and the various committees as the member representatives. The Board adopts the fundamental policies of the SACCO and has them ratified by the Shareholder Assembly. The Executive Management develops proposals for the policies and important business decisions, refines them through consultation with the appropriate Board Committees, which endorse them for adoption by the full Board. Finally, the Executive Management is responsible for running the daily operations within the confines of the Board approved policies and procedures. Practical Issues in Interactions between Management and Board In practice, it is important that fundamental policy changes are adequately deliberated with management and duly considered by sub-committees before they are adopted by the Board. The SACCO should avoid ad-hoc decisions at board level on essential issues such as credit policies, product pricing, staff positions and pay scales. Frequently changed, volatile policies can confuse and paralyze an organization and its clients. The frequency and timing of committee and board meetings should reflect the different level of operational involvement and information detail handled by sub-committees versus the full board. Most SACCO committees, in particular the Credit Committee that must approve loans above the authorities delegated to management should sit at least monthly, while the full Board might convene monthly or only quarterly. The committee and board dates should be timed as to allow sufficient time for management and sub-committees to review information and prepare their reports to the Board. Board and committee packs should be circulated at least five working days ahead of the scheduled meeting. In a small SACCO it is important to avoid “committee overload” for the professional management who have to assemble the information packs, write the minutes and follow-up on the mandated actions by the committee and full board sessions. Board members, and the volunteer treasurer in particular, should always be welcome to carry out surprise visits and spot-checks, for example by counting the vault or looking at a random sample of loan files. However, board members must also be mindful of the workload and distraction this may create for management and staff and the impact on customer service. Elected officers should respect the authority of the hired management for the daily operations and should not directly give orders to staff or argue with management in front of staff or members. Independence of Elected Officials A very sensitive issue that many SACCOs appear uncertain about is the amount of board sitting fees to be paid to elected officers. In some SACCOs the sitting fees per board member over the course of a year amount to almost a full-time professional salary. Volunteer officials are certainly entitled to reimbursement for their expenses (e.g. meals and transport) in connection with attending official functions, but the level of compensation should not make them into effective employees. It is difficult to stipulate an absolute limit for board sitting fees because the size of fees should be seen relative to the financial means of the SACCO and the income level of the membership. One should always ask whether the amount of Rural SPEED 51 TREASURY MANAGEMENT FOR SACCOS compensation offered to board members is significant to the individual: i.e. does this money contribute towards household expenses of the board member and might he/she therefore become “interested” in board meetings for the fee rather than it being a simple reimbursement of expenses incurred. Once an elected officer becomes monetarily interested in attending board meetings, his/her independence towards management is compromised. This is because the person now depends on management to call meetings in order to earn fees and will no longer be free to occasionally hold opposing views to management. The notion of independence of the elected officers vis-à-vis the full time staff and management is critical for the board to be effective in controlling and supervising management. Aside from not being financially dependent on management, elected officers should also have financial and technical skills roughly on par with management so that they can engage management in a meaningful debate and at times challenge the interpretation of certain results. SACCOs must therefore emphasize practical training and financial education for elected officers. It is recommended that key offices, such as the position of treasurer, should only be assumed after a three to six month initiation period, during which the new office holder receives essential training. Many institutions handle this by retaining the incumbent officer on active duty after the elections at the general assembly, while the officer-elect goes through the training program. Orderly transitions between elected officers are critical for the continuity and long-term success of a SACCO. Connected Party Loans Many SACCOs also report concerns about connected party loans. These are loans to officers themselves or their close relatives and business associates. Even in the largest commercial banks, connected party loans are subject to special procedures and controls, because the potential for conflicts of interest is large. In a SACCO, connected party situations arise more frequently than in a bank because the SACCO operates within a relatively narrow membership, which is typically quite concentrated geographically and in terms of community allegiances. It is therefore not practical to entirely rule out loans to board members and their families and associates, but every SACCO needs a clear policy on how to approve and track such loans. It is recommended that connected party loans regardless of size are deliberated and approved by the full board. It should also be a standing item at every credit committee and board meeting that the payment status and potential arrears of such loans are reported by management. No exceptions should be authorized regarding the collections process and possible legal steps against defaulters on connected party loans. Making concessions on the vigorous collections against defaulting relatives and associates of board members would greatly compromise the standing of the SACCO far beyond the particular loan amount at stake. This is the most important test for being a serious and viable financial institution: if the SACCO starts to waver on collecting a delinquent loan from a cousin of a board member, it is downhill from here. Connected party loans and special favors on loan enforcement are one of the great downfalls of banks and SACCOs alike. The credibility of the entire institution is at risk, if this is not handled professionally. Rural SPEED 52 TREASURY MANAGEMENT FOR SACCOS Staff Retention and Rotation Finally, a common friction point between management and Board in a growing SACCO is the question of building a sufficient personnel base to accommodate growth and to budget for the inevitable staff attrition. We are well aware of the eternal reflex of managers who want to build “empires” and take pride in the number of people working “under them” while creating cost loads that may not be sustainable in the long run. However, board members must also acknowledge that staff attrition is a fact of life and that by only hiring exactly the number of staff required to fill currently vacant positions, the organization will be in a permanent state of staff shortage. This leads organizations to constantly operate in crisis mode, having to plug one hole by opening up another somewhere else. By hiring junior staff in slightly larger number than the open permanent positions suggest, the SACCO can move to an entirely different modus operandi for a relatively modest additional staff cost. With just one or two extra staff beyond scheduled positions, the SACCO can afford to thoroughly train new hires by rotating them through various functions/departments/branches where they can fill in during vacation absences and illnesses. Staff rotation should extend not just to new hires but is also a growth opportunity for core staff who are being groomed to take on leadership positions. Staff rotation and mandatory vacation time are also an excellent deterrent and detection mechanism against fraud. All managers and staff should be required to take at least one week of continuous absence from the office per year. Fraudsters fear nothing more than someone else working with their files, reading their mail, and picking up their phone. It is a well established tenet in banking that the “threat” of vacation does wonders for the honesty of employees. Rural SPEED 53 TREASURY MANAGEMENT FOR SACCOS APPENDIX 1: PROPOSED FINANCIAL REPORTING FORMAT Balance Sheet Reporting period Period start date Period end date Last FY 1-Jan-05 31-Dec-05 Quarter 1 1-Jan-06 31-Mar-06 Quarter 2 1-Apr-06 30-Jun-06 Quarter 3 1-Jul-06 30-Sep-06 Quarter 4 Year-to-Date 1-Oct-06 Budget 31-Dec-06 31-Dec-06 Variance 31-Dec-06 ASSETS Current assets Cash Deposits in financial institutions Short-term investments Gross loan portfolio (Loan loss reserve) Net loan portfolio Other short-term assets Total current assets Non-current assets Long-term investments Fixed assets (Accumulated depreciation) Net fixed assets Other long-term assets Total non-current assets TOTAL ASSETS LIABILITIES and EQUITY Current liabilities Restricted/compulsory savings Voluntary savings Time deposits < = 1 year TOTAL short-term deposits Short-term debt (market rates) Short-term debt (subsidised rates) Loans from the Central Bank Other current liabilities Total current liabilities Non-current liabilities Time deposits > 1 year Long-term debt (market rates) Long-term debt (subsidised rates) Deferred income or restricted funds Other long-term liabilities Total non-current liabilities TOTAL LIABILITIES Equity Capital from shareholders Donated equity Reserves Retained surplus/(deficit) Current year Prior years Retained surplus/(deficit) Other capital accounts TOTAL EQUITY TOTAL LIABILITIES AND EQUITY Rural SPEED 54 TREASURY MANAGEMENT FOR SACCOS Income Statement Reporting period Period start date Period end date Last FY 1-Jan-05 31-Dec-05 Quarter 1 1-Jan-06 31-Mar-06 Quarter 2 1-Apr-06 30-Jun-06 Quarter 3 1-Jul-06 30-Sep-06 Quarter 4 1-Oct-06 31-Dec-06 Year-to-Date Actual Year-to-Date Budget Year-to-Date Variance Income Interest income from loans Fee income on loans Income from investments Other operating income Total operating income Financing expenses Interest and charges paid on market debt Interest paid on subsidised debt Interest paid on unrestricted savings Interest paid on restricted savings Total financing expenses Gross financial margin Provision for loan losses Net financial margin Operating Expenses Personnel expense Rent and utilities Travel and transport Depreciation Stationery and office supplies Other operating costs Total operating expenses Total expenses Net income from operations Income taxes Net income from operations after tax Income from non-financial services Expenses from non-financial services Net income from non-financial services Grants received Grant income for loan capital Grant income for fixed assets Grant income for operations Unrestricted grant income Total grants received Net income after grants for the period Rural SPEED 55 TREASURY MANAGEMENT FOR SACCOS EXERCISE 3: RATIO COMPARISON ACROSS INSTITUTIONS The balance sheets for Micro-Bank and Solidarity Credit are shown below for the years 2005 and 2006 (millions of pesos). During 2006, loan demand rose rapidly and drove up interest rates. i) Determine and describe how each MFI met its loan demand by analyzing sources and use of funds. ii) Which MFI entered 2006 with greater liquidity? Consider the cash position indicator, the relationship of liquid assets to total assets, the capacity ratio, and the purchased funds ratio. iii) Discuss how each institution’s beginning balance sheet position might have affected its profitability during 2005 and 2006. Micro-Bank 2005 Cash items 2006 Solidarity Credit 2005 2006 8 6 6 6 Short-term investments 20 12 6 2 Net loans 52 65 60 84 Long-term investments 20 20 28 22 100 103 100 114 Transaction deposits 25 22 20 17 Core savings and time deposits 67 68 65 62 Purchased funds 0 4 5 24 Total Equity 8 9 10 11 100 103 100 114 Total Assets Total Liabilities & Equity Rural SPEED 56 TREASURY MANAGEMENT FOR SACCOS SOLUTION TO EXERCISE 3 i) Micro Bank covered the net loan increase mainly from liquid assets (short-term securities and cash) with some contribution from purchased funds. Solidarity Credit relied mainly on purchased funds, but also drew down liquid assets and sold off some long-term investments to meet loan demand. ii) Micro-Bank is more liquid at the beginning of 2006. Micro-Bank Cash Position Indicator Solidarity Credit 8% 6% Liquid Assets / Total Assets 28% 12% Capacity Ratio 52% 60% 0% 5% Purchased Funds Ratio iii) Micro-Bank has a very inexpensive funding base with mostly low interest deposits at the beginning of both years. The high liquidity at the end of 2005 means an opportunity loss of income compared to higher earning loans. Micro-Bank goes into the year 2007 with a higher proportion of fully earning assets and still enjoys the benefit of a low-cost funding base. Solidarity Credit started out with a higher utilization of its loan capacity and a low reliance on purchased funds. This is a rather profitable situation. Solidarity goes into the year 2007 almost fully loaned up. Some of the additional earnings from loans will be eaten up by an increased reliance on expensive purchased funds. Rural SPEED 57 TREASURY MANAGEMENT FOR SACCOS EXERCISE 4: LONG-TERM TREND AND SEASONALITY The sample SACCO faces the problem of seasonal swings in loan demand and savings supply. As the SACCO manager, you want to plan ahead and develop a forecast of loan demand for the coming year 2007 that incorporates both your long-run growth trend of loan demand and a measure of the seasonal fluctuations of loan demand throughout the year. You base your estimate of the long-term growth trend in your portfolio on the year-end observations from 1999 through 2006 for the total loan portfolio balance in your SACCO. This is quickly done in Microsoft Excel using the built-in GROWTH() function that returns values along an exponential growth curve fitted through your observations. We recommend to capture the intra-year seasonality by calculating a seasonal index for each month during the years 2004 through 2006 as the quotient: actual observed balance / growth trend value. You then take the average of the three index values for each month to come up with an average seasonal index. The historical average seasonal index could then be applied to your monthly growth trend forecast for 2007 to arrive at the seasonally adjusted growth trend forecast for the monthly loan balances in 2007. The necessary loan balance observations are below: Sample SACCO - Long-Run Year-End Loan Balances Year Total Loans (UGS ‘000) Year Total Loans (UGS ‘000) 1999 223,903 2002 268,078 2000 276,324 2003 276,988 2001 278,015 Sample SACCO - Month End Loan Balances (Shilling, thousands) 2004 2005 2006 January 270,125 278,840 278,654 February 275,301 279,600 282,346 March 284,326 279,857 286,459 April 287,548 282,548 289,587 May 280,578 275,865 290,578 June 273,257 262,500 278,350 July 268,423 251,300 240,350 August 255,501 238,750 235,870 September 256,875 245,600 229,650 October 265,978 254,360 240,560 November 275,900 261,350 268,900 December 276,988 268,078 278,015 Rural SPEED 58


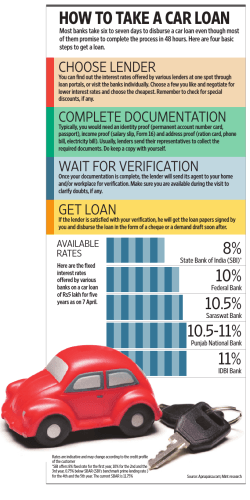
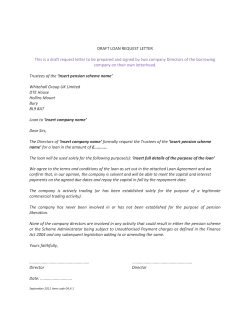
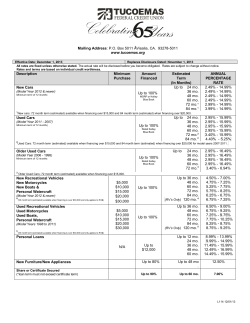
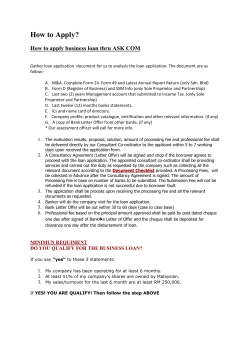
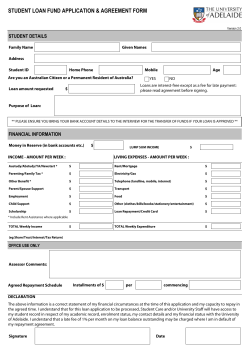
© Copyright 2026