
UNIVERSITY OF OSLO Working Paper 2005: 7
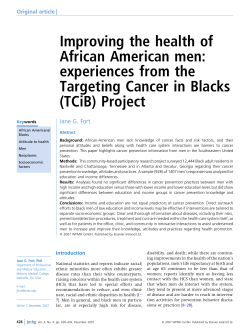
UNIVERSITY OF OSLO HEALTH ECONOMICS RESEARCH PROGRAMME Pecuniary compensation increases the participation rate in screening for colorectal cancer Eline Aas Department of Health Management and Health Economics Working Paper 2005: 7 Pecuniary compensation increases the participation rate in screening for colorectal cancer Eline Aas Health Economics Research programme at the University of Oslo HERO 2005 Acknowledgement I would like to thank Tor Iversen and John Dagsvik for helpful comments during the work on this paper, Statistics Norway for good collaboration during the data collection, Sverre Grepperud, Hilde Lurås, Geir Hoff, Tom Grotmol and Jon Strand for commenting the paper, Jia Zhiyang, Weizhen Zhu and Erik Magnus Sæther for help with programming, response from referees and participants at the 4th World Congress of the International Health Economics Association (June 15th-18th, 2003, in San Francisco), and The 24th Meeting of the Nordic Health Economists’ Study Group (August 15th-16th, 2003, in Bergen), and participants at the seminar at the Cancer Registry of Norway. Author: Eline Aas, University of Oslo, Institute of Health Management and Health Economics, P.O. Box 1089 Blindern, NO-0317 Oslo, Norway E-mail: [email protected] © 2005 HERO and the author – Reproduction is permitted when the source is referred to. Health Economics Research programme at the University of Oslo Financial support from The Research Council of Norway is acknowledged. ISSN 1501-9071, ISBN 82-7756-151-0 Abstract Typically, the participation rate is below 100 per cent. In this paper pecuniary compensation is used to increase the participation rate. In a postal questionnaire to 5,000 people invited to screening for colorectal cancer, those not participating were asked “would you participate if you were given NOK X in compensation?” The results show that compensation increases participation and that the participation probability systematically varies with travel expenses, income, age, county, native country, marital status, use of health care services, genetic predisposition, expected benefit from the screening, subjective health status, and education. The estimated costs per additional screening are increasing. Keywords: participation, willingness-to pay, compensation, costs, binary probit JEL: I10, C25, H42, H43 2 1. Introduction New medical methods to prevent and detect cancer at an early stage have potential benefits in reducing pain, suffering, and treatment costs. In particular, the introduction of screening programmes; i.e. mass-examination of individuals without symptoms, has been the subject of quite a lot of attention during the last few years. The rate of participation in screening programmes is typically below 100 per cent. Here the purpose is to examine whether a pecuniary compensation influences the participation rate in screening for colorectal cancer. If costs and gains are reasonably balanced and/or the incidence of cancer is higher among those not participating than among those participating (see Hoff et al., 1985 and Walker and Whynes, 1991), organisers could be motivated to take measures to increase the participation rate. We formalise a model explaining the individual’s choice to participate in screening for colorectal cancer when the individual is offered a pecuniary compensation given that the individual did not choose to participate when first invited. The estimation is conducted in two steps. First, we estimate the participation probability for the screening when the compensation is zero. Second, we use the estimated results from the first step to estimate the participation probability for the screening when compensation is introduced. Both steps are undertaking by using a binary probit. The results show that pecuniary compensation increases the rate of participation significantly. In addition we find that the participation probability is higher; the higher income and age of the individual; or if the individual lives in Telemark, was born in Norway, visited his/her GP 2-5 times during the last year, has a genetic predisposition, is married or has a partner, has a greater expected benefit from the screening, or is more highly educated (except for very high education). Participation is lower the higher the travel expenses and among those reporting their subjective health to be poor or very poor. Using the estimated results we predict the increase in the participation rate for different levels of compensation. This procedure shows that the participation rate increases from 62 to 72 per cent if offered NOK 200 in compensation. The costs of this increase amounts to NOK 5,306 per additional screened individual. Previous research on screening and participation analyse various invitation systems. Wardle et al. (2003) find the participation rate to be higher given a brochure relatively to a standard invitation. 3 Cole et al. (2002) find a higher participation rate among individuals who receive an invitation signed from their GP.1 Walker and Whynes (1991) find that more impersonal approaches reduce participation. In addition, there is a potential benefit with regard to gained life years of increasing participation, since prevalence increases with age and participation decreases with age. Studies of willingness-to-pay (WTP) for colorectal cancer screening are closely related to our study. Frew, Wolstenholme and Whynes (2001) studied the WTP for two types of colorectal cancer screening. They show that WTP is influenced by factors like gender, income, age, risk perception, illness experience and health beliefs. This article proceeds as follows; Section 2 discusses the decision to participate in screening for colorectal cancer. In 3 we present the theoretical model, and in 4 the empirical specification of the model is presented. Data and estimated results are reported in 5 and 6 respectively. In section 7 we predict the increase in participation and in section 8 we estimate the total costs of increasing participation and the costs per additional screening. We end the discussion with some concluding remarks in section 9. 2. The participation decision in screenings for colorectal cancer Screenings are mass-examinations of individuals who have no symptoms of a specific illness. One criterion for a mass-examination is that the disease has a relatively high incidence rate, which is the case for colorectal cancer, being the most common type of cancer in Norway. Gyrd-Hansen et al. (1997) has described the progress of cancer and how it is affected by screening, see figure 1. Cancer has a biological onset. Normally, without screening, the cancer is first detected on the basis of symptoms. The starting point of the symptomatic phase is the time of diagnosis due to symptoms. Screening makes it possible to detect and prevent cancer in the asymptomatic phase, also referred to as the sojourn time. The starting point of the sojourn time is defined as the time when it is possible to detect colorectal cancer with a screening method. This point may depend on the sensitivity of the test, 1 Several other analyses are presented in Vernon (1997) 4 while the right endpoint, i.e. start of the symptomatic phase, may depend on the natural history of the disease, i.e. how it progresses. The earlier cancer is detected, the shorter the delay time, which is the time from the starting point of the sojourn time to the time that the screening test detects cancer. Earlier detection of cancer also increases the lead time, i.e. the amount of time by which a diagnosis is advanced due to screening. (Figure 1) From 1999 to 2001 NORCCAP (Norwegian colorectal cancer prevention, see Bretthauer et al. (2002)), the first screening for colorectal cancer was carried out in Norway. Ahead of NORCCAP, there had been a pilot study which was important for the choice of design of the NORCCAP study, see Hoff et al. (1985). Two counties were represented in NORCCAP, Telemark (165,855 inhabitants in 2003), where the pilot study was carried out, and Oslo (517,401 inhabitants in 2003). Oslo represents a typical urban area, while Telemark has both urban and rural areas. NORCCAP is a once-only screening, and the screening-methods used were flexible sigmoidoscopy (FS) and faecal occult blood tests (FOBT)2. Half of the intervention/screening group was offered FS and the other half a combination of FS and FOBT. FS enables the physician to observe the inside of the large intestine from the rectum through the distal part of the colon (about 50 cm of the total colon), called the sigmoid colon. This procedure makes it possible to look for polyps3, being early signs of cancer. The FOBT test is self-administered and requires stool samples on three consecutive days. Samples are smeared onto cards containing chemically impregnated paper and returned to the laboratory at the time of screening participation. There were some exclusion criteria in the study. Individuals under treatment for cancer and individuals using anticoagulants were, for instance, excluded. 2 The FOBT used here is a FlexSureOBT®, an immunochemical test for human blood. Polyps are outgrowths in the colon. The greater they are, the more likely they are to develop into cancer in the future. 3 5 The expected benefits from screening for colorectal cancer are an increased probability of surviving cancer and a reduced number of future incidences. The first effect is due to earlier detection of cancer since colorectal cancer often is diagnosed at a very late stage, which is negatively correlated with the survival probability. The second effect is connected to the removal of polyps from the colon which could develop into cancer in the future. 3. Demand for screening for colorectal cancer In this section the choice of whether to participate or not in a screening for colorectal cancer is analysed in a simple analytic model. This enables us to study factors that are important to the individual when making the decision. We assume a two period model, where the choice to participate in a screening for colorectal cancer is made in the first period and where the medical outcome is realised in the second period. The participation decision depends both on known and uncertain factors. For instance, compensation, the time spent travelling to the screening centre and travel expenses are known by certainty, whereas examination discomfort and medical outcome are uncertain. The individual therefore makes a decision based on expectations. The known costs of participation amount to a negligible part of the income, i.e. consumption will not be affected by the choice to participate. Since the screening is performed during the asymptomatic detectable stage of the disease, the individual is assumed not to have known colorectal cancer when she4 makes her decision to participate. The utility is therefore independent of perceived health state in period 1, while it depends on the perceived health state in period 2. How screening influences the probability of staying healthy in period 2 is important when the individual decides whether to participate or not. In the analysis we only include reduced future incidences of colorectal cancer. It is here assumed that screening does not affect severity. q j (where j =P, N) is the perceived probability of staying healthy in period 2. Superscript j refers to the choice; j = P indicates that the individual participates and j = N that she does not participate. q P is expected to increase (or remain constant) as a result of the screening. 6 Hence, q P ≥ q N , i.e. the perceived probability of staying healthy in period 2 when participating can never be smaller than the perceived probability of staying healthy in period 2 when not participating. How much the perceived probability of staying healthy will increase as a result of participating in the screening, will differ from individual to individual due to different expectations. The expectations can be influenced by personal characteristics and information about the population probability of getting colorectal cancer. Due to uncertainty about the health outcome in period 2, we use a setup based on the expected utility theory. We assume that EV P = v1P + r[q P a2h + (1 − q P )a2s ] (1) EV N = r[q N a2h + (1 − q N )a2s ] (2) where v1P is a vector of participation specific factors in period 1, such as travel time and expenses, and compensation, and can therefore take both positive and negative values. a2d (where d = h, s ) represents the change in utility of staying healthy or getting colorectal cancer in period 2. Superscript d refers to the health state; d = h indicates that the individual is healthy and d = s that she has colorectal cancer. When the individual stays healthy in period 2, we assume that the utility increases, a2h > 0 , whereas if the individual gets colorectal cancer we assume no change in utility, a2s = 0 . r is the discount factor, r ∈ [0,1] , indicating that future effects are given less weight for lower values of r . Using the assumption above and equations (1) and (2), we can find the difference in expected utility between participating and not participating. EV P − EV N = v1P + ra2h (q P − q N ) (3) The first term in (3) represent the participation specific factors in period 1. The second term reflects the expected discounted health benefits from screening in period 2, and is a product of the discount 4 We refer to the individual as “she” 7 rate, the increase in utility of staying healthy, and the change in perceived probability of staying healthy between participating and not participating. 4. Empirical specification of the model The factors that influence the participation decision in the analytic model are both known and uncertain. Participation-specific factors in the first period, v1P , are travel time, travel expenses, and compensation all being known to the individual. Other factors are unobservable to the researcher, such as expectations about the screening itself including stress and whether or not the screening is expected to be uncomfortable. The expected discounted health benefits from screening are given by the product ra2h (q P − q N ) . We do not observe the factors of this product directly, but this product can be represented by suitable instrument variables. An individual who believes she will benefit from screening can be expected to have a greater positive change in the perceived probability of staying healthy if she participates than an individual who does not think the screening will have any effect, see Sutton et al. (2000). The levels of and changes in perceived probabilities are also assumed to depend on the level of knowledge about cancer. This correlation may be due to the fact that an individual with relatives who have a history of cancer is more informed about the true risk in the population and expected change in the probability. Another explanation could be that she is more afraid of getting colorectal cancer and will do anything to reduce the probability of getting it. The difference between the perceived probability of staying healthy when participating and not participating will then increase, see Petersen (2002), Harewood et al. (2002) and Vernon (1997). Socio-economic variables like education, income and wealth are assumed to be positively correlated with the discount factor, and will therefore increase the difference in expected discounted utility, see McCaffery et al. (2002), Peterson (2002) and Vernon (1997). We assume that the difference in expected utility can be represented by the reduced form specification: EVi P − EVi N = α * kiP + X i β * +σε i i = 1, …M 8 (4) where α * is an unknown parameter, kiP is a pecuniary compensation that the individual is offered if she decides to participate. β * is a vector of unknown parameters and X i is a vector of the explanatory variables; including the travel time, travel expenses, perceived benefit of screening for colorectal cancer, number of family members with a cancer history, income and education. σ is a positive unknown parameter. The size of σ determines how much of the variation in the dependent variable that is explained by the systematic part and the stochastic part of the model. When σ → ∞ the variation in the model will be totally stochastic, and when σ → 0 the model will be deterministic, i.e. all variation is explained by the systematic part. ε i is a random term that accounts for misspecification and the effect of unobserved variables, such as embarrassment. The random term is assumed to be standard normally distributed N ∼ (0,1) . M is the number of individuals in the analysis. Without loss of generality we can normalise equation (4) by dividing both sides with σ , which gives us EVˆi P − EVˆi N = α kiP + X i β + ε i where α = (5) α* β* . and β = σ σ The individual chooses to participate when EVˆi P − EVˆi N ≥ 0 , which is when the difference in expected utility is greater than or equal to zero. To take account of selection biases in the data set we adjust for the fact that only individuals who did not participate, answered our hypothetical question about compensation. This is done by estimating the conditional probability of accepting compensation, i.e. the probability of accepting compensation given that the individual did not participate when first invited (when compensation was 9 zero). The estimation is carried out in two steps5. First, the probability of participating when first invited is derived, i.e. for compensation equal to zero. Let 1 if X i β + ε i ≥ 0 Yi = 0 otherwise The participation probability when first invited is defined as P (Yi = 1| X i ) = P( X i β ≥ −ε i ) (6) Since the random term is normally distributed, we can use a probit model and write the cumulative probability of participating in the screening as: P (Yi = 1| X i ) = Φ ( X i β ) (7) where Φ (.) denotes the standardised cumulative normal distribution. The parameters in (7) can be estimated by the maximum likelihood method. We then maximise the probability of the chosen model fitting our observations. One can conveniently express the log likelihood functions as LogL = ∑ Yi log Φ ( X i β ) + ∑ (1 − Yi ) log(1 − Φ ( X i β )) i (8) i In the second step we use the estimated coefficients from (8) to estimate whether pecuniary compensation increases participation in the screening among those individuals who did not participate when first invited. Let 5 It is also possible to estimate this probability simultaneously, but that procedure is much more complicated. The theoretical specifications are reported in the appendix. 10 1 if α kiP + X i β + ε i ≥ 0 given Zi = 0 otherwise X i β + εi ≤ 0 The probability of accepting compensation given that the individual did not participate when first invited (compensation equal to zero), is defined as P (α kiP + X i β ≥ ε i | X i β ≤ ε i ) = P(α kiP + X i β + ε i ≥ 0, X i β + ε i ≤ 0) P ( X i β + ε i ≤ 0) (9) where the numerator is the joint probability that the individual did not participate when first invited and accept compensation. The denominator is the probability that the individual is in the sample, i.e. did not participate when first invited. Equation (9) can be restructured to P (α kiP + X i β ≥ ε i | X i β ≤ ε i ) = P(α kiP + X i β ≥ −ε i ≥ X i β ) P( X i β ≤ −ε i ) (10) where the only change from equation (9) is the numerator on the right hand side, which is the participation probability when compensation increases from zero to kiP . From the assumption that the random term is normally distributed, we can rewrite this expression as Φ(α kiP + X i β ) − Φ ( X i β ) Qi = 1 − Φ( X i β ) (11) where Qi is the conditional probability of accepting compensation given that the individual did not participate when first invited. Φ (.) denotes the standardised cumulative normal distribution. The parameters in (11) can be estimated by the maximum likelihood method. One can conveniently express the log likelihood functions as 11 log L = ∑ Z i log Qi + ∑ (1 − Z i ) log(1 − Qi ) i (12) i In summary; in the reduced form specification we have assumed the following correlation between the explanatory variables and the individual’s participation probability: • Compensation increases participation. • Longer travel time and higher travel expenses reduces participation. • Increased income and education increases participation, see McCaffery et al. (2002), Peterson (2002) and Vernon (1997). • Increased expected benefits from the screening increases participation, see Sutton et al. (2000). • Increased number of family members with a cancer history increases participation, see Petersen (2002), Harewood et al. (2002) and Vernon (1997). In addition, we believe that the following variables may affect the individual’s choice of participating as well: • We would expect individuals from other countries than Norway to have a lower participation probability than Norwegians. This would be due to problems of informing them because of language difficulties. • Marital status is assumed to be an important factor in health decisions. Living in a relationship with a spouse or partner is supposed to increase the participation probability. For this group the costs associated with screening are lower relative to total income than for those living alone. In addition, living in a relationship may motivate the individuals to take action in order to increase their probability of staying healthy because their utility is positively correlated with each other. • The effect of subjective health on the participation probability is expected to depend on the level of health. Those who are in very bad health may not have the energy to participate in a 12 screening. Especially if they think their condition is unrelated to colorectal cancer. Those who report a very good health condition may not participate because they fail to see the need for treatment, see McCaffery et al. (2002). • Number of visits to their GP during the last 12 months and number of hospitalisations during the last 5 years are both indicators of the individuals’ need for health care services. This effect may be strongest for the number of hospitalisations, since hospitalisations are rationed by the GP. We would therefore expect that the participation probability is reduced as the number of hospitalisations rises. The individuals decide themselves when they want to consult their GP, and the number of visits can also indicate how inclined the individual is to visit the GP and health care services in general. This assumption indicates an increased participation probability with increased numbers of visits to the GP during the last 12 months. • Women are expected to participate more often than men, because they are more inclined to use health care services. In addition, the introduction of mammography screening may have increased their knowledge about cancer and the importance of early detection, see Petersen (2002), Sutton et al. (2000) and Vernon (1997). • We would expect that participation in the workforce says something about socio-economic status, i.e. we would expect individuals who work to participate more often than those not working, see McCaffery et al. (2002). • Age is assumed to have a positive effect on the participation probability, see Petersen et al. (2002). • We also expect individuals living in Telemark to have a higher participation probability. This claim is supported by three arguments. Firstly, the individuals may have heard about the screening through the pilot study. Secondly, half the population is invited, indicating that the probability of knowing someone else who is invited is high. Finally, the screening in Oslo will be one of many health care activities the individuals can be offered. 13 Our benchmark is that both choices are random. As a measure of the goodness of fit we can therefore employ6: ρ 2 = 1− LogL* LogL0 (13) where L* is the log likelihood from the estimation, and L0 is the log likelihood if the choice was totally random, i.e. all the parameters are zero. Two extreme situations can occur. Firstly, if ρ 2 =1 (σ=0) the covariates explain all the variation in the data i.e. no uncertainty in the preferences. Secondly, if ρ 2 = 0 the deterministic part of the model has no predictive power. This information will be used in the empirical testing of how well the model fits the data. We shall estimate different model specifications, and in order to decide which one to choose, we apply the likelihood ratio test. A typical null hypothesis ( H 0 ) is that there are specific constraints on the parameter values. For examples, several parameters may be equal to zero. Let βˆ H denote the constrained maximum likelihood estimate obtained when the likelihood is maximised subject to the restrictions on the parameters under H 0 . Similarly, let β̂ refer to the unconstrained maximisation of the likelihood. Let ( βˆ H ) and ( βˆ ) denote the log likelihood values evaluated at βˆ H and β̂ , respectively. Let f be the number of independent restrictions implied by the null hypothesis. Under the null hypothesis we then have ( −2 ( βˆ H ) − ( βˆ ) ) (14) which is asymptotically chi-squared distributed with f degrees of freedom. Thus, if ( ) −2 ( βˆ H ) − ( βˆ ) is large, the null hypothesis is rejected. 6 This measure has been proposed by McFadden. 14 5. The data From the year 1999 to 2001, 7,000 persons were invited, 3,500 from each county. In 1999 and 2,000 persons between 55 and 64 years were invited, while persons between 50 and 54 years were invited in 2001. The participation rate in 1999 and 2000 was 66 per cent, but fell to 62 per cent in 2001- 65 per cent for the whole period. Our analysis consists of data from the screening in 2001, i.e. persons between 50 and 54 years. In co-operation with Statistics Norway a postal questionnaire was sent to 4,998 of those invited to the screening. The questionnaire contained questions about travel time, travel expenses, use of health care services, health condition, knowledge about cancer and participation in the workforce. Earlier experiences (see Aas, 2004) had shown lower response from those who did not participate. To ensure the best possible analysis we decided to include all those who did not participate (2,628 people), then all the people who participated after receiving a reminder (933 people), and finally a random sample of those who participated without a reminder (1,437 people). 85 per cent of those participating answered the questionnaire and 45 per cent of those not participating. In addition to the questionnaire, we obtained information about age, county of residence, gross income and education from Statistics Norway. The data-set originally consisted of 3,116 observations but this figure was reduced to 2,918 due to missing information about education (27 individuals), and the fact that 171 individuals had answered the questionnaire incompletely. Rather than excluding observations where the individual had failed to report information about travel time and travel expenses, we replaced the missing value with the median value for individuals living in the same county. In Oslo the median travel time was 1.35 hours and in Telemark 1.77 hours (145 individuals). Median travel expenses were NOK 40 and NOK 60 for Oslo and Telemark respectively (333 individuals). The income measure used in the analysis is personal gross income. We see from table 1 that participants had shorter travel time, lower travel expenses, higher income and about the same age as those not participating. (Table 1) 15 (Table 2) Table 2 shows descriptive statistics of variables used in the analysis. We see that perceived benefit tends to be a strong indicator of participation, as participation increases with perceived benefit. There is a small tendency of men participating more often than women. Participation tends to increase with more visits to a GP, expected benefit from the screening, genetic predisposition, and level of education, except for the highest education level. If the individuals are working, living in Telemark, or are natives of Norway, participation will increase. With the exception of individuals with very good health, participation decreases as health declines. Participation also decreases with an increased number of hospitalisations. Married individuals and widows/widowers participate more often than unmarried, separated or divorced individuals, and cohabitants. Since only individuals who did not participate when first invited were asked the question about compensation, these individuals constitute the sample when we in the second step estimate the effect of compensation on the participation probability7. The sample was originally split into four random subsamples. Each sample was allocated only one size of money and asked the hypothetical question “would you participate if you were to get NOK X in compensation?” They had the choice of answering “yes”, “no” or “do not know”. In the estimation we have only included those who answered “yes” or “no”, i.e. excluded 330 individuals who answered “do not know”. Furthermore, the sample was further reduced as a result of 136 individuals not providing complete answers. The sample is therefore reduced to 627 individuals. The percentage distribution of those answering “yes” and “no” is reported in table 3. (Table 3) 16 Except for the category NOK 1,000, there is a tendency towards a higher acceptance rate the larger the sum offered is. Meanwhile, we see that a large proportion accepts even when the compensation is at the lowest point (NOK 200). 6. Estimation and results We estimate the empirical model in section 4 by using TSP 4.5. The estimation was carried out in two steps. First, we estimated the probability of participating in the screening. At this point the compensation was zero. In the second step we used the estimated coefficient from the first estimation to estimate the effect of compensation on the participation probability, given that the individual had not participated when first invited. Results from both steps in the estimation are reported jointly in table 4. Three different models are presented. In model 1 we include only variables we believe are the most important determinants for the decision to participate. In model 2 we test the stability of model 1 by adding only significant variables. In model 3 we estimate a full model with all the factors that we believe may affect the choice of participation. From table 4 we see that compensation has a significantly positive effect on participation in all three specifications. In addition, we find (in all models) that the participation probability is lower with higher travel expenses, if the individual expected no benefit, little or very little effect of the screening8, and increases by: • higher income9 • age10 • living in Telemark • higher levels of education, except for the highest level11. 7 Descriptive statistics in this dataset are reported in the appendix. Identical with findings in Sutton et al. (2000). 9 Identical with findings in McCaffery et al. (2002), Peterson (2002) and Vernon (1997). 10 Identical with findings in Peterson (2002). 11 Identical with findings in McCaffery et al. (2002), Peterson (2002) and Vernon (1997). 8 17 (Table 4) In model 2 and 3 the participation probability is also lower if the individual reported subjective health as poor or very poor12, and higher if the individual: • was born in Norway • visited a GP 2–3 times or 4–5 times during the last year • is married or lives together with a partner • has 1, 2–3 or 4 or more family members with a cancer history13. The results are stable across the different model specifications. The goodness-of-fit is measured by (13). We calculate ρ 2 to be 0.20 in model 1 which means that the model explains the data 20 per cent better than if the individual is assumed to make a purely random choice (0.23 in model 2 and model 3). Hence there are systematic dependencies between characteristics of an individual and the individual’s choice of accepting compensation. Still, the random part of the model plays an important part in the choice process. Using the log likelihood ratio test to choose the best specification, we find that model 1 is rejected in favour of model 2, which in turn is rejected in favour of model 3 (rejected at a p-value of less than 0.005). The share of correct predictions is another measure for the preciseness of the model specification. The numbers are reported in table 5. We see that the sensitivity of the “yes” prediction is 0.89 (1,728/1,937) and the specificity is 0.46 (456/981). This indicates that the model does, on average, predict “yes” and “no” correctly in approximately 81 per cent of the cases. The positive prediction value in the model is 0.77 (1,728/2,253), which indicates that we on average predict more than 3 out of 4 positive choices correctly. (Table 5) 12 Identical with findings in McCaffery et al. (2002). 18 7. Predicting changes in the rate of participation The individual was confronted with only one hypothetical sum of compensation in the questionnaire. An individual, who did not accept NOK 200 in compensation, however may have chosen differently had she been offered NOK 1,000 in compensation. Similarly, an individual who accepted NOK 500 in compensation may have chosen to participate with only NOK 200 in compensation. We can use the estimated results from table 4 and predict the level of compensation required for the individual to be indifferent between participating and not participating, i.e. where the expected discounted utility is equal for the two choices. When equation (5) equals zero, we find the value of kiP which determines the point where the individual is indifferent between participating and not participating. kiP = − 1 α ( X i β + εi ) (15) The compensation can only be positive, since the individual would have chosen to participate when first invited if the compensation had been smaller or equal to zero. We want to use the results from the estimated model to predict the probability of accepting a screening invitation given different sums of compensation. This will enable us to estimate the costs of increasing the participation per additional screening. The probability of an individual accepting a pecuniary compensation less than y in order to participate, can be defined as 1 ( X i β + ε i ) ≤ y) α = P(−ε i ≤ α y + X i β ) P (kiP ≤ y | X i ) = P(− 13 (16) Identical with findings in Petersen (2002), Harewood et al. (2002) and Vernon (1997). 19 Since ε i is standard normally distributed, which is a symmetric distribution, −ε i is also standard normally distributed. The cumulative probability distribution can be represented with the probit model: P (kiP ≤ y | X i ) = Φ (α y + X i β ) (17) Using (17) we can find the share in the population requiring compensations between y and y + ∆y to participate P ( y < kiP < y + ∆y | X i ) = P(kiP < y + ∆y | X i ) − P (kiP < y | X i ) (18) We estimated the predicted participation probability for given levels of compensation by using the model in equation (9) and the estimated coefficients from model 3 in table 4. From equation (18) we can compute how much the probability changes with increased compensation for each individual. In order to aggregate the result (obtain the unconditioned expectation), we add up the change in probability for all the individuals and estimate the average change. From table 6 we see that the predicted probability reaches 62 per cent when the individual is offered NOK 500 in compensation. To increase the probability to 84 per cent, we have to offer NOK 2,000. We derive the change in the predicted participation probability by finding the change in predicted probability for two different levels of compensation.14 We see that the change in predicted probability is not linear and has no specific trend. (Table 6) 14 The change in the predicted participation probability is derived as follows: For compensation equal to NOK 50: 0.533 – 0; for NOK 100: 0.543 – 0.533 etc. 20 20,780 individuals were invited to participate. Since 12,960 participated, the rate of participation is equal to approximately 0.62, i.e. a share of 0.38 did not participate without compensation. We know that 0.45 of those not participating answered the questionnaire. From table 6 we see that 0.62 are predicted to participate with a compensation of NOK 500. In this case, the total increase in participation is equal to: 0.38 * 0.45 * 0.62 = 0.106. Total participation will then be 0.726. This procedure assumes that we can only persuade individuals who answered the questionnaire to participate in the screening. Hence, the maximal participation rate can never be increased with more than 0.17 (0.38*0.45), i.e. to a total rate of participation of 0.79. In order to better illustrate the results, we have calculated changes in the predicted probability for different sub samples. In doing that we have used the average values of the following variables: Travel time, travel expenses, income, age, and number of hospitalisations during the last 5 years. In addition we have assumed that the individual is a man, married or has a partner and has an intermediate level of education. For all the examples the estimation was carried for a compensation level equal of NOK 500. In the 8 predictions we have varied the variables; county, native country, genetic predisposition, subjective health, number of visits to the GP during the last 12 months, and expected benefit from the examination. The results are presented in table 7. (Table 7) All the variables seem to affect the predicted probability to a great extent. the estimated probability varies from 0.061 to 0.914, indicating that it is easier to persuade some groups to participate than others. For instance, an individual living in Oslo, born in Norway, not working, with 2–3 family members with a cancer history, no use of GP during the last year, reporting very poor health and expecting very little benefit from the screening has an approximately eight times smaller probability of participating relative to if he used the GP 4–5 times during the last year, reports good health, is working, and expect very much benefit from the screening. 21 8. The costs of increasing participation To estimate the costs, we use numbers from the NORCCAP Annual Report 1998 – 2001. The estimation of the costs of increasing participation includes: 1. Compensation both paid to those who are willing to participate without compensation and to those who need compensation in order to participate. Both groups must be compensated; otherwise very few would choose to participate when first invited, if they know that they can receive compensation by waiting. Compensation may cover all losses incurred by participation. 2. Incremental costs related to increased numbers of screenings of NOK 2,683 per screened individual15. 3. Incremental costs related to increased numbers of colonoscopies. There are 0.3 colonoscopies per screening and the costs amount to NOK 248 per screened individual16. 4. Travel costs of NOK 90 per individual on average among those not participating when first invited. Using the assumptions from 1 – 4 we can specify the total cost function TC = (20780 + (20780*0.38*0.45* γ k ))k + (2683 + 248 + 90)(20780*0.38*0.45* γ k ) (19) where TC is total costs, k is pecuniary compensation and γ k is the predicted increase in participation for a compensation level of k17. We have used the results from table 6 and assume that only those answering the questionnaire can be encouraged to participate. We derive the change in participation 15 Estimated by use of accounting data from the NORCCAP annual report. Estimated by use of accounting data from the NORCCAP annual report. 17 The number of invited was 20,780. Increased participation is equal to (NOK 200 as an example): 0.38*0.45*0.561*20780=1993. 16 22 from the predicted probabilities in table 6.18 The change in total costs is estimated the same way as the change in participation. The costs per additional screening are derived by dividing the change in total costs by the change in participation.19 (Table 8) From the table we see that the costs per additional screening are increasing. Offering the individuals NOK 200 in compensation leads to costs of NOK 5,306 per additional screening. Increasing the compensation to NOK 500 increases participation by 196 individuals. The costs per additional screening related to offering a compensation of NOK 500, are NOK 38,375. 9. Concluding remarks We have shown that compensation increases the participating rate in screenings for colorectal cancer. In addition we show that an individual’s participation probability increases with; higher income; age; living in Telemark; being born in Norway; having visited a GP 2-5 times during the last year; being married or having a partner; a higher expected benefit from the screening; genetic predisposition, a higher level of education (except for very high education). Participation is lower with higher travel expenses and among those reporting their subjective health to be poor or very poor. We use the estimated results to predict the participation probability for different levels of compensation. Offering the individuals NOK 200 in compensation increases participation from 62 to 72 per cent, and results in costs of NOK 5,306 per additional screening. It is assumed that only those answering the questionnaire can be encouraged to participate, and we have therefore applied the most cautious estimate. Assuming no selection bias in the data set reduces the costs significantly. If we offer the individual NOK 200, the participation rate increases 18 The change in predicted probability; NOK 200: 1993 – 0, NOK 500: 2189 – 1993, etc. 23 from 62 to 83 per cent, i.e. 4,429 individuals will decide to participate and the costs per additional screening will be reduced to NOK 4,159. The relevance of our findings depends, among other things, on the individual’s actual behaviour being identical to her reported answer. Would the individual actually participate if she were confronted with the same pecuniary compensation as in the questionnaire? We know from environmental economics that individuals who were confronted with their WTP for improved environment did not actually pay the sum they had reportedly been willing to pay (see Seip and Strand 1992). The true benefits of the screening, i.e. number of life years gained, is another factor that is important before compensation can be recommended as an appropriate measure. In the next few years we will be able to analyse and find the real effect of screening on the incidence of colorectal cancer in Norway. This will be possible as we are developing a data set where we track the individuals invited to the screening, together with a control group. Regardless of the true benefits, the government should also evaluate other possible measures and their respective costs. In our analysis we find that a large share of those asked is encouraged to participate at a relatively low level of compensation. Does this indicate that they are just happy to get a “second chance”? If this is true, a second reminder or another invitation would be enough to make them participate. This would certainly be less expensive. Or, since many report “unable to go” as their most important reason for not participating when first invited, a more flexible appointment system may be a solution. A flexible appointment system may include extended opening hours and more administrative staff who contact the individuals by telephone in order to give them the opportunity to find the best possible time for the screening. In NORCCAP the individuals themselves could change their appointment. Since 12,960 out of 20,780 participated, this indicates that the administrative staff would have to contact 8,040 individuals. At a first glance this method seems less expensive, but we do not know the true effect on the rate of participation. These last two examples just illustrate other possible measures to evaluate in order to increase participation in screenings. In a future research project it would be interesting to test for different follow-up strategies. 19 For instance for NOK 500: 12,711,405/196 = 38,375. 24 References Aas, E, 2004, “Participation in screening for colorectal cancer”, Forth coming in Økonomisk Forum in October 2004. Bretthauer, M, G. Gondal, I.K. Larsen, E. Carlsen, T.J. Eide, T. Grotmol, E. Skovlund, K.M. Tveit, M.H. Vatn and G. Hoff, 2002, “Design, Organization and Management of a Controlled Population Screening Study for Detection of Colorectal Neoplasia”, Scandinavian Journal of Gastroenterology 5, 569 – 573. Cole, S.R, G.P. Young, D. Byrne, J.R. Guy, J. Morcom, 2002, “Participation in screening for colorectal cancer based on a faecal occult blood test in improved endorsement by the primary care practitioner”, Journal of Medical Screening 9, 147 – 152. Frew, E, J.L. Wolstenholme, D.K. Whynes, 2001, “Willingness to pay for colorectal cancer screening”, European Journal of Cancer 37, 1746-1751. Greene, W., 2002, Econometric analysis, fifth edition (Prentice-Hall Inc.) Gyrd-Hansen, D, J. Søgaard and O. Kronborg, 1997, ”Analysis of Screening Data: Colorectal Cancer”, International Journal of Epidemiology (6), 1172 – 1181. Harewood, GC, MJ Wiersema, LJ Melton III, 2002, “A prospective, Controlled Assessment of Factors Influencing Acceptance of Screening Colonoscopy”, The American Journal of Gastroenterology 12, 3186 - 3194 25 Hoff, G, M.H. Vatn, E. Gjone, S. Larsen, J. Sauar, 1985, ”Epidemiology of polyps in the rectum and sigmoid colon. Design of a population screening study”, Scandinavian Journal of Gastroenterology 20, 351 – 355. McCaffery, K, J. Wardle, M. Nadel, W. Atkin, 2002, ”Socioeconomic variation in participation in colorectal cancer screening”, Journal of Medical Screening 2002:9, 104-108. Petersen, GM, 2002, “Barriers to preventive intervention”, Gastroenterology of clinics of North America 31, 1061-1068. Samlede årsrapporter for perioden 1998 – 2001 (Annual report), NORCCAP – Norwegian Colorectal Cancer Prevention. Statistics Norway, The postal questionnaire. Seip, K, J. Strand, 1992, “Willingness to Pay for Environmental Goods in Norway: A Contingent Valuation Study with Real Payment”, Environmental and Resource Economics 2, 91 - 106 Sutton, S, J. Wardle, T. Taylor, K. McCaffery, S. Williamson, R. Edwards, J. Cuzick, A. Hart, J. Northover, W. Atkin, 2000, “Predictors of attendance in the United Kingdom flexible sigmoidoscopy screening trial”, Journal of Medical screening 7, 99-104. TSP, 1999, Reference Manual Version 4.5 (TSP International) Vernon, S.W., 1997, “Participation in Colorectal Cancer Screening: a Review”, Journal of the National Cancer Institute 19, 1406 – 1422. 26 Walker, A and D.K. Whynes, 1991, “Participation and screening programmes for colorectal cancer: More would be better?” Journal of Health Economics 10, 207 – 225. Wardle, J, S. Williamson, K. McCaffery, S. Sutton, T. Taylor, R. Edwards, W. Atkin, 2003, “Increasing Attendance at Colorectal Cancer Screening: Testing the Efficacy of a Mailed, Psychoeducational Intervention in a Community Sample of Older Adults”, Health Psychology 22, 99 – 105. 27 Appendix A1: The joint probability The joint probability of accepting compensation and not participating when first invited is defined by: 1 if X i β + ε i > 0 Vi = 0 otherwise Wi = 1 if X i β + ε i < 0 and α kiP + X i β + ε i > 0 P (Vi = 0, Wi = 1| X i ) = P( X i β + ε i < 0, α kiP + X i β + ε i > 0) (20) Using the results from the empirical specification in section 2.2, the parameters in (6) can be estimated by the maximum likelihood method. We then maximise the probability of the chosen model fitting our observations. One can conveniently express the log likelihood functions as log L = ∑ Vi log Φ ( X i β ) i + ∑ (1 − Vi )Wi log[Φ (α kiP + X i β ) − Φ ( X i β )] i + ∑ (1 − Vi )(1 − Wi ) log[1 − Φ (α kiP + X i β )] i A2: Descriptive statistics (Table A1) (Table A2) 28 (21) Biological onset Sojourn time Asymptomatic detectable disease stage Delay time Lead time Screening test Detects disease Figure 1: Progress in cancer and the introduction of screening. 29 Symptomatic Table 1: Descriptive statistics for the continuous variables according to participation and nonparticipation in the screening. M = 2,918. Variable Travel time (hours) Travel expenses (NOK) Income (NOK) Age Participating Mean St.dev 1.46 1.80 73.17 141.78 406,775 1,519,455 53.8 1.5 30 Not participating Mean St.dev 1.72 2.42 114.20 492.01 306,347 296,371 53.7 1.5 Table 2: Descriptive statistics for categorical variables according to participation and nonparticipation in the screening. M = 2,918. Variable Perceived benefit Category Participating Not participating Very much Much Neither much nor little Little Very little 0.80 0.76 0.47 0.29 0.15 0.20 0.24 0.53 0.71 0.85 Men Women 0.67 0.64 0.33 0.36 Oslo Telemark 0.62 0.70 0.38 0.30 Low (0 – 10) Intermediate (11 - 14) High (14 – 19) Very high (19 +) 0.58 0.67 0.70 0.59 0.42 0.33 0.30 0.41 Norway Other 0.67 0.58 0.33 0.42 0 1 2–3 4–5 5+ 0.63 0.66 0.69 0.69 0.60 0.37 0.34 0.31 0.31 0.40 0 1 2–4 5 or more 0.67 0.66 0.63 0.49 0.33 0.34 0.37 0.51 Very good Good Neither good nor poor Poor Very poor 0.66 0.69 0.62 0.50 0.38 0.34 0.31 0.38 0.50 0.62 0 1 2–3 4 or more Don’t know 0.56 0.66 0.69 0.81 0.56 0.44 0.34 0.31 0.19 0.44 Unmarried Married/partner Cohabitant Widow/widower Separated Divorced Yes No 0.58 0.70 0.43 0.66 0.55 0.59 0.69 0.52 0.42 0.30 0.57 0.34 0.45 0.41 0.31 0.48 Gender County Education in years Native country No of visits to GP last year No of hospitalisations during the last 5 years Subjective health Genetic predisposition Marital status Working 31 Table 3: Acceptance of an economic compensation and participation, numbers in per cent20. M = 627 Compensation NOK 200 NOK 500 NOK 1,000 NOK 2,000 20 Yes 0.47 0.48 0.39 0.52 No 0.53 0.52 0.61 0.48 1 NOK is approx. 0,137$. 32 N 154 156 162 155 Table 4: Estimated coefficients and their effect on the probability of participating in the screening for colorectal cancer. The coefficient for compensation is estimated in the second step (M=627), whereas all the others are estimated in the first step (M=2,918). Standard error in brackets. Variable Compensation Explanation Model 1 Model 2 Model 3 0.572 (.025)*** 0.585 (.025)*** 0.585 (.025)*** -1.592 (.937)* -1.612 (.952)* -1.695 (.957)* -10.389 (6.89) -10.113 (6.91) - 9.769 (6.91) -0.513 (.157)*** -0.415 (.160)*** -0.401 (.161)*** 2.936 (.960)*** 1.834 (.915)** 1.834 (.923)** Much Neither much nor little Little Very little -0.198 (.066)*** -1.009 (.073)*** -1.432 (.121)*** -1.901 (.167)*** -0.234 (.068)*** -1.003 (.075)*** -1.396 (.123)*** -1.757 (.169)*** -0.235 (.068)*** -1.001 (.075)*** -1.401 (.124)*** -1.755 (.169)*** Women -0.017 (.053) -0.037 (.055) -0.045 (.056) 50 to 54 0.383 (.173)** 0.410 (.175)** 0.405 (.176)** Telemark 0.263 (.053)*** 0.212 (.055)*** 0.217 (.056)*** Intermediate (11 – 14) High (14 – 19) Very high (19 +) 0.270 (.072)*** 0.482 (.081)*** 0.365 (.231) 0.222 (.073)*** 0.403 (.084)*** 0.288 (.235) 0.224 (.074)*** 0.398 (.085)*** 0.287 (.236) Not Norway -0.125 (.070)* -0.130 (.070)* 1 2–3 4–5 5+ 0.107 (.060)* 0.158 (.090)* 0.063 (.074) 0.167 (.076)** 0.244 (.106)** 0.134 (.106) Constant Travel time Travel expenses Income Perceived benefit (ref. very much) Gender Age County Education in years (ref. low (0-10)) Native country No of visits to GP last year (ref. 0) Hospitalisations during the last 5 years (ref. 0) Marital status (ref. divorced) Subjective health (ref. very good) Genetic predisposition (ref. 0) 1 2–4 5 or more -0.018 (.067) -0.021 (.097) -0.258 (.219) Unmarried Married/partner Cohabitant Widow/widower Separated 0.211 (.055)*** Good Neither good nor poor Poor Very poor -0.233 (.118)** -0.637 (.346)* 0.098 (.097) 0.211 (.055)*** -0.108 (.247) 0.232 (.178) -0.030 (.185) 0.012 (.067) -0.132 (.087) -0.233 (.118)** -0.637 (.346)** 1 2–3 4 or more Do not know 0.174 (.068)*** 0.223 (.067)*** 0.512 (.096)*** 0.174 (.068)*** 0.223 (.067)*** 0.512 (.096)*** 0.009 (.143) Not working -0.269 (.073)*** -0.269 (.073)*** Working 33 Log likelihood 21 ρ 2 22 1,608.14 1,564.40 1,559.95 0.20 0.23 0.23 ***significant at a 1 per cent level ** significant at a 5 per cent level * significant at a 10 per cent level 21 Log likelihood for the estimation of the probability of participating in the screening. 22 McFaddens ρ2 represent the estimation of the probability of participating in the screening. 34 Table 5: Number of correct and incorrect predictions from the estimated model 3 (step 2), sensitivity and specificity. M = 2,918. Reported decision: Yes Reported decision: No Total Predicted: Yes 1,728 525 2,253 35 Predicted: No 209 456 665 Total 1,937 981 2,918 Table 6: The predicted participation probability for different levels of compensation. Compensation (NOK) 50 100 200 500 1,000 2,000 4,000 8,000 Predicted participation probability 0.533 0.543 0.561 0.616 0.702 0.842 0.975 1.000 Change in predicted participation probability 0.533 0.010 0.018 0.055 0.086 0.140 0.133 0.025 36 Table 7: The predicted participation probability for different sub samples – given NOK 500 in compensation. County Oslo Telemark Oslo Oslo Oslo Oslo Oslo Oslo Native country Not Norway Not Norway Norway Norway Norway Norway Norway Norway Genetic predisp 0 Use of GP 0 Subjective health Very poor health Working Expected benefit No Very little benefit Predicted probability 0.061 0 0 Very poor health No Very little benefit 0.092 0 2–3 2–3 2–3 2–3 2–3 0 0 4–5 4–5 4–5 4–5 Very poor health Very poor health Very poor health Good health Good health Good health No No No No Yes Yes Very little benefit Very little benefit Very little benefit Very little benefit Very little benefit Very much benefit 0.078 0.116 0.171 0.350 0.440 0.914 37 Table 8: Predicted change in participation and the related total costs associated with increasing participation. Compensation (NOK) 200 500 1,000 2,000 4,000 Increased participation 1,993 2,189 2,494 2,992 3,465 Change in participation 1,993 196 305 498 473 Total costs (NOK) 10,575,453 18,096,969 30,808,374 56,582,832 107,440,744 38 Change in total costs (NOK) 10,575,453 7,521,516 12,711,405 25,774,458 50,857,912 Costs per additional screened (NOK) 5,306 38,375 41,677 51,756 107,522 Table A1: Descriptive statistics for the continuous variables according to accepting and not accepting compensation. M = 627. Variable Travel time (min) Travel expenses (NOK) Income (NOK) Age Accepting compensation Mean St.dev 99.0 77.2 104.4 197.8 317,260 319,846 53.7 1.4 39 Not accepting compensation Mean St.dev 87.4 116.3 85.7 267.7 319,908 325,952 53.7 1.6 Table A2: Descriptive statistics for categorical variables according to accepting and not accepting compensation. M = 627. Variable Perceived benefit Category Accepting Not accepting Very much Much Neither much nor little Little Very little 0.74 0.67 0.33 0.21 0.09 0.26 0.33 0.67 0.79 0.91 Men Women 0.51 0.42 0.49 0.58 Oslo Telemark 0.48 0.43 0.52 0.57 Low (0 – 10) Intermediate (11 - 14) High (14 – 19) Very high (19 +) 0.38 0.48 0.52 0.31 0.62 0.52 0.48 0.69 Delayed – unable to go Time expenditure Small gain from screening Uncomfortable examination Loss of income Opening hours Recently done a FS Postpone the examination Didn’t receive an invitation Poor health condition Other 0.76 0.38 0.17 0.26 0.75 0.50 0.70 1.00 0.86 0.29 0.35 0.24 0.62 0.83 0.74 0.25 0.50 0.30 0.00 0.14 0.71 0.65 Norway Other 0.45 0.49 0.55 0.51 0 1 2–3 4–5 5+ 0.31 0.43 0.50 0.59 0.66 0.41 0.57 0.52 0.77 0.69 0.57 0.50 0.41 0.34 0.59 0.43 0.48 0.23 Very good Good Neither good nor poor Poor Very poor 0.37 0.48 0.54 0.52 0.50 0.63 0.52 0.46 0.48 0.50 0 1 2–3 4+ Don’t know 0.43 0.45 0.50 0.54 0.46 0.57 0.55 0.50 0.46 0.54 Unmarried 0.49 0.51 Gender County Education in years Reason for not participating Native country No of visits to a GP last year No of hospitalisations during the last 5 years 0 1 2–4 5+ Subjective health Genetic predisposition Marital status 40 Married/partner Cohabitant Widow/widower Separated Divorced 0.42 0.43 0.67 0.47 0.54 0.58 0.57 0.33 0.53 0.46 Yes No 0.47 0.44 0.53 0.56 Working 41


© Copyright 2026