
Reports
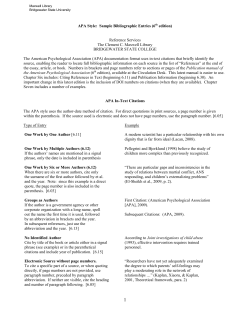
Reports Over 4 - 7 November 2013, we used the Wide Field Camera 3 (WFC3) instrument from the Hubble Space Telescope (HST) to observe three nearlyconsecutive orbits of WASP-43b. The planet orbits so close to its host star that it is tidally locked. Therefore, orbital phase is equivalent to rotational phase for the planet, and observations over a complete orbit allow us to map the Kevin B. Stevenson,1,13* Jean-Michel Désert,2 Michael R. Line,3 entire surface of the planet. HST also Jacob L. Bean,1 Jonathan J. Fortney,3 Adam P. Showman,4 Tiffany acquired data for three primary transits Kataria,4 Laura Kreidberg,1 Peter R. McCullough,5,6 Gregory W. and two secondary eclipses, where the planet passes in front of and behind its Henry,7 David Charbonneau,8 Adam Burrows,9 Sara Seager,10 11 7 12 host star, respectively, between 9 NoNikku Madhusudhan, Michael H. Williamson, Derek Homeier vember 2013 and 5 December 2013. All 1 Department of Astronomy and Astrophysics, University of Chicago, 5640 S Ellis Ave, Chicago, IL 60637, of the observations used the G141 USA. 2CASA, Department of Astrophysical and Planetary Sciences, University of Colorado, 389-UCB, grism (1.1 - 1.7 μm) and the biBoulder, CO 80309, USA. 3Department of Astronomy and Astrophysics, University of California, Santa directional spatial scan mode. 4 Cruz, CA 95064, USA. Department of Planetary Sciences and Lunar and Planetary Laboratory, The Using custom software (18, 19), we 5 University of Arizona, Tucson, AZ 85721, USA. Space Telescope Science Institute, Baltimore, MD 21218, reduced the data and extracted the spec6 USA. Department of Physics and Astronomy, Johns Hopkins University, 3400 North Charles Street, tra. We produced time-series spectrosBaltimore, MD 21218, USA. 7Center for Excellence in Information Systems, Tennessee State University, copy by dividing the spectra into 15 8 Nashville, TN 37209, USA. Department of Astronomy, Harvard University, Cambridge, MA 02138, USA. 9 10 0.035-μm-wide channels (7 pixels, Department of Astrophysical Sciences, Princeton University, Princeton, NJ 08544, USA. Dept. of Earth, resolution R = λ/∆λ ∼ 37). We also Atmospheric, and Planetary Sciences, Dept. of Physics, Massachusetts Institute of Technology, 54-1718, produced band-integrated “white” light 77 Mass. Ave., Cambridge, MA 02139, USA. 11Institute of Astronomy, University of Cambridge, Cambridge curves to resolve finer details in the CB3 OHA, UK. 12Centre de Recherche Astrophysique de Lyon, UMR 5574, CNRS, Université de Lyon, École Normale Supérieure de Lyon, 46 Allée d’Italie, F-69364 Lyon Cedex 07, France. 13NASA Sagan shape of the phase curve (Fig. 1). We Fellow simultaneously fit the light curves using transit and uniform-source eclipse *To whom correspondence should be addressed; E-mail: [email protected] models (20), a baseline flux for each HST scan direction, two standard model Exoplanets that orbit close to their host stars are much more highly irradiated than components for HST orbit-long and their Solar System counterparts. Understanding the thermal structures and visit-long systematics, and a sinusoidal appearances of these planets requires investigating how their atmospheres respond function to represent the phase variation to such extreme stellar forcing. We present spectroscopic thermal emission (19, 21). We estimate uncertainties measurements as a function of orbital phase (“phase-curve observations”) for the using a differential-evolution Markovhighly-irradiated exoplanet WASP-43b spanning three full planet rotations using the chain Monte Carlo (DE-MCMC) algoHubble Space Telescope. With these data, we construct a map of the planet’s rithm (18) and utilize an independent atmospheric thermal structure, from which we find large day-night temperature analysis pipeline (21) to confirm our variations at all measured altitudes and a monotonically decreasing temperature light-curve fits. The white light phase curve (Fig. 1) with pressure at all longitudes. We also derive a Bond albedo of 0.18+−0.07 0.12 and an reveals a distinct increase in flux as the altitude dependence in the hot-spot offset relative to the substellar point. tidally-locked dayside rotates into view. The flux peaks prior to secondary Previous exoplanet phase-curve observations (1–7) have revealed day- eclipse (eastward of the substellar point) and then decreases until the night temperature contrasts and hot-spot offsets relative to the substellar planet transits in front of its host star. Because the phase curve minimum point (the point at which the host star would be perceived to be directly occurs west of the anti-stellar point, we detect a strong asymmetry overhead). However, these observations were limited to broadband pho- (∼10σ) in the shape of the observed phase curve. We measure a white tometry; therefore, the altitudes probed by the phase curves were not light curve eclipse depth that is consistent with the peak-to-peak planet uniquely constrained. Spectroscopic phase curves can break previous flux variation. This confirms a relatively cool night side and poor heat degeneracies by permitting us to uniquely identify the main atmospheric redistribution. Table S1 lists our best-fit parameters with uncertainties. opacity source within the observed bandpass and infer the planet’s atWe gain additional information by decomposing the white light mospheric temperature-pressure profile as a function of orbital phase (8– phase curve into 15 spectrophotometric channels (Fig. 2). The spectrally12). resolved phase curves exhibit wavelength-dependent amplitudes, phase The WASP-43 system contains a transiting Jupiter-size exoplanet on shifts, and eclipse depths (table S2). We use the measured phasea 19.5-hour orbit around its K7 host star (13). Previous measurements resolved emission spectra (Fig. 2C) to infer the temperature structure and (14–17) of its dayside thermal emission detect no signs of a thermal molecular abundances at 15 binned orbital phases (each of width inversion and suggest low day-night energy redistribution. However, the 0.0625). We fit atmospheric models to these spectra using a DE-MCMC precise thermal structure of the dayside atmosphere remains unknown approach from the CHIMERA Bayesian retrieval suite (22). For each without higher resolution observations, and the planet’s global energy phase, a five-parameter, double-gray radiative equilibrium solution pabudget and atmospheric heat-redistribution efficiency is poorly con- rameterizes the planet’s temperature structure (23). The models include strained without observations of the nightside. six thermochemically plausible and spectrally prominent absorbers / http://www.sciencemag.org/content/early/recent / 9 October 2014/ Page 1 / 10.1126/science.1256758 Downloaded from www.sciencemag.org on October 9, 2014 Thermal structure of an exoplanet atmosphere from phase-resolved emission spectroscopy (H2O, CH4, CO, CO2, NH3, and H2S). We find that water is the only absorber to significantly influence the phase-resolved emission spectra (24) (Fig. 2). The model spectra are in good agreement with the data, achieving a typical χ2 value of 18 with 15 data points and 6 relevant free parameters (fig. S3). Using the atmospheric models to estimate the day- and night-side fluxes, we find that the planet redistributes heat poorly [(19), = 0.503+−0.021 = 0.5 → 1 spans the range from zero to full 0.003 , where heat redistribution]. This is predicted to occur when the radiative timescale is shorter than the relevant dynamical timescales, including those for wave propagation and advection over a hemisphere (25). Poor redistribution has been inferred before, but only for hot Jupiters receiving significantly greater stellar flux than WASP-43b (4, 7). We estimate the fraction of incident stellar light reflected by WASP-43b’s atmosphere by computing the day- and night-side bolometric fluxes from the model spectra and find a Bond albedo of 0.18+−0.07 0.12 . This method assumes energy balance with the parent star but requires no detection of reflected light (19). The low Bond albedo is consistent with model predictions that hot Jupiters absorb most of the flux incident upon them (11, 26, 27). The atmospheric model fits reveal information about WASP-43b’s phase-dependent thermal structure at the pressure levels probed by these observations (Fig. 3). Depending on the wavelength and phase, these pressures range from 0.01 to 1 bar (fig. S4). The retrieved thermal profiles are consistent with a global, monotonically decreasing temperature with altitude, as would be expected from radiative cooling without high altitude absorbers of stellar radiation. As a test, we compare the retrieved dayside-averaged thermal profile to three scenarios of self-consistent radiative equilibrium models (28) and find that it is most congruous with the thermal structure expected at the substellar point (fig. S5). This result supports our findings of a low day-night heat redistribution. Adopting the same sinusoidal function used to fit the phase variation (19), we invert the spectroscopic light curves into longitudinallyresolved brightness temperature maps (29) (Fig. 4). The brightness temperature, TB, is a function of atmospheric opacity, and water vapor is the main source of opacity in this bandpass. Because TB is systematically cooler within the water band, this signifies the global presence of water vapor within the pressure regions probed by these measurements (fig. S7). The large measured day-night luminosity difference of WASP-43b [(19), Lday/Lnight > 20 at 1σ, mode ~ 40] stands in stark contrast to the modest day-night differences inferred from Spitzer photometry for giant planets such as HD 189733b, HD 209458b, and HD 149026b that are similarly irradiated (1, 5, 25). Unlike Spitzer data, our spectrum samples the planet’s flux near the peak of its Planck curve, allowing a more robust determination of the total dayside luminosity. This data set suggests that derived day-night differences may be strongly wavelength dependent and that mid-infrared photometry may not give a complete picture of planetary circulation. Brightness temperature maps, being functions of both longitude and atmospheric depth, reveal the dynamics of a planet’s atmosphere. Phasecurve peaks prior to the time of secondary eclipse (as seen in Fig. 1) have previously been reported in hot Jupiters (1, 6) and match predictions from 3D circulation models (30–32). Such models show that the eastward offset results from a strong jet stream at the equator; our observations thus suggest that WASP-43b exhibits such an eastward-flowing jet. Our spectrophotometric observations further demonstrate the influence of water vapor on the emergent thermal structure. Inside the water band (1.35 - 1.6 μm), observations probe lower atmospheric pressures (higher altitudes) and we measure smaller phase-curve peak offsets relative to the other wavelengths (figs. S7 and S8). This is qualitatively consistent with variable brown dwarf measurements (33) and circulationmodel predictions (25, 31, 32, 34), which show that smaller displacements are expected at higher altitudes where radiative timescales are much shorter than the relevant dynamical timescales. However, the observed westward offset of the coldest regions from the antistellar point is puzzling and is not predicted by most models. The strong day-night temperature variation observed for WASP-43b distinguishes itself from the predominantly uniform temperatures of the Solar System giant planets. This illustrates the importance of radiative forcing on the atmospheres of close-in exoplanets. Phase-resolved emission spectroscopy offers a unique way to determine how the extreme stellar radiation incident on these planets is absorbed, circulated, and reemitted. The door is now open to observations that can constrain theories of planetary atmospheric dynamics in a new regime. References 1. H. A. Knutson, D. Charbonneau, L. E. Allen, J. J. Fortney, E. Agol, N. B. Cowan, A. P. Showman, C. S. Cooper, S. T. Megeath, A map of the day-night contrast of the extrasolar planet HD 189733b. Nature 447, 183–186 (2007). Medline doi:10.1038/nature05782 2. H. A. Knutson, D. Charbonneau, N. B. Cowan, J. J. Fortney, A. P. Showman, E. Agol, G. W. Henry, The 8 μm phase variation of the hot Saturn HD 149026b. Astrophys. J. 703, 769–784 (2009). doi:10.1088/0004637X/703/1/769 3. I. J. M. Crossfield, B. M. S. Hansen, J. Harrington, J. Y.-K. Cho, D. Deming, K. Menou, S. Seager, A new 24 μm phase curve for υ Andromedae b. Astrophys. J. 723, 1436–1446 (2010). doi:10.1088/0004-637X/723/2/1436 4. N. B. Cowan, P. Machalek, B. Croll, L. M. Shekhtman, A. Burrows, D. Deming, T. Greene, J. L. Hora, Thermal phase variations of WASP-12b: Defying predictions. Astrophys. J. 747, 82 (2012). doi:10.1088/0004637X/747/1/82 5. H. A. Knutson, N. Lewis, J. J. Fortney, A. Burrows, A. P. Showman, N. B. Cowan, E. Agol, S. Aigrain, D. Charbonneau, D. Deming, J.-M. Désert, G. W. Henry, J. Langton, G. Laughlin, 3.6 AND 4.5 μm phase curves and evidence for non-equilibrium chemistry in the atmosphere of extrasolar planet HD 189733b. Astrophys. J. 754, 22 (2012). doi:10.1088/0004-637X/754/1/22 6. N. K. Lewis, H. A. Knutson, A. P. Showman, N. B. Cowan, G. Laughlin, A. Burrows, D. Deming, J. R. Crepp, K. J. Mighell, E. Agol, G. Á. Bakos, D. Charbonneau, J.-M. Désert, D. A. Fischer, J. J. Fortney, J. D. Hartman, S. Hinkley, A. W. Howard, J. A. Johnson, M. Kao, J. Langton, G. W. Marcy, Orbital phase variations of the eccentric giant planet HAT-P-2b. Astrophys. J. 766, 95 (2013). doi:10.1088/0004-637X/766/2/95 7. P. F. L. Maxted, D. R. Anderson, A. P. Doyle, M. Gillon, J. Harrington, N. Iro, E. Jehin, D. Lafreniere, B. Smalley, J. Southworth, Spitzer 3.6 and 4.5 m fullorbit light curves of WASP-18. Mon. Not. R. Astron. Soc. 428, 2645–2660 (2013). doi:10.1093/mnras/sts231 8. S. Seager, D. D. Sasselov, Extrasolar giant planets under strong stellar irradiation. Astrophys. J. 502, L157–L161 (1998). doi:10.1086/311498 9. A. Burrows, T. Guillot, W. B. Hubbard, M. S. Marley, D. Saumon, J. I. Lunine, D. Sudarsky, On the radii of close-in giant planets. Astrophys. J. 534, L97– L100 (2000). Medline doi:10.1086/312638 10. T. Guillot, A. P. Showman, Evolution of “51 Pegasus b-like” planets. Astron. Astrophys. 385, 156–165 (2002). doi:10.1051/0004-6361:20011624 11. D. Sudarsky, A. Burrows, I. Hubeny, Theoretical spectra and atmospheres of extrasolar giant planets. Astrophys. J. 588, 1121–1148 (2003). doi:10.1086/374331 12. J. J. Fortney, C. S. Cooper, A. P. Showman, M. S. Marley, R. S. Freedman, The influence of atmospheric dynamics on the infrared spectra and light curves of hot Jupiters. Astrophys. J. 652, 746–757 (2006). doi:10.1086/508442 13. C. Hellier, D. R. Anderson, A. Collier Cameron, M. Gillon, E. Jehin, M. Lendl, P. F. L. Maxted, F. Pepe, D. Pollacco, D. Queloz, D. Ségransan, B. Smalley, A. M. S. Smith, J. Southworth, A. H. M. J. Triaud, S. Udry, R. G. West, WASP-43b: The closest-orbiting hot Jupiter. Astron. Astrophys. 535, L7 (2011). doi:10.1051/0004-6361/201117081 14. M. Gillon, A. H. M. J. Triaud, J. J. Fortney, B.-O. Demory, E. Jehin, M. Lendl, P. Magain, P. Kabath, D. Queloz, R. Alonso, D. R. Anderson, A. Collier Cameron, A. Fumel, L. Hebb, C. Hellier, A. Lanotte, P. F. L. Maxted, N. Mowlavi, B. Smalley, The TRAPPIST survey of southern transiting planets. Astron. Astrophys. 542, A4 (2012). doi:10.1051/00046361/201218817 / http://www.sciencemag.org/content/early/recent / 9 October 2014/ Page 2 / 10.1126/science.1256758 15. W. Wang, R. van Boekel, N. Madhusudhan, G. Chen, G. Zhao, T. Henning, Ground-based detections of thermal emission from the dense hot Jupiter WASP-43b in the H and K s bands. Astrophys. J. 770, 70 (2013). doi:10.1088/0004-637X/770/1/70 16. G. Chen, R. van Boekel, H. Wang, N. Nikolov, J. J. Fortney, U. Seemann, W. Wang, L. Mancini, T. Henning, Broad-band transmission spectrum and Kband thermal emission of WASP-43b as observed from the ground. Astron. Astrophys. 563, A40 (2014). doi:10.1051/0004-6361/201322740 17. J. Blecic, J. Harrington, N. Madhusudhan, K. B. Stevenson, R. A. Hardy, P. E. Cubillos, M. Hardin, O. Bowman, S. Nymeyer, D. R. Anderson, C. Hellier, A. M. S. Smith, A. C. Cameron, SPITZER observations of the thermal emission from WASP-43b. Astrophys. J. 781, 116 (2014). doi:10.1088/0004637X/781/2/116 18. K. B. Stevenson, J. L. Bean, A. Seifahrt, J.-M. Désert, N. Madhusudhan, M. Bergmann, L. Kreidberg, D. Homeier, Transmission spectroscopy of the hot Jupiter WASP-12b from 0.7 TO 5 μm. Astron. J. 147, 161 (2014). doi:10.1088/0004-6256/147/6/161 19. Materials and methods are available as supplementary material on Science Online . 20. K. Mandel, E. Agol, Analytic light curves for planetary transit searches. Astrophys. J. 580, L171–L175 (2002). doi:10.1086/345520 21. L. Kreidberg, J. L. Bean, J. M. Désert, B. Benneke, D. Deming, K. B. Stevenson, S. Seager, Z. Berta-Thompson, A. Seifahrt, D. Homeier, Clouds in the atmosphere of the super-Earth exoplanet GJ 1214b. Nature 505, 69–72 (2014). Medline doi:10.1038/nature12888 22. M. R. Line, H. Knutson, A. S. Wolf, Y. L. Yung, A systematic retrieval analysis of secondary eclipse spectra. II. A uniform analysis of nine planets and their C to O Ratios. Astrophys. J. 783, 70 (2014). doi:10.1088/0004637X/783/2/70 23. V. Parmentier, G. Guillot, VizieR Online Data Catalog 356, 29133 (2013). 24. L. Kreidberg, J. L. Bean, J.-M. Désert, M. R. Line, J. J. Fortney, N. Madhusudhan, K. B. Stevenson, A. P. Showman, D. Charbonneau, P. R. McCullough, S. Seager, A. Burrows, G. W. Henry, M. Williamson, T. Kataria, D. Homeier, A precise water abundance measurement for the hot Jupiter WASP-43b. Astrophys. J. 793, L27 (2014). doi:10.1088/20418205/793/2/L27 25. D. Perez-Becker, A. P. Showman, Atmospheric heat redistribution on hot Jupiters. Astrophys. J. 776, 134 (2013). doi:10.1088/0004-637X/776/2/134 26. M. S. Marley, C. Gelino, D. Stephens, J. I. Lunine, R. Freedman, Reflected spectra and albedos of extrasolar giant planets. I. Clear and cloudy atmospheres. Astrophys. J. 513, 879–893 (1999). doi:10.1086/306881 27. A. Burrows, L. Ibgui, I. Hubeny, Optical albedo theory of strongly irradiated giant planets: The case of HD 209458b. Astrophys. J. 682, 1277–1282 (2008). doi:10.1086/589824 28. J. J. Fortney, K. Lodders, M. S. Marley, R. S. Freedman, A unified theory for the atmospheres of the hot and very hot Jupiters: Two classes of irradiated atmospheres. Astrophys. J. 678, 1419–1435 (2008). doi:10.1086/528370 29. N. B. Cowan, E. Agol, Inverting phase functions to map exoplanets. Astrophys. J. 678, L129–L132 (2008). doi:10.1086/588553 30. A. P. Showman, T. Guillot, Atmospheric circulation and tides of “51 Pegasus b-like” planets. Astron. Astrophys. 385, 166–180 (2002). doi:10.1051/00046361:20020101 31. C. S. Cooper, A. P. Showman, Dynamic meteorology at the photosphere of HD 209458b. Astrophys. J. 629, L45–L48 (2005). doi:10.1086/444354 32. A. P. Showman, J. J. Fortney, Y. Lian, M. S. Marley, R. S. Freedman, H. A. Knutson, D. Charbonneau, Atmospheric circulation of hot Jupiters: Coupled radiative-dynamical general circulation model simulations of HD 189733b and HD 209458b. Astrophys. J. 699, 564–584 (2009). doi:10.1088/0004637X/699/1/564 33. E. Buenzli, D. Apai, C. V. Morley, D. Flateau, A. P. Showman, A. Burrows, M. S. Marley, N. K. Lewis, I. N. Reid, Vertical atmospheric structure in a variable brown dwarf: Pressure-dependent phase shifts in simultaneous Hubble Space Telescope - Spitzer light curves. Astrophys. J. 760, L31 (2012). doi:10.1088/2041-8205/760/2/L31 34. A. Burrows, E. Rauscher, D. S. Spiegel, K. Menou, Photometric and spectral signatures of three-dimensional models of transiting giant exoplanets. Astrophys. J. 719, 341–350 (2010). doi:10.1088/0004-637X/719/1/341 Acknowledgments: This work is based on observations made with the NASA/ESA Hubble Space Telescope that were obtained at the Space Telescope Science Institute, which is operated by the Association of Universities for Research in Astronomy, Inc., under NASA contract NAS 526555. Data are available through the Mikulski Archive for Space Telescopes (MAST). We thank Alison Vick and Merle Reinhart of STScI for scheduling these observations, which are associated with program GO-13467. Support for this work was provided by NASA through a grant from the Space Telescope Science Institute, the Sagan Fellowship Program (to K.B.S.) as supported by NASA and administered by the NASA Exoplanet Science Institute (NExScI), the Alfred P. Sloan Foundation through a Sloan Research Fellowship (to J.L.B.), and the National Science Foundation through a Graduate Research Fellowship (to L.K.). G.W.H. and M.H.W. acknowledge long-term support from NASA, NSF, Tennessee State University, and the State of Tennessee through its Centers of Excellence program. S.S. acknowledges funding from the Massachusetts Institute of Technology. D.H. acknowledges support from the European Research Council under the European Community’s Seventh Framework Programme - FP7/2007-2013 Grant Agreement no. 247060. Supplementary Materials www.sciencemag.org/cgi/content/full/science.1256758/DC1 Materials and Methods Supplementary Text Tables S1 and S2 Figs. S1 to S8 Movie S1 30 May 2014; accepted 17 September 2014 Published online 9 October 2014 10.1126/science.1256758 / http://www.sciencemag.org/content/early/recent / 9 October 2014/ Page 3 / 10.1126/science.1256758 Fig. 1. Band-integrated phase curve of WASP-43b. The systematics-corrected flux values are binned in time, normalized to the stellar flux, and have 1σ error bars. Each color represents data acquired from a different HST visit. The phase curve depicts steadily increasing and decreasing observed flux which originates from different longitudes of the tidally-locked planet as it makes one complete rotation. Light from the planet is blocked near an orbital phase of 0.5 as it is eclipsed by its host star. The model phase curve maximum occurs 40 ± 3 min prior to the midpoint of secondary eclipse, which corresponds to a shift of 12.3 ± 1.0° East of the substellar point. The model phase curve minimum occurs 34 ± 5 min after the primary transit midpoint, or 10.6 ± 1.4° West of the anti-stellar point. As a result, maximum planetary emission occurs 0.436 ± 0.005 orbits after the observed minimum (for depths probed by these observations) and the shape of the phase curve is asymmetric. Inset, for comparison, is the white light curve primary transit. It is interesting to note that the observed flux values are consistently low for ∼ 30 min after transit egress. / http://www.sciencemag.org/content/early/recent / 9 October 2014/ Page 4 / 10.1126/science.1256758 Fig. 2. Phase-resolved emission spectrum of WASP-43b relative to the stellar flux. A, The histograms of the unbinned phase-curve residuals are separated horizontally by wavelength (colors, defined on the abscissa of panel C) for clarity. The residuals are Gaussian distributed with a zero mean and show no evidence of correlated noise. B, We show binned phase curves (colored points with 1σ error bars) and best-fit models (colored lines). The planet emission is normalized with respect to the stellar flux and separated horizontally by wavelength for clarity. The gray region depicts the time of secondary eclipse. C, We illustrate a subset of data points from panel B, except plotted as a function of wavelength and with best-fit atmospheric models (colored lines). White diamonds depict the models binned to the resolution of the data. For clarity, we only display planet-to-star flux ratios at four planet phases: full (0.5, secondary eclipse), wanning gibbous (0.62), half (0.75), and wanning crescent (0.88). In figs. S1 - S3, we provide full 1D and 2D representations of panels B and C. A time-lapse video of the planet’s phase-resolved emission spectrum is available in movie S1. / http://www.sciencemag.org/content/early/recent / 9 October 2014/ Page 5 / 10.1126/science.1256758 Fig. 3. Thermal profiles of WASP-43b at select orbital phases. Higher pressures indicate deeper within the planet’s atmosphere. Colored curves depict median values with 1σ uncertainty regions for the assumed parameterization of the retrieval. We illustrate the temperature asymmetry on the planet’s night side immediately before and after transit (orbital phase = 0.0625 and 0.9375), the similar thermal profiles on WASP-43b’s morning and evening terminators (0.25 and 0.75), and the dayside-averaged profile (0.5). The HST/WFC3 measurements probe the atmosphere primarily between 0.01 and 1.0 bar (horizontal dotted lines). The retrieved model profiles are 1D representations of the disk-integrated flux values at each phase. However, because the emitted flux values at these wavelengths are near the peak of 5 the Planck curve, the flux goes as T or more and the disk-integrated thermal profiles are heavily weighted toward the hotter dayside. As a result, there is no significant change in the modeled temperature structure over half of the orbital phases (0.25 → 0.75, when the substellar point is visible). We plot individual pressure-temperature profiles with 1σ uncertainty regions in fig. S4. A time-lapse video of WASP-43b’s phase-resolved thermal profile is available in movie S1. / http://www.sciencemag.org/content/early/recent / 9 October 2014/ Page 6 / 10.1126/science.1256758 Fig. 4. Longitudinally-resolved brightness temperature maps of WASP-43b in all fifteen spectrophotometric channels. Black regions in this Robinson projection indicate no discernible contribution. Numbers indicate the wavelength in μm. The observations constrain the brightness temperature at each longitude, but contain no latitudinal information (we 2 assign a cos weighting). In general, the change in temperature is relatively small over the planet’s dayside (-90° to +90°) and comparatively extreme near ±120°, thus indicating that we detect emission over the planet’s entire dayside. Since WASP-43b does not contain a thermal inversion at these pressures, the hotter regions at a given longitude sample deeper within the atmosphere. The presence of water vapor in the planet’s atmosphere explains the relatively cool brightness temperature from 1.35 - 1.6 μm. Outside of the water feature, the brightness temperature peak (indicated in white) is predominantly eastward (toward positive longitudes) of the substellar point. This correlation is readily seen in fig. S8 and matches the predictions of three-dimensional circulation models. Fig. S6 displays one dimensional brightness temperatures with uncertainty regions. / http://www.sciencemag.org/content/early/recent / 9 October 2014/ Page 7 / 10.1126/science.1256758


© Copyright 2026