
For personal use only STREAMLINE. OPTIMISE.
For personal use only STREAMLINE. OPTIMISE. GROW. SIMS METAL MANAGEMENT LIMITED ANNUAL REPORT 2014 F I N A N C I A L H I G H L I G H T S .. . . . . . . . . . . . . . . . . . . . . . . . . . . . . . . . . . . . . . . 2 C H A I R M A N ’ S R E V I E W .. . . . . . . . . . . . . . . . . . . . . . . . . . . . . . . . . . . . . . . . . . . 4 CEO ’S RE V IEW....................................................... 6 O P E R AT I O N A L & F I N A N C I A L R E V I E W .. . . . . . . . . . . . . . . . . . 8 G L O B A L O P E R AT I O N S .. . . . . . . . . . . . . . . . . . . . . . . . . . . . . . . . . . 8 F I V E Y E A R S T R AT E G I C P L A N . . . . . . . . . . . . . . . . . . . . . . 1 0 NOR T H A MERICA............................................ 1 8 For personal use only AUSTR AL ASIA................................................ 20 EUROPE........................................................... 22 S U S TA I N A B I L I T Y . . . . . . . . . . . . . . . . . . . . . . . . . . . . . . . . . . . . . . . . . . . . 2 4 FIN A NCI A L RE V IE W........................................ 28 C O R P O R AT E G O V E R N A N C E S TAT E M E N T . . . . . . . . . . . 3 1 DIREC T ORS ’ REP OR T.......................................... 4 3 BOARD OF DIRECTORS............................... 46 R E M U N E R AT I O N R E P O R T . . . . . . . . . . . . . . . . . . . . . . . . . . . . . . . 4 8 F I N A N C I A L S TAT E M E N T S . . . . . . . . . . . . . . . . . . . . . . . . . . . . . . . . . . . . 7 5 D I R E C T O R S ’ D E C L A R AT I O N.. . . . . . . . . . . . . . . . . . . . . . . . 1 3 9 I N D E P E N D E N T A U D I T O R ’ S R E P O R T.. . . . . . . . . . . . . . 1 4 0 A U D I T O R ’ S I N D E P E N D E N C E D E C L A R AT I O N.. 1 4 1 O T H E R I N F O R M AT I O N . . . . . . . . . . . . . . . . . . . . . . . . . . . . . . . . . . . . . . . . 1 4 2 ANNUAL FINANCIAL REPORT E X TR ACTS... 142 S H A R E H O L D E R I N F O R M AT I O N . . . . . . . . . . . . . . . . . . . . 1 4 6 F I V E Y E A R T R E N D S U M M A R Y .. . . . . . . . . . . . . . . . . . . . . 1 4 7 C O R P O R AT E D I R E C T O R Y . . . . . . . . . . . . . . . . . . . . . . . . . . . . . 1 4 8 Chairman & CEO’s Reviews 2 Operational & Financial Review 3 Corporate Governance 4 Directors’ Report ALIGNed TO DELIVER 5 Sims Metal Management is the world’s largest listed metal and electronics recycler with over 250 facilities and 6,000 employees globally. Our mission is to be the best in class recycler in all markets we operate. Our industry leadership will be driven by the strengths of our partnership with our suppliers, the excellence of our products and services to our customers, and the attractiveness of our returns to shareholders. Financial Statements For personal use only Sims Metal Management Annual Report 2014 1 6 Other Information 1 For personal use only Financial Highlights $242m $119m $69m UP 27% from FY13 UNDERLYING EBITDA 1 $42m UP from FY13 NET CASH UP 333% from FY13 UNDERLYING EBIT 1 UNDERLYING NPAT 1 33.6¢ 10.0¢ UP 336% from FY13 UP from FY13 UNDERLYING EPS 1 (Diluted) YEAR ENDED 30 JUNE (A$m) Sales Revenue EBITDA Underlying EBITDA 1 Goodwill & Intangible Asset Impairment Depreciation Amortisation EBIT Underlying EBIT1 Net Interest Expense Tax (Expense)/Benefit NPAT Underlying NPAT1 EPS (cents per share) – Diluted Underlying EPS (cents per share) – Diluted1 Full Fiscal Year Dividend (cents per share) Total Assets Total Liabilities Net Assets Net Cash/(Debt) Net Debt/(Net Debt + Equity) (%) Net Tangible Assets Net Tangible Assets per share (A$ per share) Net Cash Inflow From Operating Activities Capital Expenditures Net Cash Outflow From Investing Activities Net Cash Inflow From Operating & Investing Activities Employees Intake Tonnes (‘000) Sales Tonnes (‘000) 1 FINAL DIVIDEND FY 2014 7,129.0 124.8 242.4 (28.5) (105.6) (18.3) (27.6) 118.5 (14.2) (47.1) (88.9) 68.8 (43.5) 33.6 10.0 2,649.4 815.5 1,833.9 42.3 NMF 1,618.1 7.91 210.1 64.1 (0.9) 209.2 6,011 11,783 11,815 Underlying excludes goodwill and other intangible asset impairments, and all other significant items. NMF = Not meaningful percentage change 2 UP 77% from FY13 FY 2013 Restated Change (%) 7,193.0 (42.5) 190.4 (304.4) (101.1) (22.4) (470.4) 66.9 (18.2) 21.3 (467.3) 15.9 (228.6) 7.7 0.0 2,917.4 988.2 1,929.2 (153.8) 7.4% 1,665.3 8.15 297.3 149.0 (118.8) 178.5 6,393 12,453 12,786 (0.9) NMF 27.3 (90.6) 4.5 (18.3) (94.1) 77.1 (22.0) NMF (81.0) 332.7 (81.0) 336.4 NMF (9.2) (17.5) (4.9) NMF NMF (2.8) (2.9) (29.3) (57.0) (99.2) 17.2 (6.0) (5.4) (7.6) 283 208 352 119 FY14 FY13 FY12 FY11 FY10 FY09 FY14 FY13 FY12 FY11 FY10 FY09 182 56 910 1,652 3,321 40 74 126 1,362 69 FY11 FY12 67 88 190 124 242 253 259 7,129 FY14 414 9,036 7,193 FY13 8,847 8,636 7,453 FY10 FY09 SALES REVENUE BY REGION (A$m) SALES REVENUE BY PRODUCT (A$m) nNORTH AMERICA nAUSTRALASIA nEUROPE n FERROUS TRADING n FERROUS BROKERAGE nNON-FERROUS SHRED RECOVERY nNON-FERROUS TRADING/BROKERAGE n RECYCLING SOLUTIONS nMANUFACTURING/OTHER FY13 16 FY14 FY12 1,127 FY11 4,253 FY10 353 1,224 FY09 For personal use only Sims Metal Management Annual Report 2014 EBIT1 (A$m) EBITDA1 (A$m) SALES REVENUE (A$m) NET PROFIT AFTER TAX1 (A$m) 1Underlying excludes goodwill and other intangible asset impairments, and all other significant items. 3 For personal use only Chairman’s Review Dear Shareholders, The 2014 financial year has seen significant change for Sims Metal Management. In October 2013 we announced the appointment of Galdino Claro as Group CEO & Managing Director. Galdino brings with him 30 years of global experience in the metals industry and a history of success in reinvigorating underperforming businesses, as well as entering new markets. Galdino has moved quickly to bring fresh perspectives, providing our most experienced executives with new management challenges, as well as appointing a number of new executives to the Company’s leadership team. F ive year strategic plan geoffrey n brunsdon In July 2014, following approval by the Board of Directors, Galdino and a number of members of his leadership team presented the Company’s five year strategic plan. Based on a three stage model of Streamline, Optimise, and Grow, the strategic plan is a roadmap to increase underlying Company earnings before interest and tax (EBIT) by more than 350% over FY13. Importantly, this strategy is based only on factors within the control of management, and does not rely on improving external conditions or acquisitions to be achieved. This is in line with the Board’s view that, even at the bottom of the economic cycle, the Company must achieve a return equal to its cost of capital. The culture of the Company is changing from one of a material handler captive to commodity flows and business cycles, to one of a customer centric, supply chain manager with constant attention to margin enhancement. Sims Metal Management has extraordinary potential. The Company has unrivalled global reach, with operations on five continents, trading relationships with customers on six continents, and an extraordinary depth of industry experience, all of which will be fully exploited through this strategy. F inancial results In FY14, underlying EBIT of $119 million increased 77% over the prior year result of $67 million. Underlying net profit after tax (NPAT) of $69 million was 333% higher than the prior year. Despite the improved result, difficult external market conditions continued to impede the business’s recovery. Cyclically low levels of secondary metal generation, intense competition, and severe winter weather conditions in North America posed challenges to the Company’s operations. After recognising $158 million of significant items, the Company reported a statutory net loss after tax of $89 million. At current levels, return on invested capital remains less than satisfactory, and will continue to be an area of attention in the year ahead. C apital management and dividend Protecting the Company’s strong balance sheet position is a key priority of the Board. During FY14, capital expenditures were $64 million, down from $149 million in the prior year as major projects, including the New England expansion and New York City Municipal Recycling contract, reached completion. Disciplined capital management and robust cash flow from operations allowed the Company to reduce net debt by $196 million in FY14 to a net cash position of $42 million at 30 June 2014. Capital expenditure will, however, increase as new projects are initiated in line with our strategic plan. The Board has determined to pay a final dividend for FY14 of 10.0 cents per share, which will be fully franked, on 21 October 2014 to shareholders on the Company’s register at the record date of 7 October 2014. Pleasingly, the final dividend of FY14 represents the Company’s first payout since the end of FY12. The Company’s dividend policy to distribute 45% to 55% of NPAT, subject to the discretion of the Board, remains unchanged. 4 1 Chairman & CEO’s Reviews For personal use only Sims Metal Management Annual Report 2014 B oard renewal The Board is committed to renewal within its membership in order to retain independence and to promote the increasingly diverse set of skills required at the non-executive director level. At the conclusion of this year’s Annual General Meeting, Gerry Morris and Norm Bobins will each retire. Both directors made significant contributions to the evolution of the Company following the merger of Sims Group and Metal Management in 2008. Following the merger, Gerry chaired the Risk, Audit & Compliance Committee, and Norm chaired the Finance & Investment Committee and subsequently the Nomination/ Governance Committee. I wish to record the deep appreciation to both of them for their tireless efforts through a very challenging period, and acknowledge the legacy they leave. I am sure you will join with me in wishing them well as they retire from this Board. I was delighted to recently announce the appointment of Deborah O’Toole and Georgia Nelson as directors of the Company effective 1 November 2014. Both Deborah and Georgia are extremely well credentialed and bring to the Board world class experience across a range of industries. I am sure both Deborah and Georgia will each make a significant contribution to the work of the Board over the coming years, and I welcome the opportunity for shareholders to hear from each of them at the AGM and to vote on their election. E mployees It is appropriate that the Board acknowledge the efforts of our employees through a period of change and significant uncertainty. Your efforts through this period ensured that we were able to deal with the challenges that the external environment presented and emerge a stronger company. Your excitement as you now execute our five year strategic plan is evident, which further serves to reinforce the confidence the Board has that this plan will deliver significantly improved returns. We must never forget however the most essential component of our strategy, and all of our actions, is to provide a safe work environment for our employees, as we continue to strive to create a zero harm workplace. O utloo k Under the direction of a rejuvenated executive leadership team, and the establishment of the five year strategic plan, both the Board and management are confident in the future prospects of the Company. In the year ahead, the initial gains from recent Streamline actions, including those recently announced within the electronics recycling (SRS) and North America metals recycling businesses, are expected to be achieved. As well, further margin improvement is anticipated, as strategic Optimise phase initiatives are embedded across the Company’s global footprint. On behalf of myself and my fellow directors, I would like to thank you for your continued support as shareholders in the Company and invite you to attend our AGM, this year at the Westin Hotel Sydney, on Thursday November 13. geoffrey n brunsdon CHAIRMAN 5 For personal use only CEO’s review Dear Shareholders, Since joining Sims Metal Management in November 2013, I’ve spent much of my time travelling around our global operations. I’ve met with our employees, our suppliers, as well as our customers. In that time I discovered a Company with significant differences in operational profitability and approaches to doing business. I also found a global business, built on a long history of acquisitions, but where the full synergies had not yet been fully realised. More than anything else, however, I found opportunities. Opportunities to build on a solid foundation of successful and sustainable operations run by the best people in the industry; the opportunity to use our scale, our unmatched global trading relationships, and our depth of industry experience, to generate returns superior to our competitors. A strategy to S treamline , O ptimise , and G row Galdino J Claro In July 2014 we presented the details of a five year strategic plan to significantly improve the financial returns of the Company. The strategic plan is expected to improve underlying EBIT by more than 350% over FY13, built on internal initiatives alone, and without a reliance on cyclical market recovery or major acquisitions. The plan is based on three phases; which will first Streamline the business back to lower cost and higher margin operations, then secondly Optimise these businesses based on our core drivers of profitability, and finally Grow the total business through reinvestment into the Group’s most attractive operations. Our actions to streamline the business resulted in the recent decision to exit our underperforming operations in UK SRS and SRS Canada. Additionally, we have implemented plans to significantly reduce regional and corporate overhead costs through consolidating the North America metals recycling business into three operating regions. These actions are expected to improve EBIT by $32 million per annum, which we anticipate will be fully realised by FY16. Our optimisation strategies center on maximising our core drivers of profitability, through reducing inefficiencies across the entire value chain, from supplier relationships, logistics, processing, to end product quality and services. To achieve this, we are implementing new business information reporting, and improving the sharing of knowledge and skills across our global operations to make better use of our unparalleled scale and footprint. We anticipate optimisation of the business will improve EBIT by a further $130 million per annum by the end of the five year plan. We will also return to growth through reinvesting in our most attractive and highest returning businesses. By strengthening our relationships with key suppliers and the strategic expansion of our feeder yard network, we intend to grow total sales volumes by 10% over the five year plan. Any benefit we may receive from a broader economic recovery will be in addition to these gains. As well, in our electronics recycling business we intend to return to growth by expanding our asset management and services offerings and leveraging our global footprint with multi-national corporates. We expect these growth initiatives to deliver a further $40 million per annum in EBIT by the end of the five year plan. Lastly, and most critically, we will achieve this without losing any of our attention to the safety of our employees. FY14 was an encouraging year with a 25% reduction in lost time incidents. We will press harder to improve on these gains in the year ahead, as we progress towards our goal of a zero harm workplace. 6 Largely due to actions taken to streamline the business, total significant items were $158 million after tax in FY14. These included $100 million in restructuring costs related to the exit from the loss making SRS businesses in the UK and Canada, as well as the exit from several non‑core and underperforming metals recycling operations in North America. In addition, $23 million in goodwill impairments were recorded in relation to SRS in North America. 1 Chairman & CEO’s Reviews For personal use only Sims Metal Management Annual Report 2014 R estructuring impairments As difficult to make as these decisions were, we believe the Company is now much better positioned. Our remaining portfolio of businesses is anticipated to achieve higher margins with greater competitive advantages. Additionally, following the restructure of the SRS businesses, we anticipate no significant further restructuring charges post FY14. M anagement team There were a number of changes made amongst my executive leadership team in the past year as we realigned the business to best deliver our strategic plan. We consolidated our North America Metals business into three operating regions, East, West, and Central. Joe Payesko was appointed as President of the East region and Steve Shinn was appointed President of the West region. Both are exceptional executives, each with over 20 years’ experience in the industry. Bob Kelman, formerly the President of the North America Metals business, was appointed to lead our European Metals business. Bob was the architect of our successful East region, and will now take responsibility for the development of the European business. In September 2014 we announced the appointment of Fred Knechtel as Group CFO. Fred brings over 30 years of financial and business management experience to the Company, including senior-level roles across a number of industries. We are very excited to have him join our executive team. Fred replaces Rob Larry, who in June 2014 announced he would step down from the position of Group CFO. I would like to thank Rob and we wish him the very best for the future. O utloo k In the year ahead, we intend to intensify the pace of the implementation of the five year strategic plan. A Project Management Office has been put in place to ensure the disciplined execution of the strategy across the global businesses. While we maintain the conservative view that external markets will remain constrained in the near-term, we expect further earnings benefits to be realised from our streamline and optimise phases as they are delivered in FY15. On behalf of myself, and my executive leadership team, I thank you for your valuable support as shareholders in the Company. Galdino J Claro GROUP CEO 7 OP ER AT ION A L & FIN A NCI A L RE V IE W For personal use only Global Operations 11.8 MILLION TONNES OF METAL RECYCLED IN FY14 600 THOUSAND TONNES OF ELECTRONICS RECYCLED IN FY14 13.5 MILLION Mwh of energy saved through secondary metals recycling 12.8 MILLION Tonnes of C02 emissions avoided through secondary metals recycling 8 6,000 EMPLOYEES GLOBALLY 2 Operational & Financial Review For personal use only FACILITIES GLOBALLY Sims Metal Management Annual Report 2014 250 20 COUNTRIES OF OPERATION 68 EXPORT AND DOMESTIC COUNTRIES SERVED 9 OP ER AT ION A L & FIN A NCI A L RE V IE W For personal use only Five-Year Strategic Plan 10 The five-year strategic plan is expected to improve underlying EBIT by more than 350% over FY13, based on internal initiatives alone. The plan is based on three phases which will first Streamline the business back to lower cost and higher margin operations, then secondly Optimise the business based on the core drivers of profitability, and finally Grow the total business through reinvestment into the Group’s most attractive operations. Streamline Optimise Exit from non-strategic businesses and further overhead cost reductions. 1-2 years 3-4 years Grow Maximising the core Expanding metals drivers of profitability: recycling volumes through organic market share • Supplier Relationships improvement and selective • Logistics acquisitions. Returning • Operational Excellence to growth in electronics • Product Quality recycling through & Service asset management and corporate services offerings. 5 years $321m $67m $119m For personal use only Operational & Financial Review EBIT GROWTH IN FY14 Sims Metal Management Annual Report 2014 +77% FY13 UNDERLYING EBIT 2 MANAGEMENT IMPROVEMENT INITIATIVES STREAMLINE FY14 UNDERLYING EBIT STREAMLINE OPTIMISE SUPPLIER RELATIONSHIPS & LOGISTICS OPERATIONAL EXCELLENCE GROW PRODUCT QUALITY & SERVICE GROW TARGET EBIT MORE THAN 350% EBIT GROWTH TARGET OVER 5 YEARS 11 For personal use only 12 01 We are streamlining the business to focus on our highest margin operations. 2 Operational & Financial Review For personal use only Sims Metal Management Annual Report 2014 We are exiting from non-strategic businesses and reducing cost overheads to allow management to focus on better performing and higher growth potential operations. $32 million in annual EBIT benefits expected to be delivered through streamlining, with 50% to be realised in FY15 and 100% by FY16. $11 million of EBIT benefits in North America metals recycling through the reduction of regional overhead and divestment of noncore facilities. $20 million of EBIT benefits across global SRS electronics recycling, through the exit of underperforming operations and the consolidation of facilities. $1 million of EBIT benefits through the reduction in corporate overheads. 13 For personal use only 14 02 We are optimising our core drivers of profitability. Strengthen supplier relationships and ensure the right material is bought for the right price. 2 Operational & Financial Review For personal use only Sims Metal Management Annual Report 2014 Supplier Relationships Logistics $130 million Minimise freight and handling costs, and leverage export capabilities. in further EBIT benefits expected from optimisation strategies, in addition to $50m achieved in FY14. Operational Excellence Share best practices across global operations to increase processing yields and drive continuous improvement. Product Quality & Service Develop new value added products and services and lead on product quality. 15 For personal use only 03 We are returning to growth through investment in our highest margin businesses. 2 Operational & Financial Review For personal use only Sims Metal Management Annual Report 2014 We are growing our metals recycling volumes through organic market share and selective acquisitions, while returning to growth in electronics recycling through asset management and services. $40 million increase in EBIT expected through internal growth initiatives. Metals recycling sales volumes expected to grow 10% through internal initiatives alone. Growing electronic recycling revenues through asset management, new services, and emerging markets. 17 OP ER AT ION A L & FIN A NCI A L RE V IE W For personal use only North America 252 Sales revenue for the North America region of $4,253 million was down 6% on FY13. In constant exchange rate terms, sales revenue was down 16%. The decrease was due to lower sales volumes, in part due to severe winter weather in the US, the disposal of certain non-core businesses, and lower non-ferrous and precious metal prices. 4,001 SALES REVENUE (A$m) n METALS RECYCLING n SRS (E-RECYCLING) 18 PERFORMANCE Underlying EBITDA of $83 million was down 19% on FY13, primarily due to weaker earnings from both metals recycling and SRS. Correspondingly, underlying EBITDA margins fell to 1.9% from 2.2% in FY13. Lower underlying EBITDA from North America Metals was due largely to lower sales volumes and continued difficult market conditions which constrained the ability to procure intake material. Weaker underlying EBITDA from North America SRS was driven in large part by losses within SRS Canada. At constant currency, underlying controllable costs were $48 million lower, down 8% during FY14 compared to FY13. A portion of these cost reductions was a result of disposals of non-core businesses. These cost savings are expected to be sustainable until intake volumes change materially. A$m Revenue Underlying EBITDA 1 Underlying EBIT1 Sales Tonnes (millions) Underlying EBITDA margin 1 FY14 4,253.5 82.9 12.7 8.152 1.9% FY13 4,534.6 102.1 34.0 9.377 2.2% Change (%) (6.2) (18.8) (62.6) (13.1) Underlying excludes goodwill and intangible asset impairments and all other significant items. 2 strategic progress During FY14 the Company continued actions to streamline and develop the North American operational footprint. In July 2013, the Company announced the sale of its US-based Aerospace Metals business, a non-core business specialising in the recycling of titanium alloys and high temperature metals. Further rationalisation measures included the sale of metal recycling assets in Utah and Birmingham, Alabama as well as the idling of the underperforming Mobile, Alabama‑based operations. Operational & Financial Review For personal use only Sims Metal Management Annual Report 2014 RESULTS AT A GLANCE Additionally, in June 2014, restructuring initiatives were announced which determined the electronics recycling business of SRS Canada to be outside of the Group’s long term strategic interests. Further to the exit from SRS Canada, the operations of smaller US SRS facilities in Edison, New Jersey and Dallas, Texas were consolidated with other sites during FY14 in order to lower fixed costs and increase throughput rates across the remaining facilities. These decisions have benefited the Company by creating a more efficient operating structure, reducing controllable costs, and allowing management to focus on better performing and higher growth potential operations. Proceeds from these asset sales are being invested in projects anticipated to have higher returns. This includes the development of a New England metals recycling footprint, with a greenfield yard, shredder and export facility in Rhode Island, and stage one of the NYC Municipal Recycling project, both of which were completed during the first half of FY14. OUTLOOK The majority of key leading indicators for secondary metal generation continued to improve during FY14. Consumer confidence, new vehicle sales, and major appliance shipments all improved meaningfully over the prior year. Despite these encouraging signals, and hampered by abnormally severe winter weather and a decline in commodity prices, North American metals recycling business conditions remained difficult during the past 12 months. The Company is resolved to improve earnings through factors within its own control. As part of its five year strategic plan announced near the end of FY14, the Company delivered further streamline actions which will positively impact the North America businesses. These include consolidating North America metals recycling from seven operating regions to three, and reducing overhead costs at the regional level. These actions are expected to deliver annual EBIT benefits of $11 million, with anticipations that 50% of the target will be achieved in FY15 and the full 100% in FY16. ABOVE sacramento, ca – metals recycling MIDDLE jersey city, nj – metals recycling BELOW brooklyn, ny – municipal recycling 19 OP ER AT ION A L & FIN A NCI A L RE V IE W For personal use only Australasia 32 3 PERFORMANCE Sales revenue for the Australasia region of $1,224 million was up 13% on FY13. In constant exchange rate terms, sales revenue was up 12%. The increase was due primarily to a 16% lift in sales volumes driven by Australia Metals, which was partially offset by a decrease in non-ferrous metal prices. 1,189 SALES REVENUE (A$m) n METALS RECYCLING n SRS (E-RECYCLING) nMANUFACTURING/OTHER 20 Underlying EBITDA of $114 million was up 46% compared to FY13, primarily due to strong performance from Australia Metals, as well as higher income from Australasia SRS and joint ventures. Both sales margins and sales volumes increased compared to FY13 leading to significant earnings improvement. Earnings from Australia Metals also benefited positively from refinements made to the business in recent years. These included the acquisition of the Paramount Browns ferrous metal yard in South Australia, a capital upgrade of the St. Mary’s yard in New South Wales, and the installation of a downstream non-ferrous extraction facility in Victoria. At constant currency, underlying controllable costs were $40 million higher, up 19% in FY14 compared to FY13. The increase largely relates to the significant increase in business activity which occurred in the Australia Metals business. A$m Revenue Underlying EBITDA 1 Underlying EBIT1 Sales Tonnes (millions) Underlying EBITDA margin 1 FY14 1,223.9 114.1 85.5 2.054 9.3% FY13 1,083.1 78.1 52.1 1.764 7.2% Change (%) 13.0 46.1 64.1 16.4 Underlying excludes goodwill and intangible asset impairments and all other significant items. 2 S T R AT E G I C P R O G R E S S The Company continued to reinvest in businesses across the Australian region during FY14. Most notably, this included the commencement of development on a new shredding facility in Western Australia for the metals recycling business, but also included further growth in the small, but expanding SRS business in the emerging markets of South Africa, Dubai and India. Operational & Financial Review For personal use only Sims Metal Management Annual Report 2014 RESULTS AT A GLANCE The new operation in Kwinana, Western Australia will represent the final stage of our shredder replacement placement program and off-line downstream non-ferrous recovery plant installations in Australia. Upon completion, all operations will have expanded processing capacity with the most up-to-date metals recovery technology available. Kwinana itself will be the Company’s largest operation in Australia, and will replace the current footprintconstrained operations running outdated equipment. The Company expects the Kwinana shredder to be operational late in the second half of FY15. OUTLOOK The outlook for economic activity in Australia appears to be diminishing after a decade of consistent growth driven by strong demand for raw materials and rising commodity prices. Declining investment in the mining sector, coupled with weak manufacturing activity, caused unemployment levels to reach a 12 year high in July 2014. Consequently, consumer confidence, a key leading indicator for consumer secondary metal generation, has begun to retreat. Within this challenging environment, several metal recycling competitors have either left markets or scaled back operations. These developments have created opportunities for the Company to better service suppliers in several markets, as well as investing in the new shredding operation in Western Australia. In order to spur growth, the Reserve Bank of Australia has held interest rates at a historic low of 2.50%. As a result, the Australian dollar has weakened materially against the US dollar and other major currencies. While low interest rates and a lower Australian dollar should assist in stimulating greater economic activity and improve the attractiveness of exports, significant tangible benefits to the Australian economy have not yet been seen. In line with the Company’s five year strategic plan to generate stronger earnings and margins, the Australian business remains focused on the actions within its control. Optimising the business based on the core drivers of profitability will remain a priority for FY15. ABOVE New zealand – metals recycling MIDDLE St Marys, NSW – Metals recycling BELOW hampton park, VIC – lms energy 21 OP ER AT ION A L & FIN A NCI A L RE V IE W For personal use only Europe Sales revenue for the Europe region of $1,652 million was up 5% on FY13. In constant exchange rate terms, sales revenue was down 10%. The decrease was primarily due to lower sales from Europe SRS, which was impacted by lower precious metals prices and the restructuring of the SRS business in the UK. In constant exchange rate terms, sales revenue for metals recycling was down a lesser 1.8% due to lower sales volumes. 1,069 SALES REVENUE (A$m) n METALS RECYCLING n SRS (E-RECYCLING) 22 PERFORMANCE 583 Underlying EBITDA of $45 million was up 345% on FY13, due to improved performance from UK Metals and Germany SRS, partially offset by lower performance from UK SRS. Performance from UK SRS was negatively impacted by external margin pressure, lower commodity prices, and lower volumes, leading to an underlying EBITDA loss. Stronger underlying EBITDA from UK Metals was a result of higher sales margins and the cost reduction program which began in the second half of FY13. Despite restructuring activities during FY13 which included the idling of two of UK Metals’ five metal shredders, at Newport and Yately, sales volumes remained relatively steady. Weaker underlying EBITDA from Europe SRS was driven in a large part by losses within UK SRS. At constant currency, underlying controllable costs were $44 million lower, down 16% in FY14 compared to FY13. A$m Revenue Underlying EBITDA 1 Underlying EBIT1 Sales Tonnes (millions) Underlying EBITDA margin 1 FY14 1,651.6 45.4 20.3 1.609 2.7% FY13 1,575.3 10.2 (19.2) 1.645 0.6% Change (%) 4.8 345.1 205.7 (2.2) – Underlying excludes goodwill and intangible asset impairments and all other significant items. S T R AT E G I C P R O G R E S S In June 2014, the Group announced restructuring initiatives which determined a substantial portion of UK SRS to be outside the Group’s long-term strategic interests. These loss-making businesses operated under hypercompetitive conditions where competitive advantages could not be gained or past technology investments could not be successfully commercialised. The Group’s UK Metals operations, fridge recycling and IT asset management solutions were not impacted by the restructuring activities. Post the restructuring actions, the remaining metals recycling and SRS businesses in Europe remain profitable and are in supportive legislative environments. 2 Operational & Financial Review For personal use only Sims Metal Management Annual Report 2014 RESULTS AT A GLANCE OUTLOOK Economic conditions in the European region have shown signs of improvement, with particular strength noted in the UK. Consumer confidence in the UK lifted materially in FY14, reaching a nine year high in June, while GDP growth in the June quarter of 3.1% was above the pre-GFC peak. Encouragingly for the UK Metals business, the 2013 UK new car market had its best year since 2007 with 2.3 million cars registered, an 11% increase over the prior year. More broadly considered though, Europe continues to exhibit slow and unbalanced growth which is exacerbated by high levels of debt. Unemployment remains problematic and there is an absence of inflation. As well, political instability evidenced by military conflict in the Ukraine and the Middle East has added uncertainty to the economic conditions in the Group’s markets. These characteristics demonstrate the challenging environment our businesses face in Europe. During FY15, the initial benefits related to the Streamline portion of the five year strategic plan are expected to be realised. Of this, $20 million in annual EBIT benefits are expected to be gained across the Global SRS business due to footprint rationalisation and cost reductions, with 50% to be achieved in FY15 and the full 100% in FY16. The majority of these benefits are associated with the exit from loss making operations in UK SRS. ABOVE NEWPORT, UK – METALS RECYCLING MIDDLE HARTLEPOOL, UK – METALS RECYCLING BELOW DUMFRIES, UK – ELECTRONICS RECYCLING 23 O PPEERR AA T ITO INOAN L A& LF I&N AFNI CNI A LN R O C EI VA ILE WR E V I E W For personal use only Sustainability key parameters / Region HIGHLIGHTS ENVIRONMENT Energy use and CO2 emissions reduced by 6% and 4% respectively over the prior year. The 11.8 million tonnes of material recycled by the Company in FY14 saved 13.5 million Mwh of energy and 12.8 million tonnes of CO2 by replacing virgin materials. That is equivalent to the energy used by 7.3 million average homes, the carbon footprint of around 700,000 people living in Australia or the USA, or the carbon mitigated by the planting of 12.8 million trees over a 100 year lifespan H E A LT H A N D S A F E T Y Lost time injury and medically treated injury frequency rates declined by 25% and 13% respectively through a focus on pre-emptive awareness training PEOPLE AND DIVERSIT Y The percentage of females employed in middle, senior and executive management increased to 20% COMMUNIT Y As one of the world’s leading metals and electronics recycler, we take a proactive approach to working with governments, industry, educational facilities and environmental advocacy groups on matters of sustainability and resource efficiency FY14 FY13 change% Trend Energy Use (GJ) North America 1,453,531 1,597,189 Europe 439,702 520,407 Australasia 594,666 520,538 Group Total 2,487,899 2,638,134 CO2 Emissions (tCO2e) North America 129,310 142,162 Europe 40,595 48,307 Australasia 73,116 63,188 Group Total 243,021 253,657 Scope 1 106,935 111,131 Scope 2 136,086 142,526 Water Consumption (Mega Litres) North America 400.9 527.8 Europe 238.3 141.6 Australasia 94.2 82.5 Group Total 733.4 751.9 Waste Generation (Tonnes) North America 746,587 757,593 Europe 373,905 368,760 Australasia 285,196 251,090 Group Total 1,405,688 1,377,443 Key OH&S Indicators Group LTIFR (LTIx1,000,000/exposed hours) 2.7 3.6 Group MTIFR (MTIx1,000,000/exposed hours) 11.0 12.7 Number of employees Male 4,903 5,243 Female 1,108 1,150 Group Total 6,011 6,393 Training Group Total Hours (Corporate training only) 150,850 277,142 -9 -16 14 -6 i -9 -16 16 -4 -4 -5 i -24 68 14 -2 i (1) 1 14 2 i -25 -13 i -6 -4 -6 i -46 i i h i i h i i i h h i h h h i i i E nvironment E N E R G Y, F U E L A N D E L E C T R I C I T Y Total energy use for the Group in FY14 was 2,487,899 GJ, a decrease of 6% from FY13. This trend was the result of energy efficiency measures as well as reduced production in our North American operations. Diesel usage remained the highest energy component at 53%, followed by electricity at 36%, gas at 8%, LPG at 2%, and petrol at 1%. North America: Solar arrays at the Brooklyn and Claremont facilities were completed and commissioned, generating more than 500Mwh and 200Mwh respectively since start-up. The region also continued with its mobile equipment upgrade to tier 4 diesel engines. At the SRS plant in Roseville, upgrading the shredder line has introduced significant energy savings along with the upgrading of lighting at SRS West Chicago, which will provide estimated energy savings of more than 360,000Kwh per year. Europe: The “Energy Forum”, comprising all major operational stakeholders, was established and tasked with identifying opportunities for continued and sustainable reductions in energy consumption. The “Switch Off” campaign was launched to further assist in the reduction of unnecessary energy consumed in lighting, heating and other areas. A comprehensive survey of equipment run-down times and idling was conducted to eliminate non‑beneficial running of equipment. 24 Australasia: During the year, the remaining secondary aluminium smelter at Laverton, Victoria was closed, with significant reductions in gas and associated energy consumption. CARBON EMISSIONS PROFILE The energy consumed by the Company gives rise to carbon emissions, either directly from fuel consumed by its equipment, or indirectly from externally provided power. The Company’s approach to managing energy and carbon emissions is detailed in its Corporate Environmental and Energy Policies (available at simsmm.com), and executed by dedicated regional energy teams, ensuring integration into daily operational considerations and activities. As a participant in the Carbon Disclosure Project (CDP) since 2006, the Company is committed to detailed public reporting of its carbon emissions. 902,258 1,329,261 1,377,443 1,405,688 GROUP ENERGY USE BY TYPE (GJ) nDIESEL 53% nELECTRICITY 36% n GAS 8% nLPG 2% nPETROL 1% TOTAL 251,090 285,196 AUSTRALASIA 368,760 373,905 EUROPE While carbon policy remains the subject of considerable debate in Australia, the Company is not likely to be captured under any immediate policy arrangements, or in the US and Continental Europe. The Company is subject to the CRC Energy Efficiency Scheme in the UK, with the current cost being fixed by the Government at £12/tonne of CO2 emitted. This is forecast to rise next year to £15.60/ tonne of CO2e. The intended UK policy goal is to move to a free market trading scheme after that, at which point the Company will need to engage in carbon off-set trading. 2 GREEN ENERGY The Company has a 50% interest in renewable energy company LMS Energy Pty Ltd, which achieved continued excellent performance in FY14. LMS generated in excess of 369,000 megawatt hours of renewable energy, resulting in the creation of over 369,000 Large-Scale Generation Certificates (LGCs) under the Large-Scale Renewable Energy Target (LRET). LMS Energy’s power generation projects now comprise a total installed capacity in excess of 50 megawatts and its operational activities during FY14 resulted in an estimated carbon abatement of 2,200,000 tonnes of CO2. W AT E R U S E The Company is not a large consumer of water compared to industrial peers. Where water is used for operational purposes, it is recycled extensively and used alongside grey water and harvested rainfall. Group water consumption was 733Ml, down by 2% over FY13. Regionally, water consumption rose in Europe as a result of increased water use in shredders and the new materials recovery facilities in SRS. Similarly, water use increased in Australasia in line with higher production. 757,593 746,587 NORTH AMERICA TOTAL WASTE GENERATION (METRIC TONNES) nFY13 nFY14 Total Group CO2 emissions for FY14 were 243,021 tonnes, a reduction of 4% compared to FY13. The decrease was spread evenly between Scope 1 down 4% (trucks, mobile plant etc), and Scope 2 down 5% (electricity), and reflected an overall reduction in operating activity across the Group. Due to regional factors in energy to carbon conversion under the international Greenhouse Gas Protocol (GGP), the carbon profile is different to that of energy, with electricity accounting for 56% of emissions, followed by diesel at 38%, gas at under 5%, and petrol and LPG under 1% each. Operational & Financial Review For personal use only Sims Metal Management Annual Report 2014 36,381 17,613 202,386 WA S T E M A N AG E M E N T Waste generation is very strictly controlled and is a fundamental part of the Company’s purchasing and pricing policies for incoming materials. Due to the nature of the business however, some waste is unavoidable. In FY14, the Company generated 1,405,688 tonnes of waste. This was a small increase over FY13, largely caused by a 14% increase in Australasia due to significantly higher production. The vast majority of waste (97.3%) is non-hazardous residue which finds beneficial use in landfills as day cover, drainage or methane recovery media. The remaining waste (2.7%) is classified as hazardous. The increase in that component in FY14 was due to a re-classification by various statutory authorities, as well as the disposal of excess leaded glass from the CRT recovery operations within the SRS division. 25 O PPEERR AA T ITO INOAN L A& LF I&N AFNI CNI A LN R O C EI VA ILE WR E V I E W 5.6 3.6 FY14 2.7 2.8 FY13 FY12 2.7 FY11 FY10 3.2 4.5 FY09 FY08 FY07 FY06 FY03 FY04 FY05 LOST TIME INJURY FREQUENCY RATE (LTIFR)1 Safety is the first and most important priority in every task and operational activity that we undertake. An enormous amount of training and resources is dedicated to this most crucial aspect of our operations. As an executive rule, operational activity will be shut down if a near miss or unsafe situation is identified, and will not recommence until the issue is fully understood and rectified. At an individual level, working safely is a non-negotiable condition of being present on the Company’s sites. It is integral to every task performed, be it by an employee, a contractor or a visitor. Not only are the traditional lagging indicators, such as LTI’s, MTI’s, as well as minor incidents, recorded in the Company’s global data base but, equally, leading indicators raised within safety conversations (known as Observational Behaviour Audits – OBA’s) of any unsafe act and near miss are recorded and analysed with the objective of eliminating any repeat. A considerable amount of the more than 150,000 training hours delivered during FY14 were specifically dedicated to safety. It is pleasing to report, through the Company’s unwavering focus on safety, incidents declined meaningfully over the prior year. The lost time injury frequency rate (LTIFR) for the Group in FY14 was 2.7, a decrease of 25% on FY13. Similarly, the medically treated injury frequency rate (MTIFR) for FY14 was 11.0, a decrease of 13% over the prior year. The Company also tracks, on par with its full time employees, the incident statistics for contractors and temporary workers, although the nature of individual contracts does not allow the Company to calculate the associated frequency rates. 52.3 Under this Company wide safety framework, each region pursues and implements specific safety initiatives of immediate and individual relevance to its operations. During YF14, these included: 11.1 FY12 FY13 FY14 12.7 11.0 12.4 FY11 FY10 FY09 FY08 FY06 FY07 14.2 19.4 25.2 31.1 31.9 31.6 38.7 North America Metals: The quality of safety observations and their allocated corrective actions was targeted across all divisions, and training delivered improved performance in this area. Supervisors and managers were also retrained with the aim of delivering improved information value on incident investigations. A specific safety campaign “A Hundred Days of Summer” highlighted issues relating to employees standing in for others on leave. MEDICALLY TREATED INJURY FREQUENCY RATE (MTIFR)1 1 26 6.5 5.0 6.0 8.0 11.0 H ealth and S afety FY03 FY04 FY05 For personal use only Sustainability alculated as the number of lost time C or medically treated injuries multiplied by 1 million and divided by the hours worked. UK Metals and SRS Global: Each facility was tasked with providing specific site action plans to maintain and implement the deliverables of the SimsMMway safety platform. These included site managers receiving formal training on behavioural science to better understand and influence behaviour. A “Stop the Yard” initiative was introduced, where all operational activities are stopped for ten minutes each day to discuss yard activities and their interaction, in a safety context. Specific to SRS, training targeted pedestrian and vehicle interaction and the expected standards of safety performance as it relates to manual de-manufacturing and dismantling of components. Australia and New Zealand Metals: The shared values of “Think Safe – Work Safe – Home Safe” were strongly promoted and supported by a range of targeted training and workshops. “Simsafe” – an individual risk assessment process incorporating responsibility, accountability and authority was also implemented, combined with specific presentations to management and delivery of training to all workers. Initiatives relating to the most common injuries, improvements, and what SHEC Managers will do differently in the future, were target issues during FY14. 73 77 CORPORATE EUROPE SRS EUROPE METALS NORTH AMERICA METALS NORTH AMERICA SRS AUSTRALIA METALS AUSTRALASIA SRS 173 186 680 634 811 830 1,038 930 1,223 1,139 DIVERSIT Y AND RETENTION As a result of restructuring activities during FY14, the total employees within the Group reduced by 6% to 6,011 from 6,393 employees in FY13. Throughout however, the Company remained focused on its ongoing commitment to gender balance in the workforce. During FY14, the percentage of females employed in Middle, Senior and Executive management increased from 16% to 20%. At the Executive level, female employment increased from 11% to 17%. The number of staff leaving voluntarily remained largely unchanged from FY13 at 17%, as did redundancies at 5%. 6.6 PRODUCTION 8.7 7.2 ADMINISTRATION 2.8 MIDDLE MANAGEMENT 0.3 1.4 SENIOR MANAGEMENT EXECUTIVES 0.1 0.5 11.0 61.4 FULL TIME EMPLOYEE COMPARISON (excluding JV’s) nFY13 nFY14 WORKFORCE AND GENDER DISTRIBUTION (% of Total Workforce) n FEMALES nMALES TRAINING AND DEVELOPMENT Training and development is a significant driver of the Company’s ability to innovate, improve, and sustain its operations. Notwithstanding this, total training reduced to roughly 151,000 hours in FY14, due to a combination of headcount decline and the maturing of many training programs to a maintenance phase. The Company’s strong commitment to safety and wellness accounted for a significant component of training; other issues such as Leadership and Management, Customer Service, and Trainee development were also core deliverables. In addition to this time thousands of hours of training was received related to on-the-job skills improvement. 2 Operational & Financial Review For personal use only 2,395 2,215 Sims Metal Management Annual Report 2014 P e ople and D iversity COMMUNIT Y ENGAGEMENT As the world’s largest listed recycler of metals and electronics, the Company’s insight on matters related to waste and energy reduction is keenly sought by Government entities, NGO’s and a wide range of institutions interested in sustainable practices. As a result, the Company works closely with a wide range of stakeholders, from Government think-tanks, to small local communities that have an interest in what the Company does. Notable relationships include; the UN, City of New York, the UK Ministry of Defence, and the Australian Government, on issues ranging from data security, illegal trans-boundary movements, to metal theft and resource efficiency. Equally, the Company works closely with environmental advocacy groups such as The Baykeeper, and has prominent involvement with industry groups including the International Recycling Organisation (BIR), the Institute of Scrap Recycling Industries (ISRI), the British Metal Recycling Organisation (BMRA) and the Australian Council of Recyclers (ACOR). The Company remains closely connected to the communities in which it operates reflected in the thousands of projects and activities in which it is involved. The following is a small selection of the wide span of these activities: North America: Programs were conducted with a number of local law enforcement agencies to prevent and report metal theft, as well as the shredding of guns in support of anti-violent behaviour. Across the region, a large number of educational and environmental activities were supported. The SRS division organised the take-back of more than 250,000 pounds of e-waste as part of Earth Day, breaking the Guinness World Record for most consumer electronics recycled within 24 hours. Australasia: New Zealand staff took an active role in the support of cancer research as part of the 24 hour “Relay for Life”. In Australia, employees at the Company’s facilities continued work with the fire and rescue services, opening yards out of hours and providing practice vehicles for life saving drills with “the jaws of life” – simulating the cutting free of people trapped in wrecked vehicles. Europe: The Company’s “Community Ambassadors” program almost doubled its target for local community engagement, with program activities including school education and high school career programs, and the provision of obsolete vehicles to fire and rescue services. In addition, employees were encouraged to volunteer in a range of charity events, which included the Air Ambulance service and the “Soldiers, Sailors, Airmen and Families” Association. 27 OP ER AT ION A L & FIN A NCI A L RE V IE W For personal use only Financial Review S ensitivity to movements in foreign exchange rates The principal currencies in which the Group’s subsidiaries conduct business are United States (“US”) dollars, Australian dollars (“A$”), Euros, and British pounds sterling. Although the Group’s reporting currency is the Australian dollar, a significant portion of the Group’s sales and purchases are made in currencies other than the Australian dollar. In addition, a significant portion of the Group’s net assets are denominated in currencies other than the Australian dollar. The Group’s consolidated financial position, results of operations and cash flows may be materially affected by movements in the exchange rate between the Australian dollar and the respective local currencies to which its subsidiaries are exposed. Some of the results referred to below are shown on a “constant currency” basis, which means that the current period results are translated into Australian dollars using applicable exchange rates in the prior year comparable period. This allows for a relative performance comparison between the two periods before the translation impact of currency fluctuations. Foreign exchange rates compared with the prior corresponding periods for the major currencies that affect the Group’s results are as follows: Average Rate US dollar Euro Pounds sterling FY14 FY13 0.9187 0.6775 0.5657 1.0271 0.7949 0.6549 Closing Rate Variance % (10.6) (14.8) (13.6) As at 30 June 2014 As at 30 June 2013 0.9420 0.6906 0.5531 0.9275 0.7095 0.6072 Variance % 1.6 (2.7) (8.9) As at 30 June 2014, the cumulative effect of the retranslation of net assets of foreign controlled entities (recognised through the foreign currency translation reserve) was $329.9 million compared to $307.6 million as at 30 June 2013. REVENUE Sales revenue of $7,129.0 million in FY14 was down 1% compared to sales revenue of $7,193.0 million in FY13. At constant currency, sales revenue was down 11% due to lower sales volumes and lower average non-ferrous and precious metal scrap prices. Sales volumes decreased by 8% to 11.815 million tonnes in FY14 versus 12.786 million tonnes in FY13. E arnings Statutory net loss after tax was $88.9 million. Underlying net profit after tax was $68.8 million, 333% higher than FY13. The principal difference between the statutory and underlying results relates to significant items recorded during both FY14 and FY13. Statutory EBITDA for FY14 was $124.8 million compared to a statutory EBITDA loss of $42.5 million in FY13. Underlying EBITDA of $242.4 million was 27% higher than FY13. The increase in underlying EBITDA was primarily due to much improved performance from the Group’s metal recycling operations in Australia and the UK, offset by lower underlying EBITDA from metals recycling in North America and the electronics recycling businesses in North America and the UK. At constant currency, underlying controllable costs were $52.7 million lower in FY14 compared to FY13. RECONCILIATION OF STATUTORY NPAT TO EBITDA A$m Statutory Net Loss After Tax Goodwill and intangible impairment charges Depreciation and amortisation Interest expense, net Income tax expense / (benefit) Statutory EBITDA FY14 (88.9) 28.5 123.9 14.2 47.1 124.8 FY13 restated (467.3) 304.4 123.5 18.2 (21.3) (42.5) Depreciation and amortisation increased by $0.4 million to $123.9 million, while net interest expense decreased by $4.0 million to $14.2 million in FY14. The reduction in net interest expense reflects the decline in net debt during the period. 28 For personal use only Sims Metal Management Annual Report 2014 Statutory loss per share improved to 43.5 cents in FY14 compared to a statutory loss per share of 228.6 cents in FY13. Underlying diluted earnings per share increased to 33.6 cents in FY14 from 7.7 cents per share in FY13. The Company determined to pay a final dividend for FY14 of 10.0 cents per share, which will be fully franked. This is an exception to the Company’s dividend policy which is to distribute 45% to 55% of NPAT, subject to the discretion of the Board and remains unchanged. C ash F low and B orrowings Cash flow from operating activities of $210.1 million in FY14 decreased by $87.2 million versus FY13 due to increased working capital requirements, higher income tax payments and lower dividends received from associates and joint ventures. • Investments in Western Australia for a new shredding operation which the Group expects to be operational in the second half of fiscal 2015. • T he completion of the development of the New England metals recycling region in North America, with an automobile shredder and export facility in Rhode Island. • T he completion of the principal plant supporting the New York City municipal recycling project. 2 Operational & Financial Review Capital expenditures were $64.1 million during FY14 which was significantly lower than capital expenditures of $149.0 million in FY13. Lower capital expenditures reflect the recent completion of a number of major capital investments. The primary capital expenditures in FY14 relate to the following projects: As at 30 June 2014, the Group had a net cash position of $42.3 million. The Group’s gearing ratio as at 30 June 2013 was as follows: A$m Total borrowings Less: cash and cash equivalents Net debt Plus: total equity Total capital Gearing ratio as at 30 june 2013 restated 200.7 (46.9) 153.8 1,929.2 2,083.0 7.4% The Group’s strong cash flow and balance sheet position provides the capacity to fund the ongoing operational requirements of the business, as well as potential increased working capital requirements as underlying business conditions improve. Maintaining low gearing and a secure balance sheet remains a focus of the Group. 29 For personal use only OP ER AT ION A L & FIN A NCI A L RE V IE W 30 RECONCILIATION OF STATUTORY RESULTS TO UNDERLYING RESULTS FOR THE YEARS ENDED 30 JUNE 2014 and 2013 EBITDA 1 EBIT NPAT FY14 A$m FY13 A$m FY14 A$m FY13 A$m FY14 A$m FY13 A$m Statutory Results 124.8 (42.5) (27.6) (470.4) (88.9) (467.3) Significant items: Goodwill impairment Other intangible asset impairment Impairment of investment in CTG Fixed asset impairment Write-down of equipment spares Natural disaster expenses, net of insurance recoveries Fire destroyed assets, net of insurance recoveries Net (reversal)/impairment of loans UK inventory write-downs Inventory adjustments to net realisable value Write-down of CTG derivatives and equity accounted losses Adjustments made by joint ventures Lease settlements/onerous leases Redundancies Settlement of disputes with third parties Share-based compensation expense related to former CEO3 One-time costs associated with new CEO Yard closure/dilapidations Credit provisions/losses Multi-employer pension plan withdrawal liability Loss on sale of joint arrangements Transaction and other legal costs Loss on sale of business divisions Commercial settlements Other Write-off of deferred tax asset Underlying results 4 N/A 2 N/A 2 – 40.9 0.8 (2.8) (5.3) (4.9) – 0.9 13.0 3.0 31.8 16.7 1.3 – 1.0 9.8 3.5 6.3 – – 1.3 – 0.3 – 242.4 N/A 2 N/A 2 14.9 61.2 5.1 4.3 – 4.8 63.9 6.0 21.3 – 13.1 7.3 4.7 3.4 – 8.5 2.9 – 1.6 3.1 10.1 (3.3) – – 190.4 27.8 0.7 – 40.9 0.8 (2.8) (5.3) (4.9) – 0.9 13.0 3.0 31.8 16.7 1.3 – 1.0 9.8 3.5 6.3 – – 1.3 – 0.3 – 118.5 292.2 12.2 14.9 61.2 5.1 4.3 – 4.8 63.9 6.0 21.3 – 13.1 7.3 4.7 3.4 – 8.5 2.9 – 1.6 3.1 10.1 (3.3) – – 66.9 22.2 0.7 – 41.6 0.7 (2.8) (5.3) (4.9) – 0.9 13.0 3.0 31.5 16.3 1.3 – 0.9 9.8 3.4 6.3 – – 1.2 – 0.3 17.6 68.8 261.9 8.9 14.9 54.7 5.1 2.7 – 3.0 63.9 4.9 21.3 – 9.7 5.0 4.7 2.1 – 7.2 2.0 – 1.5 2.4 10.0 (2.7) – – 15.9 EBITDA is a measurement of non-conforming financial information. See table above that reconciles statutory net loss after tax to statutory EBITDA. N/A indicates that EBITDA is calculated to exclude impairment of goodwill and other identified intangible assets in the presentation of both the statutory and underlying results. 3 Represents expense associated with good leaver determination for the former CEO with respect to long-term incentive plans. 4 Underlying result is a non-IFRS measure that is presented to provide an understanding of the underlying performance of the Group. The measure excludes the impacts of impairments, disposals as well as items that are subject to significant variability from one period to the next. The reconciling items above (before tax) have been extracted from the audited financial statements. 1 2 For personal use only The directors and management of Sims Metal Management Limited (the “Company” or the “Group”) are committed to operating the Company’s business ethically and in a manner consistent with high standards of corporate governance. The directors consider the establishment and implementation of sound corporate governance practices to be a fundamental part of promoting investor confidence and creating value for shareholders, through prudent risk management and a culture which encourages ethical conduct, accountability and sound business practices. The Corporate Governance Statement of the Company for the 2014 financial year has been prepared with reference to the Australian Securities Exchange (ASX) Corporate Governance Principles and Recommendations (including 2010 Amendments) (Recommendations). The Company has complied with the Recommendations. Sims Metal Management Annual Report 2014 CORPORATE GOVERNANCE STATEMENT PRINCIPLE 1: LAY SOLID FOUNDATIONS FOR MANAGEMENT AND OVERSIGHT 1.1 BOARD OF DIRECTORS The board is responsible for the corporate governance and overall performance of the Company and the Group and for providing strategic guidance for the Group. The responsibilities of the board encompass the setting of key objectives, monitoring performance and ensuring the Group’s internal control, risk management and reporting procedures are adequate and effective. 1.2 THE ROLE AND RESPONSIBILITIES OF THE BOARD AND SENIOR EXECUTIVES The role and responsibilities of the board are formally set out in its charter. The board charter identifies the functions reserved for the board and those delegated to senior executives. The board’s key responsibilities include: –– overall corporate governance of the Group, including oversight of its control and accountability systems; –– appointing, removing and appraising the performance of the Group Chief Executive Officer (CEO); –– monitoring performance of senior management and the implementation of strategy, and ensuring appropriate resources are available; –– approving and monitoring the progress of major capital expenditure, capital management, acquisitions and divestitures, and financial and other reporting. The board has delegated general authority to manage the businesses of the Company to the CEO, who in turn may delegate functions to other senior management. However, the CEO remains answerable to the board and must comply with any limits on his authority established by the board from time to time. Effective 1 July 2013 the board created a Global Leadership Team to serve in lieu of the CEO while a search was accomplished to appoint a new CEO. Galdino Claro was appointed CEO of the Company on 4 November 2013. Corporate Governance –– enhancing and protecting the reputation of the Company by reviewing and ratifying systems of risk management and internal compliance and control, codes of conduct, and legal compliance; and 3 Letters of appointment have been provided to all non-executive directors, covering responsibilities, time commitments, performance evaluation, indemnity and insurance arrangements, and induction and development. The responsibilities and terms of employment of certain senior executives of the Group are also set out in formal contracts of employment. 1.3 PERFORMANCE EVALUATION OF SENIOR EXECUTIVES Annual performance objectives are set each financial year for all senior executives of the Group. These performance objectives include both financial and non-financial measures. A year-end appraisal is conducted to assess performance against the executive’s personal priorities and the responsibilities and demands of their role. The outcome of the performance review process is reflected in training and development/executive coaching programs, as needed, and succession planning for each executive, as well as an annual remuneration review. For the 2014 financial year, annual performance reviews were completed in accordance with the process disclosed. The Remuneration Report on pages 48 to 74 contains further information regarding the process for evaluating the performance of senior executives for the purpose of determining their fixed and variable remuneration. 1.4 EXECUTIVE INDUCTION PROGRAMS Senior executives are able to attend formal induction programs which provide an overview of the Group, and its key policies and processes. Meetings are arranged with other senior executives in the Group to brief the new executives on the Group’s businesses, strategic objectives, risk management practices and other information necessary to meet the requirements of their roles. Site visits are also arranged to familiarise the executives with the Group’s operations and key operating personnel. A copy of the board charter is available from the corporate governance section on the Company’s website. 31 C O R P O R ATE G O V E R NAN C E S TATEMENT For personal use only PRINCIPLE 2: STRUCTURE THE BOARD TO ADD VALUE 2.1 COMPOSITION OF THE BOARD The board charter sets out the composition of the board and relevant criteria for assessing the independence of directors. The board currently comprises nine non-executive directors. Mr Claro was appointed an executive director of the Company on 4 November 2013. Details of board members, including their skills, experience, qualifications and terms in office, are set out on pages 46 and 47. 2.2 BOARD ACCESS TO INFORMATION AND INDEPENDENT ADVICE A director may, at the Company’s expense and subject to prior approval of the Chairperson, obtain independent professional advice relating to his or her duties and obligations as a board member. Board committees may also seek such independent professional advice. To the extent required to enable them to carry out their duties, all directors and board committees also have access to Company information and records and may consult senior management as required. 2.3 INDEPENDENCE OF DIRECTORS The board charter states that board members shall be considered independent if they do not have any of the relationships identified in Box 2.1 of the Recommendations, and have been determined by the board to be independent, as defined in and to the extent required by the applicable rules of the United States Securities and Exchange Commission (SEC) and other applicable laws and regulations, as they may be amended from time to time. Having regard to these criteria, the board has determined that Heather Ridout, Gerald Morris, Norman Bobins, Christopher Renwick, Geoffrey Brunsdon, Jim Thompson, John DiLacqua and Robert Bass were independent non-executive directors of the Company during the 2014 financial year. Tom Sato, a non-executive director, is not considered to be an independent director of the Company as a result of his association with Mitsui & Co., Ltd, which, through its affiliates, owns an 18% shareholding in the Company. In accordance with Recommendation 2.1, the board has a majority of directors who are independent. The independence of the directors is regularly reviewed. In accordance with the board charter, all directors must disclose to the board any actual or perceived conflicts of interest, whether of a direct or indirect nature, of which the director becomes aware and which the director reasonably believes may compromise the reputation or performance of the Company. 2.4 CHAIRPERSON Geoffrey Brunsdon, an independent non-executive director, has held the position of Chairperson of the board since 1 March 2012. The roles of CEO of the Company and Chairperson of the board are separate, and the Chairperson must not also be the CEO. The Chairperson is responsible for the leadership of the board, establishing the agenda for board meetings, ensuring the board is effective, and chairing board and shareholders’ meetings. 2.5 BOARD PROCESSES The board charter provides that the board shall meet at least four times per year, and otherwise as it considers necessary. The board met six times during the 2014 financial year, including three times for full briefing sessions. Details of directors’ attendances at board meetings in the 2014 financial year are reported on page 43. To assist directors in enhancing their understanding of the Company’s business, directors are briefed from time to time by members of the executive team on divisional performance and key operational and strategic issues, financial matters, risk management, market conditions, compliance and governance. The directors are also provided with an explanation of those proposed activities of the Group which require board approval. The Group Company Secretary is responsible for ensuring that board procedures and policies are followed, and provides advice to the board on corporate governance and regulatory matters. All directors have unrestricted access to the advice and services of the Group Company Secretary. 2.6 BOARD COMMITTEES The board has established five board committees to assist in the execution of board functions. Each committee has a written charter which is approved by the board and reviewed periodically. The charters of each of the board committees are available on the Company’s website. Membership of the board committees is set out in the biographies of directors on pages 46 and 47. Details of directors’ attendance at each committee meeting in the 2014 financial year are set out on page 43. To enable each of the committees to discharge its responsibilities adequately and effectively, each committee has the authority to retain advisers and external legal counsel as required. Each committee reports to the board and, following preparation of the minutes of each committee meeting, provides the board with copies of those minutes at the next occasion the board meets. 32 For personal use only The Nomination/Governance (Nom/Gov) Committee is responsible for recommending nominees for membership of the board in accordance with the committee’s Policy and Procedures for the Selection and Appointment of New Directors and the Re-election of Incumbent Directors. The Nom/Gov Committee also assesses necessary and desirable competencies of board members. Sims Metal Management Annual Report 2014 2.7 NOMINATION/GOVERNANCE COMMITTEE The Nom/Gov Committee is also responsible for reviewing the corporate governance procedures of the Company and recommending changes to the board as appropriate; developing a plan for board succession, including the succession of the Chairperson of the board and the CEO of the Company, and monitoring succession plans for the Company's management levels and key resources; and establishing procedures for and overseeing the evaluation of the board. When considering the mix of skills and diversity which the board is looking to achieve in its membership, the Nom/Gov Committee takes into account the need to have members with relevant industry experience; expertise in particular fields such as financial, human resources and health & safety; and the broad skillset and experience required to effectively serve on the board of a global organisation. The Nom/Gov Committee has a formal charter, a copy of which is available from the corporate governance section on the Company’s website, approved by the board. COMPOSITION The Nom/Gov Committee shall comprise at least three directors of the Company, with a majority being independent. The current members of the Nom/Gov Committee are Mrs Ridout and Messrs Bobins (Chairperson), Morris and Renwick, all being independent non-executive directors, and Mr Claro. The board may appoint additional directors to the Nom/Gov Committee or remove and replace members of the Nom/Gov Committee by resolution. The Nom/Gov Committee Chairperson shall not be the Chairperson of the board. MEETINGS OF THE NOMINATION/GOVERNANCE COMMITTEE The committee charter provides that the Nom/Gov Committee shall meet at least twice each year on a formal basis and additionally as circumstances may require. The Nom/Gov Committee met three times during the 2014 financial year. Details of attendance at meetings of the Nom/Gov Committee are set out on page 43. 2.8 BOARD PERFORMANCE EVALUATION 3 Corporate Governance The Nom/Gov Committee is responsible for establishing procedures and overseeing the evaluation of the board. A formal performance evaluation was conducted involving the directors answering a series of questions on topics such as challenges or issues facing the Company and how the board can assist management in dealing with them, board interaction with the CEO and management, board composition, and continuing director education. The results of the evaluation, including individual committee assessments, were independently documented and will form the basis for the development of appropriate action plans under the guidance of the Nom/Gov Committee for the 2015 financial year. 2.9 RETIREMENT AND RE-ELECTION OF DIRECTORS The Nom/Gov Committee considers and nominates to the board candidates for election as directors. The Company’s constitution requires that non-executive directors appointed by the board during the year must offer themselves for election by shareholders at the next Annual General Meeting of the Company. In addition, a non-executive director may not serve without seeking re‑election beyond the third Annual General Meeting following the meeting at which the director was last elected or re-elected, or three years, whichever is longer. At least one director, other than the CEO, must retire at each Annual General Meeting. Retiring directors may offer themselves for re-election by the shareholders. The board does not impose a predetermined restriction on the tenure of directors as it considers that this restriction may result in the loss of vital experience and expertise. 2.10 DIRECTOR EDUCATION A new board member orientation process has been established to provide new directors with an understanding of, and insight into, the industry, Company, management and control environment of the Group. As part of this process, directors receive orientation materials, meet with key senior executives and are given the opportunity to conduct site visits at significant operational facilities. Directors may, from time to time, depending on their particular needs, experience and interests, undertake external education seminars and programs at the expense, and with the approval, of the Company. As part of on-going director education, board meetings are held at various Group locations from time to time during the year which provides directors the opportunity to observe activities and interact with management. 33 C O R P O R ATE G O V E R NAN C E S TATEMENT For personal use only PRINCIPLE 3: PROMOTE ETHICAL AND RESPONSIBLE DECISION-MAKING 34 3.1 CODE OF CONDUCT The Company’s Code of Conduct applies to all directors, officers and employees of the Group. It underpins Sims Metal Management’s commitment to integrity, fair dealing and compliance with the law in its business affairs, and sets out expected standards of conduct with respect to all stakeholders, including fellow employees, customers, suppliers, shareholders and the community. The Code of Conduct is designed to encourage ethical and appropriate behaviour by all Group personnel, and addresses a wide range of responsibilities to stakeholders, including conflicts of interest, security of information, use of Company assets and resources, discrimination and harassment, occupational health and safety, and the prohibition of corrupt conduct and the consequences in the event thereof. The Code of Conduct encourages employees to raise any matters of concern without fear of retribution. The Company has implemented the Sims Metal Management Hotline to enable employees, customers, contractors and the like to report misconduct or unethical behaviour within the Group to an external third party. The Company also conducts employee education and compliance programs on a regular basis to help ensure compliance with various laws around the world. 3.2 ANTI-CORRUPTION CODE In addition to the Code of Conduct, the Company has adopted an Anti-Corruption Code which has been developed to aid employees, agents, contractors, consultants and partners in ensuring that they comply at all times with applicable anti-corruption laws and policies. Among other matters, the Code of Conduct sets out the Company’s policy in relation to conflicts of interests, gifts and hospitality, relationships with governments and political contributions. Copies of the Company’s Code of Conduct and Anti-Corruption Code are available from the corporate governance section on the Company’s website. 3.3 DEALING IN COMPANY SECURITIES Directors and employees of the Group are bound by the Company’s policy on dealing in the securities of the Company. Under the policy, directors, senior executives and other ‘designated persons’ may only buy or sell Company securities during the period 24 hours to 28 days after the release of the Company’s yearly and half-yearly results announcements and the filing of the Company’s Form 20-F with the SEC, or during such period following the conclusion of the Company’s Annual General Meeting, or during the currency of any capital raising prospectus issued by the Company or takeover bid for the Company. A copy of the Company’s policy titled ‘Dealing in Sims Metal Management Limited Securities’ is available from the corporate governance section on the Company’s website. 3.4 DIVERSITY Sims Metal Management recognises the value and advantages of having a diversified workforce that reflects the diversity of the communities in which it operates. Accordingly, the Company has adopted a Workplace Diversity Policy, a copy of which can be found on the Company’s website. This policy is designed to support the Company’s organisational core values of respect, integrity and teamwork. The board has responsibility for establishing and monitoring the Company’s overall diversity strategy and policy. The board’s Nom/Gov Committee has responsibility for monitoring the effectiveness of this policy to the extent it relates to board diversity and for reviewing and recommending any updates to this policy as deemed necessary. The board’s Remuneration Committee has an overarching role to establish measurable objectives for achieving diversity, and to assess annually, both the objectives and the Company’s progress in achieving them. The following table shows the objectives in relation to gender diversity that were established for the 2014 financial year and the progress made towards achieving them. Objective Progress 1. In accordance with the Global Gender Diversity Plan (Diversity Plan), deliver leadership diversity training to global managers/supervisors. Achieved and ongoing. 2. Increase female participation at the Senior Management and Executive levels. Progress made. The percentage of female participation at the Senior Management level increased from 14% in the 2013 financial year to 17% in the 2014 financial year. The percentage of female participation at the Executive level increased from 11% to 17% over the same period. 3. Following the appointment of a female director in calendar 2011 consider, as retirements permit, appointing at least one further female director within the ensuing two calendar years. The Company has recently announced the appointment of two additional female directors to the board effective 1 November 2014. This will mean, following the planned retirement of two male directors at the conclusion of the Company’s 2014 Annual General Meeting, that one-third of the non-executive directors on the board will be female. 4. Consider age, cultural and ethnicity issues within the context of the Diversity Plan. This initiative is slightly behind schedule due to significant restructuring efforts of the past years but will continue to be considered for the 2015 financial year and beyond. 5. Conduct a review of benefits and workplace practices to identify and remove diversity biases, including evaluating current diversity friendly benefits such as maternity leave, and considering additional programs like mentoring and flexible working arrangements for appropriate roles. Mentoring and flexible working arrangements have been implemented on a test basis throughout the Company. Management will monitor the effects of these tests and implement on a broader basis if proven successful. 6. Establish diversity objectives as part of an executive’s short term incentive personal priorities by the 2014 financial year. Diversity objectives have been implemented as part of the overall Talent Management objective for senior executives. Specific and more objective targets will be considered for the future. 7. Increase the percentage of women recruited into our management trainee, graduate and cadet programs to 25% by the 2014 financial year. Progress has been made in most regions. In North America Metals, from nil female Corporate Management Trainees in the 2013 financial year, two out of three hires in the the 2014 financial year were women, resulting in 50% of the current trainees being female. In North America SRS, its management trainee program created during the the 2014 financial year has two female candidates identified out of eight that will be going through the program in the 2015 financial year (ratio 25%). In Australia Metals, during the the 2014 financial year there were 16 participants in the Cadet and Graduate program of which five (or 31%) were female. This represented an increase from nine participants of which two (or 22%) were female, in the 2013 financial year. Since July 2014, two more female participants have been employed. Due to the restructuring and organisational changes and challenges in UK Metals during the 2014 financial year, that region currently does not have any trainee managers on its Trainee Management Programme. As at the end of the 2014 financial year, the proportion of women employees in the whole organisation and in senior executive positions was 18% and 17% respectively. There is one female director on the Company’s board. 3 Corporate Governance For personal use only Progress Sims Metal Management Annual Report 2014 Objective PRINCIPLE 4: SAFEGUARD INTEGRITY IN FINANCIAL REPORTING The CEO and the Group Chief Financial Officer (CFO) have stated in writing to the board in respect of the 2014 financial year: –– that the Company’s financial reports present a true and fair view, in all material respects, of the Company’s financial condition and operational results and are in accordance with relevant accounting standards; and –– that the above statement is founded on a sound system of risk management and internal compliance and control which implements the policies adopted by the board and that the Company's risk management and internal compliance and control system is operating efficiently and effectively in all material respects. As at 30 June 2013, the Company had two material weaknesses in internal controls over financial reporting involving inventory valuation in the UK SRS business and in the aggregation across the Group relating to period end management review of journal entries. Each of these material weaknesses were remediated in the 2014 financial year. 4.1 RISK, AUDIT & COMPLIANCE COMMITTEE The Risk, Audit & Compliance (RAC) Committee assists the board in fulfilling its responsibility to oversee the quality and integrity of accounting, auditing and reporting practices of the Company. In particular, the primary role of the RAC Committee is to assist the board in fulfilling its corporate governance and oversight responsibilities in relation to the Company’s accounting and financial reporting, internal control structure, risk management systems (including the review of risk mitigation, which includes commercial insurance coverage), internal and external audit functions, and compliance with legal and regulatory requirements. The RAC Committee has a formal charter approved by the board. The RAC Committee reports to the board on all matters relevant to the RAC Committee’s role and responsibilities. The specific functions of the RAC Committee are set out in its charter and include: –– reviewing and assessing the internal and external reporting of financial information; –– assessing management processes supporting the integrity and reliability of the Company’s financial and management reporting systems and its external reporting; –– overseeing the relationship with and performance of the external auditor and assessing the independence of the external auditor; and –– overseeing the performance of the internal audit function. 35 For personal use only C O R P O R ATE G O V E R NAN C E S TATEMENT 36 The RAC Committee charter establishes a framework for the RAC Committee’s relationship with the internal and external auditor, and a policy has been adopted for the selection and appointment of the external auditor and for rotation of external audit engagement partners. A copy of the RAC Committee charter is available from the corporate governance section on the Company’s website. 4.2 COMPOSITION The RAC Committee charter provides for the RAC Committee to have at least three members, all of whom must be non-executive independent directors. The current members of the RAC Committee are Mrs Ridout and Messrs Morris (Chairperson), Brunsdon, DiLacqua and Bass, all of whom are non-executive independent directors. Further, all members must be financially literate, and at least one member must have accounting or related financial management expertise. These requirements are satisfied. Under the RAC Committee charter, a director may not be both the Chairperson of the RAC Committee and the Chairperson of the board. 4.3 MEETINGS OF THE RAC COMMITTEE In accordance with its charter, the RAC Committee is required to meet at least four times each year on a formal basis, and holds additional meetings as necessary. Meetings are attended by invitation by the other directors, the CEO, the CFO, other members of management, including the General Counsel, internal auditors and the external auditor, PricewaterhouseCoopers. The RAC Committee met seven times during the 2014 financial year. Details of attendance at meetings of the RAC Committee are set out on page 43. 4.4 EXTERNAL AUDITOR The external auditor is responsible for planning and carrying out the audit of the Group’s annual financial reports and reviewing the Group’s half-yearly financial reports. The auditor provides a written confirmation to the Company of its independence in connection with the Company’s financial reports for each half-year and financial year. The RAC Committee may meet with the external auditor without management being present at any time during each financial year. The external auditor is also provided with the opportunity, on request, to meet with the board of directors without management being present. The Company has adopted a policy titled “Procedures for the Selection and Appointment of the External Auditors and for the Rotation of External Audit Engagement Partners”, a copy of which is available from the corporate governance section on the Company’s website. 4.5 INTERNAL AUDITORS The RAC Committee has the responsibility for overseeing the development and execution of the internal audit plan. The Group Vice President of Internal Audit reports directly to the RAC Chairperson. The RAC Committee can appoint, hire, and reassign the Group Vice President of Internal Audit with a recommendation to the board. PRINCIPLE 5: MAKE TIMELY AND BALANCED DISCLOSURE 5.1 CONTINUOUS DISCLOSURE The Company is committed to ensuring that the market and its shareholders are provided with complete and timely information. The Company has adopted a Market Disclosure Policy, supplemented by specific procedures, to ensure that it complies with the continuous disclosure obligations imposed by the ASX, and with its disclosure obligations under the rules and regulations of the SEC. A copy of the policy is available from the corporate governance section on the Company’s website. The Company has formed a Disclosure Committee which, during the 2014 financial year, comprised the CEO (as Chairperson), the CFO and the Group Company Secretary. The committee has a formal charter approved by the board. The primary role of the committee is to manage the Company’s compliance with its continuous disclosure obligations by implementing reporting processes and controls and determining guidelines for the release of disclosable information. The Group Company Secretary has been appointed as the person responsible for communications with the ASX and SEC, which includes overseeing and co-ordinating information disclosure to the ASX and SEC. All announcements provided to the ASX are posted on the Company’s website as soon as practicable after release to the market. 5.2 COMMENTARY ON FINANCIAL RESULTS AND PERIODIC DISCLOSURE Sims Metal Management strives to provide investors with sufficient information to make an informed assessment of the Company’s activities and results. Results announcements and media/analyst presentations are released to the ASX and SEC and made available on the Company’s website. The Annual Report contains an operational and financial review to assist shareholders in evaluating the Company’s operating results, business strategies, prospects and financial position. For personal use only Sims Metal Management Annual Report 2014 PRINCIPLE 6: RESPECT THE RIGHTS OF SHAREHOLDERS 6.1 COMMUNICATION WITH SHAREHOLDERS The Company has adopted a statement on communication with shareholders which is designed to promote effective communication with shareholders and to encourage informed shareholder participation at the Annual General Meeting. A copy of the statement is available from the corporate governance section on the Company’s website. Where practical, the Company uses technology to facilitate communication with shareholders. The Company’s website includes links to announcements to the ASX and copies of the annual and half-yearly reports, notices of meetings, presentations and other information released to the market. By registering with the Company’s registrar, shareholders can receive email notifications when the Company makes an announcement to the ASX, including the release of financial reports. Sims Metal Management’s Annual Report currently remains one of the principal means of communicating with shareholders. The Company continues to review and enhance its website and to consider other ways to utilise technology to improve shareholder communication. Webcasts of results briefings allow access by all interested parties. 6.2 SHAREHOLDER MEETINGS Shareholders have the opportunity to raise matters with the members of the board at the Company’s Annual General Meeting. The external audit firm Group lead partner in charge of the Sims Metal Management audit also attends the Annual General Meeting and is available to answer questions from shareholders on audit-related matters. PRINCIPLE 7: RECOGNISE AND MANAGE RISK 7.1 RISK MANAGEMENT FRAMEWORK The board recognises that the effective management of risk is essential to achieving the Group’s objectives of maximising Group performance and creating long-term shareholder value while meeting its commitments to other stakeholders, including its employees, customers and the wider community. The board is responsible for ensuring that there are adequate policies in place with respect to risk management. The board and senior management are responsible for determining the level of risks acceptable to the Company. To help ensure all risks relevant to the Company are considered, a systematic approach to risk identification is followed. Identifiable risk areas which are considered include: Corporate Governance The Company has adopted a Risk Management Policy and a statement on internal compliance and control systems. 3 –– maintaining a safe work environment for the Company’s employees; –– the safeguarding and efficient use of assets; –– management of human resources; –– ensuring the Company complies with its environmental obligations; –– achieving established objectives and goals; –– the reliability and integrity of financial and operational information; –– compliance with internal policies and procedures; –– compliance with laws and regulations; and –– changes in the Company’s internal and external environments. Measures of consequence and likelihood have been determined and are used on a consistent basis. The Company’s primary risk assessment process comprises a comprehensive annual risk review. The board is responsible, on the recommendations of the RAC Committee, for ensuring that there are adequate policies in place in relation to internal control systems over financial reporting. The board places considerable importance on maintaining a strong internal control environment. The internal control system is based upon written procedures, policies, guidelines, job descriptions and organisational structures that provide an appropriate division of responsibility. It also relies upon the careful selection and training of key personnel. Internal control systems are reviewed on an ongoing basis to ensure that the systems are updated to reflect changes in the Company’s operations and the environment in which the Company operates. The Company has detailed written documentation covering critical areas. Internal Audit carries out regular systematic monitoring of control activities and reports to the RAC Committee and senior management. An internal audit plan is prepared, with input from the RAC Committee and senior management, annually by the Vice President of Internal Audit. This annual internal audit plan takes into consideration the findings of an annual risk assessment report prepared by senior management. The RAC Committee approves this annual internal audit plan. 37 For personal use only C O R P O R ATE G O V E R NAN C E S TATEMENT 38 Sustainability reporting is part of, and is integrated into, the Group’s risk management framework. The CEO has overall responsibility for Group sustainability matters, and a number of initiatives have been implemented to better enable the Group to measure, monitor and report on its sustainability performance. SAFETY, HEALTH, ENVIRONMENT & COMMUNITY COMMITTEE The board has established a Safety, Health, Environment & Community (SHEC) Committee. The primary role of the SHEC Committee is to provide additional focus and advice to the board on key SHEC issues and to assist the board to fulfil and discharge its SHEC obligations. The SHEC Committee shall comprise at least three directors of the Company, of whom at least one shall be independent. The SHEC Committee is composed of Mrs Ridout and Messrs Thompson (Chairperson), Renwick, Claro and Sato. The SHEC charter provides that the SHEC Committee shall meet at least four times each year and as required. The SHEC Committee met four times during the 2014 financial year. Details of attendance at meetings of the SHEC Committee are set out on page 43. FINANCE & INVESTMENT COMMITTEE The board has established a Finance & Investment (FIC) Committee. The primary role of the FIC Committee is to review, advise and report to the board on the management of the Company’s financial resources and invested assets, shareholder dividend policy and shareholder dividends, the Company’s capital plan and capital position, debt levels, hedging policies and other financial matters. The FIC Committee also reviews broad investment policies and guidelines for the Group and makes recommendations to the board. The FIC Committee shall comprise at least three directors of the Company, of whom at least one shall be independent. The FIC Committee is composed of Messrs DiLacqua (Chairperson), Brunsdon, Claro, Sato, Bobins and Thompson. The FIC charter provides that the FIC Committee shall meet at least twice each year and as required. The FIC Committee met seven times during the 2014 financial year. Details of attendance at meetings of the FIC Committee are set out on page 43. FINANCIAL REPORTING AND INTERNAL CONTROLS The board has responsibility for reviewing and ratifying internal compliance and control systems. The RAC Committee reviews the effectiveness and adequacy of internal control processes relating to financial reporting on a regular basis and reports its findings to the board. Management assumes the primary responsibility for implementing internal controls and for the internal control environment. In accordance with the Company’s policy, each regional President and regional Chief Financial Officer reports every six months to the CEO and the CFO and, if any exceptions, to the RAC Committee, on the operation and effectiveness of key internal controls. Any identified deficiencies in internal controls are followed up and addressed by division management. In addition, the Company maintains an internal audit function to conduct internal audits and reviews of the Group’s operations. The RAC Committee reviews the reports from the internal audit function on a regular basis, monitors its scope and resources, and approves the annual internal audit plan. The Company monitors its control system on a continual basis and, where appropriate, enhances internal control processes to improve their effectiveness. 7.2 RISK MANAGEMENT ASSURANCE The CEO and the CFO have stated in writing to the board in respect of the 2014 financial year that the Company’s financial reports present a true and fair view, in all material respects, of the Company’s financial condition and operational results and are in accordance with relevant accounting standards. The board has also received a written statement of assurance from the CEO and the CFO that, in respect of the 2014 financial year, to the best of their knowledge and belief: 1. the declaration provided in accordance with section 295A of the Corporations Act 2001 is founded on a sound system of risk management and internal compliance and control which, in all material respects, implements the policies adopted by the board; and 2. the Group’s risk management and internal compliance and control system for the financial year is operating effectively in all material respects in relation to financial reporting risks. Due to the geographic spread of the Group’s operations and the extensive delegation of authority and responsibility granted to senior business unit management, the CEO and the CFO, when attesting to the adequacy of the Company’s risk management and internal compliance and control system, rely significantly upon internal audit and the control certification reports received from each regional President and regional Chief Financial Officer regarding compliance with the various risk management, compliance and internal control policies and procedures in the region for which each is responsible. For personal use only Sims Metal Management Annual Report 2014 PRINCIPLE 8: REMUNERATE FAIRLY AND RESPONSIBLY 8.1 REMUNERATION COMMITTEE The primary role of the Remuneration Committee (Remco) is to support and advise the board on the implementation and maintenance of coherent, fair and responsible remuneration policies at Sims Metal Management which are observed and which enable it to attract and retain executives and directors who will create value for shareholders of the Company. Remco has responsibility for, among other things, reviewing and making recommendations to the board on the: –– remuneration and incentive performance packages of the CEO and direct reports to the CEO; –– Company’s recruitment, retention and termination policies and procedures; –– introduction and application of equity-based schemes, including allocations; and –– level of annual fees paid to the non-executive directors. 8.2 COMPOSITION Remco shall comprise at least three directors of the Company, with a majority being independent. The Remco Chairperson is appointed by the board, and must be independent. Remco is composed of five independent non-executive directors, Mrs Ridout and Messrs Renwick (Chairperson), Morris, Thompson and Brunsdon. The board may appoint additional directors to Remco or remove and replace members of Remco by resolution. 8.3 MEETINGS OF THE REMUNERATION COMMITTEE Remco has a charter, which provides for Remco to meet at least twice each year on a formal basis and additionally as circumstances may require. Remco met five times during the 2014 financial year. Details of attendance at meetings of Remco are set out on page 43. A copy of the Remco charter is available from the corporate governance section on the Company’s website. 8.4 DIRECTORS’ REMUNERATION 3 Corporate Governance The Remuneration Report sets out the total remuneration of non-executive and executive directors of the Company. Each of the non-executive directors is entitled to a fee for serving as a director of the Company and an additional fee for serving as Chairperson of a board committee. These fees are inclusive of any compulsory superannuation contributions (where applicable) and any retirement benefits. In general, unless otherwise disclosed in the Remuneration Report for the 2014 financial year, which is set out on pages 48 to 74, no additional fees are payable to non-executive directors for other services performed outside the scope of their ordinary duties as a director or committee member. The maximum aggregate remuneration of non-executive directors is determined by a resolution of shareholders and is then divided between the directors as agreed by the board. The amount of aggregate remuneration sought to be approved by shareholders, and the manner in which it is apportioned among non-executive directors, is reviewed annually by Remco and recommendations are then made to the board. The board considers advice as to the fees paid to non-executive directors of comparable companies when undertaking the annual review process. When considered appropriate to do so, it will also obtain advice from external consultants. 8.5 REMUNERATION REPORT The Company’s remuneration policy and procedures in respect of senior executives of the Company and Group are discussed in its Remuneration Report. The Company’s statement prohibiting designated persons from entering into transactions in products associated with Company securities which operate to limit the economic risk of their security holding in the Company over unvested entitlements under any Company equity incentive plans may be found in the Company’s policy titled ‘Dealing in Sims Metal Management Limited Securities’, available from the corporate governance section on the Company’s website. 39 C O R P O R ATE G O V E R NAN C E S TATEMENT For personal use only ASX CORPORATE GOVERNANCE COUNCIL’S CORPORATE GOVERNANCE PRINCIPLES AND RECOMMENDATIONS 40 Reference Comply 1.1, 1.2 1.2Disclose the process for evaluating the performance of senior executives 1.3, Remuneration Report 1.3Provide the information indicated in the Guide to reporting on Principle 1 website, 1.1–1.4 2.1A majority of the board should be independent directors 2.3 2.2The chair should be an independent director 2.4 2.4 Principle 1: Lay solid foundations for management and oversight 1.1Establish and disclose the functions reserved to the board and those delegated to senior executives Principle 2: Structure the board to add value 2.3The roles of chair and CEO should not be exercised by the same individual 2.4The board should establish a nomination committee 2.6, 2.7, 2.9 2.8, 2.10 website, Directors’ Report, 2.1–2.10 3.1, 3.2 3.2Establish a policy concerning diversity and disclose the policy or a summary of that policy. The policy should include requirements for the board to establish measurable objectives for achieving gender diversity and for the board to assess annually both the objectives and progress in achieving them 3.4 3.3Disclose in each annual report the measurable objectives for achieving gender diversity set by the board in accordance with the diversity policy and progress towards achieving them 3.4 3.4Disclose in each annual report the proportion of women employees in the whole organisation, women in senior executive positions and women on the board 3.4 website, 3.1–3.4 4.1The board should establish an audit committee 4.1 4.2The audit committee should be structured to consist only of non-executive directors, a majority of independent directors and an independent chair (who is not chair of the board), and to have at least three members 4.2 2.5Disclose the process for evaluating the performance of the board, its committees and individual directors 2.6Provide the information indicated in the Guide to reporting on Principle 2 Principle 3: Promote ethical and responsible decision-making 3.1Establish a code of conduct and disclose the code or a summary of the code as to the practices necessary to maintain confidence in the company’s integrity, the practices necessary to take into account their legal obligations and the reasonable expectations of their stakeholders, and the responsibility and accountability of individuals for reporting and investigating reports of unethical practices 3.5Provide the information indicated in the Guide to reporting on Principle 3 Principle 4: Safeguard integrity in financial reporting 4.3The audit committee should have a formal charter 4.1 website, 4.1–4.4 5.1, 5.2 website, 5.1, 5.2 6.1Design and disclose a communications policy for promoting effective communication with shareholders and encouraging their participation at general meetings 6.1, 6.2 6.2Provide the information indicated in the Guide to reporting on Principle 6 website, 6.1, 6.2 4.4Provide the information indicated in the Guide to reporting on Principle 4 Principle 5: Make timely and balanced disclosure 5.1Establish and disclose written policies designed to ensure compliance with ASX Listing Rule disclosure requirements and to ensure accountability at a senior executive level for that compliance 5.2Provide the information indicated in the Guide to reporting on Principle 5 Principle 6: Respect the rights of shareholders Comply 7.1 7.1, 7.2 7.2 website, 7.1, 7.2 For personal use only Principle 7: Recognise and manage risk 7.1Establish policies for the oversight and management of material business risks and disclose a summary of those policies 7.2The board should require management to design and implement the risk management and internal control system to manage the company’s material business risks and report to it on whether those risks are being managed effectively and should disclose that management has reported to it as to the effectiveness of the company’s management of its material business risks 7.3The board should disclose whether it has received assurance from the CEO and CFO that the declaration provided in accordance with section 295A of the Corporations Act is founded on a sound system of risk management and internal control which is operating effectively in all material respects in relation to financial reporting risks 7.4Provide the information indicated in the Guide to reporting on Principle 7 Sims Metal Management Annual Report 2014 Reference Principle 8: Remunerate fairly and responsibly 8.1The board should establish a remuneration committee 8.1 8.2The remuneration committee should be structured to consist of a majority of independent directors and an independent chair, and to have at least three members 8.2 8.3Clearly distinguish the structure of non-executive director remuneration from that of executive directors and senior executives 8.4, Remuneration Report 8.4Provide the information indicated in the Guide to reporting on Principle 8 website, 8.1–8.5 3 Corporate Governance 41 For personal use only 42 Directors’ Report Consolidated Income Statements for the year ended 30 June 2014 Consolidated Statements of Comprehensive Income for the year ended 30 June 2014 Consolidated Statements of Financial Position as at 30 June 2014 Consolidated Statements of Changes in Equity for the year ended 30 June 2014 Consolidated Statements of Cash Flows for the year ended 30 June 2014 43 75 76 77 78 79 Notes to the Consolidated Financial Statements 1 2 3 4 5 6 7 8 9 10 11 12 13 14 15 16 17 18 19 20 21 22 23 24 25 26 27 28 29 30 31 32 Summary of significant accounting policies Financial risk management Critical accounting estimates and judgements Loss per share Segment information Revenue Other income and expenses Income taxes Trade and other receivables Inventory Other financial assets and liabilities Property, plant and equipment Goodwill Other intangible assets Trade and other payables Borrowings Provisions Retirement benefit obligations Contributed equity Accumulated deficit and reserves Dividends Contingencies Commitments Share ownership plans Remuneration of auditors Business acquisitions and disposals Subsidiaries Interests in other entities Related party transactions Parent entity financial information Cash flow information Assets/liabilities classified as held for sale Directors’ Declaration Independent auditor’s report to the members of Sims Metal Management Limited Auditor’s Independence Declaration Annual Financial Report Extracts Presented in US Dollars Shareholder Information Five Year Trend Summary 80 92 96 96 97 99 100 102 105 106 106 109 110 112 113 113 114 115 119 120 121 122 122 123 126 127 129 133 135 136 137 138 139 140 141 142 146 147 For personal use only Sims Metal Management Annual Report 2014 Your Directors present their report on the consolidated entity (referred to hereafter as the “Group”) consisting of Sims Metal Management Limited (the “Company”) and the entities it controlled at the end of, or during, the year ended 30 June 2014 (“FY14”). PRINCIPAL ACTIVITIES The principal activities of the Group during the financial year comprised (1) the buying, processing and selling of ferrous and non–ferrous recycled metals and (2) the provision of environmentally responsible solutions for the disposal of post–consumer electronic products, including IT assets recycled for commercial customers. The Group offers fee–for–service business opportunities in the environmentally responsible recycling of negative value materials including refrigerators, electrical and electronic equipment. The Group’s principal activities remain unchanged from the previous financial year. OPERATING AND FINANCIAL REVIEW A review of the operations of the Group during the financial year and the results of those operations are set out in the Chairman and Chief Executive Officer’s Reviews on pages 4 to 7 and the Operational and Financial Review on pages 8 to 30. NAMES AND PARTICULARS OF DIRECTORS The names of the Directors of the Company during the financial year and up to the date of this report together with their qualifications and experience are provided on pages 46 and 47. COMPANY SECRETARIES Frank Moratti B Comm, LLB, MBA (Executive) Mr Moratti was appointed to the position of Company Secretary in 1997. Before joining the Company, he held positions of assistant company secretary/legal counsel in a number of publicly listed companies over a period of some 12 years and, prior to that, worked as a solicitor with a major legal practice. Scott Miller BS, MS, JD, PE Mr Miller was appointed to the position of Company Secretary in 2008. Since joining the Company in 1997, Mr Miller has held positions as legal counsel and manager for environmental affairs for North American operations. Before joining the Company, he held positions at an environmental mediation firm, as an attorney with a major legal practice and as a consulting engineer. DIRECTORS’ MEETINGS The following table shows the actual board and committee meetings held during the financial year and the number of meetings attended by each Director. 6* 6 4 5 6 6 6 6 6 6 6 Risk, Audit & Compliance Committee 7 7 4 Remuneration Committee 5 5 3 4 Finance & Investment Committee Nomination/ Governance Committee 7 7 5 3 7 7 3 Directors’ Report Meetings held G Brunsdon G Claro 1 R Bass 2 N Bobins J DiLacqua G Morris C Renwick H Ridout T Sato J Thompson Board of Directors Safety, Health, Environment & Community Committee 2 6 7 7 7 4 4 4 4 5 5 4 5 3 3 2 7 7 r Claro was appointed to the Board of Directors and to the Finance & Investment Committee, Safety, Health, Environment & Community M Committee and Nomination/Governance Committee on 4 November 2013. 2 M r Bass was appointed to the Board of Directors and the Risk, Audit & Compliance Committee on 10 September 2013. * Includes three face-to-face strategic review sessions. 1 43 DIRECTORS’ REPORT For personal use only DIRECTORS’ INTERESTS As at the date of this report, the interests of the Directors in the shares, options, or performance rights of the Company are set forth below. Shares G Brunsdon R Bass N Bobins G Claro* J DiLacqua G Morris C Renwick H Ridout T Sato J Thompson 22,057 10,600 54,600 – – 40,500 13,144 – – 12,000 * refer to the Remuneration Report for information on options and rights held by Mr Claro. DIVIDENDS Since the end of the financial year, the Directors have determined a final dividend of 10.0 cents per share, 100% franked, will be paid for the year ended 30 June 2014. The Directors have determined that the dividend reinvestment plan will not operate in relation to this dividend. SIGNIFICANT CHANGES IN THE STATE OF AFFAIRS On 8 October 2013, the Company announced the appointment of Mr Galdino Claro as the Group Chief Executive Officer and Managing Director of the Company, effective 4 November 2013. Mr Claro has nearly 30 years of global executive leadership experience in the worldwide metals industry. Most recently, since July 2010, he served as Executive Vice President and Chief Executive Officer of Metals & Minerals at Harsco Corporation, a publicly traded company on the New York Stock Exchange with US$3 billion in revenues. On 6 June 2014, the Company announced that Mr Robert Larry would step down from the position of Group Chief Financial Officer effective 21 August 2014. There were no other significant changes in the state of affairs of the Group during the financial year not otherwise disclosed elsewhere in this report. SIGNIFICANT EVENTS AFTER THE BALANCE SHEET DATE On 23 July 2014, Mr Claro presented a five year strategic plan a copy of which is available on the Company’s website at www.simsmm.com. The Directors are not aware of any items, transactions or events of a material or unusual nature that have arisen since the end of the financial year which will significantly affect, or may significantly affect, the operations of the Group, the results of those operations or the state of affairs of the Group in subsequent financial years. LIKELY DEVELOPMENTS Information as to the likely developments in the operations of the Group is set out in the Chairman and Chief Executive Officer’s Reviews on pages 4 to 7 and the Operational and Financial Review on pages 8 to 30. Further information on likely developments in the operations of the Group and the expected results of operations in subsequent financial years have not been included in this annual financial report because the Directors believe it would be likely to result in unreasonable prejudice to the Group. ENVIRONMENTAL REGULATION The Group is subject to environmental regulations and reporting requirements in Australia as well as other countries in which it operates. The Group has operating licenses and consents in place at each of its operating sites as prescribed by relevant environmental laws and regulations in each respective location and comprehensive environmental management systems and audit procedures to support compliance. Further information on the consolidated entity’s performance in respect of environmental regulation is set out in the Operational and Financial Review on pages 8 to 30 and our Annual Sustainability Report. The Group’s Australian operations are subject to the reporting requirements of both the Energy Efficiency Opportunities Act 2006 (EEO) and the National Greenhouse and Energy Reporting Act 2007 (NGER). The EEO Act requires the Group to assess the energy usage of its Australian operations, including the identification, investigation and evaluation of energy saving opportunities, and to report publicly on the assessments undertaken, including intended actions by the Group. The Group continues to meet its obligations under this Act. 44 For personal use only Sims Metal Management Annual Report 2014 The NGER Act requires the Group to report its annual greenhouse emissions and energy use of its Australian operations. The Group has implemented systems and processes for the collection and calculation of the data required so as to prepare and submit the relevant report to the Greenhouse and Energy Data Officer annually. There have been no significant known breaches of the Group’s license conditions or any environmental regulations to which it is subject. INSURANCE AND INDEMNIFICATION OF OFFICERS During the financial year, the Company had contracts in place insuring all Directors and executives of the Company (and/or any subsidiary companies in which it holds greater than 50% of the voting shares), including Directors in office at the date of this report and those who served on the board during the year, against liabilities that may arise from their positions within the Company and its controlled entities, except where the liabilities arise out of conduct involving a lack of good faith. The Directors have not included details of the nature of the liabilities covered or the amount of the premium paid as such disclosure is prohibited under the terms of the contracts. SHARE OPTION AND RIGHTS Unissued shares As of the date of this report, there are 7,858,336 share options outstanding and 5,322,114 rights outstanding in relation to the Company’s ordinary shares. Refer to Note 24 of the consolidated financial statements for further details of the options and rights outstanding as at 30 June 2014. Option and right holders do not have any right, by virtue of the option or right, to participate in any share issue of the Company. Shares issued as a result of the exercise of options and vesting of rights During the financial year, there were 82,000 ordinary shares issued upon the exercise of share options and 209,934 ordinary shares issued in connection with the vesting of rights. Refer to Note 24 of the consolidated financial statements for further details of shares issued pursuant to share-based awards. Subsequent to the end of the financial year and up to the date of this report, there have been 726 ordinary shares issued in connection with the exercise of share options and 3,112 ordinary shares issued in connection with vesting of rights. NON-AUDIT SERVICES The Company may decide to employ its external auditor (PricewaterhouseCoopers) on assignments additional to their statutory audit duties where the auditor’s expertise and experience with the Company and/or the Group are important. Details of the amounts paid or payable to the auditor for audit and non-audit services provided during the financial year are set out in Note 25 of the consolidated financial statements. The Board has considered the position and, in accordance with advice received from the Risk, Audit & Compliance Committee, is satisfied that the provision of the non-audit services is compatible with the general standard of independence for auditors imposed by the Corporations Act 2001 . The Directors are satisfied that the provision of non-audit services by the auditor, as set forth in Note 25 of the consolidated financial statements, did not compromise the auditor independence requirements of the Corporations Act 2001 for the following reasons: –– none of the services undermine the general principles relating to auditor independence as set out in APES 110 Code of Ethics for Professional Accountants. Directors’ Report –– all non-audit services have been reviewed by the Risk, Audit & Compliance Committee to ensure they do not impact the impartiality and objectivity of the auditor; and 4 A copy of the auditor’s independence declaration as required under section 307C of the Corporations Act 2001 is set out on page 141. ROUNDING OF AMOUNTS The Company is of a kind referred to in Class Order 98/100, issued by the Australian Securities and Investments Commission, relating to the “rounding off” of amounts in the financial statements. Amounts in the financial statements have been rounded off in accordance with that Class Order to the nearest tenth of a million dollars, unless otherwise indicated. 45 DIRECTORS’ REPORT For personal use only BOARD OF DIRECTORS 46 Geoffrey N Brunsdon B Comm (age 56) Chairman and Independent non-executive director Mr Brunsdon was appointed as a director in November 2009, appointed Deputy Chairperson in September 2011 and appointed Chairperson of the Company on 1 March 2012. He is a member of the Risk, Audit & Compliance Committee, the Remuneration Committee and the Finance & Investment Committee. Until June 2009, Mr Brunsdon was Managing Director and Head of Investment Banking of Merrill Lynch International (Australia) Limited. He is Chairman of IPE Limited (since 2004), APN Funds Management Limited (since November 2009), and MetLife Insurance Limited (since April 2011) and a member of the Takeovers Panel. He was a member of the listing committee of the Australian Securities Exchange between 1993 and 1997 and was a director of Sims Group Limited between 1999 and 2007. He is a Fellow of the Institute of Chartered Accountants, a Fellow of the Financial Services Institute of Australia and a Fellow of the Institute of Company Directors. Mr Brunsdon is also a director of several non-profit organisations, including Redkite (supporting families who have children with cancer), the Wentworth Group of Concerned Scientists and Purves Environmental Custodians. Robert J Bass MBA (age 65) Independent non-executive director Mr Bass was appointed as a director on 10 September 2013. He is a member of the Risk, Audit & Compliance Committee. Mr Bass was formerly a partner at Deloitte & Touche from 1982, and Vice Chairman at Deloitte LLP from 2006, until his retirement in June 2012. He practiced at that firm for 39 years and was Lead Client Service Partner responsible for the development, planning, management, administration and delivery of services, including audits of consolidated financial statements to multinational clients in a variety of industries. Mr Bass is currently a director of Groupon Inc (since June 2012) and NewPage Holdings Inc (since December 2012) and is Chairman of the Audit Committee of both companies. He is a graduate of Emory University and received an MBA from Columbia University. He is a Certified Public Accountant, New York and Connecticut, and a member of the American Institute of Certified Public Accountants and Connecticut State Society of Certified Public Accountants. Norman R Bobins BS, MBA (age 71) Independent non-executive director Mr Bobins was appointed as a director in March 2008. He is Chairperson of the Nomination/Governance Committee, and is a member of the Finance & Investment Committee. Mr Bobins was formerly a director of Metal Management, Inc (since 2006). He is the Chairman of Norman Bobins Consulting LLC (since 2008). From May 2007 until October 2007, Mr Bobins was the Chairman of the Board of LaSalle Bank Corporation. From 2002 to 2007, he was President and Chief Executive Officer of LaSalle Bank Corporation. From 2006‑2007, he was President and Chief Executive Officer of ABN AMRO North America. From 2002-2007, Mr Bobins was Senior Executive Vice President at ABN AMRO Bank N.V., the Dutch parent of LaSalle Bank Corporation. He is the Non-Executive Chairman of The PrivateBank and Trust Company. Mr Bobins is also a director of AGL Resources, Inc, AAR CORP, and Aviv REIT, Inc. He earned his BS from the University of Wisconsin and his MBA from the University of Chicago. Galdino Claro B Mech Eng (age 55) Group Chief Executive Officer and Managing Director Mr Claro was appointed Group Chief Executive Officer and Managing Director of the Company on 4 November 2013. He is a member of the Safety, Health, Environment & Community Committee, the Nomination/Governance Committee, and the Finance & Investment Committee. Mr Claro has nearly 30 years of global executive leadership experience in the worldwide metals industry. He served as Executive Vice President and Chief Executive Officer of Metals & Minerals at Harsco Corporation from July 2010 to November 2013. He also held various positions over a twenty year period with Alcoa Inc. Mr Claro has a Mechanical Engineering background. John T DiLacqua MBA (age 62) Independent non-executive director Mr DiLacqua was appointed as a director in September 2011. He is Chairperson of the Finance & Investment Committee, and is a member of the Risk, Audit & Compliance Committee. Mr DiLacqua was formerly a director of Metal Management, Inc (since 2001), and was a director of Sims Metal Management Limited between March and November 2008. He was the Executive Chairman of Envirosource, Inc from May 2004 to December 2004 and had served as President and Chief Executive Officer of Envirosource from January 1999 to May 2004. From October 1997 to December 1998, Mr DiLacqua served as President of the US Ferrous Operations of Philip Metals, Inc, and, prior to that, from May 1994, as the President of Luria Brothers. He is a graduate of Temple University and received an MBA from Carnegie Mellon University. Mr DiLacqua is a Certified Public Accountant. For personal use only Independent non-executive director Sims Metal Management Annual Report 2014 Gerald E Morris BA (age 81) Mr Morris was appointed as a director in March 2008. He is Chairperson of the Risk, Audit & Compliance Committee, and is a member of the Remuneration Committee and the Nomination/Governance Committee. Mr Morris was formerly a director (since 2004) of Metal Management, Inc. He previously served as President and CEO of Intalite International N.V., as Chairman and director of Beacon Trust Company, and as a director of Metals USA, Inc, Rexel, Inc and Tivoli Industries, Inc, and as trustee of the Blanchard Group of Funds. He earned his BA from the University of Connecticut. Mr Morris is a Certified Public Accountant. Christopher J Renwick AM, FAIM, FAIE, FTSE – BA, LLB (age 71) Independent non-executive director Mr Renwick was appointed as a director in June 2007. Mr Renwick is Chairperson of the Remuneration Committee, and is a member of the Safety, Health, Environment & Community Committee and the Nomination/Governance Committee. Mr Renwick was employed with the Rio Tinto Group for over 35 years, rising, in 1997, to Chief Executive, Rio Tinto Iron Ore, a position he held until his retirement in 2004. He has previously served as Chairman and director of Coal and Allied Industries Limited (2004 to 2011), Chairman of the Rio Tinto Aboriginal Fund (2004 to 2011) and director of Downer EDI Limited (2004 to 2010). Mr Renwick is a director of South East Regional Touring Opera Company Limited, a “not-for-profit” public company limited by guarantee, which operates as “Melbourne Opera”. Heather Ridout AO BEc (Hons) (age 60) Independent non-executive director Mrs Ridout was appointed as a director in September 2011. She is a member of the Safety, Health, Environment & Community Committee, the Remuneration Committee, the Risk, Audit & Compliance Committee and the Nomination/Governance Committee. Mrs Ridout was formerly the Chief Executive Officer of the Australian Industry Group from 2004 until her retirement in April 2012. She is a member of the Board of the Reserve Bank of Australia (since December 2011), and is a director of Australian Securities Exchange Limited (since August 2012) and Chair of the AustralianSuper Trustee Board, the largest industry fund in Australia. Mrs Ridout also serves on the Board of the Australian Chamber Orchestra and is also co-Chair of the Australian-Canada Economic Leadership Dialogue. She has an economics degree, with honours, from the University of Sydney. Tamotsu (Tom) Sato BA (age 62) Non-independent non-executive director Directors’ Report Mr Sato was appointed as a director in April 2013. He is Mitsui & Co., Ltd’s nominated non-independent director. Mr Sato is a member of the Finance & Investment Committee and the Safety, Health, Environment & Community Committee. He joined Mitsui in 1975 and has held various positions within that company including Executive Director of Mitsui Coal Holdings (2002-2004) based in Brisbane, Senior Vice President of Mitsui Singapore (2006-2009) and, most recently, since May 2009, President & CEO of Mitsui Raw Materials Development based in New York. 4 James T Thompson BS (age 64) Independent non-executive director Mr Thompson was appointed as a director in November 2009. He is Chairperson of the Safety, Health, Environment & Community Committee, and is a member of the Finance & Investment Committee and the Remuneration Committee. Mr Thompson was, from 2004 until his retirement in 2007, Executive Vice President Commercial for The Mosaic Company, one of the world’s largest fertiliser companies, with sales of US$10 billion and some 8,000 employees, which is publicly traded on the New York Stock Exchange. Prior to that, he was engaged for 30 years in the steel industry from 1974–2004 in various roles at Cargill, Inc of Minnesota, United States, leading to the position of President of Cargill Steel Group from 1996–2004. During that period, Mr Thompson also served for a time as Co-Chairman of the North Star BlueScope Steel joint venture, and was a member of various industry boards, including AISI (American Iron and Steel Institute), SMA (Steel Manufacturers Institute) and MSCI (Metals Service Center Institute). He is currently a director of Hawkins, Inc and serves on the Board of Visitors of the University of Wisconsin School of Education. Mr Thompson has a BS from the University of Wisconsin Madison. 47 DIRECTORS’ REPORT REMUNERATION REPORT REMARKS BY THE CHAIRMAN OF THE REMUNERATION COMMITTEE For personal use only Dear Shareholder, 48 We are pleased to present our Remuneration Report for FY14. Fiscal 2014 proved to be another challenging year for our Company as evidenced by our statutory loss of A$89 million. In recognition of the difficult market conditions in which we operated as a basic materials processor through our scrap metals and e-recycling businesses, the Remuneration Committee administered the Company’s short-term incentive (STI) and long-term incentive (LTI) plans carefully to control remuneration and cost in FY14. It was also a year of change, as we appointed Galdino Claro as our new Group CEO effective 4 November 2013. Mr Claro is repositioning our portfolio of businesses and building a new management team well suited to the execution of the Company’s five year strategic plan announced on 23 July 2014. We have continued to strengthen our executive remuneration framework. Our STI plan now has greater alignment to Group financial performance. In FY14, a financial gateway was introduced into the STI plan, so that a threshold Group return on controlled capital employed (ROCCE) (for the full financial year) must be achieved before any STI payment is awarded to the Group Executives. This will also apply to the Group CEO from FY15. The Group Executives will also continue to have 80% of their target STI based on Group ROCCE, being our key financial measure, as will the Group CEO from FY15. The Regional Executives now have 20% of their STI based on Group ROCCE to encourage collaboration and to drive Group financial performance, with 60% of their target STI based on business unit ROCCE, which is more within their control. Regional Executives must also meet threshold Group and Regional ROCCE gateways before any STI payments are awarded. Furthermore, in order for Executives to receive the 20% of their target STI that is based on individual non-financial measures, a threshold level of ROCCE will need to be achieved. Given the Group CEO’s commencement date with the Company, the Committee determined that a financial measure for the Group CEO in the calculation of his potential STI award for FY14 would be underlying Group EBITDA for the second half of FY14. Enhancements were also made to the LTI plan. An increased portion of an executive’s LTI grant is now delivered as performance rights (80% for the Group CEO and 67% for executives, up from 50%). This further aligns the LTI plan with Australian market practice. As we compete for the majority of our talent and business in the USA, the balance of an executive’s LTI grant is delivered as options, to align the LTI plan with market practice there. A further performance hurdle was placed on the performance rights so that these are now subject to both relative total shareholder return (TSR) and earnings per share (EPS). The inherent absolute share price growth hurdle in options continues to apply. We also removed the re-test mechanism that previously applied to performance rights. We believe that our LTI plan is one of the more rigorous in the market because, in order for awards to fully vest, there needs to be earnings growth, absolute share price growth and superior total shareholder return relative to our peers. We will continue to review and strengthen our remuneration framework in FY15, particularly in respect of the individual nonfinancial measures in the STI plan, more strongly relating pay outcomes with the achievement of the Company’s strategic plan. The following pages outline the actual remuneration outcomes for FY14 in light of Company performance, as well as providing further detail on our executive remuneration framework. We welcome and value your feedback on our executive remuneration practices. Yours sincerely, Christopher Renwick Remuneration Committee Chair [email protected] Sims Metal Management Annual Report 2014 For personal use only The Directors of Sims Metal Management Limited present the Remuneration Report for the Company and the Group for FY14. The information provided in this Remuneration Report has been audited. The Remuneration Report is set out as follows: Section Description A Remuneration snapshot B C D E F G H I Page # 49 •Key Management Personnel (KMP) •Executive remuneration philosophy •Actual remuneration outcomes for FY14 •Outlook for FY15 52 Remuneration governance framework •Use of external remuneration consultants 53 Executive remuneration •Remuneration principles and components •Competitiveness of KMP remuneration •Remuneration mix •Fixed remuneration •At-risk remuneration including the Short-Term Incentive (STI) plan, Long-Term Incentive (LTI) plan and discretionary awards •Securities trading policy Link between ‘at-risk’ remuneration and Company performance Executive statutory remuneration disclosures Executive contracts Non-Executive Directors’ (NED) fees Share-based payment disclosures and equity holdings Other transactions with KMP 63 65 66 68 70 74 A.REMUNERATION SNAPSHOT Key Management Personnel (KMP) Name Position Country Non-Executive Directors Geoffrey N Brunsdon Robert J Bass Norman R Bobins John T DiLacqua Gerald E Morris Christopher J Renwick Heather Ridout Tamotsu (Tom) Sato James T Thompson Chairman and Independent Non-Executive Director Independent Non-Executive Director (commenced 10 September 2013) Independent Non-Executive Director Independent Non-Executive Director Independent Non-Executive Director Independent Non-Executive Director Independent Non-Executive Director Non-Independent Non-Executive Director Independent Non-Executive Director Australia USA USA USA USA Australia Australia Japan USA Group Chief Executive Officer and Managing Director (commenced 4 November 2013) USA President – North America Metals (NAM) Group Chief Financial Officer Managing Director – Australia and New Zealand Metals President – Global Sims Recycling Solutions (SRS) USA USA Australia USA Executives Executive Director and Group CEO Galdino Claro Executives Robert Kelman Robert C Larry Darron McGree Stephen Skurnac 4 Directors’ Report The Remuneration Report is focused on the Company’s KMP, consisting of the below Non-Executive Directors and Executives. Unless otherwise indicated, the KMP were classified as KMP for the entire financial year. 49 DIRECTORS’ REPORT For personal use only Executive remuneration philosophy 50 Our remuneration philosophy is designed to provide remuneration that: –– attracts, motivates and retains the best and brightest of its senior executive, leadership and staff positions; –– drives the Company’s strategic plan; and –– aligns reward opportunities with shareholder interests. Due to our global scale, our remuneration practices take into account local market practice, particularly in the USA, our largest geographic region, where we compete for much of our talent and business. Our executive remuneration framework consists of fixed remuneration, short-term incentives and long-term incentives. Actual remuneration outcomes for FY14 Remuneration component Outcome Fixed remuneration •Our new Group CEO commenced on 4 November 2013 with total fixed remuneration of US$1.15 million per annum. This is 18% lower than that of our previous Group CEO. •Executive fixed remuneration levels were frozen for all existing KMP for FY14. •Steve Skurnac received a pay increase on 1 July 2013 upon taking on the broader responsibilities Short-term incentive (STI) of President, Global SRS and became a KMP as of this date. Mr Skurnac’s new remuneration level was determined in the context of remuneration market data based on industry-related companies of a relative size, footprint and complexity to the Company. •STI payments were significantly lower than target, due to performance against our key financial measure, ROCCE, generally being below threshold. •The Group CEO received 67% of his target STI opportunity (also pro-rated for service). The individual performance goals for the Group CEO, as determined by the Committee, were based on specific goals within five categories – safety, financial (including, given that he commenced with the Company on 4 November 2013, underlying Group EBITDA for the second half of FY14), people and culture, accounting and operational controls, and consolidation of corporate headquarters. •The Executives (excluding the Group CEO) received an STI award ranging from 0% to 117% of their target STI opportunities based on ROCCE and individual performance. ROCCE for the full year was below threshold at the Group level and for all businesses except Australia Metals and New Zealand Metals, which achieved above target, and Europe SRS excluding UK SRS, which achieved above threshold. •The number of employees participating in the STI plan was reduced by 26% Group wide to limit participation to those individuals who could directly influence Company performance. Long-term incentive (LTI) •No performance rights vested during the year as the Company’s TSR performance was below the median against its TSR peer group. •Options vested during the year in accordance with the terms of their grant. •Mr Morris was the only KMP who exercised options during FY14. These options were granted in 2008 by Metal Management Inc (MMI) prior to its merger with the former Sims Group Limited. Neither Mr Morris nor any other NED held any options in the Company at the end of the year. •The number of employees participating in the LTI plan was reduced by 48% Group wide to limit participation to those individuals who could directly influence Company performance. In the context of the above comments, actual remuneration received by Executives during FY14 is set out below. This disclosure is provided on a voluntary basis to provide additional transparency and to clearly demonstrate the strong linkage between ‘at-risk’ pay and Company performance. For personal use only Executives (A$) G Claro 4,5 R Kelman 5 R Larry 5 D McGree S Skurnac 5 Fixed remuneration1 Actual cash bonus 2 949,622 936,045 844,104 763,730 758,455 1,263,742 0 0 884,243 124,741 Target cash bonus 1,251,769 789,171 745,632 727,240 408,186 Actual long‑term incentives 3 0 0 0 11,701 0 Sims Metal Management Annual Report 2014 As seen in the table below, actual incentive pay was significantly lower than target incentive pay. LTI awards were also significantly lower than the amounts that are required to be disclosed in the statutory remuneration table (see Section E). Target long-term Total actual Total target incentives remuneration remuneration 2,503,538 986,464 932,040 727,240 408,186 2,213,364 936,045 844,104 1,659,674 883,196 4,704,929 2,711,680 2,521,776 2,218,210 1,574,827 1. Fixed remuneration includes cash salary, other benefits, pension and superannuation, and annual leave accruals. It is the same as the statutory remuneration disclosures. 2. Actual cash bonus refers to the Executive’s total bonus that was earned in FY14, and will be paid to the Executive in September 2014 following the finalisation of the Company’s audited financial results. These figures are the same as the statutory remuneration disclosures. See note 4 for further details on Mr Claro’s actual cash bonus. 3. Actual LTI refers to options granted in prior years that vested during FY14. The value has been calculated using the closing share price of the Company’s shares on the business day prior to vesting after deducting the exercise price. Executives received no economic value from the options in FY14 as none were exercised. There is no value attributable to performance rights because none vested in FY14. The LTI value is significantly lower than target LTI (determined in the context of the FY14 remuneration mix) and is different to the LTI figures in the statutory remuneration table. This is because the LTI figures in the statutory remuneration table reflect the amortised value of the entire LTI award (that may or may not vest) in accordance with the accounting standards. 4. Mr Claro commenced employment on 4 November 2013. Accordingly, his actual remuneration reflects the period from 4 November 2013 to 30 June 2014 only. The actual and target cash bonus for Mr Claro includes a US$650,000 signing bonus which was paid in July 2014 in accordance with his offer of employment. This signing bonus was to compensate for the cash incentive Mr Claro would have received had he remained with his previous employer. 5. Messrs Claro, Kelman, Larry and Skurnac received their cash payments in United States dollars. Outlook for FY15 While we will continue to strengthen our executive remuneration framework in FY15, we will be revisiting the overall design to ensure that performance measures in our incentive plans are strongly aligned with our key performance drivers and the Company’s 5 year strategic plan advised to the market on 23 July 2014. Specifically, in the STI plan, we will seek to align the STI performance goals to the strategic plan through incorporation of our FY15 budget in the performance goals for our portfolio of businesses. The STI plan will continue to be based 80% on ROCCE and 20% on non-financial and individual goals. In the LTI plan, we will seek to create alignment with the Company’s strategic plan. The table below indicates how our remuneration framework will be aligned to our key performance drivers in FY15. Performance driver How the driver is incorporated into the executive remuneration framework Increasing alignment with shareholders LTI (50% for the Group CEO and between 30% and 38% for Executives) is delivered as equity in the LTI plan •50% of the performance rights in the LTI plan are based on relative TSR •100% of the options are only expected to be exercised if there has been 4 Directors’ Report •A significant portion of the Executives’ total remuneration opportunity absolute share price growth Strong financial performance STI •80% of the Group CEO’s and Group Executives’ STI is based on Group ROCCE •20% of the Regional Executives’ STI is based on Group ROCCE, with 60% being Strong safety performance LTI STI Alignment with 5 year strategic plan STI Strong compliance performance STI •50% of the performance rights in the LTI plan are based on earnings per share •Long-term injury frequency rate and medically-treated injury frequency rate are included in the 20% allocated to non-financial measures in the STI plan •Goals that are directly linked to the execution of the 5 year strategic plan for the financial year will be included in the 20% allocated to non‑financial measures in the STI plan. This encourages a focus on multi‑year performance •Compliance measures in respect of ensuring Sarbanes Oxley level controls will be included in the 20% allocated to non-financial measures in the STI plan based on business unit ROCCE 51 DIRECTORS’ REPORT For personal use only B:REMUNERATION GOVERNANCE FRAMEWORK 52 We have a strong remuneration governance framework, with the Board being ultimately responsible for the Company’s executive remuneration practices. The Remuneration Committee advises the Board in making remuneration decisions. The primary role of the Remuneration Committee (Committee) is to support and advise the Board on the implementation and maintenance of coherent, fair and responsible remuneration policies and practices, which are observed by the Company and which enable it to attract and retain executives and directors who will create value for shareholders. The Committee’s charter, which is available on the Company’s website at www.simsmm.com, provides further information on the role and responsibilities of the Committee. The diagram below illustrates the role of the Board, the Committee, management and external advisors (including remuneration consultants) in relation to remuneration. BOARD (Reviews and approves the recommendations made by the Committee) Final recommendations made by the Committee are reviewed and approved by the Board in respect of: • Executive remuneration philosophy and policies • Executive remuneration and incentive performance packages • Introduction and application of equity-based schemes • The establishment and review of performance goals for the Group CEO • Executive recruitment, retention and termination policies • Non-Executive Directors’ fees and framework R E M U N E R AT I O N C O M M I T T E E (Reviews and makes recommendations to the Board) Members of the Committee during FY14 were: • Christopher J Renwick – Chairman • Geoffrey N Brunsdon – Member • Gerald E Morris – Member • James T Thompson – Member • Heather Ridout – Member The Committee considers recommendations presented by management in developing an executive remuneration philosophy, policy and framework aligned to the Company’s overall strategic direction. Mr Morris is Chairman of the Risk, Audit & Compliance Committee and seeks to ensure that remuneration practices are designed in a risk-aware manner and are consistent with the Company’s overall risk management framework. EX TERNAL REMUNERATION CONSULTANTS Engaged directly by the Committee in areas of: • Executive remuneration benchmarking • Incentive plan design • Guidance on development of TSR peer group • Relative TSR calculation MANAGEMENT (Makes recommendations to the Committee in developing and implementing the remuneration strategy) In addition to the above, in recognition of the value and advantages of having a diversified workforce and consistent with the Company’s Workforce Diversity Policy (a copy of which can be found on the Company’s website at www.simsmm.com), the Committee is responsible for reviewing and approving the measureable objectives for achieving diversity as noted in the Company’s Corporate Governance Statement. Does the Committee use a remuneration consultant? What services did the remuneration consultant provide in FY14? Did the remuneration consultant provide a remuneration recommendation in FY14? What was the fee for the remuneration recommendation? Did the Company pay Mercer any other fees? What arrangements did the Company have in place to ensure that the making of remuneration recommendations was made free from undue influence by the KMP? Is the Board satisfied that the remuneration recommendation was made free from undue influence by the KMP? •Yes. The Committee retains Mercer, a remuneration consultant. •In its capacity as advisor to the Committee, Mercer: –– benchmarked and assessed Executive base salary, annual incentive levels and long‑term incentive levels for the Committee’s consideration as it approves base salary adjustments and sets target incentive opportunities for Executives –– provided guidance on competitive practices with regard to Executive contracts –– valued awards under the LTI plan –– provided guidance on reintroducing EPS into the LTI plan, and the nature of the EPS targets, and –– assessed the Company’s cumulative TSR performance against the TSR peer group. •Yes. During FY14, Mercer provided the Company with a remuneration recommendation as defined under the Corporations Act 2001 (Cth). •The fee for the remuneration recommendation was A$63,216 and an additional fee of A$26,481 was paid to Mercer for the provision of various accounting valuations under the LTI plan. •Yes. Mercer also provided human resources professional development services to management and were paid a fee of A$33,784. •The Committee has implemented protocols in respect of the appointment and use of remuneration consultants to ensure compliance with the Corporations Act 2001 (Cth). •Mr Renwick, Chairman of the Committee, directly engaged Mercer to perform the above services, and Mercer did not provide its report to any member of Company management. •The Committee also had direct access to Mercer during executive sessions (without Company management) throughout FY14. •Mercer has declared to the Committee that their remuneration recommendations were not unduly influenced by any of the Company’s KMP throughout the course of their engagement. •Yes. Based on the protocols followed, and Mercer’s declaration, the Board is satisfied that the remuneration recommendation from Mercer was made free from undue influence by any of the KMP. C:EXECUTIVE REMUNERATION Our executive remuneration framework is heavily skewed towards variable pay to drive Company performance, with 75% of the Group CEO’s target pay, and between 60-69% of target pay for the other Executives, being at-risk, subject to challenging short-term and long-term hurdles. 4 Directors’ Report For personal use only The following table provides details of how the Committee used remuneration consultants during the year. Sims Metal Management Annual Report 2014 Use of external remuneration consultants Remuneration principles and components Sims Metal Management Limited and its joint ventures operate in more than 250 locations across five continents. Given our global scale, it is imperative that the executive remuneration policy and framework reflects the international nature of the Company and the fact that our executives are based throughout the world. As the Company’s success is dependent upon the quality of its people, the primary aim of the Company’s executive remuneration policy is to attract, motivate and retain high calibre executives. To do so, the Company provides executive remuneration packages that are competitive and commensurate with executive responsibilities and accountabilities. The executive remuneration policy also seeks to ensure alignment between the Company’s remuneration philosophy, its strategic plan, and the best interests of its shareholders. In doing this, the Committee seeks to ensure that the policy reflects the global environment through appropriately balancing competitive market practice in the USA, UK and Australia. The framework is continually reviewed by the Committee to ensure best practices are followed. The Company also undertakes an annual remuneration review to determine the total remuneration positioning of its Executives against the market. 53 DIRECTORS’ REPORT For personal use only A snapshot of the Company’s remuneration principles and its components, and how they support the Company’s overall vision, is illustrated in the diagram below. 54 MISSION Our mission is to be the best in class recycler of metals and electronics in all markets we operate. Our industry leadership will be driven by the strengths of our partnership with our suppliers, the excellence of our products and services to our customers, and the attractiveness of our returns to shareholders. R E M U N E R AT I O N P R I N C I P L E S Reward capability, experience and performance against business strategy Provide a competitive reward for contribution to growth in shareholder wealth Provide a clear structure for earning rewards Provide recognition for individual performance contributions in line with the Company’s strategic plan Support the Company’s core values of safety, teamwork, respect, integrity, financial discipline and an entrepreneurial spirit R E M U N E R AT I O N C O M P O N E N T S FIXED REMUNERATION SHORT-TERM INCENTIVE LONG-TERM INCENTIVE What is the purpose of this remuneration component? To be able to attract and retain quality talent. To reward executives for Company, business unit and individual contributions. To retain executives and ensure their interests and rewards are aligned with the longer term interests and rewards of shareholders. How is this remuneration component determined? Based on capability, experience, responsibilities and accountability, commensurate with role. Set with reference to market data against a relevant peer group. Based on financial targets (ROCCE) and individual performance goals (such as safety, environment and sustainability, implementation of the strategic plan, talent management and shareholder and community relations). All equity is subject to continued service. Hurdles are based on relative TSR (40%), earnings per share (40%), and absolute share price (20%) (inherent in the options). Over what period is performance assessed? n/a 12 months. Performance rights have a 3 year performance period. Options vest over 1-3 years, and can be exercised up to the end of Year 7. How is this remuneration component delivered? Annual salary, benefits and pension / superannuation. Cash. Performance rights and options (or phantom options). For personal use only The Committee regularly reviews the competitiveness of KMP target total remuneration to pay levels in a remuneration peer group, with assistance from Mercer. The remuneration peer group includes 15 listed companies (4 Australian-based and 11 USA‑based) that compete with the Company for business and / or executive level talent. The remuneration peer group is comprised of the following companies: Australian listed companies USA listed companies Arrium AK Steel Holding BlueScope Steel Alleghany Technologies Boral Commercial Metals Brambles Masco Sims Metal Management Annual Report 2014 Competitiveness of KMP remuneration Nucor Reliance Steel & Aluminium Republic Services Schnitzer Steel Industries Steel Dynamics USG Waste Management The remuneration peer group differs from the TSR peer group considering size of the companies and the availability of publicly disclosed executive remuneration levels. The Committee looks at each company in the peer group and each component of remuneration – fixed; STI and LTI (and the nature of the hurdles) – to satisfy itself that KMP remuneration is both competitive in the markets in which the Company operates and recruits talent, and can be regarded as reasonable from a shareholder perspective. Given the disparate measures of size in the remuneration peer group, the Committee does not set a target remuneration band. However, based on recent Mercer analysis, the target total remuneration of the Group CEO ($4.6m) is below median and approximates the 25th percentile of remuneration provided to the CEOs within the remuneration peer group. Remuneration mix TOTAL TARGET REMUNERATION MIX GROUP CEO 25% GROUP CFO, PRESIDENT NAM 31% MD, AUSTRALIA AND NEW ZEALAND METALS 34% PRESIDENT GLOBAL SRS 40% FIXED 25% 4 Directors’ Report In line with the Company’s intent to ensure the Executive remuneration framework is aligned to the Company’s performance, a significant portion of an Executive’s remuneration is ‘at-risk’. The following chart sets out the target remuneration mix; that is, fixed remuneration (salary / package), target STI, and LTI for the Executives. 50% 31% 33% 30% STI (at risk) 38% 33% 30% LTI (at risk) 55 DIRECTORS’ REPORT For personal use only Fixed remuneration Fixed remuneration primarily seeks to attract and retain high calibre Executives. It rewards for capability, experience, responsibility and accountability, commensurate with role. Fixed remuneration comprises base salary and benefits: –– Base salary is determined on an individual basis, taking into consideration the individual’s capability, experience, responsibilities and accountability, as well as external market factors and benchmark data. –– Benefits programs vary by market and may include health insurance, life and disability insurance, retirement programs (depending on national government and tax regulations) and automobile allowances. Remuneration packages (including fixed components of base salaries and benefits) are reviewed annually. In reviewing any changes to Executive remuneration, the Committee references individual performance, as well as its competitiveness against the remuneration peer group (described above). There are no guaranteed increases to any components of fixed remuneration for any of the Executives. ‘At-risk’ remuneration The ‘at-risk’ component of remuneration comprises both short-term and long-term incentives. ‘At-risk’ means an absence of certainty regarding the payment of a particular component of remuneration in the event agreed-upon performance hurdles or employment conditions are not met during the performance period. Details on each of these Plans are outlined below. STI Plan Key developments in FY14: –– The new Group CEO has a target STI opportunity of 100% of fixed remuneration (reduced from 130% of fixed remuneration for the previous Group CEO). –– A financial gateway was introduced into the STI plan, meaning that for all Executives (including the Group CEO from FY15) a threshold level of financial performance (Group / business unit ROCCE) needs to be achieved before any STI payments are made. This provides greater alignment of STI payments to Company financial performance. –– All Executives now have a portion of their STI based on Group ROCCE. This encourages collaboration and provides an increased focus on Group results. –– The number of employees participating in the STI plan was reduced by 26% Group wide to limit participation to those individuals who could directly influence Company performance. Executives are eligible to participate in the Company’s STI plan. The Committee believes that the STI plan is a key motivator to drive alignment with Company strategy and values, by rewarding for a mix of Company, business unit and individual contributions. The table below summarises the key aspects of the STI plan. What is the STI plan? •Under the STI plan, eligible employees have an opportunity to earn an annual cash-based incentive based on the achievement of pre-defined financial (ROCCE) targets and individual goals over the financial year. •Company, business unit and individual goals are set on an annual basis, to align with achievement of the Company’s financial, business, and strategic priorities. What is ROCCE and why is it used? •ROCCE is an acronym that means return on controlled capital employed which is calculated as profit divided by funds deployed: –– Profit in the numerator refers to earnings before interest and taxes which the Committee believes represents ordinary earnings within the influence of management. –– Controlled capital employed in the denominator is total funds used by management in the business and represents the average balances of assets throughout the financial year to generate ordinary earnings. •ROCCE rewards investment decisions that deliver higher returns (efficient use of capital) rather than just increased profits. •Debt capital cannot be used by management to manipulate higher net asset returns since debt is not subtracted in determining the funds employed in the denominator. •For these reasons ROCCE is selected as the most appropriate measure of management’s success in delivering shareholder value. •ROCCE is subject to adjustments as approved at the Committee’s discretion. 56 What is the weighting between Group, business unit and individual performance goals? What are the Group and business unit measures and why were they chosen? What are the individual goals and why were they chosen? •The STI is determined by reference to three hurdles: –– Threshold –– Target –– Maximum •For FY14, the threshold was determined by reference to the greater of the budget or ROCCE target. For FY14, the threshold was 85% of target. At threshold, a portion of target STI is paid depending on an individual’s position and this increases in a linear fashion to 100% at target. STI payments as they relate to individual performance goals cannot be paid unless the ROCCE threshold performance is reached. •The STI target opportunity is 100% of fixed remuneration for the Group CEO, and ranges from 75% to 100% of fixed remuneration for Executives. •The actual STI award can range from a minimum of nil to a maximum of 200% of the target opportunity for all Executives (including the Group CEO) depending upon performance achieved against pre-defined goals. •In FY14, a financial gateway was introduced into the STI plan. This means that a financial threshold must be achieved before any STI payment is made: –– For the Group Executives, and for the Group CEO going forward in FY15, the financial gateway is threshold Group ROCCE (for the full financial year), which must be achieved before any of the payment is awarded. –– For Regional Executives, the Group ROCCE threshold must be achieved before any of the Group financial component is awarded. The business unit ROCCE threshold must be achieved before any payment can be made against the business unit ROCCE or individual goals. •Introducing a financial gateway creates stronger alignment between STI payments and Company financial performance. •Once the financial gateway is achieved, the STI plan rewards eligible employees for both financial and individual goals. The below table shows the weight attributable to each STI measure. Financial measures Position Individual goals Group ROCCE Business unit ROCCE (subject to ROCCE threshold) 80% 80% 20% N/A N/A 60% 20% 20% 20% Group CEO (from FY15) Group Executives Regional Executives •The Group CEO and Group Executives have 80% of their STI dependent upon Group ROCCE. •The Regional Executives have 60% of their STI based on business unit ROCCE, creating strong line 4 •ROCCE was chosen to represent 80% of the STI measures because it is the Company’s key Directors’ Report For personal use only What is the financial gateway? Sims Metal Management Annual Report 2014 What is the range of STI opportunity? of sight to the level of ROCCE that they can influence. 20% of their STI is based on Group ROCCE to encourage collaboration at the Group level and a focus on Group results. financial measure. See above for further information on ROCCE. •Individual non-financial goals are set in several key performance areas focusing on individual initiatives that are critical to the overall success of the Company and the execution of the Company’s 5 year strategic plan. •For the Group CEO, the Committee established for FY14 a matrix of approximately 20 specific criteria summarised into five categories – safety (reflecting Long-Term Injury Frequency Rate and Medically-Treated Injury Frequency Rate), financial results, people and culture (including succession planning and talent management), accounting and operational controls, and consolidation of corporate headquarters. •For the other Executives, the individual goals may include: Individual goals Description Safety, Health, Environment and Community (SHEC) –– Reduction in critical safety incident metrics (i.e. Long‑Term Injury Frequency Rate and Medically-Treated Injury Frequency Rate) and environmental incidents Compliance Strategic measures Talent management –– Increase in community involvement activity –– Ensure Sarbanes-Oxley level control environment –– Achievement of critical initiatives in support of the Company’s 5 year strategic plan –– This includes measures such as succession planning (eg identifying 1-3 year succession candidates) and management development (eg addressing talent gaps identified during the succession planning process) 57 For personal use only DIRECTORS’ REPORT 58 Why aren’t the specific performance targets disclosed? How are the performance measures determined? The Committee understands the desire for greater transparency of specific targets. However, given the Company’s size and position in the industry, the Company believes disclosing precise financial / individual goals would put it at a competitive disadvantage due to commercial sensitivity. •The financial hurdles are determined by referencing the Company’s current year budget and cost of capital in consideration of the current economic cycle. •The individual goals are determined taking into consideration the areas of specific focus by the How is performance assessed? Group CEO and Executives to support the delivery of the Company’s 5 year strategic plan. Assessing Company performance: •First, the financial gateway of Group ROCCE / business unit ROCCE is assessed. If the financial gateway is not met, there are no payments made under the STI plan. •Second, if the financial gateway is met, payment is then determined by reference to ROCCE and individual goals. Once the threshold hurdle is met, awards against the ROCCE targets are linear in calculation until the maximum hurdle is reached. •Actual performance against the financial targets is set out in Section D. Assessing individual performance •An individual’s performance is rated on a scale of 0 to 4. Participants must receive a weighted average rating of at least 2.0 (meets expectations) in order to receive target payment based on the individual performance component. A rating below 1.75 results in no award with regard to the individual performance component. •The Group CEO’s performance is assessed by the Committee and a recommended payment Does the Board have discretion? How is the STI delivered? Why is there no STI deferral and clawback? is approved by the Board. Each Executive’s performance is assessed by the Group CEO, and recommended payments are considered and, if appropriate, approved by the Committee. •The Board maintains full discretion over the level of any STI awards paid to the Group CEO and Executives. •The STI is delivered as cash. Any payments are made in September following the finalisation of the Company’s audited financial results. •During FY14, the Committee considered the introduction of STI deferral for the Group CEO and Executives. However, given the Group CEO and Executives have a meaningful weighting on the LTI in their remuneration mix (ranging from 30% to 50%), the Committee concluded that it was not necessary at this time to introduce STI deferral for shareholder alignment or retention purposes. •The Company currently does not have a policy that allows for the clawback of STI payments. What are the termination provisions? The Committee recognises that the clawback of STI payments may be appropriate in certain circumstances and the Company may consider introducing a clawback policy in the future. •A voluntary termination prior to the last calendar day of the fiscal year will result in no STI being paid for the year unless the Committee determines otherwise. Upon a qualifying cessation (i.e. generally, termination due to death, permanent disability, redundancy, or in other circumstances determined at the discretion of the Board), STI performance for the relevant period will be assessed and paid. See Section F for further information on the Group CEO’s entitlement to any STI on termination. •No STI payments will be made in the case of termination for cause. Sims Metal Management Annual Report 2014 LTI Plan For personal use only Key developments in FY14: –– An increased portion of the LTI grant is delivered as performance rights (rights) subject to performance hurdles (80% for the Group CEO and 67% for other Executives, up from 50%). The remaining portion of the LTI grant is delivered as options, where rewards are only delivered if there has been absolute share price growth. –– EPS was introduced as a secondary performance hurdle on the rights (along with relative TSR), to focus Executives on earnings and relative shareholder value creation. –– The ability to re-test was removed from rights granted from FY14. –– The number of employees participating in the LTI plan was reduced by 48% Group wide to limit the participation to those individuals who could directly influence Company performance. The Board believes that this new structure adds further rigour to the LTI plan and is more aligned with shareholder expectations and Australian market practice. The LTI plan seeks to be competitive across the Company’s key geographical areas, being the USA, UK and Australia. Accordingly, a portion of a grant under the LTI plan is based on rights subject to relative TSR and EPS (consistent with Australian market practice) and a portion is based on options which an Executive would only be expected to exercise, and realise the rewards of, if there has been absolute share price growth (consistent with USA market practice). The Company believes that the LTI plan is one of the more rigorous in the market because Executives only receive full LTI vesting if there has been earnings growth, absolute share price growth, and superior relative total shareholder returns. Both rights and options are also subject to continued service. The diagram below outlines the key characteristics of the LTI plan: Performance rights – Constitutes 80% of the Group CEO LTI award and 67% of the Executive LTI award. – 50% subject to relative TSR, 50% subject to EPS. All rights are based on continued service. 100% YEAR 0 1 2 3 Options / phantom options – Constitutes 20% of the Group CEO LTI award and 33% of the Executive LTI award. – 100% based on absolute share price growth and continued service. 4 Directors’ Report 33% 33% 33% YEAR 0 1 2 3 7 Vesting period. Note that the options vest on the last business day of August at the end of the relevant vesting period. Exercise period. 59 DIRECTORS’ REPORT For personal use only What is the purpose of the LTI plan? What is the frequency and timing of the awards? What instruments are offered under the LTI plan? •The LTI plan incentivises Executives to achieve earnings, share price and relative total shareholder return targets over a 1-3 year period (80% of the Group CEO’s grant and 2/3 of the other Executives’ grants are not eligible for vesting until the third year). Executive rewards under the LTI plan are aligned with the shareholder experience as the ultimate reward an Executive receives is dependent upon the Company’s share price. •The Company’s shareholders approved an LTI award for the Group CEO at the Company’s 2013 Annual General Meeting (AGM). In conjunction with the AGM, the Committee approved and granted LTI awards for the Executives. •Awards are typically made on an annual basis. The table below provides further information on the three instruments: Instrument Description Performance rights •A performance right is a contractual right to acquire an ordinary share Options for nil consideration if specified performance conditions are met. All the Executives received performance rights. •An option is a contract that gives the holder the right, but not the obligation, to acquire an ordinary share at a fixed price over a specified period of time. In respect of option grants prior to FY14, USA participants have their options settled in American Depositary Shares (ADSs) unless otherwise determined by the Board. •Options reward Executives for absolute share price performance Phantom options because the options only have value if the Company’s share price exceeds the exercise price at the end of the vesting period. All the Executives, other than Mr McGree, received options. •Phantom options operate in the same manner as options; however, they are cash-settled rather than equity-settled. Accordingly, rather than receiving an ordinary share in the Company upon exercise, the Executive receives the equivalent value in cash. •Because of its differing securities laws and taxation treatments, phantom options have been offered to participants in Australia since 1 July 2010. Mr McGree, given he is resident in Australia, is the only Executive who receives phantom options. Why are options included as part of the LTI plan? •Options are a small component of the LTI award, representing 20% of the LTI opportunity for the Group CEO and 33% of the LTI opportunity for the Executives. •Options are included in the LTI plan because it is critical that the Company, in light of the What is the target and maximum LTI opportunity? geographic spread of its operations and talent pool, has a globally competitive remuneration framework. While the grant of rights subject to relative TSR and EPS reflects Australian competitive market practice, the grant of options subject to vesting over a 1-3 year period reflects competitive USA market practice. If options were not included as part of the LTI plan, there is a risk that the Company would not be able to attract quality talent in the USA, its largest operating jurisdiction. •The target LTI opportunity is 200% of fixed remuneration for the Group CEO and ranges between 75% and 125% of fixed remuneration for Executives. •The maximum LTI opportunity is dependent on the number of rights that vest, the number of options that are exercised, and the Company’s share price at the vesting / exercise date. How is the number of LTI awards determined? •The number of rights and options granted is determined based on the fair value of the rights and options on the date of approval by the Committee. The fair value of rights is calculated by Mercer for the Committee using a Black-Scholes, Binomial or Monte Carlo simulation option pricing model as appropriate. •The Company uses a discounted fair value approach in determining the size of LTI grants to be consistent with the grant date fair value used for expensing and to reflect the degree of difficulty in goal achievement. This method also considers the approach used by Mercer in obtaining competitive data from the Company’s Australian remuneration peer group companies, where Mercer applied discounts to peer company target LTI values to reflect the risk of forfeiture from performing below levels required to receive full target payouts. •As a result of the discounts, market LTIs for the Australian peer companies that are reviewed by the Committee are reported at much lower than target levels. The comparable adjustment for the Company is determined at grant using the fair value approach to determining the number of target shares based on the target dollar value. 60 Rationale and comments Relative TSR (50% of performance rights based on value) •The relative TSR hurdle ensures •TSR performance is measured over a three-year period. For grants made in FY14 this is from 1 July 2013 through to 30 June 2016. •The peer group is: •The peer group was chosen as Peer companies AK Steel Alcoa Allegheny Technologies ArcelorMittal Arrium BlueScope Steel Commercial Metals Gerdau that Executives are only rewarded when the Company’s TSR is at least equivalent to the median company in a peer group. Nucor POSCO Reliance Steel Schnitzer Steel Steel Dynamics Tokyo Steel U.S. Steel •The vesting schedule is: TSR growth relative to the peer group Proportion of TSR grant vesting Less than 50th percentile 50th percentile 50th percentile to 75th percentile 75th percentile or higher 0% 50% it reflects companies that are comparable to the Company in terms of industry, footprint and complexity. •The use of relative TSR is common market practice in Australia. •Re-testing has been removed following consideration of shareholder and proxy adviser feedback, and to further align the LTI plan with common market practice in Australia. Pro-rata straight line 100% •Re-testing was removed from LTI grants commencing in FY14. EPS (50% of performance rights based on value) •EPS performance is measured over a three-year period based on statutory EPS. For grants made in FY14 this is from FY14 through to FY16. •The vesting schedule is: Cumulative EPS growth Proportion of EPS grant vesting Less than $2.00 $2.00 $2.00 to $3.00 $3.00 or higher 0% 50% Pro-rata straight line 100% Absolute share price growth (100% of options) •Options have an inherent absolute share price growth hurdle, being the exercise price. This is because the Company’s share price must increase and exceed the exercise price at the end of the vesting period for the options to deliver value to participants. •EPS was chosen as a hurdle because it is consistent with the Committee’s goal of aligning management incentives with a reasonable level of net income for shareholders. •The use of EPS is common market practice in Australia. •The EPS hurdle rates were determined by the Committee to represent earnings over a 3 year vesting schedule that would be rigorous in prevailing economic conditions. 4 Directors’ Report For personal use only Performance measure Sims Metal Management Annual Report 2014 What are the performance measures and why were they chosen? •Options reward absolute growth in shareholder wealth. •The use of options is common market practice in the USA, where the Company competes for much of its talent and business. •The exercise price of options is set at grant, and is equal •The tiered vesting schedule over to the average closing share price for the five days preceding the grant date 1 . 1-3 years reflects common market practice in the USA. •The options vest in three equal instalments over a three-year period. Specifically, for grants made in FY14, each instalment vests on the last business day of August, as follows: –– One-third in 2014, –– One-third in 2015, and –– One-third in 2016. •Options expire seven years after the date of grant. 61 For personal use only DIRECTORS’ REPORT 62 Do participants receive dividends? •Holders of rights and options are not entitled to dividends over the term of the relevant vesting Treatment of awards on termination of employment •As all instruments are subject to a continuous service provision, where a participant resigns, period (and in the case of options, until exercised). or is terminated for cause, his or her awards are forfeited. •Where termination of employment is the result of a qualifying cessation (i.e. generally death, permanent disablement, redundancy, or in other circumstances at the discretion of the Board), a participant will be entitled to his or her unvested awards subject to any performance conditions, in accordance with the original vesting schedule. •Any unvested rights held by an eligible terminated participant will be tested at the end of the How are awards treated on a change of control? relevant performance period. Any unvested awards will lapse at the end of the relevant performance period. In respect of the Group CEO’s entitlement to any continual vesting under the LTI plan on termination, see further Section F. •The Board has the discretion to immediately vest the rights and options prior to their vesting date if there is a change of control event. •The rights and options will immediately vest in the event that a takeover bid of the Company is recommended by the Board, or a scheme of arrangement concerning the Company, which would have a similar effect to a full takeover bid, is approved by the Company’s shareholders. 1 For USA based Executives, option awards are not Incentive Stock Options for the purposes of section 422 of the United States Internal Revenue Code. Guidelines for approval of Discretionary Awards The guidelines for approval authority limits for individual discretionary cash awards and aggregate discretionary cash and / or equity awards are: –– Individual awards: Any individual discretionary cash and / or equity award in excess of US$250,000 must be presented to the Committee for approval. This is a reduction in the prior threshold of US$500,000. –– Aggregate awards: If the aggregate sum of the cash and / or equity award per occurrence is in excess of the Group CEO Discretionary Capital Expenditure authority (currently US$1,000,000), then it must be presented to the Committee for approval. All discretionary awards that are approved by the Group CEO are subsequently presented to the Committee for ratification. Securities Trading Policy The trading of securities issued to participants pursuant to the LTI plan is subject to, and conditional upon, compliance with the terms of the Company’s policy titled 'Dealings in Sims Metal Management Limited Securities' (a copy of which is available on the Company’s website at www.simsmm.com). Executives are prohibited from entering into any hedging arrangements over unvested awards under the LTI plan. The Company would consider a breach of the Securities Trading Policy as serious misconduct, which may lead to disciplinary action up to and including dismissal. For personal use only Outlined below is the Company’s performance against key metrics over the past five fiscal years. Fiscal Year 2 2013 1,2 2014 1 (Loss)/Profit Before Interest and Tax (A$m) Diluted EPS (cents) Return on Shareholders’ Equity Total dividends (cents) Share price at 30 June A$ 1 Sims Metal Management Annual Report 2014 D:LINK BETWEEN ‘AT-RISK’ REMUNERATION AND COMPANY PERFORMANCE (470.4) (228.6) (24.2%) 0.0 8.26 (27.6) (43.5) (4.9%) 10.0 9.68 2012 2 2011 2010 (624.0) (302.7) (27.3%) 20.0 9.61 293.1 90.9 6.4% 47.0 17.65 198.3 61.8 3.7% 33.0 17.11 FY14, FY13 and FY12 reflect goodwill and other intangible impairment charges of A$28.5 million, A$304.4 million and A$675.6 million respectively. Previously reported amounts have been restated. See Note 1(d) of the financial report. Linkage of STI outcomes to Company performance The Group CEO commenced with the Company on 4 November 2013. One of his financial measures, as determined by the Committee, was underlying Group EBITDA for the second half of FY14. He achieved above threshold with respect to this financial measure. The Group Executives have 80% of their target STI based on Group ROCCE, being Profit Before Interest and Tax (PBIT) divided by Average Controlled Capital Employed. The Regional Executives have 20% of their target STI based on Group ROCCE, with 60% based on business unit ROCCE. The remaining percentage of the STI for the Group CEO and Executives is based on individual performance goals (with a threshold of ROCCE required to be achieved before any payments are made). The table below outlines FY14 Group and business unit performance against the STI ROCCE targets (underlying Group EBITDA for the Group CEO). Below threshold performance as indicated resulted in no payout. Group/business unit R Kelman R Larry D McGree S Skurnac Group (full FY14) North America Metals Group (second half of FY14) G Claro UK SRS Europe SRS (excluding UK SRS) Australia Metals New Zealand Metals Above threshold 4 Directors’ Report North America SRS Below threshold Financial performance Above target The table below outlines the proportion of the target STI that was earned and forfeited. Name G Claro 1 R Kelman R Larry D McGree S Skurnac 1 Target STI opportunity (% fixed remuneration) 100% 100% 100% 100% 75% Proportion of target Proportion of target STI earned during FY14 STI forfeited during FY14 67% 0% 0% 118% 31% 33% 100% 100% 0% 69% Mr Claro commenced employment on 4 November 2013. The 100% of fixed remuneration STI opportunity represents his annual target STI opportunity, and the 67% earned reflects Mr Claro’s achievement against his target. Mr Claro’s actual STI was pro-rated for the period of time served in the performance year. 63 DIRECTORS’ REPORT For personal use only Linkage of LTI outcomes to Company performance 64 The LTI plan is based on relative TSR, EPS and absolute share price growth. Relative TSR (hurdle for 50% of the rights based on value) The TSR graph below compares the Company’s (ASX: SGM) TSR against the peer group (as referenced above) for the five‑year period ending 30 June 2014. TSR is the return to shareholders provided by share price appreciation plus dividends (which are assumed to be reinvested in the Company’s shares), expressed as a percentage of the share price at the beginning of the measurement period adjusted, where appropriate, for bonus issues, capital consolidation or equivalents. CUMULATIVE TOTAL SHAREHOLDER RETURN SGM AGAINST THE COMPARATOR GROUP (EXCLUDING SGM) 60.00% 40.00% 20.00% 0.00% -20.00% -40.00% -60.00% -80.00% 30-JUN-2009 30-JUN-2010 30-JUN-2011 SGM 30-JUN-2012 30-JUN-2013 30-JUN-2014 COMPARATOR GROUP As the Company’s TSR has been below the median against its peer group of companies, there has been no vesting under the LTI plan against the relative TSR hurdle since FY11. The table below outlines the status of the LTI grants that were outstanding as of 1 July 2014: TSR Grant Status FY09 FY10 FY11 FY12-FY14 100% forfeited on 23 August 2013 100% forfeited on 22 August 2014 No vesting as of 30 June 2014. Final re-test on 30 June 2015 Not yet eligible for testing Earnings per share (hurdle for 50% of the rights based on value) In FY14, an EPS hurdle was re-introduced into the LTI plan. The first time that these rights will be eligible to vest based on EPS performance will be in FY16. Including an EPS hurdle in the LTI plan is consistent with our goal to align management incentive with a reasonable level of net income for shareholders. Absolute share price growth (hurdle for 100% of the options and phantom options) Using options as a small part of the LTI grant is aligned to Company performance as it focuses Executives on absolute share price growth. This is because Executives only receive rewards from the options if the Company’s share price increases above the option exercise price. Options create the strongest alignment to the shareholder experience because Executives only receive rewards if shareholders have similarly benefited. Mr Morris was the only KMP who exercised options during FY14. These options were over ADSs in the Company and were granted by MMI prior to its merger with the former Sims Group Limited in 2008. Neither Mr Morris nor any other NED holds any options in the Company. For personal use only Cash 1,263,742 – 120,000 – – 884,243 264,753 124,741 Cash bonus 2 11 10 9 8 7 6 5 4 3 2 62,180 26,412 30,342 33,337 28,778 25,000 33,830 35,424 – 56,828 – 31,476 182,353 181,254 – 100,339 – 23,952 541,135 250,090 – 4,868 – – 33,873 78,512 5,442 5,442 4,868 5,442 4,868 12,105 63,908 5,442 Pension and Other longsuperannuation term benefits 165,264 120,4628 33,980 65,135 69,252 11,490 22,567 178,784 8 Other benefits 3 Post-employment benefits – – – – 791,336 – – – – 791,336 9 – – – – termination benefits 4 – 6,855,231 – (476,441) 3,261,293 8,197,495 904,954 751,311 639,792 770,342 741,083 590,173 437,830 244,513 Share-based payments 5 – 8,970,987 – (28,106) 10,611,184 13,529,951 3,123,760 1,692,798 1,534,854 2,411,224 1,510,918 2,250,251 1,541,298 1,133,151 Total Cash salary includes amounts sacrificed in lieu of other benefits at the discretion of the individual. Cash bonus amounts for FY14 and FY13 reflect the amounts accrued for all Executives under the FY14 and FY13 STI plans respectively. In accordance with the Group CEO’s offer of employment, he received a US$650,000 signing bonus in July 2014. This signing bonus was designed to compensate for the cash incentive Mr Claro would have received had he remained with his previous employer. Other short-term benefits include auto allowances, health and life insurance benefits, amounts accrued for annual leave during the period and personal security payments (for Mr Dienst in FY13). For USA employees, it also includes a Paid Time Off policy which includes a carry-over feature of up to twice the annual entitlement. In lieu of “other benefits” as provided by the Group CEO’s employment agreement, Mr Claro received a prorated payment of US$100,000 for FY14. Other long-term benefits include amounts accrued for cash-based long-term incentive plans, long-service leave (for Mr McGree) and deferred compensation plans (for Messrs Claro, Kelman, Larry, Skurnac and Dienst). Share-based payments represent the accounting expense (as computed pursuant to AASB 2 (IFRS 2), ‘Share-based Payments’) recognised by the Company for share-based awards. Mr Claro commenced on 4 November 2013. Mr Claro’s FY14 remuneration disclosed above reflects his remuneration for the period 4 November 2013 to 30 June 2014. Messrs Claro, Kelman, Larry, Skurnac and Dienst received their cash payments in United States dollars. Mr Davy received his cash payment in FY13 in pounds sterling. Mr Kelman was seconded to the UK on 1 August 2014. Other short-term benefits include benefits associated with his Secondment Agreement such as relocation, home finding, child’s tuition etc. Mr Skumac was seconded to the UK on 1 July 2013. Other short-term benefits include benefits associated with his Secondment Agreement such as transportation to the UK, house hunting expenses, relocation, housing allowance, etc. Mr Larry’s termination benefit is comprised primarily of 12 month’s severance, Company paid health insurance and executive outplacement services. As Mr Skurnac was appointed a KMP in FY14, his FY13 data is not presented. Mr Davy left the Company on 19 March 2013. Mr Davy’s 2013 remuneration disclosed above reflects his remuneration for the period 1 July 2012 to 19 March 2013. Mr Davy did not receive any termination benefits. Directors’ Report 1 Former Executives (including the former Executive Director and Group CEO) D Dienst7 USA 2014 – – 2013 1,363,061 590,660 G Davy 7, 11 UK 2014 – – 2013 392,907 – Total 2014 3,528,468 2,272,726 2013 3,847,187 975,413 (A$) Location Year salary1 Senior Executives (including the Executive Director and Group CEO) USA 2014 722,178 G Claro 6,7 R Kelman 7 USA 2014 789,171 2013 705,872 USA 2014 745,632 R Larry 7 2013 666,937 D McGree Australia 2014 727,240 2013 718,410 S Skurnac 7, 10 USA 2014 544,247 FISCAL Short-term benefits Certain Executives (as disclosed below) are not residents of Australia. Their respective remuneration paid in foreign currency has been converted to Australian dollars at an average exchange rate over the year. Fixed remuneration for the existing KMP was frozen in FY14. Accordingly, any change in cash salary is due to exchange rate movements (or in the case of Mr McGree, a change in the mix between his cash salary and superannuation). E.EXECUTIVE STATUTORY REMUNERATION DISCLOSURES Sims Metal Management Annual Report 2014 4 65 DIRECTORS’ REPORT For personal use only Fixed and actual ‘at-risk’ remuneration for FY14 Outlined below is the percentage of the Executives’ FY14 remuneration that was fixed and ‘at-risk’ based upon the statutory remuneration table. The percentage of their remuneration that consisted of rights and options is also disclosed. Fixed Remuneration % Executives G Claro R Kelman R Larry D McGree S Skurnac 1 30% 55% 68% 34% 67% ‘At-Risk’ Remuneration % Remuneration consisting of rights % Remuneration consisting of options % 24% 23% 17% 13% 13% 5% 22% 15% 13% 9% 70% 1 45% 32% 66% 33% This includes 23% relating to Mr Claro’s sign-on bonus. This bonus is classified as “at-risk” because there was a service condition imposed on the bonus being that Mr Claro was required to remain in employment until 15 July 2014 to receive the bonus. F: EXECUTIVE CONTRACTS Executive Director and Group CEO The key terms of Mr Claro’s employment contract are: Commencement date Contract duration Notice period from the Company Notice period from the Executive 4 November 2013 Ongoing 3 months prior notice in writing 3 months prior notice in writing Termination provisions Mr Claro’s employment may be terminated immediately by the Company for cause, or by either party for convenience, or by Mr Claro for good reason, each term as defined in the contract. Signing incentives: Mr Claro was awarded one-off signing incentives, comprised of a cash bonus of US$650,000, that was paid on 17 July 2014, and 116,505 Restricted Stock Units (RSUs), equating to a value of US$1 million, that were granted on 15 November 2013 following shareholder approval. The signing bonus and RSUs grant were designed to compensate Mr Claro for the cash incentive he would have received had he remained with his previous employer. Termination of employment: If Mr Claro’s employment is terminated by the Company for convenience on 3 months’ written notice, then Mr Claro will be entitled to: (a) a Severance Payment (see below); (b) a pro-rata STI in respect of the performance year in which the termination occurs and based on the actual performance results of the Group for that year (Pro-Rata Bonus), unless the Board determines otherwise acting reasonably having regard to the performance of Mr Claro over the preceding years; (c) continued vesting of any equity awards under the LTI plan (subject to any performance hurdles) granted to him before termination (Continued Equity Award Vesting), unless the Board determines otherwise as above; (d) any accrued but unpaid remuneration, accrued but untaken holiday leave (subject to Company policy) and reimbursement for incurred expenses (Accrued Benefits); and (e) up to 12 months of Company paid health insurance premiums (Insurance). If Mr Claro terminates his employment for good reason, then he will be entitled to the Severance Payment, Pro-Rata Bonus, Continued Equity Award Vesting, Accrued Benefits, and the Insurance. If his employment is terminated on the death or permanent disablement of Mr Claro, or in other circumstances determined at the discretion of the Board, then Mr Claro (or his beneficiary or legal representative) will be entitled to the Pro-Rata Bonus, Continued Equity Award Vesting and, other than on death, the Insurance. If his employment is terminated by the Company for Cause, or if Mr Claro terminates for convenience on 3 months’ written notice, then Mr Claro is only entitled to the Accrued Benefits. Generally, as approved by shareholders on 14 November 2013, a Severance Payment is equal to Mr Claro’s final year’s total fixed remuneration. However, if termination occurs prior to 4 November 2014, then the severance payment will be US$1.15 million and pro-rated based on the proportion that the number of days employed bears to 365 days. Change of control: A change of control, as defined in the contract, of the Company, may allow Mr Claro to terminate his employment for good reason. 66 D McGree R Larry R Kelman and S Skurnac Name with the Company ended on 21 August 2014; however, he remains available to the Company in a consulting capacity through to August 2015 •Ongoing contract •Mr Larry’s employment ongoing contracts effective 1 July 2014 •Contract expired on 30 June 2012 and was allowed to automatically renew through 30 June 2014 in accordance with the terms of the agreement •The executives signed employed pursuant to a contract during FY14 •The executives were not Contract duration 12 months prior notice in writing 30 days prior notice in writing 3 months prior notice in writing Notice period from the Company The key terms of the Executives’ employment contracts are: 3 months prior notice in writing 30 days prior notice in writing 3 months prior notice in writing Notice period from the Executive in lieu, or a benefit calculated by reference to the Sims Group Redundancy Policy up to a maximum of 18 months total fixed remuneration plus most recent STI award, depending upon years of service Change of control: Entitled to a payment equivalent to six months total fixed remuneration if he remains in the employ of the Company six months after a takeover of the Company (or if he is terminated within six months of such a takeover) •12 months total fixed remuneration or payment in lieu •In the event of redundancy, entitled to the greater of 12 months’ notice or payment Termination: Mr Larry was entitled to the above termination benefits when his employment ended on 21 August 2014 •Up to 12 months of Company paid health insurance premiums accordance with their original vesting schedule •12 months base salary •All LTI plan awards continue to vest (subject to any performance conditions) in Termination: Change of control: The executives may be allowed to terminate for good reason Termination: The termination provisions are broadly the same as in Mr Claro’s contract described above, with certain entitlements on termination subject to shareholder approval or otherwise the maximum that can be paid in accordance with the Corporations Act 2001 (Cth) Termination provisions (other than for cause) and change of control provisions For personal use only Directors’ Report Executives Sims Metal Management Annual Report 2014 4 67 DIRECTORS’ REPORT For personal use only G: NON-EXECUTIVE DIRECTORS’ FEES Key development: In recognition of Company performance, it was agreed that NED fees reduce by 10% in FY14 and revert back to FY13 levels in FY15. Approach to determining Non-Executive Director (NED) fees The level of NED fees reflects the need to reward directors for their commitment to the corporate governance of the Company, their active participation in the affairs of the business and the contribution they make generally to the maximisation of shareholder value. The Company aims to provide a level of fees for NEDs taking into account, among other things, fees paid for similar roles in comparable companies, the time commitment, risk and responsibility accepted by NEDs, and recognition of their commercial expertise and experience. Non-Executive Directors’ fees The total amount of fees, including superannuation, for all NEDs must not exceed the limit approved by shareholders. The current NED fee cap is A$3,000,000 per annum, approved at the Company’s 2009 AGM. In recognition of Company performance, and in an effort to reduce costs in FY14, it was agreed that NED fees reduce by 10% in FY14 and revert back to FY13 levels in FY15. With the expectation of improving performance following the adoption by the Board of the Company’s 5 year strategic plan, NED fees will revert, as agreed, to the previous (FY13) fee level in FY15. This change will not require any increase to the NED fee pool. Under the current fee framework, NEDs receive a base fee and also receive further fees for chairmanship of a Board Committee. There are no additional fees for membership of a Committee. The table below outlines NED fees for FY14 and FY15. FINANCIAL Year NED FEES (AUD) Base fee (Chairman) Base fee (NED) Chairman Risk, Audit & Compliance Committee 3 Chairman Safety, Health, Environment & Community Committee Chairman Remuneration Committee Chairman Finance & Investment Committee Chairman Nomination/Governance Committee 1 2 3 2014 1 20152 405,475 183,082 58,500 31,500 31,500 31,500 31,500 450,528 203,424 35,000 35,000 35,000 35,000 35,000 Reflecting a 10% decrease from FY13 fee levels. NED fees reverted back to FY13 fee levels. The annual fee for the Chairman of the Risk, Audit & Compliance Committee will be reduced to A$35,000 effective from the date of the Company’s 2014 AGM. Between July 2013 and November 2013, the Company operated without a Group CEO while an executive search for a new Group CEO was completed. The Board determined that, during this period, the Company would be led by a senior management team, headed by NEDs Geoffrey Brunsdon and James Thompson. As compensation for their services in providing leadership during this transition period, the Board, on the recommendation of the Committee, and in consultation with Mercer, the Committee’s remuneration consultant, determined in November 2013 that the Company pay A$200,000 to Mr Brunsdon and US$200,000 to Mr Thompson as special one-off awards. NEDs also receive reimbursement for reasonable travel, accommodation and other expenses incurred in travelling to and / or from meetings of the Board, or when otherwise engaged in the business of the Company in accordance with Board policy. NEDs are not currently covered by any contract of employment; therefore, they have no contract duration, notice period for termination, or entitlement to termination payments. NEDs do not participate in any incentive (cash or equity-based) arrangements. Mr Morris held options as a result of grants made by MMI prior to its merger with the former Sims Group Limited in March 2008. These options were all exercised in FY14 and neither Mr Morris nor any other NED now holds any options in the Company. Superannuation and retirement benefits For Australian resident NEDs, superannuation is paid in addition to the above fees. The Company pays superannuation at 9.25% (increasing to 9.50% in FY15) for each Australian resident NED. Superannuation is not paid in respect of overseas directors. Statutory NED remuneration disclosures For NEDs who receive payments in foreign currencies, the table below reflects the Australian dollar equivalent based on the exchange rate at the date of payment. Accordingly, exchange rate movements have influenced the disclosed fee level. In FY14, the Australian dollar weakened considerably against the US dollar as compared to FY13. Therefore, in the table below, even though there was a 10% reduction in NED fees, the FY14 fees for USA based NEDs were higher than that of FY13 as presented in Australian dollars. 68 Non-Executive Directors R Bass 1, 2 N Bobins 1 Location USA USA G Brunsdon 4 Australia J DiLacqua 1 USA G Morris 1 USA C Renwick Australia H Ridout Australia T Sato5 Japan J Thompson 1,4 Former Non-Executive Directors JM Feeney 3 P Sukagawa 5 P Varello 1,3 Total 1 2 3 4 5 6 USA Australia Japan USA Fiscal Year Cash Fees Post-employment benefits Superannuation6 Retirement benefits Total 2014 2014 2013 2014 2013 2014 2013 2014 2013 2014 2013 2014 2013 2014 2013 2014 2013 160,080 233,551 230,899 605,475 463,657 233,537 217,763 266,315 259,953 214,582 238,424 183,082 203,424 183,082 50,856 446,348 217,945 – – – 56,006 41,729 – – – – 19,849 21,458 16,935 18,308 – – – – – – – – – – – – – – – – – – – – – 160,080 233,551 230,899 661,481 505,386 233,537 217,763 266,315 259,953 234,431 259,882 200,017 221,732 183,082 50,856 446,348 217,945 2013 2013 2013 2014 2013 89,409 152,568 74,679 2,526,052 2,199,577 8,047 – – 92,790 89,542 9,616 – – – 9,616 107,072 152,568 74,679 2,618,842 2,298,735 Messrs Bass, Bobins, DiLacqua, Morris, Thompson and Varello are residents of the USA and received their payments in US dollars. Fees for FY13 and FY14 that were paid in US dollars were converted at a rate of A$1 to US$1 as established by the Committee in July 2011. Mr Bass was appointed to the Board on 10 September 2013. Messrs Feeney and Varello retired from the Board on 15 November 2012. FY14 fees for Messrs Brunsdon and Thompson include a special one-off award (as discussed above) in the amount of A$200,000 and US$200,000, respectively. Mr Sato was appointed by Mitsui as its representative director on 1 April 2013. Mr Sukagawa served as the representative director for Mitsui until 31 March 2013. NED fees for Messrs Sato and Sukagawa are paid to a Mitsui affiliate in Australia. Superannuation contributions are made on behalf of Australian resident NEDs to satisfy the Company’s obligations under Australian Superannuation Guarantee legislation. 4 Directors’ Report For personal use only Name Sims Metal Management Annual Report 2014 Short-term benefits (A$) 69 DIRECTORS’ REPORT For personal use only H:SHARE-BASED PAYMENT DISCLOSURES AND EQUITY HOLDINGS 70 Options provided as remuneration The following table summarises the terms of outstanding option grants (and phantom option grants where applicable) for the Executives. Name Grant date Ordinary Shares (A$) G Claro 15 Nov 13 R Larry 15 Nov 13 R Kelman 15 Nov 13 D McGree 11 Nov 11 16 Nov 12 15 Nov 13 S Skurnac 15 Nov 13 ADSs (US$) R Kelman R Larry S Skurnac 1 2 11 Nov 11 16 Nov 12 11 Nov 11 16 Nov 12 11 Nov 11 16 Nov 12 Number granted Date next Exercise Fair value at tranche can price grant date be exercised % of options Expiry that have date vested Maximum total value of unvested grant1 138,714 125,054 132,356 87,260 2 146,268 2 101,726 2 54,768 $9.98 $9.98 $9.98 $13.07 $9.29 $9.98 $9.98 $2.77 $2.77 $2.77 $1.142 $2.18 2 $2.16 2 $2.77 29 Aug 14 29 Aug 14 29 Aug 14 22 Aug 14 29 Aug 14 29 Aug 14 29 Aug 14 15 Nov 20 15 Nov 20 15 Nov 20 11 Nov 18 16 Nov 19 15 Nov 20 15 Nov 20 0% 0% 0% 66.7% 33.3% 0% 0% $215,060 $193,882 $205,203 $2,023 $56,911 $123,513 $84,912 70,924 157,886 88,655 149,175 12,506 21,042 $13.37 $9.49 $13.37 $9.49 $13.37 $9.49 $4.52 $2.18 $4.52 $2.18 $4.52 $2.18 22 Aug 14 29 Aug 14 22 Aug 14 29 Aug 14 22 Aug 14 29 Aug 14 11 Nov 18 16 Nov 19 11 Nov 18 16 Nov 19 11 Nov 18 16 Nov 19 66.7% 33.3% 66.7% 33.3% 66.7% 33.3% $7,064 $62,259 $8,830 $58,825 $1,245 $8,298 No options will vest if the vesting conditions are not satisfied, hence the minimum value of unvested awards is nil. The maximum value of the unvested awards has been determined as the amount of the grant date fair value that is yet to be expensed. Represents a cash-settled phantom option grant. In accordance with AASB 2 (IFRS 2), the fair value is as of the end of the reporting period. For personal use only 353,922 – 467,273 – 384,532 58,623 – 82,000 – Balance at 1 July 2013 – 132,356 – 125,054 101,726 – 54,768 – 138,714 Number Granted Directors’ Report Balance at 30 June 2014 – 138,714 353,922 132,356 467,273 125,054 486,258 58,623 54,768 Number Exercised (82,000) – – – – – – – – 225,024 – 338,272 – 257,934 40,427 – – – Vested 128,898 132,356 129,001 125,054 228,324 18,196 54,768 – 138,714 Unvested 93,263 – 100,517 – 96,697 13,422 – – – $ 151,707 – $219,728 $ 346,400 – $ 366,626 – – – – – – – – – $ 36,080 – $ 384,238 Value of options granted during FY14 No options lapsed during the financial year. 1 Mr Morris’ options over ADSs in the Company were a result of grants made by MMI prior to its merger with the former Sims Group Limited in March 2008. Mr Morris no longer holds any options. 2 Includes cash-settled option grants. 3 The value at exercise date of the options that were exercised during the year has been determined as the intrinsic value of the options at that date (share price less exercise price). D McGree 2 S Skurnac R Larry ADSs Ordinary shares ADSs Ordinary shares Ordinary shares ADSs Ordinary shares ADSs Ordinary shares Directors G Morris 1 G Claro Executives R Kelman Instrument that options are over Name Number of options that vested during FY14 Value of options that were exercised or sold during FY14 3 The number of options over ordinary shares or ADSs in the Company held during the financial year by each Director and other KMP, including their personally related parties, is set out below. Values are in Australian dollars for ordinary shares and US dollars for ADSs: Sims Metal Management Annual Report 2014 4 71 DIRECTORS’ REPORT For personal use only Rights provided as remuneration 72 The table below summarises the terms of outstanding rights. None of these rights have vested. Name Ordinary Shares (A$) G Claro R Larry R Kelman D McGree S Skurnac ADSs (US$) R Kelman R Larry S Skurnac 1 2 Expiry Date Maximum total value of unvested grant1 Grant date Number granted Fair value at grant date Date next tranche vests 15 Nov 13 15 Nov 13 15 Nov 13 15 Nov 13 15 Nov 13 15 Nov 13 15 Nov 13 15 Nov 13 23 Nov 09 30 Nov 10 11 Nov 11 16 Nov 12 15 Nov 13 15 Nov 13 15 Nov 13 15 Nov 13 123,436 78,153 58,252 58,253 72,257 36,639 76,477 38,778 20,728 24,517 35,178 54,589 45,261 28,657 31,646 16,046 $5.38 $9.61 $10.12 $9.82 $5.38 $9.61 $5.38 $9.61 $15.97 $14.04 $10.42 $5.29 $5.38 $9.61 $5.38 $9.61 31 Aug 16 31 Aug 16 01 Dec 14 01 Dec 15 31 Aug 16 31 Aug 16 31 Aug 16 31 Aug 16 22 Aug 14 22 Aug 14 22 Aug 14 31 Aug 15 31 Aug 16 31 Aug 16 31 Aug 16 31 Aug 16 31 Aug 16 31 Aug 16 01 Dec 14 01 Dec 15 31 Aug 16 31 Aug 16 31 Aug 16 31 Aug 16 22 Aug 14 31 Aug 15 31 Aug 16 31 Aug 17 31 Aug 16 31 Aug 16 31 Aug 16 31 Aug 16 $454,767 $751,050 2 $237,660 $397,437 $266,212 $352,100 2 $281,759 $372,6572 – – $19,625 $106,575 $166,752 $275,393 2 $116,591 $154,202 23 Nov 09 30 Nov 10 11 Nov 11 16 Nov 12 23 Nov 09 30 Nov 10 11 Nov 11 16 Nov 12 17 Dec 09 30 Nov 10 11 Nov 11 16 Nov 12 27 Jun 13 25,531 33,983 41,615 82,838 31,914 42,479 52,018 78,268 3,388 4,477 7,338 11,040 16,067 $11.99 $9.29 $8.24 $4.12 $11.99 $9.29 $8.24 $4.12 $11.75 $9.29 $8.24 $4.12 $7.30 22 Aug 14 22 Aug 14 22 Aug 14 31 Aug 15 22 Aug 14 22 Aug 14 22 Aug 14 31 Aug 15 22 Aug 14 22 Aug 14 22 Aug 14 31 Aug 15 27 Jun 16 22 Aug 14 31 Aug 15 31 Aug 16 31 Aug 17 22 Aug 14 31 Aug 15 31 Aug 16 31 Aug 17 22 Aug 14 31 Aug 15 31 Aug 16 31 Aug 17 27 Jun 16 – – $18,359 $125,957 – – $22,949 $119,008 – – $3,236 $16,787 $77,836 No rights will vest if the vesting conditions are not satisfied, hence the minimum value of unvested awards is nil. The maximum value of the unvested rights has been determined as the amount of the grant date fair value that is yet to be expensed. These grants relate to rights subject to the EPS hurdle. Based on the Company’s assessment at 30 June 2014, these rights will not vest. No amount has been expensed relating to these rights in FY14. For personal use only Name Executives G Claro R Kelman R Larry D McGree S Skurnac Instrument that rights are over Ordinary shares ADSs Ordinary shares ADSs Ordinary shares Ordinary shares ADSs Ordinary shares Balance at 1 July 2013 Number Granted Number Vested – 222,547 – 252,904 – 151,325 42,310 – 318,094 – 115,255 – 108,896 73,918 – 47,692 – – – – – – – – Number Forfeited – (38,580) – (48,225) – (16,313) – – Sims Metal Management Annual Report 2014 The number of rights to ordinary shares or ADSs in the Company held during the financial year by each Executive Director and other KMP, including their personally related parties, is set out below: Balance at 30 June 2014 318,094 183,967 115,255 204,679 108,896 208,930 42,310 47,692 Share holdings The number of shares in the Company held during the financial year by each Director and other KMP, including their personally related parties, is set out below: Balance at 1 July 2013 Received on exercise of options or rights Non-Executive Directors R Bass N Bobins G Brunsdon G Morris C Renwick J Thompson – 54,600 22,057 20,000 13,144 12,000 – – – 82,000 – – 5,600 – – (61,500) – – 5,000 1 – – – – – 10,600 54,600 22,057 40,500 13,144 12,000 Executives G Claro R Kelman R Larry D McGree S. Skurnac (ADSs) – – 61,609 47,462 2,498 – – – – – – – (11,526) – – – – – – 50,083 47,462 2,498 Name Represents shares held at time of appointment to the Board. – – Balance at 30 June 2014 4 Directors’ Report 1 Purchases / (sales) Other changes during the year 73 DIRECTORS’ REPORT For personal use only I: OTHER TRANSACTIONS WITH KMP 74 Transactions entered into with any Directors or other KMP of the Group, including their personally related parties, are at normal commercial terms. Mr Sato serves as the representative director for Mitsui & Co. Prior to his appointment, Mr Sukagawa served as the representative director for Mitsui & Co. As a result, their director remuneration is paid directly to Mitsui & Co. During the year ended 30 June 2014, the Group paid A$183,082 to Mitsui & Co. for director remuneration (2013: A$203,424). This report is made in accordance with a resolution of the Board of Directors and is signed for and on behalf of the Board of Directors. G N Brunsdon Chairman Sydney 22 August 2014 G J Claro Managing Director and Group CEO New York 21 August 2014 Consolidated Income Statements for the year ended 30 June 2014 2013 A$m restated 2012 A$m restated Revenue 6 7,144.3 7,203.1 9,042.3 Other income Raw materials used and changes in inventories Freight expense Employee benefits expense Depreciation and amortisation expense Repairs and maintenance expense Other expenses Impairment of goodwill and other intangibles Finance costs Impairment of goodwill in joint venture Share of results of associates and joint ventures Loss before income tax 7 21.1 (5,219.9) (534.0) (589.4) (123.9) (103.1) (581.9) (28.5) (23.2) – (3.3) (41.8) 52.6 (5,452.2) (560.3) (536.2) (123.5) (105.8) (608.7) (304.4) (25.5) – (27.7) (488.6) 91.2 (7,065.5) (687.0) (563.0) (129.9) (127.2) (497.5) (618.1) (25.1) (57.5) (8.0) (645.3) (47.1) (88.9) 21.3 (467.3) 22.3 (623.0) For personal use only Note 2014 A$m Income tax (expense)/benefit Loss for the year 7 7 7 28 28 8 Loss per share Basic Diluted A¢ 4 4 (43.5) (43.5) A¢ RESTATED (228.6) (228.6) Sims Metal Management Annual Report 2014 F INAN C IAL S TATEMENT S A¢ RESTATED (302.7) (302.7) The consolidated income statements should be read in conjunction with the accompanying notes. See note 1(d) for details regarding restatement of balances for the years ended 30 June 2013 and 30 June 2012 as a result of changes in accounting policies. 5 Financial Statements 75 F INAN C IAL S TATEMENT S For personal use only Consolidated Statements Of Comprehensive Income for the year ended 30 June 2014 76 Note 2014 A$m 2013 A$m restated 2012 A$m restated (88.9) (467.3) (623.0) 20 20 4.4 (17.8) (3.8) 121.7 1.2 87.2 20 (4.8) – – 28 0.3 0.6 (0.4) 18 (2.6) 6.3 (10.4) (20.5) 124.8 77.6 (109.4) (342.5) (545.4) Loss for the year Other comprehensive income: Items that may be reclassified to profit or loss Changes in the fair value of cash flow hedges, net of tax Foreign exchange translation differences arising during the period, net of tax Recycling of foreign currency translation reserve on disposal of foreign operations Share of other comprehensive income of associates, net of tax Items that will not be reclassified to profit or loss Re-measurements of defined benefit plans, net of tax Other comprehensive (loss)/income for the year, net of tax Total comprehensive loss for the year The consolidated statements of comprehensive income should be read in conjunction with the accompanying notes. See note 1(d) for details regarding restatement of balances for the years ended 30 June 2013 and 30 June 2012 as a result of changes in accounting policies. Non-current assets Investments in associates and joint ventures Other financial assets Property, plant and equipment Retirement benefit assets Deferred tax assets Goodwill Other intangible assets Total non-current assets Total assets LIABILITIES Current liabilities Trade and other payables Borrowings Other financial liabilities Current tax liabilities Provisions Liabilities associated with assets held for sale Total current liabilities Non-current liabilities Payables Borrowings Deferred tax liabilities Provisions Retirement benefit obligations Total non-current liabilities Total liabilities 2013 A$m restated 31 9 10 11 32 57.2 445.6 545.0 51.8 7.4 1,107.0 46.9 455.4 564.8 29.1 53.1 1,149.3 28 11 12 18 8 13 14 314.9 7.2 903.0 2.1 99.4 139.3 76.5 1,542.4 2,649.4 330.0 47.9 1,002.3 1.0 123.0 166.5 97.4 1,768.1 2,917.4 15 16 11 571.4 0.5 4.5 24.8 76.4 – 677.6 585.2 11.6 6.3 13.2 38.5 16.6 671.4 6.5 14.4 66.0 46.4 4.6 137.9 815.5 8.3 189.1 74.0 40.5 4.9 316.8 988.2 1,833.9 1,929.2 2,796.4 (202.3) (760.2) 1,833.9 2,795.7 (197.8) (668.7) 1,929.2 Note 17 32 15 16 8 17 18 Net assets EQUITY Contributed equity Reserves Accumulated deficit Total equity 19 20 20 5 Financial Statements For personal use only ASSETS Current assets Cash and cash equivalents Trade and other receivables Inventory Other financial assets Assets classified as held for sale Total current assets 2014 A$m Sims Metal Management Annual Report 2014 Consolidated Statements Of Financial Position as at 30 June 2014 The consolidated statements of financial position should be read in conjunction with the accompanying notes. See note 1(d) for details regarding restatement of balances for the year ended 30 June 2013 as a result of changes in accounting policies. 77 F INAN C IAL S TATEMENT S For personal use only Consolidated Statements Of Changes In Equity for the year ended 30 June 2014 78 Note Balance at 1 July 2011 Loss for the year (restated) Other comprehensive income (restated) Total comprehensive loss for the year Transactions with owners in their capacity as owners: Dividends provided for or paid Share-based payments Buy-back of ordinary shares Dividend reinvestment plan Transactions with owners in their capacity as owners: Dividends provided for or paid Share-based payments Buy-back of ordinary shares Balance at 30 June 2013 (restated) Loss for the year Other comprehensive loss Total comprehensive loss for the year Transactions with owners in their capacity as owners: Share-based payments Balance at 30 June 2014 Reserves A$m Retained earnings/ (deficit) A$m Total equity A$m 2,817.9 – – – (445.2) – 88.0 88.0 538.8 (623.0) (10.4) (633.4) 2,911.5 (623.0) 77.6 (545.4) – 1.5 (38.5) 23.4 (13.6) 2,804.3 – 24.3 – – 24.3 (332.9) (92.7) – – – (92.7) (187.3) (92.7) 25.8 (38.5) 23.4 (82.0) 2,284.1 1(d) – – – – 118.5 118.5 (467.3) 6.3 (461.0) (467.3) 124.8 (342.5) 21 – – (8.6) (8.6) 2,795.7 – 16.6 – 16.6 (197.8) (20.4) – – (20.4) (668.7) (20.4) 16.6 (8.6) (12.4) 1,929.2 – – – – (17.9) (17.9) (88.9) (2.6) (91.5) (88.9) (20.5) (109.4) 0.7 0.7 2,796.4 13.4 13.4 (202.3) – – (760.2) 1(d) 21 19 21 Balance at 30 June 2012 (restated) Loss for the year (restated) Other comprehensive income (restated) Total comprehensive loss for the year Contributed equity A$m 19 14.1 14.1 1,833.9 The consolidated statements of changes in equity should be read in conjunction with the accompanying notes. See note 1(d) for details regarding restatement of balances for the years ended 30 June 2013 and 30 June 2012 as a result of changes in accounting policies. Cash flows from operating activities Receipts from customers (inclusive of GST) Payments to suppliers and employees (inclusive of GST) Interest received Interest paid Insurance recoveries Dividends received from associates and joint ventures Income taxes paid Net cash inflows from operating activities Cash flows from investing activities Payments for property, plant and equipment Proceeds from sale of property, plant and equipment Payments for acquisition of subsidiaries, net of cash acquired Payment for an interest in an associate Return of capital from associates and joint ventures Proceeds from sale of an interest in a joint venture Proceeds from sale of business divisions Proceeds from sale of joint venture Loan to an associate Payments for other financial assets Proceeds from sale of other financial assets Loans to a joint venture Proceeds from repayment on joint venture loans Loans to third parties Proceeds from repayment on third party loans Net cash outflows from investing activities Cash flows from financing activities Proceeds from borrowings Repayment of borrowings Fees paid for loan facilities Repayment of finance leases Proceeds from issue of shares Payments for shares bought back Dividends paid Net cash outflows from financing activities 31 12 26 28 28 26 26 19 21 Net increase/(decrease) in cash and cash equivalents Cash and cash equivalents at the beginning of the financial year Effects of exchange rate changes on cash and cash equivalents Cash and cash equivalents at the end of the financial year 31 2014 A$m 2013 A$m 2012 A$m 7,295.5 (7,066.6) 6.0 (22.6) 8.9 8.0 (19.1) 210.1 7,441.6 (7,131.4) 5.0 (21.7) 1.4 11.8 (9.4) 297.3 9,323.9 (8,959.9) 2.6 (22.6) 5.3 5.1 (64.8) 289.6 (64.1) 4.8 – – – – 38.4 – – (1.1) 1.7 (3.6) 3.6 (1.1) 20.5 (0.9) (149.0) 4.8 (28.1) – – 7.3 44.9 – – (1.4) 1.1 – – (5.7) 7.3 (118.8) (161.1) 6.6 (82.2) (93.5) 0.3 – – 40.0 (37.8) (1.5) 0.4 – – (33.0) 19.2 (342.6) 2,660.7 (2,859.1) (1.7) (0.3) 0.7 – – (199.7) 2,488.3 (2,645.6) (0.2) – – (8.6) (20.4) (186.5) 2,557.3 (2,514.3) (2.1) – 1.5 (38.5) (69.3) (65.4) 9.5 (8.0) (118.4) 46.9 0.8 57.2 51.4 3.5 46.9 165.5 4.3 51.4 The consolidated statements of cash flows should be read in conjunction with the accompanying notes. 5 Financial Statements For personal use only Note Sims Metal Management Annual Report 2014 Consolidated Statements Of Cash Flows for the year ended 30 June 2014 79 F INAN C IAL S TATEMENT S notes to the Consolidated financial statements For the year ended 30 June 2014 For personal use only Note 1 – Summary of significant accounting policies 80 The principal accounting policies adopted in the preparation of these consolidated financial statements are set out below. These policies have been consistently applied to all the years presented, unless otherwise stated. (a) Reporting entity Sims Metal Management Limited (the “Company”) is a company domiciled in Australia. The consolidated financial statements for the year ended 30 June 2014 comprise the Company and its subsidiaries (together referred to as the “Group”) and the Group’s interest in associates and joint arrangements. The Group is a for-profit entity for the purpose of preparing the consolidated financial statements. (b) Basis of preparation The consolidated financial statements are general purpose financial statements prepared in accordance with the requirements of the Corporations Act 2001 , Australian Accounting Standards, interpretations and other authoritative pronouncements of the Australian Accounting Standards Board (“AASB”). Compliance with IFRS The consolidated financial statements comply with International Financial Reporting Standards (“IFRS”) and interpretations as issued by the International Accounting Standards Board (“IASB”). Historical cost convention The consolidated financial statements have been prepared under the historical cost convention, except for certain financial assets and liabilities, defined benefit plan assets associated with retirement benefit obligations and liabilities for cash-settled share based payments, which are measured at fair value. Rounding of amounts The Company is of a kind referred to in Class Order 98/100, issued by the Australian Securities and Investments Commission (“ASIC”), relating to the “rounding off” of amounts in the consolidated financial statements. Amounts in the consolidated financial statements have been rounded off in accordance with that Class Order to the nearest tenth of a million dollars, unless otherwise indicated. (c) Critical accounting estimates The preparation of the consolidated financial statements requires the use of certain critical accounting estimates. It also requires management to exercise its judgement in the process of applying the Group’s accounting policies. The areas involving a higher degree of judgement or complexity, or areas where assumptions and estimates are significant to the consolidated financial statements, are disclosed in note 3. (d)New accounting standards and interpretations New and amended accounting standards issued by the AASB and IASB which became effective on 1 July 2013 that are relevant to the Group include: –– AASB 10 (IFRS 10) Consolidated Financial Statements –– AASB 11 (IFRS 11) Joint Arrangements –– AASB 12 (IFRS 12) Disclosure of Interests in Other Entities –– AASB 13 (IFRS 13) Fair Value Measurement –– Revised AASB 119 (revised IAS 19) Employee Benefits –– Revised AASB 127 (revised IAS 27) Separate Financial Statements –– Revised AASB 128 (revised IAS 28) Investments in Associates and Joint Ventures –– AASB 2012-5 Amendments to Australian Account Standards arising from Annual Improvements 2009-2011 Cycle Except as described below, the impact of the adoption of the new and amended accounting standards was not material to the Group. (i)AASB 13 (IFRS 13) Fair Value Measurement AASB 13 (IFRS 13) establishes a single source of guidance under accounting standards for all fair value measurements. AASB 13 (IFRS 13) does not change when an entity is required to use fair value, but rather provides guidance on how to measure fair value. It also replaces and expands the disclosure requirements about fair value measurements in other accounting standards, including AASB 7 (IFRS 7) Financial Instruments: Disclosures. The adoption of AASB 13 (IFRS 13) has not materially impacted the fair value measurements carried out by the Group nor has it materially impacted the disclosures. For personal use only Sims Metal Management Annual Report 2014 (ii) Revised AASB 119 (revised IAS 19) Employee Benefits The Group has applied the revised AASB 119 (revised IAS 19) from 1 July 2013. As a result, the Group has changed its accounting policy with respect to accounting for defined benefit plans as follows: –– The revised standard replaces the interest cost and expected return on plan assets under the previous standard with a net interest amount. The Group therefore determines the net interest expense (income) on the net defined benefit liability (asset) for the period by applying the discount rate used to measure the defined benefit obligation at the beginning of the annual period to the opening net defined benefit liability (asset), taking into account any changes in the net defined benefit liability (asset) during the period as a result of contributions and benefit payments. This has no effect on total comprehensive income as the impact to profit or loss is offset by the impact to other comprehensive income. –– Under the revised standard, taxes payable on future investment income of the plan are included in the return on plan assets and are therefore charged to other comprehensive income as part of the excess or shortfall of the overall return on plan assets over the amount included in net interest on the net defined benefit liability (asset). A gross of tax discount rate is therefore used when measuring the defined benefit obligation, as opposed to a net of tax discount rate. A net of tax discount rate was previously used for the Group’s Australian plan, as taxes payable on future investment income were previously included in the measurement of the defined benefit obligation. As the revised standard must be adopted retrospectively, adjustments were made to the statement of financial position, the income statement and statement of comprehensive income. The impact was a A$1.2 million increase in loss after tax for the year ended 30 June 2013 and a corresponding increase in other comprehensive income. For the year ended 30 June 2012, the impact was a A$0.5 million increase in loss after tax and a A$0.9 million increase in other comprehensive income. Basic and diluted loss per share increased 0.5 and 0.3 cents per share for the years ended 30 June 2013 and 30 June 2012, respectively, to a corresponding loss of 228.6 cents per share and 302.7 cents per share. The impact on the statement of financial position as at 30 June 2013 was an A$0.6 million increase in retirement benefit assets, an A$0.2 million increase in deferred tax liabilities and an A$0.4 million decrease in accumulated deficit. (iii)AASB 2012-5 Amendments to Australian Account Standards arising from Annual Improvements 2009-2011 Cycle AASB 2012-5 amended AASB 116 Property, Plant and Equipment to specify that spare parts and servicing equipment are classified as property, plant and equipment rather than inventory when they meet the definition of property, plant and equipment. The Group previously classified spare parts with a life greater than one year as inventory. As a result of this amendment, the Group changed its accounting policy for spare parts with a life greater than one year to conform to AASB 2012-5 and applied the change retrospectively. The impact on the statement of financial position as at 30 June 2013 was an increase to property, plant and equipment of A$10.1 million and a corresponding decrease to inventory. (iv)AASB 2011-4 Amendments to Australian Accounting Standards to Remove Individual Key Management Personnel Disclosure Requirements AASB 2011-4 removed the individual key management personnel disclosure requirements from AASB 124 Related Party Disclosures to achieve consistency with the international equivalent standard and remove a duplication of the requirements with the Corporations Act 2001 , which effectively transitions the key management personnel disclosures from the notes to the financial statements to the Remuneration Report. A number of new standards, amendments to standards and interpretations are effective for annual periods beginning on or after 1 July 2014 and have not been applied in preparing these consolidated financial statements. The Group’s assessment of the impact of new standards, amendments to standards and interpretations applicable to the Group is set out below: AASB 9 (IFRS 9) Financial Instruments AASB 9 (IFRS 9) introduces new requirements for the classification, measurement and derecognition of financial assets and financial liabilities and sets out new hedge accounting requirements. Application of AASB 9 (IFRS 9) is not expected to have a significant impact on the Group’s accounting for financial assets and financial liabilities. The Group has not yet assessed how its own hedging arrangements would be impacted by the new rules. AASB 9 (IFRS 9) is effective for annual periods beginning on or after 1 July 2017, and is available for early adoption. Financial Statements IFRS 15 Revenue from Contracts with Customers IFRS 15 establishes a new, single revenue accounting model which replaces existing revenue recognition guidance. The concept of transfer of risks and rewards is replaced with the notion that revenue is recognised when a customer obtains control of a good service, that is, when the customer has the ability to direct the use of and obtain the benefits from the good or service. Additionally, the standard introduces requirements regarding variable consideration, allocation of transaction price based on relative standalone selling price and the time value of money with respect to longer-term contracts. IFRS 15 is effective for annual periods beginning on or after 1 July 2017, and is available for early adoption. The Group has not yet assessed how its revenue recognition policy will be impacted by the new rules. 5 AASB 2013-3 Amendments to AASB 136 – Recoverable Amount Disclosures for Non-Financial Assets AASB 2013-3 amends certain disclosures required by AASB 136 Impairment of Assets. The amendments include the requirement to disclose additional information about the fair value measurement when the recoverable amount of impaired assets is based on fair values less costs of disposal. No financial statement amounts will be impacted by this standard. AASB 2013-3 is effective for annual periods beginning on or after 1 July 2014. There are no other standards that are not yet effective and that are expected to have a material impact on the entity in the current or future reporting periods and on foreseeable future transactions. 81 F INAN C IAL S TATEMENT S notes to the Consolidated financial statements For the year ended 30 June 2014 For personal use only Note 1 – Summary of significant accounting policies (continued) (e) Principles of consolidation (i)Subsidiaries Subsidiaries are all entities over which the Group has control. The Group controls an entity when the Group is exposed to, or has rights to, variable returns from its involvement with the entity and has the ability to affect those returns through its power over the entity. Subsidiaries are fully consolidated from the date on which control is transferred to the Group. They are deconsolidated from the date that control ceases. The acquisition method of accounting is used to account for business combinations by the Group (refer to note 1(f)). Intercompany transactions, balances and unrealised gains on transactions between Group companies are eliminated. Unrealised losses are also eliminated unless the transaction provides evidence of an impairment of the transferred asset. Accounting policies of subsidiaries have been changed where necessary to ensure consistency with the policies adopted by the Group. (ii)Associates An associate is an entity over whose operating and financial policies the Group exercises significant influence, but not control. Significant influence is presumed to exist where the Group has between 20% and 50% of the voting rights, but can also arise where the Group holds less than 20% if it has the power to be actively involved and influential in policy decisions impacting the entity. The Group’s investment in associates includes goodwill identified on acquisition. Investments in associates are accounted for using the equity method of accounting after initially being recognised at cost. The Group determines at each reporting date whether there is any objective evidence that the investment in the associate is impaired. If this is the case, the Group calculates the amount of impairment as the difference between the recoverable amount of the associate and its carrying value and recognises the amount in profit or loss. Dilution gains and losses arising in investments in associates are recognised in profit or loss. (iii) Joint arrangements Under AASB 11 (IFRS 11) Joint Arrangements investments in joint arrangements are classified as either joint operations or joint ventures. The classification depends on the contractual rights and obligations of each investor, rather than the legal structure of the joint arrangement. The Group has joint operations and joint ventures. Joint operations The Group recognises its direct right to the assets, liabilities, revenues and expenses of joint operations and its share of any jointly held or incurred assets, liabilities, revenues and expenses. These have been incorporated in the financial statements under the appropriate headings. Details of the joint operation are set out in note 28(h). Joint ventures Interests in joint ventures are accounted for using the equity method of accounting, after initially being recognised at cost. (iv)Equity method Under the equity method of accounting, the investments are initially recognised at cost and adjusted thereafter to recognise the Group’s share of the post-acquisition profits or losses of the investee in profit or loss, and the Group’s share of movements in other comprehensive income of the investee in other comprehensive income. Dividends received or receivable from associates and joint ventures are recognised as a reduction in the carrying amount of the investment. When the Group’s share of losses in an equity-accounted investment equals or exceeds its interest in the entity, including any other unsecured long-term receivables, the Group does not recognise further losses, unless it has incurred obligations or made payments on behalf of the other entity. Unrealised gains on transactions between the Group and its associates and joint ventures are eliminated to the extent of the Group’s interest in these entities. Unrealised losses are also eliminated unless the transaction provides evidence of an impairment of the asset transferred. Accounting policies of equity accounted investees have been changed where necessary to ensure consistency with the policies adopted by the Group. (v) Changes in ownership interests When the Group ceases to have control, joint control or significant influence, any retained interest in the entity is remeasured to its fair value with the change in carrying amount recognised in profit or loss. This fair value becomes the initial carrying amount for the purposes of subsequently accounting for the retained interest as an associate, joint venture or financial asset. In addition, any amounts previously recognised in other comprehensive income in respect of that entity are accounted for as if the Group had directly disposed of the related assets or liabilities. This may mean that amounts previously recognised in other comprehensive income are reclassified to profit or loss. If the ownership interest in a joint venture or an associate is reduced but joint control or significant influence is retained, only a proportionate share of the amounts previously recognised in other comprehensive income are reclassified to profit or loss where appropriate. 82 For personal use only The acquisition method of accounting is used to account for all business combinations, regardless of whether equity instruments or other assets are acquired. The consideration transferred for the acquisition of a subsidiary comprises the: Sims Metal Management Annual Report 2014 (f) Business combinations –– fair values of the assets transferred; –– liabilities incurred; –– equity interests issued by the Group; –– fair value of any asset or liability resulting from a contingent consideration arrangement; and –– fair value of any pre-existing equity interest in the subsidiary. Identifiable assets acquired and liabilities and contingent liabilities assumed in a business combination are, with limited exceptions, measured initially at their fair values at the acquisition date. The Group recognises any non-controlling interest in the acquired entity on an acquisition-by-acquisition basis either at fair value or at the non-controlling interest’s proportionate share of the acquired entity’s net identifiable assets. Acquisition-related costs are expensed as incurred. The excess of the consideration transferred, the amount of any non-controlling interest in the acquired entity, and the acquisition-date fair value of any previous equity interest in the acquired entity over the fair value of the identifiable net assets acquired is recorded as goodwill. If those amounts are less than the fair value of the net identifiable assets of the subsidiary acquired, the difference is recognised directly in profit or loss as a bargain purchase. Where settlement of any part of cash consideration is deferred, the amounts payable in the future are discounted to their present value as at the date of exchange. The discount rate used is the entity’s incremental borrowing rate, being the rate at which a similar borrowing could be obtained from an independent financier under comparable terms and conditions. Contingent consideration is classified either as equity or a financial liability. Amounts classified as a financial liability are subsequently remeasured to fair value with changes in fair value recognised in profit or loss. If the business combination is achieved in stages, the acquisition date carrying value of the acquirer’s previously held equity interest in the acquire is remeasured to fair value at the acquisition date. Any gains or losses arising from such remeasurement are recognised in profit or loss. (g) Foreign currency translation (i) Functional and presentation currency Items included in the financial statements of each of the Group’s entities are measured using the currency of the primary economic environment in which the entity operates (the “functional currency”). The consolidated financial statements are presented in Australian dollars (“A$”), which is the Company’s functional and presentation currency. (ii)Transactions and balances Foreign currency transactions are translated into the functional currency using the exchange rates prevailing at the dates of the transactions. Foreign exchange gains and losses resulting from the settlement of such transactions and from the translation at year end exchange rates of monetary assets and liabilities denominated in foreign currencies are recognised in profit or loss, except when deferred in equity as qualifying cash flow hedges and qualifying net investment hedges or are attributable to part of the net investment in a foreign operation. Non-monetary items that are measured at fair value in a foreign currency are translated using the exchange rates at the date when the fair value was determined. Translation differences on assets and liabilities carried at fair value are reported as part of the fair value gain or loss. Translation differences on non-monetary financial assets and liabilities such as equities held at fair value through profit or loss are recognised in profit or loss as part of the fair value gain or loss and translation differences on non-monetary assets such as equities classified as available-for-sale financial assets are included in other comprehensive income. –– assets and liabilities for each statement of financial position presented are translated at the closing rate at the date of that statement of financial position; Financial Statements (iii)Group companies The results and financial position of foreign operations (none of which has the currency of a hyperinflationary economy) that have a functional currency different from the presentation currency are translated into the presentation currency as follows: 5 –– income and expenses for each income statement and statement of comprehensive income are translated at average exchange rates (unless this is not a reasonable approximation of the cumulative effect of the rates prevailing on the transaction dates, in which case they are translated at the date of the transaction); and –– all resulting exchange differences are recognised in other comprehensive income. On consolidation, exchange differences arising from the translation of any net investment in foreign entities, borrowings and other financial instruments designated as hedges of such investments, or long-term intragroup borrowings which, in substance, form part of the Group’s net investment in an entity, are recognised in other comprehensive income. When a loss of control occurs over a foreign operation, a proportionate share of such exchange differences is reclassified to profit or loss as part of the gain or loss on disposal where applicable. Goodwill and fair value adjustments arising on the acquisition of a foreign entity are treated as assets and liabilities of the foreign entity and translated at the closing rate. 83 F INAN C IAL S TATEMENT S notes to the Consolidated financial statements For the year ended 30 June 2014 For personal use only Note 1 – Summary of significant accounting policies (continued) (h) Revenue recognition Revenue is measured at the fair value of the consideration received or receivable. Amounts disclosed as revenue are net of returns and trade allowances. Amounts billed to customers in respect of shipping and handling are classified as sales revenue where the Group is responsible for carriage, insurance and freight. All shipping and handling costs incurred by the Group are recognised as freight expense in the income statement. The Group recognises revenue when the amount of revenue can be reliably measured, it is probable that future economic benefits will flow to the entity and specific criteria have been met for each of the Group’s activities as described below. The amount of revenue is not considered to be reliably measurable until all contingencies relating to the sale have been resolved. Revenue is recognised for the major business activities as follows: (i) Sale of goods Revenue from the sale of goods is recognised when there is persuasive evidence, usually in the form of an executed sales agreement at the time of delivery of goods to the customer, indicating that there has been a transfer of risks and rewards to the customer, no further work or processing is required, the quantity and quality of the goods have been determined, the price is fixed and generally title has passed. Title for both our ferrous and non-ferrous secondary recycling products and recycling solutions products are based on contract terms which vary across businesses. The majority of the Group’s ferrous bulk cargo sales arrangements specify that title passes once all material has been loaded onto a vessel (i.e. passed the ship’s rail). A significant portion of these ferrous exports sales are made with letters of credit, reducing credit risk. Further, non‑ferrous export sales typically require a deposit prior to shipment. However, domestic ferrous and non-ferrous sales are made on open account. (ii) Service revenue Service revenue represents revenue earned from the collection of end-of-life post-consumer products for the purpose of product recycling. Service revenue is recognised when the services have been provided. Service revenue received in advance of the service being rendered is deferred. (iii)Interest income Interest income is recognised on an accrual basis using the effective interest method. (iv) Dividend income Dividends are recognised when the right to receive payment is established. (i)Government grants Grants from the government are recognised at their fair value where there is a reasonable assurance that the grant will be received and the Group will comply with all attached conditions. Government grants relating to costs are deferred and recognised in profit or loss over the period necessary to match them with the costs that they are intended to compensate. Government grants relating to the purchase of property, plant and equipment are included in non-current liabilities as deferred income and are credited to other income in the income statement on a straight-line basis over the expected lives of the related assets. ( j)Income tax The income tax expense or benefit for the period is the tax payable on the current period taxable income based on the applicable income tax rate for each jurisdiction adjusted by changes in deferred tax assets and liabilities attributable to temporary differences and unused tax losses. The current income tax charge is calculated on the basis of the tax laws enacted or substantively enacted at the end of the reporting period in the countries where the Group’s subsidiaries and associates operate and generate taxable income. Management periodically evaluates provisions taken in tax returns with respect to situations in which applicable tax regulation is subject to interpretation. It establishes provisions, where appropriate, on the basis of amounts expected to be paid to the tax authorities. Deferred income tax is provided in full, using the liability method, on temporary differences arising between the tax bases of assets and liabilities and their carrying amounts in the consolidated financial statements. However, the deferred income tax is not accounted for if it arises from initial recognition of an asset or liability in a transaction other than a business combination that at the time of the transaction impacts neither accounting nor taxable profit or loss. Deferred income tax is determined using tax rates (and laws) that have been enacted or substantially enacted by the end of the reporting period and are expected to apply when the related deferred income tax asset is realised or the deferred income tax liability is settled. Deferred tax assets are recognised for deductible temporary differences and unused tax losses only if it is probable that future taxable amounts will be available to utilise those temporary differences and losses. 84 For personal use only Sims Metal Management Annual Report 2014 Deferred tax liabilities and assets are not recognised for temporary differences between the carrying amount and tax bases of investments in controlled entities where the Company is able to control the timing of the reversal of the temporary differences and it is probable that the differences will not reverse in the foreseeable future. Deferred tax assets and liabilities are offset when there is a legally enforceable right to offset current tax assets and liabilities and when the deferred tax balances relate to the same taxation authority. Current tax assets and tax liabilities are offset where the entity has a legally enforceable right to offset and intends either to settle on a net basis, or to realise the asset and settle the liability simultaneously. Current and deferred tax is recognised in profit or loss, except to the extent that it relates to items recognised in other comprehensive income or directly in equity. In this case, the tax is also recognised in other comprehensive income or directly in equity, respectively. (i)Tax consolidation legislation Sims Metal Management Limited and its wholly owned Australian controlled entities have implemented the tax consolidation legislation as of 31 October 2005. Sims Metal Management Limited is the head entity of the tax consolidated group. Members of the tax consolidated group have entered into a tax sharing and funding agreement that provides for the allocation of income tax liabilities between entities should the head entity default on its tax payment obligations. No amounts have been recognised in the consolidated financial statements in respect of this agreement on the basis that the probability of default is remote. (ii)Investment allowances Entities within the Group may be entitled to claim special tax deductions for investments in qualifying assets (investment allowances). The Group accounts for such allowances as tax credits, which means that the allowance reduces income tax payable and current tax expense. A deferred tax asset is recognised for unclaimed tax credits that are carried forward as deferred tax assets. (k)Leases Leases in which a significant portion of the risks and rewards of ownership are retained by the lessor are classified as operating leases. Payments made under operating leases (net of any incentives received from the lessor) are charged to profit or loss on a straight-line basis over the period of the lease. Leases of property, plant and equipment where the Group has substantially all the risks and rewards of ownership are classified as finance leases. Finance leases are capitalised at the lease’s commencement at the lower of the fair value of the leased property and the present value of the minimum lease payments. Each lease payment is allocated between the liability and finance charges. The corresponding rental obligations, net of finance charges, are included in long-term payables. The interest element of the finance cost is charged to profit or loss over the lease period so as to produce a constant periodic rate of interest on the remaining balance of the liability for each period. The property, plant and equipment acquired under finance leases is depreciated over the shorter of the useful life of the asset and the lease term. Lease income from operating leases where the Group is a lessor is recognised in income on a straight-line basis over the lease term. (l) Segment information Operating segments are reported in a manner consistent with the internal reporting that was provided to the Managing Director and Group Chief Executive Officer (“CEO”), who is the chief operating decision maker. Details on the Group’s segments are set out in note 5. (m)Impairment of assets 5 Financial Statements Goodwill and intangible assets that have an indefinite useful life are not subject to amortisation and are tested annually for impairment, or more frequently if events or changes in circumstances indicate a potential for impairment. Other assets are tested for impairment whenever events or changes in circumstances indicate that the carrying amount may not be recoverable. An impairment loss is recognised for the amount by which the asset’s carrying amount exceeds its recoverable amount. The recoverable amount is the higher of an asset’s fair value less costs to sell and value in use. For the purposes of assessing impairment, assets are grouped at the lowest levels for which there are separately identifiable cash inflows, which are largely independent of the cash inflows from other assets or groups of assets (“CGUs”). Non-financial assets, other than goodwill, that suffered impairment are reviewed for possible reversal of the impairment at each reporting period. (n) Cash and cash equivalents For the purpose of presentation in the consolidated statement of cash flows, cash and cash equivalents includes cash on hand, deposits held at call with financial institutions and other short-term, highly liquid investments with original maturities of three months or less that are readily convertible to known amounts of cash and which are subject to an insignificant risk of changes in value. 85 F INAN C IAL S TATEMENT S notes to the Consolidated financial statements For the year ended 30 June 2014 For personal use only Note 1 – Summary of significant accounting policies (continued) (o)Trade and other receivables Trade receivables are recognised initially at fair value and subsequently measured at amortised cost, less provision for impairment. Trade receivables are generally due for settlement within 30 to 60 days following shipment, except in the case of certain ferrous shipments made to export destinations, which are generally secured by letters of credit that are collected on negotiated terms but generally within 10 days of shipment. Collectability of trade receivables is reviewed on an ongoing basis. Individual debts that are known to be uncollectible are written-off by reducing the carrying amount directly. An allowance account (a provision for impairment of trade receivables) is used when there is objective evidence that the Group will not be able to collect all amounts due according to the original terms of the receivable. Indicators of impairment would include significant financial difficulties of the debtor, likelihood of the debtor’s insolvency, default or delinquency in payment, or a significant deterioration in creditworthiness. The amount of the impairment provision is recognised in profit or loss within other expenses. When a trade receivable for which an impairment provision had been recognised becomes uncollectible in a subsequent period, it is written-off against the provision for impairment account. Subsequent recoveries of amounts previously written-off are credited against other expenses in profit or loss. (p)Inventory Inventories are stated at the lower of cost and net realisable value. Cost is based on weighted average and comprises direct materials, direct labour and an appropriate proportion of variable and fixed overhead expenditures, the latter being allocated on the basis of normal operating capacity. Net realisable value is the estimated selling price in the ordinary course of business less the estimated costs of completion and the estimated costs necessary to make the sale including freight. Stores consist of consumable and maintenance stores and spare parts when they do not meet the definition of property, plant and equipment. Stores and spare parts are valued at the lower of cost and net realisable value. Cost is determined using either the first-in-first out (“FIFO”) or the weighted average method. (q)Non-current assets (or disposal groups) held for sale and discontinued operations Non-current assets (or disposal groups) are classified as held for sale if their carrying amount will be recovered principally through a sale transaction rather than through continuing use and a sale is considered highly probable. They are measured at the lower of their carrying amount and fair value less costs to sell, except for assets such as deferred tax assets, assets arising from employee benefits and financial assets that are carried at fair value, which are specifically exempt from this requirement. An impairment loss is recognised for any initial or subsequent write-down of the asset (or disposal group) to fair value less costs to sell. A gain is recognised for any subsequent increases in fair value less costs to sell of an asset (or disposal group), but not in excess of any cumulative impairment loss previously recognised. A gain or loss not previously recognised by the date of the sale of the non-current asset (or disposal group) is recognised at the date of derecognition. Non-current assets (including those that are part of a disposal group) are not depreciated or amortised while they are classified as held for sale. Interest and other expenses attributable to the liabilities of a disposal group classified as held for sale continue to be recognised. Non-current assets classified as held for sale and the assets of a disposal group classified as held for sale are presented separately from the other assets in the statement of financial position. The liabilities associated with an asset classified as held for sale and the liabilities of a disposal group classified as held for sale are presented separately from other liabilities in the statement of financial position. A discontinued operation is a component of the entity that has been disposed of or is classified as held for sale and that represents a separate major line of business or geographical area of operations, is part of a single coordinated plan to dispose of such a line of business or area of operations or is a subsidiary acquired exclusively with a view to resale. The results of discontinued operations are presented separately in profit or loss. (r) Property, plant and equipment Property, plant and equipment is recorded at historical cost less accumulated depreciation and accumulated impairment. Historical cost includes expenditures that are directly attributable to the acquisition and installation of the items. Cost may also include transfers from equity of any gain or loss on qualifying cash flow hedges of foreign currency purchases of property, plant and equipment. Subsequent costs are included in the asset’s carrying amount or recognised as a separate asset, as appropriate, only when it is probable that future economic benefits associated with the item will flow to the Group and the cost of the item can be measured reliably. The carrying amount of any component accounted for as a separate asset is derecognised when replaced. All other repairs and maintenance are charged to profit or loss during the financial period in which they are incurred. Land is not depreciated. Depreciation on other assets is calculated using the straight-line method to allocate their cost net of their residual values, over their estimated useful lives, as follows: –– Buildings – 25 to 40 years –– Plant and equipment – 1 to 20 years –– Leasehold improvements – lesser of life of asset or life of the lease 86 For personal use only Sims Metal Management Annual Report 2014 The assets’ residual values and useful lives are reviewed, and adjusted if appropriate, at the end of each reporting period. An asset’s carrying amount is written-down immediately to its recoverable amount if the asset’s carrying amount is greater than its estimated recoverable amount as set out in note 1(m). Gains and losses on disposals are determined by comparing proceeds with carrying amounts and recognised in profit or loss. (s) Financial assets (i)Classification The Group classifies its financial assets in the following categories: –– financial assets at fair value through profit or loss; –– loans and receivables; –– held-to-maturity investments; and –– available-for-sale financial assets. The classification depends on the purpose for which the investments were acquired. Management determines the classification of its investments at initial recognition and, in the case of assets classified as held-to-maturity, re-evaluates this designation at the end of each reporting period. (ii)Reclassification The Group may choose to reclassify a non-derivative trading financial asset out of the held for trading category if the financial asset is no longer held for the purpose of selling it in the near term. Financial assets other than loans and receivables are permitted to be reclassified out of the held for trading category only in rare circumstances arising from a single event that is unusual and highly unlikely to recur in the near term. In addition, the Group may choose to reclassify financial assets that would meet the definition of loans and receivables out of the held for trading or available-for-sale categories if the Group has the intention and ability to hold these financial assets for the foreseeable future or until maturity at the date of reclassification. Reclassifications are made at fair value as of the reclassification date. Fair value becomes the new cost or amortised cost as applicable, and no reversals of fair value gains or losses recorded before reclassification date are subsequently made. Effective interest rates for financial assets reclassified to loans and receivables and held-to-maturity categories are determined at the reclassification date. Further increases in estimates of cash flows adjust effective interest rates prospectively. If there is evidence of impairment for any of the Group’s financial assets carried at amortised cost, the loss is measured as the difference between the asset’s carrying amount and the present value of estimated future cash flows, excluding future credit losses that have not been incurred. The cash flows are discounted at the financial asset’s original effective interest rate. The loss is recognised in profit or loss. (iii) Recognition and derecognition Regular way purchases and sales of financial assets are recognised on trade-date, the date on which the Group commits to purchase or sell the asset. Financial assets are derecognised when the rights to receive cash flows from the financial assets have expired or have been transferred and the Group has transferred substantially all the risks and rewards of ownership. When securities classified as available-for-sale are sold, the accumulated fair value adjustments recognised in other comprehensive income are reclassified to profit or loss as gains and losses from investment securities. (iv)Measurement At initial recognition, the Group measures a financial asset at its fair value plus, in the case of a financial asset not at fair value through profit or loss, transaction costs that are directly attributable to the acquisition of the financial asset. Transaction costs of financial assets carried at fair value through profit or loss are expensed in profit or loss. Loans and receivables and held-to-maturity investments are subsequently carried at amortised cost using the effective interest method. Financial Statements Available-for-sale financial assets and financial assets at fair value through profit or loss are subsequently carried at fair value. Gains or losses arising from changes in the fair value of the “financial assets at fair value through profit or loss” category are presented in profit or loss within other income or other expenses in the period in which they arise. Dividend income from financial assets at fair value through profit or loss is recognised in profit or loss as part of revenue from continuing operations when the Group’s right to receive payments is established. 5 (v)Impairment The Group assesses at the end of each reporting period whether there is objective evidence that a financial asset or group of financial assets is impaired. A financial asset or a group of financial assets is impaired and impairment losses are incurred only if there is objective evidence of impairment as a result of one or more events that occurred after the initial recognition of the asset (a “loss event”) and that loss event (or events) has an impact on the estimated future cash flows of the financial asset or group of financial assets that can be reliably estimated. In the case of equity investments classified as availablefor-sale, a significant or prolonged decline in the fair value of the security below its cost is considered an indicator that the assets are impaired. 87 F INAN C IAL S TATEMENT S notes to the Consolidated financial statements For the year ended 30 June 2014 For personal use only Note 1 – Summary of significant accounting policies (continued) (s) Financial assets (continued) Assets carried at amortised cost For loans and receivables, the amount of the loss is measured as the difference between the asset’s carrying amount and the present value of estimated future cash flows (excluding future credit losses that have not been incurred) discounted at the financial asset’s original effective interest rate. The carrying amount of the asset is reduced and the amount of the loss is recognised in profit or loss. If a loan or held-to-maturity investment has a variable interest rate, the discount rate for measuring any impairment loss is the current effective interest rate determined under the contract. As a practical expedient, the Group may measure impairment on the basis of an instrument’s fair value using an observable market price. If, in a subsequent period, the amount of the impairment loss decreases and the decrease can be related objectively to an event occurring after the impairment was recognised (such as an improvement in the debtor’s credit rating), the reversal of the previously recognised impairment loss is recognised in profit or loss. Impairment testing of trade receivables is described in note 1(o). Assets classified as available-for-sale If there is objective evidence of impairment for available-for-sale financial assets, the cumulative loss (measured as the difference between the acquisition cost and the current fair value, less any impairment loss on that financial asset previously recognised in profit or loss) is removed from equity and recognised in profit or loss. Impairment losses on equity instruments that were recognised in profit or loss are not reversed through profit or loss in a subsequent period. If the fair value of a debt instrument classified as available-for-sale increases in a subsequent period and the increase can be objectively related to an event occurring after the impairment loss was recognised in profit or loss, the impairment loss is reversed through profit or loss. (t) Derivatives and hedging activities Derivatives are initially recognised at fair value on the date a derivative contract is entered into and are subsequently remeasured to their fair value at the end of each reporting period. The accounting for subsequent changes in fair value depends on whether the derivative is designated as a hedging instrument, and if so, the nature of the item being hedged. The Group designates certain derivatives as either: (i) hedges of the fair value of recognised assets or liabilities or a firm commitment (“fair value hedges”) or (ii) hedges of a particular risk associated with the cash flows of recognised assets and liabilities and highly probable forecast transactions (“cash flow hedges”). Certain derivative instruments do not qualify for hedge accounting, despite being valid economic hedges of the relevant risks. Changes in the fair value of any derivative instrument that does not qualify for hedge accounting are recognised immediately in profit or loss and are included in other income or other expenses. The Group documents, at the inception of the hedging transaction, the relationship between hedging instruments and hedged items, as well as its risk management objective and strategy for undertaking various hedge transactions. The Group also documents its assessment, both at hedge inception and on an ongoing basis, of whether the derivatives that are used in hedging transactions have been, and will continue to be, highly effective in offsetting changes in fair values or cash flows of hedged items. The fair values of various derivative financial instruments used for hedging purposes are disclosed in note 11. Movements in the hedging reserve in equity are shown in note 20. The full fair value of a hedging derivative is classified as a non-current asset or liability when the remaining maturity of the hedged item is more than 12 months; it is classified as a current asset or liability when the remaining maturity is less than 12 months. Options and warrants associated with listed equity securities and the conversion feature of convertible loans are classified as derivatives on the statement of financial position. (i) Fair value hedge Changes in the fair value of derivatives that are designated and qualify as fair value hedges are recorded in profit or loss, together with any changes in the fair value of the hedged asset or liability that are attributable to the hedged risk. (ii) Cash flow hedge The effective portion of changes in the fair value of derivatives that are designated and qualify as cash flow hedges are recognised in other comprehensive income and accumulated in the hedging reserve in equity. The gain or loss relating to the ineffective portion is recognised immediately in profit or loss. Amounts accumulated in equity are reclassified to profit or loss in the periods when the hedged item impacts profit or loss (for instance when the forecast sale that is hedged takes place). The gain or loss relating to the effective portion of forward foreign exchange contracts hedging export sales is recognised in profit or loss within revenue. Where the hedged item is the cost of a non-financial asset or liability, such as a forecast transaction for the purchase of property, plant and equipment, the amounts recognised within other comprehensive income are transferred to the initial carrying amount of the non-financial asset or liability. When a hedging instrument expires or is sold or terminated, or when a hedge no longer meets the criteria for hedge accounting, any cumulative gain or loss existing in equity at that time remains in equity and is recognised when the forecast transaction is ultimately recognised in profit or loss. When a forecast transaction is no longer expected to occur, the cumulative gains or losses that were deferred in equity are immediately transferred to profit or loss. 88 For personal use only (i)Goodwill Goodwill is measured as described in note 1(f). Goodwill is not amortised but it is tested for impairment annually or more frequently if events or changes in circumstances indicate that it might be impaired, and is carried at cost less accumulated impairment losses. Gains and losses on the disposal of an entity include the carrying amount of goodwill relating to the entity sold. Sims Metal Management Annual Report 2014 (u)Goodwill and other intangible assets Goodwill is allocated to CGUs for the purpose of impairment testing. The allocation is made to those CGUs or groups of CGUs that are expected to benefit from the business combination from which the goodwill arose. (ii)Trade name Trade name relates principally to the “Metal Management” trading name. This intangible asset has a finite useful life and is carried at cost less accumulated amortisation. Amortisation is calculated using the straight-line method to allocate the cost of the trade name over its estimated useful life, which is 20 years. (iii) Supplier relationships and contracts Supplier relationships and contracts acquired as part of a business combination are recognised separately from goodwill. The supplier relationships and contracts are carried at their fair value at the date of acquisition less accumulated amortisation and impairment losses. Amortisation is calculated based on the timing of projected cash flows of the supplier relationships or straight-line method (as appropriate) over their estimated useful lives, which currently vary from one to nine years. (iv)Permits Permits acquired as part of a business combination are recognised separately from goodwill. Permits are issued by state and local governments and are renewable at little or no cost and are thus considered to have an indefinite life. Permits are carried at their fair value at the date of acquisition and are not amortised. Instead, permits are tested for impairment annually, or more frequently if events or changes in circumstances indicate that they might be impaired, and are carried at cost less accumulated impairment losses. Permits that relate to facilities that have closed, relocated or sold are written-off to nil at the time the facility is closed, relocated or sold. (v)Trade and other payables Trade and other payable amounts represent liabilities for goods and services provided to the Group prior to the end of a financial year, which are unpaid. The amounts are unsecured and are usually payable within 30 days of recognition. (w)Borrowings Borrowings are initially recognised at fair value, net of transaction costs incurred. Borrowings are subsequently measured at amortised cost. Any difference between the proceeds (net of transaction costs) and the redemption amount is recognised in profit or loss over the period of the borrowings using the effective interest method. Fees paid on the establishment of loan facilities, which are not an incremental cost relating to the actual draw-down of the facility, are recognised as prepayments and amortised to finance costs on a straight-line basis over the term of the loan facility. Borrowings are removed from the statement of financial position when the obligation specified in the contract is discharged, cancelled or expired. The difference between the carrying amount of a financial liability that has been extinguished or transferred to another party and the consideration paid, including any non-cash assets transferred or liabilities assumed, is recognised in profit or loss as other income or finance costs. Borrowings are classified as current liabilities unless the Group has the unconditional right to defer settlement of the liability for at least 12 months after the reporting period. (x) Borrowing costs (y)Provisions Provisions are recognised when the Group has a present legal or constructive obligation as a result of past events, it is probable that an outflow of resources will be required to settle the obligation and the amount can be reliably estimated. Provisions are not recognised for future operating losses. 5 Financial Statements Borrowing costs incurred for the construction of any qualifying asset are capitalised during the period of time required to complete and prepare the asset for its intended use. Other borrowing costs are recognised as expenses in the period in which they are incurred. Where there are a number of similar obligations, the likelihood that an outflow will be required in settlement is determined by considering the class of obligations as a whole. A provision is recognised even if the likelihood of an outflow with respect to any one item included in the same class of obligations may be small. Provisions are measured at the present value of management’s best estimate of the expenditure required to settle the present obligation at the end of the reporting period. The discount rate used to determine the present value is a pre-tax rate that reflects current market assessments of the time value of money and the risks specific to the liability. The increase in the provision due to the passage of time is recognised as interest expense. Provisions for onerous leases are recognised when the Group believes that the unavoidable costs of meeting the lease obligations exceed the economic benefits expected to be received under the lease. Provisions for dilapidation costs are recognised on a lease by lease basis. 89 F INAN C IAL S TATEMENT S notes to the Consolidated financial statements For the year ended 30 June 2014 For personal use only Note 1 – Summary of significant accounting policies (continued) 90 (z)Employee benefits (i) Short-term obligations Liabilities for wages and salaries, including non-monetary benefits and accumulating sick leave that are expected to be settled within 12 months after the end of the period in which employees render the related service are recognised in respect of employees’ services up to the end of the reporting period and are measured at the amounts expected to be paid when the liabilities are settled. The liability for accumulating sick leave is recognised in the provision for employee benefits. All other short‑term benefit obligations are presented as payables. (ii) Other long-term employee benefit obligations The liability for long service leave is recognised in the provision for employee benefits and measured as the present value of expected future payments to be made in respect of services provided by employees up to the end of the reporting period in which the employees render the related service. Consideration is given to expected future wage and salary levels, experience of employee departures and periods of service. Expected future payments are discounted using market yields at the reporting date on national government bonds with terms to maturity and currency that match, as closely as possible, the estimated future cash outflows. (iii) Retirement benefits The cost of providing benefits under the defined benefit plans is determined separately for each plan using the projected unit credit method. Past service costs, resulting from either a plan amendment or a curtailment are recognised immediately in profit or loss. Net interest expense relating to defined benefit plans represents the net change in present value of plan obligations and the value of plan assets resulting from the passage of time, and is determined by applying the discount rate to the present value of the benefit obligation at the start of the year, and to the fair value of plan assets at the start of the year, taking into account expected changes in the obligation or plan assets during the year. Re-measurements of the net defined benefit liability or asset, comprising actuarial gains and losses, and the return on plan assets (excluding amounts included in net interest described above) are recognised within other comprehensive income in the period in which they occur. Re-measurements are not reclassified to profit or loss in subsequent periods. The defined benefit pension plan asset or obligation in the statement of financial position comprises the total for each plan of the present value of the defined benefit obligation (using a discount rate based on high quality corporate bonds), less the fair value of plan assets out of which the obligations are to be settled directly. Fair value is based on market price information and, in the case of quoted securities, is the published bid price. Contributions to defined contribution plans are recognised in the income statement in the period in which they become payable. (iv)Termination benefits Termination benefits are payable when employment is terminated before the normal retirement date, or when an employee accepts voluntary redundancy in exchange for these benefits. The Group recognises termination benefits at the earlier of the following dates: (a) when the Group can no longer withdraw the offer of those benefits; or (b) when the entity recognises costs for a restructuring that is within the scope of AASB 137 (IAS 37) and involves the payment of termination benefits. In the case of an offer made to encourage voluntary redundancy, the termination benefits are measured based on the number of employees expected to accept the offer. Benefits due more than 12 months after the end of the reporting period are discounted to present value. (v) Share-based payments Share-based compensation benefits are provided to certain employees via the schemes set out in note 24. For share-based arrangements, the fair value is measured at grant date and recognised as an employee benefit expense with a corresponding increase in equity. For cash-settled share-based arrangements, the fair value of the amount payable is recognised as an employee benefit expense with a corresponding increase to a liability. The liability is re-measured each reporting date and at settlement date. Any changes in the fair value of the liability are recognised as an employee benefit expense in profit or loss. The fair value at grant date is independently determined using either a binomial model or a Monte-Carlo simulation model. The model takes into account the exercise price, the term, the share price at grant date and expected price volatility of the underlying share, the expected dividend yield and the risk-free interest rate for the term of the grant. The fair value is adjusted to reflect market vesting conditions, but excludes the impact of any non-market vesting conditions (for example, earnings per share targets). Non-market vesting conditions are included in assumptions about the number of shares that are expected to become exercisable. At the end of each reporting period, the Group revises its estimate of the number of shares that are expected to become exercisable. The employee benefit expense recognised each period takes into account the most recent estimate. The impact of the revision to original estimates, if any, is recognised in profit or loss with a corresponding adjustment to equity. For personal use only Ordinary shares are classified as equity. Incremental costs directly attributable to the issuance of new shares are shown in equity as a deduction, net of tax, from the proceeds. Sims Metal Management Annual Report 2014 (aa) Contributed equity When the Company purchases any of its own equity instruments, for example, as a result of a share buy-back, the consideration paid, including any directly attributable incremental costs (net of income taxes) is deducted from contributed equity and any reacquired shares are cancelled upon their purchase. (ab) Dividends A provision is made for the amount of any dividends declared on or before the end of the reporting period, but not distributed at the end of the reporting period. (ac) Earnings per share (“EPS”) Basic earnings per share is calculated by dividing net profit by the weighted average number of ordinary shares outstanding during the financial year, adjusted for bonus elements in ordinary shares issued during the year. Diluted earnings per share adjusts the figures used in the determination of basic earnings per share to take into account the after income tax effect of interest and other financing costs associated with dilutive potential ordinary shares, and the weighted average number of additional ordinary shares that would have been outstanding assuming the conversion of all dilutive potential ordinary shares. (ad) Goods and services or other value-added taxes (“GST”) Cash flows are presented on a gross basis. The GST components of cash flows arising from investing or financing activities which are recoverable from, or payable to the taxation authority, are presented as operating cash flows. (ae) Parent entity financial information The financial information for the parent entity, Sims Metal Management Limited, disclosed in note 30, has been prepared on the same basis as the consolidated financial statements, except as set out below. (i)Investments in subsidiaries Investments in subsidiaries are accounted for at cost in the financial statements of the Company. Dividends received from subsidiaries are recognised in the Company’s profit or loss, rather than being deducted from the carrying amount of the investments. (ii)Tax consolidation legislation The Company and its wholly-owned Australian controlled entities have implemented the tax consolidation legislation. The head entity, Sims Metal Management Limited, and the controlled entities in the tax consolidated group, account for their own current and deferred tax amounts. These amounts are measured as if each entity in the tax consolidated group continues to be a standalone taxpayer in its own right. In addition to its current and deferred tax amounts, the Company also recognises the current tax liabilities (or assets) and the deferred tax assets arising from unused tax losses and unused tax credits assumed from controlled entities in the tax consolidated group. The entities have also entered into a tax funding agreement under which the wholly-owned entities fully compensate the Company for any current tax receivable and deferred tax assets relating to unused tax losses or unused tax credits that are transferred to the Company under the tax consolidation legislation. The funding amounts are determined by reference to the amounts recognised in the wholly-owned entities’ financial statements. Assets or liabilities arising under the tax funding agreements with the tax consolidated entities are recognised as current amounts receivable from or payable to other entities in the Group. Any difference between the amounts assumed and amounts receivable or payable under the tax funding agreement are recognised as a contribution to (or distribution from) wholly-owned tax consolidated entities. 5 Financial Statements The amount receivable/payable under the tax funding agreement is due upon receipt of the funding advice from the head entity, which is issued as soon as practicable after the end of each financial year. The head entity may also require payment of interim funding amounts to assist with its obligations to pay tax installments. 91 F INAN C IAL S TATEMENT S notes to the Consolidated financial statements For the year ended 30 June 2014 For personal use only Note 2 – Financial risk management 92 The Group’s activities expose it to a variety of financial risks: market risk (including interest rate risk, foreign exchange risk, commodity price risk and equity securities price risk), credit risk and liquidity risk. The Group’s overall financial risk management strategy seeks to mitigate these risks to minimise potential adverse effects on the financial performance of the Group. The Group uses derivative financial instruments in certain circumstances in accordance with Board approved policies to hedge exposure to fluctuations in foreign exchange rates and commodity prices. Derivative financial instruments are used for hedging purposes and not as trading or other speculative instruments. The Group uses different methods to measure different types of risk to which it is exposed. These methods include monitoring key movements in interest rates, key transactions impacted by foreign exchange, commodity prices, equity prices and ageing analysis for credit risk. Risk management is carried out by a limited number of employees as authorised by the Board. The Board provides written principles for overall risk management, as well as written policies covering specific areas, such as foreign exchange risk, interest rate risk, credit risk, use of derivative financial instruments and non-derivative financial instruments and the investment of excess liquidity. The Risk, Audit & Compliance Committee (“RAC”) of the Board oversees, on a quarterly basis, the monitoring of compliance by management with the Group’s risk management framework. The RAC is assisted in its oversight role by Internal Audit. Internal Audit undertakes both regular and ad hoc reviews of risk management controls and procedures, the results of which are also reported to the RAC. The carrying amounts and estimated fair value of all the Group’s financial assets and liabilities approximate each other. The carrying amount is recognised in the statement of financial position as follows: Note 2014 A$m 2013 A$m Financial assets: Cash and cash equivalents Trade and other receivables Other financial assets Total financial assets 31 9 11 57.2 445.6 59.0 561.8 46.9 455.4 77.0 579.3 Financial liabilities: Trade and other payables Borrowings Other financial liabilities Total financial liabilities 15 16 11 577.9 14.9 4.5 597.3 593.5 200.7 6.3 800.5 (a)Market risk Market risk is the risk that the fair value or future cash flows of the Group’s financial instruments will fluctuate because of changes in market prices. The market risks to which the Group is exposed are discussed in further detail below: (i)Interest rate risk Interest rate risk arises from interest bearing financial assets and liabilities that the Group utilises. The Group’s main exposure to interest rate risk arises from borrowings at variable interest rates. The Group does not use any derivative financial instruments to manage its exposure to interest rate risk. Cash deposits, loans to third parties and associates and borrowings issued at fixed rates expose the Group to fair value interest rate risk. The Group’s borrowings are sourced primarily from domestic, but also offshore, markets. The Group’s borrowings consist primarily of foreign currency denominated borrowings and are managed in accordance with targeted currency, interest rate, liquidity and debt portfolio maturity profiles. Specifically, interest rate risk is managed on the Group’s net debt portfolio by: –– providing access to diverse sources of funding; –– reducing risks of refinancing by establishing and managing in accordance with target maturity profiles; and –– negotiating interest rates with the Group’s banks based on a variable pricing matrix, which generally involves a LIBOR rate plus a margin. The Group’s weighted average interest rate on interest-bearing liabilities for the year ended 30 June 2014 was 2.6% (2013: 2.8%). If interest rates had increased by 100 basis points as at the balance date with all other variables held constant, post-tax profit for the year ended 30 June 2014 would have been A$0.1 million lower (2013: A$1.5 million lower). A sensitivity of 100 basis points is deemed reasonable based on current and past market conditions. The calculations are based on interest-bearing financial instruments with variable interest rates at the end of the reporting period. A 100 basis points decrease in interest rates would have an equal and opposite effect. For personal use only Commodity price risk The Group is exposed to risks associated with fluctuations in the market price for ferrous and non-ferrous metals and precious metals, which are at times volatile. The Group seeks to mitigate commodity price risk by seeking to turn over its inventories quickly, instead of holding inventories in anticipation of higher commodity prices. The ability of the Group to accomplish an adequate level of inventory turnover can be a function of demand and market conditions which are not always steady. The Group uses forward commodity contracts matched to purchases or sales of non-ferrous metals (primarily copper, nickel and aluminium) and certain precious metals (primarily gold, silver and palladium). Sims Metal Management Annual Report 2014 (ii) Price risk The Group’s normal policy is to sell its products at prevailing market prices. Exceptions to this rule are subject to limits and policies approved by the Board and to systems of internal controls and compliance monitoring. The Group’s exposure to commodity prices is, to an extent, diversified by virtue of its broad commodity base. At the end of the reporting period, none of the Group’s forward commodity contracts qualified for hedge accounting, despite being valid economic hedges of the relevant risk. Accordingly, any movement in commodity rates that impact the fair value of these forward commodity contracts are recorded in profit or loss. Note 11 shows the carrying amount of the Group’s forward commodity contracts at the end of the reporting period. The following table shows the effect on post-tax profit from a 10% appreciation in commodity prices at the end of the reporting period being applied to outstanding forward commodity contracts, with all other variables held constant. A 10% sensitivity has been selected, as this is considered reasonable, given the current level of commodity prices and the volatility observed both on a historical basis and on market expectations for future movements. Impact on post-tax profit – higher/(lower) 2014 A$m 2013 A$m (8.8) (11.3) A 10% depreciation of the stated commodity prices would have an equal and opposite effect. Equity securities price risk The Group is exposed to equity securities price risk through financial instruments classified as fair value through profit or loss, whose valuations are partially derived from equity prices of listed securities. These financial instruments relate to an investment in an associate. The Group does not attempt to manage the price risk related to these financial instruments. The Group is also exposed to equity securities price risk through investments in marketable securities. These marketable securities are traded in major financial markets. The price risk for these investments is immaterial in terms of possible impact on profit or loss. (iii) Foreign exchange risk The Group operates internationally and is exposed to foreign exchange risk, primarily with respect to transactions settled in US dollars. Foreign exchange risk arises when future commercial transactions and recognised assets and liabilities are denominated in a currency that is not the entity’s functional currency. Financial assets and liabilities denominated in currencies other than the functional currency of an entity are periodically restated to their functional currency, and the associated gain or loss is taken to profit or loss. The exposure of an entity to transaction risk is minimised by matching local currency income with local currency costs. The Group seeks to denominate borrowings in the currencies of its principal assets and cash flows. These are primarily denominated in US dollars, British pounds sterling, Euros and Australian dollars. The Group’s exposure to foreign exchange risk at the end of the reporting period, expressed in Australian dollars, was as follows: Currency US dollar Euro British pounds sterling Net financial assets/(liabilities) 2014 A$m 6.8 8.8 0.2 5 Financial Statements In accordance with Board approved policies, the Group enters into forward foreign exchange contracts to buy and sell specific amounts of various foreign currencies in the future at predetermined exchange rates. The forward foreign exchange contracts are used to hedge transactions denominated in currencies that are not the functional currency of the relevant entity. These contracts are hedging highly probable forecasted transactions and recognised assets and liabilities for the ensuing financial year. The contracts are timed to mature when monies from the forecasted sales are scheduled to be received or when payments for purchases are scheduled to be made. 2013 A$m 8.9 17.3 (0.2) 93 F INAN C IAL S TATEMENT S notes to the Consolidated financial statements For the year ended 30 June 2014 For personal use only Note 2 – Financial risk management (continued) (a)Market risk (continued) (iii) Foreign exchange risk (continued) The table below shows the net impact of a 10% appreciation of the relevant currency against the Australian dollar for the balances above with all other variables held constant and the corresponding effect on the Group’s forward foreign exchange contracts with all other variables held constant. A sensitivity of 10% has been selected, as this is considered reasonable, given the current level of exchange rates and the volatility observed both on a historical basis and on market expectations for future movements. US dollar 2014 A$m Impact on post-tax profit – higher/(lower) Impact on equity (1.7) 19.8 Euro 2013 A$m 2013 A$m 2014 A$m 2013 A$m 0.1 0.5 – – (1.2) (0.5) – 10.0 (1.9) 20.2 The impact on equity includes the effect from intragroup long-term borrowings which, in substance, form part of the Group’s investment in an entity. Exchange gains and losses on these balances are recorded in the foreign currency translation reserve. A 10% depreciation of the relevant currency against the Australian dollar would have an equal and opposite effect. Translation risk The financial statements for each of the Group’s foreign operations are prepared in local currency, being their functional currency. For the purposes of preparing the Group’s consolidated financial information, each foreign operation’s financial statements are translated into Australian dollars using the applicable foreign exchange rates as at the balance date. A translation risk, therefore, exists on translating the financial statements of the Group’s foreign operations into Australian dollars for the purposes of reporting consolidated financial information. As a result, volatility in foreign exchange rates can impact the Group’s net assets, net profit and the foreign currency translation reserve and, as a result, can influence compliance with credit agreements. (b) Credit risk Credit risk is the risk that a counterparty will not complete its obligations under a financial instrument and cause a financial loss to the Group. The Group has exposure to credit risk on all financial assets included in the Group’s statement of financial position. The Group establishes credit limits for its customers. Trade and other receivables consist of a large number of customers, spread across various metal producing sectors in international markets. The Group does not have any significant credit risk exposure to a single customer or groups of customers. Ongoing credit evaluation is performed on the financial condition of the Group’s customers and, where appropriate, an impairment provision is raised. For certain customers, the Group purchases credit insurance to protect itself against collection risks. The Group is also exposed to credit risk arising from the Group’s transactions in derivative contracts. For credit purposes, there is only a credit risk where the counterparty is liable to pay the Group in the event of a closeout. The Group has policies that limit the amount of credit exposure to any financial institution. Derivative counterparties and cash transactions are limited to financial institutions that have a minimum credit rating of “A” by either Standard & Poor’s or Moody’s. Management also monitors the current credit exposure with each counterparty. Any changes to counterparties or their credit limits must be approved by the Group Chief Financial Officer. Refer to note 9 for quantitative data. (c)Liquidity risk Liquidity risk is associated with ensuring that there is sufficient cash and cash equivalents on hand and the availability of funding through an adequate amount of committed credit facilities to meet the Group’s obligations as they mature and the ability to close out market positions. The Group manages liquidity risk by monitoring forecast and actual cash flows and matching the maturity profiles of financial assets and liabilities. Due to the dynamic and volatile nature of the underlying businesses, the Group aims at maintaining flexibility in funding by keeping committed credit lines available with a variety of counterparties. The Group has access to unsecured global multi-currency/multi-option loan facilities, all of which are subject to common terms. The loan facilities have maturities through 31 October 2016. The Group also has annual rights to extend the maturity by an additional year in certain circumstances. The Group had access to the following credit standby arrangements at the balance date. The amount of credit available is subject to limits from covenants as specified in the loan facilities. Unsecured global multi-currency/multi-option loan facilities Amount of credit unused There have been no breaches of the Group’s bank covenants during the period. 94 British pounds 2014 A$m 2014 A$m 2013 A$m 1,352.9 1,314.9 1,396.7 1,177.4 For personal use only 2014 Non-derivatives: Trade and other payables Finance lease liabilities Borrowings (excluding finance leases) Derivatives: Net settled (forward commodity contracts) Gross settled (forward foreign exchange contracts): (inflows) outflows Financial guarantees1 Less than 1 year A$m Between Between 1 and 2 years 2 and 5 years A$m A$m Over 5 years A$m Total A$m 571.4 0.6 10.0 1.9 0.6 10.0 2.8 1.7 15.7 1.8 0.1 – 577.9 3.0 35.7 4.3 – – – 4.3 (38.7) 38.9 586.5 54.1 640.6 – – 12.5 – 12.5 – – 20.2 – 20.2 – – 1.9 – 1.9 (38.7) 38.9 621.1 54.1 675.2 585.2 30.7 2.3 19.1 4.6 195.5 1.4 – 593.5 245.3 0.8 – – – 0.8 (224.4) 229.9 622.2 61.9 684.1 – – 21.4 – 21.4 – – 200.1 – 200.1 – – 1.4 – 1.4 (224.4) 229.9 845.1 61.9 907.0 Sims Metal Management Annual Report 2014 The contractual cash flows of the Group’s financial liabilities are shown in the table below. The contractual amounts represent the future undiscounted cash flows. The amounts for interest bearing liabilities also include interest cash flows and therefore, do not equate to the carrying amount. The expected timing of cash outflows are set out below: 2013 Non-derivatives: Trade and other payables Borrowings Derivatives: Net settled (forward commodity contracts) Gross settled (forward foreign exchange contracts): (inflows) outflows Financial guarantees1 1 Refer to note 22(a) for details on financial guarantees. The amounts disclosed above are the maximum amounts allocated to the earliest period in which the guarantee could be called. However, the Group considers that it is more likely than not that such an amount will not be payable under the arrangement. 5 Financial Statements 95 F INAN C IAL S TATEMENT S notes to the Consolidated financial statements For the year ended 30 June 2014 For personal use only Note 3 – Critical accounting estimates and judgements Certain amounts included in the consolidated financial statements involve the use of estimation and/or judgement. Estimates and judgements used in preparation of the consolidated financial statements are continually evaluated and are based on historical experience and other factors, including the expectations of future events that may have a financial impact on the Group and that are believed to be reasonable under the circumstances. The resulting accounting estimates may differ from actual results. The Group has identified the following areas that involve critical judgements and estimations that have the most significant effect on the amounts recognised in the consolidated financial statements. Impairment of goodwill Goodwill is tested for impairment in accordance with the accounting policy stated in note 1(m). For goodwill impairment testing, the recoverable amount of each CGU is determined based on the higher of its value in use or fair value less costs to sell. These calculations require the use of assumptions such as discount rates, exchange rates, growth rates and other assumptions. As at 30 June 2014, the carrying amount of goodwill was A$139.3 million. Refer to note 13 for details of these assumptions and the potential impact of changes to the assumptions. Taxation The Group is subject to income taxes in numerous jurisdictions. Significant judgement is required in determining the worldwide provision for income taxes due to the complexity of legislation. There are many transactions and calculations for which the ultimate tax determination is uncertain during the ordinary course of business. The Group recognises liabilities for anticipated tax audit issues based on estimates of whether additional taxes will be due. Where the final tax outcome of these matters is different from the amounts that were initially recorded, such differences will impact the income tax and deferred tax provisions in the period in which such determination is made. The Group recognises the net future tax benefit related to deferred income tax assets to the extent that it is probable that the deductible temporary differences will reverse in the foreseeable future. Assessing the recoverability of deferred income tax assets requires the Group to make significant estimates related to expectations of future taxable income. Estimates of future taxable income are based on forecast cash flows from operations and the application of existing tax laws in each jurisdiction. To the extent that future cash flows and taxable income differ significantly from estimates, the ability of the Group to realise the net deferred tax assets recorded at the reporting date could be impacted. Additionally, future changes in tax laws in the jurisdictions in which the Group operates could limit the ability of the Group to obtain tax deductions in future periods. For more information see note 8(f). Valuation of inventories The Group’s inventories primarily consist of ferrous and non-ferrous scrap metals. Quantities of inventories are determined using various estimation techniques, including observation, weighing and other industry methods and are subject to periodic physical verification. Inventories are stated at the lower of cost and net realisable value, with due allowance for excess, obsolete or slow moving items. Cost is determined by the weighted average method and comprises direct purchase costs, direct labour and an appropriate portion of fixed and variable overhead costs (refer to note 1(p)). The Group reviews its inventory at the end of each reporting period to determine if it is properly stated at net realisable value. Net realisable value is based on current assessments of future demand and market conditions. The amount of write-downs of inventories to net realisable value is disclosed in note 7. Given the significance of inventories to the consolidated statement of financial position, the determination of net realisable value is considered to be a critical accounting estimate. Impairment losses may be recognised on inventory in the next financial year if management needs to revise its estimates of net realisable value in response to changing market conditions. Note 4 – Loss per share 2014 Loss per share (in cents) Basic Diluted Weighted average number of shares used in the denominator (’000) Basic shares Dilutive effect of share-based awards Diluted shares (43.5) (43.5) 204,410 – 204,410 2013 restated 2012 restated (228.6) (228.6) (302.7) (302.7) 204,391 – 204,391 205,828 – 205,828 Due to the loss after tax in the years ended 30 June 2014, 2013 and 2012, the dilutive effect of share-based awards, which was approximately 0.3 million, 2.8 million and 2.0 million shares, respectively, was not included as the result would have been anti‑dilutive. Details relating to share awards are set out in note 24. 96 Sims Metal Management Annual Report 2014 For personal use only Note 5 – Segment information (a) Description of segments The Group is principally organised geographically and then by line of business. While the CEO has historically evaluated results in a number of different ways, the geographical area of operation is the primary basis for which the allocations of resources and financial results are assessed. The major geographic areas of operations are as follows: –– North America – comprising the United States (“US”) and Canada. –– Australasia – comprising Australia, New Zealand, Papua New Guinea, India, Singapore, Hong Kong, Dubai and South Africa. –– Europe – comprising the United Kingdom (“UK”), Sweden, Belgium, the Netherlands, Germany, Poland, the Czech Republic, Austria and Norway. The Group reports revenues by the following product groups: –– Ferrous secondary recycling – comprising the collection, processing and trading of iron and steel secondary raw material. –– Non-ferrous secondary recycling – comprising the collection, processing and trading of other metal alloys and residues, principally aluminium, lead, copper, zinc and nickel bearing materials. –– Recycling solutions – comprising the provision of environmentally responsible solutions for the disposal of post- consumer electronic products, including IT assets recycled for commercial customers. The Group offers fee-for-service business opportunities in the environmentally responsible recycling of negative value materials, including refrigerators, electrical and electronic equipment. –– Secondary processing and other services – comprising value-added processes involving the melting, refining and ingoting of certain non-ferrous metals and other sources of service based revenue. (b)Information about reportable segments There have been no changes to the basis of segmentation or the measurement basis for the segment profit before income tax since 30 June 2013. 2014 Total sales revenue Other revenue/income Total segment revenue Segment EBIT Interest income Finance costs Loss before income tax Segment total assets Segment total liabilities Net assets Australasia A$m Europe A$m A$m 4,253.5 4.0 4,257.5 1,223.9 10.6 1,234.5 1,651.6 0.7 1,652.3 7,129.0 15.3 7,144.3 (57.1) 1,494.0 386.9 1,107.1 73.9 629.3 203.2 426.1 (44.4) 526.1 225.4 300.7 (27.6) 9.0 (23.2) (41.8) 2,649.4 815.5 1,833.9 (70.2) 2.1 225.4 39.2 (28.6) (5.4) 89.5 17.5 (25.1) 7.4 (123.9) (3.3) 314.9 64.1 (27.8) (0.7) (12.4) 2.4 (30.9) (27.8) (0.7) (40.9) 5 Financial Statements Other items: Depreciation and amortisation expense Share of results of investments accounted for using the equity method Investments accounted for using the equity method Acquisitions of property, plant and equipment Impairment (charge)/reversal: Goodwill Other intangible assets Property, plant and equipment North America A$m 97 F INAN C IAL S TATEMENT S notes to the Consolidated financial statements For the year ended 30 June 2014 For personal use only Note 5 – Segment information (continued) 98 (b)Information about reportable segments (continued) North America A$m Australasia A$m Europe A$m A$m Total sales revenue Other revenue/income Total segment revenue 4,534.6 1.2 4,535.8 1,083.1 8.0 1,091.1 1,575.3 0.9 1,576.2 7,193.0 10.1 7,203.1 Segment EBIT Interest income Finance costs Loss before income tax (329.0) 9.2 (150.6) (470.4) 7.3 (25.5) (488.6) Segment total assets Segment total liabilities Net assets 1,660.0 477.7 1,182.3 672.0 165.0 507.0 585.4 345.5 239.9 2,917.4 988.2 1,929.2 (68.1) (0.4) 233.1 79.2 (26.0) (27.3) 96.9 50.2 (29.4) 19.6 (123.5) (27.7) 330.0 149.0 (292.2) (8.5) (17.1) - (3.7) (44.1) (292.2) (12.2) (61.2) 2013 (restated) Other items: Depreciation and amortisation expense Share of results of investments accounted for using the equity method Investments accounted for using the equity method Acquisitions of property, plant and equipment Impairment charge: Goodwill Other intangible assets Property, plant and equipment 2012 (restated) Total sales revenue Other revenue/income Total segment revenue 6,027.0 0.5 6,027.5 1,228.1 5.3 1,233.4 1,780.6 0.8 1,781.4 9,035.7 6.6 9,042.3 Segment EBIT Interest income Finance costs Loss before income tax (615.9) 92.7 (100.8) (624.0) 3.8 (25.1) (645.3) Segment total assets Segment total liabilities Net assets 2,066.3 608.6 1,457.7 733.0 190.1 542.9 709.7 426.1 283.6 3,509.0 1,224.8 2,284.2 (77.1) (11.9) 230.9 79.0 (24.9) 3.9 120.2 39.5 (27.9) 42.6 (129.9) (8.0) 351.1 161.1 (510.8) (0.8) (3.1) (3.6) (0.3) (102.9) 3.0 (617.3) (0.8) (0.4) Other items: Depreciation and amortisation expense Share of results of investments accounted for using the equity method Investments accounted for using the equity method Acquisitions of property, plant and equipment Impairment (charge)/reversal: Goodwill Other intangible assets Property, plant and equipment Sims Metal Management Annual Report 2014 (c) Other segment information For personal use only (i)Intersegment sales Segment revenues, expenses and results include transfers between segments. Such transfers are priced on an “arm’s-length” basis and are eliminated on consolidation. (ii) Sales to external customers Australia China United States Turkey South Korea Other Total sales revenue 2014 A$m 2013 A$m 2012 A$m 357.4 578.3 1,772.9 1,063.8 337.0 3,019.6 7,129.0 323.7 942.8 1,499.9 1,276.8 235.7 2,914.1 7,193.0 339.9 1,844.6 1,925.3 1,643.9 432.7 2,849.3 9,035.7 2014 A$m 2013 A$m 2012 A$m 4,801.4 1,361.5 909.8 56.3 7,129.0 4,817.0 1,353.0 968.8 54.2 7,193.0 6,258.6 1,656.5 1,011.8 108.8 9,035.7 No single customer contributed 10% or more to the Group revenue for all the periods presented. (iii) Revenue by product Ferrous secondary recycling Non-ferrous secondary recycling Recycling solutions Secondary processing and other services Total sales revenue (iv)Non-current assets Non-current assets (excluding financial assets and deferred tax assets) are held in the following countries: 2014 A$m 2013 A$m RESTATED 271.2 871.3 102.6 190.7 1,435.8 277.9 967.5 135.0 216.8 1,597.2 2014 A$m 2013 A$m 2012 A$m 7,031.0 98.0 7,129.0 7,112.4 80.6 7,193.0 8,965.9 69.8 9,035.7 9.0 6.3 15.3 7,144.3 7.3 2.8 10.1 7,203.1 3.7 2.9 6.6 9,042.3 Australia United States United Kingdom Other Note 6 – Revenue Other revenue Interest income Rental income Total revenue 5 Financial Statements Sales revenue Sale of goods Service revenue 99 F INAN C IAL S TATEMENT S notes to the Consolidated financial statements For the year ended 30 June 2014 For personal use only Note 7 – Other income and expenses 100 (a) Other income Net gain on commodity derivatives Net gain on currency derivatives Net gain on revaluation of financial assets at fair value through profit or loss Gain on sale of joint venture 1 Commercial settlements Gain on sale of other financial assets Insurance recoveries Government grants Net gain on disposal of property, plant and equipment Reimbursement of expenses from a third party Third party commissions Other Total other income 1 2014 A$m 2013 A$m 2012 A$m – 1.5 0.3 – – 0.3 8.9 0.4 – 1.2 2.2 6.3 21.1 31.2 6.1 – – 3.3 – 1.4 0.7 – 2.7 3.2 4.0 52.6 34.0 4.1 – 35.7 1.4 – 5.3 0.5 2.8 – 4.2 3.2 91.2 Represents the gain from the sale of the Group’s 50% ownership interest in the secondary lead producing facility in Sydney, Australia of Australian Refined Alloys (see note 26). (b) Specific expenses recognised in loss before income tax Depreciation and amortisation: Depreciation expense Amortisation expense Finance costs 1 Net foreign exchange loss Net loss on revaluation of financial assets at fair value through profit or loss 2 Equity-settled share-based payments expense 3 Cash-settled share-based payments expense Defined contribution plan expense Rental expenses relating to operating leases Net loss on disposal of property, plant and equipment Net loss on commodity derivatives 1 2 3 2014 A$m 2013 A$m RESTATED 2012 A$m RESTATED 105.6 18.3 123.9 101.1 22.4 123.5 103.1 26.8 129.9 23.2 0.9 11.8 0.9 13.3 104.7 2.4 7.8 25.5 6.2 6.1 16.1 0.4 11.2 90.2 0.6 – 25.1 2.5 2.0 24.3 – 10.8 79.5 – – Finance costs include commitment fees paid on the Group’s loan facilities of A$8.1 million (2013: A$7.6 million; 2012: A$7.0 million). Primarily represents losses from the revaluation of derivatives acquired in connection with the Group’s investment in Chiho-Tiande Group (see note 11). 2013 amount includes the acceleration of A$3.4 million of expense as a result of the good leaver provision of the former CEO who retired on 30 June 2013. 2012 amount includes A$7.9 million of expense associated with the final settlement of a business arrangement. For personal use only Impairment losses: Impairment of goodwill (note 13) Impairment of other intangible assets (note 14) Impairment of goodwill in joint venture (note 28) Impairment of investment in an associate (note 28) Impairment of trade receivables 1 Impairment/(reversal) of third party loans (note 11) Impairment of property, plant and equipment 2 (note 12) Net loss on sale of business divisions (note 26) Loss on sale of ownership interest in a joint venture (note 28) Loss on sale of joint venture 3 Write-down of inventory to net realisable value UK inventory write-down Redundancies Natural disaster related expenses/(reversal) 4 Transaction costs related to business combinations Professional fees associated with various matters 5 Provision recorded for disputes with third parties Lease settlements and onerous lease provisions 6 Yard closure costs and dilapidation provisions Withdrawal liability related to multi-employer pension plans (note 18) 1 2 3 4 5 6 2014 A$m 2013 A$m 2012 A$m 27.8 0.7 28.5 292.2 12.2 304.4 617.3 0.8 618.1 – – 2.8 (4.9) 40.9 – 14.9 2.4 4.8 61.2 57.5 – 5.1 – 0.4 1.3 – – 0.9 – 16.7 (0.9) – 0.3 1.3 31.8 9.8 6.3 10.1 0.3 1.3 6.0 63.9 7.3 5.7 0.7 2.4 4.7 13.1 8.5 – – – – 21.3 48.0 9.9 2.6 2.5 – 12.8 – – 3.0 Sims Metal Management Annual Report 2014 (c)Loss before income tax includes the following expenses, which are disclosed due to their size or nature 2013 amount includes A$1.1 million provision related to a receivable that was partially impaired as a result of a customer bankruptcy (2012: A$4.4 million). 2014 amount is comprised of impairments of A$30.9 million and A$10.1 million relating to the restructuring of SRS businesses in the UK and Canada, respectively. 2013 amount is comprised of impairments of A$45.8 million related to excess or under-utilised processing equipment and A$15.4 million related to assets held for sale. 2012 amount was comprised of impairments of A$3.4 million related to excess or under-utilised processing equipment offset by the reversal of a previously recognised impairment of A$3.0 million on land. Amount represents the loss on the sale of additional assets related to the Group’s 50% ownership interest in the secondary lead producing facility in Sydney, Australia of Australia Refined Alloys (see note 26). 2014 amount represents a reversal of estimated expenses recorded in 2013 for costs associated with Superstorm Sandy in the US. 2012 amount primarily represents costs associated with the floods in Queensland, Australia. These costs were reimbursed by the Group’s insurance carrier and the reimbursement is included in the “insurance recoveries” line in other income above. Amounts include professional fees incurred in connection with the UK investigation conducted by the Special Committee of the Board, legal fees associated with business disposals and costs incurred related to the search for a new Group Chief Executive Officer. Amounts include settlements for real estate leases which were terminated early and onerous lease provisions for under-utilised sites. In 2014, this includes real estate leases related to UK and Canada SRS which will be shut-down as a result of the SRS restructuring initiatives determined and announced in June 2014. 5 Financial Statements 101 F INAN C IAL S TATEMENT S notes to the Consolidated financial statements For the year ended 30 June 2014 For personal use only Note 8 – Income taxes 102 2014 A$m 2013 A$m restated 2012 A$m restated (a)Income tax expense/(benefit) Current income tax charge Adjustments for prior years Deferred income tax Income tax expense/(benefit) 37.8 (3.6) 12.9 47.1 20.8 (1.7) (40.4) (21.3) 33.0 (6.6) (48.7) (22.3) 20.3 (7.4) 12.9 1.6 (42.0) (40.4) (27.3) (21.4) (48.7) Loss before income tax (41.8) (488.6) (645.3) Tax at the standard Australian rate of 30% Non-deductible impairment of goodwill and intangibles Non-deductible impairment of goodwill in joint venture Effect of unused losses and tax offsets not recognised as deferred tax assets Non-deductible expenses Effect of tax rates in other jurisdictions Non-deductible impairment of investment in associate Share-based payments Assessable gain on disposal of business divisions Non-assessable income Equity accounted investees results reported net of tax Adjustments for prior years Prior year tax loss not previously recognised Non-assessable gain on disposal of joint venture Other Income tax expense/(benefit) (12.5) 3.6 – 51.6 7.9 1.6 – 1.4 – (3.7) 1.7 (3.6) (0.6) – (0.3) 47.1 (146.5) 65.8 – 50.4 7.9 (7.4) 4.5 4.0 2.8 (2.4) 1.8 (1.7) (0.4) – (0.1) (21.3) (193.6) 169.5 11.9 10.8 4.7 (9.8) – 6.5 – (2.5) (1.6) (6.6) (1.5) (10.7) 0.6 (22.3) (1.6) 3.0 1.4 (0.5) 14.6 14.1 0.0 7.0 7.0 1.4 2.4 3.8 (1.6) 2.5 0.9 0.4 (4.9) (4.5) Deferred income tax expense included in income tax expense comprises: Decrease/(increase) in deferred tax assets Decrease in deferred tax liabilities (b) Reconciliation of income tax expense/(benefit) to prima facie tax payable (c)Income tax charged/(credited) directly to equity Share-based payments Exchange gain on foreign denominated intercompany loans (d)Tax expense/(benefit) relating to items of other comprehensive income Cash flow hedges Defined benefit plans For personal use only 2013 A$m restated 13.5 19.8 1.1 3.2 20.3 3.9 1.7 7.5 1.1 72.1 19.2 11.3 6.7 3.1 18.1 1.0 18.1 5.8 7.0 90.3 2.9 2.4 – – 22.0 27.3 1.3 4.8 0.4 1.2 25.0 32.7 123.0 (20.3) 1.1 (5.0) 0.6 99.4 129.4 (1.6) 3.0 (15.4) 7.6 123.0 35.6 63.8 99.4 47.7 75.3 123.0 1.5 55.3 2.6 3.0 1.7 1.7 65.8 4.1 60.9 3.4 0.7 2.4 2.5 74.0 0.2 – Sims Metal Management Annual Report 2014 2014 A$m (e) Deferred tax assets and liabilities Deferred tax assets The balance comprises temporary difference attributable to: (amounts recognised in profit or loss) Provisions and other accruals Employee benefits Inventory and consumables Property, plant and equipment Intangibles Joint ventures and associates Tax loss carryforwards Share-based payments Other (amounts recognised directly in equity) Share-based payments Defined benefit plans Share placement costs Cash flow hedges Exchange loss on foreign denominated intercompany loans Movements Balance at 1 July Charged to income statement Adjustments for prior years Charged directly to equity and other comprehensive income Foreign exchange differences Balance at 30 June Deferred tax assets expected to be recovered within 12 months Deferred tax assets expected to be recovered after 12 months (amounts recognised directly in equity) Cash flow hedges 5 Financial Statements Deferred tax liabilities The balance comprises temporary differences attributable to: (amounts recognised in profit or loss) Intangible assets Property, plant and equipment Inventory and consumables Joint ventures and associates Employee benefits Other 103 F INAN C IAL S TATEMENT S notes to the Consolidated financial statements For the year ended 30 June 2014 For personal use only Note 8 – Income taxes (continued) 104 2014 A$m 2013 A$m restated (e) Deferred tax assets and liabilities (continued) Deferred tax liabilities (continued) Movements Balance at 1 July Charged to income statement Adjustments for prior years Charged directly to equity and other comprehensive income Acquisitions Foreign exchange differences Balance at 30 June Deferred tax liabilities expected to be settled within 12 months Deferred tax liabilities expected to be settled after 12 months 74.0 (7.4) – 0.2 _ (0.8) 66.0 109.3 (42.0) 1.2 (0.4) 0.2 5.7 74.0 6.1 59.9 66.0 8.1 65.9 74.0 (f) Unrecognised deferred tax assets In the year ended 30 June 2014, the Group wrote-off a deferred tax asset of A$17.6 million related to unused tax losses for a tax group in the US as it is uncertain as to when these losses will be utilised. This amount is included in the table above under the heading “effect of unused losses and tax offsets not recognised as deferred tax assets”. Refer to note 3. Deferred tax assets totaling A$107.2 million (2013: A$69.2 million) have not been recognised as it is not probable that they will be realised. The majority of the unrecognised deferred tax asset relates to unused tax losses of A$83.2 million (2013: A$62.3 million) due to either a history of tax losses or it is not considered probable that there will be sufficient future taxable profits to realise the benefit of deferred tax assets within certain subsidiary entities. Included in unrecognised tax losses are tax losses of A$36.1 million (2013: A$24.3 million) that will expire in 5 to 20 years. Other unused tax losses may be carried forward indefinitely. (g) Unrecognised temporary differences associated with investments and interests As at 30 June 2014, there were no unrecognised temporary differences associated with the Group’s investments in subsidiaries, associates or joint ventures, as the Group has no liability for additional taxation should unremitted earnings be remitted. Sims Metal Management Annual Report 2014 For personal use only Note 9 – Trade and other receivables 2014 A$m 2013 A$m Trade receivables Provision for impairment of receivables 345.1 (10.8) 334.3 335.2 (10.6) 324.6 Other receivables Tax receivable Prepayments 80.8 3.4 27.1 111.3 445.6 96.9 14.1 19.8 130.8 455.4 Occasionally, the Group will sell a portion of its trade receivables to third parties. All credit risk passes to the third party at the time of the assignment, such that the Group has no further exposure to default by the specific trade debtors. The amount of trade receivables sold to third parties was not significant in the periods presented. The third party is not obliged to accept offers of receivables and the Group is not obligated to make offers or pay commitment fees to the third party. (a)Movements in provision for impairment of receivables Balance at 1 July Provision for impairment recognised during the year Write-offs Reclassified as assets held for sale Foreign exchange differences Balance at 30 June 2014 A$m 2013 A$m 10.6 2.8 (2.5) – (0.1) 10.8 8.3 2.4 (0.9) (0.1) 0.9 10.6 2012 A$m 5.4 5.1 (2.4) – 0.2 8.3 The creation and release of the provision for impaired receivables has been included in other expenses in profit or loss. Amounts charged to the allowance account are generally written-off when there is no expectation of recovering additional cash. (b) Past due but not impaired As at 30 June 2014, receivables of A$42.5 million (2013: A$77.6 million) were past due but not impaired and the Group does not hold any material collateral in relation to these receivables. These relate to a number of independent customers for whom there is no recent history of default. The ageing analyses of these receivables are as follows: Days overdue: 1 – 30 days 31 – 60 days Over 60 days 2014 A$m 2013 A$m 30.4 7.3 4.8 42.5 63.5 7.4 6.7 77.6 (c) Other receivables and deferred expenses (d) Foreign exchange and interest rate risk Information about the Group’s exposure to foreign exchange risk and interest rate risk in relation to trade and other receivables is provided in note 2. 5 Financial Statements Other receivable amounts generally arise from transactions outside the usual operating activities of the Group. Interest may be charged at commercial rates where the terms of repayment exceed six months. Collateral is not normally obtained. (e) Fair value and credit risk Due to their short-term nature, the carrying value of current receivables approximates its fair value. The maximum exposure to credit risk at the end of the reporting period is the carrying amount of each class of receivables mentioned above. The fair value of securities held for certain trade receivables is insignificant, as is the fair value of any collateral sold or repledged. Refer to note 2 for more information on the Group’s exposure to credit risk. 105 F INAN C IAL S TATEMENT S notes to the Consolidated financial statements For the year ended 30 June 2014 For personal use only Note 10 – Inventory Raw materials Finished goods Stores and spare parts (note 1(d)) 2014 A$m 2013 A$m restated 115.6 411.3 18.1 545.0 133.5 407.9 23.4 564.8 The cost of inventories recognised as expense during the year ended 30 June 2014 amounted to A$5,349.6 million (2013: A$5,580.5 million). Write-down of inventories to net realisable value are disclosed in note 7. Note 11 – Other financial assets and liabilities Other financial assets – Current: Financial assets at fair value through profit or loss: Investments in marketable securities Loans and other receivables: Convertible loan to an associate carried at amortised cost (a) Loans to third parties carried at amortised cost (d) Derivative financial instruments (c): Forward foreign exchange contracts Forward commodity contracts Other financial assets – Non-current: Loans and other receivables: Convertible loan to an associate carried at amortised cost (a) Other receivables Financial assets at fair value through profit or loss: Embedded conversion feature of convertible loan (a) Warrants (a) Options (b) Other financial liabilities – Current: Derivative financial instruments (c): Forward foreign exchange contracts Forward commodity contracts 2014 A$m 2013 A$m 7.5 7.1 41.1 0.1 – 14.8 3.0 0.1 51.8 1.3 5.9 29.1 – 7.2 38.9 8.6 – – – 7.2 0.4 0.0 0.0 47.9 0.2 4.3 4.5 5.5 0.8 6.3 (a) Convertible loan On 1 March 2012, the Group subscribed for a HK$315.6 million (A$37.8 million) convertible loan from Chiho-Tiande Group Limited (“CTG”), an associate of the Group. The convertible loan carries an annual interest rate of 4% and is convertible at HK$6.00 per share. In connection with the subscription, CTG also issued to the Group, warrants to purchase 12,638,441 shares of CTG at an exercise price of HK$6.00 per share. Both the convertible loan and warrants have a term of three years from the date of issue. In certain instances, the conversion period can be extended for a further two years. The conversion feature of the convertible loan represents an embedded derivative, which along with the warrants, are recorded as financial assets at fair value through profit or loss. The convertible loan is recorded at amortised cost using the effective interest method. (b)Options On 17 January 2012, the Group received options to purchase 20,837,095 shares of CTG as part of its investment in CTG (see note 28). The options have an exercise price of HK$6.00 per share, are immediately exercisable and expire on 17 January 2015. The options are recorded as financial assets at fair value through profit or loss. The fair value of the options at the issue date was A$1.1 million and was independently calculated by a valuation firm. Subsequent to its initial recognition, the options have been measured at fair value, with any gains or losses being recognised in profit or loss. 106 For personal use only The Group is a party to derivative financial instruments in the normal course of business in order to hedge its exposure to currency fluctuations in foreign exchange rates and commodity prices in accordance with the Group’s financial risk management policies, which are set out in note 2. Sims Metal Management Annual Report 2014 (c) Derivatives used by the Group (i) Forward foreign exchange contracts In order to protect against exchange rate movements in relation to material purchases and sales and underlying transactions between subsidiaries, the Group has entered into forward foreign exchange contracts to purchase foreign currencies for settlement of the related transaction. The Group’s primary exposure is to US dollars, Euros and British pounds sterling as disclosed in note 2. The portion of the gain or loss on the hedging instrument that is determined to be an effective hedge is deferred and recognised in other comprehensive income to the extent that the hedge is effective. When the cash flows occur, the amount is released to profit or loss. Any ineffective portion is charged to profit or loss. (ii) Forward commodity contracts The Group has entered into forward commodity contracts, which are economic hedges but do not satisfy the requirements for hedge accounting. These contracts protect against movements in the underlying commodity of the related material purchase or sale. The Group’s primary exposure is to non-ferrous and precious metal prices as disclosed in note 2. (d)Loans to third parties carried at amortised cost During the year ended 30 June 2013, the Group performed an evaluation of a series of loans made to a third party and recorded an impairment charge of A$4.8 million. The Group’s assessment was based on significant financial difficulty facing the third party and was in breach of the loan agreements with the Group. The Group had a security interest in the inventory of the third party and determined the impairment based on the amount of the loan that exceeded the value of the security interest. After the impairment charge, the Group had a loan balance, net of the impairment charge, from the third party of A$14.8 million at 30 June 2013 which was all classified as current. In June 2014, the third party was able to obtain financing from a new lending source which enabled them to repay outstanding loans to the Group. As a result, the Group reversed the impairment charge in the year ended 30 June 2014. (e) Risk exposures Information about the Group’s exposure to credit risk, foreign exchange, price and interest rate risk is provided in note 2. The maximum exposure to credit risk at the end of the reporting period is the carrying amount of each class of financial instrument mentioned above. (f) Fair value The loans to third parties and the convertible loan to a listed entity, carried at amortised cost, accrue interest at a fixed rate. The fair value of these loans using current interest rates approximates their carrying value. The carrying value of other non‑current receivables approximates their fair value. Financial instruments carried at fair value are classified by valuation method using the following hierarchy: –– Level 1 – quoted prices (unadjusted) in active markets for identical assets or liabilities. –– Level 2 – inputs other than quoted prices included within Level 1 that are observable for the asset or liability, either directly (as prices) or indirectly (derived from prices). –– Level 3 – inputs for the asset or liability that are not based on observable market data (unobservable inputs). The following table presents the Group’s financial instruments measured at fair value by valuation method: 5 Financial Statements 107 F INAN C IAL S TATEMENT S notes to the Consolidated financial statements For the year ended 30 June 2014 For personal use only Note 11 – Other financial assets and liabilities (continued) 108 (f) Fair value (continued) 2014 Financial assets: Financial assets at fair value through profit or loss: Investments in marketable securities Embedded conversion feature of convertible loan Warrants Options Derivative financial instruments Financial liabilities: Derivative financial instruments Level 1 A$m Level 2 A$m Level 3 A$m Total A$m 7.5 – – – 0.1 7.6 – – – – 3.0 3.0 – – – – – – 7.5 – – – 3.1 10.6 4.3 4.3 0.2 0.2 – – 4.5 4.5 7.1 – – – 5.9 13.0 – – – – 1.3 1.3 – 0.4 0.0 0.0 – 0.4 7.1 0.4 0.0 0.0 7.2 14.7 0.8 0.8 5.5 5.5 – – 6.3 6.3 2013 Financial assets: Financial assets at fair value through profit or loss: Investments in marketable securities Embedded conversion feature of convertible loan Warrants Options Derivative financial instruments Financial liabilities: Derivative financial instruments The fair value of financial instruments traded on active markets (such as publicly traded derivatives and investments in marketable securities) is based on quoted market prices at the reporting date. The quoted market price used for financial assets held by the Group is the current bid price. These instruments are included in level 1. The fair value of financial instruments that are not traded in an active market (for example, forward foreign exchange contracts) is determined using forward exchange market rates at the end of the reporting period. These instruments are included in level 2. If one or more of the significant inputs is not based on observable market data, the fair value of financial instruments is included in level 3. This is the case for the embedded conversion feature of the convertible loan and unlisted warrants and options. The following table presents the changes in level 3 instruments for the years ended 30 June 2014 and 2013. Warrants A$m Balance at 30 June 2012 Revaluation loss recognised in profit or loss Equity accounting elimination (note 28) Foreign exchange differences Balance at 30 June 2013 Revaluation loss recognised in profit or loss Foreign exchange differences Balance at 30 June 2014 0.5 (0.7) 0.2 0.0 0.0 0.0 0.0 – Conversion feature A$m 2.7 (4.6) 2.3 0.0 0.4 (0.4) 0.0 – Options A$m 1.0 (1.0) – 0.0 0.0 0.0 0.0 – Total A$m 4.2 (6.3) 2.5 0.0 0.4 (0.4) 0.0 – During the reporting period, there were no transfers between level 1 and level 2 fair value measurements, or no transfers into or out of level 3 fair value measurements. Sims Metal Management Annual Report 2014 At 30 June 2014 Cost Accumulated depreciation Net book amount Year ended 30 June 2014 Balance at 1 July Additions Disposals Transfers Reclassified as assets held for sale (note 32) Impairments (note 7) Depreciation expense Sale of business divisions (note 26) Foreign exchange differences Balance at 30 June At 30 June 2013 (restated) Cost Accumulated depreciation Net book amount Year ended 30 June 2013 (restated) Balance at 1 July Additions Disposals Transfers Reclassifications 2 Reclassified as assets held for sale (note 32) Impairments (note 7) Depreciation expense Acquisition of subsidiaries (note 26) Sale of business divisions (note 26) Foreign exchange differences Balance at 30 June 1 2 Land A$m Leasehold Buildings improvements A$m A$m Plant & equipment 1 A$m Capital work in progress A$m 1,029.1 (641.6) 387.5 40.3 – 40.3 1,688.5 (785.5) 903.0 Total A$m 270.5 – 270.5 269.2 (94.9) 174.3 79.4 (49.0) 30.4 276.3 – (0.1) (0.4) (1.9) 140.5 0.4 (0.6) 54.3 (2.5) 45.1 – – 2.7 – 400.6 19.1 (6.4) 84.8 (3.0) 139.8 47.4 (5.2) (141.4) – 1,002.3 66.9 (12.3) – (7.4) (0.2) – (1.8) (1.4) 270.5 (0.2) (14.6) (1.6) (1.4) 174.3 (10.9) (8.3) (0.2) 2.0 30.4 (27.5) (82.7) (1.5) 4.1 387.5 (2.1) – – 1.8 40.3 (40.9) (105.6) (5.1) 5.1 903.0 276.3 – 276.3 225.3 (84.8) 140.5 86.0 (40.9) 45.1 1,001.7 (601.1) 400.6 139.8 – 139.8 1,729.1 (726.8) 1,002.3 235.5 9.4 – 20.5 0.4 (1.9) 129.7 14.9 (0.1) 3.1 (0.2) (1.3) 51.7 9.3 (0.1) 0.6 – – 436.6 81.9 (4.3) 7.3 (0.7) (8.0) 123.6 33.5 (2.1) (31.5) 10.1 (0.1) 977.1 149.0 (6.6) – 9.6 (11.3) – – 0.6 (9.8) 21.6 276.3 – (12.6) 0.1 (2.9) 9.8 140.5 (11.9) (7.5) 0.1 – 2.9 45.1 (49.3) (81.0) 6.3 (16.3) 28.1 400.6 – – – (3.8) 10.1 139.8 (61.2) (101.1) 7.1 (32.8) 72.5 1,002.3 Plant and equipment in 2014 includes A$2.8 million of assets acquired under finance leases during the year ended 30 June 2014. The net book value of assets acquired through finance leases is A$2.6 million as at 30 June 2014. CWIP amount in 2013 pertains to retrospective application of a change in accounting policy (see note 1(d)). 5 Financial Statements For personal use only Note 12 – Property, plant and equipment 109 F INAN C IAL S TATEMENT S notes to the Consolidated financial statements For the year ended 30 June 2014 For personal use only Note 13 – Goodwill (a)Movements in carrying amounts Cost Accumulated impairment Net book amount Balance at 1 July Acquisition of subsidiaries (note 26) Derecognised on sale of business divisions (note 26) Impairment charge Foreign exchange differences Balance at 30 June 1,290.2 (1,150.9) 139.3 1,294.2 (1,127.7) 166.5 166.5 – – (27.8) 0.6 139.3 446.3 14.0 (9.9) (292.2) 8.3 166.5 Goodwill acquired through business combinations has been allocated to groups of CGUs that are expected to benefit from the acquisition. Goodwill is monitored and tested for impairment by management at the CGU level. The following CGUs have significant amounts of goodwill: CGU Segment US Recycling Solutions Continental Europe Recycling Solutions Australia Metals All other CGUs Total North America Europe Australasia 2014 A$m 2013 A$m 32.2 62.4 40.8 3.9 139.3 61.0 60.8 40.8 3.9 166.5 (b) Key assumptions used for goodwill and intangible asset impairment tests The recoverable amount of each of the Group’s CGUs has been determined based on the higher of fair value less costs to sell or value in use calculations. The Group believes its methodology is the most meaningful method, in order to reflect the cyclicality of its business and the volatile nature of commodity markets that can impact its business. The value in use calculations use a five year cash flow projection, which is based initially on the budget for the 2015 financial year (as approved by the Board) and a four year forecast prepared by management. The four year forecast is developed using historical averages derived from four years of historical results and the budget for the 2015 financial year. These five year projections also incorporate management estimates related to the inherent impact of future volatility in volumes, commodity prices and margins drawn from past experience and factor in current and expected future economic conditions. A terminal value is determined from the final year of cash flow based on application of the Gordon Growth model. The cash flows are discounted using rates that reflect management’s estimate of the time value of money and the risks specific to each CGU that are not already reflected in the cash flows. In determining appropriate discount rates for each CGU, consideration has been given to a weighted average cost of capital of the entity as a whole and adjusted for country and business risk specific to the CGU. The cash flow projections are based on management’s best estimates, with reference to historical results, to determine income, expenses, capital expenditures and cash flows for each CGU. Expected future cash flows used to determine the value in use of goodwill are inherently uncertain and could materially change over time. Should management’s estimate of the future not reflect actual events, further impairments may be identified. The key assumptions used for the value in use calculations were as follows: Discount rate (pre-tax) CGU US Recycling Solutions Continental Europe Recycling Solutions Australia Metals North America Metals 1 Bulk Stainless 1 All other CGUs 1 110 2013 A$m 2014 A$m Growth rate 2014 % 2013 % 2014 % 2013 % 14.2 9.9 15.3 12.6 15.2 11.5-17.3 13.4–14.0 14.0–14.3 16.0–16.8 13.1–14.0 14.5–15.1 12.0–16.9 2.4 1.8–2.7 2.7 2.4 2.4 1.2–2.7 3.0 1.5–2.5 2.5 3.0 3.0 2.5–3.0 In 2013, goodwill related to these CGUs were fully impaired. The disclosed 2014 assumptions were utilised when assessing whether the carrying amount of the CGU’s long-lived assets exceeded its estimated recoverable amount. For personal use only The Group tests goodwill annually for impairment or more frequently if there are indications that goodwill might be impaired. Due to the difficult economic conditions impacting the Group’s industry, changes to the Group’s operating results and forecasts, and a significant reduction in the Group’s market capitalisation, a goodwill impairment test was performed during the years ended 30 June 2014 and 30 June 2013, which resulted in the following impairment charges being recognised: CGU 2014 A$m 2013 A$m US Recycling Solutions North America Metals Bulk Stainless Canada Recycling Solutions Other Total 27.8 – – – – 27.8 – 256.2 20.8 7.6 7.6 292.2 Sims Metal Management Annual Report 2014 (c)Goodwill impairment charges recognised Year ended 30 June 2014 The impairment charge related to the US Recycling Solutions CGU was a result of the assessment of future cash flows. This CGU continued to be impacted by margin pressure resulting from a competitive market landscape and volatility in underlying commodity pricing. The 30 June 2013 impairment considerations for this CGU were predicated on a return to historical cash flow levels, which did not materialise during the year ended 30 June 2014. As a result, the future cash flows for US Recycling Solutions CGU was reassessed which indicated the carrying value of goodwill was not fully recoverable leading to an impairment of A$27.8 million. After the impairment, remaining goodwill for this CGU is A$32.2 million. Year ended 30 June 2013 During the half year ended 31 December 2012, results for the North America Metals CGU were impacted by lower than anticipated intake volume and shipments, particularly for deep sea ferrous products. The anticipated improvement in the cash flows for this CGU which was the basis for the Group’s impairment considerations as at 30 June 2012 did not materialise. As a result, the future cash flows for the North America Metals CGU was reassessed which indicated that the carrying value of goodwill was not recoverable thus requiring an impairment of the entire goodwill balance for this CGU and an impairment of A$5.5 million related to permits (see note 14). The impairment charge related to the Bulk Stainless CGU was a result of the assessment of future cash flows. This CGU was impacted by weak demand and pricing for stainless steel metals. Based on its financial results and projections of future cash flows, the carrying value of goodwill was determined to be not recoverable thus requiring an impairment of the entire goodwill balance for this CGU. The impairment charge related to the Canada Recycling Solutions CGU was a result of deterioration in financial performance of the CGU due to increasing competitive pressures. Based on financial results and projections of future cash flows, the carrying value of goodwill was determined to be not recoverable thus requiring an impairment of the entire goodwill balance for this CGU. (d)Impact of possible changes in key assumptions Other than the US Recycling Solutions CGU, the valuations as at 30 June 2014 indicate sufficient headroom such that a reasonably possible change to key assumptions is unlikely to result in an impairment of the related goodwill. As a result of the goodwill impairment, the estimated recoverable amount for the US Recycling Solutions CGU equaled its carrying value at 30 June 2014. If the discount rate was 1% higher or future cash flows were 10% lower, with all other assumptions being the same, than an additional impairment charge of A$10.0 million or A$8.2 million, respectively, would have been recorded. 5 Financial Statements Although no goodwill remains, an assessment of the impact of possible changes in key assumptions was performed for the North America Metals CGU to assess the recoverability of other long-lived assets as at 30 June 2014. The estimated recoverable amount for the North America Metals CGU exceeded its carrying value by 5%. If future cash flows were 10% lower, then an impairment charge of A$41.9 million would have been required to other identified intangible assets. 111 F INAN C IAL S TATEMENT S notes to the Consolidated financial statements For the year ended 30 June 2014 For personal use only Note 14 – Other intangible assets 112 Supplier relationships A$m At 30 June 2014 Cost Accumulated impairment Accumulated amortisation Net book amount Permits A$m Licenses/ Contracts A$m Tradenames A$m Total A$m 221.6 (4.9) (167.4) 49.3 9.1 (7.3) – 1.8 36.7 (0.1) (33.4) 3.2 32.4 (0.1) (10.1) 22.2 299.8 (12.4) (210.9) 76.5 Year ended 30 June 2014 Balance at 1 July Disposals (note 26) Impairment 1 Amortisation charge Foreign exchange differences Balance at 30 June 65.4 (1.0) (0.5) (14.0) (0.6) 49.3 1.9 – – – (0.1) 1.8 5.9 – (0.1) (2.6) – 3.2 24.2 – (0.1) (1.7) (0.2) 22.2 97.4 (1.0) (0.7) (18.3) (0.9) 76.5 At 30 June 2013 Cost Accumulated impairment Accumulated amortisation Net book amount 227.3 (4.1) (157.8) 65.4 9.2 (7.3) – 1.9 37.2 – (31.3) 5.9 32.8 – (8.6) 24.2 306.5 (11.4) (197.7) 97.4 87.6 4.6 (9.3) 0.7 (5.6) (18.5) 5.9 65.4 7.9 0.1 (0.6) – (5.5) – – 1.9 6.9 1.3 – (0.5) – (2.3) 0.5 5.9 24.2 0.3 – 0.3 (1.1) (1.6) 2.1 24.2 126.6 6.3 (9.9) 0.5 (12.2) (22.4) 8.5 97.4 Year ended 30 June 2013 Balance at 1 July Acquisitions (note 26) Disposals (note 26) Reclassification (note 12) Impairment 1 Amortisation charge Foreign exchange differences Balance at 30 June 1 For the year ended 30 June 2014, A$0.6 million of impairments were attributed to the decision to exit the Canada Recycling Solutions business. For the year ended 30 June 2013, A$3.0 million of impairments were related to assets held for sale. The remaining impairments were recorded in connection with the Group’s impairment analysis of goodwill and intangible assets (see note 13). Sims Metal Management Annual Report 2014 For personal use only Note 15 – Trade and other payables Current: Trade payables Other payables Deferred income Non-current: Other payables 2014 A$m 2013 A$m 378.3 157.4 35.7 571.4 419.2 140.7 25.3 585.2 6.5 6.5 8.3 8.3 The Group’s exposure to currency and liquidity risk related to trade and other payables is set out in note 2. The fair value of the Group’s trade and other payables approximates its carrying value. Note 16 – Borrowings Current borrowings: Bank loans Finance lease liabilities Other borrowings Non-current borrowings: Bank loans Finance lease liabilities 2014 A$m 2013 A$m – 0.5 – 0.5 10.0 – 1.6 11.6 12.3 2.1 14.4 189.1 – 189.1 Bank loans are unsecured but are subject to various guarantees/cross guarantees, cross defaults and indemnities from the Company and certain of its subsidiaries. (a) Risk exposures The Group’s exposure to interest rate risk, as well as information relating to the facility arrangements is set out in note 2. (b) Fair value The fair value of bank loans approximate their carrying amount because they carry floating rates of interest. The fair value of finance lease liabilities was A$2.7 million (2013: nil) and was measured by discounting estimated cash flows with an applicable quoted yield. 5 Financial Statements 113 F INAN C IAL S TATEMENT S notes to the Consolidated financial statements For the year ended 30 June 2014 For personal use only Note 17 – Provisions 114 2014 A$m 2013 A$m Employee benefits Onerous lease provisions Legal provisions Environmental and dilapidations Other 61.5 29.8 15.2 13.3 3.0 122.8 45.2 1.3 17.9 11.1 3.5 79.0 Current Non-current 76.4 46.4 122.8 38.5 40.5 79.0 Movements in each class of provision during the financial year, other than employee benefits, are set out below: Onerous Leases A$m Balance at 1 July Provisions recognised in profit or loss Payments Foreign exchange differences Balance at 30 June 1.3 29.8 (1.0) (0.3) 29.8 Environmental and Legal dilapidations A$m A$m 17.9 2.5 (5.0) (0.2) 15.2 11.1 2.8 (1.3) 0.7 13.3 Other A$m 3.5 (0.2) (0.8) 0.5 3.0 Onerous lease provisions comprise obligations for future rents payable net of rents receivable on onerous leases. The majority of the provisions recognised during the financial year relate to real estate leases in the UK and Canada which will be exited as a result of the SRS restructuring initiatives determined and announced in June 2014. The exact timing of utilisation of these provisions will vary according to the individual leases. The Group is involved in legal and other disputes and, after taking legal advice, has established provisions taking into account the relevant facts of each dispute. The timing of cash outflows associated with legal claims cannot be reasonably determined. The environmental and dilapidations provision is an estimate of costs for property remediation that is expected to be required in the future. For personal use only The Group operates a number of pension plans for the benefit of its employees throughout the world. The Group’s pension plans are provided through either defined benefit and defined contribution plans. Defined contribution plans offer employees individual funds that are converted into benefits at the time of retirement. The defined contribution plans receive fixed contributions from Group companies with the Group’s legal obligation limited to these contributions. Sims Metal Management Annual Report 2014 Note 18 – Retirement benefit obligations The Group operates different defined benefit plans in the UK, Australia and US. The specific characteristics (benefit formulas, funding policies and types of assets held) of the defined benefit plans vary according to the regulations and laws in the country where the defined benefit plans are offered. In the UK, the defined benefit plan provides a benefit based on the members’ final salary at retirement and length of service. The defined benefit plan is closed to new members and represents approximately 57% of the present value of obligations as at 30 June 2014. In Australia, the defined benefit plan provides a lump sum benefit based on final salary and length of service. The defined benefit plan is closed to new members and represents approximately 19% of the present value of obligations as at 30 June 2014. In the US, the Group sponsors three defined benefit plans which provide an annuity or lump sum benefits based on final average earnings or flat-dollar benefit units and years of credited service. Accrued benefits under two of the defined benefit plans have been frozen and represent approximately 14% of the present value of obligations as at 30 June 2014. The other defined benefit plan has frozen benefits for only nonunion employees, is closed to new union members and represents approximately 10% of the present value of obligations as at 30 June 2014. The following sets out details in respect of the defined benefit sections only. The expense recognised in relation to the defined contribution plans is disclosed in note 7. (a) Financial statement amounts The amounts recognised in the statement of financial position are determined as follows: Retirement benefit assets Retirement benefit obligations Net retirement benefit obligations 2014 A$m 2.1 (4.6) (2.5) 2013 A$m 1.0 (4.9) (3.9) 5 Financial Statements 115 F INAN C IAL S TATEMENT S notes to the Consolidated financial statements For the year ended 30 June 2014 For personal use only Note 18 – Retirement benefit obligations (continued) (a) Financial statement amounts (continued) Present value of obligations A$m Net amount A$m 64.6 (62.6) 2.0 1.1 3.6 4.7 – (3.4) (3.4) 1.1 0.2 1.3 Remeasurements: Return on plan assets greater than interest income Actuarial (gains)/losses – experience Actuarial (gains)/losses – financial assumptions Total amount recognised in other comprehensive income – 0.7 10.2 10.9 3.8 – – 3.8 3.8 0.7 10.2 14.7 Contributions: Employers Plan participants Benefit payments Foreign exchange differences Balance as at 30 June 2012 (restated) – 0.3 (3.2) 1.5 78.8 (4.3) (0.3) 3.2 (1.3) (64.9) (4.3) – – 0.2 13.9 Service cost Interest expense/(income) Total amount recognised in profit or loss 1.4 3.1 4.5 – (2.5) (2.5) 1.4 0.6 2.0 Remeasurements: Return on plan assets greater than interest income Actuarial (gains)/losses – experience Actuarial (gains)/losses – financial assumptions Total amount recognised in other comprehensive income – (1.5) (1.9) (3.4) (5.8) – – (5.8) (5.8) (1.5) (1.9) (9.2) Contributions: Employers Plan participants Benefit payments Foreign exchange differences Balance as at 30 June 2013 (restated) – 0.3 (7.0) 4.5 77.7 (3.3) (0.3) 7.0 (4.0) (73.8) (3.3) – – 0.5 3.9 Service cost Interest expense/(income) Total amount recognised in profit or loss 1.2 3.4 4.6 – (3.3) (3.3) 1.2 0.1 1.3 Remeasurements: Return on plan assets greater than interest income Actuarial (gains)/losses – experience Actuarial (gains)/losses – demographic Actuarial (gains)/losses – financial assumptions Total amount recognised in other comprehensive income – 0.1 0.1 4.6 4.8 (4.6) – – – (4.6) (4.6) 0.1 0.1 4.6 0.2 – 0.3 (7.1) 3.8 84.1 (3.0) (0.3) 7.1 (3.7) (81.6) (3.0) – – 0.1 2.5 Balance as at 1 July 2011 Service cost Interest expense/(income) Total amount recognised in profit or loss Contributions: Employers Plan participants Benefit payments Foreign exchange differences Balance as at 30 June 2014 116 Fair value of plan assets A$m Sims Metal Management Annual Report 2014 For personal use only The Group has no legal obligation to settle the liability with an immediate contribution or additional one-off contributions. The Group intends to continue to contribute to the defined benefit plans based on recommendations from its actuaries. (b) Categories of plan assets The major categories of plan assets are as follows: 2013 A$m 1.9 46.3 15.0 4.9 5.7 73.8 2014 A$m 1.4 51.9 18.1 3.1 7.1 81.6 Cash Equity investments Debt instruments Hedge funds Property Total plan assets An active market price exists for all plan assets. Assets of each defined benefit plan are managed by a dedicated investment committee in accordance with the plan rules and local regulations. The Group has representatives on these committees and promotes simple and diversified investment strategies. The goal is to limit investment risks to those necessary to fulfil the benefit commitment. The plans assets have no direct investments in the Group’s equity securities or in property currently used by the Group. The actual return on plan assets was A$7.9 million at 30 June 2014 (2013: A$8.3 million). (c) Principal actuarial assumptions Actuarial assumptions used vary by type of plan and by country. The defined benefit plans liabilities are measured using the projected unit credit method using the principal actuarial assumptions set out below: Weighted average actuarial assumptions used at 30 June: Discount rate Rate of increase in salaries Rate of increase in Retail Price Index (UK defined benefit plan only) 2014 % 2013 % restated 2012 % restated 4.1 3.6 3.4 4.2 3.6 3.4 4.2 3.6 2.8 Measurement of the Group’s defined benefit plan obligations is sensitive to changes in certain key assumptions. The sensitivity analysis below has been determined based on reasonably possible changes of the respective assumptions occurring at the end of the reporting period, while holding all other assumptions constant. The impact from the change in assumption on the defined benefit obligation is set out below: 2014 A$m (11.2) 14.4 Rate of increase in salaries: Increase by 100 basis points Decrease by 100 basis points 2.9 (2.5) Rate of increase in inflation (UK defined benefit plan only): Increase by 100 basis points Decrease by 100 basis points 6.3 (5.7) Life expectancy (UK and US defined benefit plans only): Increase in longevity by 1 year 2.0 5 Financial Statements Discount rate: Increase by 100 basis points Decrease by 100 basis points 117 F INAN C IAL S TATEMENT S notes to the Consolidated financial statements For the year ended 30 June 2014 For personal use only Note 18 – Retirement benefit obligations (continued) 118 (c) Principal actuarial assumptions (continued) Comparative information has not been provided for the sensitivity analysis as permitted by the transitional provisions of AASB 119R (IAS 19R). The sensitivity analysis presented above may not be representative of the actual change in the defined benefit obligation as it is unlikely that the change in assumptions would occur in insolation of one another as some of the assumptions may be correlated. Furthermore, in presenting the above sensitivity analysis, the present value of the defined benefit obligation has been calculated using the projected unit credit method at the end of the reporting period, which is the same as that applied in calculating the defined benefit obligation liability recognised in the statement of financial position. The methods and types of assumptions used in preparing the sensitivity analysis did not change compared to the prior period. (d) Risk exposure Through its defined benefit plans, the Group is exposed to a number of risks, the most significant of which are detailed below: –– Asset volatility: The plan liabilities are calculated using a discount rate set with reference to corporate bond yields; if plan assets underperform this yield, this will create a deficit. The plans hold a significant proportion of equities, which are expected to outperform bonds in the long-term while contributing volatility and risk in the short-term. The Group believes that due to the long-term nature of the plan liabilities, a level of continuing equity investment is an appropriate element of the Group’s long‑term strategy to manage the plans efficiently. –– Change in bond yields: A decrease in corporate bond yields will increase plan liabilities, although this will be partially offset by an increase in the value of the plans’ bond holdings. –– Inflation risk: Some of the plans’ benefit obligations are linked to inflation, and higher inflation will lead to higher liabilities, although, in most cases, caps on the level of inflationary increases are in place to protect the plan against extreme inflation. –– Life expectancy: The majority of the plans’ obligations are to provide benefits for the life of the member, so increases in life expectancy will result in an increase in the plans’ liability. –– Salary increases: Some of the plans’ benefit obligations related to active members are linked to their salaries. Higher salary increases will therefore tend to lead to higher plan liabilities. (e)Employer contributions and maturity profile In accordance with British regulation, the UK defined benefit plan is required to perform a valuation every three years, and agree on a recovery plan to correct any deficit. The last valuation revealed a funding deficit of £4.5 million. The current recovery plan agreement was signed in January 2013, and the Group agreed to pay £70,000 per month with the goal of eliminating the shortfall by November 2018. Including the funding deficit contributions in the UK, the Group expects to make contributions of A$2.5 million to the defined benefit plans during the next financial year. The weighted average duration of the benefit obligation at 30 June 2014 is 15.3 years (2013:14.6 years). (f)Multi-employer pension plans The Group participates in several multi-employer pension plans in the US which are based on collective bargaining agreements. The risks of participating in these multi-employer plans are different from single-employer plans in that (i) assets contributed to the multi-employer plan by one employer may be used to provide benefits to employees of other participating employers; (ii) if a participating employer stops contributing to the plan, the unfunded obligations of the plan may be required to be assumed by the remaining participating employers, and (iii) if the Group chooses to stop participating in any of its multi-employer plans, the Group may be required to pay those plans a withdrawal amount based on the underfunded status of the plan. While these plans provide for defined benefits, as a result of insufficient information provided to the Group by the administrators of the plans, the Group accounts for these plans as defined contribution plans. In the year ended 30 June 2014, the Group recorded an estimated withdrawal liability of A$6.3 million with respect to a multi‑employer plan. The liability has been estimated as the Group believes the plan administrator’s calculation of the withdrawal liability is incorrect and is currently challenging the assessment. As such, the liability represents management’s best estimate. Sims Metal Management Annual Report 2014 For personal use only Note 19 – Contributed equity (a) Share capital Ordinary shares, which have no par value, trade on the Australian Securities Exchange (“ASX”) and entitle the holder to participate in dividends and the proceeds on winding up of the Company in proportion to the number of shares held. Voting rights attaching to the ordinary shares are, on a show of hands, one vote for every person present as a member, proxy, attorney or representative thereof and, on a poll, one vote per share for every member present in person or by proxy, attorney or representative. The Company does not have a limited amount of authorised capital. The Company voluntarily delisted its shares from the New York Stock Exchange (“NYSE”) on 11 October, 2013. Following the NYSE delisting, the Company’s American Depositary Shares (“ADS”) trade in the US in the “over-the-counter” (OTC) market. ADSs have the same rights as ordinary shares, including participation in dividends and voting rights. Movements in the ordinary share balance were as follows: Balance at 30 June 2012 Issued under long-term incentive plans Share buy-back Balance at 30 June 2013 Issued under long-term incentive plans Balance at 30 June 2014 Number of shares 204,816,794 404,594 (912,001) 204,309,387 291,934 204,601,321 A$m 2,804.3 – (8.6) 2,795.7 0.7 2,796.4 (b) Share buy-back On 7 October 2011, the Company announced an on-market share buy-back program, which allowed the buy-back of a maximum of 10% of issued capital (20,603,871 ordinary shares) over a 12-month period on the ASX. The buy-back commenced on 24 October 2011 and was completed on 23 October 2012. During the 12 month duration of the share buy-back program, the Company repurchased 3.952 million shares for a total cost of A$47.1 million. The reacquired shares have been cancelled. Details regarding the shares purchased during the year ended 30 June 2013 are as follows: Ordinary shares purchased High Price Low Price Average Price 2013 912,001 A$10.35 A$8.63 A$9.43 The Company does not have any continuing authorisation from the Board for on-market buybacks. (c) Capital risk management The primary objective of managing the Group’s capital is to ensure that there is sufficient capital available to support the funding requirements of the Group, including capital expenditure, in a way that optimises the cost of capital, maximises shareholders’ returns and ensures that the Group remains in a sound financial position. In order to manage the capital structure, the Group may periodically adjust dividend policy, return capital to shareholders, issue new shares or sell assets to reduce debt. The Group monitors its capital structure primarily using the gearing ratio. This ratio is calculated as net debt divided by total capital. Net debt is calculated as total borrowings less cash and cash equivalents. Total capital is calculated as total equity as shown in the statement of financial position plus net debt. 5 As at 30 June 2014, the Group had a net cash position of A$42.3 million. The Group’s gearing ratio as at 30 June 2013 was as follows: Financial Statements Total borrowings Less: cash and cash equivalents Net debt Plus: total equity Total capital Gearing ratio 2013 A$m RESTATED 200.7 (46.9) 153.8 1,929.2 2,083.0 7.4% 119 F INAN C IAL S TATEMENT S notes to the Consolidated financial statements For the year ended 30 June 2014 For personal use only Note 20 – Accumulated deficit and reserves 120 (a)Accumulated deficit 2014 A$m Balance at 1 July Loss after tax Dividends paid Actuarial (loss)/gain on defined benefit plans, net of tax Balance at 30 June (668.7) (88.9) – (2.6) (760.2) 2013 A$m restated (187.3) (467.3) (20.4) 6.3 (668.7) (b)Reserves Share-based payments A$m Balance at 30 June 2012 Equity-settled share-based payment expense Revaluation – gross Transfer to profit or loss – gross Foreign currency translation differences Associates Deferred tax Balance at 30 June 2013 Equity-settled share-based payment expense Revaluation – gross Transfer to profit or loss – gross Foreign currency translation differences Associates Deferred tax Balance at 30 June 2014 96.2 16.1 – – – – 0.5 112.8 11.8 – – – – 1.6 126.2 Availablefor-sale investments A$m (0.1) – – – – 0.2 – 0.1 – – – – – – 0.1 Cash flow hedging A$m 1.0 – (6.7) 1.3 – (0.3) 1.6 (3.1) – 1.4 4.4 – – (1.4) 1.3 Foreign currency translation A$m (430.0) – – – 136.3 0.7 (14.6) (307.6) – – – (19.6) 0.3 (3.0) (329.9) Total A$m (332.9) 16.1 (6.7) 1.3 136.3 0.6 (12.5) (197.8) 11.8 1.4 4.4 (19.6) 0.3 (2.8) (202.3) (c)Nature and purpose of reserves (i) Share-based payments reserve The share-based payments reserve is used to recognise the fair value of share-based awards issued to employees. (ii)Available-for-sale investments reserve Changes in the fair value and exchange differences arising on translation of investments, such as equities classified as availablefor-sale investments, are recognised in other comprehensive income as described in note 1(s) and accumulated in a separate reserve within equity. Amounts are reclassified to profit or loss when the associated assets are sold or impaired. (iii) Cash flow hedging reserve The cash flow hedging reserve is used to record gains or losses on a hedging instrument in a cash flow hedge that are recognised in other comprehensive income, as described in note 1(t). Amounts are recognised in profit or loss when the associated hedged transaction impacts profit or loss. (iv) Foreign currency translation reserve Exchange differences arising on translation of foreign controlled entities are recognised in other comprehensive income, as described in note 1(g) and accumulated in a separate reserve within equity. The cumulative amount is reclassified to profit or loss when the Group no longer controls the foreign operation. Sims Metal Management Annual Report 2014 For personal use only Note 21 – Dividends (a) Dividends declared and paid during the year Interim 2014 Final 2013 Interim 2013 Final 2012 Interim 2012 Final 2011 Total dividends paid Shares issued under the DRP Total cash dividends paid Cents per share Franked % 2014 A$m 2013 A$m 2012 A$m 0.0 0.0 0.0 10.0 10.0 35.0 0% 0% 0% 0% 0% 43% – – – – – – – – – – – – 20.4 – – 20.4 – 20.4 – – – – 20.6 72.1 92.7 (23.4) 69.3 The franked components of all dividends paid or declared were franked based on an Australian corporate tax rate of 30%. (b) Dividends not recognised at year end Since the end of the financial year, the Directors have determined to pay a final dividend of 10.0 cents per share (2013: nil), 100% franked based on Australian corporate taxes paid at 30%. The aggregate amount of the proposed dividend expected to be paid on 21 October 2014, but not recognised as a liability at the end of the reporting period, is A$20.5 million (2013: nil). The Directors have determined that the dividend reinvestment plan (“DRP”) will not operate in relation to this dividend. (c) Franked dividends Estimated franking credits available for the subsequent financial years based on an Australian tax rate of 30% (2013: 30%) 2014 A$m 2013 A$m 32.8 23.4 The above amounts represent the balance of the franking account as at the end of the reporting date, adjusted for: (a) franking credits that will arise from the payment of the amount of the provision for income tax and franking debits that will arise from refunds; (b) franking debits that will arise from the payment of dividends recognised as a liability as at the reporting date; and (c) franking credits that will arise from the receipt of dividends recognised as receivables as at the reporting date. 5 Financial Statements 121 F INAN C IAL S TATEMENT S notes to the Consolidated financial statements For the year ended 30 June 2014 For personal use only Note 22 – Contingencies (a)Guarantees The Group has given guarantees in respect of the performance of contracts entered into in the ordinary course of business. The amounts of these guarantees provided by the Group, for which no amounts are recognised in the consolidated financial statements, as at 30 June 2014 was A$54.1 million (2013: A$61.9 million). See note 30(b) for information related to guarantees provided by the Company. (b)Tax audits The Group files income tax returns in many jurisdictions throughout the world. Various tax authorities are currently reviewing or auditing the Group’s income tax returns. Tax returns contain matters that could be subject to differing interpretations of applicable tax laws and regulations. While it is difficult to predict the ultimate outcome in some cases, the Group does not anticipate that there will be any material impact on the Group’s consolidated financial statements from such audits or reviews. (c)Environmental claims The Group is subject to comprehensive environmental requirements relating to, among others, the acceptance, storage, treatment, handling and disposal of solid waste and hazardous waste; the discharge of materials and storm water into the environment; the management and treatment of wastewater and storm water; and the remediation of soil and groundwater contamination. As a consequence, the Group has incurred and will continue to incur environmental costs and liabilities associated with site and facility operation, closure, remediation, monitoring and licensing. Provisions have been made in respect of estimated environmental liabilities where obligations are known to exist and can be reasonably measured. However, additional liabilities may emerge due to a number of factors, including changes in environmental laws and regulations in each of the jurisdictions in which the Group operates or has operated. The Group cannot predict the extent to which it may be impacted in the future by any such changes in legislation or regulation. (d)Legal claims Various Group companies are parties to legal actions and claims that arise in the ordinary course of their business. While the outcome of such legal proceedings cannot be readily foreseen, the Group believes that they will be resolved without material effect on its financial statements. Provision has been made for known obligations where the existence of the liability is probable and can be reasonably estimated. (e)Subsidiaries Under the terms of a Deed of Cross Guarantee (“DCG”) entered into in accordance with ASIC Class Order 98/1418 (as amended by Class Orders 98/2107, 00/0321, 01/1087, 02/0248 and 02/1017), the Company has undertaken to meet any shortfall that might arise on the winding up of controlled entities that are party to the deed, as described in note 27. The controlled entities are not in liquidation and there is no indication that they will be wound up. Note 23 – Commitments (a) Capital commitments Capital expenditures contracted for at the reporting date but not recognised as liabilities are as follows: Property, plant and equipment 2014 A$m 2013 A$m 50.9 40.8 The capital commitments included above also include the Group’s share relating to associates and joint arrangements. (b)Lease commitments (i) Operating leases The Group has entered into various operating leases on property, plant and equipment. The leases have varying terms, escalation clauses and renewal rights. On renewal, the terms of the leases are renegotiated. Lease commitments for operating leases are as follows: Not later than one year Later than one year, but not later than five years Later than five years Total lease commitments not recognised as liabilities 2014 A$m 2013 A$m 78.7 157.1 125.6 361.4 81.8 172.5 113.8 368.1 The lease commitments included above also include the Group’s share relating to associates and joint arrangements. 122 Sims Metal Management Annual Report 2014 Note 24 – Share ownership plans For personal use only The Company’s share ownership plans are designed to link the rewards of eligible employees to the long-term performance of the Company and the returns generated for shareholders. The maximum number of shares that can be outstanding at any time under the share ownership plans is limited to 5% of the Company’s issued capital. Grants under the share ownership plans can be in the form of options or share rights. Certain share ownership plans also provide for cash-settlement, which are determined by the Board. An option is a contract that gives the holder the right, but not the obligation, to acquire the Company’s shares at a fixed or determinable price for a specified period of time. Options have an exercise price based on the weighted average market price of the Company’s ordinary shares (or ADSs) during the five trading days up to the date of the grant. Share rights are a contractual right to acquire the Company’s shares for nil consideration. Unless specified in the grants, holders of options and share rights are not entitled to dividends or voting rights. Historically, the Company issued share-based awards to US-based employees that were settled in ADSs. However, beginning in November 2013, all new share-based awards will be settled in ordinary shares. (a)Effect of share-based payments on profit or loss The expense recognised in the income statement in relation to share-based payments is disclosed in note 7. The carrying amount of liabilities for cash-settled share-based arrangements as at 30 June 2014 was A$1.7 million (2013: A$0.8 million). Where share‑based awards are issued to employees of subsidiaries within the Group, the subsidiaries compensate the Company for the fair value of these share-based awards. (b)Long-Term Incentive Plan (“LTIP”) In July 2003, the Company established a LTIP designed as a reward and retention tool for certain employees. Options and share rights granted under the LTIP may vest either based on continuous service or based on performance conditions. Share rights that contain performance conditions are referred to as performance rights, whereas share rights which only contain a continuous service condition are referred to as restricted share units. Cash-settled option grants are also made under the LTIP to certain employees. Refer to the Remuneration Report for further information on the terms of the grants made in the year ended 30 June 2014 pursuant to the LTIP. (i)Equity-settled options The fair value of equity-settled options granted is independently determined using a Binomial method, which allows for the effects of an early exercise for vested options assuming the share price exceeds one and a half times the exercise price. The significant weighted assumptions used to determine the fair value were as follows: Ordinary shares Risk-free interest rate Dividend yield Volatility Expected life (years) Share price at grant date Weighted average fair value ADSs 2014 2013 2013 3.7% 3.0% 33.0% 4.2 A$10.45 A$2.77 2.8% 3.0% 33.0% 4.7 A$8.57 A$1.88 1.0% 3.0% 39.0% 4.6 US$8.93 US$2.18 The volatility assumption is based on the actual volatility for the ordinary shares over a three year period to the valuation date. Equity-settled options outstanding Ordinary Shares: Balance at 1 July Granted Forfeited Exercised Balance at 30 June Exercisable at 30 June 984,279 1,429,471 (49,015) – 2,364,735 800,737 A$17.85 A$9.98 A$9.98 – A$13.25 A$19.60 1,061,746 248,047 (325,514) – 984,279 660,694 A$19.38 A$9.29 A$16.34 – A$17.85 A$21.20 ADSs: Balance at 1 July Granted Forfeited Exercised Balance at 30 June Exercisable at 30 June 5,532,758 – (38,431) – 5,494,327 3,814,915 US$14.14 – US$10.12 – US$14.17 US$15.85 3,648,508 2,106,373 (222,123) – 5,532,758 2,508,738 US$16.71 US$9.49 US$12.26 – US$14.14 US$17.80 5 Financial Statements Weighted Number average of options exercise price 2013 2013 Weighted Number average of options exercise Price 2014 2014 123 F INAN C IAL S TATEMENT S notes to the Consolidated financial statements For the year ended 30 June 2014 For personal use only Note 24 – Share ownership plans (continued) (b)Long-Term Incentive Plan (“LTIP”) (continued) (i)Equity-settled options (continued) Information about outstanding and exercisable equity-settled options as at 30 June 2014 is as follows: Outstanding Exercise price range Ordinary shares: A$9.00–A$9.29 A$9.30–A$9.99 A$10.00–A$26.00 ADSs: US$9.00–US$10.99 US$11.00–US$19.99 US$20.00–US$25.00 Exercisable Number of options Weighted average exercise price Weighted average remaining contractual life (years) 209,777 1,380,456 774,502 2,364,735 A$9.29 A$9.98 A$20.16 A$13.25 1,980,912 2,225,097 1,288,318 5,494,327 US$9.49 US$14.57 US$20.65 US$14.17 Number of options Weighted average exercise price Weighted average remaining contractual life (years) 5.38 6.38 2.64 5.07 69,927 – 730,810 800,737 A$9.29 – A$20.59 A$19.60 5.38 – 2.54 2.79 5.38 3.75 2.23 3.98 671,040 1,855,557 1,288,318 3,814,915 US$9.49 US$14.82 US$20.65 US$15.85 5.38 3.62 2.23 3.46 (ii) Cash-settled options The fair value of cash-settled options is determined in the same manner as equity-settled options. The liability for cash-settled options is remeasured at each reporting date. The significant weighted assumptions used to remeasure the fair value at 30 June 2014 were as follows: Granted during year ended 30 June 2014 2013 3.0% 3.0% 33.0% 3.3 A$9.68 A$2.16 3.3% 3.0% 34.0% 4.2 A$8.26 A$1.69 Weighted average exercise price $ 2014 Number of options 2013 Weighted average exercise price $ 2013 A$11.97 A$9.98 A$10.84 – A$11.52 A$13.54 566,166 611,251 (75,224) – 1,102,193 248,905 A$14.88 A$9.29 A$12.02 – A$11.97 A$15.68 Risk-free interest rate Dividend yield Volatility Expected life (years) Share price at reporting date Weighted average fair value Cash-settled options outstanding Ordinary Shares: Balance at 1 July Granted Forfeited Exercised Balance at 30 June Exercisable at 30 June Number of options 2014 1,102,193 364,527 (88,677) – 1,378,043 581,309 (iii) Performance rights Performance rights vest after a period of three to five years, but only if the performance hurdle has been met. Performance hurdles are either based on Total Shareholder Return (“TSR”) or on Earnings per Share (“EPS”) criteria. In the year ended 30 June 2014, 103,118 share rights (2013: 461,994) were forfeited as the performance conditions were not satisfied. TSR right grants made in the years ended 30 June 2014 and 2013 are measured using a hurdle over a three-year period (commencing at the beginning of the financial year) against a comparator group of companies. Full vesting of the TSR rights occurs when the Company’s TSR is at (or exceeds) the 75th percentile relative to the comparator group, scaling down to 50% vesting on a straight-line basis for median performance. Below median performance, no vesting occurs. EPS right grants made in the year ended 30 June 2014 are measured based on the achievement of cumulate EPS of A$3.00 per share over a three-year period (commencing at the beginning of the financial year). Full vesting of the EPS rights occurs when the Company’s EPS exceeds A$3.00 per share, scaling down to 50% vesting on a straight-line basis for cumulative EPS of A$2.00 per share. No vesting occurs if cumulative EPS is below A$2.00 per share. 124 For personal use only Sims Metal Management Annual Report 2014 The fair value of TSR share rights granted is independently determined using a Black-Scholes method to produce a Monte-Carlo simulation model which allows for the incorporation for a TSR performance condition that must be met before the share rights vest. The fair value of EPS share rights is determined based on the market price of the Company’s shares on the date of grant and the Company’s dividend yield. The significant weighted assumptions used to determine the fair value were as follows: Ordinary shares Dividend yield Risk-free interest rate Volatility Share price at grant date Performance rights outstanding Number of shares 2014 ADSs 2014 2013 2013 3.0% 2.9% 33.0% A$10.45 3.0% 2.5% 33.0% A$8.57 3.0% 0.3% 39.0% US$8.93 Number of shares 2013 Weighted average fair value at grant date $ 2013 Weighted average fair value at grant date $ 2014 Ordinary Shares: Non-vested balance at 1 July Granted Forfeited/cancelled Vested Non-vested balance at 30 June 688,036 1,289,654 (122,056) – 1,855,634 A$9.60 A$6.21 A$10.19 – A$7.21 706,947 320,702 (339,613) – 688,036 A$16.27 A$5.29 A$19.42 – A$9.60 ADSs: Balance at 1 July Granted Forfeited/cancelled Vested Non-vested balance at 30 June 3,084,759 – (181,694) – 2,903,065 US$6.99 – US$9.14 – US$6.85 2,278,835 1,361,087 (555,163) – 3,084,759 US$9.34 US$4.12 US$9.60 – US$6.99 (iv) Restricted share units Restricted share units granted to employees typically vest over a period up to three years. The fair value of restricted share units is determined based on the market price of the Company’s shares on the date of grant and the Company’s dividend yield. Restricted share units outstanding Number of shares 2014 Weighted average fair value at grant date $ 2014 Number of shares 2013 Weighted average fair value at grant date $ 2013 10,014 386,879 (13,125) (12,593) 371,175 A$15.05 A$9.72 A$9.61 A$16.77 A$9.72 46,536 – (33,893) (2,629) 10,014 A$14.96 – A$14.72 A$17.67 A$15.05 ADSs: Balance at 1 July Granted Forfeited/cancelled Vested Non-vested balance at 30 June 431,186 12,180 (50,673) (197,341) 195,352 US$9.80 US$7.64 US$8.43 US$10.94 US$8.87 471,763 408,190 (46,802) (401,965) 431,186 US$13.39 US$8.70 US$10.39 US$12.81 US$9.80 5 Financial Statements Ordinary Shares: Non-vested balance at 1 July Granted Forfeited/cancelled Vested Non-vested balance at 30 June 125 F INAN C IAL S TATEMENT S notes to the Consolidated financial statements For the year ended 30 June 2014 For personal use only Note 24 – Share ownership plans (continued) 126 (c)Transition Incentive Share Plan related to the Metal Management merger In accordance with the terms and conditions of the merger agreement with Metal Management Inc., the Sims Group Limited Transition Incentive Plan (“SGLTIP”) was established. The SGLTIP assumed the rights and obligations of Metal Management under its former plan (“MMI Plan”). No additional grants can be made under the SGLTIP. The options assumed were held by the former directors of Metal Management Inc. who became directors of the Company on the merger date. Each outstanding share option under the MMI Plan was converted into 2.05 options of the Company. Each option represents the right to acquire one ADS. In addition, the exercise price of each outstanding option under the MMI Plan was converted at the same exchange ratio. All the options assumed were fully vested and therefore the fair value was recorded as a component of the purchase price for Metal Management Inc. As at 30 June 2014, no directors of the Company hold options. The following table sets out details of outstanding options under the SGLTIP: Balance at 1 July Exercised Forfeited/cancelled Balance at 30 June Exercisable at 30 June Number of options 2014 Weighted average exercise price US$ 2014 Number of options 2013 Weighted average exercise price US$ 2013 492,000 (82,000) (410,000) – – $13.89 $8.62 $14.95 – – 492,000 – – 492,000 492,000 $13.89 – – $13.89 $13.89 Note 25 – Remuneration of auditors It is the Group’s policy to employ PricewaterhouseCoopers on assignments additional to their statutory audit duties where PricewaterhouseCoopers’ expertise and experience with the Group are important. These assignments are principally for tax advice and due diligence on acquisitions, or where PricewaterhouseCoopers is awarded assignments on a competitive basis. All audit and non-audit services provided by PricewaterhouseCoopers are subject to pre-approval by the RAC of the Board in accordance with the Group Independence Policy. The following fees were paid and payable for services provided by the auditor of the Group and its related practices: PricewaterhouseCoopers Australia: Audit and review of financial statements Audit-related fees 1 Taxation services Other Network firms of PricewaterhouseCoopers Australia: Audit and review of financial statements Audit-related fees 1 Taxation services Total remuneration for PricewaterhouseCoopers 1 2014 A$’000 2013 A$’000 1,910 – 54 20 1,984 1,980 115 6 – 2,101 3,435 – 13 3,448 5,432 3,024 385 26 3,435 5,536 Audit-related fees include fees related to the restatement of the Group’s financial statements in 2013, due diligence related to acquisitions, internal control reviews, accounting consultations and regulatory related matters. Sims Metal Management Annual Report 2014 Note 26 – Business acquisitions and disposals For personal use only There were no acquisitions made during the year ended 30 June 2014. During the year ended 30 June 2013, the Group acquired five businesses. None of the acquisitions were significant in terms of purchase price. On a combined basis, had the acquisitions all occurred on 1 July 2012, there would not have been a significant change to the Group’s revenue and net profit for the year ended 30 June 2013. Additionally, revenue and net profit contribution by the businesses acquired to the Group post-acquisition was not significant. (a) Purchase consideration and assets and liabilities acquired Details of the aggregate purchase consideration and cash outflow are as follows: Cash paid for current year acquisitions Cash acquired Cash outflow for acquisitions 2014 A$m – – – 2013 A$m 28.2 (0.1) 28.1 The fair value of assets and liabilities arising from acquisitions was as follows: Cash Trade and other receivables Inventories Property, plant and equipment (note 12) Identified intangible assets (note 14) Trade and other payables Deferred tax liability Net assets acquired 2014 A$m – – – – – – – – 2013 A$m 0.1 1.2 0.1 7.1 6.3 (0.4) (0.2) 14.2 Goodwill recognised from acquisitions was as follows: Total cash consideration Less: net assets acquired Goodwill on acquisition 2014 A$m – – – 2013 A$m 28.2 (14.2) 14.0 There were no material changes to the initial accounting for the prior year acquisitions. The goodwill was attributable to several factors including, site locations, synergies existing in the operations acquired and the assembled workforce, which together contribute to the profitability of the acquired businesses. Some of the goodwill recognised was deductible for income tax purposes. (b)Disposals During the years ended 30 June 2014 and 2013, the Group sold businesses in the US within the North America segment which were determined to be non-core. Some of these businesses were previously classified as held for sale at 30 June 2013. Details of the aggregate consideration and cash inflow are as follows: 2013 A$m 38.9 (0.5) 38.4 44.9 – 44.9 Financial Statements Total cash consideration Less: cash and cash equivalent balances disposed of Net cash inflow on disposal of businesses 2014 A$m 5 Total cash consideration includes A$1.2 million which was deposited into an escrow account for general representations and warranties made by the Group to the buyer. 127 F INAN C IAL S TATEMENT S notes to the Consolidated financial statements For the year ended 30 June 2014 For personal use only Note 26 – Business acquisitions and disposals (continued) 128 (b) Disposals (continued) The loss on the disposal of the businesses was calculated as follows: Total consideration Net carrying value of disposed assets: Cash Receivables Inventories Prepayments Property, plant and equipment Goodwill and other intangibles Accounts payable Recycling of foreign currency translation reserve on disposal of foreign operations Transaction costs associated with disposals Loss on business disposals 2014 A$m 2013 A$m 38.9 44.9 (0.5) (13.0) (19.2) (0.3) (16.5) (1.0) 6.0 4.8 (0.5) (1.3) – – (2.4) – (32.8) (19.8) – – – (10.1) In the year ended 30 June 2012, the Group sold its 50% ownership interest in the secondary lead producing facility in Sydney, Australia of Australian Refined Alloys (“ARA”) to companies associated with Renewed Metal Technologies for total sales proceeds of A$40.0 million. The disposal transaction was an asset sale only comprising the sale of land, buildings, and plant and equipment. The gain on the disposal of the assets recorded in other income in the year ended 30 June 2012 was calculated as follows: A$m Cash consideration received Net carrying value of disposed assets: Land and buildings Plant and equipment Capital work-in-progress Transaction costs associated with disposal Gain on disposal 40.0 (2.4) (1.3) (0.2) (0.4) 35.7 In the year ended 30 June 2013, additional assets related to the Group’s 50% ownership interest ARA were sold resulting in a loss on disposal of A$1.3 million. This amount has been recorded in other expenses (refer to note 7). Name of entity Sims Metal Management Limited Sims Group Australia Holdings Limited (i) Sims Aluminium Pty Limited (i) Sims E-Recycling Pty Limited Simsmetal Holdings Pty Limited Simsmetal Properties Qld Pty Limited Sims Industrial Pty Limited Simsmetal Services Pty Limited (i) Simsmetal Properties NSW Pty Limited Sims Group Holdings 3 Pty Limited Universal Inspection and Testing Company Pty Limited Sims Group Holdings 1 Pty Ltd Sims Group Holdings 2 Pty Ltd Electronic Product Stewardship Australasia Pty Limited Sims Recycling Solutions Austrian Holding GmbH Sims Recycling Solutions Austrian Intermediate Holdings GmbH Sims metrade GmbH Sims Recycling Solutions NV Sims Group Recycling Solutions Canada Ltd Sims Group Canada Holdings Limited ErgoTrade d.o.o. (iii) Sims Lifecycle Services s.r.o. Sims Recycling Solutions FZE Sims Group German Holdings GmbH Sims M+R GmbH Sims Lifecycle Services GmbH Sims Metal Management Asia Limited Sims Metal Management China Holdings Limited Sims Metal Management Dragon Holdings Limited Sims Lifecycle Services Kft. Trishyiraya Recycling India Private Limited Sims Recycling Solutions India Private Limited Sims Group Mauritius Limited (iii) Mirec BV Sims Recycling Solutions Coöperatief B.A. Sims Lifecycle Services BV Sims E – Recycling (NZ) Limited Simsmetal Industries Limited Sims Recycling Solutions A/S (ii) PNG Recycling Limited Gaukara Company No. 2 Limited Sims Lifecycle Service Sp z.o.o. Sims Recycling Solutions Africa Pty Ltd Sims Recycling Solutions Pte. Ltd. Sims Recycling Solutions AB Sims Group UK Holdings Limited Sims Group UK Intermediate Holdings Limited Sims Group UK Limited C Herring & Son Limited Life Cycle Services Limited All Metal Recovery Limited All Metal Recovery Cradley Heath Limited Equity holding % Country of Incorporation Australia Australia Australia Australia Australia Australia Australia Australia Australia Australia Australia Australia Australia Australia Austria Austria Austria Belgium Canada Canada Croatia Czech Republic Dubai Germany Germany Germany Hong Kong Hong Kong Hong Kong Hungary India India Mauritius Netherlands Netherlands Netherlands New Zealand New Zealand Norway Papua New Guinea Papua New Guinea Poland Republic of South Africa Singapore Sweden UK UK UK UK UK UK UK 2014 2013 100% 100% 90% 100% 100% 100% 100% 100% 100% 100% 100% 100% 90% 100% 100% 100% 100% 100% 100% 0% 100% 100% 100% 100% 100% 100% 100% 100% 100% 100% 100% 0% 100% 100% 100% 90% 100% 100% 100% 100% 100% 100% 100% 100% 100% 100% 100% 100% 100% 100% 100% 100% 100% 90% 100% 100% 100% 100% 100% 100% 100% 100% 100% 90% 100% 100% 100% 100% 100% 100% 100% 100% 100% 100% 100% 100% 100% 100% 100% 100% 100% 100% 100% 100% 100% 100% 90% 100% 0% 100% 100% 100% 100% 100% 100% 100% 100% 100% 100% 100% 100% 100% 5 Financial Statements For personal use only The consolidated financial statements incorporate the assets, liabilities and results of the following subsidiaries in accordance with the accounting policy described in note 1(e). Sims Metal Management Annual Report 2014 Note 27 – Subsidiaries 129 F INAN C IAL S TATEMENT S notes to the Consolidated financial statements For the year ended 30 June 2014 For personal use only Note 27 – Subsidiaries (continued) Equity holding % Name of entity Country of Incorporation ER Coley (Steel) Limited (iii) ER Coley (Cast) Limited (iii) Evans & Mondon Limited Sims Recycling Solutions UK Holdings Limited Sims Recycling Solutions UK Group Limited Sims Recycling Solutions UK Limited United Castings Limited Sims Group UK Pension Trustees Limited Recommit Limited (iii) Cooper Metal Recycling Ltd Dunn Brothers (1995) Limited Cheque Swap Limited Deane Wood Export Limited S3 Interactive Limited Sims FE Mottram Limited Sims Recycling Solutions Inc. Sims Recycling Solutions Holdings Inc. Sims Metal Management USA GP Sims Group USA Holdings Corporation Dover Barge Company Simsmetal East LLC Sims Municipal Recycling of New York LLC Schiabo Larovo Corporation Simsmetal West LLC Sims Group Global Trade Corporation Sims Group USA Corporation Metal Management, Inc. Metal Dynamics Detroit LLC SMM Gulf Coast LLC Metal Management Midwest, Inc. CIM Trucking, Inc. Metal Management Indiana, Inc. Metal Management Memphis, L.L.C. Metal Management Ohio, Inc. SMM – North America Trade Corporation Metal Management Pittsburgh, Inc. Metal Management Aerospace, Inc. (iii) Metal Management Arizona, L.L.C. Proler Southwest Corporation SMM South Corporation Naporano Iron & Metal, Inc. Metal Management Northeast, Inc. SMM New England Corporation New York Recycling Ventures, Inc. Reserve Iron & Metal Limited Partnership Port Albany Ventures, LLC SMM Southeast LLC UK UK UK UK UK UK UK UK UK UK UK UK UK UK UK US US US US US US US US US US US US US US US US US US US US US US US US US US US US US US US US 2014 2013 0% 0% 100% 100% 100% 100% 100% 100% 0% 100% 100% 100% 100% 100% 100% 100% 100% 100% 100% 100% 100% 100% 100% 100% 100% 100% 100% 100% 100% 100% 100% 100% 100% 100% 100% 100% 0% 100% 100% 100% 100% 100% 100% 100% 100% 100% 100% 100% 100% 100% 100% 100% 100% 100% 100% 100% 100% 100% 100% 100% 100% 100% 100% 100% 100% 100% 100% 100% 100% 100% 100% 100% 100% 100% 100% 100% 100% 100% 100% 100% 100% 100% 100% 100% 100% 100% 100% 100% 100% 100% 100% 100% 100% 100% (i)These subsidiaries and the Company are parties to a DCG under which each entity guarantees the debts of the others. The above entities represent a Closed Group and an Extended Closed Group for the purposes of the relevant Australian Securities and Investments Commission Class Order. (ii)These subsidiaries were acquired or incorporated during the year. (iii)These subsidiaries were disposed of or deregistered during the year. The voting power held in each subsidiary is proportionate to the equity holdings. 130 For personal use only Sims Metal Management Limited, Sims Group Australia Holdings Limited, Sims Aluminium Pty Limited and Simsmetal Services Pty Limited are parties to a DCG under which each Group guarantees the debts of the others. By entering into the DCG, the wholly owned entities have been relieved from the requirements to prepare a financial report and directors report under Class Order 98/1418 (as amended) issued by ASIC. Sims Metal Management Annual Report 2014 Deed of Cross Guarantee The above companies represent a “Closed Group” for the purposes of the Class Order. As there are no other parties to the DCG that are controlled by Sims Metal Management Limited, they also represent the “Extended Closed Group”. Set out below is a condensed consolidated income statement, a consolidated statement of comprehensive income, a summary of movements in consolidated accumulated deficit and a consolidated statement of financial position for the Closed Group. (i) Condensed consolidated income statement Profit/(loss) before income tax 1 Income tax expense Profit/(loss) after tax 1 2014 A$m 36.9 (28.5) 8.4 2013 A$m restated (185.4) (13.7) (199.1) Amount includes an after tax non-cash impairment charge of A$59.1 million for 2014 and A$240.2 million for 2013 against the parent entity’s investment in subsidiaries which are not part of the Closed Group. (ii) Consolidated statement of comprehensive income Profit/(loss) after tax Other comprehensive income: Items that may be reclassified to profit or loss Changes in the fair value of derivatives held as cash flow hedges, net of tax Share of other comprehensive income from associates Items that will not be reclassified to profit or loss Actuarial gain on defined benefit plans, net of tax Other comprehensive income/(loss) for the year, net of tax Total comprehensive income/(loss) for the year (iii) Summary of movements in consolidated accumulated deficit Balance at 1 July Profit/(loss) for the year Actuarial gain on defined benefit plans, net of tax Dividends provided for or paid Balance at 30 June (199.1) 2.6 – (3.4) (0.3) 0.8 3.4 11.8 3.2 (0.5) (199.6) (840.6) 8.4 0.8 – (831.4) (624.3) (199.1) 3.2 (20.4) (840.6) 3.3 225.8 91.7 1.8 3.7 326.3 3.6 339.1 114.0 1.3 – 458.0 5 Financial Statements (iv) Consolidated statement of financial position ASSETS Current assets Cash and cash equivalents Trade and other receivables Inventory Other financial assets Assets held for sale Total current assets 8.4 131 F INAN C IAL S TATEMENT S notes to the Consolidated financial statements For the year ended 30 June 2014 For personal use only Note 27 – Subsidiaries (continued) 132 (iv) Consolidated statement of financial position (continued) 2014 A$m 2013 A$m restated 29.0 1,652.2 153.6 2.1 37.9 40.4 1.7 1,916.9 2,243.2 23.5 1,552.5 160.7 1.0 20.4 40.4 2.6 1,801.1 2,259.1 LIABILITIES Current liabilities Trade and other payables Borrowings Other financial liabilities Current tax liabilities Provisions Total current liabilities 95.2 0.5 0.2 17.3 12.6 125.8 151.0 – 4.0 3.8 15.4 174.2 Non-current liabilities Payables Borrowings Deferred tax liabilities Provisions Total non-current liabilities Total liabilities 2.2 12.6 10.0 2.7 27.5 153.3 1.4 7.7 6.9 1.7 17.7 191.9 Net assets 2,089.9 2,067.2 EQUITY Contributed equity Reserves Accumulated deficit Total equity 2,796.4 124.9 (831.4) 2,089.9 2,795.7 112.1 (840.6) 2,067.2 Non-current assets Investments in associates and joint ventures Other financial assets Property, plant and equipment Retirement benefit assets Deferred tax assets Goodwill Other intangible assets Total non-current assets Total assets Sims Metal Management Annual Report 2014 For personal use only Note 28 – Interests in other entities (a)Names of associates and joint ventures Name SA Recycling LLC Rondout Iron & Metal Company LLC Richmond Steel Recycling Limited LMS Energy Pty Ltd (“LMS”) Simstar Alloys Pty Limited ITL Logistics GmbH Chiho-Tiande Group Limited (“CTG”) Ownership interest % Country of Incorporation US US Canada Australia Australia Germany Cayman Islands 2014 2013 50 50 50 50 50 34 16 50 50 50 50 50 34 16 Other than LMS, the principal activity of all other associates or joint ventures is metal recycling. LMS is a specialist landfill gas and renewable energy company, which researches, installs and develops landfill gas extraction systems, renewable energy and power generation technologies. (b)Movements in carrying amounts of associates and joint ventures Balance at 1 July Disposals (c) Dilution loss on change in ownership interest of an associate Share of results Accretion of deferred gain to equity accounted profit Impairment of investment in an associate (d) Share of other comprehensive income of associates Equity accounting elimination (note 11) Dividends received Foreign exchange differences Balance at 30 June 2014 A$m 2013 A$m 330.0 – (0.2) (5.9) 2.6 – 0.3 – (7.5) (4.4) 314.9 351.1 (7.6) – (15.1) 2.3 (14.9) 0.6 (2.5) (12.3) 28.4 330.0 (c)Disposals In October 2012, the Group disposed of its 50% ownership interest in its Metal Management Nashville, LLC joint venture for a loss of A$0.3 million. (d)Impairments As at 30 June 2013, the Group determined that its investment in CTG was impaired due to a significant decline in CTG’s quoted share price and its recent significant net loss. As a result, the Group recognised an impairment charge of A$14.9 million to write‑down its investment in CTG to its fair value. The fair value of the Group’s interest in CTG at 30 June 2014, which is listed on the Hong Kong Stock Exchange, was A$69.2 million (2013: A$73.4 million). 5 Financial Statements Investments in associates and joint arrangements are annually tested for impairment and whenever the Group believes events or changes in circumstances indicate that the carrying value amount may not be recoverable. An impairment loss is recognised for the amount by which the carrying amount of the investment exceeds its recoverable amount. The recoverable amount is the higher of an investment’s fair value less costs to sell and value in use. The impairment analysis includes performing sensitivity analysis of any reasonable possible changes which could give rise to any impairment. As at 30 June 2014, the sensitivity analysis performed on the Group’s SA Recycling joint venture indicated that if future cash flows were 10% lower, with all other assumptions being the same, then the carrying amount of the Group’s investment in SA Recycling would have been impaired by A$17 million. In the year ended 30 June 2012, SA Recycling LLC recognised an impairment on goodwill, of which the Group’s pre-tax share was A$57.5 million. This has been recognised in the income statement in the period. The impairment represents the portion of SA Recycling LLC’s goodwill attributable to the Group which was determined to be not recoverable based on the value in use of the business. Similar to the Group’s North America Metals CGU, SA Recycling LLC was impacted by economic conditions which have impacted its financial results and future forecasts. 133 F INAN C IAL S TATEMENT S notes to the Consolidated financial statements For the year ended 30 June 2014 For personal use only Note 28 – Interests in other entities (continued) (e)Investment in Chiho-Tiande On 17 January 2012, the Group acquired 16% of the existing shares of CTG, a Hong Kong listed metals and electronics recycler with operations in the People’s Republic of China and Hong Kong. The shares were acquired from founder Chairman Ankong Fang and Delco Participation B.V. (Delco), a Netherlands-based investment holding company, for total consideration of HK$750.1 million (A$93.1 million). The cost of the acquisition also included transaction costs of A$0.4 million. In addition, Delco granted an option to the Group to acquire a further 2% of CTG (see note 11). The Group accounts for CTG as an associate, although the Group holds less than 20% equity interest. This is because the Group exercises significant influence through its nominated director’s active participation on CTG’s board of directors as well as a significant trading relationship with CTG. (f) Summarised financial information of associates and joint ventures 2014 A$m 2013 A$m Current assets Non-current assets Total assets 142.9 306.7 449.6 186.7 297.6 484.3 Current liabilities Non-current liabilities Total liabilities Net assets 95.5 82.2 177.7 271.9 105.1 112.9 218.0 266.3 2014 A$m 2013 A$m 2012 A$m 786.9 (788.1) (1.2) (4.7) (5.9) 731.5 (745.5) (14.0) (1.1) (15.1) 837.9 (845.7) (7.8) (2.5) (10.3) Group’s share of assets and liabilities Group’s share of revenue, expenses and results Revenues Expenses Loss before income tax Tax expense Loss for the year (g) Contingent liabilities and capital commitments The Group’s share of the contingent liabilities of joint arrangements is disclosed in note 22. The Group’s share of the capital commitments and other expenditure commitments of joint arrangements is disclosed in note 23. (h) Joint operations The Group has a 50% interest in a joint operation called Sims Pacific Metals (“SPM”) which is engaged in metal recycling in New Zealand. The partners in the joint operation own the assets as tenants in common and are jointly and severally liable for the liabilities incurred by the joint operation. SPM is therefore classified as a joint operation and the Group recognises its direct right to the jointly held assets, liabilities, revenues and expenses as described in note 1(e)(iii). The Group’s interest in SPM is included in the statement of financial position under the classifications shown below: 2014 A$m 2013 A$m Current assets Non-current assets Total assets 22.0 8.0 30.0 15.9 8.4 24.3 Current liabilities Non-current liabilities Total liabilities Net assets 25.3 0.1 25.4 4.6 18.6 0.2 18.8 5.5 The Group’s share of SPM’s contingent liabilities and capital expenditure commitments is included in notes 22 and 23, respectively. 134 Sims Metal Management Annual Report 2014 Note 29 – Related party transactions For personal use only The Group’s related parties are its associates, joint ventures, pension schemes and key management personnel. Group contributions to pension schemes are disclosed in notes 7 and 18. (a) Key management personnel compensation Short-term benefits Long-term benefits Post-employment benefits Termination benefits Share-based payments 2014 A$ 2013 A$ 8,868,381 33,873 275,143 791,336 3,261,293 13,230,026 7,272,267 78,512 280,412 – 8,197,495 15,828,686 The Group has taken advantage of the relief provided by ASIC Class Order 06/50 and has transferred the detailed remuneration disclosures to the Remuneration Report, which is presented in the Directors’ Report. (b) Other transactions with key management personnel Transactions entered into with any Directors or other key management personnel of the Group, including their personally related parties, are at normal commercial terms. Between July 2013 and November 2013 the Company operated without a Group Chief Executive Officer while an executive search was accomplished by the Board. The Board determined that while the search for a Group Chief Executive Officer was accomplished, that the Company would be led by a senior management team that would be led by Directors Geoffrey Brunsdon and James Thompson. As compensation for their services in providing leadership during the transition period to a new Group Chief Executive Officer, the Board determined in November 2013 to pay A$200,000 to Mr Brunsdon and US$200,000 to Mr Thompson as special one-off awards. The fee was determined by the Remuneration Committee in consultation with a remuneration advisor and then recommended to the Board. Mr Sato serves as the representative director for Mitsui & Co. Prior to Mr Sato’s appointment, Mr Sukagawa served as the representative director for Mitsui & Co. As a result, their respective director remuneration is paid directly to Mitsui & Co. During the year ended 30 June 2014, the Group paid A$183,082 to Mitsui & Co. for director remuneration (2013: A$203,424). (c)Transactions with related parties Related party transactions with the Group’s associates and joint ventures are as follows: Sales of goods and services Purchases of goods and services Management fees and commissions Interest income 2014 A$m 2013 A$m 98.1 539.4 1.8 4.7 107.1 531.0 2.6 3.9 2014 A$m 2013 A$m 2.0 28.3 41.1 4.4 25.0 38.9 Outstanding balances from the Group’s associates and joint ventures are as follows: 5 Financial Statements Current receivables Current payables Loans to associate 135 F INAN C IAL S TATEMENT S notes to the Consolidated financial statements For the year ended 30 June 2014 For personal use only Note 30 – Parent entity financial information 136 The Company was incorporated on 20 June 2005. Under the terms of a scheme of arrangement entered into between Sims Metal Management Limited (formerly known as Sims Group Limited from 20 June 2005 to 21 November 2008) and Sims Group Australia Holdings Limited (“SGAHL”) (formerly known as Sims Group Limited prior to 20 June 2005) on 31 October 2005, the shareholders in SGAHL exchanged their shares in that entity for the shares in Sims Metal Management Limited. As required by AASB 3 (IFRS 3), Business Combinations at the time, SGAHL was deemed to be the acquirer in this business combination. This transaction has therefore been accounted for as a reverse acquisition. Accordingly, the consolidated financial statements of Sims Metal Management Limited have been prepared as a continuation of the consolidated financial statements of SGAHL. SGAHL, as the deemed acquirer, has applied purchase accounting for its acquisition of Sims Metal Management Limited as at 31 October 2005. (a) Summary financial information Statement of financial position: Current assets Total assets Current liabilities Total liabilities Shareholders’ equity: Contributed equity Reserves Accumulated deficit Total equity Loss for the year 1 Total comprehensive loss 1 2014 A$m 2013 A$m 87.8 2,511.4 59.1 2,585.2 79.6 81.4 62.3 63.7 4,117.0 126.2 (1,813.2) 2,430.0 4,116.3 112.8 (1,707.6) 2,521.5 (105.6) (105.6) (408.4) (408.4) The parent entity’s loss for 2014 and 2013 included an after-tax non-cash impairment charge of A$105.0 million and A$427.0 million, respectively, against the parent entity’s investment in subsidiaries. In accordance with AASB 136 (IAS 36), the parent entity’s investment in subsidiary balance was compared to the higher of its value in use or fair market value less costs to sell, and the comparison identified an impairment in the carrying value of the parent entity’s investment in subsidiaries. This non-cash charge is reversed on consolidation and does not impact the consolidated financial statements of the Group. As at 30 June 2013, the Company had current liabilities greater than current assets. The current liabilities primarily represent intercompany balances between entities, which are a party to a DCG to which the Parent is also a party. Refer to note 27. (b)Guarantees entered into by the parent entity The Company has not provided financial guarantees for which a liability has been recognised in the Company’s statement of financial position. The Company and certain of its subsidiaries have given guarantees in respect of the performance of contracts entered into in the ordinary course of business. The amount of these guarantees provided by the Company as at 30 June 2014 was A$38.4 million (2013: A$46.1 million). On 31 March 2011, the Company provided a guarantee for its proportional share of a lease obligation of a joint venture of the Group. The Company’s proportional amount of the lease obligation remaining as at 30 June 2014 was A$11.8 million (2013: A$14.8 million). The Company is party to a number of financing facilities and a Deed of Cross Guarantee under which it guarantees the debts of a number of its subsidiaries. Refer to notes 16 and 27 for details. (c)Lease commitments Not later than one year Later than one year, but not later than five years Later than five years Total lease commitments not recognised as liabilities 2014 A$m 2013 A$m 2.1 8.6 38.7 49.4 2.0 8.5 40.7 51.2 Sims Metal Management Annual Report 2014 For personal use only Note 31 – Cash flow information (a) Cash and cash equivalents Cash at the end of the financial year as shown in the consolidated statements of cash flows is reconciled to the related items in the consolidated statements of financial position as follows: Cash at bank and on hand Cash and cash equivalents 2014 A$m 2013 A$m 57.2 57.2 46.9 46.9 Cash and cash equivalents include A$1.2 million of cash held in escrow from the sale of a business for general warranties and representations. (b) Reconciliation of loss for the year to net cash inflows from operating activities 2014 A$m 2013 A$m restated 2012 A$m restated (88.9) 123.9 1.9 0.2 8.5 (0.6) 27.8 0.7 40.9 – – 2.4 – 1.3 11.8 1.2 (3.0) 10.8 (467.3) 123.5 2.9 – (2.1) 6.1 292.2 12.2 61.2 14.9 – 0.6 0.3 10.1 16.1 1.4 (2.3) 25.1 (623.0) 129.9 2.2 – (1.2) 2.0 617.3 0.8 0.4 – 57.5 (2.8) (35.7) – 24.3 1.1 (0.7) 13.1 14.8 41.7 (0.7) 54.2 12.2 14.3 (65.3) 67.5 266.7 19.1 11.7 (3.5) (28.0) (131.1) 139.6 161.0 (22.1) (15.8) (19.4) (40.1) (98.8) Net cash inflows from operating activities 210.1 297.3 289.6 (c)Non-cash investing and financing activities 5 Financial Statements Loss for the year Depreciation and amortisation Non-cash interest expense Dilution loss on change in ownership interest of an associate Unrealised loss/(gain) on held for trading derivatives Fair value (gains)/losses on financial assets at fair value through profit or loss Impairment of goodwill Impairment of intangible assets Impairment of property, plant and equipment Impairment of investment in an associate Impairment of goodwill in joint venture Net loss/(gain) on disposal of property, plant and equipment Loss/(gain) on sale of joint ventures and assets Loss on sale of business divisions Non-cash share-based payments expense Non-cash retirements benefit expense Imputed portion of interest income on convertible loan Equity accounted results net of dividends received Change in operating assets and liabilities, excluding the effects of acquisitions and disposals of entities: Decrease in trade and other receivables Decrease in inventories (Increase)/decrease in prepayments Increase/(decrease) in provisions Increase/(decrease) in income taxes Increase/(decrease) in deferred taxes Decrease in trade and other payables During the year ended 30 June 2014, the Group acquired equipment by means of finance leases totaling A$2.8 million (2013: nil). Refer to note 12. During the year ended 30 June 2014, the Group disposed of equipment totaling A$4.5 million (2013: nil) for which the cash proceeds were not received until July 2014. 137 F INAN C IAL S TATEMENT S notes to the Consolidated financial statements For the year ended 30 June 2014 For personal use only Note 32 – Assets/liabilities classified as held for sale 138 Assets classified as held for sale Trade and other receivables Inventory Property, plant and equipment Prepayments Liabilities directly associated with assets classified as held for sale Trade and other payables Provisions 2014 A$m 2013 A$m – – 7.4 – 7.4 16.1 25.3 11.3 0.4 53.1 – – – 6.9 9.7 16.6 Assets held for sale at 30 June 2014 include excess property and equipment in the US and Australia which the Group expects to sell within the next financial year. Assets held for sale at 30 June 2013, including directly associated liabilities, represented non-core assets in the US which were sold during the year ended 30 June 2014. Refer to note 26(b) for additional information. In the Directors’ opinion: For personal use only (a) The financial statements and notes set out on pages 75 to 138 are in accordance with the Corporations Act 2001 , including: i) Sims Metal Management Annual Report 2014 Directors’ Declaration complying with Accounting Standards, the Corporations Regulations 2001 and other mandatory professional reporting requirements, and ii) giving a true and fair view of the consolidated entity’s financial position as at 30 June 2014 and of its performance for the financial year ended on that date, and (b) there are reasonable grounds to believe that Sims Metal Management Limited will be able to pay its debts as and when they become due and payable, and (c) at the date of this declaration, there are reasonable grounds to believe that the members of the Extended Closed Group identified in note 27 will be able to meet any obligations or liabilities to which they are, or may become, subject by virtue of the Deed of Cross Guarantee described in note 27. Note 1(b) confirms that the financial statements also comply with International Financial Reporting Standards as issued by the International Accounting Standards Board. The directors have been given the declarations by the Group Chief Executive Officer and the Group Chief Financial Officer required by section 295A of the Corporations Act 2001 . The declaration is made in accordance with a resolution of the Directors. G N Brunsdon Chairman Sydney 22 August 2014 G J Claro Managing Director and Group CEO New York 21 August 2014 5 Financial Statements 139 F INAN C IAL S TATEMENT S For personal use only Independent auditor’s report to the members of Sims Metal Management Limited Report on the financial report We have audited the accompanying financial report of Sims Metal Management Limited (the company), which comprises the statement of financial position as at 30 June 2014, the income statement, the statement of comprehensive income, statement of changes in equity and statement of cash flows for the year ended on that date, a summary of significant accounting policies, other explanatory notes and the directors’ declaration for Sims Metal Management Limited (the consolidated entity). The consolidated entity comprises the company and the entities it controlled at the year's end or from time to time during the financial year. Directors’ responsibility for the financial report The directors of the company are responsible for the preparation of the financial report that gives a true and fair view in accordance with Australian Accounting Standards and the Corporations Act 2001 and for such internal control as the directors determine is necessary to enable the preparation of the financial report that is free from material misstatement, whether due to fraud or error. In Note 1, the directors also state, in accordance with Accounting Standard AASB 101 Presentation of Financial Statements, that the financial statements comply with International Financial Reporting Standards as issued by the International Accounting Standards Board. Auditor’s responsibility Our responsibility is to express an opinion on the financial report based on our audit. We conducted our audit in accordance with Australian Auditing Standards. Those standards require that we comply with relevant ethical requirements relating to audit engagements and plan and perform the audit to obtain reasonable assurance whether the financial report is free from material misstatement. An audit involves performing procedures to obtain audit evidence about the amounts and disclosures in the financial report. The procedures selected depend on the auditor’s judgement, including the assessment of the risks of material misstatement of the financial report, whether due to fraud or error. In making those risk assessments, the auditor considers internal control relevant to the consolidated entity’s preparation and fair presentation of the financial report in order to design audit procedures that are appropriate in the circumstances, but not for the purpose of expressing an opinion on the effectiveness of the entity’s internal control. An audit also includes evaluating the appropriateness of accounting policies used and the reasonableness of accounting estimates made by the directors, as well as evaluating the overall presentation of the financial report. We believe that the audit evidence we have obtained is sufficient and appropriate to provide a basis for our audit opinion. Independence In conducting our audit, we have complied with the independence requirements of the Corporations Act 2001 . PricewaterhouseCoopers, ABN 52 780 433 757 Darling Park Tower 2, 201 Sussex Street, GPO BOX 2650, SYDNEY NSW 1171 DX 77 Sydney, Australia T +61 2 8266 0000, F +61 2 8266 9999, www.pwc.com.au 140 Liability limited by a scheme approved under Professional Standards Legislation. Auditor’s opinion For personal use only In our opinion: Sims Metal Management Annual Report 2014 Independent auditor’s report to the members of Sims Metal Management Limited (a) the financial report of Sims Metal Management Limited is in accordance with the Corporations Act 2001 , including: i) giving a true and fair view of the consolidated entity’s financial position as at 30 June 2014 and of its performance for the year ended on that date; and ii) complying with Australian Accounting Standards (including the Australian Accounting Interpretations) and the Corporations Regulations 2001 . (b) the financial report and notes also comply with International Financial Reporting Standards as disclosed in Note 1. Report on the Remuneration Report We have audited the remuneration report included in pages 48 to 74 of the directors’ report for the year ended 30 June 2014. The directors of the company are responsible for the preparation and presentation of the remuneration report in accordance with section 300A of the Corporations Act 2001 . Our responsibility is to express an opinion on the remuneration report, based on our audit conducted in accordance with Australian Auditing Standards. Auditor’s opinion In our opinion, the remuneration report of Sims Metal Management Limited for the year ended 30 June 2014, complies with section 300A of the Corporations Act 2001 . PricewaterhouseCoopers David Wiadrowski Partner Sydney 22 August 2014 Auditor’s Independence Declaration As lead auditor for the audit of Sims Metal Management Limited for the year ended 30 June 2014, I declare that to the best of my knowledge and belief, there have been: (a) no contraventions of the auditor independence requirements of the Corporations Act 2001 in relation to the audit; and (b) no contraventions of any applicable code of professional conduct in relation to the audit. This declaration is in respect of Sims Metal Management Limited and the entities it controlled during the period. Sydney 22 August 2014 5 Financial Statements David Wiadrowski Partner PricewaterhouseCoopers PricewaterhouseCoopers, ABN 52 780 433 757 Darling Park Tower 2, 201 Sussex Street, GPO BOX 2650, SYDNEY NSW 1171 DX 77 Sydney, Australia T +61 2 8266 0000, F +61 2 8266 9999, www.pwc.com.au Liability limited by a scheme approved under Professional Standards Legislation. 141 O T H E R IN F O R MATI O N For personal use only Annual Financial Report Extracts Presented in US Dollars 142 The audited financial statements of the Group presented in Australian dollars (“A$”) are included in pages 75 to 79. On pages 143 to 145, extracts from the audited financial statements are presented in US dollars (“US”). This information does not form the part of the audited financial statements. The translation from A$ to US$ is included solely for the convenience of the reader. The financial statements as at and for the year ended 30 June 2014 have been translated into US$ at US$1.00 = A$1.0616 based on the closing exchange rate published by the Reserve Bank of Australia. For personal use only 2014 US$m Revenue 6,729.9 Other income Raw materials used and changes in inventories Freight expense Employee benefits expense Depreciation and amortisation expense Repairs and maintenance expense Other expenses Impairment of goodwill and other intangibles Finance costs Share of results of associates and joint ventures Loss before income tax 19.9 (4,917.2) (503.0) (555.2) (116.7) (97.1) (548.1) (26.8) (21.9) (3.1) (39.3) Income tax expense Loss for the year Loss per share: Basic Diluted Sims Metal Management Annual Report 2014 Consolidated US$ Income Statement For the year ended 30 June 2014 (44.4) (83.7) US¢ (40.8) (40.8) 6 Other Information 143 O T H E R IN F O R MATI O N Consolidated US$ statement of financial position as at 30 June 2014 For personal use only 2014 US$m 144 ASSETS Current assets Cash and cash equivalents Trade and other receivables Inventory Other financial assets Assets classified as held for sale Total current assets 53.9 419.7 513.4 48.8 7.0 1,042.8 Non-current assets Investments in associates and joint ventures Other financial assets Property, plant and equipment Retirement benefit assets Deferred tax assets Goodwill Other intangible assets Total non-current assets Total assets 296.6 6.8 850.6 2.0 93.6 131.2 72.1 1,452.9 2,495.7 LIABILITIES Current liabilities Trade and other payables Borrowings Other financial liabilities Current tax liabilities Provisions Total current liabilities 538.1 0.5 4.2 23.4 72.0 638.2 Non-current liabilities Payables Borrowings Deferred tax liabilities Provisions Retirement benefit obligations Total non-current liabilities Total liabilities 6.1 13.6 62.2 43.7 4.3 129.9 768.1 Net assets 1,727.6 EQUITY Contributed equity Reserves Accumulated deficit Total equity 2,634.3 (190.6) (716.1) 1,727.6 For personal use only 2014 US$m Cash flows from operating activities Receipts from customers (inclusive of GST) Payments to suppliers and employees (inclusive of GST) Interest received Interest paid Insurance recoveries Dividends received from associates and joint ventures Income taxes paid Net cash inflow from operating activities Cash flows from investing activities Payments for property, plant and equipment Proceeds from sale of property, plant and equipment Proceeds from sale of business division Payments for other financial assets Proceeds from sale of other financial assets Loans to a joint venture Proceeds from repayment on joint venture loans Loan to third parties Proceeds from repayment on third party loans Net cash outflow from investing activities Cash flows from financing activities Proceeds from borrowings Repayment of borrowings Fees paid for loan facilities Repayment of finance leases Proceeds from issue of shares Net cash outflow from financing activities Net increase in cash and cash equivalents Cash and cash equivalents at the beginning of the financial year Effects of exchange rate changes on cash and cash equivalents Cash and cash equivalents at the end of the financial year Sims Metal Management Annual Report 2014 Consolidated US$ statement of cash flows For the year ended 30 June 2014 6,872.4 (6,656.8) 5.7 (21.3) 8.4 7.5 (18.0) 197.9 (60.4) 4.5 36.2 (1.0) 1.6 (3.4) 3.4 (1.0) 19.3 (0.8) 2,506.4 (2,693.3) (1.6) (0.3) 0.7 (188.1) 9.0 44.2 0.7 53.9 6 Other Information 145 O T H E R IN F O R MATI O N Shareholder Information AS AT 4 SEPTEMBER 2014 For personal use only EQUITY SECURITIES SUBSTANTIAL SHAREHOLDERS Mitsui Raw Materials Developments Pty Limited Commonwealth Bank of Australia Perpetual Limited FIL Limited National Australia Bank Limited Number held % 36,151,787 23,879,794 19,334,648 12,457,894 11,218,658 17.7 11.7 9.4 6.1 5.4 ORDINARY SHARES Distribution of ordinary share holdings Range Holders 1–1,000 1,001–5,000 5,001–10,000 10,001–100,000 100,001 and over Total 7,667 6,174 834 340 36 15,051 There were 760 holders of less than a marketable parcel of shares. Voting rights attaching to the ordinary shares are, on a show of hands, one vote for every person present as a member, proxy, attorney or representative thereof and upon a poll each share shall have one vote. PERFORMANCE RIGHTS/RESTRICTED SHARE UNITS Distribution of performance rights/restricted share units holdings Range 1–1,000 1,001–5,000 5,001–10,000 10,001–100,000 100,001 and over Total Holders 4 47 32 68 7 158 A total of 4,996,132 performance rights and restricted share units to take up ordinary shares or American Depositary Shares are issued under the Sims Metal Management Limited Long Term Incentive Plan and individual contracts, held by 158 holders. The performance rights and restricted share units do not have any voting rights. OPTIONS Distribution of options holdings Range 1–1,000 1,001–5,000 5,001–10,000 10,001–100,000 100,001 and over Total Holders 5 35 30 111 13 194 A total of 7,851,449 options to take up ordinary shares or American Depositary Shares are issued under the Sims Metal Management Limited Long Term Incentive Plan, held by 194 holders. The options do not have any voting rights. 146 For personal use only TWENTY LARGEST SHAREHOLDERS 1. MITSUI RAW MATERIALS DEVELOPMENT PTY LIMITED LEVEL 40 120 COLLINS STREET, MELBOURNE VIC, 3000 2. J P MORGAN NOMINEES AUSTRALIA LIMITED LOCKED BAG 20049, MELBOURNE VIC, 3001 NO. OF SHARES % HELD 36,151,787 17.67 28,141,175 13.75 3. NATIONAL NOMINEES LIMITED GPO BOX 1406, MELBOURNE VIC, 3001 27,159,467 13.27 4. GPO BOX 5302, SYDNEY NSW, 2001 23,531,625 11.50 HSBC CUSTODY NOMINEES (AUSTRALIA) LIMITED 5. CITICORP NOMINEES PTY LIMITED G P O BOX 764G, MELBOURNE VIC, 3001 14,481,917 7.08 6. CITICORP NOMINEES PTY LIMITED <COLONIAL FIRST STATE INV A/C> GPO BOX 764G, MELBOURNE VIC, 3001 13,601,745 6.65 7. GPO BOX 5430, SYDNEY NSW, 2001 8,485,398 4.15 RBC INVESTOR SERVICES AUSTRALIA NOMINEES PTY LIMITED <PI POOLED A/C> 8. BNP PARIBAS NOMS PTY LTD <DRP> PO BOX R209, ROYAL EXCHANGE NSW, 1225 7,457,931 3.64 9. BNP PARIBAS NOMINEES PTY LTD <AGENCY LENDING DRP A/C> PO BOX R209, ROYAL EXCHANGE NSW, 1225 2,499,500 1.22 10. UBS NOMINEES PTY LTD LEVEL 16, CHIFLEY TOWER, 2 CHIFLEY SQUARE, SYDNEY NSW, 2000 1,165,484 0.57 11. RBC INVESTOR SERVICES AUSTRALIA NOMINEES PTY LIMITED <PIIC A/C> GPO BOX 5430, SYDNEY NSW, 2001 1,020,540 0.50 12. HSBC CUSTODY NOMINEES (AUSTRALIA) GPO BOX 5302, SYDNEY NSW, 2001 LIMITED <NT-COMNWLTH SUPER CORP A/C> 1,004,106 0.49 13. RBC INVESTOR SERVICES AUSTRALIA NOMINEES PTY LTD <BKMINI A/C> GPO BOX 5430, SYDNEY NSW, 2001 818,333 0.40 14. RBC INVESTOR SERVICES AUSTRALIA NOMINEES PTY LIMITED <PISELECT> GPO BOX 5430, SYDNEY NSW, 2001 809,333 0.40 15. CAMROCK (AUSTRALIA) PTY LTD PO BOX 649, BERWICK VIC, 3806 793,892 0.39 16. MILTON CORPORATION LIMITED PO BOX R1836, ROYAL EXCHANGE NSW, 1225 793,037 0.39 17. QIC LIMITED C/- NATIONAL NOMINEES LIMITED, GPO BOX 2242, BRISBANE QLD, 4001 695,145 0.34 18. ECAPITAL NOMINEES PTY LIMITED <SETTLEMENT A/C> GPO BOX 3804, SYDNEY NSW, 2001 567,148 0.28 19. UCA GROWTH FUND LIMITED 130 LITTLE COLLINS STREET, MELBOURNE VIC, 3000 515,000 0.25 20. ARGO INVESTMENTS LIMITED G P O BOX 2692, ADELAIDE SA, 5001 415,772 0.20 170,108,335 83.14 Sims Metal Management Annual Report 2014 SHAREHOLDER INFORMATION AS AT 4 SEPTEMBER 2014 FIVE YEAR TREND SUMMARY 2014 2013 Restated 2012 Restated 2011 2010 7,144.3 7,203.1 9,042.3 8,852.9 7,458.5 Revenue A$m (Loss)/profit before interest and tax Net interest expense Tax (expense)/benefit A$m A$m A$m (27.6) (14.2) (47.1) (470.4) (18.2) 21.3 (624.0) (21.3) 22.3 293.1 (23.9) (81.9) 198.3 (13.6) (63.3) (Loss)/profit after tax A$m (88.9) (467.3) (623.0) 187.3 121.4 Net Cash Flows from Operations A$m 210.1 297.3 289.6 158.6 (47.5) A¢ A¢ (43.5) 10.0 (228.6) 0.0 (302.7) 20.0 90.9 47.0 61.8 33.0 Return on Shareholders' Equity Current Ratio (to 1) Gearing Ratio % % (4.8) 1.63 N/A (24.2) 1.71 7.4 (27.3) 1.95 11.3 6.4 2.14 4.2 3.7 2.21 N/A A$ 7.91 8.15 8.35 8.70 9.45 Net Tangible Asset Backing per Share 6 Other Information (Loss)/earnings per share – diluted Dividends per Share 147 O T H E R IN F O R MATI O N Corporate Directory SECURITIES EXCHANGE LISTING For personal use only The Company’s ordinary shares are quoted on the Australian Securities Exchange under the ASX Code ‘SGM’. 148 The Company’s American Depositary Shares (ADSs) are quoted on the Over-the-Counter market under the symbol ‘SMSMY’. The Company has a Level I ADS program, and the depositary bank is The Bank of New York Mellon Corporation. ADSs trade under CUSIP number 829160100 with each ADS representing one (1) ordinary share. Further information and investor enquiries on ADSs may be directed to: The Bank of New York Mellon P.O. Box 358516 Pittsburgh, PA 15252-8516 Telephone: (1 888) BNY ADRS Email: [email protected] REGISTERED OFFICE Sir Joseph Banks Corporate Park Suite 3, Level 2 32–34 Lord Street Botany NSW 2019 Telephone: (02) 8113 1600 HEAD OFFICE 16 West 22nd Street, 10th Floor New York, NY 10010 United States Telephone: (1 212) 604-0710 SHAREHOLDER ENQUIRIES Enquiries from investors regarding their share holdings should be directed to: Computershare Investor Services Pty Limited Level 4 60 Carrington Street Sydney NSW 2000 Postal Address: GPO Box 2975 Melbourne VIC 3001 Telephone: 1300 855 080 Facsimile: (03) 9473 2500 COMPANY SECRETARIES Frank Moratti Scott Miller For more up-to-the-minute investor relations, visit www.simsmm.com. For personal use only This report is printed on Pacesetter. Pacesetter is FSC Mix Certified, which ensures that all virgin pulp is derived from well-managed forests and controlled sources. It is manufactured by an ISO 14001 certified mill. Designed and produced by ArmstrongQ – www.armstrongQ.com.au simsmm.com For personal use only

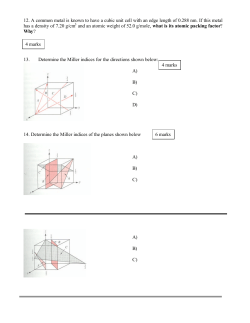


© Copyright 2026