
Supplemental Information
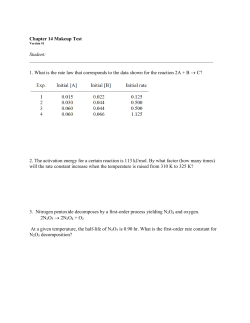
Molecular Cell, Volume 55
Supplemental Information
Cytosolic pH Regulates Cell Growth
through Distinct GTPases, Arf1 and Gtr1,
to Promote Ras/PKA and TORC1 Activity
Reinhard Dechant, Shady Saad, Alfredo J. Ibáñez, and Matthias Peter
Supplementary material:
Cytosolic pH regulates cell growth
through distinct GTPases, Arf1 and Gtr1,
to promote Ras/PKA and TORC1 activity
Reinhard Dechant, Shady Saad, Alfredo J. Ibáñez and Matthias Peter
cell size (fl)
A
55
50
45
40
35
10-4
10-3
10-2
10-1
1
10
glucose (%)
growth rate (1/h)
B
0.5
uc
r
0.4
Ra
Gl
Gl
ff
Va
l
0.3
uc
n
Ga
Pr
l
o
0.2
0.1
Fr
Se
Le
u
Gl
yc
0
30 40 50 60 70 80 90 100
cell size (fl)
C
8
Le
cytosolic pH
u Pr
o
Se
r Gln
7.5
Gl
uc
7
Fr
uc
Ra
ff
Ga
l
6.5
40
50
60
70
80
90
cell size (fl)
Dechant et al., Figure S1
A
B
extracellular pH
7.4
7.35
Gluc Gal Gluc Gal
+
+
PMA1-TAP
control
Gluc
Gal
7.3
7.25
PMA1-TAP
7.2
PGK1
7.15
0
1
2
3
4
5
6
time (min)
PMA1-GFP
-
CHX
D
tetO7-PMA1
+ dox
+
Whi5-GFP
C
m
Dechant et al., Figure S2
0.16
0.14
OD600
0.12
0.10
pRS415 ctrl
pRS415 dox
pMET-Ras2 ctrl
pMET-Ras2 dox
0.08
0.06
0.04
0.02
0
0 1 2 3 4 5 6 7 8 9 10 11
time (h)
Dechant et al., Figure S3
B
rel. Arf1-GFP
membrane loc. (A.U.)
1.1
1.0
0.9
0.8
0.7
0.6
WT
WT
ctrl C-starv
D
Arf2-GFP
C-starv
E
1
0.85
0.75
0.65
WT
2-DOG
gluocse
0
0
5
10
15
20
25
1.05
2
1.00
0.95
1
0.90
0.85
0.80
WT
gluc
0
15
30
45
glucose (%)
ctrl
0.95
time (min)
rel. Arf2-GFP
membrane loc. (A.U.)
C
2
1.05
glucose (%)
2-DOG (%)
Arf1-GFP rel. membrane
localization (A.U.)
A
0
time (min)
F
WT
YPD
100mM Ca2+
GArf1 TVWDVGGQDRIRSLWRHYY
Arf2 TVWDVGGQDRIRSLWRHYY
Arl1 NVWDLGGQTSIRPYWRCYY
Arl3 KFWDVGGQESLRSMWSEYY
Dechant et al., Figure S4
A
ctrl
C-starv +CHX +Rap
C
Sch9-HA
C-term
B
ctrl
C-starv +CHX +Rap
P-Sch9 (%)
125%
WT
100%
75%
50%
25%
P-Sch9
0%
ctrl
5'
15'
+gluc
E
125%
125%
P-Sch9 (%)
100%
75%
50%
25%
0%
low gluc
F
100%
75%
ctrl
dox
50%
25%
0%
low gluc
+ 2-DOG
Gtr1 WT
Gtr1 GTP
150%
P-Sch9 (%)
P-Sch9 (%)
15'
C-starv
Pgk1
D
5'
100%
WT
50%
0%
pH 4.6
pH 7.0
Dechant et al., Figure S5
A
GTR1
ctrl
-C
GTR1-GTP
-N
ctrl
-C
-N
Sch9-HA
C-term
C
B
3
P < 0.002
GTP/GDP ratio
GTP/GDP ratio
3
2
1
0
SD-full
D
1
Gluc
P < 0.02
12
8
C GDP
13
ion count
6
4
2
0
Gal
E
THC-PMA1
GTP/GDP ratio
2
0
C-starv
10
n.s.
ctrl
13
C GTP
C GDP
m/Z
dox
F
Glucose
pH
GTP
GDP
Galactose
?
pH
GTP
GDP
C-starv
?
Gtr1/2
Gtr1/2
TORC1
GTP
GDP
pH
?
Gtr1/2
TORC1
TORC1
Dechant et al., Figure S6
A
YPD
WT
100mM Ca2+
WT
B
Rtg1-GFP
tetO7-PMA1
+ dox
m
Dechant et al., Figure S7
Supplementary Figure Legends
Figure S1: Cytosolic pH tightly correlates with cell size on different Csources, related to Figure 1
(A) Correlation of cell size with glucose concentration. Cells expressing
pHluorin were grown as in Figure 1A and cell size was determined. Cell size
was plotted as a function of glucose concentration as in Figure 1A. (B)
Correlation of growth rate and cell size with different nutrient conditions.
Cells were grown as in Figure 1C and cell size was determined. Growth rates
from Figure 1C were plotted as a function of cell size. (C) Correlation of
growth rate and cytosolic pH on media containing alternative carbon sources
or amino acids. Cells were grown as in Figure 1C and cell size was
determined. Cytosolic pH was plotted as a function of cell size and data are
represented as in Figure 1C. In all panels, error bars represent SEM.
Figure S2: Regulation of Pma1 by C-source, related to Figure 2
(A) Measurement of net-proton export from cells. Representative example of
raw data for the assay presented in Figure 2A. Acidification of the buffer is
shown as a function of time upon addition of C-source. (B) Expression of
PMA1 on different C-sources. Cells expressing Pma1-TAP were grown in SCmedia containing 2% glucose or 2% galactose and expression of Pma1 was
determined by western-blotting. Pgk1 serves as a loading control. (C) Newly
synthesized Pma1 is secreted into developing buds. Cells expressing Pma1GFP were grown and scored for Pma1 localization with or without treatment
of cycloheximide (1h) to block new protein synthesis. Note that newly
synthesized Pma1-GFP has low fluorescence due to the slow maturation of
GFP. Thus, Pma1-GFP is barely visible in the absence of cycloheximide (CHX)
in developing buds, but is readily detectable upon CHX treatment, which
arrests growth and thus allows for maturation of the GFP fluorescence. (D)
Localization of Whi5-GFP upon suppression of PMA1 expression. tetO7PMA1 cells expressing Whi5-GFP were grown in the presence of 10µg/mg
doxycycline and scored for Whi5-GFP localization. A single mother cell (m)
generating 3 daughter cells (arrow heads) is shown.
Figure S3: Expression of wild-type Ras2 partially suppresses growth defect
associated with suppression of Pma1 expression, related to Figure 3
tetO7-PMA1 cells expressing wild-type Ras2 or a control plasmid were grown
in the presence or absence of doxycycline. Growth was determined by
measuring OD600 as a function of time. Doxycycline was used at 10 µg/ml.
Error bars represent SEM.
Figure S4: Arf1 and Arf2 are regulated by glucose and V-ATPase activity,
related to Figure 4
(A) Quantification of Arf1 membrane localization. Cells of the indicated
genotype expressing Arf1-GFP were grown in SD media and membrane
localization of Arf1 was quantified. Cells starved for glucose for 15 min are
included as control. (B) Regulation of Arf1 by glucose metabolism. Cells
expressing Arf1-GFP were grown in SC media containing 0.2% glucose,
loaded into a microfluidic chip and Arf1 membrane localization was followed
over time during addition of 2-DOG (solid red line). (C and D) Regulation of
Arf2 membrane localization by glucose. Cells expressing Arf2-GFP were
grown in SD media, loaded into a microfluidic chip and analyzed for Arf2
localization upon glucose starvation and readdition. (C) Representative
images before and 15 min after glucose starvation and (D) quantification of
time-lapse analysis are shown. (E) Synthetic lethality of arf1∆ and arf2∆
mutations. Diploid cells heterozygous for both arf1∆ and arf2∆ were
sporulated and tetrads were dissected on YPD plates. Genotypes of the
resulting spores are indicated. (F) Arf1 is not required for V-ATPase function.
Cells of the indicated genotype were grown in YPD, tenfold serial dilutions of
cells were spotted onto control plates (YPD) or plates containing 100 mM Ca2+
and scored for cell growth after 3 days. (G) Sequence alignment of ARF1 and
related GTPases from S. cerevisiae. The conserved glutamine residue required
for interaction with Arf-GAPs that was mutated to generate the hyperactive
allele is indicated in red. In all panels, error bars represent SEM.
Figure S5: Regulation of Sch9 phosphorylation by glucose is mediated by
cytosolic pH and requires V-ATPase and Gtr1, related to Figure 5 and 6
(A) Cells expressing Sch9-HA were grown in SC medium containing 2%
glucose, and Sch9-phosphorylation was analyzed by gel-shift assay following
NTCB cleavage after glucose starvation, addition of 20 µg/ml Cycloheximide
(CHX) and addition of 200nM Rapamycin. Note that CHX treatment increases
TORC1 activity and serves as a control. (B) Wild-type cells were grown and
treated as in (A) and analyzed for phosphorylation of Sch9 at T737 by
western-blotting using a phosphospecific antibody. (C and D) Activation of
Sch9 is regulated by glucose metabolism and Gtr1. Quantification of relative
phosphorylation of Sch9 from the experiment shown in Figure 5A (C) and
Figure 5B (D) is displayed as the mean +/- SEM of three independent
experiments. (E) Activation of Sch9 is regulated by cytosolic pH through Gtr1.
Quantification of relative phosphorylation of Sch9 from the experiment
shown in Figure 5C is displayed as in (C). (F) V-ATPase is required for
TORC1 activation. Quantification of relative phosphorylation of Sch9 from
the experiment shown in Figure 6A is displayed as in (C). In all panels, error
bars represent SEM.
Figure S6: Two glucose dependent signals might regulate TORC1
dependent Sch9 phosphorylation, related to Figure 5
(A) Cells expressing wild-type Gtr1 or dominant active Gtr1-Q65L (GTR1GTP) were grown in SD media and starved for glucose and nitrogen for 15
min. Sch9 phosphorylation was analyzed by western blotting following
NCBT cleavage. (B-D) Measurement of GTP/GDP ratio in cells after
perturbations of cytosolic pH. (B) Wild-type cells were grown in SD medium,
washed and resuspended in SD medium (SD-full) or in medium w/o glucose
(C-starv) and the ratio of GTP/GDP was determined as described in the
supplemental Materials and Methods. (C) Wild-type cells were grown in
media containing glucose or galactose and GTP/GDP ratio was determined.
(D) Cells harboring the tetO7-PMA1 allele were grown in the presence or
absence of doxycycline and GTP/GDP ratio was determined. Doxycycline
was used at 10 µg/ml. The P-values obtained from a Student’s t-test are
indicated. n.s.: not significantly different (P>0.1). (E) Schematic representation
of the analysis of intrinsic GTP fragmentation into GDP using
13
C and
12
C
labeled standards. See supplemental Materials and Methods for details. (F)
Model depicting the proposed integration of different glucose dependent
signals by TORC1. Glucose promotes activation cell growth by two
independent signals. In addition to cytosolic pH, another signal exists that
regulates Sch9 phosphorylation at the level of, or downstream of Gtr1. This
signal may be the ratio of GTP/GDP, or an associated metabolic signal. While
growth on alternative C-sources mostly affects the pH signal, complete
glucose starvation inactivates both signals, thus leading to inactivation of
TORC1 even in cells expressing dominant-active Gtr1. In all panels, error bars
represent SEM.
Figure S7: Regulation of V-ATPase activity by Gtr1 and pH dependent
regulation of Rtg1, related to Figure 6 and 7
(A) Cells of the indicated genotype were grown in YPD, tenfold serial
dilutions of cells were spotted onto control plates (YPD) or plates containing
100 mM Ca2+ and scored for cell growth after 3 days. (B) tetO7-PMA1 cells
expressing Rtg1-GFP were grown in SD medium in the presence of
doxycycline and Rtg1 localization was analyzed by fluorescence microscopy.
A mother cell (m) generating multiple daughter cells (arrowheads) is shown.
Doxycycline was used at 10 µg/ml.
Supplementary Tables
Table S1: plasmids used in this study
Plasmid No.
Genotype
Source
pRD22
pRS306-pGPD-pHluorin
(Dechant et al., 2010)
pRD23
pRS415-pADH-pHluorin
(Dechant et al., 2010)
pBL98
YEP213-Ras2-V19
C. DeVirgilio
pB1510
MET25-GFP-Ras2
(Wang and Deschenes, 2006)
pRD30
pYX212-EGFP-RBD-3
(Leadsham et al., 2009)
pRD50
pRS415-pADH1-ARF1-Q71L
This study
pRD32
pGAL-GST-Arf1
Thermo Scientific
pRD33
pGAL-GST-Gtr1
Thermo Scientific
pJU660
pRS415 GTR1
(Binda et al., 2009)
pMB1483
pRS415 GTR1-Q65L
(Binda et al., 2009)
pJU656
pRS415 GTR1-S20L
(Binda et al., 2009)
pJU676
pRS416 SCH9-5HA
(Urban et al., 2007)
pRD40
pRS413 SCH9-5HA
This study
pMKi102
pRS413 GFP-ATG8
M. Kijanska
Table S2: yeast strains used in this study
Strain No.
Relevant genotype
Source
BY4741
MATa ura3∆0; leu2∆0; his3∆1; met15∆0
Openbiosystems
BY4742
MATα ura3∆0; leu2∆0; his3∆1; met15∆0
Openbiosystems
FY4
MATa, isogenic prototrophic parent of BY4741
(Winston et al., 1995)
FY3
FY4 ura3-52
(Winston et al., 1995)
yRD204
BY4741, tetO7-PMA1::KanR; pCMV-TA*::URA3
R
Openbiosystems
yRD202
BY4741, tetO7-PMA1::Kan ; pCMV-TA*::URA3,
WHI5-GFP::HIS3
This study
yRD215
BY4741, PMA1-TAP::HIS3
Openbiosystems
yRD216
BY4741, PMA1-GFP::HIS3
Invitrogen
yRD135
BY4741, vma2∆::KanR
(Dechant et al., 2010)
yRD222
BY4741, ARF1-GFP::HIS3
Invitrogen
yRD341
BY4741, ARF2-GFP::HIS3
yRD220
BY4741, ARF1-GFP::HIS3; vma2∆::Kan
Invitrogen
R
This study
yRD224
BY4741, ARF1-GFP::HIS3; gea1∆::KanR
This study
yRD65
BY4741, VMA5-GFP::HIS3
(Dechant et al., 2010)
yRD267
BY4741, arf1∆::KAN
R
Openbiosystems
yRD294
BY4741, arf2∆::KANR
Openbiosystems
yRD295
BY4742, arf2∆::KAN
R
Openbiosystems
yRD268
BY4741, VMA5-GFP::HIS3; arf1∆::KanR
This study
yRD195
BY4741, TMD-RFP::HIS3
This study
yRD201
BY4742, TMD-RFP::HIS3
This study
yRD279
R
BY4741, arf1∆::KAN , TMD-RFP::HIS3
R
yRD210
BY4741, vma2∆::Kan ; TMD-RFP::HIS3
yRD269
R
BY4741, arf1∆::Kan ; vma2∆::Kan
R
R
R
Openbiosystems
Openbiosystems
This study
yRD280
BY4741 arf1∆::Kan ; vma2∆::Kan ; TMDRFP::HIS3
Openbiosystems
yRD288
BY4741, stv1∆::KanR; TMD-RFP::HIS3
Openbiosystems
R
R
yRD289
BY4741, arf1∆::Kan ; stv1∆::Kan ; TMDRFP::HIS3
This study
yRD231
BY4741, STV1-TAP::HIS3
Openbiosystems
yRD232
BY4741, VPH1-TAP::HIS3
Openbiosystems
yRD258
BY4741, RTG1-GFP::HIS3
Invitrogen
yRD259
BY4741, GAT1-GFP::HIS3
Invitrogen
yRD243
BY4741, gtr1∆::KanR
yRD256
R
BY4741, gtr1∆::Kan ; vma2∆::Kan
yRD305
BY4741, gtr1∆::KanR;VMA5-GFP::HIS3
R
yRD307
BY4741, npr2∆::Kan
yRD233
BY4741, CUP5-TAP::HIS3
yRD209
Openbiosystems
R
This study
This study
Openbiosystems
Openbiosystems
R
This study
R
BY4741, tetO7-PMA1::Nat ; pCMV-TA*::URA3
yRD321
BY4741, tetO7-PMA1::Nat ; pCMV-TA*::URA3;
gtr1∆::KanR
This study
yRD265
BY4741, tetO7-PMA1::KanR; pCMV-TA*::URA3,
RTG1-GFP::HIS3
This study
yRD311
BY4741, PGK1-GFP::HIS3
Invitrogen
Supplementary Materials and Methods:
Determination of GTP/GDP ratios using MALDI-MS
Cells were harvested by directly mixing 0.5 ml of cell suspension with 1 ml
75% MeOH, which was precooled to -400C. Cells were collected by
centrifugation (1 min at 4000g, -100C) and cell pellets were flash frozen in
liquid N2 and stored at -800C. For MALDI MS, cells were reconstituted in 500
µl of a MeOH/ddH2O mixture (60:40) + 0.85% (w/V) ammonium bicarbonate
buffer, pre-cooled at -400C, and carefully shaken to avoid cell aggregation.
The samples were centrifuged (1 min at 1000g, -100C) and the cell pellet was
reconstituted in 500 µl of 60% MeOH in ddH2O (-400C) and slightly shaken.
150 µl of the cell suspension (~1,000,000 cells per mL) were spiked with 13Clabeled GTP and mixed with 50 µl of the MALDI matrix, i.e. 9-aminoacridine
(10 mg/mL dissolved in 60% MeOH in ddH2O). To avoid any changes to the
metabolism during the subsequent spotting of the samples onto the MALDI
steel target, the MALDI target was cooled (-400C) on a dry ice – ethanol bath
in a nitrogen-rich atmosphere (with a constant flow of N2 gas) to avoid
condensation.
The MALDI MS measurements were carried out on a commercial MALDITOF/TOF mass spectrometer (AB Sciex TOF/TOF 5800, AB Sciex,
Concord/ON, Canada). This instrument is equipped with a solid-state
Nd:YAG (neodymium-doped yttrium aluminum garnet) laser. The laser emits
pulses of ~4 ns duration at a wavelength of a 349-nm and at a repetition of 400
Hz. For ion generation, a fixed laser intensity of 4800 au (TOF/TOF series
explorer) was applied. Measurements were conducted in the negative-ion
reflection mode, analyzing a mass range between 70 and 900 m/z, while
MS/MS analyses were conducted using the collision-induced dissociation
(CID) cell, using air as the collision gas. During our measurements, we
avoided sweet spot effects by using a center biased rastering pattern with 900
shots (30 subspectra x 30 shots).
The intrinsic, partial fragmentation of GTP into GDP during laser desorption
was determined as described previously (Steinhoff et al., 2013). In brief, a 1:1
mixture of
13
C-labelled GTP and unlabeled GDP (12C-GDP) was measured
using MALDI-MS and relative intensities of 12C-GDP, 13C-GDP and 13C-GTP
were determined. Based on this, we calculated a rough correction factor and
confirmed that the intrinsic fragmentation of GDP is negligible under our
experimental conditions. The correction factor was then fine-tuned for each
individual experiment. Importantly, the observed correction factor was
unaffected by growth conditions of the cells prior to quenching.
Data treatment and data analysis software
Spectral data (i.e., accurate mass, signal intensity, etc.) were calculated from
the raw spectra using a MATLAB (MathWorks, Natick, MA, USA) peak
recognition software that was kindly made available by Uwe Sauer and
Nicola Zamboni (Institute of Molecular Systems Biology, ETH Zürich) (Fuhrer
et al., 2011). Prior to using the MATLAB program, the raw data were
transformed into an mzXML format using the freeware program Peak List
Conversion
Tool,
available
from
http://www.proteomecommons.org.
Chemical assignments (identities) were made on the basis of accurate mass
measurements (accuracy of ~50 ppm or better).
Supplementary References:
Binda, M., Péli-Gulli, M.-P., Bonfils, G., Panchaud, N., Urban, J., Sturgill, T.W.,
Loewith, R., and De Virgilio, C. (2009). The Vam6 GEF controls TORC1 by
activating the EGO complex. Molecular cell 35, 563-573.
Dechant, R., Binda, M., Lee, S.S., Pelet, S., Winderickx, J., and Peter, M. (2010).
Cytosolic pH is a second messenger for glucose and regulates the PKA
pathway through V-ATPase. Embo J 29, 2515-2526.
Fuhrer, T., Heer, D., Begemann, B., and Zamboni, N. (2011). High-throughput,
accurate mass metabolome profiling of cellular extracts by flow injectiontime-of-flight mass spectrometry. Anal Chem 83, 7074-7080.
Leadsham, J.E., Miller, K., Ayscough, K.R., Colombo, S., Martegani, E.,
Sudbery, P., and Gourlay, C.W. (2009). Whi2p links nutritional sensing to
actin-dependent Ras-cAMP-PKA regulation and apoptosis in yeast. J Cell Sci
122, 706-715.
Steinhoff, R.F., Krismer, J., Eyer, K., Fagerer, S.R., Ibanez, A., Pabst, M., and
Zenobi, R. (2013). Rapid estimation of the energy charge from cell lysates
using MALDI-MS: role of in-source fragmentation. Analytical biochemistry.
Wang, G., and Deschenes, R.J. (2006). Plasma membrane localization of Ras
requires class C Vps proteins and functional mitochondria in Saccharomyces
cerevisiae. Mol Cell Biol 26, 3243-3255.
Winston, F., Dollard, C., and Ricupero-Hovasse, S.L. (1995). Construction of a
set of convenient Saccharomyces cerevisiae strains that are isogenic to S288C.
Yeast 11, 53-55.


© Copyright 2026