
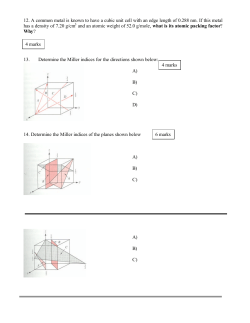
DISCLAIMER
DISCLAIMER The Suggested Answers hosted in the website do not constitute the basis for evaluation of the students’ answers in the examination. The answers are prepared by the Faculty of the Board of Studies with a view to assist the students in their education. While due care is taken in preparation of the answers, if any errors or omissions are noticed, the same may be brought to the attention of the Director of Studies. The Council of the Institute is not in anyway responsible for the correctness or otherwise of the answers published herein. © The Institute of Chartered Accountants of India PAPER – 5 : ADVANCED MANAGEMENT ACCOUNTING Question No.1 is compulsory. Answer any five out of the remaining six questions Working notes should form part of the answer No statistical or other table is to be distributed along with this paper Question 1 (a) A process industry unit manufactures three joint products: A, B and C. C has no realisable value unless it undergoes further processing after the point of separation. The cost details of C are as follows: Per Unit ` Upto point of separation Marginal cost 30 Fixed Cost After point of separation 20 Marginal cost Fixed cost 15 5 70 C can be sold at ` 37 per unit and no more. (i) Would you recommend production of C? (ii) Would your recommendation be different if A, B and C are not joint products? (5 Marks) (b) HTM Ltd., by using 12,00,000 units of a material M produces jointly 2,00,000 units of H and 4,00,000 units of T. The costs and sales details are as under: ` Direct Material M @ ` 5 per unit 60,00,000 Other variable costs 42,00,000 Total fixed costs 18,00,000 Selling price of H per unit 25 Selling price of T per unit 20 The company receives an additional order for 40,000 units of T at the rate of ` 15 per unit. If this order has been accepted, the existing price of T will not be affected. © The Institute of Chartered Accountants of India 2 FINAL EXAMINATION: MAY, 2013 However, the present price of H should be reduced evenly on the entire sale of H to market the additional units to be produced. Find the minimum average unit price to be charged on H to sustain the increased sales. (5 Marks) (c) Prescribe the steps to be followed to solve an assignment problem. (5 Marks) (d) X Ltd. wants to replace one of its old machines. Three alternative machines namely M1, M2 and M3 are under its consideration. The costs associated with these machines are as under: M1 M2 M3 ` ` ` Direct material cost p.u. 50 100 150 Direct labour cost p.u. 40 70 200 Variable overhead p.u. 10 30 50 Fixed cost p.a. 2,50,000 1,50,000 70,000 You are required to compute the cost indifference points for these alternatives. Based on these points suggest a most economical alternative machine to replace the old one when the expected level of annual production is 1,200 units. (5 Marks) Answer (a) (i) Cost incurred on Product ‘C’ upto point of separation is irrelevant for decision making as Product ‘C’ is a Joint Product. Joint Products are the result of same raw material & same process Operations. Cost incurred after point of separation will be considered for decision making as specifically incurred for Product ‘C’. After further processing Product ‘C’ will contribute `17 per unit toward ‘Joint Production Cost’. Calculation is as follows: Particulars Selling Price per unit Less: Cost after separation: Marginal Cost per unit Fixed Cost per unit Amount (`) Amount (`) 37.00 15.00 5.00 20.00 Contribution toward ‘Joint Production Cost’ Hence, further processing of Product ‘C’ is recommended. © The Institute of Chartered Accountants of India 17.00 PAPER – 5 : ADVANCED MANAGEMENT ACCOUNTING 3 (ii) If Product ‘C’ is not a joint product with same cost structure. In this case there will be negative contribution on production of Product ‘C’. The calculation is as follows: Particulars Amount (`) Selling Price per unit Less: Marginal Cost (` 30 + ` 15) Contribution 37.00 45.00 (8.00) Hence, production of Product ‘C’ will not be recommended. (b) Product H & T are joint products and produced in the ratio of 1:2 from the same direct material- M. Production of 40,000 additional units of T results in production of 20,000 units of H. Calculation of contribution under existing situation Particulars Sales Value: H – 2,00,000 units @ ` 25 per unit T – 4,00,000 units @ ` 20 per unit Less: Material- M (12,00,000 units @ ` 5 per unit) Less: Other Variable Costs Contribution Amount (`) 50,00,000 80,00,000 Let Minimum Average Selling Price per unit of H is ` X Amount (`) 1,30,00,000 60,00,000 42,00,000 28,00,000 Calculation of contribution after acceptance of additional order of ‘T’ Particulars Sales Value: H – 2,20,000 units @ ` X per unit T – 4,00,000 units @ ` 20 per unit 40,000 units @ ` 15 per unit Less: Material- M (12,00,000 units x 110%) @ ` 5 per unit Less: Other Variable Costs (` 42,00,000 x 110%) Contribution © The Institute of Chartered Accountants of India Amount (`) 2,20,000 X 80,00,000 6,00,000 Amount (`) 2,20,000 X + 86,00,000 66,00,000 46,20,000 2,20,000 X – 26,20,000 4 FINAL EXAMINATION: MAY, 2013 Minimum Average Selling Price per unit of H Contribution after additional order of T = Contribution under existing production ⇒ 2,20,000 X – 26,20,000 = 28,00,000 ⇒ 2,20,000 X ⇒ X = 54,20,000 = 54,20,000 = ` 24.64 2,20,000 Minimum Average Selling Price per unit of H is ` 24.64 (c) The assignment problem can be solved by applying the following steps: Step1: Subtract the minimum element after row operation of each row from all the elements in that row. From each column of the matrix so obtained, subtract its minimum element. The resulting matrix is the starting matrix for the following procedure. Step2: Draw the minimum number of horizontal and vertical lines that cover all the zeros. If this number of lines is n, order of the matrix, optimal assignment can be made by skipping steps 3 and 4 and proceeding with step 5. If, however, this number is less than n, go to the next step Step3: Here, we try to increase the number of zeros in the matrix. We select the smallest element out of these which do not lie on any line. Subtract this element from all such (uncovered) elements and add it to the elements which are placed at the intersections of the horizontal and vertical lines. Do not alter the elements through which only one line passes. Step4: Repeat steps 1, 2 and 3 until we get the minimum number of lines equal to n. Step5 (A): Starting with first row, examine all rows of matrix in step 2 or 4 in turn until a row containing exactly one zero is found. Surround this zero by , indication of an assignment there. Draw a vertical line through the column containing this zero. This eliminates any confusion of making any further assignments in that column. Process all the rows in this way. Step5 (B): Apply the same treatment to columns also. Starting with the first column, examine all columns until a column containing exactly one zero is found. Mark around this zero and draw a horizontal line through the row containing this marked zero. Repeat steps 5A and B, until one of the following situations arises: (i) No unmarked ( ) or uncovered (by a line) zero is left, (ii) There may be more than one unmarked zero in one column or row. In this case, put around one of the unmarked zero arbitrarily and pass 2 lines in the cells of the remaining zeros in its row and column. Repeat the process until no unmarked zero is left in the matrix. © The Institute of Chartered Accountants of India PAPER – 5 : ADVANCED MANAGEMENT ACCOUNTING 5 (d) Computation of Cost Indifference Points for three alternatives Cost Indifference Point of two machines = Machine M1 & M2 = = Machine M2 & M3 = = Machine M1 & M3 = = Difference inFixedC os t Difference inVariable C os t per unit ` 2,50,000 − ` 1,50,000 (`100 + ` 70 + ` 30) − (` 50 + ` 40 + `10) `1,00,000 = 1,000units ` 100 ` 1,50,000 − ` 70,000 (` 150 + ` 200 + ` 50) − (` 100 + ` 70 + ` 30) ` 80,000 = 400units ` 200 ` 2,50,000 − ` 70,000 (` 150 + ` 200 + ` 50) − (` 50 + ` 40 + ` 10) ` 1,80,000 = 600units ` 300 From the above computations, it is clear that at activity level below the indifference point the alternative (machine) with lower fixed cost and higher variable costs should be used. In case the activity level exceeds the indifference point, a machine with lower variable cost per unit (or higher contribution per unit) and higher fixed cost, is more profitable to operate. At the activity level equal to the indifference point both machines are on equal footing. Hence from the above we conclude as follows: Activity Level Machine Preference Less than 400 units M3 Exactly 400 units Either M2 or M3 Above 400 units but less than 1,000 units M2 Exactly 1,000 units Either M1 or M2 Above 1,000 units M1 When expected level of activity is 1,200 units i.e. more than 1,000 units, Machine M 1 should be used. © The Institute of Chartered Accountants of India 6 FINAL EXAMINATION: MAY, 2013 Question 2 (a) DEF Bank operated for years under the assumption that profitability can be increased by increasing Rupee volumes. But that has not been the case. Cost analysis has revealed the following: Activity Activity Cost (`) Activity Driver Activity Capacity Providing ATM service 1,00,000 No. of transactions 2,00,000 Computer processing 10,00,000 No. of transactions 25,00,000 Issuing Statements 8,00,000 No. of statements 5,00,000 Customer inquiries 3,60,000 Telephone minutes 6,00,000 The following annual information on three products was also made available: Units of product ATM transactions Computer transactions Number of statements Telephone minutes Checking Personal Loans Accounts 30,000 5,000 1,80,000 0 20,00,000 2,00,000 3,00,000 50,000 3,50,000 90,000 Gold Visa 10,000 20,000 3,00,000 1,50,000 1,60,000 Required: (i) Calculate rates for each activity. (ii) Using the rates computed in requirement (i), calculate the cost of each product. (8 Marks) (b) KG Ltd. is engaged in the production of two products K and G. One unit of product K requires two units of material A and four units of material B. Each unit of product G needs four units of material A, two units of material B and four units of material C. Material C is locally produced in the factory of the company by using two units of material B for each unit of C. Material A and B are purchased in the open market. Production of products K, G and C is carried out evenly throughout the year. At present the company has purchased its 3 months requirements of A and B in one purchase. That is four purchases per annum. The other particulars provided by the company are: Budgeted sales for the next year Desired stock at the end of the year Expected stock at the beginning of the year © The Institute of Chartered Accountants of India K Units 40,000 5,000 15,000 Products G Units 75,000 10,000 25,000 PAPER – 5 : ADVANCED MANAGEMENT ACCOUNTING (i) Products A 15 1,000 10% Purchase price p.u. (`) Ordering cost per order (`) Carrying cost p.a. You are required to: 7 B 25 1,000 10% Prepare a production budget and a material requirement budget for the next year. (ii) Calculate the number of material purchases to be made, if the company wants to purchase materials in optimal quantity. (8 Marks) Answer (a) Calculation showing Rates for each Activity Activity Providing ATM Service Computer Processing Issuing Statements Customer Inquiries Activity Cost [a] (`) Activity Driver 1,00,000 10,00,000 8,00,000 3,60,000 No. of Units of Activity Driver [b] No. of ATM Transactions No. of Computer Transactions No. of Statements Telephone Minutes 2,00,000 25,00,000 5,00,000 6,00,000 Activity Rate [a] / [b] (`) 0.50 0.40 1.60 0.60 Calculation showing Cost of each Product Activity Providing ATM Service Computer Processing Checking Accounts (`) 90,000 (1,80,000 tr. x ` 0.50) Personal Loans (`) − Gold Visa (`) 10,000 (20,000 tr. x ` 0.50) 8,00,000 (20,00,000 tr. x ` 0.40) 80,000 (2,00,000 tr. x ` 0.40) 1,20,000 (3,00,000 tr. x ` 0.40) Issuing Statements 4,80,000 (3,00,000 tr. x ` 1.60) 80,000 (50,000 tr. x ` 1.60) 2,40,000 (1,50,000 tr. x ` 1.60) Customer Inquiries 2,10,000 (3,50,000 tr. x ` 0.60) 54,000 (90,000 tr. x ` 0.60) 96,000 (1,60,000 tr. x ` 0.60) ` 15,80,000 30,000 52.67 ` 2,14,000 5,000 42.80 ` 4,66,000 10,000 46.60 Total Cost [a] Units of Product [b] Cost of each Product [a]/[b] © The Institute of Chartered Accountants of India 8 FINAL EXAMINATION: MAY, 2013 (b) Production Budget for Product K and G Particulars Desired Inventory at the end of the year Sales Forecast Total Requirements Less: Expected Inventory at beginning of the year Budgeted Production ‘K’ Units 5,000 40,000 45,000 15,000 30,000 ‘G’ Units 10,000 75,000 85,000 25,000 60,000 Budgeted Requirements of Material ‘A’, ‘B’ and ‘C’ Particulars For Product ‘K’: Production 30,000 units ‘A’: 30,000 × 2 per unit ‘B’: 30,000 × 4 per unit For Product ‘G’: Production 60,000 units ‘A’: 60,000 × 4 per unit ‘B’: 60,000 × 2 per unit ‘C’: 60,000 × 4 per unit For Material ‘C’: Production 2,40,000 units ‘B’: 2,40,000 × 2 per unit Total Requirements ‘A’ Units ‘B’ Units ‘C’ Units 60,000 − − 1,20,000 − − 2,40,000 − − − 1,20,000 − − − 2,40,000 − 3,00,000 4,80,000 7,20,000 − 2,40,000 Optimum Order Quantity: ‘A’ EOQ = ‘B’ 2 × 3,00,000 × 1,000 15 × 10% = 20,000 units 2 × 7,20,000 × 1,000 25 × 10% EOQ = = 24,000 units No. of Purchases: ‘A’ = TotalRe quirements OptimumOrderQuantity = 3,00,000 20,000 = 15 Purchases © The Institute of Chartered Accountants of India ‘B’ = TotalRe quirements OptimumOrderQuantity = 7,20,000 24,000 = 30 Purchases PAPER – 5 : ADVANCED MANAGEMENT ACCOUNTING 9 Question 3 (a) A company manufactures two products A and B, involving three departments Machining, Fabrication and Assembly. The process time, profit/unit and total capacity of each department is given in the following table : A B Capacity Machining (hours) 1 2 720 Fabrication (hours) 5 4 1,800 Assembly (hours) 3 1 900 Profit (`) 80 100 Set up Linear Programming problem to maximize profits. What will be the product-mix at maximum profit level? What will be the profit? (8 Marks) (b) The following are the information regarding overheads of a company: (a) Overheads cost variance = ` 2,800 (A) (b) Overheads volume variance = ` 2,000 (A) (c) Budgeted overheads = ` 12,000 (d) Actual overhead recovery rate = ` 8 per hour (e) Budgeted hours for the period = 2,400 hours You are required to compute the following: (i) Overheads expenditure variance. (ii) Actual incurred overheads. (iii) Actual hours for actual production. (iv) Overheads capacity variance. (v) Overheads efficiency variance. (vi) Standard hours for actual production. (8 Marks) Answer (a) Let x and y denote the number of units produced for the product A & B respectively. Maximize (Profit) Subject to Z = 80x + 100y x + 2y ≤ 720 (Machining Time) 5x + 4y ≤ 1,800 (Fabrication Time) 3x + y ≤ 900 (Assembly Time) x ≥ 0, y ≥ 0 © The Institute of Chartered Accountants of India 10 FINAL EXAMINATION: MAY, 2013 SIMPLEX METHOD By introducing slack variables s1 ≥ 0, s2 ≥ 0 and s3 ≥ 0 the linear programming problem in standard form becomes – Maximize Z = 80x + 100y + 0s1 + 0s2 + 0s3 Subject to x + 2y + s1 = 720 (Machining Time) 5x + 4y + s2 = 1,800 (Fabrication Time) 3x + y + s3 = 900 (Assembly Time) x, y, s1, s2, s3 ≥ 0 We shall prepare the initial simplex tableau as follows: SIMPLEX TABLEAU-I Cj 80 100 0 0 0 CB Basic Variable (B) Value of Basic Variables b(=XB) x y s1 s2 s3 Minimum Ratio 0 s1 720 1 2 1 0 0 360 0 s2 1,800 5 4 0 1 0 450 0 s3 900 3 1 0 0 1 900 Bi X j 0 0 0 0 0 Cj – Zj 80 100 0 0 0 80 x 100 y 0 s1 0 s2 0 s3 Minimum Ratio 1/2 3 5/2 50 1 0 0 100 1/2 -2 -1/2 50 0 1 0 0 0 0 1 0 720 120 216 30 0 -50 0 0 Zj = ∑C SIMPLEX TABLEAU-II CB Cj Basic Variable (B) 100 0 0 y s2 s3 Value of Basic Variables b(=XB) 360 360 540 Zj = ∑C Bi X j Cj – Zj © The Institute of Chartered Accountants of India PAPER – 5 : ADVANCED MANAGEMENT ACCOUNTING 11 SIMPLEX TABLEAU-III CB Cj Basic Variable (B) 100 80 0 y x s3 Value of Basic Variables b(=XB) 300 120 240 Zj = ∑C Bi X j Cj – Zj 80 x 100 y 0 s1 0 s2 0 s3 0 1 0 80 1 0 0 100 5/6 -2/3 7/6 30 -1/6 1/3 -5/6 10 0 0 1 0 0 0 -30 -10 0 Since all numbers in the Cj – Zj row are either negative or zero, the optimum solution to the given problem has been obtained and is given by x = 120 units and 300 units Maximum Profit = 80 x 120 + 100 x 300 Hence, the optimum solution is to produce 120 units of product A and 300 units of product B to get maximum profit of ` 39,600 The above solution can also be done through GRAPHICAL METHOD. Solution by GRAPHICAL METHOD Let x and y denote the number of units produced for the product A & B respectively. Maximize (Profit) Z = 80x + 100y Subject to x + 2y ≤ 720 (Machining Time) 5x + 4y ≤ 1,800 (Fabrication Time) 3x + y ≤ 900 (Assembly Time) x ≥ 0, y ≥ 0 Points to draw x + 2y = 720 If x = 0 2y = 720 y = 720/2 = 360 If y = 0 x = 720 (x, y) − (0, 360); (720, 0) © The Institute of Chartered Accountants of India 12 FINAL EXAMINATION: MAY, 2013 Points to draw 5x + 4y = 1,800 If x = 0 4y = 1,800 y = 450 If y = 0 5x = 1,800 x = 360 (x, y) − (0, 450); (360, 0) Points to draw 3x + y = 900 If x = 0 y = 900 If y = 0 3x = 900 x = 300 (x, y) − (0, 900); (300, 0) Intersection Point (R) 5x + 4y = 1,800 (Equation1) x + 2y = 720 (Equation2) Or 5x + 4y = 1,800 5x + 10y = 3,600 [(Equation 2) x 5] − − − - 6y = -1,800 y = 300 On putting value of y in any one of the above equation, the value of x = 120 Point R– (120, 300) Intersection Point (Q) 5x + 4y = 1,800 (Equation1) 3x + y = 900 (Equation2) Or © The Institute of Chartered Accountants of India PAPER – 5 : ADVANCED MANAGEMENT ACCOUNTING 5x + 4y = 1,800 12x + 4y = 3,600 [(Equation 2) x 4] − − − -7x = -1,800 x = 257 On putting value of x in any one of the above equation, the value of y = 129 Point Q – (257, 129) © The Institute of Chartered Accountants of India 13 14 FINAL EXAMINATION: MAY, 2013 The shaded portion in the diagram represents the feasible region. Point Co-Ordinates of the corner Value of the objective points of the feasible region function (value of x and y) Z = 80x + 100y (300,0) ` 24,000 (257,129) ` 33,460 (120,300) ` 39,600 (0,360) ` 36,000 (0,0) ` 0 P Q R S T Since at Point R company makes maximum profit hence product mix at Point R i.e. 120 units of Product A and 300 units of product B should be produced. (b) Overheads Cost Variance = ` 2,800 (A) Overheads Volume Variance = ` 2,000 (A) Budgeted Overheads = ` 12,000 Actual Overhead Recovery Rate = ` 8 per hour Budgeted Hours for the period = 2,400 hours (i) Overheads Expenditure Variance = Overheads Cost Variance (-) Overheads Volume Variance = ` 2,800 (A) - ` 2,000 (A) = ` 800 (A) (ii) Overheads Expenditure Variance = Budgeted Overheads (-) Actual Overheads ⇒ ` 800(A) Therefore, Actual Overheads = ` 12,000 (-) Actual Overheads = ` 12,800 (iii) Actual hours for actual production = Actual Overheads Actual Overhead Recovery Rate Per Hour = ` 12,800 `8 = 1,600 hours For (iv), (v) & (vi) refer Working Note © The Institute of Chartered Accountants of India PAPER – 5 : ADVANCED MANAGEMENT ACCOUNTING (iv) Overheads Capacity Variance = 15 Budgeted Overheads for Actual Hours (-) Budgeted Overheads = ` 5 x 1,600 hrs. - ` 12,000 = ` 8,000 - ` 12,000 = ` 4,000 (A) (v) Overheads Efficiency Variance = Absorbed Overheads (-) Budgeted Overheads for Actual Hour = ` 10,000 - ` 5 x 1,600 hours = ` 2,000 (F) (vi) Standard hours for actual production = AbsorbedOverheads Standard Overhead Rate per hour = ` 10,000 = 2,000 `5 Working Notes: Overhead Cost Variance = Absorbed Overheads (-) Actual Overheads ⇒ ` 2,800 (A) = Absorbed Overheads (-) `12,800 Therefore, Absorbed Overheads = `10,000 Standard Rate per hour = ` 12,000 BudgetedOverheads = =`5 2,400hours Budgeted Hours Question 4 (a) XYZ Company has three plants and four warehouses. The supply and demand in units and the corresponding transportation costs are given. The table below shows the details taken from the solution procedure of the transportation problem : WAREHOURSES I II A Plants Demand 5 10 8 B 20 6 C 5 4 25 III 10 10 © The Institute of Chartered Accountants of India 2 10 IV 4 7 5 15 5 5 5 Supply 5 10 2 25 7 20 16 FINAL EXAMINATION: MAY, 2013 Answer the following questions. Give brief reasons: (i) Is this solution feasible? (ii) Is this solution degenerate? (iii) Is this solution optimum? (8 Marks) (b) Gupta Ltd. produces 4 products P, Q, R and S by using three different machines X, Y and Z. Each machine capacity is limited to 6,000 hours per month. The details given below are for July, 2013: Selling price p.u. (`) Variable cost p.u. (`) Machine hours required p.u. Machine X Machine Y Machine Z Expected Demand (units) P 10,000 7,000 Q 8,000 5,600 R 6,000 4,000 S 4,000 2,800 20 20 20 200 12 18 6 200 4 6 2 200 2 3 1 200 Required: (i) Find out the bottleneck activity. (ii) Allocate the machine hours on the basis of the bottleneck. (iii) Ascertain the profit expected in the month if the monthly fixed cost amounts to ` 9,50,000. (iv) Calculate the unused spare hours of each machine. (8 Marks) Answer (a) (i) Is this solution feasible? A necessary and sufficient condition for the existence of a feasible solution to the transportation problem is that m n i =1 j =1 ∑ ai = ∑ b j Where ai = quantity of product available at origin i. bj = quantity of product available at origin j. In other words, the total capacity (or supply) must equal total requirement (or demand) © The Institute of Chartered Accountants of India PAPER – 5 : ADVANCED MANAGEMENT ACCOUNTING 17 As the supply 55 units (10+25+20) equals demand 55 units (25+10+15+5), a feasible solution to the problem exists. (ii) Is this solution degenerate? When the number of positive allocations at any stage of the feasible solution is less than the required number (rows + columns -1), the solution is said to be degenerate solution. In given solution total allocated cells are 6 which are equal to 4+3-1 (rows + columns -1). Therefore, the initial basic solution is not a degenerate solution. (iii) Is this solution optimum? Test of Optimality: (ui +vj) matrix for allocated cells ui 4 6 vj -1 2 4 2 5 4 2 5 0 0 (ui +vj) matrix for unallocated cells 3 1 4 ui -1 7 4 2 5 -1 2 0 vj 2 0 0 ∆ij= Cij— (ui +vj) matrix 2 9 4 6 0 7 Since, all cells values in ∆ij= Cij— (ui +vj) matrix are non- negative, hence the solution provided by XYZ Company is optimum. It may be noted that zero opportunity cost in cell (B, III) indicates a case of alternative optimum solution. © The Institute of Chartered Accountants of India 18 FINAL EXAMINATION: MAY, 2013 (b) (i) Machine Time Required for Products (Hours) Q R P X 4,000 (200 units x 20 hours) 4,000 (200 units x 20 hours) 4,000 (200 units x 20 hours) Y Z 2,400 (200 units x 12 hours) 3,600 (200 units x 18 hours) 1,200 (200 units x 6 hours) 800 (200 units x 4 hours) 1,200 (200 units x 6 hours) 400 (200 units x 2 hours) S 400 (200 units x 2 hours) 600 (200 units x 3 hours) 200 (200 units x 1 hours) Total Time Time Available Machine Utilization 7,600 6,000 126.67% 9,400 6,000 156.67% 5,800 6,000 96.67% Since Machine Y has the highest machine utilization it represents the bottleneck activity. Hence Product Ranking & Resource Allocation should be based on Contribution/Machine Hour of Machine Y. (ii) Particulars Selling Price per unit (`) Variable Cost per unit (`) Contribution per unit (`) Time Required in Machine ‘Y’ (hrs.) Contribution per Machine Hour (`) Rank Allocation of Machine ‘Y’ time (hrs.) Production (units) Allocation of Machine ‘X’ time (hrs.) Allocation of Machine ‘Z’ time (hrs.) P Allocation of Resources Q R S 10,000 7,000 3,000 20 8,000 5,600 2,400 18 6,000 4,000 2,000 6 4,000 2,800 1,200 3 150 133.33 333.33 400 III 4,000 (200 units x 20 hrs.) 200 4,000 (200 units x 20 hrs.) 4,000 (200 units x 20 hrs.) © The Institute of Chartered Accountants of India IV II I 1,200 600 (200 (200 units x 6 units x hrs.) 3 hrs.) 11.11 200 200 (200 hrs. / 18 hrs.) 133.32 800 400 (11.11 (200 (200 units x 12 units x 4 units x hrs.) hrs.) 2 hrs.) 66.66 400 200 (11.11unit (200 (200 s x 6 hrs.) units x 2 units x hrs.) 1 hrs.) 200 (Balance) Machine Utilization Spare capacity 6,000 5,333.32 666.68 4,666.66 1,333.34 PAPER – 5 : ADVANCED MANAGEMENT ACCOUNTING 19 (iii) Calculation of Expected Profit Particulars Amount (`) 6,00,000 26,664 4,00,000 2,40,000 12,66,664 9,50,000 3,16,664 P (200 units x ` 3,000) Q (11.11 units x ` 2,400) R (200 units x ` 2,000) S (200 units x ` 1,200) Total Contribution Less: Fixed Cost Expected Profit (iv) Unused Spare Hours Machine ‘X’ Particulars Amount (`) 6,000.00 hrs. 5,333.32 hrs. 666.68 hrs. Machine Hours Available Less: Machine Hours Utilized Spare Hours Machine ’Z’ Particulars Amount (`) 6,000.00 hrs. 4,666.66 hrs. 1,333.34 hrs. Machine Hours Available Less: Machine Hours Utilized Spare Hours While calculating Production (units) of Product ‘Q’ on the basis of allocated hours, round figure (complete units) can also be considered and rest of the solution will be changed accordingly. Question 5 (a) Better and Best Ltd. manufacture only one product. Production is regular throughout the year and the capacity of the factory is 1,50,000 units per annum. The summarized Profit and Loss Account for the year ended 31st December is being reviewed by the Board of Directors. ` Sales @ ` 10 per unit Cost of sales: Direct materials Direct labour © The Institute of Chartered Accountants of India 10,00,000 2,50,000 1,50,000 20 FINAL EXAMINATION: MAY, 2013 Production overheads: ` Variable 30,000 Fixed 2,30,000 Administrative overheads: Fixed 1,00,000 Selling and distribution overhead: Variable 50,000 Fixed 1,50,000 (i) The Production Director proposed to reduce selling price to ` 9 in order to utilize full capacity. (ii) The Sales Director proposed to increase selling price by 20 percent. By spending ` 2,25,000 on advertisement, sales will be increased to 1,20,000 units per annum. (iii) The Personnel Director pleaded for a change in the method of wage payment. For the present piece rate of `·1.50 per unit, a bonus scheme (for each 2% increase in production over the target, there would be an increase of 1% in the basic wage of each employee) will be implemented. A target of 2,000 units per week for the company will be set for 50 week year. Selling price increase by 10%. With an additional advertisement cost of ` 1,60,000, 20% increase in present sales will be achieved. (iv) The Chairman felt that the packaging of the product required improvement. He wanted to know the sales required to earn a target profit of 10% on turnover with the introduction of an improved packing at an additional cost of 20 paise per unit (no change in selling price). You are required to evaluate individually the proposals of each of the board member and give your recommendation. (12 Marks) (b) What do you mean by DPP? What are its benefits? (4 Marks) Answer (a) Workings: Full Capacity: ` 1,50,000 units p.a. Current Capacity: ` 1,00,000 units p.a. which is equals to 66.67% of full capacity. © The Institute of Chartered Accountants of India PAPER – 5 : ADVANCED MANAGEMENT ACCOUNTING 21 Existing Situation Particulars Sales (1,00,000 units x ` 10) Less: Variable Cost Direct Material Direct Labour Production Overheads Selling and Distribution Overhead Contribution Less: Fixed Cost Production Overheads Administrative Overheads Selling and Distribution Overhead Profit Amount (`) Per Unit Rs(`) 10,00,000 10.00 2,50,000 1,50,000 30,000 50,000 5,20,000 2.50 1.50 0.30 0.50 5.20 2,30,000 1,00,000 1,50,000 40,000 2.30 1.00 1.50 0.40 Variable Cost ` 4.80 p.u. Proposal (i) - Reduce Selling Price to ` 9, Capacity Utilization 100% Particulars Sales (1,50,000 units x ` 9) Less: Variable Cost (1,50,000 units x ` 4.80) Contribution Less: Fixed Cost Profit Amount (`) 13,50,000 7,20,000 6,30,000 4,80,000 1,50,000 Proposal (ii) - Increase in Selling Price by 20%, Additional Advertising Cost ` 2,25,000, Sales Volume 1,20,000 units per annum. Particulars Sales (1,20,000 units x ` 12) Less: Variable Cost (1,20,000 units x ` 4.80) Contribution Less: Fixed Cost Less: Advertising Cost Profit © The Institute of Chartered Accountants of India Amount (`) 14,40,000 5,76,000 8,64,000 4,80,000 2,25,000 1,59,000 22 FINAL EXAMINATION: MAY, 2013 Proposal (iii) - Increase in Selling Price by 10%, Additional Advertising Cost ` 1,60,000, 20% Increase in Present Sales and Bonus Scheme (for each 2% increase in production over the target, there would be an increase of 1% in the basic wages of each employee) Particulars Sales (1,20,000 units x ` 11) Less: Variable Cost [1,20,000 units x `(2.50 + 1.65* + 0.30 + 0.50)] Contribution Less: Fixed Cost Less: Advertising Cost Profit Amount (`) 13,20,000 5,94,000 7,26,000 4,80,000 1,60,000 86,000 Workings(*): Present Labour Rate = ` 1.50 per unit Target Production Volume = 2,000 units x 50 weeks = 1,00,000 units Production above the target volume = 1,20,000 units – 1,00,000 units = 20,000 units or 20% of Target Production Volume Bonus (for each 2% increase in production over the target, there would be an increase of 1% 1% in the basic wages of each employee) = x20% = 10% increase in basic wages. 2% It means wages would be ` 1.65 (` 1.50 x 1.10) per unit. Proposal (iv) -Target Profit 10% on Turnover, Additional Packing Cost 0.20 paise per unit, No Change in Selling Price, Sales Volume =? Let Sales Volumes is K units. Particulars Sales (K units x ` 10) Less: Variable Cost [K units x `(4.80 + 0.20) Contribution Less: Fixed Cost Profit © The Institute of Chartered Accountants of India Amount (`) 10K 5K 5K 4,80,000 5K-4,80,000 PAPER – 5 : ADVANCED MANAGEMENT ACCOUNTING 23 Profit equals to 10% of Turnover. It means⇒ 5K – 4,80,000 = 10% of 10K 4K = 4,80,000 ⇒ K = 1,20,000 units ⇒ Turnover = 1,20,000 units x ` 10 = ` 12,00,000 Profit = 10% of ` 12,00,000 = ` 1,20,000 Particulars Existing Situation Proposal (i) Proposal (ii) Proposal (iii) Proposal (iv) Capacity Utilization 66.67% 100.00% 80.00% 80.00% 80.00% Profit (`) 40,000 1,50,000 1,59,000 86,000 1,20,000 Company should accept Proposal (ii). (b) Direct Product Profitability (DPP) is ‘Used primarily within the retail sector, and involves the attribution of both the purchase price and other indirect costs such as distribution, warehousing, retailing to each product line. Thus a net profit, as opposed to a gross profit, can be identified for each product. The cost attribution process utilises a variety of measures such as warehousing space, transport time to reflect the resource consumption of individual products.’ Benefits of Direct Product Profitability: (i) Better Cost Analysis - Cost per product is analysed to know the profitability of a particular product. (ii) Better Pricing Decision- It helps in price determination as desired margin can be added with the actual cost. (iii) Better Management of Store and Warehouse Space- Space Cost and Benefit from a product can be analysed and it helps in management of store and warehouse in profitable way. (iv) The Rationalisation of Product Ranges etc. Question 6 (a) The Noida Nirman Authority intends to install a road traffic regulating signal in a heavy traffic prone area. The total installation work has been broken down into six © The Institute of Chartered Accountants of India 24 FINAL EXAMINATION: MAY, 2013 activities. The normal duration, crash duration and crashing cost of the activities are expected as given in the following table : . Activity 1-2 1-3 1-4 2-4 3-4 4-5 Normal Duration (Days) 9 8 15 5 10 2 Crash Duration (Days) 6 5 10 3 6 1 Crashing Cost per day (`) 30,000 40,000 45,000 15,000 20,000 60,000 You are required to : (i) draw the network and find the normal and minimum duration of the work. (ii) compute the additional cost involved if the authority wants to complete the work in the shortest duration. (7 Marks) (b) Bring out the main applications of Learning Curve. (4 Marks) (c) (5 Marks) State the advantages available in inter-firm comparison. Answer (a) (i) The critical path is 1 – 3 – 4 – 5. The normal length of the project is 20 days and minimum project length is 12 days. © The Institute of Chartered Accountants of India PAPER – 5 : ADVANCED MANAGEMENT ACCOUNTING 25 (ii) Statement showing Additional Crashing Cost: Normal Project Length Days 20 19 18 17 16 15 Job Crashed Crashing Cost 3-4 3-4 3-4 4-5 3-4,1-4 14 1-3, 1-4, 2-4 13 1-3, 1-4, 2-4 12 1-3, 1-4, 1-2 ` 20,000 x1 Day = ` 20,000 ` 20,000 x 2 Days = ` 40,000 ` 20,000 x 3 Days = ` 60,000 ` 20,000 x 3 Days +1 Day x ` 60,000 =` 1,20,000 ` 20,000 x 4 Days + ` 60,000 x1 Day + ` 45,000 x 1 Day = `1,85,000 ` 1,85,000 +1 Day x ` 40,000 +1 Day x ` 45,000+ 1 Day x ` 15,000 = ` 2,85,000 ` 2,85,000 +1 Day x ` 40,000 +1 Day x ` 45,000+ 1 Day x ` 15,000 = ` 3,85,000 ` 3,85,000+1 Day x ` 40,000 +1 Day x ` 45,000 +1 Day x ` 30,000 = ` 5,00,000 Total Additional Cost (At shortest duration) ` 5,00,000/- (b) Knowledge of learning curve can be useful both in planning and control. Standard cost for new operations should be revised frequently to reflect the anticipated learning pattern. The main applications are summarised below: Helps to analyse CVP relationship during familiarisation phase: Learning curve is useful to analyse cost-volume-profit relationship during familiarisation phase of product or process and thus it is very useful for cost estimates. Learning curve can be used as a tool for forecasting. Helps in budgeting and profit planning: Budget manager should select those costs which reflect learning effect and then he should be able to incorporate this effect in process of developing budgets or in the exercises relating to project planning. Helps in pricing: The use of cost data adjusted for learning effect helps in development of advantageous pricing policy. Design makers: It helps design engineers in making decisions based upon expected (predictable from past experience) rates of improvement. Helps in negotiations: It is very useful to Government in negotiations about the contracts. © The Institute of Chartered Accountants of India 26 FINAL EXAMINATION: MAY, 2013 Helps in setting standards: The learning curve is quite helpful in setting standards in learning phase. (c) Advantages of Inter-firm comparison: The main advantages of inter-firm comparison are: Such a comparison gives an overall view of the industry as a whole to its members– the present position of the industry, progress made during the past and the future of the industry. It helps a concern in knowing its strengths or weaknesses in relation to others so that remedial measures may be taken. It ensures an unbiased specialized reporting on particular problems of the concern. It develops cost consciousness among members of the industry. It helps Government in effecting price regulation. It helps to improve the quality of products manufactured and to reduce the cost of production. It is thus advantageous to the industry as well as to the society. Question 7 Answer any four of the following questions : (a) What are the focuses of Theory of Constraints ? How it differs with regard to cost (4 Marks) behaviour ? (b) Brief the reasons for using simulation technique to solve problems. (4 Marks) (c) List out the qualities required for a good pricing policy. (4 Marks) (d) Under what circumstance PERT is more relevant? How? (4 Marks) (e) Enumerate the expected disadvantages in taking divisions as profit centres. (4 Marks) Answer (a) The theory of constraint focuses its attention on constraints and bottlenecks within the organisation which hinder speedy production. The main concept is to maximize the rate of manufacturing output i.e. the throughput of the organisation. This requires examining the bottlenecks and constraints which are defined as: A bottleneck is an activity within the organisation where the demand for that resource is more than its capacity to supply. A constraint is a situational factor which makes the achievement of objectives/throughput more difficult than it would otherwise be. Constraints may take several forms such as lack of skilled employees, lack of customer orders or the need to achieve a high level of quality product output. © The Institute of Chartered Accountants of India PAPER – 5 : ADVANCED MANAGEMENT ACCOUNTING 27 Using above definition, therefore, a bottleneck is always a constraint but a constraints need not be a bottleneck. The theory of constraints assumes few costs are variable –generally materials, purchased parts, piecework labour, and energy to run machines. It assumes that most direct labour and overheads are fixed. This is consistent with the idea that the shorter the time period, the more costs are fixed, and the idea that the theory of constraints focuses on the short run. (b) Reasons for using simulation technique to solve problems: It is not possible to develop a mathematical model and solutions without some basic assumptions. It may be too costly to actually observe a system. Sufficient time may not be available to allow the system to operate for a very long time. Actual operation and observation of a real system may be too disruptive. (c) Quality required for a good pricing policy: The pricing policy plays an important role in a business because the long run survival of a business depends upon the firm’s ability to increase its sales and device the maximum profit from the existing and new capital investment. Although cost is an important aspect of pricing, consumer demand and competitive environment are frequently far more significant in pricing decisions. The pricing policy structure should: provide an incentive to producer for adopting improved technology and maximising production; encourage optimum utilisation of resources; work towards better balance between demand and supply; promote exports; and avoid adverse effects on the rest of the economy. (d) PERT (Program Evaluation and Review Technique) is more relevant for handling such projects which have a great deal of uncertainty associated with the activity durations. To take these uncertainty into account, three kinds of times estimates are generally obtained. These are: The Optimistic Times Estimate: This is the estimate of the shortest possible time in which an activity can be completed under ideal conditions. For this estimate, no provision for delays or setbacks are made. We shall denote this estimate by t o. © The Institute of Chartered Accountants of India 28 FINAL EXAMINATION: MAY, 2013 The Pessimistic Time Estimate: This is the maximum possible time which an activity could take to accomplish the job. If everything went wrong and abnormal situations prevailed, this would be the time estimate. It is denoted by t p. The Most Likely Time Estimate: This is a time estimate of an activity which lies between the optimistic and the pessimistic time estimates. It assumes that things go in a normal way with few setbacks. It is represents by tm. (e) The expected disadvantages of taking divisions as profit centres are as follows: Divisions may compete with each other and may take decisions to increase profits at the expense of other divisions thereby overemphasizing short term results. It may adversely affect co-operation between the divisions and lead to lack of harmony in achieving organizational goals of the company. Thus it is hard to achieve the objective of goal congruence. It may lead to reduction in the company’s overall total profits. The cost of activities, which are common to all divisions, may be greater for decentralized structure than centralized structure. It may thus result in duplication of staff activities. Top management loses control by delegating decision making to divisional managers. There are risks of mistakes committed by the divisional managers, which the top management, may avoid. Series of control reports prepared for several departments may not be effective from the point of view of top management. It may under utilize corporate competence. It leads to complications associated with transfer pricing problems. It becomes difficult to identity and defines precisely suitable profit centres. It confuses division’s results with manager’s performance. © The Institute of Chartered Accountants of India


© Copyright 2026