
Biotechnology Letters Volume 27, Number 17
Biotechnology Letters
Volume 27, Number 17
Laboratory Scale Bioremediation of Acid Mine Water Drainage from a Disused Tin
Mine
Lawrence Darkwah, Neil A. Rowson, Christopher J. Hewitt
DOI: 10.1007/s10529-005-3201-z
(1251 - 1257)
Inhibition of Platelet Aggregation of a Mutant Proinsulin Chimera Engineered by
Introduction of a Native Lys-Gly-Asp-containing Sequence
Jian Jing and Shan Lu
DOI: 10.1007/s10529-005-3202-y
(1259 - 1265)
Construction of an Effective Protein Expression System Using the tpl Promoter in
Escherichia coli
Takashi Koyanagi, Takane Katayama, Ai Hirao, Hideyuki Suzuki, Hidehiko Kumagai
DOI: 10.1007/s10529-005-0216-4
(1267 - 1271)
Purification and Properties of an N-acetylglucosaminidase from Streptomyces
(1273 - 1276)
cerradoensis
Iderval da Silva Junior Sobrinho, Luiz Artur Mendes Bataus, Valéria Ribeiro Maitan, Cirano José Ulhoa
DOI: 10.1007/s10529-005-0218-2
A Modified PCR System for Amplifying β-ketoacyl-ACP Synthase Gene Fragments
with DNA from Streptomyces luteogriseus
Feng-Ming Yu, Xin Jiang, Jin-Chuan Wu, Ying-Jin Yuan
DOI: 10.1007/s10529-005-3219-2
(1277 - 1282)
Molecular Cloning and Tissue Distribution of SF-1-related Orphan Receptors During
Sexual Maturation in Female Goldfish
Cheol Young Choi and Hamid R. Habibi
DOI: 10.1007/s10529-005-0220-8
(1283 - 1290)
Enhancement of Isoflavone Synthase Activity by Co-expression of P450 Reductase (1291 - 1294)
from Rice
Dae Hwan Kim, Bong Gyu Kim, Hyo Jung Lee, Yoongho Lim, Hor Gil Hur, Joong-Hoon Ahn
DOI: 10.1007/s10529-005-0221-7
Structural Characterization of β-glucans of Agaricus brasiliensis in Different Stages (1295 - 1299)
of Fruiting Body Maturity and their Use in Nutraceutical Products
Carla Maísa Camelini, Marcelo Maraschin, Margarida Matos Mendonça, Cezar Zucco, Antonio Gilberto
Ferreira, Leila Aley Tavares
DOI: 10.1007/s10529-005-0222-6
Taxane Production in Suspension Culture of Taxus × Media var. Hicksii Carried Out
in Flasks and Bioreactor
Katarzyna Syklowska-Baranek and Miroslawa Furmanowa
DOI: 10.1007/s10529-005-0223-5
(1301 - 1304)
Regio- and Stereo-selective Hydroxylation of Abietic Acid Derivatives by Mucor
circinelloides and Mortierella isabellina
Koichi Mitsukura, Takeshi Imoto, Hirokazu Nagaoka, Toyokazu Yoshida, Toru Nagasawa
DOI: 10.1007/s10529-005-3224-5
(1305 - 1310)
Increased Conformational and Thermal Stability Properties for Phenylalanine
Dehydrogenase by Chemical Glycosidation with End-group Activated Dextran
Reynaldo Villalonga, Shinjiro Tachibana, Yunel Pérez, Yasuhisa Asano
DOI: 10.1007/s10529-005-3225-4
(1311 - 1317)
Production of Fungal Biomass Immobilized Loofa Sponge (FBILS)-discs for the
Removal of Heavy Metal Ions and Chlorinated Compounds from Aqueous Solution
M. Iqbal, A. Saeed, R.G.J. Edyvean, B. O’Sullivan, P. Styring
DOI: 10.1007/s10529-005-0477-y
(1319 - 1323)
A Metal Ion as a Cofactor Attenuates Substrate Inhibition in the Enzymatic
Production of a High Concentration of
Kazuaki Yoshimune, Ai Hirayama, Mitsuaki Moriguchi
DOI: 10.1007/s10529-005-0480-3
(1325 - 1328)
Characterization of an Extracellular Serine Protease Gene from the Nematophagous (1329 - 1334)
Fungus Lecanicillium psalliotae
Jinkui Yang, Xiaowei Huang, Baoyu Tian, Hui Sun, Junxin Duan, Wenping Wu, Keqin Zhang
DOI: 10.1007/s10529-005-0482-1
Author’s Quick Check Checklist for Preparing Manuscripts for Submission
DOI: 10.1007/s10529-005-1074-9
(1335 - 1335)
Ó Springer 2005
Biotechnology Letters (2005) 27: 1251–1257
DOI 10.1007/s10529-005-3201-z
Laboratory scale bioremediation of acid mine water drainage
from a disused tin mine
Lawrence Darkwah, Neil A. Rowson & Christopher J. Hewitt*
Centre for Formulation Engineering, Biochemical Engineering, School of Engineering (Chemical Engineering),
The University of Birmingham, Edgbaston, B15 2TT, UK
*Author for correspondence (Fax: +44-121-414-5324; E-mail: [email protected].)
Received 6 May 2005; Revisions requested 2 June 2005; Revisions received 13 June 2005; Accepted 14 June 2005
Key words: acid mine drainage, Acidithiobacillus ferrooxidans, bioremediation, laboratory scale, microbial
catalysis
Abstract
Real acidic mine-water drainage was seeded with Acidithiobacillus ferrooxidans to catalyse the removal of
iron contained therein. The addition of At. ferrooxidans increased metal precipitation kinetics and
decreased the water iron content by 70%. Supplementing non-sterile mine water with a bacterial growth
medium accelerated metal removal by indigenous micro-organisms both at the 500 ml shake-flask and 5 l
bioreactor scale.
Introduction
Both alkaline and acid mine water drainage
(ADM) is a growing world-wide problem for
both working and abandoned mines as well as
colliery spoil heaps due to the highly toxic products generated in both underground and surface
mining (Johnson 2003). In particular, acidic
drainages originate from the exposure of sulphidic mineral surfaces to O2, which results in the
formation of soluble sulphates. On contact with
water, these minerals (mostly with a high ferrous
iron content) become oxidised, usually with
microbial catalytic enhancement, producing ferric
ions and H2. These ions when leached into
streams cause the water to become more acidic,
normally reaching pH values <3. Additionally,
other metal ions, such as Cd, Cu, Mn, Al and
As, also leach into the AMD, at final concentrations far above permissible legal levels.
Wheal Jane, an important cassiterite (the main
mineral ore for tin) mine within the Carnon Valley
(Cornwall, UK) provided the AMD for use in this
study. The workings that make up this disused
mine (work finished finally in c. 1991) extend to a
depth of 450 m below ground being partially flooded and very wet. This is probably due to water
seeping from interconnected workings that historically produced pyrite and arsenopyrite. During the
mines working life such water, partially treated,
was actively pumped and discharged into the River Carnon (UK) but, when government funding
was withdrawn, all treatment ceased so the rising
mine water, with a pH of 2.8 and a high metal
content, was passively discharged into the River
Carnon (UK). Further attempts to treat the water
with CaCO3 (lime) before it was pumped into the
existing Wheal Jane tailings dam were made but,
when this stopped for technical reasons in January
1992, 50 million litres of acidic metal laden water
were accidentally released into the river. Since this
water contained iron hydroxides at high levels, a
very visual contamination of the local river caused
significant public pressure for a long-term solution
to the problem of AMD in the UK (Banks et al.
1997, Somerfield et al. 1994).
Many methods have been investigated,
designed and used in remediating AMD. Most
1252
common, are the passive (wetland) methods, conventional active methods of adding limestone,
quicklime or NaOH (caustic soda) or soda ash to
promote metal precipitation and other biological
routes such as biosorbents and rotating biological contactors (Wildeman 1993, Groudev et al.
1999, Shutes 2001, Brown et al. 2002).
The bioremediation approach to AMD remediation, which incorporates both biological and passive chemical processes, is a proven alternative to
conventional environmental cleanup technologies
(Macaskie et al. 1995, Boswell et al. 1998, Bonthrone et al. 2000). The naturally occurring, acidophilic bacterium Acidithiobacillus ferrooxidans has
long been used for the bioleaching of copper from
chalcopyrite (CuFeS2) because it can oxidise ferrous iron at a high rate, exhibits rapid growth and
is able to tolerate high iron concentrations (Kelly
& Wood 2000). For these reasons, it has also been
studied extensively for use in solving environmental problems involving iron rich AMD. Therefore
in this work we seek to investigate and enhance
the capability of the indigenous mostly acidophilic
iron and sulphur-oxidising bacteria (Hallberg &
Johnson 2005, Johnson 2003) in the mine water to
oxidise the ferrous iron in solution to ferric iron.
The latter quickly precipitates at the low pH of
the AMD used here and is easily removed using
conventional technologies such as sedimentation
(enhanced by flocculation or the use of hydro-cyclones), froth flotation or filtration. This was done
firstly, by supplementing the water with a bacterial
growth medium and secondly by seeding the water
with a culture of the bacterium At. ferrooxidans at
both the shake flask and laboratory scale.
(average 1.7107 cells/ml) was produced on
ATCC medium 64 (GM) and maintained at
4 °C. GM is made up from two solutions. Solution A, 0.4 g (NH4)2SO4, 0.2 g KH2PO4 and
0.08 g MgSO4Æ7H2O made up in 400 ml distilled
water. Solution B, 10.0 g FeSO4Æ7H2O made up
in 100 ml distilled water and acidified with 1 ml
0.5 M H2SO4. Solution A was autoclaved at
121 °C for 20 min whilst Solution B was filtersterilised (0.2 lm) and the two combined aseptically. The pH of the GM was 2.8.
AMD experiments
Aliquots of AMD were either heat-sterilised
(121 °C for 20 min) or not. These are referred to
as heat-sterilised mine water (HSMW) and nonsterilised mine water (NSMW), respectively. Both
of these (NSMW and HSMW) were supplemented
with 50%, 80% and 90% (v/v) GM or distilled
water where appropriate. A total volume of 50 ml
of each of the above solutions was put into duplicate 500 ml shake flasks and shaken on an orbital
shaker at 100 rpm and 30 °C. Similar flasks were
inoculated with 10% (v/v) At. ferrooxidans where
appropriate and also incubated at 30 °C and
100 rpm. In a similar way, laboratory scale bioreactor studies were carried out in a 5 l cylindrical
glass vessel, (157 mm diameter 260 mm total
height), with a working volume of 4 l. The vessel
was fitted with one 76 mm diameter, four bladed
Rushton turbine which was situated 30 mm above
the bottom of the vessel. The vessel also had four
equally spaced vertical baffles, width 17 mm. The
vessel was equipped for the measurement of pH
and temperature. Cultures were run at 30 °C with
an impeller speed of 100 rpm.
Materials and methods
Analytical methods
Acid mine water (AMD)
AMD was obtained from the Wheal Jane mine
(Cornwall, UK). Fresh AMD was collected in
pre-sterilized plastic bottles. This water was then
stored at 4 °C and used for experiments less than
5 days from the date of collection.
Bacterial strain and growth medium
At. ferrooxidans (ATCC 19859) was used to inoculate the AMD where appropriate. Inoculum
For all experiments, 10 ml samples were taken
and filtered through a 0.45 lm cellulose acetate
membrane filter to remove precipitates (mostly
insoluble ferric iron species) and then acidified
with 1.5 ll conc. HNO3 per 1 ml sample and
kept at 4 °C for total soluble iron (mostly ferrous iron species) content analysis using an
atomic absorption spectrophotometer (Model
751, Instrumentation Laboratory, USA) (Greenberg et al. 1992). For shake flask experiments,
the remainder of the sample was used to measure
1253
temperature, pH and in all cases reduction–oxidation (redox) potential using a Water Test
Meter calibrated as per the manufacturers
instructions (Hannah Instruments, UK).
Results and discussion
A series of experiments was carried out in 500 ml
shake-flasks and a 5 l bioreactor where the AMD
was sterilised or not, supplemented with various
proportions of GM (50%, 80%, 90% v/v) or distilled water or not and inoculated with a laboratory strain of At. ferrooxidans or not. Since
conventional techniques for following microbial
activity were not suitable for use in this case,
because of the very complex particulate nature of
the GM and mine water mixture used, metabolic
activity can be inferred from changes in redox
potential (mV) (Nemati & Harrison 2000, Bhatti
et al. 2001, Medrano-Roldan et al. 2001) changes
in pH and a decreases in total (ferrous) iron in
solution. Also, because AMD is an environmental sample, its composition varies with the time
3.2
550
500
3.0
4000
450
2.8
3000
pH
400
2.6
350
2000
2.4
300
1000
0
2.2
Redox potential (mV)
5000
Total iron in solution mg/l
of year but, even with these different starting
concentrations of iron (also due to the differing
proportions of GM used), reproducible measurements of pH, redox potential (mV), total iron in
solution mg/l were made for duplicate experiments (not all data shown, Figures 1–5). Initial
studies showed that the At. ferrooxidans strain
used here could not grow in undiluted AMD or
AMD diluted with sterile distilled water (50% v/
v) but exhibited a typical growth profile on the
GM. This confirmed the work of others (Dennison et al. 2001) that showed that the AMD needs
to be supplemented with a phosphate source for
At. ferrooxidans to grow.
The effect of both heat-sterilisation and supplementing the AMD with 90% (v/v) of GM
can be seen in Figure 1. In the case of the
HSMW, the total iron in solution remained
high (3300–4500 mg/l), the redox potential was
always below 355 mV and the pH remained
above 2.3 indicating little microbial activity and
ferrous iron removed from solution throughout. However, in the case of the NSMW, the
increase in redox potential to a maximum of
250
2.0
200
0
2
4
6
8
Time (days)
pH HSMW
pH NSMW
Redox potential (mV) HSMW
Redox potential (mV) NSMW
Total iron in solution mg/l HSMW
Total iron in solution mg/l NSMW
Fig. 1. pH, redox potential (mV) and total iron in solution mg/l shake flask profiles for HSMW and NSMW both supplemented
with 90% GM.
1254
2.6
4500
650
4000
600
550
3000
2500
2000
2.2
500
450
2.0
400
1500
Redox potential (mV)
3500
pH
Total iron in solution mg/l
2.4
1.8
350
1000
500
1.6
300
0
2
4
6
8
Time (days)
pH HSMW
pH NSMW
Redox potential (mV) HSMW
Redox potential (mV) NSMW
Tot al iron in solution mg/l HSMW
Tot al iron in solution mg/l NSMW
Fig. 2. pH, redox potential (mV) and total iron in solution mg/l shake flask profiles for HSMW and NSMW both inoculated with
At. ferrooxidans and supplemented with 90% GM.
520 mV with a concomitant decrease in pH to
2.2 indicated indigenous microbial activity
(Nemati & Harrison 2000, Bhatti et al. 2001,
Medrano-Roldan et al. 2001), which was capable
of oxidising ferrous iron to ferric iron hence
lowering the total iron in solution by 70%
after 6 days’ incubation.
The effect of inoculating the HSMW and
NSMW supplemented with 90% (v/v) GM with
At. ferrooxidans is illustrated in Figure 2. In both
cases the redox potential had risen above 550 mV
and the pH had dropped to <1.8 by the end of
day 2. This indicated sufficient microbial activity
to reduce the total iron in solution to below
1300 mg/l (>70% reduction) in both cases during
the same time period. Essentially identical experiments were carried out in a 5 l stirred (100 rpm)
tank bioreactor and similar results were obtained.
The effect of inoculating the NSMW supplemented with 80% (v/v) GM with At. ferrooxidans
is illustrated in Figure 3. In the case of the NSMW
supplemented with 80% (v/v) GM without
inoculation, the total iron in solution decreased
only slightly (5% by day 5), the redox potential
rose steadily from 200 to 320 mV and the pH fell
from 2.9 to 2.4 indicating diminished microbial
activity and ferrous iron oxidtion throughout.
However, in the case of the inoculated NSMW
supplemented with 80% (v/v) GM, the redox potential increased to a maximum of 600 mV by day
2 and a steady decrease in pH to 1.7 throughout.
This indicated microbial activity which was capable of lowering the total iron in solution by 45%
after 2 days’ incubation increasing to 56% by day
5. Essentially, identical experiments were carried
out in a 5 l stirred (100 rpm) tank bioreactor and
similar results were obtained.
The effect of adding 50% (v/v) GM to both
NSMW and NSMW inoculated with At. ferrooxidans in a 5 l stirred (100 rpm) tank bioreactor is
shown in Figure 4. In the case of the NSMW
supplemented with 50% (v/v) GM without inoculation, the total iron in solution decreased only
slightly initially but there was a greater secondary decrease starting on day 6 resulting in a 50%
drop in total iron in solution by day 8. A similar
3.0
4000
2.8
3500
700
600
2.6
500
3000
2.4
2500
400
2.2
2000
300
1500
2.0
1000
1.8
500
1.6
Redox potential (mV)
4500
pH
Total iron in solution mg/l
1255
200
100
0
2
4
6
8
Time (days)
pH NSMW not inoculated
pH NSMW inoculated
Redox potential (mV) NSMW not inoculated
Redox potential (mV) NSMW inoculated
Total iron in solution mg/l NSMW not inoculated
Total iron in solution mg/l NSMW inoculated
Fig. 3. pH, redox potential (mV) and total iron in solution mg/l shake flask profiles for NSMW and NSMW inoculated with
At. ferrooxidans, where both were supplemented with 80% GM.
trend was observed for pH but the redox potential increased gradually throughout. In the case
of the NSMW supplemented with 50% (v/v) GM
with inoculation, the total iron in solution had
decreased by 80% by day 2. This was followed
by a concomitant decrease in pH and increase in
redox potential. Essentially identical experiments
were carried out in 500 ml Erlenmeyer shake
flasks and similar results were obtained.
The effect of adding 10% (v/v) GM to both
NSMW and NSMW inoculated with At. ferrooxidans in a 5 l stirred (100 rpm) tank bioreactor is
shown in Figure 5. In the case of the NSMW
supplemented with 10% (v/v) GM without
inoculation, the total iron in solution gradually
declined with an 80% drop by day 6. A similar
trend was observed for pH but redox potential
increased gradually, throughout. In the case of
the NSMW supplemented with 10% (v/v) GM
with inoculation, similar results were obtained
and the total iron in solution had decreased
by 80% by day 6. This was followed by a concomitant decrease in pH and increase in redox
potential. Essentially identical experiments were
carried out in 500 ml Erlenmeyer shake flasks
and similar results were obtained.
Conclusions
Supplementing non-sterile mine water (NSMW)
with growth medium (GM) at varying proportions, enhances natural microbial activity and
facilitates the removal of total iron from solution
from real acidic mine water such as that obtained
from the Wheal Jane mine even when its composition varies according to the time of year and,
not unsurprisingly, that this effect increases with
increasing proportions of the GM. Further that
the addition of a pure culture of At. ferrooxidans
to either heat-sterilized mine water or NSMW
further enhances the ferrous iron oxidation kinetics. The subsequent hydrolysis of the resultant
ferric iron causes it to precipitate very rapidly
and it can then be removed from suspension by
conventional techniques, in this case, filtration.
Process performance seems to be independent of
the scale of operation examined here (shake-flask
1256
2.8
700
1200
600
1000
500
2.4
800
pH
Total iron in solution mg/l
2.6
600
400
2.2
300
400
2.0
200
200
0
Redox potential (mV)
1400
1.8
100
0
2
4
6
8
Time (days)
pH NSMW not inoculated
pH NSMW inoculated
Redox potential (mV) NSMW not inoculated
Redox potential (mV) NSMW inoculated
Total iron in solution mg/l NSMW not inoclulated
Total iron in solution mg/l NSMW inoculated
Fig. 4. pH, redox potential (mV) and total iron in solution mg/l 5 l laboratory scale bioreactor profiles for NSMW and NSMW
inoculated with At. ferrooxidans where both were supplemented with 50% GM.
600
3.2
550
500
3.0
400
450
2.8
300
pH
Total iron in solution mg/l
500
3.4
400
2.6
350
200
2.4
100
0
Redox potential (mV)
600
300
2.2
250
2.0
200
0
2
4
6
8
Time (days)
pH NSMW not inoculated
pH NSMW inoculated
Redox potential (mV) NSMW not inoculated
Redox potential (mV) NSMW inoculated
Tot al iron in solution mg/l NSMW not inoculated
Tot al iron in solution mg/l NSMW inoculated
Fig. 5. pH, redox potential (mV) and total iron in solution mg/l 5 l laboratory scale bioreactor profiles for NSMW and NSMW
inoculated with At. ferrooxidans where both were supplemented with 10% GM.
1257
and 5 l laboratory scale) and demonstrates the
potential of using such a system for treating real
acid mine water drainage containing a high
ferrous iron content.
Acknowledgements
The authors are grateful to United Utilities
(Cornwall, UK) for allowing samples to be
taken from the Wheal Jane mining facility. This
work was funded by the Ghana Scholarship
Agency through the Commonwealth Scholarship
Commission.
References
Banks D, Younger PL, Arnesen RT, Iversen ER, Banks SB
(1997) Mine-water chemistry: the good, the bad and the ugly.
Environ. Geol. 32: 157–174.
Bhatti TM, Bigham JM, Tuovinen OH (2001) Bacterial and
chemical oxidation of marcasite and pyrite. In: Ciminelli
VST & Garcia JR, eds. International Biohydrometallurgy
Symposium Proceedings, Process Metallurgy, Part A, Amsterdam: Elsevier, pp. 617–625.
Bonthrone KM, Quarmby J, Hewitt CJ, Allan VJM, PatersonBeedle M, Kennedy JF, Macaskie LE (2000) The effect of the
growth medium on the composition and metal binding
behaviour of the extracellular polymeric material of a metalaccumulating Citrobacter sp. Environ. Technol. 21: 123–134.
Boswell CD, Hewitt CJ, Macaskie LE (1998) An application of
bacterial flow cytometry: Evaluation of the toxic effects of
four heavy metals on Acinetobacter sp. with potential for
bioremediation of contaminated wastewaters. Biotechnol.
Lett. 20: 857–863.
Brown M, Barley B, Wood H (2002) Minewater Treatment:
Technology, Application and Policy, Dorchester, UK:IWA
Publishing.
Dennison FD, Sen AM, Hallberg KB, Johnson DB (2001)
Biological versus abiotic oxidation of iron in acid mine
drainage waters: An important role for moderately acidophilic, iron-oxidising bacteria. In: Ciminelli VST & Garcia
JR, eds. International Biohydrometallurgy Symposium Proceedings, Process Metallurgy, Part A, Amsterdam: Elsevier,
pp. 493–501.
Greenberg AE, Clesceri LS, Eaton AD (1992) Standard methods
for the examination of water and wastewater, 18USA:American Public Health Association.
Groudev SN, Bratcova SG, Komnitsas K (1999) Treatment of
waters polluted with radioactive elements and heavy metals
by means of a laboratory passive system. Miner. Eng. 12:
261–270.
Hallberg KB, Johnson DB (2005) Microbiology of a wetland
ecosystem constructed to remediate mine drainage from a
heavy metal mine. Sci. Total Environ. 338: 53–66.
Johnson DB (2003) Chemical and microbiological characteristics of mineral spoils and drainage waters at abandoned coal
and metal mines. Water Air Soil Poll. 3: 47–66.
Kelly DP, Wood AP (2000) Reclassification of some species of
Thiobacillus ferrooxidans to the newly designated genera
Acidithiobacillus, Halothiobacillus and Thermithiobacillus.
Int. J. Syst. Bacterial. 50: 511–516.
Macaskie LE, Hewitt CJ, Shearer JA, Kent CA (1995) Biomass
production for the removal of heavy metals from aqueous
solutions at low pH using growth-decoupled cells of a
Citrobacter spp. Int. Biodeter. Biodegr. 73–92.
Medrano-Roldan H, Chavez-Gonzalez BP, Solis-Soto A,
Morales-Castro J, Ochoa-Martinez LA, Rocha-Fuentes M,
Pereyra-Alferez B, Gala-Wong JL, Ramirez-Rodriguez GD,
Davila-Flores RT (2001) Growth of a native Thiobacillus
ferrooxidans strain in mine tailings. In: Ciminelli VST &
Garcia JR, eds. International Biohydrometallurgy Symposium Proceedings, Process Metallurgy, Part A, Amsterdam:
Elsevier, pp. 587–593.
Nemati M, Harrison STL (2000) A comparative study on
thermophilic and mesophilic biooxidation of ferrous iron.
Min. Eng. 13: 19–24.
Shutes RBE (2001) Artificial wetlands and water quality
improvement. Environ. Int. 26: 441–447.
Somerfield PJ, Gee MJ, Warwrick RM (1994) Benthic
community structure in relation to an instantaneous
discharge of waste water from a tin mine. Mar. Pollut.
Bull. 28: 363–369.
Wildeman TR (1993) Passive bioremediation of metals from
water using reactors or constructed wetlands. In: Means J &
Hinchee R, eds. Emerging Technology for Bioremediation of
Metals, Boca Raton: Interpharm/CRC, pp. 13 –25.
Biotechnology Letters (2005) 27: 1259–1265
DOI 10.1007/s10529-005-3202-y
Springer 2005
Inhibition of platelet aggregation of a mutant proinsulin chimera
engineered by introduction of a native Lys-Gly-Asp-containing sequence
Jian Jing* & Shan Lu
Department of Biochemistry and Biotechnology, Laboratory of Biotechnology and Protein Engineering,
Beijing Normal University, 100875, Beijing, China
*Author for correspondence (Fax: +86-10-58807365; E-mail: [email protected])
Received 13 January 2005; Revisions requested 2 February 2005; Revisions received 14 June 2005; Accepted 14 June 2005
Key words: glycoprotein IIb/IIIa receptor, inhibition of platelet aggregation, KGD (Lys-Gly-Asp) motif,
proinsulin mutant
Abstract
An eight amino acid sequence, CAKGDWNC, from disintegrin barbourin, was introduced into an inactive
human proinsulin molecule between the B28 and A2 sites to construct a chimeric, anti-thrombosis recombinant protein. The constructed Lys-Gly-Asp (KGD)-proinsulin gene was expressed in Escherichia coli
and then purified. The KGD-proinsulin chimera protein inhibits human platelet aggregation, induced by
ADP, with an IC50 value (molar concentration causing 50% inhibition of platelet aggregation) of 830 nM
and demonstrates also specific affinity to glycoprotein IIb/IIIa receptor. Its insulin receptor binding activity
remaines as low as 0.04% with native insulin as a control.
Introduction
The functional motif of Arg-Gly-Asp/Lys-GlyAsp (RGD/KGD) exists in many adhesion proteins, such as fibrinogen, fibronectin and von
Willebrand factor. Platelet aggregation is an
important step in thrombotic events and requires
the binding of fibrinogen to glycoprotein IIb/IIIa
receptor on activated platelets. Most proteins or
peptides from snake and leech venom (Musial &
Niewiarowski 1990, Scarborough et al. 1991),
known as the disintegrin family, containing RGD
motifs or KGD motifs, are potential antagonists
of platelet aggregation. The RGD motif occurs
in many disintegrins, but the KGD motif has
only been found in the disintegrins barbourin
(Scarborough et al. 1991) and ussuristatin-2 (Kiyotaka & Shigeyuki 1999). RGD and KGD motifs have almost the same biological activity to
inhibit platelet aggregation but the KGD motif is
glycoprotein IIb/IIIa receptor-specific as compared with the RGD motif. If KGD-containing
proteins or peptides can simulate the conformation of native functional KGD motif, they may
be also glycoprotein IIb/IIIa receptor-specific and
have high potency to inhibit platelet aggregation
by interacting specificially with glycoprotein IIb/
IIIa receptor on the platelet surface (Wittig et al.
1998). Minoux et al. (2000) have revealed that
functional KGD motif is usually located at the
top of solvent-accessible, highly flexible loop
structure and always tends to assume a b-turn
conformation (Minoux et al. 2000).
Insulin is produced by cleavage of the C-peptide of proinsulin, the precursor of insulin hormone. The C-peptide, exposed on the surface of
proinsulin, is a loose loop structure (Weiss et al.
1990) which is similar to the KGD motif of native KGD-containing disintegrins. To obtain a
novel platelet aggregation inhibitor, an eight
amino acid peptide, CAKGDWNC, originated
from the functional motif of the disintegrin, barbourin (Scarborough et al. 1991), was selected to
replace the C-peptide of human proinsulin to
1260
construct a chimeric anti-thrombosis peptide.
The structure of chimeric KGD-proinsulin molecule was simulated, inhibitory activity of platelet
aggregation, glycoprotein IIb/IIIa receptor binding specificity and insulin hormone activity were
determined.
Materials and methods
Simulation of the KGD-proinsulin structure
The structure of the KGD-proinsulin was simulated with sgi workstation using Insight II software. Structural simulation was carried out with
the data of NMR structure of native human
insulin (Protein Data Bank, Brookheaven, CA).
The Biopolymer module in Insight II was employed to add the CAKGDWNC sequence between the B28 and A2 sites of insulin structure.
At the same time, the A6Cys and A11Cys of
proinsulin were replaced by Ser to delete the
intra-A chain disulfide bond. The Builder module
was employed to carry out structural optimization (iterations: 1000; derivative: 0.01).
Construction of the KGD-proinsulin mutant gene
The standard polymerase chain reaction method
was employed to construct mutant KGD-containing proinsulin gene. The proinsulin gene with
A6 and A11 Cys to Ala mutations was used as
the template (Dai & Tang 1996). The sequences
of the primers were as follows: AGAAAGACGTTGGAG (primer l, 5¢ primer); GACTAATATTACGTCGACTCCCAAATAACCAA
TATTCCCCCAGCACTGAAGCTGCTACGGTGGTAGAA (primer 2, mutant primer); ATTAGCTAGGTGGCC (primer 3, complementary to
the mutant primer); GTCTGATCCCCGGCA
(primer 4, 3¢ primer). Primer 1 and 2 were used
to obtain upstream DNA fragment, and primer 3
and 4 were used to obtain downstream DNA
fragment. Then, the above two DNA fragments
were mixed and annealed with the primer 1 and
4 to obtain full-length KGD-proinsulin gene. The
recombinant gene was confirmed by DNA
sequencing and cloned into an expression vector
pET21a at BamHI and HindIII sites under the
control of a T7 promoter. The constructed recombinant expression vector was named as
pEK214 and used to transform Escherichia coli
BL21(DE3)pLysS for further expression and
purification of the KGD-proinsulin protein.
Expression and purification of the KGD-proinsulin
The procedures for expression and refolding of
the KGD-proinsulin were as described previously
with some modifications (Jing & Tang 2000).
After Sephacryl S200 separation, the pH of the
KGD-proinsulin fraction was adjusted to 3.5
with 2 M HCl, and solid NaCl to 12.5% (w/v) to
salt-out the KGD-proinsulin. The pellet was collected by centrifugation and dissolved in 0.05 M
Tris–HCl and 40% (v/v) 2-propanol, pH 7.0, and
was further purified by DEAE Sephadex ionexchange chromatography.
Characterization of the KGD-proinsulin
Amino acid composition and circular dichroism
(CD) analysis were done as described (Dai &
Tang 1996). The molecular weight of the KGDproinsulin was determined by mass spectrometry.
Inhibition of platelet aggregation was determined
as follows. Fresh human blood was anticoagulated with 0.01 M sodium citrate (10% v/v), pH 7.4,
and centrufuged at 150 g at 25 C for 10 min.
The supernatant was collected as platelet-rich
plasma. The protein samples were dissolved in
0.9% NaCl. Platelet-rich plasma, 300 ll, was
incubated with 25 ll of various concentrations of
protein samples at 37 C for 2 min before addition of 25 ll of 100 lM adenosine 5¢-diphosphate.
The inhibition of platelet aggregation was determined by light transmission measurement. The
IC50 value was calculated by linear regression.
Cell attachment assay was carried out to determine glycoprotein IIb/IIIa receptor binding specificity. The human melanoma cell line K2 was
cultured in modified RPM1640 medium containing 12% fetal calf serum and harvested at subconfluency with 0.4% trypsin and 1 mM EDTA.
Wells (2 cm2) of six-well dishes were treated with
50 ll of fibrinogen (50 lg ml)1) or fibronectin
(50 lg ml)1) in PBS overnight at 4 C. A 500 ll
aliquot of cells (1.5 105 cells ml)1) was added to
each well. The cells were incubated for 1.5 h at
37 C, then non-adherent cells were removed by
aspiration, and adherent cells were fixed and
stained with 2% Giemsa solution for 60 min. The
1261
total number of cells in each well was counted
microscopically. Insulin receptor binding assay
was done as following. Insulin receptor was partially isolated as crude membranes from human
placenta. The proteins were diluted into a series
of concentrations in KRB buffer (0.114 M NaCl,
1.2 mM MgSO4, 0.03 M HEPES, 0.05 M KCl,
1.2 mM KH2PO4, 1.3 mM CaCl2, 0.01 M NaHCO3, pH 7.4). To 50 ll of protein samples, an
equal volume of properly diluted 125I-insulin in
KRB buffer and 6-fold diluted insulin receptor in
KRB buffer in 2% of bovine serum albumin were
added and the samples were mixed. The mixtures
were incubated overnight at 4 C and centrifuged
at 10,000 g for 5 min. The radioactvitiy of the
pellets was determined by gamma ray detection.
The concentration of native insulin producing
50% inhibition of 125I-insulin binding to receptor
was set as 100%, and the activity of the KGDproinsulin was compared.
deleted. A1Gly and B30Thr were replaced by two
Cys residues on the two ends of the eight amino
acid KGD-containing peptide. The two Cys
introduced with the KGD-containing peptide
may form a disulfide-bond to improve platelet
aggregation inhibitory activity of the KGD-proinsulin protein. The structural simulation and
homology modeling of the KGD-proinsulin chimera was carried out with the sgi-workstation
using Insight II-software based on detailed structural information of mutant proinsulin (Hua
et al. 1996) and the disintegrin barbourin
(Minoux et al. 2000). The simulated structure
(Figure 1) of the KGD-proinsulin chimera protein demonstrates that the CAKGDWNC-peptide
introduced between the B28 site and A2 site of
the mutant proinsulin with intra-A chain disulfide-bond deletion exhibits its functional motif to
interact with the glycoprotein IIb/IIIa receptor,
know as fibrinogen receptor. The structural property of the KGD-proinsulin provides necessary
requirements of recognition and interaction with
Results and discussion
Design of the KGD-proinsulin molecule
Intra-A chain disulfide bond-deleted proinsulin
and insulin mutant shows almost no insulin
receptor binding activity, but whole immune
activity is retained (Dai & Tang 1996). The structure of the intra-A chain disulfide bond-deleted
proinsulin mutant is quite similar to that of native proinsulin (Hua et al. 1996). That suggests
that the intra-A chain disulfide bond-deleted proinsulin can be adopted as a promising scaffold
for foreign functional motif to exhibit its active
conformation. The mutant proinsulin with intraA chain disulfide bond deletion is human origin
and inactive in vivo, it can also be prepared easily
as recombinant protein. Spatial distance between
B28 site of the B-chain and A2 site of the A
chain is about 5–10 Å which is suitable for
inserting a small peptide. Also, the proinsulin
and native KGD-containing platelet antagonists
are all small proteins rich in disulfide bonds.
The chimeric KGD-proinsulin has the possibility to specifically inhibit platelet aggregation
and shows no insulin hormone activity as a mutant proinsulin scaffold. To reduce further the
possibility of degradation of proinsulin to insulin,
B29Lys, a possible protease digestion site was
Fig. 1. Simulation of three-dimensional structure of the
KGD-proinsulin. The structure was simulated with an sgi
workstation using Insight II software. Peptide backbone is
shown as a long slender coil shaded in black, with the KGD
sequence (including the side-chains) highlighted. The KGDmotif lies on the surface of mutant proinsulin molecule and
the side-chains of the KGD sequence are extended to the outside of loop structure. The KGD-motif is far away from the
core of mutant proinsulin and exhibit a native-like conformation. Replacement of the C-peptide with KGD-containing sequence has little influence on the proinsulin structure.
1262
the glycoprotein IIb/IIIa receptor on platelet cell
surface. So there is great possibility to obtain a
novel potent anti-thrombosis protein with the
specificity of the glycoprotein IIb/IIIa receptor.
Expression, purification, and characterization
of the KGD-proinsulin
Routine recombinant DNA techniques were used
to construct the chimeric gene and the gene was
over-expressed in Escherichia coli BL21(DE3)pLyS with constructed expression vector
pEK214. The expression and purification of the
KGD-proinsulin is mainly processed according
to the method described previously (Jing & Tang
2000). The expressed protein was analyzed, as
shown in Figure 2a. The expression level was
about 17% of total cellular proteins based on the
spectrophotometric analysis. After isolation of
the inclusion bodies, unfolding and refolding of
the KGD-proinsulin protein, Sephacryl S200
chromatography was used to separate the refolded KGD-proinsulin chiemra protein, as
shown in Figure 2b. (Peak 2 stands for the
KGD-proinsulin chimera protein fraction.) The
KGD-proinsulin was further purified by a
DEAE-Sephadex ion-exchange chromatography
(Figure 2c). High homogeneity of purified KGDproinsulin recombinant protein can be determined by both SDS-PAGE (Figure 2a) and
Fig. 2. Purification of the KGD-proinsulin chimera protein. (a) Analysis of expression of recombinant clones by 15% SDS-PAGE.
Lane 1, protein molecular weight marker; lane 2, total cellular proteins of cells transformed by pET21a vector; lanes 3 and 4, total
cellular proteins of cells transformed by recombinant expression plasmid pEK214; lane 5, purified KGD-proinsulin after DEAESephadex chromatography. (b) Sephacryl S200 chromatography separation. The column (1 50 cm) was eluted with 0.05 M
Gly–NaOH buffer (pH 10.8). Peak 2 represents the KGD-proinsulin. (c) DEAE-Sephadex ion-exchange chromatography to further
purify the KGD-proinsulin. The column (1 5 cm) was equilibrated with 0.05 M Tris–HC1 and 40% 2-isopropanol at pH 7.0. The
KGD-proinsulin was eluted out with a linear NaCl gradient from 0 to 0.30 M in a total volume of 75 ml. Peak 2 represents the
KGD-proinsulin. (d) Electrophoretic analysis of purified KGD-proinsulin on 12% (v/v) polyacrylamide gel. Lane 1, human proinsulin; lane 2, purified KGD-proinsulin after DEAE-Sephadex ion-exchange chromatography. The gels were stained with Coomassie
Brilliant Blue R-250.
1263
native PAGE (Figure 2d) analyses. The predicted
pI of the KGD-proinsulin chimera is about 5.3,
so our previous procedure for the purification of
recombinant human mutant proinsulin (Jing &
Tang 2000) can be adopted to purify the mutant
KGD-proinsulin chimeric protein. The final results were shown by Figure 2 which is in agreement with our expectation.
Amino acid composition analysis of the
KGD-proinsulin chimera was carried out also
with native human proinsulin peptide as a control and the data agrees well with the amino acid
residues numbers calculated by its primary structure (data not shown). CD spectra analysis indicated the KGD-proinsulin contains very close
secondary-structure contents compared with
human insulin (Table 1). This determination
suggests that our structural simulation of the
KGD-proinsulin is very similar to its actual
stereo-structure.
The inhibitory activity of adenosine 5¢-diphosphate-induced human platelet aggregation by the
Table 1. Secondary structure content (%) of the KGD-proinsulin chimera with CD spectra analysis.
a-Helix
b-Sheet
Random structure
KGD-proinsulin
Insulin
15.1
22.6
63.3
22.8
17.1
60.1
KGD-proinsulin was tested, as shown in Figure 3.
Light transmission of ADP-induced platelet
aggregation is illustrated in Figure 3a. The
KGD-proinsulin shows high platelet aggregation
inhibitory activity. The IC50 value calculated is
about 830 nM as shown in Figure 3b, which is
high compared with that of native disintegrins
(Gan 1988, Musial & Niewiarowski 1990, Scarborough et al. 1991). Under the same conditions,
both human proinsulin and insulin peptides
showed no inhibitory activity of the platelet
aggregation (data not shown).
The result suggests that the CAKGDWNC-sequence inserted between the B28 site and the A2
site of the mutant proinsulin with intra-A chain
disulfide-bond deletion exhibits its functional
conformation and can interact directly with corresponding glycoprotein IIb/IIIa receptor on the
platelet cell surface. The potent inhibitory activity of the KGD-proinsulin agrees well with our
expectation based on the result of structural simulation of the KGD-proinsulin chimera protein.
Insulin receptor binding assay showed that the
insulin receptor binding activity of the KGDproinsulin is only 0.04% of native human insulin,
as shown in Figure 4. This agrees with our
expectation that the KGD-proinsulin would not
exhibit insulin hormone activity, so the KGDproinsulin chimera is a safe and specific antithrombosis agent and the mutant proinsulin with
intra-A chain disulfide bond deletion only acts as
Fig. 3. Inhibitory activity analysis of adenosine 5¢-diphosphate-induced platelet aggregation by the KGD-proinsulin. (a) Light
transmission measurement of platelet aggregation. Three hundred microliters of platelet-rich plasma were incubated with 25 ll of
various concentrations of the KGD-proinsulin at 37 C for 2 min before addition of 25 ll 100 l M ADP. Samples 1–5 represent
control buffer, 0.1, 0.5, 1.0 and 10 lm KGD-proinsulin, respectively. (b) Inhibition curve of adenosine 5¢-diphosphate-induced
platelet aggregation of the KGD-proinsulin.
1264
Adhesi on % of K2 melanoma cells( 103)
100
×
Binding of 125I-insulin(%)
80
60
40
20
0
0
1
2
3
4
5
6
Log concentration(ng ml-1) of KGD-proinsulin
120
100
80
60
40
20
0
0
1
10
100
1000
Concentration (nM) of KGD-proinsulin
Fig. 4. Insulin receptor binding assays of the KGD-proinsulin. Vertical axis indicates the binding of 125I-insulin to insulin
receptor, and horizontal axis is logarithm of the native insulins or KGD-proinsulin concentrations. The binding of the
125
I-insulin in the absence of native insulin was set at 100%.
(n): native insulin, (d): KGD-proinsulin.
Fig. 5. Effects of the KGD-proinsulin on adhesion of K2
melanoma cell to (n) fibrinogen and (d) fibronectin. The
KGD-proinsulin inhibits the attachment of K2 cell to fibrinogen-coated wells, while it does not block cell attachment to
fibronectin-coated wells. All determinations were made in
quadruplicate and each sample was examined a minimum of
three times.
a molecular scaffold. The cell attachment assay
showed that the KGD-proinsulin could inhibit
the attachment of K2 human melanoma cells to
fibrinogen-coated wells but not block the cells’
attachment to fibronetin-coated wells. This phenomena suggests that the KGD-proinsulin exhibited high binding activity with glycoprotein IIb/
IIIa receptor known as the fribrinogen receptor
and low activity with alpha5beta1 receptor
known as the fibronectin receptor (Figure 5).
This receptor specificity indicated that the KGDcontaining sequence introduced into the mutant
proinsulin scaffold exhibited its full activity and
the KGD-proinsulin not only inhibits platelet
aggregation, but also recognizes and interacts
specificially with the glycoprotein IIb/IIIa receptor. The detailed structure determination of the
KGD-proinsulin chimera is carried out currently.
Proinsulin molecule is human origin and has
almost no immunogenicity to humans. The constructed KGD-proinsulin with the scaffold of human proinsulin molecule should also not
demonstrate immunogenicity when adopted as a
therapeutic agent in vivo. In this respect, the KGDproinsulin has a considerable advantage over some
naturally occurring antagonists of platelet aggregation purified from snake and leech venom (Gan
1988, Musial & Niewiarowski 1990, Scarborough
et al. 1991). The KGD-proinsulin chimera is a first
reported KGD-containing recombinant mutant
proinsulin with glycoprotein IIb/IIIa receptor
specificity. The KGD-proinsulin is easy to obtain
through large-scale fermentation as compared with
other large recombinant anti-thrombosis proteins
(Lee et al. 1993, Nie & Tang 1998).
We conclude from the above result that
the replacement of the C-peptide with the
CAKGDWNC-peptide in mutant proinsulin
yields a novel anti-thrombosis agent with potent
anti-platelet aggregation activity and the glycoprotein IIb/IIIa receptor binding specificity, but
no insulin hormone activity and immunogenicity
to human body. This advantage enables the
KGD-proinsulin chimera possibility to be adopted as a novel therapeutic agent during the treatment of thrombosis disease.
Acknowledgments
We thank especially Prof Qun Wei, for helpful
discussion about this work; Dr Yin-Ye Wang,
for the cell attachment assay; Prof Jian-Xing Ma,
from Oklahoma University Health Science Center U.S.A., for suggestion about this manuscript.
This work was supported by a grant from Nature Science Foundation of China (30171100,
1265
2001) and a grant from Funds of Distinguished
Young Scholars of Beijing Normal University to
Dr Jian Jing (104977, 2003).
References
Dai Y, Tang JG (1996) Characteristic, activity and conformational studies of [A6-Ser, A11-Ser]-insulin. Biochim. Biophys.
Acta 1296: 63–68.
Gan ZR (1988) A potent platelet aggregation inhibitor from the
venom of viper, Echis carinatus. J. Biol. Chem. 263: 19827–
19832.
Hua QX, Hu SQ, Frank BH, Jia W, Chu YC, Wang SH, Burke
GT, Katsoyannis PG, Weiss MA (1996) Mapping the
functional surface of insulin by design: structure and function
of a novel A-chain analogue. J. Mol. Biol. 264: 390–403.
Jing J, Tang JG (2000) Platelet aggregation inhibitory activity
of mutant proinsulin with C-peptide replaced by CRGDSC
sequence. Biotechnol. Lett. 22: 47–52.
Kiyotaka O, Shigeyuki T (1999) Ussuristatin 2, a novel KGDcontaining disintegrin from Agkistrodon ussuriensis venom.
J. Biochem. 125: 31–35.
Lee G, Chan W, Hurle MR, Desjarlais RL, Waston F, Sathe
GM, Wetzel R (1993) Strong inhibition of fibrinogen binding
to platelet receptor alpha IIb beta 3 by RGD sequences
installed into a presentation scaffold. Protein Eng. 6: 745–754.
Minoux H, Chipot C, Brown D, Maigret B (2000) Structural
analysis of the KGD sequence loop of barbourin an
alphaIIbbeta3-specific disintegrin. J. Comput. Aided Mol.
Des. 14: 317–327.
Musial J, Niewiarowski S (1990) Inhibition of platelet adhesion
to surfaces of extra-corporeal circuits by disintegrins: RGDcontaining peptide from viper venoms. Circulation 82: 261–
273.
Nie X, Tang JG (1998) RGD-containing trypsin with both
platelet aggregation inhibitory activity and proteolytic
activity. Biochem. Mol. Biol. Int. 45: 1149–1154.
Scarborough R, Rose JW, Hsu MA, Phillips DR, Fried VA,
Campbell AM, Nannizzi L, Charo IF (1991) Barbourin. A
GPIIb/IIIa-specific integrin antagonist from the venom of
Sistrurus m barbouri. J. Biol. Chem. 566: 9359–9362.
Weiss MA, Frank BH, Khait I, Pekar A, Heine R, Shoelson SE,
Neuringer LJ (1990) NMR and photo-CIDNP studies of
human proinsulin and prohormone processing intermediates
with application to endopeptidase recognition. Biochemistry
29: 8389–8401.
Wittig K, Rothe G, Schmitz G (1998) Inhibition of fibrinogen
binding and surface recruitment of GPIIb/IIIa as dosedependent effects of the RGD-mimetic MK-852. Thromb.
Haemost. 79: 625–630.
Springer 2005
Biotechnology Letters (2005) 27: 1267–1271
DOI 10.1007/s10529-005-0216-4
Construction of an effective protein expression system using the tpl
promoter in Escherichia coli
Takashi Koyanagi1, Takane Katayama2, Ai Hirao1, Hideyuki Suzuki1 &
Hidehiko Kumagai22,*
1
Division of Integrated Life Science, Graduate School of Biostudies, Kyoto University, Sakyo-ku Kyoto,
606-8502, Japan
2
Research Institute for Bioresources and Biotechnology, Ishikawa Prefectural University, Nonoichi-machi
Ishikawa, 921-8836, Japan
*Author for correspondence (Fax: +81-76-227-7557; E-mail: [email protected])
Received after revision 14 June 2005; Accepted 14 June 2005
Key words: Escherichia coli, protein expression system, the tpl promoter, transcriptional regulator TyrR,
tyrosine transporter TutB
Abstract
An effective protein expression system was constructed in Escherichia coli using the promoter of the
tyrosine phenol-lyase (tpl) gene of Erwinia herbicola. This system involves a mutant form of the TyrR
protein with an enhanced ability to activate tpl and the TutB protein with an ability to transport L -tyrosine
(an inducer of Tpl). The highest expression level obtained for this system was more than twice that obtained
for the tac system, although it was lower than the level obtained for the T7 system, as revealed with the lacreporter assay and SDS-polyacrylamide gel electrophoresis.
Introduction
Expression of the tyrosine phenol-lyase (tpl) gene
is tyrosine-inducible (Kumagai et al. 1970, Antson
et al. 1993, Suzuki et al. 1993), the basis of which
is the TyrR-mediated transcriptional activation in
the presence of L -tyrosine (Suzuki et al. 1995, Bai
& Somerville 1998, Katayama et al. 1999, Pittard
et al. 2005). In the previous study on TyrR of
Erwinia herbicola, we obtained the mutant tyrR5
allele (tyrRV67A Y72C E201G), the product of which
activated tpl expression even without the addition
of L-tyrosine to the medium (Katayama et al.
2000). Since the ability of this mutant
TyrRV67A Y72C E201G to activate the tpl promoter
was significant (Koyanagi et al. 2005), we considered that it could be applied to creating a heterologous protein expression system in Escherichia
coli. The construction of the tpl-expression system
and evaluation of the system using the
lac-reporter assay and SDS-PAGE analysis are
described in this paper.
Materials and methods
Bacterial strains
The bacterial strains used in this study were
derivatives of E. coli K-12. HMS174 (kDE3)
(Campbell et al. 1978), JM101 (Yanisch-Perron
et al. 1985), TK743 [F) ara D(lac-pro) thi
DtyrR::cat+] (Katayama et al. 2000), and derivatives of TK743 were used as host strains.
Media
LB broth (Miller 1992) was used as the growth
medium. Ampicillin, chloramphenicol, kanamycin, and tetracycline were used at 100, 30, 30,
and 15 lg/ml, respectively.
1268
Genetic techniques
Standard genetic techniques were used essentially
as described by Sambrook & Russell (2001). The
lac-reporter gene (lacZ) was amplified by highfidelity PCR using KOD-Plus polymerase (Toyobo). Site-directed mutagenesis was carried out
by the method of Kunkel et al. (1987). The entire
fragment to be used for manipulation was sequenced to ensure that no base change other
than those planned had occurred. The lysogenization of phage kDE3 was performed according
to the protocol supplied by Novagen.
b-Galactosidase assay
An overnight culture was added to fresh LB medium
at 1%(v/v). The culture was incubated at 37 C with
shaking at 120 rpm. Samples were withdrawn at specific time points and subjected to a b-galactosidase
assay according to the method of Miller (1992). For
each strain, assays were performed for separate cultures of five independently isolated transformants.
SDS-PAGE analysis
The cells grown in LB medium were harvested,
suspended in 10 mM sodium phosphate buffer
(pH 7.2), disrupted by sonication, and then centrifuged at 10,000 g for 10 min to separate the
soluble fraction from the insoluble fraction. Ten
micrograms of protein from the soluble fraction
were loaded on a 12% SDS-PAGE. The concentration of protein was determined by the Lowry
method. The insoluble fraction was washed once
with 10 mM sodium phosphate buffer (pH 7.2),
suspended and boiled in cracking buffer (60 mM
Tris/HCl (pH 6.8), 140 mM 2-mercaptoethanol,
35 mM SDS, 1 M glycerol, and 150 lM Bromophenol Blue), and then centrifuged at 10,000 g
for 10 min. The supernatant, equivalent to 0.7 lg
(wet wt) of cells, was loaded on the same gel.
After the electrophoresis, the gel was stained
with Coomassie Brilliant Blue R-250.
Results and discussion
Construction of the vector
First, we made a suitable expression vector with
multiple cloning sites as shown in Figure 1. Step 1:
Fig. 1. Scheme of the vector’s construction. The numbering
of pAH423 starts at the first T in the sequence GAATTC
(EcoRI), and the unique restriction sites are indicated. The
multiple cloning sites are shown below the map.
An NdeI site was introduced at the initiation
codon of the tpl gene on pTK304 (Katayama et al.
1999) by site-directed mutagenesis. Step 2: The
1269
1.5-kb NdeI-PstI fragment containing the coding
region of tpl was replaced with a similarly digested
short fragment that was made by annealing two
complementary oligonucleotides containing multiple cloning sites, 5¢-CCATATGGATCCGCGGCCGCCATGGCTGCAGG-3¢ and 5¢-CCTGCA
GCCATGGCGGCCGCGGATCCATATGG -3¢.
Step 3: The resulting plasmid was digested with
SphI, blunt-ended, and ligated with the 0.7-kb
XmnI fragment containing a strong transcription terminator (rrnBT1T2) excised from
pTrc99A (Amersham). Step 4: Next, the region
containing the TyrR binding sites, the tpl promoter, the ribosome-binding site, the multiple
cloning sites, and the transcription terminator
in this order was excised by digestion with
SmaI and HindIII (blunt-ended), and inserted
into a blunt-ended NdeI site of pBR322. Step
5: Finally, the tetracycline resistance gene was
deleted by removing the 0.8-kb EcoRV-NruI
fragment to generate pAH423.
Evaluation of the tpl-expression system using
the lac-reporter gene
The efficiency of the tpl-expression system was
evaluated using the lac-reporter assay. The
b-galactosidase (lacZ) gene was inserted into the
NdeI-NotI sites of pAH423, and the resulting reporter plasmid (pAH444) was introduced into
TK743 [F) ara D(lac-pro) thi DtyrR::cat+] carrying either the wild-type tyrR gene or the mutant
tyrR5 gene on a pSC101-derived plasmid. The
strain was grown in LB medium and then subjected to the b-galactosidase assay.
As shown in Figure 2, the strain carrying the
tyrR5 allele had significantly increased reporter
activity as compared to the strain carrying the
wild-type allele. The level of expression was further elevated on introduction of the tyrosine
transporter tutB gene (Katayama et al. 2002). In
the presence of a pACYC-derived plasmid carrying tutB, approximately 1.3-fold more activity
was obtained, due to the increased intracellular
concentration of L-tyrosine (an inducer of Tpl).
However, no significant effect was observed on
the expression level even when 0.1% L-tyrosine
was added to the medium, maybe because LB
broth originally contains a considerable amount
of L-tyrosine (data not shown). Thus, the level of
Fig. 2. Evaluation of the tpl-expression system using the lacreporter assay. The plasmid pAH423 carrying the lac-reporter
gene under the control of the tpl promoter (pAH444) was
introduced into strain TK743 [F) ara D(lac-pro) thi
DtyrR::cat+] carrying either the wild-type tyrR gene (pSC101
replicon tet+tyrRE. herbicola+) ()) or the tyrR5 gene (pSC101
replicon tet+ tyrRE. herbicolaV67A Y72C E201G) (s) on the plasmid, or strain TK743 carrying an empty vector (pSC101 replicon tet+) (h). The strain carrying the tyrR5 allele was further
transformed with a plasmid carrying tutB (p15A replicon
kan+ tutB+) (n). These strains were grown in LB medium.
Samples were withdrawn at the indicated time, and subjected
to a b-galactosidase assay. The values are averages of at least
two independent experiments.
expression is maximized when the strain carrying
tyrR5 and tutB is used as a host and incubated
in LB medium for 32 h.
The highest value obtained for the tpl-expression system was compared to that obtained for
the tac- and T7-expression systems. The lacreporter gene was inserted into the NdeI-PstI
(blunt-ended) sites of pMAL-c2E (for the tac system; New England BioLabs) to generate
pAH349, and the NdeI-BamHI (blunt-ended)
sites of pET-3a (for the T7 system; Novagen) to
generate pAH471. The resulting reporter plasmids pAH349 (tac system) and pAH471 (T7 system) were introduced into strain AH359 [F’
traD36 lacIq D (lacZ)M15 proA+B+/ara D(lacpro) thi DtyrR::cat+] and kDE3-lysogenized
AH359, respectively. The reporter plasmid for
the tpl system, pAH444, was introduced into
strain AH359 carrying the tyrR5 and tutB genes
on separate plasmids. These strains were grown
in LB medium and, as for the tac and T7
1270
systems, 0.5 mM IPTG was added at the midgrowth phase to induce expression. Samples were
withdrawn at different times, and subjected to a
b-galactosidase assay. The inhibitory effect of
IPTG (the substrate analogue) on b-galactosidase
activity was negligible (3.6% of total Miller U).
As a result, the highest expression level obtained for the tpl system (20,000 ± 3,000 Miller
U) was found to be 2.5-fold higher than that for
the tac system (7,900 ± 800 Miller U, 2 h after
induction). This was also the case when a different E. coli strain, JM101, was used as a host
(21,000 ± 2,000 Miller U for the tpl system vs.
8,600 ± 500 Miller U for the tac system).
Although JM101 possesses the wild-type tyrR allele on its chromosome, it did not affect the action of TyrRV67A Y72C E201G on the tpl promoter,
indicating that the tyrR) genotype is not necessary for the host genetic background.
Compared to the T7 system, the tpl system
exhibited a comparatively low level of efficiency of
expression. The highest value obtained for the T7
system using AH359 (kDE3) as a host was
33,000 ± 2,000 Miller U, about 1.7-fold higher
than that obtained for the tpl system. When
HMS174 (kDE3) (Novagen) was used as a host
cell, a maximum of 28,000 ± 4,000 Miller U was
obtained. As for strain HMS174 (kDE3) harboring
the reporter plasmid pAH471, the net reporter
activity was calculated by subtracting the b-galactosidase activity of the host (Lac+) (9,000 ± 1,000
Miller U) from the total activity of the strain
carrying pAH471 (37,000 ± 4,000 Miller U).
Next, the solubility and functionality of the
synthesized LacZ protein were evaluated by SDSPAGE analysis. The cells harvested when the reporter activity was at a maximum were disrupted
by sonication, and then centrifuged at 10,000 g for
10 min to separate the soluble fraction from the
remaining insoluble fraction. Each fraction was
subjected to electrophoresis, and the gel was
stained with Coomassie Brilliant Blue R-250. The
LacZ protein was detected with a molecular size of
approximately 120 kDa as shown in Figure 3
(indicated by an arrow). Consequently, it was revealed that the differences among the three systems
as to the amounts of soluble forms of LacZ well
reflected the results of the reporter assay. The tpl
system (lanes 4 and 5) produced a soluble b-galactosidase at two- to three-fold higher level of the tac
system (lanes 2 and 3), but at about a two-fold
Fig. 3. Comparison of the amounts of soluble and insoluble
forms of the LacZ protein expressed by the tac-, tpl-, and T7expression systems. The cells grown in LB medium were harvested, suspended in 10 mM sodium phosphate buffer (pH
7.2), disrupted by sonication, and then centrifuged. The soluble fractions (equivalent to 10 lg of protein; lanes 2–7) and
insoluble fractions (equivalent to 0.7 lg of wet weight of cells;
lanes 9–11) were loaded on a 12% SDS-polyacrylamide gel,
and the gel was stained with Coomassie Brilliant Blue R-250.
b-Galactosidase is indicated by an arrow (approximately
120 kDa). Lanes 1 and 8, Prestained Protein Marker, Broad
Range (New England BioLabs); lanes 2 and 3, the tac system
using AH359 and JM101 as hosts, respectively; lanes 4 and 5,
the tpl system using AH359 and JM101 as hosts, respectively;
lanes 6 and 7, the T7 system using AH359 (kDE3) and
HMS174 (kDE3) as hosts, respectively; lanes 9–11, the tac-,
tpl-, and T7-expression systems using AH359 (for tac and tpl)
and AH359 (kDE3) (for T7) as hosts.
lower level than the T7 system (lane 6 and 7). The
results suggested that all soluble protein molecules
expressed by the tpl system should be functional.
Apparently all LacZ molecules were expressed
in a soluble form when its gene was placed under
the control of the tpl promoter (lane 10), while a
significant amount of LacZ was synthesized in an
insoluble form when the T7 system was employed (lane 11).
The results presented here indicate that we
succeeded in constructing an effective protein
expression system by using the tpl promoter, the
mutant TyrR protein, and the tyrosine transporter TutB. One important advantage of this
system is that, essentially, any strain is available
as the host, in contrast to the T7 system which
requires a certain genetic background for the
infection and/or lysogenization of phage kDE3
when one wants to use a specific E. coli strain as
1271
an expression host. Thus, although the tplexpression system is not applicable to proteins
toxic to E. coli, it could serve as a good alternative to commonly used protein expression
systems.
Acknowledgements
This work was partly supported by a Grant-inAid for Scientific Research (B), No. 14360056,
from the Ministry of Education, Culture, Sports,
Science, and Technology, Japan. T. Koyanagi
was supported by the 21st Century COE Program of the Ministry of Education, Culture,
Sports, Science and Technology.
References
Antson AA, Demidkina TV, Gollnick P, Dauter Z, von Tersch
RL, Long J, Berezhnoy SN, Phillips RS, Harutyunyan EH,
Wilson KS (1993) Three-dimensional structure of tyrosine
phenol-lyase. Biochemistry 32: 4195–4206.
Bai Q, Somerville RL (1998) Integration host factor and cyclic
AMP receptor protein are required for TyrR-mediated
activation of tpl in Citrobacter freundii. J. Bacteriol. 180:
6173–6186.
Campbell JL, Richardson CC, Studier FW (1978) Genetic
recombination and complementation between bacteriophage
T7 and cloned fragments of T7 DNA. Proc. Natl. Acad. Sci.
USA 75: 2276–2280.
Katayama T, Suzuki H, Koyanagi T, Kumagai H (2000)
Cloning and random mutagenesis of the Erwinia herbicola
tyrR gene for high-level expression of tyrosine phenol-lyase.
Appl. Environ. Microbiol. 66: 4764–4771.
Katayama T, Suzuki H, Koyanagi T, Kumagai H (2002)
Functional analysis of the Erwinia herbicola tutB gene and its
product. J. Bacteriol. 184: 3135–3141.
Katayama T, Suzuki H, Yamamoto K, Kumagai H (1999)
Transcriptional regulation of tyrosine phenol-lyase gene
mediated through TyrR and cAMP receptor protein. Biosci.
Biotechnol. Biochem. 63: 1823–1827.
Koyanagi T, Katayama T, Suzuki H, Nakazawa H, Yokozeki
K, Kumagai H (2005) Effective production of 3,4-dihydroxyphenyl-L -alanine (L -DOPA) with Erwinia herbicola cells
carrying a mutant transcriptional regulator TyrR. J. Biotechnol. 115: 303–306.
Kumagai H, Yamada H, Matsui H, Ohkishi H, Ogata K (1970)
Tyrosine phenol lyase. I. Purification, crystallization, and
properties. J. Biol. Chem. 245: 1767–1772.
Kunkel TA, Roberts JD, Zakour RA (1987) Rapid and efficient
site-specific mutagenesis without phenotypic selection. Methods in Enzymology 154: 367–382.
Miller JH (1992) A Short Course in Bacterial Genetics. A
Laboratory Manual and Handbook for Escherichia coli and
Related Bacteria. Cold Spring, Harbor, NY:Cold Spring
Harbor Laboratory.
Pittard J, Camakaris H, Yang J (2005) The TyrR regulon. Mol.
Microbiol. 55: 16–26.
Sambrook J, Russell DW (2001) Moleculer Cloning: A Laboratory Manual, 3rd edn. Cold Spring Harbor, NY:Cold
Spring Harbor Laboratory.
Suzuki H, Katayama T, Yamamoto K, Kumagai H (1995)
Transcriptional regulation of tyrosine phenol-lyase gene of
Erwinia herbicola AJ2985. Biosci. Biotechnol. Biochem. 59:
2339–2341.
Suzuki H, Nishihara K, Usui N, Matsui H, Kumagai H (1993)
Cloning and nucleotide sequence of Erwinia herbicola
AJ2982 tyrosine phenol-lyase gene. J. Ferment. Bioeng. 75:
145–148.
Yanisch-Perron C, Vieira J, Messing J (1985) Improved M13
phage cloning vectors and host strains: nucleotide sequences
of the M13mp18 and pUC19 vectors. Gene 33: 103–119.
Springer 2005
Biotechnology Letters (2005) 27: 1273–1276
DOI 10.1007/s10529-005-0218-2
Purification and properties of an N-acetylglucosaminidase
from Streptomyces cerradoensis
Iderval da Silva Junior Sobrinho1, Luiz Artur Mendes Bataus2, Valéria Ribeiro Maitan2
& Cirano José Ulhoa1,*
1
Laboratório de Enzimologia, Universidade Federal de Goiás, 74001-970, Goiânia, GO, Brazil
Laboratório de Bioquı´mica e Engenharia Gene´tica, Universidade Federal de Goiás, 74001-970, Goiânia, GO,
Brazil
*Author for correspondence (E-mail: [email protected])
2
Received 22 March 2005; Revisions requested 19 April 2005; Revisions received 14 June 2005; Accepted 15 June 2005
Key words: N-acetylglucosaminidase, characterization, production, Streptomyces cerradoensis
Abstract
An N-acetylglucosaminidase produced by Streptomyces cerradoensis was partially purified giving, by SDSPAGE analysis, two main protein bands with Mr of 58.9 and 56.4 kDa. The Km and Vmax values for the
enzyme using p-nitrophenyl-b-N-acetylglucosaminide as substrate were of 0.13 mM and 1.95 U mg)1
protein, respectively. The enzyme was optimally activity at pH 5.5 and at 50 C when assayed over 10 min.
Enzyme activity was strongly inhibited by Cu2+ and Hg2+ at 10 mM, and was specific to substrates
containing acetamide groups such as p-nitrophenyl-b-N-acetylglucosaminide and p-nitrophenyl-b-D-N,N¢diacetylchitobiose.
Introduction
Chitin, a b)1, 4-linked polymer of N-acetylglucosamine, is a structural component of the arthropod exoskeleton and is a common constituent of
fungal cell walls. The complete degradation of
chitin is performed by the chitinolytic system
composed of chitinases (EC 3.2.1.14) and N-acetylglucosaminidases (E.C. 3.2.1.30) (Sahai &
Manocha 1993). Chitinases can hydrolase the substrate by two possible mechanisms, identified by
the products of hydrolysis: (a) endochitinases
cleave internal bonds within chitin releasing chitotetraose, chitotriose and chitobiose; (b) exochitinases catalyses the release of chitobiose without the
formation of oligo or monosaccharides. The
N-acetylglucosaminidases cleave chitobiose, chitotriose and chitotetraose releasing N-acetylglucosamine.
Among bacteria, the actinomycetes are an
important chitinase-producing group, especially
those belonging to the genus Streptomyces
(Broadway et al. 1995, El Sayed et al. 2000,
Gomes et al. 2000, Ueno & Miyashita 2000).
There is less work about N-acetylglucosaminidase
from other organisms and few researches have
been done to characterize this type of enzyme
from Streptomyces. In this article we describe the
partial purification and characterization of a Nacetylglucosaminidase produced by Streptomyces
cerradoensis, isolated from Brazilian cerrado
soils.
Materials and methods
Microorganism and enzyme production
Streptomyces cerradoensis obtained from solid
culture media (ISP-2) were inoculated in Erlenmeyer flasks containing 50 ml YEME liquid
media (Hopwood et al. 1985).
1274
Samples of 50 ll of cells suspension from
YEME media were added to Erlenmeyer flasks
(250 ml) containing 50 ml media: 0.2% (w/v)
K2HPO4, 0.3% (w/v) NaCl, 0.3% (w/v) KNO3,
0.05% (w/v) MgSO4 Æ 7H2O, 0.04% (w/v) CaCl2 Æ
2H2O, 0.002% (w/v) FeSO4, 0.001% (w/v)
MnSO4, 1% (w/v) chitin, pH 7.0. The flasks were
incubated at 30 C with shaking (150 rpm) for
9 days.
N-Acetylglucosaminidase assay (NAGase)
Enzyme activity was assayed using p-nitrophenyl-b-N-acetylglucosaminide (pNP-GlcNAc) as
substrate. The reaction mixture consisted of
50 ll enzyme solution, 350 ll 50 mM sodium
acetate buffer (pH 5.5) and 100 ll 5 mM pNPGlcNAc as described by Ulhoa and Peberdy
(1993). One unit (U) of enzyme was defined as
the amount of enzyme that released 1 lM
p-nitrophenol per min.
Partial enzyme purification
Samples of the supernatant (150 ml) were applied
to a SP-Sepharose chromatography column
(2.2 15 cm), equilibrated with 50 mM sodium
acetate buffer (pH 5.5), at 1 ml min)1. The column was washed with the same buffer and the
proteins eluted with a linear gradient of 0–1 M
NaCl. Fractions containing NAGase activity
were pooled, dialyzed against 50 mM sodium
acetate buffer (pH 5.0), and applied to methylSepharose column (1 5 cm). The adsorbed
proteins were eluted at 4 C with a decreasing
linear gradient of (NH4)2SO4 (1.2 M to 0). Fractions containing NAGase activity were pooled
and stored at )10 C. SDS-PAGE with 10 %
(w/v) polyacrylamide was by the standard method of by Laemmli. The proteins were silver
stained by the method of Blum et al. (1987).
Results and discussion
Production of N-acetylglucosaminidase
Recently, we isolated a chitin-degrading actinomycete from soil sample, which was identified as
belonging to Streptomyces genus. Sequence analysis of the gene encoding 16S rDNA (GeneBank
Accession No. AY627277) showed that this actinomycete is a new species, named by us as Streptomyces cerradoensis. This strain showed in
preliminary tests, high chitinase and N-acetylglucosaminidase (NAGase) activity when grown in
chitin-containing medium. A main peaks of
NAGase activity (0.061 U) was found after 120 h
growth at 30 C.
Partial purification of N-acetylglucosaminidase
The enzyme was partially purified from a culture
supernatant by ion exchange chromatography
and gel filtration. The fractions obtained after
the procedure were free of chitinase activity. At
the final steps, two main bands of protein were
detected by SDS-PAGE with apparent molecular
mass of 58.9 and 56.4 kDa (Figure 1). This
Thin-layer chromatography
The end products of the enzymatic hydrolysis of
N,N¢-diacetylchitobiose (5 mM), N,N¢,N¢¢-triacetylchitotriose (5 mM) and colloidal chitin
(0.2%, w/v) were analyzed by TLC according to
Chung et al. (1995).
Fig. 1. Protein profile on SDS-PAGE at a concentration of
10% polyacrylamide. Lane M indicates the molecular mass
markers and N shows the N-acetylglucosaminidase partially.
Phosphorylase b (99.4 kDa), serum albumin (66.0 kDa), ovalbumin (45.0 kDa) and carbonic anhydrase (29.0 kDa) were
used as molecular mass standards.
1275
Table 1. Biochemical properties of the NAGase from Streptomyces cerradoensis.
pH Optimum
Temperature optimum (C)
Temperature stability pH 5.5 over 30 min
40 C
55 C
Km (mM)
Vmax (U mg)1 protein)
Inhibition by Hg2+ (10 mM)
Inhibition by Cu2+ (10 mM)
5.0
50
30%
12%
0.13
1.95
100%
78%
The effect of pH on the enzyme activity was determined by
varying the pH of the reaction mixtures using sodium acetate
(pH 3.5–5.5) and potassium phosphate buffer (pH 6.0–7.5). The
effect of temperature on the enzymatic activity was determined
at the pH optimum, in the range of 30–75 C. The effect of
temperature on the enzyme stability was analyzed by previously
incubating the enzyme at 40 and 55 C for 30 min. Michaelis–
Menten constant (Km) was determined by non-linear-regression
analysis of data obtained by measuring the rate of qNP-GlcNAc hydrolysis (from 0.02 to 0.6 mM). The inhibition of the
NAGase activity by metal ions was determined through previous incubation of the enzyme samples with 10 mM ZnSO4, KCl,
MgSO4, CaCl2, CuSO4 and HgCl2 for 2 min. Results are means
values of three replicates.
molecular weight was in a similar range to that
produced by S. thermoviolaceus (Tsujibo et al.
1998) although, smaller NAGases (27 and
49.5 kDa) also have been isolated and characterized from Streptomyces plicatus (Tarentino et al.
1978, Trimble et al. 1982).
Enzyme characterization
The lower Km (0.13 mM) indicates that the enzyme has high affinity for the substrate when it is
compared with those reported for S. thermoviolaceus (0.43 mM) and for S. hygroscopicus (NA1:
0.12 mM and NA2: 0.76 mM) (Irhuma et al. 1991,
Tsujibo et al. 1998). Most bacterial NAGases are
optimally active in the range of pH 4–5 and
between 50 and 60 C (Trimble et al. 1982,
Irhuma et al. 1991, Saito et al. 1998, Tsujibo
et al. 1998). Concurring with this, the NAGase
of S. cerradoensis displayed maximal activity at
pH 5 and at 50 C (Table 1). The enzyme,
though, rapidly lost activity either at 40 or 55 C
(Table 1). Activity was not affected by Ca2+,
Mg2+ and Zn2+ but was inhibited by Cu2+ and
Hg2+ at 10 mM. Almost all of the NAGases
from Streptomyces are inhibited by Hg2+ indicating the importance of indole amino acid residues in the enzyme function (Irhuma et al. 1991,
Trimble et al. 1982, Tsujibo et al. 1998).
Substrate specificity
The activity of the enzyme was observed only
over substrates containing acetamide groups
(Table 2). Similar results were observed for NAGase
from other Streptomyces species, suggesting that
acetamide groups are important to the recognition of chitin and its oligomers by these enzymes
(Tsujibo et al. 1998). N-Acetylglucosaminide
was released from N,N¢-diacetylchitobiose and
N,N¢,N¢¢-triacetylchitotriose after 24 h incubation, while this monomer was released from
colloidal chitin only after 48 h incubation. Such
a profile indicates that this enzyme acts at the
extremity of the substrates releasing N-acetylglucosaminide and accords with the definition of
NGAse as proposed by Sahai and Manocha
(1993).
Acknowledgements
This work was supported by a biotechnology research grant to C.J. Ulhoa from CNPq and
FUNAPE/UFG. I.S. Jr. Sobrinho was supported
by CAPES/MEC Brazil.
Table 2. Specificity of N-acetylglucosaminidase to different substrates.
Substrate (5 mM)
Enzyme activity (U)
Relative activity (%)
p-Nitrophenyl-b-N-acetylglucosaminide
p-Nitrophenyl-b-D-N,N’-diacetylchitobiose
p-Nitrophenyl-b-D-glucopyranoside
p-Nitrophenyl-b-D-galactopyranoside
27 ± 4
6.5 ± 0.04
0.07 ± 0.01
0
100
25
0.3
0
The reaction mixture consisted of 50 ll of enzyme solution, 350 ll 50 mM sodium acetate buffer (pH 5.5) and 100 ll of specific pnitrophenyl substrate (5 mM). One unit (U) of enzyme was defined as the amount of enzyme that released 1 lM p-nitrophenol per min.
1276
References
Blum H, Beier H, Gross H (1987) Improved silver staining of
plants proteins, RNA and DNA in polyacrilamide gels.
Eletrophoresis 8: 93–99.
Broadway RM, Williams DL, Kain WC, Harman GE, Lorito
M, Labeda DP (1995) Partial characterization of chitinolytic
enzymes from Streptomyces albidoflavus. Lett. Appl.
Microbiol. 20: 271–276.
Chung YC, Kobayashi T, Kanai H, Akiba T, Kudo T (1995)
Purification and properties of extracellular amylase from the
hyperthermophilic archeon Thermococcus profundus DT
5432. Appl. Environ. Microbiol. 1: 1502–1506.
El Sayed EISA, Ezzat SM, Ghaly MF, Mansour M, El Bohey
MA (2000) Purification and characterization of two chitinases from Streptomyces albovinaceus S-22. World J. Microbiol. Biotechnol. 16: 87–89.
Gomes RC, Semêdo LTAS, Soares RMA, Alviano CS,
Linhares LF, Coelho RRR (2000) Chitinolytic activity of
actinomycetes from a cerrado soil and their potential in
biocontrol. Lett. Appl. Microbiol. 30: 146–150.
Hopwood DA, Bibb MJ, Chater KF, Kieser T, Bruton CJ,
Kieser HM, Lydiate DJ, Smith CP, Ward JM, Schrempf H
(1985) Genetic Manipulation of Streptomyces: A Laboratory
Manual, New York:The John Innes Foundation.
Irhuma A, Gallagher J, Hackett TJ, McHale AP (1991)
Studies on N-acetylglucosaminidase activity produced by
Streptomyces hygroscopicus. Biochim. Biophys. Acta 1074:
1–5.
Sahai AS, Manocha MS (1993) Chitinases of fungi and plants:
their involvement in morphogenesis and host–parasite interaction. FEMS Microbiol. Rev. 4: 317–338.
Saito A, Fujii T, Yoneyama T, Miyashita K (1998) glk is
involved in glucose repression of chitinase production in
Streptomyces lividans. J. Bacteriol. 180: 2911–2914.
Tarentino AL, Trimble RB, Maley F (1978) Endo-b-N-acetylglucosaminidase from Streptomyces plicatus. Methods in
Enzymology 1: 574–580.
Trimble RB, Tarentino AL, Aumick GE, Maley F (1982) Endob-N-acetylglucosaminidase L from Streptomyces plicatus.
Methods in Enzymology 83: 603–610.
Tsujibo H, Hatano N, Mikami T, Hirasawa A, Miyamoto K,
Inamori Y (1998) A novel b-N-acetylglucosaminidase from
Streptomyces thermoviolaceus OPC-520: gene cloning,
expression, and assignment to family 3 of the glycosyl
hydrolases. Appl. Environ. Microbiol. 64: 2920–2924.
Ulhoa CJ, Peberdy JF (1993) Effect of carbon sources on
chitobiose production by Trichoderma harzianum. Mycology
Res. 97: 45–48.
Ueno H, Miyashita K (2000) Inductive production of chitinolytic enzymes in soil microcosms using chitin, other carbonsources, and chitinase-producing Streptomyces. Soil Sci.
Plant Nut. 46: 863–871.
Springer 2005
Biotechnology Letters (2005) 27: 1277–1282
DOI 10.1007/s10529-005-3219-2
A modified PCR system for amplifying b-ketoacyl-ACP synthase gene
fragments with DNA from Streptomyces luteogriseus
Feng-Ming Yu, Xin Jiang, Jin-Chuan Wu & Ying-Jin Yuan*
Department of Pharmaceutical Engineering, Tianjin University, P.O. Box 6888, 300072, Tianjin, P. R. China
*Author for correspondence (Fax: 86-22-27403888; E-mail: [email protected], [email protected])
Received 27 April 2005; Revisions requested 18 May 2005; Revisions received 15 June 2005; Accepted 15 June 2005
Key words: b-ketoacyl-ACP
luteogriseus
synthase,
gene
amplification,
modified
PCR
system,
Streptomyces
Abstract
Streptomyces luteogriseus strain 099, producing a new type of macrolide antibiotic with anti-coxB6 virus
and anti-HIV protease activities, was isolated from soil. PCR was optimized to amplify b-ketoacyl-ACP
synthase (KS) genes. The system was optimized around the use of higher concentrations of DMSO (15%
vs. 10% v/v) and dNTP (500 lM vs. 50–200 lM) and a lower annealing temperature (55 C vs. 60–70 C)
than the normal PCR method used to amplify high GC content DNA.
Introduction
Actinomycetes, especially streptomyces, are major producers of antibiotics and other secondary
metabolites and are industrially important. The
research on the functional genome is becoming
deeper and wider. The total sequence of Streptomyces coelicolor and S. averimitilis genomes and
partial gene sequence of some other important
strains producing antibiotics have been reported.
This has resulted in a call for genetic reconstruction of strains for producing industrially useful
metabolites and the synthesis of new type of
antibiotics using combinatorial biosynthesis
(Rodrigue et al. 2003, Weber et al. 2003). The
study of relative genes for antibiotic synthesis is
therefore essential.
Genes of streptomyces are usually obtained
by a shot-gun method which is time-consuming.
According to the homology among genes, fragments could be obtained by PCR (Izumikawa
et al. 2003). For GC-rich template DNA from
streptomyces PCR is often frustrated by inadequate yield of the target DNA sequence and
undesired non-specific bonds (Chakrabarti &
Schutt 2001). So normal PCR is not suitable for
amplifying gene fragments of streptomyces and
different corrective actions have different results
under different conditions. It is essential that the
PCR system and reaction conditions for streptomyces be optimized.
Streptomyces luteogriseus 099 was isolated
from soil by our group. It can produce a secondary metabolite having good anti-coxB6 virus
and anti-HIV protease properties with the IC50
of 230 lg/ml and 40 lg/ml, respectively, showing a broad application spectrum (Wang 2004).
By means of precursors and specific inhibitors
added during experiments, together with NMR,
UV and IR spectrum analyses, the screened
substance was speculated to be a macrolide
antibiotic synthesized through the polyketide pathway. However, we found that a KS
(b-ketoacyl-ACP synthase) fragment of its genome could not be amplified perfectly by normal
PCR. We have therefore attempted the to optimize the PCR system and reaction conditions
and report the results below.
1278
Materials and methods
Strains and culture medium
Streptomyces luteogriseus 099 was isolated and
preserved in our laboratory. E. coli DH5a was
obtained from Prof. Lai-Jun Xing of Nankai
University, China. The medium for S. luteogriseus contained 5 g glucose, 30 g soluble starch,
4 g peptone, 1.5 g K2HPO4, 0.25 g NaCl, 0.5 g
MgSO4 in 1 liter water, pH 7.0. Luria–Bertani
(LB) medium was used for showing E.coli.
Reagents and materials
A PCR reagent kit, restriction enzyme EcoRI,
HindIII, DNA Marker DL2000 and pMD-18T
vector were obtained from Takara Biotechnology
Corporation. The Ultra-sep Gel Extraction kit
was obtained from Omega Bio-Tek, USA. The
Hybaid PCR express thermal cycler was obtained
from Hybaid, UK. The GDS-8000 System and
UVP Bioimaging Systems were obtained from
UVP, Inc., USA. Other chemicals were of
reagent grade and obtained commercially.
Genome DNA extraction
A modified method of Hopwood et al. (1985)
was used. After culturing S. luteogriseus for 24 h,
the mycelium was collected, washed with 150 mM
NaCl/100 mM EDTA and treated with lysozyme
at 37 C. After addition of SDS followed by
heating to 65 C, the viscosity of the mycelium
solution declined. Equal volumes of phenol/chloroform/isoamyl alcohol (25:24:1, by vol.) were
added to remove protein. After extracting twice
with chloroform, 0.9 vol. cold 2-propanol was
added into the aqueous phase to precipitate
DNA. DNA was washed twice with 70% (v/v)
ethanol, dried at room temperature and then dissolved in TE buffer (pH 8.0). RNA was degraded
in the same manner by RNase. The purity and
content of DNA were measured by absorbancies.
designed according to the homology of KS gene
sequences in S. avermitilis, S. coelicolor and other
strains published in the GeneBank. Primers were
provided by Shanghai Sangon Biological Engineering Technology and Services Co., Ltd, China.
PCR system
PCR was carried out under the following conditions. The original reaction system was determined by the preliminary experiment with the
PCR solution containing 5 ll 10 buffer,
2.5 mM MgCl2, 500 lM dNTP, 500 ng DNA template, 1 lM each primer, certain organic additives
at different concentrations and 0.5 ll Taq polymerase (5 U/ll) with the volume made to 50 ll
with sterilize water. The reaction was conducted
at 95 C for 10 min, 94 C for 30 s, 55 C for
30 s, 72 C for 1 min (40 cycles) and 72 C for
10 min, respectively.
Electrophoresis
Electrophoresis of amplification products was
done on 1% agarose gels in which 5 ll reaction
products were loaded with 0.5 ll 10 loading
buffer. Gels were run at 80 V for 40 min, stained
with ethidium bromide, visualized on a UV
transilluminator and documented by UVP Bioimaging System.
Amplification product purified from gel
The Ultra-Sep Gel Extraction Kit was used to
purify the amplification product according to
manufacturer’s recommendation.
Techniques for DNA manipulation
DNA manipulation techniques were carried out
according to standard protocols and instruction
kits, which include linkage of the amplification
product with the vector, transformation into E.
coli, screening of the positive clone and plasmid
preparation, etc.
Primer designing
DNA sequencing
Forward primer (5¢-GCTCGTACTCGTCGCT
CCCGGCCAG-3¢) and reversed primer (5¢-CGACATGGTCGCGACGGTCTCCTCG-3¢)
were
Amplification product was sequenced by Shanghai
Sangon Biological Engineering Technology and
Services Co., Ltd, China.
1279
Fig. 1. Effect of additive types on amplification. (a), DMSO; (b), methanamide; (c), glycerol (Lane M, DL2000 DNA marker; lane
1, PCR with no additive; lanes 2–6, PCR with additives at 1, 5, 10, 15 and 20% (v/v), respectively); (d), PCR at different pre-denaturation times (Lane M, DL2000 DNA marker; lane 1, 10 min; lane 2, 5 min).
Results and discussion
PCR enhancement by additives
GC content in the Streptomyces genome is over
70%. Higher energy is needed to melt DNA
chains otherwise primers cannot be coupled with
the template DNA for two chains combined together (Chenchik et al. 1996) and there will be
no amplification product. To lower the annealing
temperature to make it suitable for the annealing
between primers and template and favorable for
1280
DNA polymerase to go through the secondary
structure region, as well as to avoid the nonspecific amplification and the formation of primer dimer at the same time, some measures have
been taken, such as improving the denaturing
temperature, adding organic solvents including
formamide (Sarkar et al. 1990) dimethylsulfoxide
(DMSO) (Baskaran et al. 1996), glycerol (Pomp
and Medrano 1991) and betaine (Hengen 1997).
However, these methods are not always effective
for reasons that are still unclear. In our experiments, the pre-denaturation time was prolonged
to 10 min and the annealing temperature was increased from 55 to 70 C but there was no target
fragment amplified.
When glycerol and formamide were added
into the reaction system, no target fragment was
amplified (Figure 1a–c). Formamide slightly suppressed the dimer formation and non-specific
amplification. Glycerol only inhibited non-specific amplification. Amplification was evident
with DMSO at 5% (v/v) and was maximal at
15% (v/v). Above 15% or under 5% (v/v),
amplification was not observed. It is characteristic that the amount of the added DMSO was
higher in our system than in the normal reaction
system, and 15% (v/v) DMSO was used in the
subsequent experiments. Although 10% (v/v)
DMSO is the commonly used concentration for
amplifying high GC content DNA (Pomp and
Medrano 1991, Carmody et al. 2004) it is
changeable and adjustable according to the practical conditions.
When the pre-denaturation time was shortened to 5 min, the amplified product was detected
and its quantity changed little (Figure 1d). Therefore the pre-denaturation time was set at 5 min.
Effect of primer concentration on PCR
The optimal primer concentration is between 0.1
and 1.0 lM. If the primer concentration is too
high, it would lead to a mismatch between primer and template, non-specific amplification and
an increased chance of dimer formation. In our
experiments, a better yield and specificity of
amplified product were detected with each primer
at 1 lM, but there was dimer formation (Figure 2). When a pair of primers was used at
0.2 lM, no dimer formation was observed but the
amount of amplified product became less. The
Fig. 2. Effect of primer concentration on amplification reaction. Lane M, DL2000 DNA marker; lanes 1–5, PCR with
primers at 0.2, 1, 2, 3 and 4 lM, respectively.
suitable primer concentration was between 0.2
and 1 lM so 1 lM was used in the subsequent
experiments.
Effect of dNTP amount on PCR
In the amplification reaction, increased precision
of the reaction was obtained with a lower concentration of dNTP. When its concentration was
below 400 lM, the target amplification product
was not detected but reached its maximum at
500 lM (Figure 3). A higher concentration of
dNTP was unfavorable for PCR due to its combination with Mg2+ resulting in the shortage of
free Mg2+. In the normal PCR system, the
dNTP concentration ranged from 50 to 200 lM
but, in our system, the dNTP concentration was
as high as 500 lM, dramatically exceeding that
conventionally used.
Influence of Mg2+ on amplification
Mg2+ can alter the amount of amplification
product by changing DNA polymerase activity
and affect the reaction specificity by virtue of
changing the primer annealing temperature. The
optimal concentration of Mg2+ changes when
1281
Fig. 3. Effect of dNTP concentration on amplification. Lane
M, DL2000 DNA marker; lanes 1–5, PCR with dNTP at 100,
200, 300, 400 and 500 lM, respectively.
Fig. 4. Effect of Mg2+ on amplification. Lane M, DL2000
DNA marker; lanes 1–6, PCR with Mg2+ at 0.5, 1, 1.5, 2, 2.5
and 3 mM, respectively.
different primers, templates and different
amounts of dNTP are used. A high concentration of Mg2+ would increase the output and
non-specificity and decrease the fidelity. But the
yield may be reduced at low concentrations. In
our experiments, the best result was obtained at
2 mM Mg2+ (Figure 4).
reduce the possibility of mutant and ensure plentiful amplification product, 30–35 cycles are recommended in this PCR system.
Effect of template DNA concentration on PCR
In order to reduce the probability of mistakes produced by Taq polymerase and achieve a higher
quantity of amplified product, a higher concentration of DNA was used. If DNA content is too
high, it will increase contamination and reduce the
amplification efficiency. With the template concentration increased, the amount of amplification
product increased and peaked at 400 ng (Figure 5). So 400 ng was selected as the optimized
DNA concentration in the subsequent tests.
Influence of cycles on amplification
Figure 6 shows that amplification was evident
when the cycles reached 25 and the yield was
maximal at 35 cycles. In order to save energy,
Fig. 5. Effect of DNA amount on amplification reaction.
Lane M, DL2000 DNA marker, lanes 1–5: PCR with DNA
at 100, 200, 300, 400 and 500 ng, respectively.
1282
concentrations of DMSO and dNTP and lower
annealing temperature.
Acknowledgement
We wish to thank the ‘‘863’’ Hi-Tech Research
and Development Program of China (Grant No.
2001AA214081) and the National Natural Science Foundation of China (Grant No. 20425620)
for financial support.
References
Fig. 6. Effect of cycles on amplification. Lane M, DL2000
DNA marker; lanes 1–4, PCR with 25, 30, 35 and 40 cycles,
respectively.
In addition to the conditions discussed above,
the annealing temperature also influenced PCR.
The annealing temperature must be low enough
to ensure efficient annealing and high enough to
reduce non-specific combination between primer
and template. The reasonable annealing temperature should be between 55 and 70 C in the
normal PCR and should be higher in GC-rich
template DNA system. In this study, there was
no necessity for PCR to be carried out at a
higher annealing temperature because no specific
bonds were amplified at lower annealing temperature when DMSO was added.
In summary: the reaction system and conditions for amplification of this fragment in S.
luteogriseus were set up as follows: the PCR solution contained 5 ll 10 buffer, 2 mM MgCl2,
500 lM dNTP, 400 ng DNA template, each primer 1 lM, 2.5 U Taq polymerase and 7.5 ll
DMSO, with the volume brought to 50 ll with
sterilize water. The reaction was conducted at
95 C for 5 min, 94 C for 30 s, 55 C for 30 s,
72 C for 1 min (35 cycles) and 72 C for 10 min.
This protocol is unique in terms of the higher
Baskaran N, Kandpal RP, Bhargava AK, Glynn MW, Bale A,
Weissman SM (1996) Uniform amplification of a mixture of
deoxyribonucleic acids with varying GC content. Genome
Res. 6: 633–638.
Carmody M, Byrne B, Murphy B, Breen C, Lynch S, Flood E,
Finnan S, Caffrey P (2004) Analysis and manipulation of
amphotericin biosynthetic genes by means of modified phage
KC515 transduction techniques. Gene 343: 107–155.
Chakrabarti R, Schutt CE (2001) The enhancement of PCR
amplification by low molecular-weight sulfones. Gene 274:
293–298.
Chenchik A, Diachenko L, Moqadam F, Tarabykin V,
Lukyanov S, Siebert PD (1996) Full-length cDNA cloning
and determination of mRNA 5¢ and 3¢ ends by amplification
of adaptor-ligated cDNA. Biotechniques 21: 526–534.
Hengen PN (1997) Optimizing multiplex and LA-PCR with
betaine. Trends Biochem. Sci. 22: 225–226.
Hopwood DA, Bibb MJ, Chater KF, Kieser T, Bruton CJ,
Kieser HM, Lydiate DJ, Smith CP, Ward JM, Shrempf H
(1985) Genetic Manipulation of Streptomyces: A Laboratory
Manual. Norwich: John Innes Foundation.
Izumikawa M, Murata M, Tachibana K, Ebizuka Y, Fujii I
(2003) Cloning of modular type I polyketide synthase genes
from salinomycin producing strain of Streptomyces albus.
Bioorg. Med. Chem. 11: 3401–3405.
Pomp D, Medrano JF (1991) Organic solvents as facilitators of
polymerase chain- reaction. Biotechniques 10: 58–59.
Rodrigue E, Hu Z, Ou S, Volchegursky Y, Hutchinson CR,
McDaniel R (2003) Rapid engineering of polyketide overproduction by gene transfer to industrially optimized strains.
J. Ind. Microbiol. Biotechnol. 30: 480–488.
Sarkar G, Kapelner S, Sommer SS (1990) Formamide can
dramatically improve the specificity of PCR. Nucleic Acids
Res. 18: 7465.
Wang ZP, (2004) Study on isolation, identification, bioactivity
and biosynthesis of Maituolaimycin inhibiting HIV PR and
CVB6. PhD Thesis. Tianjin, China: Tianjin University.
Weber T, Welzel K, Pelzer S, Vente A, Wohlleben W (2003)
Exploiting the genetic potential of polyketide producing
streptomycetes. J. Biotechnol. 106: 221–232.
Springer 2005
Biotechnology Letters (2005) 27: 1283–1290
DOI 10.1007/s10529-005-0220-8
Molecular cloning and tissue distribution of SF-1-related orphan receptors
during sexual maturation in female goldfish
Cheol Young Choi1,* & Hamid R. Habibi2
1
Division of Marine Environment & Bioscience, Korea Maritime University, 606-791, Busan, Korea
Department of Biological Sciences, University of Calgary, T2N 1N4, Calgary, Alberta, Canada
*Author for correspondence (Fax: +82-51-404-3988; E-mail: [email protected])
2
Received 18 April 2005; Revisions requested 2 May 2005; Revisions received 15 June 2005; Accepted 16 June 2005
Key words: cDNA cloning, goldfish, RT-PCR, SF-1, tissue distribution
Abstract
The steroidogenic factor (SF)-1 gene is one of a number of orphan nuclear receptors, which is a key
transcriptional regulator in vertebrate reproduction. We have isolated the SF-1 homologue cDNA from the
goldfish pituitary and designed primers for SF-1 on the basis of the highly conserved regions of various
known SF-1 superfamily genes. SF-1 cDNA contained 1,948 nucleotides including an open reading frame
predicted to encode a protein of 503 amino acids. The distribution pattern of SF-1 in a variety of tissues
during sexual maturation in female goldfish was also examined by RT-PCR. Significant variations in the
relative expression of SF-1 were observed in different tissues in immature and mature female goldfish. SF-1
transcript in pituitary was significantly higher than other tissues tested in immature and mature female
goldfish. Lower expression of SF-1 was observed in the liver but was not detected in brain and ovary of the
immature female goldfish. Presence of SF-1 was the predominant expression in the pituitary and brain of
mature female goldfish. Also, in the mature female goldfish, a weak transcript was detected in liver and
ovary. Interestingly, RT-PCR analysis revealed that the expression of SF-1 became higher in the brain and
weaker in the liver in maturing female goldfish. Thus, SF-1 may be regulated in goldfish brain and/or liver.
Thus is also tissue-specific distribution of SF-1 during sexual maturation in female goldfish.
Introduction
Many transcriptional factors in the orphan nuclear receptor superfamily have recently been
cloned. Fushi tarazu transcription factor-1 (FTZF1), a member of an orphan nuclear receptor is
important transcriptional regulator of the fushi
tarazu home box gene in Drosophila (Yu et al.
1997). After the isolation of Drosophila FTZ-F1
cDNA, many FTZ-1 homologues such as bovine
(Honda et al. 1993), rat (Galarneau et al. 1996),
chicken (Kudo & Sutou 1997), frog (Kawano
et al. 1998) and human (Galarneau et al. 1998)
were reported. Recent sequence alignments also
support the existence of the orphan nuclear receptors in teleost fish (Liu et al. 1997, Watanabe
et al. 1999, Chai & Chan 2000). Vertebrate FTZF1 homologues were mainly classified into two
subgroups by phylogenetic tree analysis (Nakajima et al. 2000) and/or based on function, tissue
distribution (Galarneau et al. 1996, Hofsten et al.
2001). One is a subgroup of SF-1/Ad4BP (Steroidogenic factor-1/adrenal 4-binding protein), and
the other is that of LRH/FTF (Liver receptor
homologue protein/a1-fetoprotein transcription
factor).
The SF-1 is expressed in the adrenal cortex and
gonads (Honda et al. 1993) in which steroid hormones are synthesized. SF-1 is essential for development of the steroidogenic organs, a role that
has been extended to all levels of the hypothalamic-pituitary-gonadal axis (Ingraham et al.
1284
1994, Manglesdorf et al. 1995). Moreover, the
expression is maintained in male embryos during
testis differentiation, but declines in female embryos just after the onset of ovarian differentiation, although it increases in females in late
embryogenesis (Ikeda et al. 1994). In chicken, SF1 expression during ovarian differentiation increases, which is opposite to the pattern seen in
mammals, where it decreases in females (Smith
et al. 1999).
Mammalian LRH receptors regulate a1-fetoprotein expression and are located in endodermal
cells in pancreas and liver (Galarneau et al.
1996).
Nuclear receptors are composed of several
homologous modular domains. The members of
this superfamily have a number of common features and their proteins can be divided into distinct domains: an amino-terminal activation
domain, a central to the function of these proteins is the highly conserved DNA-binding domain (DBD). The second most conserved region
is referred to as the ligand-binding domain
(LBD) which mediates ligand-induced transactivation and participates in receptor dimerization
(Mangelsdorf et al. 1995). Moreover, the region I
functions as the DBD contains the two zinc finger motifs and has the activity of binding to hormone response elements, and the regions II and
III as the LBD/dimerization domain (Honda
et al. 1993).
RT-PCR analysis of various zebrafish tissues
indicated preferential expression of the SF-1
mRNA in liver, followed by brain, testis and lower
expression in ovary (Liu et al. 1997). Studies by
Hofsten et al. (2001) demonstrated the presence of
the Medaka SF-1 and its predominant expression
in the ovary. However, no information is available
on the sequence and RT-PCR analysis of various
tissues indicated preferential expression of SF-1
homologues mRNA in goldfish.
The objectives of this study were to characterize the SF-1 homologues cDNA and investigate
its tissue distribution in goldfish as a step to towards understanding the molecular mechanisms
of SF-1 homologues action. The results also provide for the first time a comparison of the tissue
distribution of SF-1 homologues mRNA during
sexual maturation in female goldfish.
Materials and methods
Animals
Goldfish (Carassius auratus) ranged from 10 to
13 cm in length were purchased from Aquatic
Imports (Calgary, Alberta, Canada), and kept at
17–18 C in a semi-recirculating tank. The light
regime was 16 h light, 8 h dark photoperiod.
Goldfish were anesthetized with 3-aminobenzoic
acid ethyl ester (Sigma) and killed in accordance
with the principles and guidelines of the Canadian Council of Animal Care. The gonads were
removed and weighted for calculated of the gonadosomatic index (GSI = gonad weight/body
weight 100). Tissue samples from female goldfish at sexually immature (GSI: 4.5–6.0) and mature stages (GSI: 18.5–22.0) which were removed,
and stored at )80 C until used.
Isolation of the SF-1 homologues cDNA
Two highly conserved regions of the chicken
(Gallus gallus) FTZ-F1 (Kudo & Sutou 1997),
frog (Rana rugosa) SF-1 (Kawano et al. 1998)
and medaka (Oryzias latipes) FTZ-F1 (Watanabe
et al. 1999) were design mixed primers for the
polymerase chain reaction (PCR).
One of the regions is located at the DBD domain [primer 1: 5¢-ACAAGTTTGG(G/C)CCC
ATGTAC-3¢], and the other at the LBL domain
[primer 2: 5¢-AGGTGCTTGTGGTA(C/G)AGGTA-3¢] (Figure 1). Total RNA was extracted
from each tissue using an RNAgents Total RNA
Isolation System (Promega, Madison, WI),
according to manufacturer’s instructions. One lg
of total RNA was used for cDNA synthesis as
described by Choi and Habibi (2003). Amplification was performed as previously described (Choi
& Habibi 2003) using Taq DNA polymerase
(Promega) and PCR for 38 cycles of 45 s at
94 C, 45 s at 54 C, and 1 min at 72 C, except
that the first denaturation was carried out for
3 min and the last elongation reaction for 5 min.
After electrophoresis on 1% TAE-agarose gels,
the DNA fragment was excised and ligated into
the pGEM-T Easy Vector (Promega) according
to the manufacture’s instructions, and sequenced.
1285
Fig. 1. Cloning and sequencing strategy for the goldfish (Carassius auratus) orphan nuclear receptor steroidogenic factor (SF)-1
cDNA using the 5¢/3¢ RACE and RT-PCR. The open bar indicates the open reading frame (ORF). Arrows indicate the relative
location and direction of primers.
Rapid amplication of cDNA 3¢ ends (3¢ RACE)
The 3¢ RACE technique was used to obtain sequences downstream of the PCR product using
3¢ RACE System (Version 2.0 kit, Gibco/BRL).
First-strand cDNA synthesis was initiated at the
poly (A)+ RNA using the oligo (dT) anchor primer [5¢-TGGAAGAATTCGCGGCCGCAGGA
AT18-3¢]. The 3¢ RACE-PCR product was amplified by PCR using gene specific primers [primer
3: 5¢-TTACGTGGAGAGCGTGTACG-3¢] and
[3¢ RACE adaptor primer: 5¢-TGGAAGAATTC
GCGGCCGCAG-3¢] (Figure 1) under the following conditions; 0.2 lg cDNA as template,
10 lM primer 3 and 3¢ RACE adaptor primer,
10 mM of each dNTP, and Taq DNA polymerase
(5 U/ll, Promega) in 50 ll buffer. Nested
PCR was performed using 35 cycles of 94 C for
45 s for denaturing, 57 C for 45 s for primer
annealing, and 72 C for 1 min for extension,
followed by final 1 cycle of 5 min at 72 C for
extension. The final PCR product was amplified
and T-A cloned into pGEM-T Easy Vector, and
sequenced.
Rapid amplication of cDNA 5¢ end (5¢ RACE)
The 5¢ RACE System (Version 2.0 kit, Gibco/
BRL) was employed to obtain transcript
sequences upstream of the PCR product. Five
micrograms of total RNA was reverse transcribed
according to the kit protocol using a gene specific
primer [primer 4; 5¢-GTCGACGTATGTGTA-3¢]
located within the coding sequence (Figure 1). For
the 5¢ RACE-PCR, two gene specific primers, [primer 5; 5¢-CTGGTGTAGTGCTCTCAGCTT-3¢]
and [primer 6; 5¢-ACGCCGGGTACTGTG
CTGGCA-3¢], were designed (Figure 1). The 5¢
RACE-PCR was carried out using primer 5 and
the oligo(dG) anchor primer [5¢-GGCCACG
CGTCGACTAGTACGGGIIGGGIIGGGIIG-3¢]
included in the kit. Second amplication was conducted using primer 6 and 5¢ RACE adaptor primer
[5¢-GGCCACGCGTCGACTAGTAC-3¢]
under the same conditions as 3¢ RACE nested amplication (Figure 1). Additional controls that amplify dC-tailed cDNA using each primer
individually (either primer 6 or 5¢ RACE adaptor
primer) were used to identify nonspecific products.
The final nested PCR product was amplified and
cloned, and the DNA sequence was analyzed
using the GENETYX-WIN (Software Develop.
Co., Japan) software package.
Reverse transcriptase-polymerase chain reaction
(RT-PCR)
For the RT-PCR, two specific primers were used
to amplify SF-1 cDNA as follows: [primer 7;
5¢-ACTACAGCTATGGCACGGAC-3¢]
and
[primer 8; 5¢-AGATGCAGGTTCTCTTGGCA3¢] (Figure 1). First, cDNA was synthesized from
1 lg total RNA from brain, pituitary, ovary and
liver of goldfish. RT reactions were done with reverse transcribed with an oligo(dT) primer and
M-MLV reverse transcriptase (Gibco/BRL). The
reaction mixture was activated at 94 C for
3 min, 38 reaction cycles were conducted as follows: 45 s denaturing at 94 C, 45 s annealing at
54 C, and 1 min extension at 72 C, followed by
1 cycle of 5 min extension at 72 C. Fifteen lg of
each PCR products were electrophoresed on 1%
TAE-agarose gels, with a 1 kb plus DNA ladder
1286
(Gibco/BRL) used as a reference to estimate the
molecular weights of the amplified fragments.
High-resolution scanner carried out quantification of PCR amplified fragment and the band
densities were estimated using NIH image software (NIH, Bethesda, MD). As a control for
loading, in each case the loading was controlled
by amplification of goldfish b-actin. The densitometry process from ethidium bromide stained
gel was optimized for linearity as described in a
previous study (Choi & Habibi 2003).
Statistical analysis
The results were presented as the mean ± the
standard deviations (SD), and were analyzed by
a one-way ANOVA followed by the Duncan’s
multiple range tests were applied for statistical
analysis. The means were considered statistically
different if p < 0.01.
Results
Cloning and characterization of the goldfish
SF-1 cDNA
We designed a set of nucleotide primers based on
the nucleotide sequence, which is highly conserved regions of known various species, as described in Materials and methods. One major
PCR fragment (1169 base pair) was amplified
from the goldfish pituitary and was separated by
electrophoresis. Goldfish SF-1 cDNA generated
by the 3¢ and 5¢ RACE procedures were subsequently combined to generate a full-length
cDNA sequence. The 1,948 bp cDNA had an
open reading frame (ORF) of 1,509 bp that began with the first ATG codon at position 22 bp
and ended with a TGA stop codon at position
1,531 bp (accession number AF526537). A putative polyadenylation signal AATAAA (Proudfoot
& Brownlee 1976) occurred at position 1,908 bp
(accession number AF526537).
SF-1 cDNA has a related high homology with
the other species as follow: medaka (O. latipes)
FTZ-F1 (66.9% identity and 82.3% similarity)
(Watanabe et al. 1999), frog (R. rugosa) FTZF1b (63.2% identity and 81.4% similarity) (Nakajima et al. 2000), chicken (G. gallus) FTZ-F1
(62.9% identity and 82.1% similarity) (Kudo &
Sutou 1997) and zebrafish (D. rerio) FTZ-F1b
(61.6% identity and 78.4% similarity) (Chai &
Chan 2000) are shown in Figure 2.
The zinc fingers which are in region I (DBD
domain); regions II and III are located in the LBD
domain. When amino acid sequences of these domains are aligned with those of FTZ-F1 homologues cDNA of other species, regions I and II are
appeared to high similarity. Goldfish SF-1 contains a high degree of conservation in the region I
(90.9–97.0% identity), region II (92.9–100% identity) and region III (56.5–73.9% identity) when
compared to medaka FTZ-F1, zebrafish FTZ-F1,
zebrafish FTZ-F1b, chicken FTZ-F1 and frog
FTZ-F1b (Figure 2). Apart from the regions I–III,
this receptor subclass has a characteristic conserved amino acid sequence, called the FTZ-F1
box (Figure 2). It lies adjacent to the zinc fingers
are required for high affinity and sequence-specific
binding. The FTZ-F1 box is 30 amino acids and is
100% identical among medaka FTZ-F1, zebrafish
FTZ-F1, chicken FTZ-F1 and frog FTZ-F1b,
except for zebrafish FTZ-F1b (Figure 2)
Tissue distribution of the goldfish SF-1
Using RT-PCR, we investigated the expression
of SF-1 mRNA in various tissues in female goldfish at sexually immature and mature stage. The
expression of b-actin was monitored in all tissues
and used as control to normalize for loading.
Lower expression of SF-1 was observed in the
liver, but extremely low expression was detected
in brain and ovary of the immature female goldfish. SF-1 mRNA was very highly expressed in
mature female goldfish pituitary and brain, followed by liver which, was lower expressed in
ovary (Figure 3).
Homologies of goldfish SF-1 with other species
of nuclear hormone receptor subfamily
Discussion
Homological analyses using the GenBank and
the EMBL general database searches indicated
that the amino acid sequence of the goldfish
Mammalian reproductive function is regulated by
the hypothalamic-pituitary-gonadal axis. SF-1 is
1287
Fig. 2. Deduced amino acid comparisons of the goldfish (Carassius auratus) SF-1. Goldfish amino acid sequences are compared
with the deduced amino acid sequences of the medaka (Oryzias latipes) FTZ-F1, zebrafish (Danio rerio) FTZ-F1, zebrafish (D. rerio) FTZ-F1b, chicken (Gallus gallus) FTZ-F1 and frog (Rana rugosa) FTZ-F1b. The sequences were taken from the GenBank/
EMBL/DDBJ sequence databases. SF-1 homologues sequences used for alignment are goldfish SF-1 (gfSF-1, AF526537), medaka
FTZ-F1 (mFTZF1, AB026834), zebrafish FTZ-F1 (zFTZF1, AF014926), zebrafish FTZ-F1b (zFTZFb, AF198086), chicken FTZF1 (cFTZF1, AB002404) and frog FTZ-F1b (fFTZF1, AB035499). To aid comparisons, functional motifs as described by Wong
et al. (1996) are indicated; regions I-III, P box, D box, FTZ-F1 box and the activation function (AF)-2 motif. Gaps in the sequences are indicated as dashes. Dots indicate residues identical to those of gfSF-1.
1288
essential for gonadal development and function,
implicates SF-1 as important regulatory role in
the reproductive system (Ingraham et al. 1994).
This study provides the complete coding sequence of the SF-1 cDNA in the goldfish
pituitary. The goldfish SF-1 cDNA was found to
contain an open reading frame of 1509 nucleotides encoding a protein of 503 amino acids.
SF-1 proteins have three conserved regions. The
region I functions as the DBD contains the zinc
finger motifs and has the activity of binding to
hormone response elements, and the regions II
and III as the LBD (Honda et al. 1993). The zinc
finger motifs of the steroid hormone receptor
superfamily have two functional domains; the socalled P and D boxes. Region I recognizes and
binds the specific sequences of target genes, the
expression of which is regulated by the nuclear
receptor. The P box in the first zinc finger distinguishes between the sequences of hormone response elements. Goldfish SF-1 was found to be
a P box, which is positioned at the base of the
zinc finger, and is ESCKG in all FTZ-F1 boxcontaining receptors. The D box in the second
zinc finger recognizes the spacing of those elements. Furthermore, the two sequences in the
putative LBD, called region II and III, have been
used to classify nuclear hormone receptor (Wang
et al. 1989). Region II is highly conserved and
region III is less conserved (Figure 2).
Some studies revealed that transcriptionally
active FTZ-F1 homolog in vertebrate showed
conserved activation function (AF)-2 motif sequence, LLIEML, is located in LBD at amino
acid 491–496 (Figure 2), indicating that transcriptional activation is dependent on ligand binding
as reported previously (Tora et al. 1989). Galarneau et al. (1996) reported that complete removal
of the AF-2 motif from the LBD of rat LRH-1
also caused the loss of its trans-activation
function. This result suggests that the transcriptional activities of the members of the FTZ-F1
Fig. 3. One microgram of total RNA prepared from brain (B), pituitary (P), ovary (O), liver (L) and control as a no tissue (N)
were reverse transcribed and amplified in immature and mature male goldfish using SF-1 specific primer. Tissue distribution of
goldfish SF-1 was analyzed by RT-PCR. The expression of b-actin mRNA was evaluated in each RT reaction product as a loading
control. The expression level of each tissue was normalized with respect to the b-actin signal, and expressed as relative expression
level. An asterisk indicates a significant difference compared between immature and mature goldfish (p < 0.01). Values are
mean ± the standard deviations of these four experiments, each using separate female goldfish.
1289
subfamily are mainly due to their C-terminal
regions.
SF-1 is apparently able to stimulate the synthesis of not only corticosteroids, such as glucocorticoids, in the adrenal cortex but also the
production of estrogens and androgens in the
ovary and testis by activating the expression of
the enzymes that synthesize precursors to these
hormones and by increasing the expression of
aromatase (Lynch et al. 1993), which conducts
bioconversion of androgens to estrogens. Additionally, it is also able to indirectly control the
synthesis of primary steroid sex hormones by
acting at the pituitary level to influence the
expression of the gonadotropin hormone genes
(Barnhart & Mellon 1994).
In this study, we also compared the expression pattern of SF-1 in a variety of tissues in female goldfish at immature and mature stage by
RT-PCR. Lower expression of SF-1 was observed in the liver, but not detected in brain and
ovary of the immature female goldfish. Presence
of SF-1 was the predominant expression in the
pituitary and brain of mature female goldfish.
Also, in the mature female goldfish, weak transcript was detected in brain and ovary. Interestingly, RT-PCR analysis revealed that the
expression of goldfish SF-1 became higher in the
brain and weaker in the liver during maturing female, respectively (Figure 3). This agrees with a
previous report (Kawano et al. 1998) that high
expression of mature frog FTZ-F1 mRNA was
detected in the brain, but not ovary. Interestingly, mature female goldfish liver SF-1 mRNA
levels were decreased significantly compared to
immature female goldfish. Taken together, these
data indicate a global role for FTZ-F1 at each
stages of liver and gonadal function.
On the other hand, the FTZ-F1 gene family
constitutes a subgroup of orphan nuclear receptors, which can be divided into two groups,
LRH/FTF (liver receptor homologue protein/afetoprotein transcription factor) and SF-1, based
on function, tissue distribution (Galarneau et al.
1996, Hofsten et al. 2001) and phylogenetic tree
analysis (Nakajima et al. 2000). In zebrafish,
however, Hofsten et al. (2001) demonstrated that
while the expression in liver is indicative of a
LRH/FTF function, the expression in other tissues, such as the pituitary, brain and gonad is
indicative of SF-1 function. Moreover, amino
acid sequences in the regions I and II of goldfish
SF-1 showed high similarity to not only LRH
but also SF-1, suggesting the importance of each
region for the function of these proteins. In these
observations, coupled with obtained expression
patterns, indicate that goldfish FTZ-F1 homologues exhibit characteristics that are indicative
of both LRH/FTF- and SF-1-like genes, may
have other developmental roles in goldfish. SF-1
mRNA was strongly expressed in immature and
mature goldfish pituitary. SF-1 regulates the
activity of steroidogenic enzyme in bovine adrenal cells and luteal cells (Liu & Simpson 1997).
Therefore, SF-1 may also control steroidogenesis
in goldfish pituitary.
Interestingly, RT-PCR analysis revealed that
the expression of goldfish SF-1 was found in the
goldfish liver but it became weaker in the liver of
mature female goldfish. The findings suggest that
SF-1 homologues may plays an important roles
in the regulation of liver function since it is particularly less expression in developing female
goldfish liver. Moreover, at present, little information is available on the relative importance of
SF-1 homologues in the regulation of vitellogenesis and reproduction in goldfish and other teleosts species. The present results are in accord with
findings in mammals and other vertebrates concerning tissue specific expression of SF-1 homologues. Information obtained in this study on
tissue distribution of SF-1 homologues provides
a framework for better understanding of physiological significance of these groups of the orphan
nuclear receptor in goldfish. The significance of
these findings remains to be investigated as more
information on regulation of brain and liver, and
seasonal variation of SF-1 homologues because
available in goldfish and other vertebrates.
Acknowledgement
This work was supported by a grant from the
Natural Sciences and Engineering Research
Council of Canada.
References
Barnhart KM, Mellon PL (1994) The orphan nuclear receptor,
Steroidogenic factor-1, regulates the glycoprotein hormone
1290
a-subunit gene in pituitary gonadotropes. Mol. Endocrinol. 9:
878–885.
Chai C, Chan W-K (2000) Developmental expression of a novel
FTZ-F1 homologue, ff1b (NR5A4), in the zebrafish (Danio
rerio). Mech. Develop. 91: 421–426.
Choi CY, Habibi HR (2003) Molecular cloning of estrogen
receptor a and expression pattern of estrogen receptor
subtypes in male and female goldfish. Mol. Cell Endocrinol.
204: 169–177.
Galarneau L, Pare J-F, Allard D, Hamei D, Levesque L,
Tugwood JD, Green S, Belanger L (1996) The a-1 fetoprotein locus is activated by a nuclear receptor of the Drosophila
FTZ-F1 family. Mol. Cell Biol. 16: 3853–3865.
Galarneau L, Drouin R, Belanger L (1998) Assignment of the
fetoprotein transcription factor gene (FTF) to human
chromosome band 1q32.11 by in situ hybridization. Cytogenet. Cell Genet. 82: 269–270.
Hofsten JV, Jones I, Karlsson J, Olsson P-E (2001) Developmental expression patterns of FTZ-F1 homologues in zebrafish (Danio rerio). Gen. Comp. Endocrinol. 121: 146–155.
Honda S, Morohashi K, Nomura M, Takeya M, Kitajima M,
Omura T (1993) Ad4BP regulating steroidogenic P-450 gene
is a number of steroid hormone receptor superfamily. J. Biol.
Chem. 268: 7498–7502.
Ikeda Y, Shen WH, Ingraham HA, Parker KL (1994) Developmental expression of mouse steroidogenic factor-1, an
essential regulator of the steroid hydroxylases. Mol. Endocrinol. 8: 654–662.
Ingraham HA, Lala DS, Ikeda Y, Luo X, Shen WH, Nachtigal
MW, Abbud R, Nilson JH, Parker KL (1994) The nuclear
receptor SF-1 acts multiple levels of the reproductive axis.
Genes Dev. 8: 2302–2312.
Kawano K, Miura I, Morohashi K, Takase M, Nakamura M
(1998) Molecular cloning and expression of the SF-1/Ad4BP
gene in the frog. Rana Rugosa. Gene 222: 169–176.
Kudo T, Sutou S (1997) Molecular cloning of chicken FTZ-F1related orphan receptors. Gene 197: 261–268.
Liu D, Le Drean Y, Ekker M, Xiong F, Hew CL (1997) Teleost
FTZ-F1 homolog and its splicing variant determine the
expression of the salmon gonadotropin II beta subunit gene.
Mol. Endocrinol. 11: 877–890.
Liu Z, Simpson ER (1997) Steroidogenic factor 1 (SF-1) and
sp1 are required for regulation of bovine CYP11A gene
expression in bovine luteal cells and adrenal Y1 cells. Mol.
Endocrinol. 11: 127–137.
Lynch JP, Lala DS, Peluso JJ, Luo W, Parker KL, White BA
(1993) Steroidogenic factor 1, an orphan nuclear receptor,
regulates the expression of the rat aromatase gene in gonadal
tissues. Mol. Endocrinol. 7: 776–786.
Mangelsdorf DJ, Thummel C, Beato M, Herrlich P, Schutz G,
Umesono K, Blumberg B, Kastner P, Mark M, Chambon P,
Evans RM (1995) The nuclear receptor superfamily: the
second decade. Cell 83: 835–839.
Nakajima T, Takase M, Nakamura M (2000) Two isoforms of
FTZ-F1 messenger RNA: molecular cloning and their
expression in the frog testis. Gene 248: 203–212.
Proudfoot NJ, Brownlee GG (1976) 3¢ Non-coding region
sequences in eukaryotic messenger RNA. Nature 263:
211–214.
Smith C, Smith MJ, Sinclair AH (1999) Expression of chicken
steroidogenic factor-1 during gonadal sex differentiation.
Gen. Comp. Endocrinol. 113: 187–196.
Tora L, White J, Brou C, Tasset D, Webster N, Scheer E,
Chambon P (1989) The human estrogen receptor has two
independent nonacidic transcriptional activation functions.
Cell 59: 477–487.
Wang LH, Tsai SY, Cook RG, Beattie WG, Tsai MJ,
O¢Malley BW (1989) COUP transcription factor is a
member of the steroid receptor superfamily. Nature (London) 340: 163–166.
Watanabe M, Tanaka M, Kobayashi D, Yoshiura Y, Oba Y,
Nagahama Y (1999) Medaka (Oryzias latipes) FTZ-F1
potentially regulates the transcription of P-450 aromatase
in ovarian follicles. cDNA cloning and functional characterization. Mol. Cell Endocrinol. 149: 221–228.
Wong M, Ramayya MS, Chrousos GP, Driggers PH, Parker
KL (1996) Cloning and sequence analysis of the human gene
encoding steroidogenic factor-1. J. Mol. Endocrinol. 17:
139–147.
Yu Y, Li W, Su K, Yussa M, Han W, Perrimon N, Pick L
(1997) The nuclear receptor Ftz-F1 is a cofactor for the
Drosophila homeodomain protein Ftz. Nature 385: 552–555.
Ó Springer 2005
Biotechnology Letters (2005) 27: 1291–1294
DOI 10.1007/s10529-005-0221-7
Enhancement of isoflavone synthase activity by co-expression of P450
reductase from rice
Dae Hwan Kim1, Bong Gyu Kim1, Hyo Jung Lee1, Yoongho Lim1, Hor Gil Hur2 &
Joong-Hoon Ahn1,*
1
Bio/Molecular Informatics Center, Department of Molecular Biotechnology, Konkuk University, 143-701,
Seoul, Korea
2
Department of Environmental Science and Engineering and International Environmental Research Center,
Kwangju Institute of Science and Technology, Gwangju, Korea
*Author for correspondence (Fax: +82-2-3437-6106; E-mail: [email protected])
Received after revisions 20 June 2005; Accepted 20 June 2005
Key words: cytochrome P450, cytochrome P450 reductase, Saccharomyces cerevisiae, secondary
metabolism
Abstract
Plant cytochrome P450s interact with a flavoprotein, NADPH-cytochrome P450 reductase (CPR), to
transfer electrons from NADPH. The gene for rice P450 reductase (RCPR) was cloned and expressed in
Saccaromyces cerevisiae, where the specific activity of the expressed RPCR was 0.91 U/mg protein. When
isoflavone synthase gene (IFS) from red clover, used as a model system of plant cytochrome P450, was
co-expressed with RCPR in yeast, the production of genistein from naringein increased about 4.3-fold,
indicating that the RCPR efficiently interacts with cytochrome P450 to transfer electrons from NADPH.
Introduction
Cytochrome P450 monooxygenases (P450s) play a
critical role in many biosynthetic pathways,
including the detoxification of exogenous compounds. For example, in animals, P450s are
involved in drug, steroid and fatty acid metabolism. In plants, their activity mediates the synthesis of lignins, UV protectants, pigments, defense
compounds, fatty acids, hormones, and signaling
molecules, as well as the catabolism of herbicides,
insecticides, and pollutants (Schuler & WerckReichhart 2003). The biological functions of P450s
rely on an electron donor, NADPH-cytrochrome
P450 reductase (CPR). CPR transfers two electrons from NADPH to P450s (Porter et al. 1987).
From the genome sequences, Arabidopsis has
273 P450s and rice more than 300, though the
function of most of these is unknown. The
development of an in vitro assay would be a critical
step an in analyzing the function of individual
P450s. Our group has been interested in the
functional characterization of P450s from rice
and we have now developed an in vitro assay system in which CPR from rice was cloned and
expressed in Saccharomyces cerevisiae. Then,
isoflavone synthase, a plant P450, was expressed
together with CPR in the yeast to enhance the
P450 activity.
Materials and methods
Cloning of rice CPR gene and CPR assay
A reverse-transcriptase polymerase chain reaction
(RT-PCR) was carried out to clone the CPR
gene from rice with primers of the following
sequences: CAACCAAACCCTCGCTTC as forward primer and GCTAGAGCGAGCTATTTC
1292
TGAAS as reverse primer. The resulting PCR
product was subcloned into pGMET vector (Promega, Madison, WI, USA) and sequenced. For
the in vitro rice CPR enzyme assay, a cytochrome
c reductase [NADPH] assay kit (Sigma) was
used. The rate of reduction was calculated by
differential absorption at 550 nm (Ro et al.
2002). One unit of activity was defined as the
amount of CPR produced for the reduction of
1 lmol cytochrome c per min.
Functional expression of rice CPR
in Saccharomyces cerevisiae
To subclone the rice CPR gene into the pESCHis vector (Stratagene, La Jolla, CA, USA), two
new primers were synthesized: a forward primer,
containing the initiation codon ATGGCGC
TGGCGCTGGA, a reverse primer, contained a
restriction enzyme site SpeI (ACTAGT), and a
stop codon ATACTAGTTCACCATACGTCAC
GGAGCCTGC. PCR was carried out with Pfu
Taq polymerase (Stratagene, La Jolla, CA, USA)
and the resulting PCR product was digested with
SpeI. The pESC-His vector was cut with EcoRI,
blunted with Klenow enzyme, digested with SpeI,
and then used for the ligation. Expression of
RCPR was followed according to manufacture’s
instructions. Microsomes from the transformant
were isolated by the method of Stansfield & Kelly
(1996).
Microsomal protein (1 mg), containing either
isoflavone synthase (IFS) or IFS plus RCPR
mixed with 1 mM NADPH and 100 lM naringenin, was incubated at 30 °C for 2 h. The reaction
mixture was extracted twice with ethyl acetate;
the solvent was then evaporated in vacuo and the
residue was dissolved in methanol. Analysis of
flavonoid was by HPLC as described in Kim
et al. (2002). Concentrations of naringenin and
geninstein were determined from a standard curve
calculated with various known concentrations of
both compounds against the peak area detected
on HPLC. For both compounds, the standard
HPLC detection curve was linear up to 1 lmol.
Results and discussion
The rice genome database was searched
with Arabidopsis CPR gene (GenBank accession
number X66016) to find rice CPR. Several rice
genes, which showed homology with Arabidopsis
CPR, were found and some of them were annotated as cytochrome P450 reductase. Among
them, one gene (XP_474161, RCPR) showing the
highest homology was cloned by RT-PCR. The
RCPR consists of a 2088-bp open reading frame.
The predicted protein has domains that are commonly found in other CPR; FMN, FAD, and
NADPH binding domains. It showed 82% identity with NADPH-cytochrome P450 reductase
(AAG17471) from Triticum aestivum and 72%
with that from Populus balsamifera subsp.
trichocarpa Populus deltoids (AAK15259).
To express the RCPR in yeast, it was cloned
into the pESC-His vector under the control of a
galactose-inducible promoter and the resulting
construct was transformed into S. cerevisiae INVSc1 (his-, leu-, trp-, ura-). Transformants that
grew in the absence of histidine were selected. As
a control, the pESEC-His vector was transformed into the same yeast strain. From four
independent yeast transformants, containing
either RCPR or the expression vector, microsomes were isolated and CPR activity measured
by reduction of cytochrome c. Specific activity of
the crude RCPR from the four dependent transformants ranged from 1.12 to 1.32 lmol min)1
mg)1 with an average of 1.21 lmol min)1 mg)1,
while yeast, containing the vector only, showed a
specific activity of 0.28–0.35 lmol min)1 mg)1,
with an average of 0.31. Thus, specific activity of
the expressed RCPR was 0.9 lmol min)1 mg)1.
The reduction of cytochrome c by recombinant
rice CPR protein was dependent on NADPH,
but not on NADH, as shown in other CPRs
(Koopmann & Hahlbrock 1997, Mizutani &
Ohta 1998). Therefore, based on the in vitro
enzyme assays, we can conclude that the RCPR
cDNA encodes functional rice CPR enzyme.
As endogenous CPR activity is a limiting factor in yeast when foreign P450s are overexpressed (Urban et al. 1994), we determined
whether the expressed rice CPR activity enhanced cytochrome P450 activity in yeast. IFS
from red clover was used as a model system of
plant cytochrome P450. In a previous study
(Kim et al. 2003), it was shown that IFS
expressed in yeast could convert naringenin into
genistein. The yeast strain containing RCPR was
retransformed with an IFS construct (Figure 1).
pG
AL
1
IFS (P450)
pYES2
URA 3
pG
AL
10
1293
RCPR
pESC-HIS
HIS 3
S.cerevisiae
(His3-, Leu2-, Trp1-, Ura3-)
Fig. 1. Co-expression strategy of isoflavone synthase (IFS) and
rice cytochrome P450 reductase (RCPR) in Saccharomyces
cerevisiae. IFS converts naringenin into genistein. RCPR transfers two electrons from NADPH to IFS. RCPR, with his3 gene
as a selection marker, was transformed into S. cerevisiae and
then IFS, a plant P450, with ura3 gene as a selection marker,
was transformed again into the yeast strain that was originally
transformed with RCPR.
The resulting transformants were selected on
uracil- and histidine-deleted media, since the IFS
construct contains the ura3 gene as a selection
marker. Several transformants were analyzed for
the presence of the constructs, RCPR and IFS.
As a control, a yeast transformant, containing
only IFS, was generated. Microsomes from three
independent transformants, with either IFS or
IFS and RCPR, were isolated, respectively and
IFS activity was measured.
The reaction product was analyzed with HPLC
to determined whether a reaction had occurred.
Naringenin was eluted at 12.5 min and genistein at
15.5 min (Figure 2 a, b). Reaction products with
IFS showed a smaller genistein peak than those
with IFS plus RCPR (Figure 2 c, d). To measure
the amount of genistein generated by IFS, several
concentrations of narigenin and genistein were
analyzed by HPLC and the HPLC absorbance
was used as the standard for calculating the concentration of the reaction product. HPLC absorbance vs. concentration of each flavonoids showed
a linear relationship from 0 to 200 lM. IFS itself
produced an average 18 lM genistein from 100 lM
naringenin, while IFS co-expressed with RCPR
produced 77 lM, equal to about 4.3-fold increase
in IFS activity. This indicates that RCPR enhanced the IFS activity in yeast cells. Even though
IFS was cloned from red clover, RCPR could
effectively transfer electrons to IFS. Therefore, the
current CYP expression system could be applicable for the functional studies of CYPs, not only
from rice but also from other plants.
(a)
mAU
120
OH
100
80
HO
60
40
20
O
OH
O
Naringenin
0
0
mAU
120
100
80
60
5
10
15
20
(b)
HO
O
OH
40
20
O
OH
Genistein
0
0
mAU
120
5
10
15
20
5
10
15
20
5
10
Time(min)
15
20
(c)
100
80
60
40
20
0
0
mAU
120
(d)
100
80
60
40
20
0
0
Fig. 2. HPLC elution profile of reaction product by red clover isoflavone synthase co-expressed with rice P450 reductase.
Microsomes from either vector pES-His (a, b), isoflavone synthase gene (c), or isoflavone synthase co-expressed with rice
P450 reductase (d) were incubated with 1 mM NADPH and
100 lM naringenin (genistein was used instead of naringenin
in b). The reaction products were analyzed by HPLC.
1294
Acknowledgements
This work was supported by a grant from the
Biogreen 21 Program, Rural Development
Administration, Republic of Korea and partially
by KRF2004-F00019 (KRF).
References
Kim BG, Kim SY, Song HS, Lee C, Hur HG, Kim SI, Ahn J-H
(2003) Cloning and expression of the isoflavone synthase gene
(IFS-Tp) from Trifolium pretense. Mol. Cells 15: 301–306.
Koopmann E, Hahlbrock K (1997) Differentially regulated
NADPH:cytochrome P450 oxidoreductases in parsley. Proc.
Natl. Acad. Sci. U S A. 94: 14954–14559.
Mizutani M, Ohta D (1998) Two isoforms of NADPH:Cytochrome P450 reductase in Arabidopsis thaliana. Plant
Physiol. 116: 357–367.
Porter TD, Wilson TE, Kasper CB (1987) Expression of a
functional 78,000 dalton mammalian flavoprotein,
NADPH–cytochrome P-450 oxidoreductase, in Escherichia
coli. Arch. Biochem. Biophys. 254: 353–367.
Ro D-K, Ehlting J, Douglas CJ (2002) Cloning, functional
expression, and subcellular localization of multiple
NADPH-cytochrome P450 reductase from hybrid poplar.
Plant Physiol. 130: 1837–1851.
Schuler MA, Werck-Reichhart D (2003) Functional genomics
of P450s. Annu. Rev. Plant. Biol. 54: 629–667.
Stansfield I, Kelly SL (1996) Purification and quantification of
Saccharomyces cerevisiae cytochrome P450. In: Evans IV,
ed. Yeast Protocols: Methods in Cell and Molecular Biology,
New Jersey: Humana Press, pp. 355–366.
Urban P, Werck-Reichhart D, Teutsch HG, Durst F, Regnier
S, Kazmaier M, Pompon D (1994) Characterization of
recombinant plant cinnamate 4-hydroxylase produced in
yeast. Kinetic and spectral properties of the major plant
P450 of the phenylpropanoid pathway. Eur. J. Biochem. 222:
843–850.
Urban P, Mignotte C, Kazmaier M, Delorme F, Pompon D
(1997) Cloning, yeast expression, and characterization of the
coupling of two distantly related Arabidopsis thaliana
NADPH-cytochrome P450 reductase with P450 CYP73A5.
J. Biol. Chem. 272: 19176–19186.
Springer 2005
Biotechnology Letters (2005) 27: 1295–1299
DOI 10.1007/s10529-005-0222-6
Structural characterization of b-glucans of Agaricus brasiliensis in different
stages of fruiting body maturity and their use in nutraceutical products
Carla Maı́sa Camelini1, Marcelo Maraschin2, Margarida Matos de Mendonça1,*,
Cezar Zucco3, Antonio Gilberto Ferreira4 & Leila Aley Tavares4
1
Departamento de Microbiologia e Parasitologia, Centro de Cieˆncias Biológicas, 88040-900, Santa Catarina,
Florianópolis, Brasil
2
Departamento de Fitotecnia, Centro de Cieˆncias Agrárias, 88040-900, Santa Catarina, Florianópolis, Brasil
3
Departamento de Quı´mica, Universidade Federal de Santa Catarina, 88040-900, Santa Catarina,
Florianópolis, Brasil
4
Departamento de Quı´mica, Universidade Federal de São Carlos, 13565-905, São Paulo, São Carlos, Brasil
*Author for correspondence (Fax: +55-48-331-9258; E-mail: [email protected])
Received 17 February 2005; Revisions requested 22 February 2005; Revisions received 20 June 2005; Accepted 21 June 2005
Key words: Agaricus blazei, Agaricus brasiliensis, b-glucan, nutraceutical, polysaccharide
Abstract
b-Glucans of Agaricus brasiliensis fruiting bodies in different stages of maturity were isolated and characterized by FTIR and NMR. These fractions had greater amount of (1 fi 6)-b-glucan and the (1 fi 3)-bglucan increased with fruiting bodies maturation. Yields of b-glucans increased from 42 mg b-glucans g)1
fruiting bodies (dry wt) in immature stage to 43 mg g)1 in mature stage with immature spores, and decreased to 40 mg g)1 in mature stage with spore maturation. Mature fruiting bodies, which included these
glucans, have potential therapeutical benefits for use in nutraceutical products.
Introduction
Agaricus brasiliensis Wasser & Didukh (Wasser
et al. 2002) (=Agaricus blazei ss. Heinem.), known
in Brazil as Cogumelo medicinel, has been widely
cultivated in the country because of its medicinal
properties such as immunomodulatory and antitumor activities (Kawagishi et al. 1989, Mizuno
et al. 1990, Ohno et al. 2001, Dong et al. 2002).
The mushroom is commercialized in several
countries as a nutraceutical product which is a
novel class of dietary supplements including partially refined extract or dried biomass from the
mushroom made into a capsule or tablet (Chang
& Buswell 1996). Agaricus brasiliensis is harvested in Brazil mostly in the immature stage
when the cap is still closed to meet exportation
standards. Although immature fruiting bodies
have not yet achieved their highest biomass, it is
at this stage that they reach the highest market
value for exportation. Farmers usually discard
the mature fruiting bodies. The quality of a nutraceutical is dependent on the chemical composition of the fruiting body, particularly in
relation to the content of b-glucans. However, no
studies have been developed to characterize the
b-glucans at different stages of fruiting body
maturity and on potential use on the preparation
of nutraceutical. Kawagishi et al. (1989) characterized the b-glucans with antitumoral properties
of A. blazei and detected an alkali soluble
(1 fi 6)-b-D-glucan with no (1 fi 3)-b-linkages.
Mizuno et al. (1990), using a water extraction
method, identified (1 fi 6)–(1 fi 3)-b-D-glucans
in the same species. Recently, Ohno et al. (2001)
working on an alkali-soluble fraction detected
(1 fi 6)-b-D-glucans and a small but significant
amount of (1 fi 3)-b-D-glucans in A. blazei.
1296
None of these authors indicated the stage of
development of the fruiting bodies selected in
their studies. In this study, we examined the
structural evolution of water-soluble polysaccharides such as b-glucans of A. brasiliensis in three
different stages of fruiting body maturity.
Materials and methods
Fruiting body selection
Commercially cultivated fruiting bodies of Agaricus brasiliensis (strain UFSC-51) were obtained
in Biguaçú, Santa Catarina, Southern Brazil, in
2003. The fruiting bodies were harvested and
dried in different stages of maturity: immature
(cap closed) and mature (cap opened). The mature stage was further characterized into immature spores and mature spores as seen on
Figure 1.
Extraction of the polysaccharide fraction
Cell wall polysaccharides were extracted and
purified according to Mizuno et al. (1990). Samples of dried fruiting bodies of A. brasiliensis
(20 g) were grounded, washed with 120 ml 85%
(v/v) ethanol and filtered. The residue was washed with 350 ml 85% (v/v) ethanol holding at
80 C for 3 h (3 times). The polysaccharides were
sequentially extracted with 350 ml water holdings
at 100 C for 3 h (3 times). These aqueous fractions were collected by filtration, followed by the
addition of 4 vol. 95% (v/v) ethanol. The mixture was then held overnight to obtain the polysaccharide fraction, which was concentrated and
dialyzed against distilled water. This fraction was
then freeze-dried, weighed and analyzed.
Fig. 1. Agaricus brasiliensis fruiting bodies in different stages
of maturity: (SI) immature (cap closed), (SII) mature (cap
opened) with immature spores, and (SIII) mature with mature
spores.
Polysaccharide purification
Each sample (1 g) was dissolved in distilled water
and passed through a DEAE-cellulose column
chromatography (2 cm width 35 cm length).
The neutral fraction eluted with water (105 ml)
was discarded and selected fractions of 0.25, 0.5
and 0.75 M NaCl (105 ml each) were concentrated
and then dialyzed extensively. The polysaccharide
was fractionated according to the highest molecular weight on a Toyopear HW-65F (Tosoh) column (2 cm width 35 cm length) selecting the
first 35 ml eluted. The b-glucans (unadsorbed)
was separated using Con A-Sepharose 4B (Fluka
Biochemika) column (1.5 cm width 10 cm
length), freeze-dried, weighted and analyzed.
Polysaccharide analyses
The polysaccharide fractions (before and after
purification of b-glucans) of A. brasiliensis from
each stage of maturity were analyzed. Protein
content was determined using the Bradford
method with BSA as reference. The FTIR spectra were determined with an ABD Bomem Inc.
FTLA 2000 spectrometer and KBr discs. 1H and
13
C NMR spectra of 30 mg and 120 mg polysaccharides fractions, respectively in D2O (600 ll)
were recorded at 298 K using a Bruker DRX400
spectrometer operating at 9.4 Tesla and TSPA-d4
like external reference.
Results and discussion
Polysaccharide analyses
The FTIR spectra (Figure 2) suggested the presence of a small amount of protein (band at
1540 cm)l) which was confirmed by the Bradford
method (Table 1) and the absence of uronic acids
(no carbonyl bands over 1700 cm)l). The characteristic bands of b-glucans occurred in the 1000–
1100 cm)1 region due to O-substituted glucose
residues. The band at 1400 cm)l evidenced the
presence of a b-glucan. These spectra showed a
weak band at 890 cm)l revealing a b configuration on the main glucan. The weak band at
910 cm)l and 850 cm)l indicated the presence of
a a-glucan (Gutiérrez et al. 1996).
1297
Fig. 2. FTIR spectra of polysaccharide fractions obtained
from Agaricus brasiliensis fruiting bodies in different stages of
maturity. (SI-a) aqueous fraction from immature stage isolated at 100 C (before purification of b-glucans) and (SI-b)
same fraction after purification of b-glucans; (SII-a) aqueous
fraction from mature stage with immature spores isolated at
100 C and (SII-b) same fraction after purification of b-glucans; (SIII-a) aqueous fraction from mature stage with mature spores isolated at 100 C and (SIII-b) same fraction after
purification of b-glucans.
13
C NMR spectra from polysaccharide fractions (before and after purification of b-glucans)
from A. brasiliensis, in each stage of maturity,
are shown in Figure 3. Assignment of each spectrum was made by comparison with previously
published spectra (Dong et al. 2002, Mizuno
et al. 1990, Ohno et al. 1985, 2001, Saito et al.
1976, York 1995).
Agaricus brasiliensis fruiting bodies in different stages of maturity contained b-glucans and
also a-glucans. All spectra showed six major
signals on the spectra assigned to (1 fi 6)-b-glucosidic linkages (Figure 3). The anomeric C-1
signal around 105.1 ppm with closely located signals at 104.7 ppm and 104.4 ppm were attributed
as b configurations. The substituted C-6 signal
could be identified at 71.0 ppm from the reverse
peak in the DEPT spectrum and non-substituted
C-6 signal at 62.9 ppm, suggesting a higher
amount of (1 fi 6)-b-glucan than (1 fi 3)-b-glucan. Fractions from all stages before purification
of b-glucans showed the signal at 86.5 ppm,
attributed to substituted C-3, which was weaker
than the non-substituted C-3 signal at 77.8 ppm
(Figure 3). This suggested that most C-3 was not
substituted, and a small amount of (1 fi 3)-bglucan was present. The signal at 86.5 ppm was
not detected in the fraction after purification of
b-glucans from immature fruiting bodies (SI-b),
suggesting a smaller amount of the (1 fi 3)-bglucans than other fractions. All spectra showed
signals at 83.0 ppm, suggesting a (1 fi 2)-b-glucosidic linkage. The signals at 102.0 ppm and
100.2 ppm indicated a-configurations as well as
(1 fi 4)-a- and (1 fi 6)-a-linkages at 79.0 ppm
and 68.0 ppm, respectively. Fruiting bodies in
mature stages showed an increased signal on C-1
(102 ppm) of a (1 fi 4)-a-glucosidic linkage, suggesting an increased amount of this type of glucan with spore matured. The 1H NMR spectra of
both fractions showed the anomeric signals
around 4.6 and 3.2 ppm and confirmed the
b-glucans. Table 1 shows characteristics of glucans in fruiting bodies in different stages of
Table 1. Structural characterization, the yield of water soluble glucans at 100 C from A. brasiliensis fruiting bodies in different
stages of maturity and the amount of protein detected in the fractions before and after purification of b-glucans.
Stages of
maturitya
SISIISIIIa
a
b
a
b
a
b
Glucans
Protein
(mg g)1 dry wt)
(1 fi 6)-b-
(1 fi 2)-b-
(1 fi 3)-b-
(1 fi 4)-a-
(1 fi 6)-a-
Yield (mg g)1 dry wt)
+++b
+++
+++
+++
+++
+++
+d
+
+
+
+
+
+
)e
++c
++
++
++
)
)
++
)
+++
)
+
)
+
)
+
)
102
42
106
43
111
40
6.0
5.8
7.2
6.0
9.9
6.7
Maturity stages of fruiting bodies from which glucans were isolated: (SI-a) aqueous fraction from immature stage isolated at 100 C
(before purification of b-glucans) and (SI-b) same fraction after purication of b-glucans; (SII-a) aqueous fraction from mature stage
with immature spores isolated at 100 C and (SII-b) same fraction after purification of b-glucans; (SIII-a) aqueous fraction from
mature stage with mature spores isolated at 100 C and (SIII-b) same fraction after purification of b-glucans.
b
+++ Highest amount, c++ intermediate amount, d+ smallest amount, e- no/low level of glucans detected in the fractions.
1298
branches on the (1 fi 3)-b-backbone during maturation of fruiting bodies of A. bisporus. It is
important to emphasize that linear (1 fi 6)-b-glucan extracted from Penicillium islandicum did not
present bioactivity (Ohno et al. 1986). However,
(1 fi 3)-b-side branches are structurally important and enhance the immunomodulatory activity
at polysaccharides (Dong et al. 2002). As Mizuno
et al. (1990) evidenced, important anti-tumor
activity is linked to a water-soluble (1 fi 6)–
(1 fi 3)-b-D-glucan. As a consequence, mature
fruiting bodies of A. brasiliensis should be used
for nutraceutical products because they contain
these important glucans. Furthermore, a significant increase on another water soluble (1 fi 4)-aglucan with anti-tumor activity also occurred during maturation from SII to SIII (Mizuno et al.
1990). Cap-opened, more fragile mature fruiting
bodies of A. brasiliensis should be selected over
immature ones for the production of nutraceuticals. Additionally, this strategy will provide the
consumer with a higher diversity of glucans, optimizing bioactivities such as the antitumoral one,
additionally allowing farmers an efficient and
profitable use of the mushroom biomass.
Fig. 3. 13C NMR spectra of polysaccharide fractions obtained
from Agaricus brasiliensis fruiting bodies, in different stages of
maturity, in D2O at 298 K and a number of scans between
30,000 and 35,000. (SI-a) aqueous fraction from immature
stage isolated at 100 C (before purification of b-glucans) and
(SI-b) same fraction after purification of b-glucans; (SII-a)
aqueous fraction from mature stage with immature spores
isolated at 100 C and (SII-b) same fraction after purification
of b-glucans; (SIII-a) aqueous fraction from mature stage
with mature spores isolated at 100 C and (SIII-b) same fraction after purification of b-glucans.
maturity and the yield of each polysaccharide
fraction before and after purification of b-glucans. Additionally, the small amount of protein
detected is shown.
The yield and structural diversity of glucans
increased as the fruiting bodies matured. In
mature stages the amount of (1 fi 3)-b-glucans
(SII-b and SIII-b) was higher than in the immature stage. These glucans are possibly side branches of a (1 fi 6)-b-backbone as indicated by
Dong et al. (2002) and Ohno et al. (2001) who described that b-glucans of A. blazei fruiting bodies
had a (1 fi 6)-b-backbone structure with (1 fi 3)b-side branches. Mol & Wessels (1990) also
showed a greater proportion of (1 fi 6)-b-side
Acknowledgements
This work was partially supported by a grant
from the Conselho Nacional de Desenvolvimento
Cientı́fico e Tecnológico (CNPq). The senior author would like to thank CNPq for the Biotechnology fellowship and the Mushroom Farmers of
Santa Catarina. We thank Dr. Admir Giachini
for editorial comments on this manuscript.
References
Chang ST, Buswell JA (1996) Mushroom nutriceuticals. World
J. Microb. Biotech. 12: 473–476.
Dong Q, Yao J, Yang X, Fang J (2002) Structural characterization of water-soluble b-D-glucan from fruiting bodies of
Agaricus blazei Murr. Carbohyd. Res. 337: 1417–1421.
Gutiérrez A, Prieto A, Martlnez AT (1996) Structural characterization of extracellular polysaccharides produced by fungi
from the genus Pleurotus. Carbohyd. Res. 281: 143–154.
Kawagishi H, Inagaki R, Kanao T, Mizuno T (1989) Fraction
and antitumor activity of the water-insoluble residue of
Agaricus blazei fruiting bodies. Carbohydr. Res. 186:
267–273.
1299
Mizuno T, Hagiwara T, Nakamura T, Ito H, Shimura K,
Sumiya T, Asakura A (1990) Antitumor activity and some
properties of water-soluble polysaccharides from ‘‘Himematsutake’’, the fruiting body of Agaricus blazei Murill. Agric.
Biol. Chem. 54: 2889–2896.
Mol PC, Wessels JGH (1990) Differences in wall structure
between substrate hyphae and hyphae of fruit-body stipes in
Agaricus bisporus. Mycol. Res. 94: 472–479.
Ohno N, Furukawa M, Miura NN, Adachi Y, Motoi M,
Yadomae T (2001) Antitumor b-glucan from the cultured
fruit body of A. blazei. Biol. Pharm. Bull. 24: 820–828.
Ohno N, Iino K, Takeyama T, Suzuki I, Sato K, Oikawa S,
Miyazaki T, Yadomae T (1985) Structural characterization
and antitumor activity of the extracts from matted mycelium
of cultured Grifola frondosa. Chem. Pharm. Bull. 33:
3395–3401.
Ohno N, Hayashi M, Iino K, Suzuki I, Oikawa S, Sato K,
Yadomae T (1986) Effect of glucans on the antitumor
activity of Grifolan. Chem. Pharm. Bull. 34: 2149–2154.
Saito H, Ohki T, Yoshioka Y, Fukuoka F (1976) A 13C nuclear
magnetic resonance study of a gel-forming branched
(1 fi 3)-b-D-glucan from Pleurotus ostreatus (fr.): determination of side-chains and conformation of the polymer-chain
in relation to gel-structure. FEBS Lett. 68: 15–18.
Wasser SP, Didukh MY, Amazonas MALA, Nevo E, Stamets
P, Eira AF (2002) Is a widely cultivated culinary-medicinal
royal sun Agaricus (the Himematsutake mushroom) indeed
Agaricus blazei Murrill?. Int. J. Med. Mush. 4: 267–290.
York WS (1995) A conformational model for cyclic b-(1 fi 2)linked glucans based on NMR analysis of the glucans
produced by Xanthomonas campestris. Carbohyd. Res. 278:
205–225.
Springer 2005
Biotechnology Letters (2005) 27: 1301--1304
DOI 10.1007/s10529-005-0223-5
Taxane production in suspension culture of Taxus 3 media var. Hicksii
carried out in flasks and bioreactor
Katarzyna Syklowska-Baranek* & Miroslawa Furmanowa
Department of Biology and Pharmaceutical Botany, Medical University of Warsaw, ul. Banacha 1, 02--097,
Warsaw, Poland
*Author for correspondence (E-mail: [email protected])
Received: 6 April 2005; Revisions requested 14 April 2005; Revisions received 20 June 2005; Accepted 21 June 2005
Key words: bioreactor, 10-deacetylbaccatin III, paclitaxel, L-phenylalanine, Taxus · media var. Hicksii
Abstract
Paclitaxel and 10-deacetylbaccatin III (10-DAB III) were produced in suspension cultures of Taxus · media
var. Hicksii grown in shake-flasks and in a 7-l bioreactor reaching, in the bioreactor, 4.4 mg l)1 (on day 14) and
37.5 mg l)1 (on day 11). In shake-flasks the highest total content of paclitaxel and 10-DAB III was 7.3 mg l)1
(on day 4) and 8.8 mg l)1 (on day 18). Phenylalanine, at 0.05 mM, increased paclitaxel accumulation in cells
cultivated in bioreactor and flasks 30-fold and 9-fold (from 0.02 mg l)1 to 0.6 mg l)1 and to 0.2 mg l)1,
respectively). The 10-DAB III content in cells from flasks was increased from 0.4 mg l)1 to 1.6 mg l)1.
Introduction
The structurally complex taxane diterpenoid,
paclitaxel, first isolated from the bark of the
Taxus brevifolia, is a highly effective anti-cancer drug used widely in the treatment of various carcinomas, melanomas, and sarcomas.
The 10-deacetylbaccatin III (10-DAB III) is an
intermediate in paclitaxel biosynthesis (Walker
& Croteau 2001) and currently paclitaxel and
its analogue, docetaxel, are produced semi-synthetically through acylation of 10-DAB III isolated from needles of various Taxus species.
Taxus-derived cell cultures may be a useful an
alternative source of paclitaxel and its derivatives
as the complete chemical synthesis is uneconomic
and, moreover, an increasing demand for new
taxoids with improved biological activity and
possible application against other diseases has
been observed. Currently paclitaxel, manufactured by plant cell culture technology, is the active compound of Genexol produced by
Samyang Genex (www.genexol.com). Among
many applied strategies to enhance paclitaxel
accumulation in cell culture the medium supplementation with L-phenylalanine, the precursor of
paclitaxel’s side chain, resulted in considerable
increase in paclitaxel production in suspension
cultures of Taxus species as it was reviewed by
Zhong (2002). The aim of this work was to conduct a comparative study of biomass growth and
examined the influence of L-phenylalanine on
production of paclitaxel and 10-DAB III in suspension culture of Taxus · media var. Hicksii
carried out in flasks and 7-l bioreactor. This is
the first report describing the 10-DAB III and
paclitaxel accumulation in suspension culture
performed in shake flasks and bioreactor.
Materials and methods
Flask cultures
Suspension culture of Taxus · media var. Hicksii
was initiated from callus of seedling origin
differentiating into roots. Shake-flask cultures
were carried out in 250-ml Erlenmeyer flasks
1302
containing 30 ml modified DCR medium (Gupta
& Durzan 1985). The medium was supplemented
with 1 mg NAA l)1, 4.8 mg picloram l)1, 500 mg
casein hydrolysate l)1 and 30 g sucrose l)1. Cells
were transferred to the fresh medium every four
weeks.
To perform the comparative studies the culture was continued in the same medium but
with addition of 8.25 mg L-phenylalanine l)1
(0.05 mM). To examine the time growth parameters about 2.5 g fresh weight of 28-day old cells
was placed onto 25 ml fresh medium in 250-ml
Erlenmeyer flasks. Every 3--4 days, samples from
2 flasks were collected. The fresh and dry weight
of the cells was recorded. The medium was submitted for detection of the pH, content of
sucrose and its conductivity, as well for chemical
analysis.
Bioreactor cultures
The culture was performed in 7-l mixed-type airlift reactor implemented with Rushton-type stirred tank (Biostad Ed, Braun). The working
volume was 5 l. The inoculum was 2% (w/v)
DCR medium as described above. From day 1--4
of culture stirring was set at 400 rpm, and next till
the end of experiment at 200 rpm. The pH value
was set at 5.42. To determine growth parameters
the procedure mentioned above was used.
The cultures were maintained at 25±2 C
under fluorescent light (40 lmol m)2 s)1) and
12 h light/dark cycle.
Chemical analysis
The content of paclitaxel (Sigma) and 10-DAB
III (donated by Prof. Jaziri from Free University
of Brussels) in cells and samples of medium was
determinated using method presented earlier
(Furmanowa & Syklowska-Baranek 2000).
All these experiments were conducted twice.
Statistical analysis was performed using the StatSoft STATISTICA PL software.
Results and discussion
Paclitaxel and 10-DAB III production during
batch culture, carried out in bioreactor and in
the Erlenmeyer flasks, were compared.
The growth of biomass in Erlenmeyer flasks
and bioreactor was similar up to day 14. A lag
phase was not observed. In the culture carried
out in the bioreactor, starting from day 14, there
was a rapid decline of biomass accumulation
which could be attributed to cell breakage.
Moreover from day 4 until the end of cultivation
in the bioreactor sucrose was not taken up from
the medium and remained on unchanged. On the
other hand, the consumption of sucrose in flasks
corresponded well to the cell growth profile, and
was 90% exhausted by day 14 -- at the onset of
stationary growth phase. Navia-Osorio et al.
(2002) also reported the lack of the lag phase
after inoculation in experiments conducted in 20l bioreactor. Data recorded during cultivating
cells in bioreactor might be contributed to higher
cell damage by sharing as the medium stirring
was set at 400 rpm. The similar growth pattern
of suspension culture performed in flasks and bioreactors was also reported by Pestchanker et al.
(1996).
The supplementation of medium with L-phenylalanine increased the production of cell-associated paclitaxel both in the bioreactor and flasks
(see Tables 1 and 2). The influence of this amino
acid was the most pronounced in cultures performed in bioreactor where a 30-fold rise in paclitaxel accumulation in cells was obtained
(Table 2). Jha et al. (1998) reported a 3-fold enhance of paclitaxel with addition of 2.5 mg IAAand phenylalanine l)1 to the medium. Fett-Neto
et al. (1994) demonstrated 4-fold increase of
cell-associated paclitaxel content but that the
precursor did not promote the accumulation of
paclitaxel in the medium relative to the control.
L-Phenylalanine added to the medium along with
other precursors and elicitors at optimized doses
doubled the paclitaxel content of the cells (Luo
& He 2004). A combination of in situ extraction
with organic solvents, precursor feeding and
additional carbon source introduction gave 5
times higher paclitaxel production in comparison
to the control (Yuan et al. 2001). Also a 3-fold
rise of paclitaxel accumulation in Taxus · media
var. Hicksii transgenic root culture was found
after elicitation with methyl jasmonte (Furmanowa & Syklowska-Baranek 2000).
In our experiments the highest total paclitaxel
production (cell-associated and extracellular)
was higher in flasks (Tables 1 and 2). However,
1303
Table 1. Paclitaxel and 10-DAB III content (mg l)1) in cells and medium containing L-phenylalanine from suspension culture of
Taxus · media var. Hicksii carried out in flasks (values are means of four samples ±SD).
Growth (days)
4
7
11
14
18
21
25
28
Cells
Medium
Total
Dry weight (g l)1)
Paclitaxel
10-DAB III
Paclitaxel
10-DAB III
Paclitaxel
10-DAB III
14.2±0.890
16.1±1.002
18.6±2.001
22.2±2.124
21.5±1.954
20.2±1.025
18.2±1.047
21.8±0.712
0.03±0.002
0.2±0.003
0.04±0.001
0.2±0.003
0.1±0.001
0
0
0
1.0±0.008
0.7±0.007
1.0±0.008
0.8±0.007
0.5±0.004
0.8±0.005
1.6±0.014
0.2±0.002
7.3±0.052
1.1±0.002
0
0
0
0
0
0
6.6±0.027
0.3±0.002
2.6±0.003
4.1±0.012
8.2±0.044
3.7±0.039
4.3±0.081
4.8±0.056
7.3±0.171
1.3±0.024
0.04±0.002
0.2±0.021
0.1±0.002
0
0
0
7.6±0.810
1.0±0.254
3.6±0.436
4.9±0.564
8.8±0.641
4.5±0.123
5.9±0.921
5.0±1.002
Taxane content determined in cells from suspension culture carried out in medium without L-phenylalanine in shake flasks (control):
paclitaxel 0.02±0.003 mg l)1, 10-DAB III 0.4±0.004 mg l)1; 0 -- taxanes not detected.
Table 2. Paclitaxel and 10-DAB III content (mg l)1) in cells and medium containing L-phenylalanine from suspension culture of
Taxus · media var. Hicksii carried out in bioreactor (values are means of four samples ± SD).
Growth (days)
1
4
7
11
14
18
21
Cells
Medium
Total
Dry weight (g l)1)
Paclitaxel
10-DAB III
Paclitaxel
10-DAB III
Paclitaxel
10-DAB III
3.5±0.451
5.4±0.612
5.0±0.398
7.9±0.887
18.6±1.014
15.2±2.007
11.9±1.985
0
0.04±0.003
0.3±0.008
0.6±0.007
0.4±0.010
0
0
0
0.05±0.007
0.07±0.006
0.08±0.005
0.04±0.002
0
0
1.2±0.081
2.2±0.064
1.1±0.032
0
4.0±0.076
0
0
4.2±0.065
11.5±1.018
12.9±1.425
37.4±2.523
9.3±0.874
0
0
1.2±0.054
2.3±0.036
1.4±0.014
0.6±0.052
4.4±0.321
0
0
4.2±0.029
11.6±0.764
13.0±0.0214
37.5±2.395
9.9±0.845
0
0
Taxane content determined in cells from suspension culture carried out in medium without L-phenylalanine in shake flasks (control):
paclitaxel 0.02±0.003 mg l)1, 10-DAB III 0.4±0.004 mg l)1; 0 -- taxanes not detected.
paclitaxel in cells from flasks was produced only
up to day 18 and was not detected after day 7 in
the medium (Table 1).
Higher amounts of 10-DAB III were accumulated by cells cultivated in flasks than in bioreactor. But substantially higher quantities of
10-DAB III were secreted to the medium in bioreactor than in flasks (Tables 1 and 2).
In our experiments the highest total concentrations of paclitaxel detected in bioreactor coincided with the lowest 10-DAB III amounts
(Table 2).
In the bioreactor paclitaxel and 10-DAB III
accumulation in cells and their secretion to the
medium was continuous, moreover at day 11 four
peaks of unidentified paclitaxel analogues but in
concentration several times higher than paclitaxel,
were observed both in cells and medium.
During culturing, the excretion of both taxanes in cells grown in flasks and in the bioreactor
exceeded on average 72% of the total compound
content which is consistent with results obtained
by Navia-Osorio et al. (2002) and Pestchanker
et al. (1996) although Wickremesinhe & Arteca
(1994) reported only a 10% release of paclitaxel
in suspension culture of Taxus · media. It was
earlier demonstrated that at low inoculum sizes
of 1.5 and 2.0 g dry wt l)1 the extracellular paclitaxel concentration was relatively higher (Wang
et al. 1997) which is in accordance with our
results.
Precursor feeding strategy employed in our
experiments seems to be promising for future
improving and scale-up of taxane production in
suspension culture of Taxus species, when 10DAB III production amounted to 37.5 mg l)1
1304
within 11 days of culture and paclitaxel yielded
4.4 mg l)1 within 14 days of culture.
Acknowledgements
This research work was supported by the grant
from the State Committee for Scientific Research
No. 4 P05F 028 12. We are grateful to Professor
Mondher Jaziri from the Laboratory of Biotechnology and Plant Morphology, Free University of
Brussels for the 10-deacetylbaccatin III standard.
References
Fett-Neto AG, Melanson SJ, Nicholson SA, Pennington JJ,
DiCosmo F (1994) Improved taxol yield by aromatic
carboxylic acid and amino acid feeding to cell cultures of
Taxus cuspidata. Biotechnol. Bioeng. 44: 967--971.
Furmanowa M, Syklowska-Baranek K (2000) Hairy root
cultures of Taxus · media var. Hicksii Rehd. as a new
source of paclitaxel and 10-deacetylbaccatin III. Biotechnol.
Lett. 22: 683--686.
Gupta PK, Durzan DJ (1985) Shoot multiplication from
mature trees of Douglas-fir (Pseudotsuga menziesii) and
Sugar pine (Pinus lambertiana). Plant Cell Rep. 4: 177--179.
Jha S, Sanyal D, Ghosh B, Jha TB (1998) Improved taxol yield
in cell suspension culture of Taxus wallichiana (Himalayan
Yew). Planta Med. 64: 270--272.
Luo J, He GY (2004) Optimization of elicitors and precursors
for paclitaxel production in cell suspension culture of Taxus
chinensis in the presence of nutrient feeding. Process
Biochem. 39: 1073--1079.
Navia-Osorio A, Garden H, Cusidó RM, Palazón J, Alferman
AW, Piñol TM (2002) Production of paclitaxel and baccatin
III in a 20-L airlift bioreactor by a cell suspension of Taxus
wallichiana. Planta Med. 68: 336--340.
Pestchanker LJ, Roberts SC, Shuler ML (1996) Kinetics of
taxol production and nutrient use in suspension cultures of
Taxus cuspidata in shake flasks and a Wilson-type bioreactor. Enzyme Microb. Technol. 19: 256--260.
Walker K, Croteau R (2001) Taxol biosynthesis genes. Phytochemistry 58: 1--7.
Wang HQ, Zhong JJ, Yu JT (1997) Enhanced production of
taxol in suspension cultures of Taxus chinensis by controlling
inoculum size. Biotechnol. Lett. 19: 353--355.
Wickremesinhe ERM, Arteca RN (1994) Taxus cell suspension
cultures: optimizing growth and production of taxol. J. Plant
Physiol. 144: 183--188.
Yuan YJ, Wei ZJ, Wu ZL, Wu JC (2001) Improved taxol
production in suspension cultures of Taxus chinensis var.
mairei by in situ extraction combined with precursor feeding
and additional carbon source introduction in airlift loop
reactor. Biotechnol. Lett. 23: 1659--1662.
Zhong JJ (2002) Plant cell culture form production of paclitaxel
and other taxanes. J. Biosci. Bioeng. 94: 591--599.
Ó Springer 2005
Biotechnology Letters (2005) 27: 1305–1310
DOI 10.1007/s10529-005-3224-5
Regio- and stereo-selective hydroxylation of abietic acid derivatives
by Mucor circinelloides and Mortierella isabellina
Koichi Mitsukura, Takeshi Imoto, Hirokazu Nagaoka, Toyokazu Yoshida &
Toru Nagasawa*
Department of Biomolecular Science, Gifu University, 1-1 Yanagido, Gifu, 501-1193, Japan
*Author for correspondence (Fax: +81-58-293-2647; E-mail: [email protected])
Received 27 April 2005; Revisions requested 24 May 2005; Revisions received 20 June 2005; Accepted 21 June 2005
Key words: abietic acid derivatives, microbial hydroxylation, regio-selective, stereo-selective
Abstract
Mucor circinelloides and Mortierella isabellina hydroxylated dehydroabietic acid (DehA). DehA was converted regio- and stereo-selectively by whole cells of Mr. circinelloides to give 2a-hydroxydehydroabietic
acid in a 75% molar conversion yield (11 mM from 14.7 mM DehA) after 72 h in the cultivation medium
containing 3% (v/v) Tween 80. With cells of Ma. isabellina, under the same conditions, 20.5 mM (6.5 g l)1)
2–hydroxydehydroabietic acid (a/b=81/19) was formed from 26.4 mM DehA.
Introduction
Rosin, commonly known as resin acid, is an
abundant renewable resource obtained from
pitch pine. It is comprised of several diterpenoic acid derivatives, such as abietic acid,
dehydroabietic acid, dihydroabietic acid, pimaric acid and tetrahydroabietic acid. They are
widely used to synthesize sizing agents for
paper, emulsifying agents for synthetic rubber,
resin for printing inks, resin adhesives, etc.
(Sadhra et al. 1994). On the other hand, the
leakage of the resin acid into natural world
through the production process of paper and
pulp has often caused severe environmental
pollution problems (Owens 1991). Therefore,
the microbial degradation or detoxification of
resin acid has been studied (Liss et al. 1997,
Martin et al. 1999).
Further broad applications of resin acids can
be expected in the field of synthetic chemicals
due to their unique chemical and physical
properties. Several biological activities such as
anti-ulcer (Wada et al. 1985), anti-microbial
(Savluchinske Feio et al. 1999) and anti-inflammatory
(Fernandez et al. 2001) effects of resin derivatives
have also been reported. In the present study, we
have surveyed microorganisms to catalyze the
hydroxylation of abietic acid derivatives and
found a strain of Mucor circinelloides IT25 that
catalyzes the regio-selective and stereo-selective
hydroxylation of both abietic acid and dehydroabietic acid.
Materials and methods
Chemicals
Abietic acid (AbA), dehydroabietic acid (DehA),
dihydroabietic acid (DihA) and rosin containing 2% (w/w) AbA, 58% (w/w) DehA and 36%
(w/w) DihA were kindly provided by Arakawa
Chemical Industries (Japan). Products from the following suppliers were used: polypeptone (Nippon
Seiyaku, Japan), meat extract (Mikunikagaku,
Japan) and yeast extract (Oriental Yeast, Japan).
All other chemicals were of guaranteed reagent
grade.
1306
Isolation of microorganisms capable of converting
abietic acid derivatives
Microorganisms capable of converting AbA,
DehA or DihA were isolated in two ways using
two types of basal media. To collect fungi from
soil, a mixture of soil samples (approximately
2 g) suspended in 5 ml 0.85% (w/v) NaCl
was plated onto medium A containing 30 g
sucrose l)1, 2 g NaNO l)13, 1 g K2HPO4 l)1,
0.5 g MgSO4Æ7H2O l)1, 0.5 g KCl l)1, 0.01 g
FeSO4Æ7H2O l)1 and 20 g agar l)1and incubated
at 28 °C. A single colony on each plate was
picked, and its AbA or DehA-converting activity
was evaluated. Alternatively, a conventional
enrichment culture was carried out aerobically
at 28 °C for 14 days in a test-tube containing
5 ml medium B (pH 7.3) which consisted
of 4 g rosin l)1, 10 g sucrose l)1, 1 g yeast
extract l)1, 2 g NH4Cl l)1, 1 g K2HPO4 l)1,
0.5 g MgSO4Æ7H2O l)1, 0.5 g KCl l)1and 0.01 g
FeSO4Æ7H2O l)1. Each culture was spread on the
plate containing the medium A and 2% (w/v)
agar and incubated at 28 °C. The conversion of
rosin was checked by thin-layer chromatography
(TLC) analysis.
0.2% (w/v) AbA, DehA or DihA were added to
the medium. Biotransformation of each substrate
was carried out at 28 °C for 7 days.
Identification of reaction products
The reaction products (see Figure 1) converted
from AbA, DehA or DihA were purified using
a silica gel column (n-hexane:ethyl acetate=8:1,
4/1, 2:1, 1:1, 0:1, and methanol, v/v) and preparative TLC (n-hexane:ethyl acetate=2:1, v/v).
The analyses of products were carried out using
a Varian INOVA 400 for NMR, a Jeol Automass SUN300 for GC-MS, and a Horiba SEPA300 for optical rotation.
Identification of microorganisms
Among 238 isolates, three bacteria (HR1, HR6,
and HR34) and two molds (IT 25 and HR32)
exhibited abietic acid derivative-converting activity. Based on morphological, physiological and
biological aspects, these five strains were identified by the National Collections of Industrial,
Food and Marine Bacteria, Japan.
Culture conditions and conversion of AbA,
DehA and DihA
The pre-culture was carried out at 28 °C for
2 days with reciprocal shaking in a test-tube containing 5 ml medium (pH 5.5) comprised of
5 g polypepton l)1, 2 g yeast extract l)1, 1 g
K2HPO4 l)1, 0.5 g MgSO4Æ7H2O l)1 and 0.01 g
FeSO4Æ7H2O l)1. The pre-culture was added to a
500 ml shaking-flask containing 30 ml of the
same medium using pre-culture. Cultivation
was carried out at 28 °C for 2 days with
reciprocal shaking (115 strokes min)1), and then
Fig. 1. Microbial conversion of various abietic acid derivatives.
1307
High performance liquid chromatography
(HPLC) analysis
Each compound was analyzed by reverse-phase
HPLC using an ODS column (Waters Spherisorb,
4.6150 mm) and methanol/water (8:2, v/v) for
elution at 1 ml min)1 and monitoring at 230 nm.
Optimization of culture medium
For the studies on the optimization of culture
medium, a mixture comprised of 0.1% (w/v)
K2HPO4, 0.05% (w/v) MgSO4Æ7H2O, and 0.001%
(w/v) FeSO4Æ7H2O was used as the basal medium.
The pre-culture using medium A was carried out
at 28 °C for 2 days with reciprocal shaking. Cultivation was carried out at 28 °C for 3 days with
reciprocal shaking.
Results
Microbial conversion of AbA, DehA and DihA
Among fungi isolates, Mortierella isabellina
HR32 exhibited a powerful hydroxylation
activity for DehA. In addition, we found that
Mr. circinelloides IT 25 exhibited a novel DehAconverting activity. Mr. circinelloides IT25 catalyzed the regio- and stereo-selective hydroxylation
of AbA and DehA to 2a-hydroxyabietic acid and
2a-hydroxydehydroabietic
acid,
respectively.
With AbA as a substrate, the aromatization
of AbA to DehA proceeded in the course of
cultivation medium due to its AbA instability.
Although Mr. javanicus IAM 6087 also exhibited
DehA-hydroxylation activity, it was lower than
that of Mr. circinelloides IT25.
Ma. isabellina HR32 also showed the hydroxylation activity for DehA or DihA. 2-hydroxydehydroabietic acid formed from DehA was a
mixture of two isomers, i.e., 81% a-isomer and
19% b-isomer, as revealed in an analysis of
NMR after esterification with trimethylsilyldiazomethane in a methanol solution. When using
AbA as a substrate, however, 2a-hydroxyabietic
acid was not formed at all. If the other isolates
were examined, Moraxella sp. HR6 converted
DehA and DihA to 3,7-dioxodehydroabietin and
3,7-dioxodihydroabietin, respectively, probably
through the oxidation at C3 and C7 followed by
decarboxylation at C4 with a low molar conversion yield. Pseudomonas sp. HR34 converted
DihA to 7-oxodihydroabietic acid. On the other
hand, Sphingomonas sp. HR1 catalyzed the rapid
degradation of DehA or DihA, so that their
hydroxylated products were not detected. These
microbial conversions of abietic acid derivatives
we found are summarized in Figure 1.
The product obtained from AbA, DehA or
DihA by microbial conversion was purified by silica gel column and identified by NMR and MS.
2a-Hydroxydehydroabietic acid: 1H-NMR
(CDCl3, 400 MHz) d 7.18 (1H, d, J=8.0 Hz), 7.02
(1H, dd, J=8.0, 1.6 Hz), 6.91 (1H, d, J=1.6 Hz),
4.11 (1H, tt, J=11.4, 4.1 Hz), 2.88–2.96 (2H, m),
2.82 (1H, septet, J=7.0 Hz), 2.67 (1H, m), 2,25
(1H, dd, J=12.6, 2.0 Hz), 2.12(1H, s), 2.07 (1H,
m), 1.78–1.90 (1H, m), 1.77 (1H, t, J=11.7 Hz),
1.57–1.65 (1H, m), 1.48 (1H, t, J=11.7 Hz), 1.31
(3H, s), 1.28 (3H, s), 1.22 (6H, d, J=7.0 Hz); 13CNMR (CDCl3, 100 MHz) d182.8, 146.1, 145.8,
134.2, 127.0, 124.1, 123.9, 65.1, 48.2, 47.1, 45.2,
44.3, 38.6, 33.5, 29.8, 26.1, 24.0, 20.9, 17.3; GCMS (methyl ester) (m/z) 330 (M+), 312, 283, 255,
237(100%), 195; [a]24.5D +60.4 (c. 0.16, CHCl3).
In the case of Ma. isabellina HR32, the optical
rotation is [a]24.5D +44 (c. 0.185, CHCl3).
2a-Hydroxyabietic acid: 1H-NMR (CDCl3,
400 MHz) d 5.78 (1H, s), 5.37 (1H, d,
J=4.4 Hz), 3.94 (1H, tt, J=11.6, 4.0 Hz),
2.21 (1H, dd, J=13.6, 6.2 Hz), 2.10 (1H, brs),
1.92–2.08 (3H, m), 1.83 (1H, d, J=11.7 Hz), 1.78
(1H, t, J=11.7 Hz), 1.27 (3H, s), 1.21–1.26 (5H,
m), 1.13 (1H, t, J=12.0 Hz), 1.10 (3H, d,
J=7.0 Hz), 1.00 (1H, t, J=6.6 Hz), 0.86 (3H s,);
13
C-NMR (CDCl3, 100 MHz) d182.9, 145.4,
135.1, 122.1, 120.3, 64.6, 50.9, 47.5, 45.3, 44.5,
36.3, 34.8, 27.3, 25.1, 22.5, 21.4, 20.8, 17.7, 14.9;
GC-MS (methyl ester) (m/z) 332 (M+), 314,
255(100%), 239.
1
2-Hydroxydihydroabietic
acid:
H-NMR
(CDCl3, 400 MHz) d 3.97 (1H, tt, J=11.4,
4.2 Hz), 2.11–2.17 (1H, m), 2.04–2.11 (1H, m),
2.03 (1H, dd, J=13.2, 2.6 Hz), 1.69–1.83
(2H, m), 1.53–1.63 (2H, m), 1.19 (2H, t,
J=8.4 Hz), 1.14 (2H, t, J=11.7 Hz), 1.02 (3H,
s), 0.95–1.01 (1H, m), 0.88 (3H, d, J=7.0 Hz),
0.87 (3H, d, J=7.0 Hz); 13C-NMR (CDCl3,
100 MHz) d182.6, 136.8, 126.3, 65.1, 48.3, 45.9,
45.3, 44.8, 40.4, 38.6, 34.3, 32.5, 31.8, 27.1, 24.7,
1308
20.8, 20.4, 19.9, 19.5, 17.3; GC-MS (methyl ester)
(m/z) 334 (M+), 316, 301, 273, 257, 241(100%).
7-Oxodihydroabietic acid: 13C-NMR (CDCl3,
100 MHz) d200.0, 182.3, 166.5, 130.6, 46.3, 44.6,
39.5, 39.2, 36.7, 36.2, 34.4, 32.3, 26.7, 26.2, 26.0,
19.8, 19.5, 17.8, 17.7, 16.2; GC-MS (methyl ester)
(m/z) 332 (M+), 317, 289, 273, 257(100%), 229.
3,7-Dioxodehydroabietin: 13C-NMR (CDCl3,
100 MHz) d210.7, 197.4, 149.8, 147.6, 132.7,
130.8, 125.4, 124.4, 47.8, 44.9, 39.4, 37.7, 37.2,
36.7, 33.6, 23.8, 23.7, 21.2, 11.0; GC-MS (m/z)
284 (M+), 269(100%), 227, 199.
3,7-Dioxodihydroabietin: 13C-NMR (CDCl3,
100 MHz) d210.7, 197.8, 163.5, 131.9, 48.0, 44.7,
39.4, 38.7, 38.3, 37.5, 35.2, 32.3, 27.4, 26.8, 25.9,
19.7, 19.5, 16.0, 10.9.
Optimal conditions for accumulation
of 2a-hydroxydehydroabietic acid
To enhance the hydroxylation activity of Mr. circinelloides IT25 and Ma. isabellina HR32, the
culture conditions were optimized. The activity was evaluated by measuring the amount of
2a-hydroxydehydroabietic acid formed in the
medium at 28°C after 72 h cultivation. The optimal medium for Mr. circinelloides IT25 consisted
of 20 g sodium L-glutamate l)1, 10 g malt
extract l)1, 1 g K2HPO4 l)1, 0.5 g MgSO4Æ7H2O l)1, and 0.01 g FeSO4Æ7H2O l)1 at pH 7.5.
Under these conditions, it produced 5.4 mM 2ahydroxydehydroabietic acid from 14.7 mM DehA
with a 37% molar conversion yield.
Culture conditions of Ma. isabellina HR32
were also examined. The optimized medium was
comprised of 20 g polypeptone l)1, 20 g yeast
extract l)1, 1 g K2HPO4 l)1, 0.5 g MgSO4Æ7H2O l)1 and 0.01 g FeSO4Æ7H2O l)1 at pH 5.0.
When the cultivaion was carried out using the
medium, 5.6 mM 2-hydroxydehydroabietic acid
was formed from 26.4 mM DehA with a 21%
molar conversion yield.
For further improvement of the productivity
of 2a-hydroxydehydroabietic acid, the effect of
organic solvents and detergents on DehA hydroxylation was examined (Table 1). The addition of
1% (v/v) methanol or ethanol was effective in
slightly extending of the formation of 2a-hydroxydehydroabietic acid by Ma. isabellina HR32. The
additon of 3% (v/v) Tween 80 resulted in a significant enhancement of 2a-hydroxydehydroabietic
Table 1. Effects of organic solvents and detergents on production of 2-hydroxydehydroabietic acid.
Organic
solvent or
detergent
None
Methanol
Ethanol
Acetone
Dimethyl sulfoxide
Tween 20
Tween 80
Triton X)100
Cone
(% v/v)
1
1
1
1
1
1
2
3
4
1
Relative
activity (%)
Mucor
circinelloides
Mortierella
isabellina
100
92
92
93
55
98
128
166
204
204
96
100
149
145
90
96
124
195
353
365
360
0
DehA (150 mg, 0.50 mmol) and (270 mg, 0.90 mmol), respectively, was added to the cultivation medium of either Mr. circinelloides or Ma. isabellina. Strain IT25 and HR32 cells formed
5.4 mM and 5.6 mM 2-hydroxydehydroabietic acid, respectively,
without organic solvents and detergents after 72 h cultivation at
28 °C. These values were taken as 100%.
acid production by Mr. circinelloides IT 25 or Ma.
isabellina HR32. Mr. circinelloides IT 25 produced
11 mM (3.5 g l)1) 2a-hydroxydehydroabietic acid
from 14.7 mM DehA with a 75% molar conversion yield. In the case of Ma. isabellina HR32,
20.5 mM (6.5 g l)1) 2-hydroxydehydroabietic acid
(a/b=81/19) was produced from 26.4 mM DehA
with a 78% molar conversion yield (Table 1).
Effects of P450 inhibitors on DehA hydroxylation
The effect of common P450 inhibitors on the
hydroxylation of DehA by Mr. circinelloides IT
25 was examined by adding 0.5 mM P450 inhibitors to the cultivation medium (Table 2). The
hydroxylation activity of Mr. circinelloides IT 25
was inhibited by all P450 inhibitors tested, with
1-aminobenzotriazole causing the most significant
inhibition.
Discussion
In previous studies of biodegradation of DehA,
some bacteria could grow on DehA as a carbon
source, and the biodegradation pathways of
1309
Table 2. Effect of P450 inhibitors at 0.5 mM on DhA hydroxylation by Mr. circinelloides IT25.
Inhibitor
Relative activity (%)
None
Methoxsalen
1-Aminobenzotriazole
Ketoconazole
Miconazole
Menadione
100
49
36
52
75
76
Hydroxylation of DhA was carried out at 28 °C for 72 h cultivation in the optimum medium containing 3% (v/v) Tween 80.
The formation of 10 mM 2a-hydroxydehydroabietic acid in the
absence of P450 inhibitors was taken as 100% – see Table 1 for
absolute values.
DehA have been outlined as shown in Figure 2a
based on studies of their metabolic intermediates
or molecular genetics. The microbial degradation
or conversion of AbA has scarcely been studied
due to its chemical lability, causing it to change
readily into DehA (Martin & Mohn 2000).
In the present study, we found that Moraxella sp. HR6 acted on DehA, and forming a new
metabolite, 3,7-dioxodehydroabietin. This result
suggested that Moraxella sp. HR6 probably
degraded DehA through a pathway similar to
pathway A in Figure 2a. A low amount of
accumulated of 3,7-dioxodehydroabietin suggested that the activity of the dioxygenase
required to catalyze cleavage of the subsequent
rings might be high. When DehA was replaced
with DihA, the accumulation of a new metabolite,
3,7-dioxodihydroabietin was observed at a
higher concentration than that of 3,7-dioxodehydroabietin. Thus, the degradation of 3,7-dioxodihydroabietin proceeded at lower rate than
3,7-dioxodehydroabietin because the cyclohexane
ring of DihA is resistant to the meta-cleavage
catalyzed by dioxygenase. Pseudomonas sp.
HR34 also catabolized DihA rapidly and a new
metabolite,
7-oxodihydroabietic
acid,
was
detected. This suggests that the degradation of
DehA by Pseudomonas sp. HR34 probably
Fig. 2. (a) Possible degradation pathway of DehA by Flavobacterium resinovorum (Biellmann et al. 1973a) (A), Alcaligenes eutrophus and Pseudomonas sp. (Biellmann et al. 1973b) (B), Pseudomonas abietaniphila BKME)9 (Martin and Morn 1999) (b) Conversion of DehA by Fusarium oxysporum or F. moniliforme (Tapia et al. 1997) (C), Mortierella isabellina (Kutney et al. 1981) (D) and
Chaetomium cochliodes (Yano et al. 1994) (E).
1310
proceeded through pathway B (see Figure 2).
When Sphingomonas sp. HR1 cells were used,
DehA was completely degraded.
In contrast to bacteria, no mold capable of
assimilating DehA as a sole carbon source has
been reported. As shown in Figure 2b, two
molds convert DehA into the hydroxylated catabolites. In our studies, Ma. isabellina HR32
produced a mixture of 2a- and 2b-hydroxydehydroabietic acid through pathway D. We also
found that Ma. isabellina HR32 catalyzed the
hydroxylation of DihA at C2 and Mr. circinelloides IT25 catalyzed the hydroxylation of AbA at
C2. We isolated these metabolites and identified
their chemical structures.
The addition of nonionic detergent Tween 20
or Tween 80 enhanced production of 2a-hydroxydehydroabietic acid. We assume that Tween 20
and Tween 80 probably enhanced the solubility
of rosin or the permeability of the cell membrane
(Baklashova & Koshcheenko 1980).
Based on the effect of P450 inhibitors on
DehA hydroxylation, we suggested that Mr. circinelloides IT25 might proceed through a system
incorporating P450.
Conclusion
Until now, the production of catabolic intermediates of DehA, a renewable natural resource, has
not been undertaken from the viewpoint of their
application and development. In the present
studies, we have produced, for the first time, a
large amount of 2a-hydroxydehydroabietic acid
by optimizing the culture conditions and are proceeding to examine its applications as a functional material.
Acknowledgements
We are grateful to Life Science Research Center
in Gifu University for NMR and mass measurements.
References
Baklashova TG, Koshcheenko KA (1980) Effect of detergents
on the hydroxylation of indolyl)3-acetic acid by an Aspergillus niger culture. Mikrobiologiia 49: 546–550.
Biellmann JF, Branlant G, Gero-Robert M, Poiret M (1973a)
Dégradation bactérienne de l’acide déhydroabiétique par un
Flavobacterium resinovorum. Tetrahedron 29: 1227–1236.
Biellmann JF, Branlant G, Gero-Robert M, Poiret M (1973b)
Dégradation bactérienne de l’acide déhydroabiétique par
un Pseudomonas et une Alcaligenes. Tetrahedron 29:
1237–1241.
Fernandez MA, Tornos MP, Garcia MD, de las Heras B, Villar
AM, Saenz MT (2001) Anti-inflammatory activity of abietic
acid, a diterpene isolated from Pimenta racemosa var.
grissea. J. Pharm. Pharmacol. 53: 867–872.
Kutney JP, Singh M, Hewitt GM, Salisbury PJ, Worth BR,
Servizi JA, Martens DW, Gordon RW (1981) Studies related
to biological detoxification of kraft pulp mill effluent I. The
biodegradation of dehydroabietic acid with Mortierella
isabellina. Can. J. Chem. 59: 2334–2341.
Liss SN, Bicho PA, Saddler JN (1997) Mini-review: Microbiology and biodegradation of resin acids in pulp mill effluents.
Can. J. Microbiol 43: 599–611.
Martin VJJ, Mohn WW (1999) A novel aromatic-ring-hydroxylating dioxygenase from the diterpenoid-degrading bacterium, Pseudomonas abietaniphila BKME)9. J. Bacteriol.
181: 2675–2682.
Martin VJJ, Yu Z, Mohn WW (1999) Mini review: Recent
advances in understanding resin acid biodegradation:
microbial diversity and metabolism. Arch. Microbiol. 172:
131–138.
Martin VJJ, Mohn WW (2000) Genetic investigation of the catabolic
pathway for degradation of abietic diterpenoids by Pseudomonas
abietaniphila BKME)9. J. Bacteriol. 182: 3784–3983.
Owens JW (1991) The hazard assessment of pulp and paper
effluents in the aquatic environment: a review. Environ.
Toxicol. Chem. 10: 1511–1540.
Sadhra S, Foulds IS, Gray CN, Koh D, Gardiner K (1994)
Colophony – uses, health effects, airborne measurements and
analysis. Ann. Occup. Hyg. 38: 385–396.
Savluchinske Feio S, Gigante B, Roseiro JC, Marcelo-Curto
MJ (1999) Antimicrobial activity of diterpene resin acid
derivatives. J. Microbiol. Methods 35: 201–206.
Tapia AA, Vallejo MD, Gouiric SC, Feresin GE, Rossomando
PC, Bustos DA (1997) Hydroxylation of dehydroabietic acid
by Fusarium species. Phytochemistry 46: 131–133.
Wada H, Kodato S, Kawamori M, Morikawa T, Nakai H,
Takeda M, Saito S, Onoda Y, Tamaki H (1985) Antiulcer
activity of dehydroabietic acid derivatives. Chem. Pharm.
Bull. (Tokyo) 33: 1472–1487.
Yano S, Nakamura T, Uehara T, Furuno T, Takahashi A
(1994) Biotransformation of terpenoids in conifers by
microorganisms I. Hydroxylation of dehydroabietic acid
by Chaetomium cochliodes. Mokuzai Gakkaishi 40:
1226–1232.
Springer 2005
Biotechnology Letters (2005) 27: 1311–1317
DOI 10.1007/s10529-005-3225-4
Increased conformational and thermal stability properties
for phenylalanine dehydrogenase by chemical glycosidation with end-group
activated dextran
Reynaldo Villalonga1,*, Shinjiro Tachibana2, Yunel Pérez1 & Yasuhisa Asano2
1
Enzyme Technology Group, Center for Biotechnological Studies, University of Matanzas, 44740, Matanzas,
C.P, Cuba
2
Biotechnology Research Center, Toyama Prefectural University, 5180 Kurokawa, 939-0398, Kosugi,
Toyama, Japan
*Author for correspondence (Fax: +53-45-253101; E-mail: [email protected])
Received 20 May 2005; Revisions requested 26 May 2005; Revisions received 20 June 2005; Accepted 21 June 2005
Key words: dextran, enzyme stability, glycosidation, phenylalanine dehydrogenase
Abstract
A mono-aminated dextran derivative was attached to Bacillus badius phenylalanine dehydrogenase via a
carbodiimide-catalyzed reaction. The optimum temperature for the conjugate was 10 C higher than for
native enzyme, and its thermostability was improved by 8 C. The activation free energy of thermal
inactivation at 45 C was increased by 16.8 kJ/mol. The improved conformational stability of the modified
enzyme was confirmed by fluorescence spectroscopy.
Introduction
Phenylalanine dehydrogenase (PheDH, EC
1.4.1.20) from Bacillus badius is a NAD+-dependent octameric enzyme that catalyzes the
reversible oxidation–reduction reactions for Lphenylalanine (Asano 1999). This enzyme has
been used in the colorimetric screening of phenylketonuria in neonates in Japan (Asano et al.
1987), and also constitutes a valuable catalyst for
the enantioselective synthesis of Phe and related
L-amino acids from their keto analogs (Asano
et al. 1990). However, the biocatalytic and analytical applications of this enzyme is limited by
its rapid inactivation at elevated temperatures
(Asano et al. 1987).
Cross-linking of enzymes with polyactivated
polymers has been widely used for increasing
functional stability (Srivastava 1991, Gómez &
Villalonga 2000, Darias & Villalonga 2001,
Villalonga et al. 2003). Site-specific modification
with polyethylenglycols has been also reported as
stabilizing method for enzymes (Veronese et al.
2002). We recently described the use of monoactivated cyclodextrin derivatives as glycosidation
agents for preparing thermostable neoglycoenzymes (Cao et al. 2003, Villalonga et al. 2003,
Fernández et al. 2004). However, chemically activated cyclodextrins are expensive materials, and
this fact limits their wide use in the synthesis of
neo-glycoenzymes for industrial application.
Dextrans are less expensive and non-toxic
polysaccharides produced by bacteria from sucrose, and consisting of linear a-1,6-linked D-glucopyranose units with some degree of branching
via 1,3-linkages (Mehvar 2000). High stable enzyme derivatives have been prepared by crosslinking the protein surfaces with polyactivated
dextrans (Srivastava 1991), but this approach
yields to enzyme preparations with low catalytic
activity. This problem could be solved by using
mono-activated polymer derivatives, but the
1312
preparation of such kind of mono-activated macromolecules requires well specific reaction conditions as well as the adequate selection of the
polymer size (Bruneel & Schacht 1995).
The present paper reports the preparation of
an end-group mono-aminated dextran derivative,
and its use as glycosidation agent for B. badius
PheDH. The influence of this modification on the
catalytic and stability properties of this oxidoreductase is evaluated.
Materials and methods
Materials
Phenylalanine dehydrogenase from Bacillus badius (18.4 U/mg), recombinantly expressed in
E. coli, was prepared as previously described
(Asano et al. 1987). L-Phenylalanine, NAD+ and
1-ethyl-3-(3-dimethylaminopropyl) carbodiimide
hydrochloride (EDAC) were purchased from
Wako Pure Chemicals. Dextran 5000 was from
Serva. All other chemicals were analytical grade.
Synthesis of end-group aminated dextran
Dextran (2 g), dissolved in 10 ml distilled water
was treated with 1 ml 1,6-hexylenediamine and
stirred for 2 h. NaBH3CN, 150 mg, was then added and the reaction mixture was continuously
stirring at room temperature overnight. The solution was further extensively dialyzed vs. distilled
water using a Spectrapor 6 dialysis tubing (Serva,
molecular weight cut-off 1000 Da) and finally
lyophilized. The aminated dextran derivative was
characterized by 1H-NMR spectrometry using a
Bruker AVANTE 400 MHz apparatus.
Preparation of PheDH-dextran conjugate
EDAC, 10 mg, was added to a reaction mixture
containing 4 mg PheDH dissolved in 3 ml 50 mM
sodium phosphate buffer, pH 6.0, and 100 mg
aminated dextran. The solution was stirred for
1 h at room temperature, then at 4 C for 16 h
and finally dialyzed at 4 C against 10 mM potassium phosphate buffer, pH 7.0, containing 1 mM
EDTA and 5 mM 2-mercaptoethanol.
Analytical determinations
The enzymatic activity of native and modified
PheDH was determined at 25 C in 100 mM
glycine/KCl/KOH buffer, pH 10.4, containing
2.5 mM NAD+ and using 10 mM L-Phe as substrate (Asano et al. 1987). One unit of L-phenylalanine dehydrogenase activity is defined as the
amount of enzyme that catalyzes the formation
of 1 lmol NADH per min under the described
conditions. Michaelis-Menten parameters were
calculated from Eadie-Hofstee plots. Protein concentration was estimated from the absorbance at
280 nm using the absorption coefficient
A1%
1cm ¼ 6:3 (Asano et al. 1987). Total carbohydrates were determined by the phenol/sulfuric
acid method using glucose as standard (Dubois
et al. 1956).
The molecular weight of the enzyme forms
was determined by analytical GPC on TSKGEL
G3000SW column (4.560 cm), calibrated with
protein standards from Oriental Yeast Co., Ltd.
The fluorescence emission spectra of native
and modified PheDH before and after thermal
denaturation at 55 C were measured with
0.7 nmol enzyme in 10 mM sodium phosphate
buffer, pH 7.0, containing 1 mM EDTA and
5 mM 2-mercaptoethanol, using a spectrofluorimeter with excitation at 280 nm and the emission
scanned between 300–400 nm.
Light scattering measurements of native and
dextran-modified PheDH were monitored at
400 nm after excitation at 280 nm.
Results and discussion
The strategy used for end-group functionalization of dextran involves the treatment with a molar excess of 1,6-hexylenediamine in the presence
of NaBH3CN in order to reduce only the new
imine bonds formed at the reducing end of the
polymer. Through this procedure, a high yield of
mono-activated dextran was obtained (about
91%), as determined by 1H-NMR spectra (data
not shown).
The amino dextran derivative synthesized was
further attached to the free carboxylate groups
from aspartic and glutamic acid residues located
at the protein surface of PheDH, through the
1313
Fig. 1. Preparation of PheDH-dextran conjugate.
formation of stable amide links by using a water
soluble carbodiimide as coupling agent. Due to
the mono-activated nature of the modifying polymer, each mol of polysaccharide was attached to
a single amino acid residue. The overall synthetic
process employed for preparing this neo-glycoenzyme is illustrated in Figure 1.
Table 1. Structural and catalytic properties of dextranmodified PheDH.
Parameter
PheDH
PheDH-dextran
Molecular weight (kDa)
Dextran content
(mol/mol protein)
Specific activity (Umg)1)
Km (lM)
kcat (s)1)
kcat/Km (lM)1s)1)
325.6
–
342
3
18.4
215
816
3.8
16.3
164
714
4.4
The structural and catalytic properties of this
enzyme-polymer conjugate are reported in
Table 1. The molecular weight of PheDH, determined by analytical GPC, was increased in about
16.4 kDa after glycosidation with dextran. This
result represents an average of 3 mol polysaccharide attached to each mol octameric protein. On
the other hand, the specific dehydrogenase activity
retained by the conjugated enzyme was estimated
to be about 89%. It was further demonstrated
that this reduction was partially mediated by the
presence of EDAC as catalyst in the reaction media. Steric hindrance to the diffusion of L-Phe to
the active site of the enzyme, caused by the presence of the bulky polysaccharide moieties at the
surface of PheDH, could be also considered as a
possible cause of this reduction. Glycosidation
with dextran enhanced the affinity of the enzyme
for L-Phe: Km was decreased by 1.3-fold for Phe-
1314
Relative Activity (%)
100
80
60
40
20
0
30
40
50
60
70
Temperature (°C)
Fig. 2. Temperature-activity profile of native (s) and
dextran-modified PheDH (d).The enzyme activity of native
and modified enzyme preparations (about 10 U/ml, corresponding to 100% in the graphic), was measured at different
temperatures in 100 mM glycine/KCl/KOH buffer, pH 10.4.
As a control, a physical mixture of PheDH and amino dextran (X) was also evaluated.
100
Residual Activity (%)
DH after modification with dextran. On the contrary, the rate of dehydrogenation of L-Phe was
only slightly decreased for the transformed enzyme, as is revealed by the lower value of kcat.
The catalytic behaviour of PheDH at high
temperatures was noticeably improved after glycosidation with the polymer. In order to evaluate
the effect of this modification on the enzyme
thermoresistance, different types of experiments
were performed. As a, native PheDH was mixed
with mono-aminated dextran in order to eliminate any contribution caused by the physical
presence of the polysaccharide.
Figure 2 shows the temperature-activity profiles of native and dextran-modified PheDH
preparations. PheDH showed maximum catalytic
activity at 40 C, and this value of optimum temperature was not affected by the physical presence of the aminated dextran. On the contrary,
the optimum temperature for dehydrogenation of
L-Phe was increased in about 10 C for the enzyme after conjugation with the polysaccharide.
This fact could be justified by the improved thermostabilization showed by the conjugated enzyme (see below), avoiding protein denaturation
until higher temperatures and then favouring to
reach a high catalytic activity of PheDH at
elevated temperatures.
The effect of 10 min of incubation at different
temperatures on the catalytic activity of both
PheDH forms is shown in Figure 3. Dextran-
80
60
40
20
0
30
40
50
60
70
Temperature (°C)
Fig. 3. Thermal stability profile of native (s) and dextranmodified PheDH (d). Native and modified enzyme preparations (about 50 U/ml, corresponding to 100% in the graphic),
were incubated in 10 mM potassium phosphate buffer, pH 7.0,
containing 1 mM EDTA and 5 mM 2-mercaptoethanol at the
stated temperatures for 10 min. Samples were removed, chilled quickly, and assayed for enzymatic activity. As a control,
a physical mixture of PheDH and amino dextran (X) was also
evaluated.
modified enzyme was more resistant to heat
treatment at temperatures higher than 45 C, in
comparison with the native counterpart.
Consequently, the value of T50, defined as the
temperature at which 50% of the initial activity was retained, was increased from 54 to
62 C for PheDH after glycosidation with the
polysaccharide.
Figure 4 shows the time course of inactivation
of PheDH preparations at different temperatures
ranging from 45 to 60 C. As can be observed,
both enzyme preparations progressively lost
activity with time though a second order inactivation mechanism, and then the data obtained
were analyzed according to a series-type enzyme
inactivation model involving two first-order steps
(Sadana & Henley 1987), in which k1 and k2 are
the inactivation rate constants. The kinetics constants were calculated by using a non-linear
regression procedure based on the MarquardtLevenberg method of iterative convergence included into the Microcal Origin 7.0 software
(Microcal Software, Inc., MA, USA).
This kind of biphasic thermal inactivation
process is characteristic for oligomeric proteins
like PheDH (Asano et al. 1987). However, it
should be noted that the modified enzyme possessed lower inactivation rate constants and consequently higher values of half life times,
1315
(a)
80
60
40
20
0
0
30
60
90
120
90
120
Time (min)
Residual Activity (%)
(b)
100
80
60
40
20
0
0
30
60
Time (min)
(a)
Fig. 4. Kinetics of thermal inactivation of native (a) and
dextran-modified PheDH (b) at 45 C (m), 50 C (X), 55 C
(s) and 60 C (n). Native and modified enzyme preparations
(about 50 U/ml, corresponding to 100% in the graphic), were
incubated at different temperatures in 10 mM potassium phosphate buffer, pH 7.0, containing 1 mM EDTA and 5 mM 2mercaptoethanol. Aliquots were removed at scheduled times,
chilled quickly, and assayed for enzymatic activity.
Relative Intensity
Residual Activity (%)
100
at 45 C, temperature at which the activation
Gibbs energy of the first phase of thermal inactivation (DGi) (Darias & Villalonga 2001) increased in about 16.8 kJ/mol.
The molecular events behind the thermal stabilization showed by modified PheDH may be
explained by the combined contribution of several factors, previously demonstrated to be effective in the maintenance of the active
conformation of neo-glycoenzymes. Among
these, the most important factors could be the
conformational stabilization of dextran-modified
PheDH molecules due to the formation of new
intramolecular hydrogen bonds (Srivastava
1991); and the hydrophilization of the non-polar
surface areas of the enzyme, preventing the thermal inactivation mechanisms associated with the
formation of intermolecular protein aggregates
due to hydrophobic interactions (Venkatesh &
Sundaram 1998).
45
t1/2
t1/2
t1/2
t1/2
t1/2
t1/2
t1/2
t1/2
50
55
60
(1)
(2)
(1)
(2)
(1)
(2)
(1)
(2)
PheDH
PheDH-dextran
2.0
19.3
1.0
4.4
0.7
2.6
0.07
0.17
231
n.d.
9.6
116
4.4
23
0.4
3.9
300
325
350
375
400
375
400
λ emission (nm)
(b) 900
n.d.: Not determined.
Relative Intensity
(C)/t1/2 (h)
600
0
300
Table 2. Half-life times of native and dextran-modified
PheDH at different temperatures.
Temperature
900
600
300
0
300
325
350
λemission (nm)
indicating an enhancement in its thermal stability
(Table 2). The thermostabilization effect for dextran-modified PheDH was especially noticeable
Fig. 5. Fluorescence emission spectra of native (a) and
dextran-modified PheDH (b) before (——) and after (ÆÆÆÆÆÆÆÆ)
1 h incubation at 55C.
1316
nIcreased light scattering (%)
In order to prove these hypotheses, the
fluorescence spectra of native and modified protein were recorded at 25 C and after 1 h incubation at 55 C (Figure 5). The fluorescence spectra
of both native and modified PheDH upon
excitation at 280 nm showed an identical emission maximum at 313 nm, which is characteristic
of tryptophan residues buried into the hydrophobic protein core. However, thermal treatment at
55 C resulted in the unfolding of non-modified
enzyme, as evidenced by the decrease in the fluorescence intensity and the appearance of a secondary band, shifted to the red zone of the
spectra. On the contrary, dextran-modified enzyme showed smaller decrease in the fluorescence
intensity after identical heat treatment, indicating
that a more compact protein structure is formed
after glycosidation of PheDH with monoactivated dextran.
Figure 6 shows the influence of heat treatment at 55 C on the light scattering intensity of
native and modified enzymes. Increased light
scattering was observed for both enzyme forms
after incubation at this temperature, indicating
the occurrence of intermolecular aggregation processes in the thermal inactivation mechanism of
this protein. However, glycosidation of PheDH
with dextran resulted in the reduction of
intermolecular associations as evidenced by reduced light scattering. This result suggests that
the hydrophilic polysaccharide moieties prevented inactivation of PheDH due to aggregation
processes when is incubated at elevated
temperatures.
In this work PheDH was chemically glycosidated with an end-group aminated dextran. This
modification resulted in a noticeable improvement of the conformational and thermal stability
properties of this oxido-reductase. The influence
of protein aggregation processes on the inactivation mechanism of PheDH at elevated temperature was also determined, as well as the
reduction of this phenomenon after attachment
of the polysaccharide. Attending to these results,
we suggest the covalent glycosidation of PheDH
with end-group aminated dextran as a useful
method for improving its resistance to heat
inactivation.
Acknowledgements
This research was supported by grants from The
Japan Society for the Promotion of Sciences to
R. Villalonga and Y. Asano (Grant S-04257),
and from Toyama Medical-Bio Cluster (The
Ministry of Education, Culture, Sports, Science
and Technology, Japan) to Y. Asano and S.
Tachibana. Dextran derivative was synthesized in
Matanzas University, Cuba, and the modification
of PheDH and its properties were investigated in
Toyama Prefectural University, Japan. Financial
support to R. Villalonga from the International
Foundation for Science, Stockholm, Sweden, and
the Organisation for the Prohibition of Chemical
Weapons, The Hague, The Netherlands (Grant
F/3004-1) is also acknowledged.
180
References
135
90
45
0
0
30
60
90
120
Time of incubation at 55°C (min)
Fig. 6. Influence of time of incubation at 55 C on light
scattering at 400 nm of native (s) and dextran-modified
PheDH (d).
Asano Y (1999) Phenylalanine dehydrogenase. In: Flickinger
MC & Drew SW eds. Encyclopedia of Bioprocess Technology: Fermentation, Biocatalysis and Bioseparation, New
York: John Wiley & Sons, Inc, pp. 1955–1963.
Asano Y, Yamada A, Kato K, Yamaguchi K, Hibino Y, Hirai K,
Kondo K (1990) Enantioselective synthesis of (S)-amino acids
by phenylalanine dehydrogenase from Bacillus sphaericus: use
of natural and recombinant enzymes. J. Org. Chem. 55: 5567–
5571.
Asano Y, Yamada A, Kato Y, Yamaguchi K, Hibino Y, Hirai K,
Kondo K (1987) Phenylalanine dehydrogenase of Bacillus
badius. Purification, characterization and gene cloning. Eur. J.
Biochem. 168: 153–159.
Bruneel D, Schacht E (1995) End group modification of
pullulan. Polymer 36: 169–172.
1317
Cao R, Fragoso A, Almiral E, Villalonga R (2003) Supramolecular chemistry of cyclodextrins in Cuba. Supramol. Chem.
15: 161–170.
Darias R, Villalonga R (2001) Functional stabilization of
cellulase by covalent modification with chitosan. J. Chem.
Technol. Biotechnol. 76: 489–493.
Dubois MK, Gilles A, Hamilton JK, Rebers PA, Smith F
(1956) Colorimetric method for determination of sugars and
related substances. Anal. Chem. 28: 350–356.
Fernández M, Fragoso A, Cao R, Baños M, Ansorge-Schumacher M, Hartmeier W, Villalonga R (2004) Functional
properties and application in peptide synthesis of trypsin
modified with cyclodextrin-containing dicarboxylic acids.
J. Mol. Catalysis B. Enzymatic 31: 47–52.
Gómez L, Villalonga R (2000) Functional stabilization of
invertase by covalent modification with pectin. Biotechnol.
Lett. 22: 1191–1195.
Mehvar R (2000) Dextrans for targeted and sustained delivery of
therapeutic and imaging agents. J. Control. Release 69: 1–25.
Sadana A, Henley JP (1987) Single-step unimolecular non-firstorder enzyme deactivation. Biotechnol. Bioeng. 30: 717–723.
Srivastava RAK (1991) Studies on stabilization of amylase by
covalent coupling to soluble polysaccharides. Enzyme
Microb. Technol. 13: 164–170.
Venkatesh R, Sundaram PV (1998) Modulation of stability
properties of bovine trypsin after in vitro structural changes
with a variety of chemical modifiers. Protein Eng. 11: 691–698.
Veronese FM, Caliceti P, Schiavon O, Sergi M (2002) Polyethylene glycol-superoxide dismutase, a conjugate in search of
exploitation. Adv. Drug Deliv. Rev. 54: 587–606.
Villalonga R, Fernández M, Fragoso A, Cao R, Di Pierro P,
Mariniello L, Porta R (2003) Transglutaminase-catalyzed
synthesis of trypsin-cyclodextrin conjugates. Kinetics and
stability properties. Biotechnol. Bioeng. 81: 732–737.
Ó Springer 2005
Biotechnology Letters (2005) 27: 1319–1323
DOI 10.1007/s10529-005-0477-y
Production of fungal biomass immobilized loofa sponge (FBILS)-discs
for the removal of heavy metal ions and chlorinated compounds
from aqueous solution
M. Iqbal1, A. Saeed1, R.G.J. Edyvean2, B. O’Sullivan2 & P. Styring2
1
Environment Biotechnology Group, Biotechnology and Food Research Centre, PCSIR Laboratories
Complex, 54600, Lahore, Pakistan
2
Department of Chemical and Process Engineering, University of Sheffield, S1 3JD, Sheffield, UK
Received 10 June 2005; Revisions requested 10 June 2005; Revisions received 23 June 2005; Accepted 28 June 2005
Key words: cadmium, 4-chloroanisole, fungal immobilization, loofa sponge, metal biosorption
Phanerochaete chrysosporium
Abstract
A white rot basidiomycete, Phanerochaete chrysosporium, was immobilized on loofa sponge (FBILS) discs.
It removed ca. 37 and 71 mg Cd (II) g)1 from 50 and 200 mg l)1 aqueous solutions and up to 89% of
4-chloroanisole from a 10 mg l)1 aqueous solution. FBILS are physically strong and chemically recalcitrant, resisting temperature, mechanical agitation, and variations in pH without alteration to shape,
structure or texture.
Introduction
Pollution in water supplies and in waste-water
discharge is a cause of increasing legislative and
public concern. In many countries, industry is
required to meet ever higher quality standards
and has a need for improved, and environmentally sound, waste treatment methodologies for
the removal of toxic chemicals from effluents.
The use of biomass as biosorbents for pollutants
offers an environmentally sound and potentially
low cost alternative to existing technologies. Fungal biomasses have high affinities for toxic metals
(Kratochvil & Volesky 1998) and organic chemicals (Perez et al. 1997, Reddy et al. 1998) in
aqueous solution. Commercial application of
such biomass has been hindered by problems
associated mainly with physical manipulation
(McHale & McHale 1994). Low mechanical
strength and fragmentation of the biomass can
cause difficulties in the contacting and separation
of the effluent and biomass and this limits process design.
Immobilization technologies have been suggested to overcome these problems (Trujillo et al.
1995, Aloysius et al. 1999). Immobilization of
microbial biomass in polymeric gel matrices is
the most extensively studied method (Leenen
et al. 1996, Arica et al. 2001). However, production of large amounts of gel beads needed for
commercial applications is expensive and requires
specialist equipment. Furthermore, the use of
such polymeric matrices results in closed structures with restrictive diffusion and low mechanical strength (Hu & Reeves 1997).
The ideal immobilization matrix is strong and
resistant and has an open structure. The plantderived Loofa sponge is an inexpensive and easily available biological, and therefore renewable,
matrix produced in most tropical and subtropical
countries. The sponge is made up of interconnecting voids with an open network of fibrous
support giving the potential for rapid contact of
immobilized cells to the surrounding aqueous
medium. Merits of the loofa biomatrix system include freedom from materials that might be toxic
1320
to microbial cells, simple application and operation technique, and high stability during longterm repeated use.
The white rot basidiomycete, Phanerochaete
chrysosporium, was chosen for this study as it has
a known affinity for metal ions but this is the
first report on the immobilization of P. chrysosporium on a biomatrix for the bioremediation of
both inorganic and organic pollutants from
aqueous solution. While the mechanisms for
inorganic and organic removal are likely to be
different, the inclusion of cadmium sorption
experiments ensures continuity with previous
work on biosorbents and to test the hypothesis
that this form of immobilization does not affect
metal uptake, and therefore surface reactivity of
the fungal hyphae.
Materials and methods
Microorganism and culture medium
The white-rot basidiomycete, Phanerochaete chrysosporium ATTC 24725, was grown on (g l)1 distilled water); D-glucose, 10; KH2PO4, 2; MgSO4 Æ
7H2O, 0.5; NH4Cl, 0.1; CaCl2 Æ H2O, 0.1; thiamine, 0.001; at pH 4.5.
Immobilizing materials and production
of FBILS-discs
Loofa sponge for use as an immobilization matrix
was obtained from the ripened dried fruit of Luffa
cylindrica. The loofa was cut into discs of approximately 2.5 cm diam. and 2–3 mm thick, soaked
in boiling water for 30 min, thoroughly washed
under tap water and left for 24 h in distilled water, changed 3–4 times. The discs were then oven
dried at 70 °C and stored in a desiccator.
A mycelium suspension of P. chrysosporium,
0.5 ml, was inoculated in 100 ml of autoclaved
growth medium containing four pre-weighed loofa sponge discs in 250 ml Erlenmeyer flasks.
Flasks, with no loofa sponge discs in the medium, were inoculated to provide free fungal biomass controls. The inoculated flasks were shaken
at 100 rpm at 34 °C. After 8 days, both free and
loofa immobilized biomass of P. chrysosporium
(hereafter called FBILS – Fungal biomass immobilized loofa sponge) were harvested from the
medium, washed twice with distilled water and
stored at 4 °C until use. The dry weight of the
fungal biomass was determined by weighing oven
dried (70 °C overnight) sponge discs before and
after fungal growth.
Results and discussion
Properties of loofa sponge
The successful use of immobilized biosorbents
requires that the immobilization matrix provides
a high surface contact area and is stable to adverse chemical and physical treatments. Neither
autoclaving (10 times for 20 min), nor pH
(2.0–12 for 24 days) produced any change in the
shape and structure of the sponge. Table 1 shows
the lowest and highest values of physical parameters of loofa sponge discs. These results indicate
that loofa sponge discs can be repeatedly reused
in adverse conditions.
Production and properties of FBILS biosorbent
Microscopic examination shows hyphal growth
in the sponge matrix within 24 h of incubation.
Complete coverage of the sponge disc with the
hyphae of P. chrysosporium occurs within 5 days
(Figure 1a–c) and growth continues until the
attainment of stationary phase at day 7. While
the immobilized hyphal biomass is packed tightly
within the sponge there remain large numbers of
micro-channels for free movement of solute during the biosorption process (Figure 1c). In contrast, the free hyphal growth was compact and
pelleted. At day 8, immobilized P. chrysosporium
had a 21% increase in biomass over the freely
growing control with biomass levels reaching
1900 mg l)1. Such an increase is unusual in
immobilized systems.
Table 1. Some physical characteristics of loofa (Luffa cylindrica) sponge.
Physical properties
Structural nature
Porosity (%)
Density (g/cm3)
Specific pore volume (cm3/g)
Fibrous network
85–95
0.018–0.05
26–34
1321
growth medium containing the inexpensive
sponge discs without any prior chemical
treatment.
Metal removal studies
Figure 2 shows the efficiency of the removal of
Cd (II) from solution by FBILS, free fungal biomass and loofa sponge control. While other authors have reported reductions in metal ion
Fig. 1. Immobilization of Phanerochaete chrysosporium within
loofa sponge discs: (a) loofa sponge disc; (b) loofa sponge
disc covered with P. chrysosporium hyphal biomass; (c) scanning electron micrographs of immobilized P. chrysosporium
showing micro-channel and void volume for free solute movement. White scale bars at bottom of micrograph = 10 lm.
No change in the shape, size or weight of
FBILS was observed during exposure to various
pH in the range 2–12 and were stable when
exposed to acid (HCl), alkali (NaOH) and salt
(NaCl) solutions for 5 days. FBILS retain 99%
of the immobilized biomass within the loofa
sponge when shaken for 7 days at 150 rpm in
distilled water. In contrast to the results for
FBILS, significant cell leakage has been reported to occur during biosorption from systems
immobilized using polymer gel systems (Hu &
Reeves 1997). These results show that, in contrast to the polymer gel immobilization method
which requires more sophisticated equipment
involving high costs, the more robust FBILS
system can be made simply by adding the
microbial cell/hyphal/spore suspensions to a
Fig. 2. Biosorption of Cd (II) from (a) 50 mg l)1 and (b)
200 mg l)1 solutions by free or immobilized Phanerochaete
chrysosporium. Cd (II) solutions were prepared from
Cd(NO3)2 and adjusted to pH 5 using 0.1 M NaOH. Fresh
dilutions were used for each experiment. Hundred milligram
of free or immobilized (FBILS-discs) fungal biomass was contacted with 100 ml Cd (II) solution in 250 ml flasks shaken at
100 rpm at 20 ± 2 °C. Free fungal biomass was separated by
centrifugation at 3500 g for 5 min, whereas FBILS-discs
were separated by simple decantation. Residual concentrations of Cd (II) in the supernatant were determined using an
atomic absorption spectrophotometer. Metal-free and fungal
biomass-free solutions were used as controls. Statistical analysis of the data was carried out according to the Duncan’s new
multiple range test (Steel & Torrie 1996).
1322
uptake when biomass is immobilized, these results show that this form of immobilization does
not affect metal uptake capacity of the fungal hyphae. Mahan and Holcombe (1992) reported a
40% reduction in the sorption of Pb (II) when
Stichococcus bacillaris was immobilized on silica
gel and Lopez et al. (2002) report a 60% decrease in metal sorption by Pseudomonas fluorescens cells immobilized in agar beads, both in
comparison with free cells. The statistically significant lower uptake of Cd (II) by free hyphal
biomass found in this work may be due to a
reduction in the surface area available for sorption due to hyphal aggregation and pelletization.
Such reductions due to aggregation have been
found for yeast cells as well as fungal hyphae (de
Rome & Gadd 1987, Plette et al. 1996, Aloysius
et al. 1999). The findings presented here indicate
no diffusional limitations and demonstrate that
FBILS are better suited for biosorption and
other reactions than either free hyphal biomass
or polymeric gel immobilization. From 50 mg l)1
metal solution uptake reached 36.8 ± 0.7 mg g)1
fungal biomass for FBILS but only 29.7 ±
0.9 mg g)1 free fungal biomass. For 200 mg l)1
metal solution, uptake reached 71.3 ± 1.3 mg g)1
fungal biomass for FBILS but only 59.9 ±
1.5 mg g)1 free fungal biomass.
From isotherm studies the maximum uptake
levels are 75.9 ± 1.7 mg g)1 for FBILS and
63.7 ± 1.5 mg g)1 for free fungal biomass from
Cd (II) concentrations of 250 mg l)1 and above.
Chlorinated aromatic organic compound removal
studies
Chlorinated aromatic organic compounds pose severe environmental and health hazards. In particular, methods for the removal of poly-chlorinated
dioxins and dibenzofurans are of widespread
interest. Because of the hazardous properties of
these materials, 4-chloroanisole in aqueous solution was chosen as a model compound as it can be
regarded as being structurally similar to half a
dichlorodioxin molecule (Figure 3).
After 7 days, contact at 34 °C, FBILS
removed 84%, 78% and 69% of 4-chloroanisole
from a 5, 10 and 20 mg l)1 aqueous solutions
(Table 2). No removal was detected in the
4-chloroanisole control using untreated loofa
sponge. Hundred percent of 4-chloroanisole was
Fig. 3. Structures of 4-chloroanisole (1) and dichlorodioxin
(2).
Table 2. Removal of different concentrations of 4-chloroanisole by fungus biomass immobilized in loofa sponge (FBILS)
discs after 7 days.
4-chloroanisole, initial
concentration (mg l)1)
4-chloroanisole removed
(mg g)1 FBILS disc)
5
10
20
14.1 ± 0.9
25.4 ± 1.2
45.8 ± 2.8
Fig. 4. Effect of contact time on the removal of 4-chloroanisole from aqueous solution. FBILS-discs were shaken at
100 rpm for 10 days in an aqueous solution of 10 mg l)1 4
chloroanisole at 35 °C. This concentration (and the others
used) is well below the maximum solubility of 4-chloroanisole
in water (237 mg l)1, Lun et al. 1995). FBILS were removed
after different periods of contact by simple decantation. Hundred millilitre of the decanted culture medium was mixed with
an equal volume of diethyl ether in a separating funnel. The
organic layer was removed, reduced to 10% volume and analysed for 4-chloroanisole by GC using a WCOT (Wall Coated
Open Tubular) fused silica capillary column, 30 m 0.25 mm
ID. Concentrations of 4-chloroanisole were determined
against calibration standards using accurately obtained solutions of the organic material in diethyl ether. Dry weight of
fungal biomass was determined after drying in an oven at
70 °C overnight.
removed from 250 ml of 10 mg solution in
8 days (Figure 4). There was no evidence in the
chromatograms for the presence of aromatic deg-
1323
radation intermediates such as anisole or phenols, however, the control studies show that this
removal does not occur by an adsorption process. It is known that P. chrysosporium will degrade the aromatic ring structure of chlorinated
aromatic compounds to carboxylic acids and carbon dioxide (Valli et al. 1992), so this is the likely pathway. Such compounds would not be
detected using the current experimental technique. These results clearly demonstrated the
ability of FBILS to remove the chlorinated
organic compound from aqueous solution. Furthermore, the absence of aromatic degradation
products demonstrates added value in the process, as degrading chlorodioxins simply to
dioxins would only lead to a small decrease in
toxicity. Degradation of the whole structure to
carboxylic acids represents a much cleaner overall remediation process.
Conclusions
Loofa sponge is an effective immobilization matrix for the entrapment of fungal hyphae to produce the fungal biomass immobilized loofa
sponge (FBILS). FBILS have a high capacity to
remove both the toxic metal and chlorinated organic compounds from aqueous solution. High
bioremoval capacity, good mechanical strength,
ease of handling, high porosity and low cost
availability of the immobilization matrix are features which lend this system to practical applications for the removal of metals and chlorinated
aromatic compounds from industrial effluents.
References
Aloysius R, Karim MIA, Ariff AB (1999) The mechanism
of cadmium removal from aqueous solution by nonmetabolizing free and immobilized live biomass of Rhizopus
oligosporus. World J. Microbiol. Biotechnol. 15: 571–578.
Arica MY, Kacar Y, Gene O (2001) Entrapment of white rot
fungus Trametes versicolor in ca-alginate beads: preparation and biosorption kinetic analysis for cadmium
removal from aqueous solution. Bioresource Technol. 80:
121–129.
de Rome L, Gadd GM (1987) Copper adsorption by Rhizopus
arrhizus, Cladosporium resinae and Penicillium italicum.
Appl. Microbiol. Biotechnol. 26: 84–90.
Hu MZC, Reeves M (1997) Biosorption of uranium by
Pseudomonas aeruginosa strain CUS immobilized in a novel
matrix. Biotechnol. Prog. 13: 60–70.
Kratochvil D, Volesky B (1998) Advances in the biosorption of
heavy metals. Trends Biotechnol. 16: 291–302.
Leenen EJTM, Dos Santos VAPM, Grolle KCF, Tramper J,
Wijffels RH (1996) Characteristics of and selection criteria
for cell immobilization in wastewater treatment. Water Res.
30: 2985–2996.
Lopez A, Lazaro N, Morales S, Marques AM (2002) Nickel
biosorption by free and immobilized cells of Pseudomonas
fluorescens 4F39: a comparative study. Water Air Soil Poll.
135: 157–172.
Lun R, Shiu WY, Mackay D (1995) Aqueous solubilities and
octanol water partition coefficients of chloroveratroles and
chloroanisoles. J. Chem. Eng. Data 40: 959–962.
Mahan CA, Holcombe JA (1992) Immobilization of algae cells
on silica gel and their characterization for trace metal
preconcentration. Anal. Chem. 64: 1933–1939.
McHale AP, McHale S (1994) Microbial biosorption of metals:
potential in the treatment of metal pollution. Biotechnol.
Adv. 12: 647–652.
Perez RR, Benito GG, Miranda MP (1997) Chlorophenol
degradation by Phanerochaete chrysosporium. Bioresource
Technol. 60: 207–213.
Plette ACC, Benedetti MF, Riemsdjik WH (1996) Competitive
binding of protons, calcium, cadmium and zinc to isolated
cell walls of a gram-positive soil bacterium. Environ. Sci.
Technol. 30: 1902–1910.
Reddy GVB, Gelpke MDS, Gold MH (1998) Degradation of
2,4,6-trichlorophenol by Phanerochaete chrysosporium:
involvement of reductive dechlorination. J. Bacteriol. 180:
5159–5164.
Steel RGD, Torrie JH (1996) Principles and Procedures of
Statistics: A Biometrical Approach, 3New York:McGrawHill.
Trujillo EM, Sprinti M, Zhuang H (1995) Immobilized
biomass: a new class of heavy metal ion exchangers. In:
Senguptal AK, ed. Ion Exchange Technology: Advances in
Pollution Control, Pennsylvania: Technomic Publishing
Company Inc, pp. 225–271.
Valli K, Wariishi H, Gold MH (1992) Degradation of 2,7dichlorodibenzo-p-dioxin by the lignin-degrading basidomycete Phanerochaete chrysosporium. J. Bacteriol. 174:
2131–2137.
Ó Springer 2005
Biotechnology Letters (2005) 27: 1325–1328
DOI 10.1007/s10529-005-0480-3
A metal ion as a cofactor attenuates substrate inhibition in the enzymatic
production of a high concentration of D-glutamate using N-acyl-D-glutamate
amidohydrolase
Kazuaki Yoshimune, Ai Hirayama & Mitsuaki Moriguchi*
Department of Applied Chemistry, Faculty of Engineering, Oita University, Dannoharu 700, 870-1192, Oita,
Japan
*Author for correspondence (Fax: +81-97-554-7890; E-mail: [email protected])
Received 5 May 2005; Revisions requested 2 June 2005; Revisions received 27 June 2005; Accepted 27 June 2005
Key words: D-aminoacylase, D-aspartate, D-glutamate production, N-acyl-D-aspartate amidohydrolase, Nacyl-D-glutamate amidohydrolase
Abstract
N-Acyl-D-glutamate amidohydrolase (D-AGase) was inhibited by 94 % when 1 mol/l N-acetyl-DLglutamate was used as a substrate. The addition of 1 mM Co2+ stabilized D-AGase. Moreover, the substrate inhibition was weakened to 88% with the addition of 0.4 mM Co2+ to the reaction mixture. Although
2+
D-AGase is a zinc-metalloenzyme, the addition of Zn
from 0.01 to 10 mM did not increase the D-glutamic
acid production in the saturated substrate. Under optimal conditions, 0.38 M D-glutamic acid was obtained
from N-acyl-DL-glutamate with 100% of the theoretical yield after 48 h.
Introduction
N-Acyl-D-amino acid amidohydrolases catalyze
the hydrolysis of N-acyl derivatives of various Damino acids to D-amino acids and fatty acids and
can be used to resolve DL-amino acids. They are
divided into three types according to their substrate specificities. D-Aminoacylase (D-ANase)
acts on N-acyl derivatives of various neutral Damino acids. D-ANase from Alcaligenes xylosoxydans subsp. xylosoxydans A-6 (Alcaligenes A-6)
has been applied as a commercial enzyme (D-aminoacylase ‘‘Amano’’) for the optical resolution
production of neutral D-amino acids (Wakayama
et al. 2003). N-Acyl-D-glutamate amidohydrolase
(D-AGase) and N-acyl-D-aspartate amidohydrolase (D-AAase) are specific for N-acyl-D-glutamate
and
N-acyl-D-aspartate,
respectively
(Wakayama & Moriguchi 2001).
The D-ANase of Alcaligenes A-6 contains
2.3 g atom Zn2+ per mol (Wakayama et al.
2000). However, the activity is inhibited by 92%
by 1 mM Zn2+ (Moriguchi et al. 1993b). Lai
et al. (2004) reported that a large excess of Zn2+
strongly inhibits D-ANase of Alcaligenes faecalis
DA1 because it changes the conformation of its
active center. D-AGase of Pseudomonas sp. strain
5f-1 is zinc-metalloenzyme, and the activity is
inhibited by 47% by 2 mM Zn2+ (Wakayama
et al. 1995b). The activity of D-AAase from
Alcaligenes A-6 is also inhibited by 73% by
2 mM Zn2+ (Moriguchi et al. 1993a). These
inhibitions may be of the same manner as that of
2+
D-ANase of Alcaligenes faecalis DA1. Co
can
2+
often substitute for Zn
to restore the activity
of the apo-form of the zinc-metalloenzyme
(Vallee & Galdes 1984). Moreover, D-AGase of
Pseudomonas sp. strain 5f-1 is stabilized by Co2+
(Wakayama et al. 1995b). Although D-AGase is
inhibited by Zn2+, Co2+ has no inhibitory effect
on the enzyme at the concentration that stabilizes
the enzyme (Wakayama et al. 1995b). Thus,
1326
Co2+ can be a useful additive for stabilizing
zinc-metalloenzymes, such as D-AGase.
In industrial productions using enzymes, high
concentrations of substrate are often reacted for
a long time to increase the production yield and
recovery of the product. Thus, industrial enzymes
are required to have a high activity and stability
in the presence of high concentrations of its substrate and product. Previously, we reported that
the production levels of D-AGase of Alcaligenes
A-6 in Escherichia coli are increased by the coexpression of molecular chaperones (Yoshimune
et al. 2004). Despite the increasing activity of DAGase, the enzyme is unable to produce a high
concentration of D-glutamic acid in a high yield.
This may be due to the substrate inhibition and
stability of D-AGase in the presence of high concentrations of its substrate. Here we report how
to remove substrate inhibition in an industrial
production using an enzyme.
Materials and methods
Materials
Plasmid pKGSD2 encoding D-AGase (Yoshimune et al. 2004) and plasmid pETAD1 encoding D-AAase (Wakayama et al. 1995c) were
prepared as described previously. N-AcetylDL-glutamate and N-acetyl-DL-aspartate were
purchased from Sigma. All other chemicals were
from Wako Pure Chemicals.
Enzyme preparation
The recombinant D-AGase or D-AAase was overproduced in E. coli using pKGSD2 or pETAD1,
respectively, as previously described (Wakayama
et al. 1995c; Yoshimune et al. 2004). E. coli in
10 mM potassium phosphate buffer (pH 7.0) was
disrupted by sonication, and cell debris was removed by centrifugation. The supernatant obtained was used as the enzyme solution.
Assay of enzyme activity
The activities of D-AGase and D-AAase were assayed by measuring the D-amino acid formed.
The reaction mixture (0.2 ml) contained 100 mM
potassium phosphate buffer (pH 7.0), 40 mM Nacetyl-DL-amino acid and enzyme (10 ll). After
incubation at 30 °C for 10 min, the reaction was
stopped by adding 0.1 ml 0.25 M NaOH. The Damino acid formed was measured by the 2,4,6trinitrobenzenesulfonic acid (TNBS) method
(Fields 1972). One unit of the enzyme was defined as the amount of enzyme that catalyzed the
formation of 1 lmol D-amino acid per min.
Using substrates above 0.1 M, reaction mixtures were adjusted to pH 8.5 with 25% (w/v)
NaHCO3. After incubation at 30 °C for 1 h, the
reaction was stopped by boiling for 3 min. The
insoluble substrate and product were dissolved
with the addition of water. The concentration of
the D-amino acid in the solution was determined
by the TNBS method.
Determination of the concentration of product
and substrate
The D-amino acid concentrations were determined by the TNBS method. For the determination of the concentration of N-acetyl-DL-amino
acid, the acid was hydrolyzed by the corresponding N-acyl-D-amino acid amidohydrolase, and
the D-amino acid produced was measured with
the TNBS method. The concentration of saturated N-acetyl-DL-amino acid was defined as the
concentration in the supernatant of a solution
containing 1.5 M N-acetyl-DL-amino acid and
25% (w/v) NaHCO3 at 30 °C. The solubility of
the N-acetyl-DL-amino acids was increased by
neutralization with sodium hydrogencarbonate.
The solubility of N-acetyl-DL-glutamate or Nacetyl-DL-aspartate in 25% (w/v) NaHCO3 was
about 0.96 or 0.65 M, respectively.
Results and discussion
Effects of the substrate concentrations
on the activities of N-acyl-D-amino acid
amidohydrolases
The activities of D-AGase and D-AAase were
inhibited by 83% and 94 %, respectively, with
1 M N-acetyl-DL-amino acids. On the other hand,
the activities of D-AGase and D-AAase were
unaffected by their products, 0.4 M D-glutamic
1327
acid and 0.4 M D-aspartic acid, respectively, in
the presence of 1 M N-acetyl-DL-amino acids.
These results suggest that product inhibition did
not take place and the productivities of D-glutamic and D-aspartic acids increase by the attenuation of substrate inhibition.
Effect of Co2+ on the production of D-glutamic
acid in the saturated substrate
Figure 1 shows the effect of Co2+ on the production of D-glutamic acid. Its productivity was increased more than three times by 1 mM Co2+ in
1.25 M N-acetyl-DL-glutamate. In the absence of
Co2+, D-glutamate was not produced after 3 h.
On the other hand, a small increase of D-glutamate was observed from 3 h through 24 h in the
presence of Co2+ (data not shown). The increase
of production level were considered probable
cause of the stabilization by Co2+. D-AGase was
stabilized by Co2+ at 30 °C (Table 1) but not at
40 °C (data not shown). Co2+ might slightly
change the conformation of D-AGase to stabilize
it at 30 °C. Activity of D-AGase was doubled by
0.4 mM Co2+ with 0.96 M N-acetyl-DL-glutamate
(data not shown). However, the D-AGase activity
was not affected by 0.4 mM Co2+ when 40 mM
N-acetyl-DL-glutamate was used as a substrate
concentration (standard assay condition; data
not shown). Co2+ might change the conformation of the active center of D-AGase to weaken
the inhibition of the substrate. Although D-AGase is considered to be a zinc-metalloenzyme
(Wakayama et al. 1995a), Zn2+ did not affect
the production of D-glutamic acid in the saturated substrate (data not shown). The production
level of D-glutamate was not increased by 1 mM
Mg2+, Mn2+, Fe2+, Fe3+, Ni2+, Cu2+ or Ba2+
(data not shown). Zn2+ of zinc-metallo enzyme
can be often replaced by Co2+ or Mn2+. Furthermore, L-aminoacylase (Toogood et al. 2002)
and thermolysin (Holland et al. 1995) are acti-
Fig. 1. Effect of Co2+ on the production of D-glutamic acid.
A reaction mixture containing 1.25 M N-acetyl-DL-glutamate,
25% (w/v) NaHCO3, 125 mM potassium phosphate buffer
(pH 7.0), and 2 U/ml D-AGase was incubated with various
concentrations of Co2+ for 24 h at 30 °C. The reaction was
stopped by boiling for 3 min.
vated by Co2+. Co2+ can be a useful additive
for activating and stabilizing zinc-metallo
enzymes. Neither Co2+ nor Zn2+ increased the
production level of D-aspartic acid by D-AAase
in the saturated substrate.
D-Amino
acid production by N-acyl-D-amino
acid amidohydrolases
Figure 2 shows the time course of the production
of D-glutamic acid with the use of D-AGase in
1 mM Co2+ and 0.77 M N-acetyl-DL-glutamate.
Only 20% of theoretical yield was obtained up to
approximately 14 h of the reaction, probably because of the substrate inhibition. After 20 h of
the reaction, the amount of D-glutamic acid rapidly increased due to the lower concentration of
the substrate. Under the same condition, D-
Table 1. Effect of various metal ions on the stability of D-AGase.
Metal ion
No addition
Concentration (mM)
Residual activity (%)
46
Mg2+
Mn2+
Fe2+
Fe3+
Co2+
1
1
1
1
0.2
1
2
49
0
2.4
9.7
42
98
62
Ni2+
Cu2+
Zn2+
Ba2+
4
1
1
1
1
31
1.4
0
52
43
The enzyme solutions containing 100 mM potassium phosphate buffer (pH 7.0) and 2 U D-AGase/ml in the presence of various metal
ions were incubated at 30 °C for 12 h. The residual D-AGase activities were measured.
1328
oretical yield in this condition. Further studies
will be required to understand the mechanisms of
Co2+ action on D-AGase.
References
Fig. 2. Time course of D-glutamic acid production. A reaction
mixture containing 0.77 M N-acetyl-DL-glutamate, 0.2 g/ml sodium hydrogencarbonate, a 380 mM potassium phosphate
buffer (pH 7.0), 1 mM Co2+, and 2 U D-AGase was incubated at 30 °C.
Fig. 3. Time course of D-aspartic acid production. A reaction
mixture containing 0.77 M N-acetyl-DL-aspartate, 0.2 g/NaHCO3/ml and 380 mM potassium phosphate buffer (pH 7.0),
and 2 U D-AAase was incubated at 30 °C.
aspartic acid was produced at 70% of the theoretical yield for 48 h (Figure 3). A slight increase
in D-aspartic acid was observed after 24 h of the
reaction, probably due to the inactivation of the
enzyme. D-AAase must be stabilized for the production of D-aspartic acid with 100 % of the the-
Fields R (1972) The rapid determination of amino groups with
TNBS. Method Enzymol. 25: 464–468.
Holland DR, Hausrath AC, Juers D, Matthews BW (1995)
Structural analysis of zinc substitutions in the active site of
thermolysin. Protein Sci. 4: 1955–1965.
Lai WL, Chou LY, Ting CY, Kirby R, Tsai YC, Wang AHJ,
Liaw SH (2004) The functional role of the binuclear metal
center in D-aminoacylase. J. Biol. Chem. 279: 13962–
13967.
Moriguchi M, Sakai K, Katsuno Y, Maki T, Wakayama M
(1993a) Purification and characterization of novel N-acyl-Daspartate amidohydrolase from Alcaligenes xylosoxydans
subsp. xylosoxydans A-6. Biosci. Biotech. Biochem. 57: 1145–
1148.
Moriguchi M, Sakai K, Miyamoto Y, Wakayama M (1993b)
Production, purification, and characterization of D-aminoacylase from Alcaligenes xylosoxydans subsp. xylosoxydans
A-6. Biosci. Biotech. Biochem. 57: 1149–1152.
Toogood HS, Hollingsworth EJ, Brown RC, Taylor IN, Taylor
SJC, McCague R, Littlechild JA (2002) A thermostable
L-aminoacylase
from Thermococcus litoralis: cloning,
overexpression, characterization, and applications in biotransformations. Extremophiles 6: 111–122.
Vallee BL, Galdes A (1984) The metallobiochemistry of zinc
enzymes. Adv. Enzymol. Relat. Areas. Mol. Biol. 56: 283–430.
Wakayama M, Ashika T, Miyamoto Y, Yoshikawa T, Sonoda
Y, Sakai K, Moriguchi M (1995a) Primary structure of
N-acyl-D-glutamate amidohydrolase from Alcaligenes xylosoxydans subsp. xylosoxydans A-6. J. Biochem. 118: 204–209.
Wakayama M, Miura Y, Oshima K, Sakai K, Moriguchi M
(1995b) Metal-characterization of N-acyl-D-glutamate amidohydrolase from Pseudomonas sp. strain 5f-1. Biosci.
Biotech. Biochem. 59: 1489–1492.
Wakayama M, Watanabe E, Takenaka Y, Miyamoto Y, Tau
Y, Sakai K, Moriguchi M (1995c) Cloning, expression, and
nucleotide sequence of the N-acyl-D-aspartate amidohydrolase gene from Alcaligenes xylosoxydans subsp. xylosoxydans
A-6. J. Ferment. Bioeng. 80: 311–317.
Wakayama M, Moriguchi M (2001) Comparative biochemistry
of bacterial N-acyl-D-amino acid amidohydrolase. J. Mol.
Catal. B: Enzym. 12: 15–25.
Wakayama M, Yada H, Kanda S, Hayashi S, Yatsuda Y, Sakai
K, Moriguchi M (2000) Role of conserved histidine residues
in D-aminoacylase from Alcaligenes xylosoxydans subsp.
xylosoxydans A-6. Biosci. Biotechnol. Biochem. 64: 1–8.
Wakayama M, Yoshimune K, Hirose Y, Moriguchi M (2003)
Production of D-amino acid amidohydrolase and its structure and function. J. Mol. Catal. B: Enzym. 23: 71–85.
Yoshimune K, Ninomiya Y, Wakayama M, Moriguchi M
(2004) Molecular chaperones facilitate the soluble expression
of N-acyl-D-amino acid amidohydrolases in Escherichia coli.
J. Ind. Microbiol. Biotechnol. 31: 421–426.
Springer 2005
Biotechnology Letters (2005) 27: 1329--1334
DOI 10.1007/s10529-005-0482-1
Characterization of an extracellular serine protease gene
from the nematophagous fungus Lecanicillium psalliotae
Jinkui Yang1, Xiaowei Huang1, Baoyu Tian1, Hui Sun1, Junxin Duan2, Wenping Wu2 &
Keqin Zhang1,*
1
Laboratory for Conservation and Utilization of Bio-resources, Yunnan University, 650091, Kunming,
P. R. China
2
Research and Development Center of Novozymes in China, 100085, Beijing, P. R. China
*Author for correspondence (Fax: +86-871-5034878; E-mail: [email protected])
Received 27 April 2005; Revisions requested 24 May 2005; Revisions received 27 June 2005; Accepted 29 June 2005
Key words: gene cloning, Lecanicillium psalliotae, serine protease, similarity comparison
Abstract
The gene encoding a cuticle-degrading serine protease was cloned from three isolates of Lecanicillium
psalliotae (syn. Verticillium psalliotae) by 3¢ and 5¢ RACE (rapid amplification of cDNA ends) method. The
gene encodes for 382 amino acids and the protein shares conserved motifs with subtilisin N and peptidase
S8. Comparison of translated cDNA sequences of three isolates revealed one amino acid polymorphism at
position 230. The deduced protease sequence shared high degree of similarities to other cuticle-degrading
proteases from other nematophagous fungi.
Introduction
Extracellular enzymes are important virulence
factors in nematophagous and entomophagous
fungi (Segers et al. 1994, Tunlid et al. 1994,
Bonants et al. 1995, Joshi et al. 1995). LopezLlorca (1990) isolated a serine protease P32 from
Pochonia suchlasporia (syn. Verticillium suchlasporium) and found it was involved in egg penetration of nematode. Subsequently, two
proteases, VCP1 and PIP, were isolated from nematophagous fungi Pochonia chlamydosporia
(syn. Verticillium chlamydosporium) and Paeciliomyces lilacinus, respectively (Segers et al. 1994,
Bonants et al. 1995). Similar extracellular proteases also had been found in entomophagous fungi (St Leger et al. 1992, Joshi et al. 1995).
Moreover, collagenase and chitinase have been
identified from nematophagous fungi Arthrobot-
rys amerospora, Po. chlamydosporia and Po.
suchlasporia (Schenck et al. 1980, Tikhonov et al.
2002).
Lecanicillium psalliotae is a nematophagus
fungus with commercial potential for the
biocontrol of root knot and cyst nematodes. It
produces an alkaline serine protease, Ver112,
during infection of the saprophytic nematode
Panagrellus redivivus. Ver112 had been purified
from culture filtrates of L. psalliotae. The N-terminal amino acid sequence has been submitted to
Swiss-Prot (accession number Q68GV9). In this
report, we described the cloning of an alkaline
serine protease from L. psalliotae by the 3¢ and 5¢
RACE method, the analysis of the primary amino acid sequence of protease Ver112 from three
isolates, and comparison with other cuticledegrading serine proteases isolated from different
nematophagous and entomopathogenic fungi.
1330
Materials and methods
Microorganisms and culture conditions
Three isolates (112, 602 and 608) of nematophagous fungus Lecanicillium psalliotae used in this
study were originally isolated from field soil
samples in Yunnan Province; strain 112 has been
deposited in the China General Microbiological
Culture Collection Center. Fungi were cultured
in PD (potato/dextrose) medium at 26 C with
shaking at 200 rpm for 3 days.
Escherichia coli DH 5a was used in all DNA
manipulations and grown in Luria--Bertani medium containing (per liter): 10 g tryptone,
10 g NaCl, 5 g yeast extract, and 16 g agar.
Genomic DNA and total RNA extraction
Mycelium were collected by filtration in a sterilized filter funnel and ground to a fine powder in
liquid N2. DNA was extracted according to the
method of Zhang et al. (1996).
Total RNA extraction was done according to
the manual of TRIzol Reagent (Invitrogen,
America), and RNA was stored at )70 C.
Amplification of 3¢ and 5¢ nucleotide sequence
A partial cDNA of Ver112 was obtained by 3¢
RACE kit (Invitrogen, America) using a degenerate primer, SERP3-1 5¢-ACNCARCARCARGG
NGCNAC-3¢, which was designed according to
the N-terminal amino acid residues of the protease
Ver112. The first strand cDNA and target cDNA
were synthesized according to the manual of 3¢
RACE system for rapid amplification of cDNA
ends. 5¢ RACE was conducted as described in the
manual of 5¢ RACE system for rapid amplification of cDNA ends using two gene-specific primers derived from the 3¢ RACE product, R5-1
5¢-AGTCTTGGACTCCGATGGTG-3¢, and R52 5¢-TGGGAGATGCGAGTAAGTC -3¢.
RACE, genomic DNA and the first strand of
cDNA was used as template, respectively. Target
DNA and cDNA were amplified by a touchdown program (Kim et al. 2003).
The cDNA and genomic sequences were compared using the DNAman software package
(Version 5.2.2, Lynnon Biosoft, Canada).
Cloning and sequencing
The PCR products were purified from a 1% agarose gel using a DNA fragment purification kit
ver 2.0 (Takara, Japan) and subcloned into
pGEM-T Vector (Promega, America). White colonies were randomly selected and purified using
the plasmid DNA purification kit (Qiagen, German) and the plasmid DNA was sequenced using
an ABI 3730 autosequencer (Perkin--Elmer,
America) with four fluorescent dyes. The
sequencing primers were T7 and SP6 universal
primers (Takara, Japan). Sequence data were
analyzed using DNAman software package. Sequence identity was compared with other cuticledegrading protease gene using the GenBank
database.
Sequence analysis
Database searches were performed using
BlastX
(http://www.ncbi.nlm.nih.gov/BLAST).
Signal sequence prediction was performed
using Signal P (http://www.cbs.dtu.dk/services/
signalP) (Henrik et al. 1997). Multiple sequence
alignments were performed using DNAman
software package. Proteins were examined for
conserved motifs using Pfam (http://pfam. wustl.edu/hmmsearch. shtml) (Garcia-Sanchez et al.
2004). N-linked glycosylation sites were predicted by NetNGlyc (http://www.cbs.dtu.dk/services/NetNGlyc/).
Results
Amplification of the Ver112 chromosomal gene
and full-length cDNA
Cloning of the cuticle-degrading serine protease
Two gene-specific primers, FP 5¢-CTGATTATCAACAAGATGCGTC-3¢ and RP 5¢-TTACG
TGGCGCCGTTGAAGGC-3¢, were designed
according to the PCR fragments of 3¢ and 5¢
Under the conditions described above, a 500 bp
PCR product (Figure 1) was successfully amplified by 5¢ RACE and sequencing indicated that
the PCR fragment contained a putative start co-
1331
Fig. 1. Result of PCR amplification. Lanes 1, 2 and 4 -- result of 5¢ RACE amplification; lanes 3 and 5 -- DNA marker (Ladder
100 bp, Promega, America); lanes 6 and 9 -- PCR fragment amplified with genomic DNA as template; lanes 7, 8 and 10 -- PCR
fragment amplified with the first strand of cDNA as template.
don (ATG). One thousand one hundred and fifty
and 1350 bp fragments (Figure 1) were amplified
by using, respectively, the first strand of cDNA
and genomic DNA as template from three isolates of L. psalliotae. These fragments were also
cloned and sequenced. The combined nucleotide
sequence for the partial DNA and cDNA were
1640 and 1440 bp, respectively.
Sequence analysis
The sequence of Ver112 comprised an ORF,
which contained three introns and four exons. It
encoded a polypeptide of 382 amino acid residues with a Mr of 39.654, which shared conserved motifs with subtilisin N and peptidase S8.
Comparison of Ver112 with other serine proteases from nematophagous fungi revealed that it
was typical of fungal serine proteases, which possessed a pre-pro-peptide structure. It has a signal
peptide (15 amino acids) consisting of the initial
methionine, a core of seven hydrophobic residues, a helix-breaking residue (proline), and four
hydrophobic residues before a signal peptidase
cleavage site (Ala-Leu-Ala). Comparison of the
deduced amino acid sequence with the N-terminal sequence of Ver112 revealed that the mature
protein started at residue 103, and the final residue of the pro-peptide was an asparagine (N),
position in 102. Each intron began with GT and
ended with AG, which was a common feature of
fungal introns and had been observed in the serine protease gene from Acremonium chrysogenum
(Isogai et al. 1991). The mature protein consisted
of 280 amino acids.
Comparison of the nucleotide sequences of
Ver112 from three isolates of L. psalliotae re-
vealed that they were very conservative, the
nucleotide sequences from L. psalliotae 112 and
608 were identical, and there were four nucleotide residues different from L. psalliotae 602, two
of them located at the second intron, and two
other variable nucleotides located at different exons, which resulted in one amino acid polymorphism at position 230, arginine (A) changed to
glycine (G). Like VCP1, Ver112 lacks any
N-linked glycosylation site (Asn-X-Ser/Thr).
These nucleotide sequences have been submitted
to GenBank, under accession numbers AY
692148 (112 and 608) and AY870806 (602).
Comparison of Ver112 with other serine
proteases isolated from nematophagous
and entomopathogenic fungi
These cuticle-degrading proteases shared some
similar biochemical properties of low molecular
mass and being inhibited by PMSF (phenylmethylsulfonylfluoride) (Table 1). However, PII
and Aozl isolated from nematode-trapping fungi
A. oligospora had lower pI and higher molecular
masses than other proteases from nematophagous and entomopathogenic fungi.
The databank search showed that Ver112
shared extensive similarities to fungal members
of the subtilisin family of serine proteases
(Figure 2). The deduced amino acid sequence of
the Ver112 showed 39.6%, 41.7%, 62.8%,
75.7%, 57.0%, 61% and 58.2% identity, respectively, to Aozl (Arthrobotrys oligospora), PII (A.
oligospora), PIP (Pic. lilacinus), Pr1 (Beauveria
bassiana), PrA (Metarhizium anisopliae), Prk
(Tritirachium album), and VCP1 (Po. chlamydosporia). The signal peptide and pro-region cleav-
1332
Table 1. Partial characterization of cuticle-degrading serine proteases isolated from different nematophagous and entomopathogenic
fungi.
Protease
PII
Aozl
VCPl
P32
Ver112
PIP
PrA
Pr1
Fungus
Arthrobotrys oligospora
Arthrobotrys oligospora
Pochonia chlamydosporia
Pochonia suchlasporia
Lecanicillium psalliotae
Paecilomyces lilacinus
Metarhizium anisopliae
Beauveria bassiana
Molecular mass (kDa)
35
38
33
32
32
33
25
32
Inhibitor of protease
a
PMSF
PMSF, SSIb
PMSF
PMSF, pCMBc
PMSF
PMSF
PMSF
PMSF
pI
Reference
4.6
4.9
10.2
--10.2
10.2
10.0
Tunlid et al. (1994)
Zhao et al. (2004)
Segers et al. (1994)
Lopez-Llorca LV (1990)
GenBank (AAU01968)
Bonants et al. (1995)
St Leger et al. (1992)
Joshi et al. (1995)
a
PMSF, phenylmethylsulfonylfluoride.
SSI, Streptomyces subtilisin inhibitor.
c
pCMB, p-chloromercuric benzoic acid.
b
age sites of them were conserved and the first
amino acid of mature proteases was alanine.
They shared the conservation of the aspartic acid
(Asp143)--histidine (His173)--serine (Ser328) (in
Ver112) catalytic triad. The two blocks of sidechains that form the sides of the substrate-binding S1 pocket in subtilisin occur in regions of
high similarity and consist of Ser236Leu237Gly238
and Ala262Ala263Gly264, respectively, in Ver112.
Furthermore, the highly conserved Asn265 (in
Ver112) is important in subtilisin for stabilization
of the reaction intermediate formed during proteolysis (Kraut 1977).
Discussion
Extracellular serine proteases have been isolated,
cloned and purified from several nematophagous
and entomopathogenic fungi. From Table 1 and
Figure 2, these cuticle-degrading serine proteases
from different nematophagous and entomopathogenic fungi may be divided into two categories
according to the difference of biochemical characterization and primary sequence. Class I is isolated from nematode-trapping fungi and has
lower pI, and class II is isolated from nematode-
parasitic or egg-parasitic fungi and has higher pI.
However, whether the differences of biochemical
characterization between classes II and I are
important for the ability of the enzymes to degrade components of the nematode cuticle and
eggshell, respectively, and whether the differences
is connected to their mode of infection are currently not known.
The high degree of similarities between extracellular serine proteases from different nematophagous and entomopathogenic fungi suggest
that they may derive from a common ancestral
subtilisin-like protease gene. Cloning of Ver112
provides a good foundation for future investigation of infection mechanism and improvement
the pathogenicity of nematophagous and entomopathogenic fungi.
Acknowledgement
We are grateful to Dr. Dilantha Fernando in
the University of Manitoba, Canada, and Dr.
Li Haipeng in the Ludwig-Maximilians-Universität München, Germany, for their invaluable
comments and revising the manuscript. The
c
Fig. 2. Alignment of subtilase amino acid sequences from Arthrobotrys oligospora (PII and Aozl), Paeciliomyces lilacinus (PIP),
Beauveria bassiana (Pr1), Metarhizium anisopliae (PrA), Tritirachium album (Prk), Pochonia chlamydosporia (VCP1) and Lecanicillium psalliotae (Ver112). The GenBank accession numbers are CAA63841, AAM93666, AAA91584, AAK70804, CAB64346, P06873,
CAD20578 and AAU01968, respectively. Areas shaded in black are conserved regions (100% similarity), areas shaded in gray are
high degree similarity (more than 50% similarity) and unshaded areas are regions of variability between the proteases. , indicates
Putative signal-sequence cleavage site; . indicates Proregion cleavage site. m indicates the aspartic acid (Asp143)--histidine (His173)-serine (Ser328) (in Ver112) catalytic triad. The underlined region is the substrate-binding S1 pocket in subtilisin.
1333
1334
work was funded by the projects from Ministry of Science and Technology of China (approved No. 2002BA901A21) and Department
of Science and Technology of Yunnan Province
(approved
No.
2004C0001Z,
No.
2003C0003Q).
References
Åhman J, EK B, Rask L, Tunlid A (1996) Sequence analysis
and regulation of a gene encoding a cuticle-degrading serine
protease from the nematophagous fungus Arthrobotrys
oligospora. Microbiology 142: 1605--1616.
Bonants PJ, Fitters PF, Thijs H, Den BE, Waalwijk C,
Henfling JW (1995) A basic serine protease from Paecilomyces lilacinus with biological activity against Meloidogyne
hapla eggs. Microbiology 141: 775--784.
Garcia-Sanchez A, Cerrato R, Larrasa J, Ambrose NC, Parra
A, Alonso JM, Hermoso-de-Mendoza M, Rey JM, Mine
MO, Carnegie PR, Ellis TM, Masters AM, Pemberton AD,
Hermoso-de-Mendoza J (2004) Characterization of an
extracellular serine protease gene (nasp gene) from Dermatophilus congolensis. FEMS Microbiol. Lett. 231: 53--57.
Henrik N, Engelbrech TJ, Brunak S, Von HG (1997)
Identification of prokaryotic and eukaryotic signal peptides
and prediction of their cleavage sites. Protein Eng. 10: 1--6.
Isogai T, Fukagawa M, Kojo H, Kohsaka M, Aoki H,
Imanaka H (1991) Cloning and nucleotide sequences of the
complementary and genomic DNA for the alkaline protease
from Acremonium chrysogenum. Agric. Biol. Chem. 55: 471-477.
Joshi L, St Leger RJ, Bidochka MJ (1995) Cloning of a cuticledegrading protease from the entomopathogenic fungus,
Beauveria bassiana. FEMS Microbiol. Lett. 125: 211--218.
Kim SK, Lee SB, Kang TJ, Chae GT (2003) Detection of gene
mutations related with drug resistance in Mycobacterium
leprae from leprosy patients using Touch-Down (TD) PCR.
FEMS Immunol. Med. Microbiol. 36: 27--32.
Kraut J (1977) Serine proteases structure and mechanism of
catalysis. Annu. Rev. Biochem. 46: 331--358.
Lopez-Llorca LV (1990) Purification and properties of extracellular proteases produced by the nematophagous fungus
Verticillium suchlasporium. Can. J. Microbiol. 36: 530-537.
Schenck S, Chase T, Jr, Rosenzweig WD, Pramer D (1980)
Collagenase production by nematode-trapping fungi. Appl.
Environ. Microbiol. 40: 567--570.
St Leger RJ, Frank DC, Roberts DW, Staple RC (1992)
Molecular cloning and regulatory analysis of the cuticledegrading protease structural gene from the entomopathogenic fungus Metarhizium anisopliae. Eur. J. Biochem. 204:
991--1001.
Segers R, Butt TM, Kerry BR, Peberdy JF (1994) The
nematophagous fungus Verticillium chlamydosporium produces a chymoelastase-like protease which hydrolyses host
nematode proteins in situ. Microbiology 140: 2715--2723.
Tikhonov VE, Lopez-Llorca LV, Salinas J, Jansson HB (2002)
Purification and characterization of chitinases from the
nematophagous fungi Verticillium chlamydosporium and
Verticillium suchlasporium. Fungal Genet. Biol. 35: 67--78.
Tunlid A, Rosen S, EK B, Rask L (1994) Purification and
characterization of an extracellular serine protease from the
nematode-trapping fungus Arthrobotrys oligospora. Microbiology 140: 1687--1695.
Zhang D, Yang Y, Castlebury LA, Cerniglia CE (1996) A
method for the large scale isolation of high transformation
efficiency fungal genomic DNA. FEMS Microbiol. Lett. 145:
261--265.
Zhao ML, Mo MH, Zhang KQ (2004) Characterization of a
neutral serine protease and its full-length cDNA from the
nematode-trapping fungus Arthrobotrys oligospora. Mycologia 96: 16--22.
Biotechnology Letters (2005) 27: 1335
DOI 10.1007/s10529-005-1074-9
Ó Springer 2005


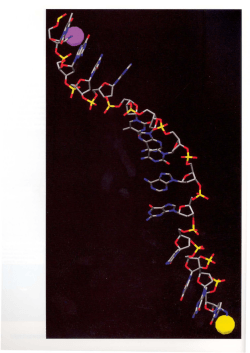

© Copyright 2026