
Document 352659
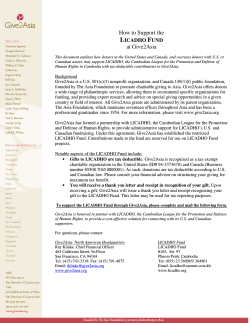
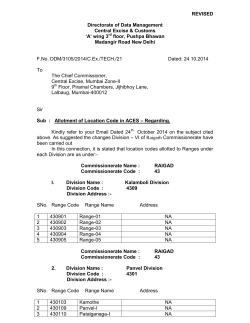
Oct 20, 2014
Gudang Garam
Sebastian Tobing
Company Focus
([email protected])
Minor impact from higher excise tax
Higher excise tax has been announced
Ministry of Finance has announced excise tax for: 1) SKM cigs with
production more than 2bn sticks to be Rp415/stick, up 10.7% from
Rp375/stick in 2013-14. 2) SKT cigs with production more than 2bn
sticks to be Rp290/stick, up 5.5% from Rp275/stick.
Minor downside to Gudang Garam
The excise tax on SKM is higher than our expectation by c1%, while the
impact on SKT is below our expectation by 11%. However, as SKM still
contribute more than 90% of GGRM’s total revenue, the net impact is
still a downgrade on 2015 EBIT and net profit by 1.4% and 1.6% respectively. We are also downgrading our FY15 EBIT margin by 20bps
from 12.3% to 12.5%. Historically GGRM will pass-on the price increase
in stages, perhaps as early as next year. We are assuming ASP growth
of 7.9% for SKM and 9% for SKT in 2015, along with 6.6% volume
growth.
Downgrade to Hold on rising risk-free rate; but higher PT
We downgrade our rating from Buy to Hold as share price have rallied
almost 30% in the past three months. However, we are still upgrading
our price target to Rp66,300/share from Rp62,600 on the back of lower
cost of debt assumption that more than offset the rising risk-free rate.
We revised our risk-free rate from 7.5% to 8.1% and the cost of debt
from 11% to 7.5%. The changes in price target mostly come from the
changes in WACC relative to changes in our excise tax estimates.
Valuation: Hold, PT of Rp66,300/sh
We apply DCF methodology to derive our price target. We apply riskfree rate of 8.1% and WACC of 10.1%. Our new price target implies 23x
2015 PE and 19x 2016 PE. GGRM currently trades at 23x 2015 PE and
19x 2016 PE respectively.
Founded in 1958, Gudang Garam grew
into one of the biggest and most wellknown cigarette company in Indonesia,
providing both the choice and quality associated with Gudang Garam.
HOLD
Rp66,300
Company Update
Share Price
Sector
Price Target
Rp60,500
Consumer
Rp66,300 (9%)
Stock Data
Reuters Code
Bloomberg Code
Issued Shares (m)
Mkt Cap (Rpbn)
Avg. Value Daily
6 month (Rpm)
52-Wk range
GGRM.JK
GGRM.IJ
1,924
116,407
Rp49.6
Rp61,500/Rp33,850
Major Shareholders
PT. Suryaduta Investama
Others
Public
69.3%
7.2%
23.5%
Consensus
EPS
Consensus (Rp)
TRIM vs Cons. (%)
Companies Data
14F
2,763
(8.0)
15F
3,232
(10.4)
2012
2013
2014F
2015F
2016F
49,029
55,437
63,113
71,742
81,713
Net Profit (Rpbn)
4,014
4,329
4,921
5,633
6,597
7 0 ,0 0 0
7 , 0 0 0 ,0 0 0
EPS (Rp)
2,086
2,250
2,558
2,928
3,429
6 0 ,0 0 0
6 , 0 0 0 ,0 0 0
-18.0%
7.8%
13.7%
14.5%
17.1%
5 0 ,0 0 0
5 , 0 0 0 ,0 0 0
4 0 ,0 0 0
4 , 0 0 0 ,0 0 0
3 0 ,0 0 0
3 , 0 0 0 ,0 0 0
Year end Dec
Sales (Rpbn)
EPS Growth (%)
DPS (Rp)
BVPS (Rp)
P/E (x)
Div Yield (%)
1,000
800
900
1,100
1,300
Stock Price
V o lu m e
P r ic e
13,760
15,209
16,867
18,743
20,937
2 0 ,0 0 0
2 , 0 0 0 ,0 0 0
25
24
24
21
18
1 0 ,0 0 0
1 , 0 0 0 ,0 0 0
1.9%
1.5%
1.7%
2.1%
2.5%
PT Trimegah Securities Tbk - www.trimegah.com
O c t- 1 3
D e c-1 3
Fe b-1 4
A p r- 1 4
J u n -1 4
Aug-14
O c t- 1 4
COMPANY FOCUS
1
Impact of higher excise tax
Indonesian Government has increased the cigarette excise tax:
1) For SKM (machine-rolled) cigarette with production above 2bn sticks, the excise tax is raised to Rp415/stick
(up 10.7% yoy) from Rp375/stick.
2) For SKT (hand-rolled) cigarette with production above 2bn sticks, the exciset tax is raised to Rp290/stick (up
5.5%) from Rp275/stick.
We have previously estimated our SKM excise tax to be Rp410 (1.2% below realized) and our SKT excise tax to
be Rp327/stick (11% higher than realized).
SKM cigarettes currently contribute up to 93% of GGRM’s total revenue.
Figure 1. SKM excise cost
Net revenue margin / stick (LHS)
Excise tax (Rp/stick) (RHS)
450
42.0%
40.0%
400
38.0%
350
36.0%
300
34.0%
250
32.0%
200
30.0%
2009
2010
2011
2012
2013
2014
2015
Source: TRIM Research, Company
Figure 2. SKT excise cost
Tota l excise tax (Rp)
Net Revenue Margin
300
60.0%
280
55.0%
260
240
50.0%
220
45.0%
200
180
40.0%
160
140
35.0%
120
30.0%
100
2009
2010
2011
2012
2013
2014
2015
Source: TRIM Research, Company
PT Trimegah Securities Tbk - www.trimegah.com
COMPANY FOCUS
2
Figure 3. Impact to our earning estimate
2014E
2015E
2016E
Before
After
% Chg
Before
After
% Chg
Before
After
Sales
63,113
63,113
0.0%
71,742
Gross profit
12,161
12,161
0.0%
13,724
EBIT
7,769
7,769
0.0%
Net profit
4,921
4,921
EPS
2,558
2,558
Gross
19.3%
EBIT
% Chg
71,742
0%
81,713
81,713
0.0%
13,596
-0.9%
15,502
15,331
-1.1%
8,965
8,838
-1.4%
10,234
10,063
-1.7%
0.0%
5,726
5,633
-1.6%
6,722
6,597
-1.9%
0.0%
2,976
2,928
-1.6%
3,494
3,429
-1.9%
19.3%
19.1%
19.0%
19.0%
18.8%
12.3%
12.3%
12.5%
12.3%
12.5%
12.3%
7.8%
7.8%
8.0%
7.9%
8.2%
8.1%
SKM
8.6%
8.6%
7.9%
7.9%
7.8%
7.8%
SKT
8.6%
8.6%
9.0%
9.0%
9.0%
9.0%
SKM
71.7
71.7
0%
76.4
76.4
0%
81.5
81.5
0%
SKT
8.3
8.3
0%
7.5
7.5
0%
6.8
6.8
0%
Margin
Net
Price increase, %
Sales volume, bn stick
Source:TRIM Research, Company
The impact to our earning estimate is modest, as the downgrade in EBIT was offset by our higher expectation for
SKT cigs. The impact to our EBIT estimate in 2015 is a 1.4% downgrade and to net profit a 1.6% downgrade.
However, this will also impact our 2016 estimates by roughly the same amount and subsequent years as the
excise tax becomes the new floor for subsequent hike.
We view that GGRM, may increase its ASP in stages to allow margin recovery. Thanks to the excise tax the net
revenue margin per stick have fallen to around 36%, a level not seen in the past five years. Historically GGRM is
able to pass-on the excise tax, though in periods. Given the higher than expected tax hike this year, the ASP
appreciation might take a while.
PT Trimegah Securities Tbk - www.trimegah.com
COMPANY FOCUS
3
Valuation
Figure 4. WACC and DFC calculations
2016F
2017F
2018F
2019F
2020F
2021F
2022F
2023F
2024F
2025F
2016F
7,547
(1,509)
(3,195)
1,351
2017F
8,600
(1,567)
(3,670)
1,441
2018F
9,761
(1,628)
(4,090)
1,537
2019F
10,999
(1,691)
(4,727)
1,638
2020F
12,361
(1,757)
(5,252)
1,744
2021F
13,852
(1,827)
(5,979)
1,856
2022F
15,460
(1,900)
(6,639)
1,975
2023F
17,180
(1,977)
(7,504)
2,100
2024F
19,031
(2,057)
(8,319)
2,232
2025F
21,011
(2,142)
(9,370)
2,372
4,194
4,804
5,580
6,218
7,096
7,903
8,896
9,799
10,887
11,870
221,828
Discount factor
Discounted FCFF
Total discounted FCFF
Net debt / (Net cash)
Minority Interest
NAV
1.00
4,194
140,947
13,310
73
127,564
1.10
4,364
1.21
4,604
1.33
4,660
1.47
4,830
1.62
4,887
1.78
4,996
1.96
4,999
2.16
5,045
2.38
98,368
# of shares (bn)
NAV / share
Market price
Upside/(downside)
1.92
66,300
61,000
9%
Risk free rate
Market premium
Beta
Debt proportion
Tax rate
Equity cost of capital
Debt cost of capital
WACC
LT growth rate
8.1%
5.0%
0.99
40%
25%
13.1%
7.5%
10.1%
4.5%
EBIT x (1 - tax)
Less: Capital Expenditure
Changes in Working Capital
Add: Depreciation &
Amortization
FCFF
LT Growth
2013
2014
2015
2016
Rp/sh
2,250
2,558
2,928
3,429
Growth YoY
%
7.8%
13.7%
14.5%
17.1%
P/E - Current
x
27.1
23.8
20.8
17.8
P/E - TP
x
29.5
25.9
22.6
19.3
EPS
Source:TRIM Research, Company
Downgrade to HOLD
We are downgrading our recommendation to HOLD following GGRM’s stellar performance in the past three
months. Share price have performed 30% during this period, outperforming JCI. Combined with the rising riskfree rate and negative headline from higher than expected excise tax, we are downgrading our recommendation
to Hold.
We are still upgrading our price target Ro66,300/share on the back of lower WACC from our downward revision of
company’s cost of debt assumption (from 11% to 7.5%) that more than offset our rising risk-free rate assumption (from 7.5% to 8.1%),
We apply DCF methodology to value GGRM, the stock currently trades at 21x 2015 PE and 18x 2016 PE post our
earnings revision.
PT Trimegah Securities Tbk - www.trimegah.com
COMPANY FOCUS
4
Risk
Raw materials supply and price may affect profitability
Gudang Garam, as with other cigarette companies, are dependent on local supply of clove and tobacco to meet
its production needs. This is especially relevant for clove since the government has imposed restriction on clove
import (in recent years the only time clove is allowed to be imported was in Jan ’12, when clove price hit historical high Rp240,000/kg). The harvests of clove (in March) and tobacco (in Aug/Sep) will affect the supply of raw
materials. While the harvests for 2014 are within expectation, there is a risk future harvest unable to meet industry’s demand, causing the price to soar. Without alternative supply source, Company’s profitability margin will
take negatively affected.
Advertising and packaging requirement
The promotional activities of cigarettes in Indonesia are restricted. Currently when advertising tobacco the packaging is not allowed to be shown, as well as the broadcast of tobacco advertising is limited to 9.30 pm to 5.00
am. Health warnings are also shown at the end of every advertisement. As of June 2014, a new restriction was
imposed, requiring cigarette companies to print graphic image of tobacco-related diseases that occupy 40% of
the packaging, in hope to raise health warnings and curb cigarette demand. While we believe the current advertising restrictions will not significantly affect the sales and profitability of the Company, further restrictions may
be implemented.
Potential increase of excise tax
Price is the most significant driver in cigarette sales. With the poor spending 12% of their income on cigarettes
(second only to rice at 18%), the growth of the cigarette sales depend on its affordability. The price of cigarette
in Indonesia at USD0.75-1.65 for a pack of 20 is far less than those in neighbouring countries. In Malaysia or
Thailand, the same pack can go for USD3-5 and in Australia, it can cost up to USD17. For Gudang Garam, excise
tax made up 67% of its cost of sales. Hence the potential increase of excise tax will significantly affect the demand for cigarettes as well as the profitability of the Company. The average excise tax is 46% of the base price,
compared with the 57% potential excise tax regulated in the law. Furthermore a regional excise tax on cigarettes
of 10% has been implemented in Jan ’14. With the possibility of a further 11% increase in excise tax and future
additional regulation, this represents a risk for the Company.
Decrease of purchasing power
Cigarette companies, Gudang Garam included, may face the risk of decreasing purchasing power in Indonesia.
The issue of cutting back or removing subsidized fuel will cause inflation
PT Trimegah Securities Tbk - www.trimegah.com
COMPANY FOCUS
5
Income Statement (Rpbn)
Year end Dec
Revenue
Balance Sheet (Rpbn)
2012
2013
2014F
2015F
2016F
Year end Dec
2012
2013
2014F
2015F
2016F
49,029
55,437
63,113
71,742
81,713
Cash and equivalents
1,286
1,404
1,300
1,345
1,808
13.8%
13.7%
13.9%
12,161
13,724
15,502
Other curr asset
28,668
33,200
37,938
41,885
46,382
Net fixed asset
10,389
14,789
16,418
16,607
16,765
2,452
2,781
2,822
2,884
3,361
41,509
50,770
57,178
61,376
66,508
ST debt
8,164
12,979
14,979
14,479
13,979
Other curr liab
5,638
7,116
8,270
9,283
10,609
0
0
0
0
0
1,101
1,259
1,259
1,259
1,259
131
152
217
291
376
15,035
21,506
24,725
25,313
26,223
36,064
40,285
Revenue Growth (%)
17.1%
Gross Profit
9,185
13.1%
10,874
Opr. Profit
6,007
6,650
7,769
8,965
10,234
EBITDA
7,031
7,758
8,952
10,230
11,585
Other asset
EBITDA Growth (%)
-8.9%
10.3%
15.4%
14.3%
13.2%
Total asset
Net Int Inc/(Exp)
(495)
(756)
(1,035)
(1,092)
(1,032)
Gain/(loss) Forex
(18)
(13)
17
(18)
16
Other Inc/(Exp)
(988) (1,053)
(1,184)
(1,265)
(1,351)
Pre-tax Profit
5,531
5,936
6,751
7,855
9,218
Tax
1,462
1,552
1,765
2,054
2,410
Minority Int.
(55)
(55)
(64)
(74)
(85)
Extra. Items
0
0
0
0
0
Reported Net Profit
4,014
4,329
4,921
5,726
6,722
Core Net Profit
4,031
4,342
4,904
5,745
6,707
13.0%
17.1%
16.7%
900
1,100
1,300
Growth (%)
Dividend per share
growth (%)
-17.8%
7.7%
1,000
800
13.6%
-20.0%
12.5%
22.2%
18.2%
0.4
0.4
0.4
0.4
0.4
Dividend payout ratio
Cash Flow (Rpbn)
LT debt
Other LT Liab
Minority interest
Total Liabilities
Total Equity
26,475
29,264
32,454
Net (debt) / cash
(6,879)
(11,575)
(13,679)
Total cap employed
27,707
30,676
33,930
37,614
41,920
Net Working capital
23,030
26,085
29,669
32,602
35,773
8,164
12,979
14,979
14,479
13,979
Debt
Key Ratio Analysis
Year end Dec
2012
2013
2014F
2015F
2016F
Core Net Profit
4,031
4,342
4,904
5,745
6,707
Profitability
Depr / Amort
1,024
1,108
1,184
1,265
1,351
(848)
Chg in non-cash
Working Cap
Others
2,572
(13,134) (12,171)
(1,149)
(1,113)
(952)
Year end Dec
2012
2013
2014F
2015F
2016F
Gross Margin (%)
18.7%
19.6%
19.3%
19.1%
19.0%
Opr Margin (%)
12.3%
12.0%
12.3%
12.5%
12.5%
EBITDA Margin (%)
14.3%
14.0%
14.2%
14.3%
14.2%
8.2%
7.8%
7.8%
8.0%
8.2%
ROAE (%)
15.8%
15.5%
15.9%
16.7%
17.6%
ROAA (%)
10.0%
9.4%
9.1%
9.7%
10.5%
(4,015)
(1,997)
(2,454)
(2,000)
(2,307)
3,612
2,304
2,521
4,058
4,902
Capex
(2,911)
(5,429)
(2,813)
(1,454)
(1,509)
Others
(649)
(211)
(145)
(17)
(14)
CF's from investing
(3,560)
(5,640)
(2,958)
(1,471)
(1,523)
Current ratio (x)
2.2
1.7
1.7
1.8
2.0
Net change in debt
2,000
4,814
2,000
(500)
(500)
Net Debt to Equity (x)
0.3
0.4
0.4
0.4
0.3
Net Debt to EBITDA
(x)
Interest Coverage (x)
1.0
1.5
1.5
1.3
1.1
11.3
8.4
7.4
8.1
9.6
CF's from oprs
Others
(1,861)
(1,360)
CF's from financing
139
Net cash flow
191
Cash at BoY
Cash at EoY
Free Cashflow
Stability
(1,667)
(2,042)
(2,416)
3,454
333
(2,542)
(2,916)
118
(104)
45
463
1,095
1,286
1,404
1,300
1,345
A/P (days)
4
6
6
6
6
1,286
1,404
1,300
1,345
1,808
A/R (days)
10
14
14
14
14
5,667
(1,049)
2,170
4,604
5,632
Inventory (days)
241
244
244
236
229
Interim Result (Rpbn)
Efficiency
Capital History
4Q12
1Q13
2Q13
3Q13
4Q13
13,999
13,379
15,420
15,670
16,997
Gross Profit
2,859
2,627
2,947
3,255
3,219
Opr. Profit
1,686
1,611
1,847
2,201
2,021
Net profit
1,155
1,034
1,093
1,417
1,318
Gross Margins (%)
20.4%
19.6%
19.1%
20.8%
18.9%
Opr Margins (%)
12.0%
12.0%
12.0%
14.0%
11.9%
Net Margins (%)
8.3%
7.7%
7.1%
9.0%
7.8%
Sales
Core Net Margin (%)
PT Trimegah Securities Tbk - www.trimegah.com
Date
27-Aug-90
IPO@Rp10,250
COMPANY FOCUS
6
PT Trimegah Securities Tbk
Gedung Artha Graha 18th Floor
Jl. Jend. Sudirman Kav. 52-53
Jakarta 12190, Indonesia
t. +62-21 2924 9088
f. +62-21 2924 9150
www.trimegah.com
DISCLAIMER
This report has been prepared by PT Trimegah Securities Tbk on behalf of itself and its affiliated companies and is provided for information
purposes only. Under no circumstances is it to be used or considered as an offer to sell, or a solicitation of any offer to buy. This report has
been produced independently and the forecasts, opinions and expectations contained herein are entirely those of Trimegah Securities.
While all reasonable care has been taken to ensure that information contained herein is not untrue or misleading at the time of publication,
Trimegah Securities makes no representation as to its accuracy or completeness and it should not be relied upon as such. This report is
provided solely for the information of clients of Trimegah Securities who are expected to make their own investment decisions without reliance
on this report. Neither Trimegah Securities nor any officer or employee of Trimegah Securities accept any liability whatsoever for any direct or
consequential loss arising from any use of this report or its contents. Trimegah Securities and/or persons connected with it may have acted
upon or used the information herein contained, or the research or analysis on which it is based, before publication. Trimegah Securities may in
future participate in an offering of the company’s equity securities.


© Copyright 2026