
11011–11029, www.atmos-chem-phys.net/14/11011/2014/ doi:10.5194/acp-14-11011-2014 © Author(s) 2014. CC Attribution 3.0 License.
Atmos. Chem. Phys., 14, 11011–11029, 2014
www.atmos-chem-phys.net/14/11011/2014/
doi:10.5194/acp-14-11011-2014
© Author(s) 2014. CC Attribution 3.0 License.
Modeling ultrafine particle growth at a pine forest site influenced by
anthropogenic pollution during BEACHON-RoMBAS 2011
Y. Y. Cui1 , A. Hodzic2 , J. N. Smith2,3 , J. Ortega2 , J. Brioude4,5 , H. Matsui6 , E. J. T. Levin7 , A. Turnipseed2 ,
P. Winkler2,8 , and B. de Foy1
1 Department
of Earth and Atmospheric Sciences, Saint Louis University, MO, USA
Center for Atmospheric Research, Atmospheric Chemistry Division, P.O. Box 3000, Boulder, CO 80307, USA
3 Department of Applied Physics, University of Eastern Finland, Kuopio, Finland
4 Chemical Sciences Division, Earth System Research Laboratory, NOAA, Boulder, CO 80305, USA
5 Cooperative Institute for Research in Environmental Sciences, University of Colorado, Boulder, CO 80309, USA
6 Japan Agency for Marine-Earth Science and Technology, Kanagawa, Japan
7 Department of Atmospheric Science, Colorado State University, Fort Collins, CO, USA
8 Faculty of Physics, University of Vienna, Boltzmanngasse 5, 1090 Vienna, Austria
2 National
Correspondence to: A. Hodzic ([email protected])
Received: 6 February 2014 – Published in Atmos. Chem. Phys. Discuss.: 4 March 2014
Revised: 11 August 2014 – Accepted: 9 September 2014 – Published: 20 October 2014
Abstract. Formation and growth of ultrafine particles is
crudely represented in chemistry-climate models, contributing to uncertainties in aerosol composition, size distribution,
and aerosol effects on cloud condensation nuclei (CCN) concentrations. Measurements of ultrafine particles, their precursor gases, and meteorological parameters were performed in
a ponderosa pine forest in the Colorado Front Range in July–
August 2011, and were analyzed to study processes leading
to small particle burst events (PBEs) which were characterized by an increase in the number concentrations of ultrafine
4–30 nm diameter size particles. These measurements suggest that PBEs were associated with the arrival at the site of
anthropogenic pollution plumes midday to early afternoon.
During PBEs, number concentrations of 4–30 nm diameter
particles typically exceeded 104 cm−3 , and these elevated
concentrations coincided with increased SO2 and monoterpene concentrations, and led to a factor-of-2 increase in CCN
concentrations at 0.5 % supersaturation. The PBEs were simulated using the regional WRF-Chem model, which was extended to account for ultrafine particle sizes starting at 1 nm
in diameter, to include an empirical activation nucleation
scheme in the planetary boundary layer, and to explicitly simulate the subsequent growth of Aitken particles (10–100 nm)
by condensation of organic and inorganic vapors. The updated model reasonably captured measured aerosol number
concentrations and size distribution during PBEs, as well as
ground-level CCN concentrations. Model results suggest that
sulfuric acid originating from anthropogenic SO2 triggered
PBEs, and that the condensation of monoterpene oxidation
products onto freshly nucleated particles contributes to their
growth. The simulated growth rate of ∼ 3.4 nm h−1 for 4–
40 nm diameter particles was comparable to the measured
average value of 2.3 nm h−1 . Results also suggest that the
presence of PBEs tends to modify the composition of sub20 nm diameter particles, leading to a higher mass fraction of
sulfate aerosols. Sensitivity simulations suggest that the representation of nucleation processes in the model largely influences the predicted number concentrations and thus CCN
concentrations. We estimate that nucleation contributes 67 %
of surface CCN at 0.5 % supersaturation in this pine forest
environment.
1
Introduction
Submicron particles reduce atmospheric visibility, impact
human health, and influence climate by radiative forcing
and by modifying the number of cloud condensation nuclei (CCN) (Somers et al., 2004; Laaksonen et al., 2005).
To accurately predict these effects, precise estimates of the
Published by Copernicus Publications on behalf of the European Geosciences Union.
11012
Y. Y. Cui et al.: Modeling ultrafine particle growth at a pine forest site
aerosol size distribution are required (Adams and Seinfeld,
2002; Dusek et al., 2010) in addition to the typically reported mass concentrations. Modeling aerosol size distributions is challenging due to uncertainties involved in the formation and growth of new particles (Pierce et al., 2011). A
new particle formation event is the result of complex processes where molecular clusters (1–2 nm) are created by nucleation of gases that can subsequently grow into detectablesized particles depending on the outcome of two competing processes: condensation of semi-volatile organic and inorganic gases and coagulation to preexisting particles (Kulmala, 2003; Kerminen and Kulmala, 2002; McMurry et al.,
2005). Studies have shown that nucleated clusters originate
from sulfuric acid, water, ammonia, and organic compounds
(Zhang et al., 2004; Sipilä et al., 2010; Kulmala et al., 2013;
Kirkby et al., 2011); however the mechanisms of formation
are still being developed. Ultrafine aerosols can become active CCN with changes in their size distribution and chemical
properties and thus can have an impact on cloud properties,
precipitation and regional climate (McFiggans et al., 2006
Rosenfeld et al., 2008). Kerminen et al. (2005) estimated that
cloud droplets originated from new particle formation over
the boreal forests in Finland are associated with a radiative
cooling of 0.2–0.9 Wm−2 .
Predicting nucleation events and their effect on CCN concentrations is challenging, and the results largely depend on
the selected nucleation scheme and the environmental conditions. Previous studies have reported that binary and ternary
homogeneous nucleation schemes (nucleation of H2 SO4 )
that are commonly used in 3-D climate models tend to underestimate nucleation rates and particle number concentrations
by orders of magnitude, especially within the boundary layer
(e.g., Kulmala et al., 2006; Young et al., 2008). Merikanto et
al. (2009) used activation nucleation (AN) parameterization
(Kulmala et al., 2006) in the boundary layer and binary homogeneous nucleation in the free troposphere, and estimated
that nucleation contributes 45 % of global mean CCN (0.2 %
super saturation (SS)), of which 35 % can be attributed to
the flux of nucleated particles from the free troposphere and
10 % from the boundary layer. Matsui et al. (2011) used a
similar approach within a regional model in the polluted urban environment of Beijing, and predicted that new particle
formation increased CCN concentrations at high (> 0.2 %)
supersaturations, and decreased CCN at low (< 0.1 %) supersaturation. Given the uncertainties in available parameterizations, Pierce and Adams (2009) compared several nucleation
schemes that spanned 6 orders of magnitude in globally averaged nucleation rates, and estimated that the average tropospheric CCN concentrations varied by less than 17 % in
the troposphere, and by 12 % within the boundary layer at
low (0.2 %) supersaturations. Although the global CCN predictions were only moderately sensitive to the choice of nucleation scheme, the presence of nucleation was found to be
crucial for predicting CCN. Luo and Yu (2011) used the ionmediated nucleation scheme and predicted that new particle
Atmos. Chem. Phys., 14, 11011–11029, 2014
formation accounted for 80 % of CCN (0.4 % SS) in most
parts of the eastern United States.
Aerosol nucleation and subsequent growth have been observed in various environments including urban areas (Matsui et al., 2011), coastal regions (O’Dowd et al., 2002), and
rural and forest environments (Kulmala et al., 2001; Levin et
al., 2012; Pierce et al., 2012). In the current study, we define
the term “small particle burst event” (PBE) to describe the
appearance and growth of particles that are larger than 3 nm
in diameter in contrast with typical nucleation events that include particles between 1 and 3 nm. Here PBEs refer to both
nucleation-mode particles (< 10 nm) and Aitken-mode particles (10–100 nm). Particle formation events, whether arising
from local nucleation of new particles or PBE-type events,
have frequently been observed in clean forest air masses, for
example in Finland (Kulmala et al., 2001). However it is unclear if the same types of processes are occurring in forests
influenced by anthropogenic pollution because urban plumes
contain gases that both contribute to the onset of nucleation
and also contain sufficient concentrations of preexisting particles onto which condensable gases can partition instead of
nucleating. Understanding how forest environments respond
to the inflow of pollutants from the nearby cities is of great
scientific interest as populations at the forest–urban interfaces are increasing. Jung et al. (2013) showed that the inflow of urban air masses could favor the initiation of the
burst of nucleation-mode particles in an isoprene-rich deciduous forest in northern Japan. However, studies in other types
of forests, such as terpene-rich forests, are less conclusive.
As part of the Bio-hydro-atmosphere interactions of Energy,
Aerosols, Carbon, H2 O, Organics & Nitrogen (BEACHON,
Ortega et al., 2014) project, there are long-term measurements of trace gases, aerosols and meteorological parameters
at the Manitou Experimental Forest Observatory (MEFO).
This site is located within a semi-arid ponderosa pine forest in the Colorado Front Range. It is representative of an
urban–rural interface and provides a unique opportunity to
study aerosol formation in a monoterpene-rich environment
that is periodically influenced by the inflow of anthropogenic
pollution from Denver and Colorado Springs (DiGangi et al.,
2012; Fry et al., 2013; Ortega et al., 2014). The PBEs observed at the site during the summer months were found to
coincide with an increase in CCN concentrations at high supersaturations (Levin et al., 2012), but the origin of the ultrafine particle formation events was not investigated.
In this paper, we use data from the BEACHON Rocky
Mountain Biogenic Aerosol Study (RoMBAS) intensive
measurement period (25 July to 25 August 2011) to investigate the origin of ultrafine aerosol formation and growth
events, and to model their characteristics using the regional
Weather Research and Forecasting model with chemistry
(WRF-Chem, Grell et al., 2005; Fast et al., 2006). More
specifically, we will use measurements and model simulations to (1) characterize the connection between anthropogenic pollution and the occurrence of PBEs, (2) test the
www.atmos-chem-phys.net/14/11011/2014/
Y. Y. Cui et al.: Modeling ultrafine particle growth at a pine forest site
ability of the WRF-Chem model to predict the levels of ultrafine particles during PBE episodes at the site, and (3) quantify their influences on CCN concentrations. As biogenic
emissions dominate the volatile organic compound concentrations at this site (Kaser et al., 2013; Ortega et al., 2014),
their effects on the growth of newly nucleated particles will
also be investigated. The WRF-Chem model is particularly
well suited for this study as it simultaneously treats biogenic
emissions, chemistry and CCN.
2
Measurement site and circulation patterns during the
campaign
The Manitou Experimental Forest Observatory (MEFO;
39.1006◦ N, 105.0942◦ W) is located in the Front Range
of the Colorado Rockies at ∼ 2300 m elevation in a subalpine forest dominated by ponderosa pine (Fig. 1). It is
located 40 km northwest of Colorado Springs and 72 km
southwest of Denver. The site is frequently influenced by
polluted air from the Front Range urban areas. Previous
studies at MEFO have indicated that monoterpenes and 2methyl-3-butene-2-ol (MBO) are the dominant component
of volatile organic compound (VOC) emissions during the
daytime (Kim et al., 2010; Kaser et al., 2013; Ortega et al.,
2014). Concentrations of anthropogenic pollutants (e.g NOx ,
SO2 , benzene) observed at the site are variable and driven by
synoptic and local meteorological conditions. Meteorological observations from the meteorological tower at MEFO
have been used to analyze the diurnal variations of wind
speeds and wind directions during both the BEACHONROCS (2010) and BEACHON-RoMBAS (2011) campaigns
(Ortega et al., 2014). During daytime in the summer, easterly upslope flows are often observed at MEFO with wind
speeds of 2–3 m s−1 , whereas during nighttime strong southwesterly drainage flows dominate with typical wind speeds
around 3–5 m s−1 . PBEs at MEFO almost always occur during midday, and it is suspected that these events are related
to transport from the urban areas to the east.
3
3.1
Measurements and modeling framework
Data sets
Measurements from several instruments are used in
this study to characterize PBEs during BEACHONRoMBAS 2011. Particle size distributions from 4 nm to 3 µm
were measured on a 5-minute cycle. The method consists of
two scanning mobility particle sizers (SMPSs) that measure
particles from 4 to 30 nm and from 30 to 300 nm, and an optical particle counter that measures particles from 200 nm to
3 µm. The final data set is composed of the superposition of
the three different measurements. The chemical composition
of 20 nm diameter aerosol performed during BEACHONRoMBAS was obtained by the Thermal Desorption Chemical
www.atmos-chem-phys.net/14/11011/2014/
11013
Ionization Mass Spectrometer (TDCIMS; Voisin et al., 2003;
Smith et al., 2004). During non-PBE periods and during
weak events, the TDCIMS measured the composition of bulk
aerosol (< 1 µm), whereas during PBEs (such as 10 August)
the instrument measured the composition of 20 nm diameter
particles. The TDCIMS acquired data in “negative ion mode”
using the reagent ion O2 –(H2 O)n, where n is in the range of
1–3, which allows for the detection of inorganic and organic
acids. Proton Transfer Reaction Quadrupole Mass Spectrometers (PTR-MS) measured ambient monoterpenes and MBO
– the dominant emissions from ponderosa pine. We also
use gas-phase measurements of CO, NOx , SO2 and H2 SO4
meteorological measurements of wind speeds and direction
(at 30 m height), and measurements of CCN concentrations.
The latter measurements were mostly performed at 0.5 % SS
with critical activation diameters less than 65 nm, and included the corresponding derived hygroscopicity parameter,
kappa, for sub-100 nm particles (Petters and Kreidenweis,
2007). Size-resolved CCN measurements were made with
a differential mobility analyzer (DMA; TSI 3071) followed
by a Droplet Measurement Technologies cloud condensation nuclei counter (DMT-CCNC) and a condensation particle counter (CPC; TSI 3010) (Levin et al., 2012, 2014). In
this paper, the time is presented in Mountain Standard Time
(MST).
We also calculate the condensation sink (CS, in s−1 ,
Eq. 1), which is the rate that condensable inorganic and organic vapors condense onto preexisting aerosols.
X
CS = 2π Di
dj βm (Knj , α)Nj ,
(1)
j
where Di is the gas-phase diffusion coefficient of condensable gas i (m2 s−1 ), Nj is the number concentrations (m−3 )
of particle j with diameter dj (m), βm is the transitional correction for the condensational mass flux, and is a function
of the Knudsen number Knj (= 2λ / dj ) and the mass accommodation coefficient α given by Fuchs and Sutugin (1971),
with λ = 6.8 × 10⁻⁸ m and α = 0.1 in this study. The formation rate (J ; see Eq. 2 below) and the growth rate are
estimated from available measurements, starting at 4.4 nm
diameter, and are used to constrain the WRF-Chem model.
To determine the formation rate of ∼ 5 nm particles (J5 nm ),
we linearly fit the measured number concentrations of particles over the range of 4.4–6.25 nm diameter between the
onset and the end of PBEs. The slope of the fitted line provides the measured formation rate (J5 nm ) that is used to
evaluate the model calculated formation rate for the model
bin 3.98–6.31 nm. A similar method is applied to derive the
formation rates for particles between 39–65 nm (J50 nm ) and
101–162 nm (J130 nm ) in the measurements, and their model
equivalent values based on model bin 40–63 nm and bin 100–
158 nm, respectively. It should be noted that the formation
rate calculated here is the net formation rate which includes
loss rates. We use the number mean diameter (NMD) to calculate the growth rate of particles in both measurements and
Atmos. Chem. Phys., 14, 11011–11029, 2014
11014
Y. Y. Cui et al.: Modeling ultrafine particle growth at a pine forest site
4000#
4000
50 ° N
(a)#
4000
(b)#
3500
3500#
3500
3000#
3000
3000
40.
0° N
2500
40 ° N
MEFO
2000
2000
37.5° N
30 ° N
130 ° W
2500
MEFO
CO Springs
Pueblo
1500
120° W
°
110 W
°
100 W
2500#
Denver
2000#
1500#
1500
1000#
1000
1000
500
500
0
500#
(m)
110.0° W
107.5° W
°
105.0 W
0#(m)#
°
(m)
102.5 W
0
Figure 1. WRF-Chem domains. (a) Coarse domain covers the western US with 36 × 36 km2 horizontal resolution; (b) nested domain covers
Colorado with 4 × 4 km2 resolution. Maps also show the topography, and the locations of the MEFO site, Denver, Colorado Springs, and
Pueblo.
Figure 1: WRF-Chem domains. (a) Coarse domain covers the western US with 36 x 36 km2
horizontal resolution, (b) Nested domain covers Colorado with 4 x 4km2 resolution. Maps also
simulations. NMD was defined by Matsui et al. (2011) using
show the topography, and the locations of the
the diameter (nm) and number concentration (cm−3 ) in each
Pueblo.fit to the values of NMD for particles
size bin. We use a linear
smaller than 30 nm during PBEs, and the slope of the fitted
line is defined as the sub-30 nm growth rate. Additionally,
we calculate the hygroscopicity parameter, κ, by including
all aerosol species present in the model for particles smaller
than 100 nm (see Sect. 4.4).
3.2
WRF-Chem simulations
Version 3.4.1 of the Weather Research and Forecasting
model with chemistry (WRF-Chem, Grell et al., 2005; Fast
et al., 2006) was used with two nested domains over the continental United States. The grid resolution was 36 km for domain 1 and 4 km for domain 2 (Fig. 1). Two-way nesting was
used between the domains. The WRF physics options chosen
for our runs include the Monin–Obukhov scheme for the surface layer, the Yonsei University (YSU) scheme (Hong et al.,
2006) for the planetary boundary layer, the Grell 3-D scheme
(Grell and Devenyi, 2002) for the cumulus parameterization
in the 36 km domain, the Lin et al. scheme for microphysics
(Lin et al., 1983), a rapid radiative transfer model (Mlawer et
al., 1997) for longwave radiation, and the Goddard scheme
(Chou et al., 1998) for shortwave radiation. The nighttime
minimum planetary boundary layer (PBL) height was set to
100 m in the YSU scheme based on previous studies (Choi et
al., 2011) to eliminate overestimating nocturnal concentrations of primary species. The land cover treatment was updated with MODIS land use data. North American Regional
Reanalysis (NARR) data were used for the initial and boundary conditions at a 3 h temporal resolution and 32 km spatial
resolution. Two representative periods were selected for our
study: 25–30 July and 9–15 August. The first 24 h of each
run were used to initialize the model, but they were not used
for comparisons. The meteorological outputs (such as wind
field, PBL height, etc.) from WRF-Chem were used to drive
a Lagrangian particle dispersion offline model (see Sect. 3.3)
Atmos. Chem. Phys., 14, 11011–11029, 2014
to estimate the arrival of anthropogenic plumes at the MEFO
site.
The chemistry is simulated using the CBMz gas-phase
mechanism (Zaveri and Peters, 1999) and MOSAIC aerosol
package (Zaveri et al., 2008). Similar to Matsui et al. (2011),
we have modified the MOSAIC aerosol package in WRFChem v3.4.1 to explicitly account for a wider range of
aerosol sizes, i.e., 20 bins over the aerosol diameter range
from 1 nm to 10 µm. The default eight bins over the range
are from 40 nm to 10 µm. The default binary homogenous
nucleation scheme (Wexler et al., 1994) is used above the
PBL, and it has been replaced by the empirical AN scheme
within the PBL. The number concentration of nucleated clusters based on the empirical AN scheme is given by Kulmala
et al. (2006):
MEFO site, Denver, Colorado Springs, and
J ∗ = A × [H2 SO4 ],
(2)
where J ∗ is the formation rate of activated clusters at 1 nm
(cm−3 s−1 ), A (s−1 ) is the rate coefficient, and [H2 SO4 ]
is the number concentration of gas-phase sulfuric acid
(cm−3 ). Previous studies indicate a large uncertainty associated with calculations of A, which was found to range
between 10−5 s−1 and 10−8 s−1 (Kuang et al., 2008). Here
we estimate a representative value of A at our site based
on measured H2 SO4 and number concentrations of ultrafine particles. The H2 SO4 measurements are available from
9 to 26 August at MEFO and indicate that the average
H2 SO4 concentration is ∼ 2 × 10⁶ molecules cm−3 during
36
the late morning and early afternoon. During
the campaign,
the smallest particles with diameters of ∼ 5 nm were detected at the site on 28 July, and their number concentrations were used to determine the 5 nm aerosol formation rate
(J5 nm = ∼ 1 cm−3 s−1 as shown in Table 1). The rate coefficient A of 2 × 10⁻⁶ s−1 was derived from those measurements, and is used within WRF-Chem for the AN parameterization to introduce particles into the first model size
bin (1–4 nm). We assume here that J5 nm is a representative value (the lower bound) of formation rate in the model
www.atmos-chem-phys.net/14/11011/2014/
Y. Y. Cui et al.: Modeling ultrafine particle growth at a pine forest site
11015
Table 1. Characteristics of four representative PBE days at the MEFO site during the BEACHON-RoMBAS-2011 field campaign. Metrics
are reported for observations and the WRF-Chem model simulations (Nucleation-bsoa).
c
N4−40
nm
PBE (< 30 nm)
burst time (MST)
N40−100 nm
Growth ratea
J5bnm
J50 nm
J130 nm
max
mean
max
mean
28 July 10:20
Observation
Model
2.5
3.0
0.74
1.09
0.21
0.20
0.01
0.02
20 540
34 440
16 155
31 515
4.160
5.389
3.795
5.357
29 July 12:25
Observation
Model
2.0
3.7
N/A
N/A
0.24
0.11
0.02
0.03
31 710
10 650
27 865
9.551
13 410
5.342
11 622
5.282
10 August 10:20
Observation
Model
2.5
N/A
N/A
N/A
0.08
0.02
0.01
0.004
22 000
3.055
21 470
2.968
6.562
5.321
5.336
5.178
Average
Observation
Model
2.3
3.4
0.74
1.09
0.18
0.11
0.013
0.018
a Growth rate of ultrafine particles from 4 to 40 nm, in nm h−1 .
b J : formation rate of small particles ∼ 5, ∼ 50 and ∼ 130 nm, in cm−3 s−1 .
c Number concentration of particles at 4–40 and 40–100 nm, in no. / cm3 . The mean values are
averaged over a 2-hour time period following the peak of each PBE. In the model, values from
particles in 3.98 to 39.8 nm , and from particles in 39.8 to 100 nm are evaluated using observed N4−40 nm and
N40−100 nm . Here, we report particles from 4 to 40 nm instead of
4 to 30 nm in order to have a closer match with the corresponding bins in the simulations.
first bin, which is a reasonable assumption at high H2 SO4
concentrations typically observed during PBE days (Kulmala et al., 2006). The derived value of A is consistent with
previous studies. For example, Sihto et al. (2006) reported
A = 1.7 × 10⁻⁶ s−1 , whereas Matsui et al. (2011) used the
value of 2 × 10⁻⁷ s−1 which was a factor of 10 lower in order
to compensate for a 10-fold overprediction of H2 SO4 concentrations in WRF-Chem.
In addition, sulfuric acid concentrations could not be estimated for this study (Mikkonen et al., 2011; Petäjä et al.,
2009) as OH measurements were not available during the
considered time period. We attempted to more accurately
simulate ultrafine particle growth by including the condensation of semi-volatile oxidation products of isoprene, αpinene and limonene onto preexisting particles. The default
WRF-Chem model configuration only includes primary organic aerosols (Matsui et al., 2011), and accounting for the
formation of secondary organic aerosols from biogenic precursors is important due to their abundance at this location.
Simple molar yield calculations were used to estimate secondary organic aerosol formation, assuming 15 % contribution for α-pinene and limonene, and 4 % for both isoprene
(Liu et al., 2012) and MBO (Zhang et al., 2014). To reduce
the computational costs, the condensed mass was distributed
in proportion to the aerosol surface area in each size bin. This
simplification is consistent with other studies (e.g., Spracklen
et al., 2006; Reddington et al., 2011) and assumes that the
first-generation oxidation products condense onto preexisting particles with zero equilibrium vapor pressure.
Initial and boundary conditions for chemical species
were provided by the MOZART-4 global chemistry-transport
model (Emmons et al., 2010). For emissions, the EPA Na-
www.atmos-chem-phys.net/14/11011/2014/
tional Emission Inventory 2005 was used for the anthropogenic sources. The number size distribution of primary
aerosol emissions was assumed to be a lognormal distribution with a median diameter of 50 nm and a standard deviation (a sigma) of 2. The MEGAN online model was applied for biogenic emissions (Guenther et al., 2006). Wet
scavenging and dry deposition of gases and aerosols were
also considered. The aerosol direct and indirect effects on radiation and cloud microphysics were included according to
Gustafson et al. (2007) and Chapman et al. (2009).
Table 2 summarizes the WRF-Chem simulations and
their characteristics. The base run (Ref-8bins) is the original WRF-Chem model with eight diameter bins starting at
40 nm. It includes the binary homogeneous nucleation parameterization in all vertical layers and does not account for
the formation of secondary organic compounds (similar to
Fast et al., 2009). The first test run (Nucleation-on) uses 20
bins and simulates the number concentration with the AN
parameterization in the PBL and binary homogeneous nucleation parameterization above the PBL. The second test
run (Nucleation-bsoa) is similar to Nucleation-on run, but
in addition it includes the condensation of biogenic oxygenated semi-volatile organic compounds and their contribution to the growth of ultrafine particles. A final sensitivity run (Nucleation-off) uses 20 bins and includes the condensation of biogenic oxygenated semi-volatile organic compounds, but it does not include a nucleation parameterization
(neither AN nor binary).
3.3
The trajectory model
To investigate the transport of anthropogenic air masses to
the MEFO site during the field study period, the Lagrangian
Atmos. Chem. Phys., 14, 11011–11029, 2014
11016
Y. Y. Cui et al.: Modeling ultrafine particle growth at a pine forest site
Table 2. Description of model simulations: AN is activation nucleation parameterization, and BHN is binary homogeneous nucleation
parameterization, which is the default option in the WRF-Chem model (see Sects. 1 and 3.2).
Simulations
Number of aerosol bins
Nucleation parameterizations
Within PBL
Ref-8bins
Nucleation-on
Nucleation-bsoa
Nucleation-off
8 bins (40 nm–10 µm)
20 bins (1 nm–10 µm)
20 bins (1 nm–10 µm)
20 bins (1 nm–10 µm)
BHN
AN
AN
particle dispersion model FLEXPART is used with WRF
(WRF-FLEXPART, Stohl et al., 2005; Fast et al., 2006;
Brioude et al., 2013). The wind field used to drive FLEXPART was a time-averaged wind predicted by the WRFChem 4 km simulations. We used the time-averaged wind
to systematically decrease the uncertainty and bias in the
trajectory calculations (Brioude et al., 2012). In WRFFLEXPART, the vertical diffusion coefficients were calculated based on the mixing heights and surface friction velocity from WRF-Chem. At the MEFO site, 10 000 inert tracer
particles are released every hour at a random height between
50 and 100 m above the ground. For each release, the backward trajectories are simulated for 48 h. The total calculation
time is 30 days from 27 July to 25 August 2013, and the
number of releases is 720. The hourly particle positions from
the back-trajectories are gridded onto the 4 × 4 km2 WRFChem domain to perform the residence time analysis. These
gridded trajectories indicate the time that air masses spent
in each grid cell before arriving at MEFO (de Foy et al.,
2007, 2008), which illustrates the preferred wind directions
and wind transport paths influencing the measurement site.
4
4.1
Results and discussion
Characterization of PBE and non-PBE days
The temporal evolution of aerosol number size distributions
observed during the entire campaign is shown in Fig. 2a.
To distinguish between PBE and non-PBE days, we calculate the ratio of the number concentrations of 4–30 nm particles (N4−30 nm ) to the concentrations of 4–100 nm particles
(N4−100 nm ). When the ratio was larger than 0.5 (Jung et al.,
2013) and the diurnal evolution of the aerosol number size
distribution was characterized by a banana-shaped plot (Dal
Maso et al., 2005), we classified that event as a PBE day. Using these criteria, we selected four representative PBEs (28,
29 July and 10, 13 August; see Fig. 2b), and three representative non-PBE days (14, 23, and 24 August). Figure 2b shows
the observed temporal evolution of SO2 mixing ratios and
N4−30 nm at MEFO during the campaign. N4−30 nm was correlated with SO2 (Pearson correlation coefficient is 0.8), with
N4−30 nm peak values that systematically coincided with high
SO2 observed at the site. These results suggest that the inflow
Atmos. Chem. Phys., 14, 11011–11029, 2014
Above PBL
BHN
BHN
None
Accounting for condensation
of biogenic VOCs
No
No
Yes
Yes
of anthropogenic pollutants impacts PBEs at the MEFO site,
and that the PBEs are likely initiated by SO2 oxidation products. The daily cycle of monoterpenes (Fig. 2b) exhibits a
more consistent day-to-day cycle with higher values at night
and lower values at the midday. Isoprene concentrations were
low at the site (Ortega et al., 2014) and are not shown here. A
closer look at the diurnal evolution of the number size distribution during the PBE of 28 July (Fig. 3a, b) shows the typical banana-shaped growth of the number size distributions.
The sharp increase in both N4−30 nm and N30−100 nm particles
coincides with the shift in wind directions from westerly to
northeasterly (from the Denver metropolitan area).
Observations of averaged diurnal profiles of SO2 , CO,
monoterpenes, N4−30 nm , CCN (0.5 % SS), and number size
distribution confirm the existence of large differences between PBE and non-PBE days (Fig. 4). Significantly higher
mean values are observed during PBE days for both monoterpenes and SO2 , and it is clear that N4−30 nm is dramatically starting midday during PBE days (Fig. 4c). CO levels are also higher during PBE days, which confirm that the
MEFO site is influenced by the inflow of anthropogenic pollutants. Primary particles transported from the Front Range
are not expected to significantly contribute to N4−30 nm concentrations because anthropogenic emissions typically generate larger particles (e.g., 30–40 nm; Brines et al., 2014).
To appreciate how rapidly molecules condense onto preexisting aerosols, we also compare the condensation sink (CS)
between PBE and non-PBE days. CS values range from
3 × 10⁻³ to 7 × 10⁻³ s−1 (Fig. 4e), and are typical of forest areas (Dal Maso et al., 2002). Somewhat higher (∼ 1.5
times) CS values are found on PBE days just before the onset
of PBEs (Figs. 4e and S2 in the Supplement), which indicates
higher concentrations of preexisting particles on those days
before the start of PBEs. During PBE days, the CS values decrease to their minimum around midday, which is generally
the PBE onset time, and then progressively increase due to
the growth of the ultrafine particles to larger sizes. There is
also a large difference in size distributions between PBE and
non-PBE days for particles smaller than 150 nm (Fig. 4f),
which is typically the size range that encompasses the critical activation diameters for CCN (50–100 nm) (Petters and
Kreidenweis, 2007). The peak of the number size distribution is shifted from ∼ 110 nm on non-PBE days to smaller
www.atmos-chem-phys.net/14/11011/2014/
Y. Y. Cui et al.: Modeling ultrafine particle growth at a pine forest site
11017
!!!!!!!!!!!!!!!!!!!!!!!!!!!!!!!!!!!!!
4
ppbv
ppbv
1.5
1
4
5
SO2
N4−30nm
Monoterpene
(b)
2
3
1
2
3
2
0.5
1
0
0
x 10
3
#/cm3
2
4
1
26 27 28 29 30 31 01 02 03 04 05 06 07 08 09 10 11 12 13 14 15 16 17 18 19 20 21 22 23 24 25
0
Date (Jul−Aug, 2011)
Date!(Jul*Aug,!2011)!
Figure 2. (a) Time series of number size distribution of submicron particles during BEACHON-RoMBAS. (b) Temporal variations in number
concentrations of 4–30 nm diameter particles (N4−30 nm ) (blue), SO2 (red), and monoterpene (green) mixing ratios during the campaign.
The four PBEs are selected (28 and 29 July and 10 and 13 August) for comparisons with the model. The orange lines indicate the periods
Figure 2: (a) Time series of number size distribution of submicron particles during
simulated with WRF-Chem.
BEACHON-RoMBAS. (b) Temporal variations in number concentrations of 4-30 nm diameter
particles
(N4-30nm
) (blue),CCN
SO2(0.5
(red),
and monoterpene
(green)during
mixingthese
ratios
during
the S4 in the Supsize distribution
PBE
days (Fig.
diameters ∼ 30 nm on
PBE days.
Measured
% SS)
plement)
shows
a
relatively
broad
distribution
number concentrations
at
the
surface
are
also
up
to
a
factor
campaign. The four PBEs are selected (July 28 and 29, and August 10 and 13) for comparisons similar to previous studies performed in an anthropogenically influenced
of 2 higher during afternoon hours on PBE days compared
with the model. The orange lines indicate the periods simulated with WRF-Chem.
forest (Jung et al., 2013). Figure S4 in the Supplement also
to non-PBE days (Fig. 3f). A sharp increase in CCN is obshows the absence of particles smaller than 5 nm. Especially
served in the afternoon, typically 3 h after the start of PBEs.
It should be noted that only particles larger than ∼ 60 nm are
in August (Fig. 8a), particles smaller than 10 nm were almost
never observed suggesting that nucleation likely occurred in
likely to activate at 0.5 % SS (Dusek et al., 2006). Given the
upwind areas or in the free troposphere, and that freshly nuobserved growth rates of 2.3 nm h−1 (Table 1), it would take
cleated particles grew for several hours before reaching the
> 20 h for freshly nucleated particles to reach a diameter of
measurement site. It should be noted that the PBE episode
60 nm. Therefore, the higher CCN concentrations on PBE
days are likely the result of the enhanced growth of preexof 13 August was very atypical showing an inverse bananaisting particles. Finally, the comparison of measured ambishaped growth (Fig. 8a). The FLEXPART back-trajectories
show that this “shrinkage” in the observed number size disent 2 m temperatures (Fig. S1 in the Supplement, first panel)
shows 1–2 ◦ C cooler temperatures during PBE days.
tribution could be related to the change in the air mass that
is being sampled over the site during this event. The arrival
Table 1 shows the observed and predicted formation and
of a polluted air mass from the Colorado Springs area during
growth rates for ∼ 5, ∼ 50, and ∼ 130 nm diameter particles, and number concentrations of 4–40 nm (N4−40 nm ) and
the afternoon (see Fig. S5 in the Supplement) is a likely rea40–100 nm (N40−100 nm ) particles for PBEs that occurred at
son for the appearance of smaller particles, which could have
been nucleated slightly upwind of the measurement site.
MEFO on 28 and 29 July, and 10 August. The PBEs at the
MEFO site typically started around noon and early afternoon
For all PBEs, the average growth rate was estimated
to be 2.3 nm h−1 , and the average net rates of formation
(10:20–15:00 MST, Table 1) following a shift in wind direcfor ∼ 5 nm, ∼ 5 and ∼ 130 nm particles to 0.74 cm−3 s−1 ,
tions generally to the east (Fig. 5a). This late onset time was
reported for other forest sites (Jung et al., 2013). N4−40 nm
0.18 cm−3 s−1 , and 0.013 cm−3 s−1 , respectively.
The values
37
derived from these observations are consistent with previand N40−100 nm reported in Table 1 are calculated as average
ous results reported for other forested regions (Kuang et al.,
values over a 2-hour time period following the peak of each
2008; Westervelt et al., 2013). The comparisons between obPBE. Here, we report particles from 4 to 40 nm instead of 4
servations and simulations are discussed in Sect. 4.3.
to 30 nm in order to have a closer match with the corresponding bins in the simulations. The observed N4−40 nm averaged
during the event varies from ∼ 16 000 to ∼ 28 000 cm−3 , and
N40−100 nm from ∼ 4000 to 12 000 cm−3 . N4−40 nm is 3 to 4
times higher compared to N40−100 nm . The observed number
www.atmos-chem-phys.net/14/11011/2014/
Atmos. Chem. Phys., 14, 11011–11029, 2014
11018
Y. Y. Cui et al.: Modeling ultrafine particle growth at a pine forest site
(a)#28#July#
103#
100000#
10000#
Dp#(nm)#
#
102#
1000#
101#
100#
100#
00#
03#
06#
09### #12##### 15#
Time(MST)#
18#
21#
10#
00# dN/dlogDp#
4
2
x 10
N4−30nm
N30−100nm
(b)#
Number (#/cm3)
1.5
1
0.5
0
00
03
06
09 12 15
Time (MST)
18
06
09
12 15
Time (MST)
18
21
00
350
2m WD (degree)
300
(c)#
250
200
150
100
50
0
00
03
21
cates influence from the Front Range urban areas, whereas
on non-PBE days they are more consistently from the southwest. Because the measured near-surface winds at the site
can be greatly influenced by local topography, we have performed the residence time analysis based on the FLEXPART
back-trajectories to confirm the origin of the air masses for
the PBE and non-PBE days. The right panels of Fig. 5a and b
show that on PBE days air masses at MEFO came from the
Colorado Springs area, whereas on non-PBE days the air
masses are principally from the west. The results suggest
that elevated SO2 likely originated from industrial sources
located in the Colorado Springs area. Consistent with measurements (Fig. 3), back-trajectory results emphasize the key
role of anthropogenic pollutants in the occurrence of ultrafine
particle events at the MEFO site.
The average time for the air mass to be transported to
MEFO during PBE days was estimated to ∼ 4 h for air
masses originating in Colorado Springs, and to ∼ 7 h for
air masses from the Denver metropolitan area. Given the
estimated transport time, and the estimated growth rates
of ∼ 3 nm h−1 , particles arriving from Denver would have
grown by ∼ 20–30 nm during transportation time to the site,
whereas particles arriving from Colorado Springs would
have grown by ∼ 15 nm. It should be noted that primary emitted particles in the model have sizes of 50 nm, and would
appear at the MEFO site as 70–80 nm particles if they originated from Denver, and as ∼ 65 nm particles if they originated from Colorado Springs. Therefore their contribution
to sub-40 nm particles predicted at the site during PBE days
is unlikely. Only particles that nucleated over urban areas
and smaller than 10 nm could contribute to the sub-40 nm
at MEFO if they were transported to the site. However, the
nucleation events over urban areas are infrequent as the condensable gases preferably partition onto existing particles,
which are typically abundant in urban areas.
00
4.3
Evaluation of modeled PBEs
Figure 3. 28 July: (a) shows the diurnal cycle of the number size
The regional WRF-Chem model is used to simulate PBEs
distributions. (b) shows the diurnal cycle of number concentrations
and the
analyze interactions between anthropogenic and bio4 to 30 nm
andof30the
to 100
nm. (c)
the diurnal(b) shows
gure 3: July 28:for(a)particles
shows from
the diurnal
cycle
number
sizeshows
distributions.
genic
air masses, as well as the potential influence of PBEs
cycle of wind directions at 2 m.
rnal cycle of number concentrations for particles from 4 to 30nm and 30 to 100nm. (c)
ows the diurnal cycle of wind directions at 2 m.
4.2 Inflow of anthropogenic pollutants at MEFO
To investigate the relationship between PBEs and the transport of anthropogenic pollutants to the site, we have analyzed
the origin of the air masses arriving at the measurement site
prior to PBEs. The wind roses measured at MEFO at a 30 m
height show the variation of wind direction by time of day
for PBE and non-PBE days (Fig. 5a, b). During PBE days,
wind directions clearly show a shift from southwesterly in
the early morning (06:00–09:00 MST) to easterly and then to
southeasterly or northeasterly winds during the day (10:00–
17:00 MST). The dominant easterly wind component indiAtmos. Chem. Phys., 14, 11011–11029, 2014
on CCN concentrations at the MEFO ground site. As mentioned in Sect. 3.2, the model includes both the AN parameterization that connects the anthropogenic SO2 emissions
to nucleation, and the contributions of biogenic VOC emissions38to the growth of ultrafine particles. Comparisons with
measurements of O3 , CO and NO2 (Fig. S6 in the Supplement) suggest that WRF-Chem generally captures their overall magnitudes and temporal variability during PBEs. Due to
the complex mountain terrain, predicting the arrival of narrow pollution plumes at the site is challenging especially with
the current model resolution of 4 km. For instance on 29 July,
WRF-Chem did not capture the observed SO2 plume at the
site because of a west shift bias in the simulated wind direction. On 10 August, simulated SO2 was much lower than
www.atmos-chem-phys.net/14/11011/2014/
11019
Monoterpene((ppbv)(
Y. Y. Cui et al.: Modeling ultrafine particle growth at a pine forest site
Figure 4. Comparison of measured parameters at the MEFO site during PBE and non-PBE days including hourly averaged diurnal profiles
of (a) monoterpenes, (b) CO, (c) SO2 , (d) number concentrations of 4–30 nm diameter particles, (e) condensation sinks (CS, s−1 ), (f) CCN
concentrations at 0.5 % supersaturation, and (g) number size distribution (from 4.4 to 150 nm). Error bars indicate 1σ variability.
Figure 4: Comparison of measured parameters at the MEFO site during PBE and non-PBE
days including hourly averaged diurnal profiles of (a) monoterpenes, (b) CO, (c) SO , (d)
2
observations because of an excessively large westerly comChem configuration (Ref-8bins). The default
configuration
-1
ponentnumber
in simulated
winds. These biases
in simulated
SO2 in-particles,
does not
simulatesinks
N4−40(CS,
nm , and
concentrations
of 4-30
nm diameter
(e)explicitly
Condensation
s greatly
), (f) underesfluence the predicted levels of H2 SO4 and lead to model untimates (up to a factor of 4) the N40−100 nm concentrations
CCN concentrations
0.5%
supersaturation,
Number
sizeand
distribution
(fromThe
4.4-150
derestimation
of PBEs on thoseatdays
(e.g.,
N4−40 nm ; Figs. 7and (g)
during
both PBE
non-PBE days.
Nucleation-bsoa
and 8).
run captures well the increase in N4−40 nm during PBE days,
nm). Error bars indicate 1σ variability.
Given the difficulty in predicting local meteorology, we
although it has a tendency to nucleate some particles durexamine (Fig. 6) the model’s ability to reproduce the avering non-PBE days as suggested by somewhat overpredicted
age features observed during PBE and non-PBE days. For
N4−40 nm concentrations. This could be an artifact of the
that purpose, average diurnal profiles of observed and preimplementation of the AN parameterization in WRF-Chem
dicted parameters associated with number size distributions
which used measured formation rates of 5 nm particles to inof sub-100 nm particles are examined. It is important to keep
troduce nucleated particles into the model first bin, and could
in mind that N4−40 nm is controlled by regional-scale nuclelead to an overprediction of freshly nucleated particles at low
ation and early particle growth, whereas N40−100 nm is also
H2 SO4 concentrations as discussed in Sect. 3.2. Simulation
influenced by regional transport and anthropogenic emisresults (Fig. 6e) are clearly improved in terms of NMDs. Dursions. The comparison of the number concentrations shows
ing PBEs, the increase in number concentrations of ultrafine
a noticeable improvement in model predictions when the
particles (N4−40 nm ) leads to an NMD reduction at midday
39 followed
Nucleation-bsoa run is used compared to the default WRF(12:00–18:00 MST) to values as low as ∼ 30 nm,
www.atmos-chem-phys.net/14/11011/2014/
Atmos. Chem. Phys., 14, 11011–11029, 2014
11020
Y. Y. Cui et al.: Modeling ultrafine particle growth at a pine forest site
(a)$PBE$days$
(b)$non.PBE$days$
Figure 5. Wind fields for PBE days (a) and non-PBE days (b): left panels are wind roses of local wind variations at 30 m height plotted
by hours of day at MEFO from 06:00 to 18:00 MS. Right panels are regional wind preferred directions corresponding to local wind roses
respectively, based on WRF-FLEXPART
analysis.
for PBE days (a) and non-PBE days (b): Left panels are wind roses of
Figure 5: Wind fields
local wind variations at 30 meters height plotted by hours of day at MEFO from 6:00 to 18:00
MS. in
Right
are regional
wind
to local
wind rosesconcentrations
turescorresponding
the variations
in number
NMD
the panels
late afternoon
due
to preferred
the con-directions
by an increase in
based
WRF-FLEXPART
densational growth. respectively,
As expected
theondefault
Ref-8binsanalysis.
run
did not capture the decrease in NMD during the early afternoon, caused by the appearance of freshly nucleated particles
on PBE days. Observations (Fig. 3g) show that the peak of
the number size distribution is shifted from ∼110 nm on nonPBE days to smaller diameters ∼ 30 nm on PBE days. This
shift in NMDs was well predicted by the Nucleation-bsoa
run (Fig. S7 in the Supplement). The comparison of modeled
(Nucleation-bsoa) number size distributions between PBE
and non-PBE days shows the same shift in the peak diameter from ∼ 100 nm on non-PBE days to ∼ 40 nm on PBE
days. During non-PBE days, the Nucleation-bsoa run predicts slightly better the observed evolution of NMD than Ref8bins (Fig. 6f).
A more detailed day-to-day evaluation of predicted number concentrations and size distributions for sub-100 nm particles is shown for 26–30 July (Fig. 7) and 10–14 August
(Fig. 8). As mentioned in Sect. 4.1, during July PBEs had
a more typical banana-shaped size distribution and particles
down to 5 nm were observed, suggesting that new-particle
formation likely occurred close to the measurement site. During this period, the updated WRF-Chem (Nucleation-bsoa
run) was able to reproduce the banana shape of the number
size distributions (Fig. 7a and b). The time series comparisons show that the Nucleation-bsoa simulation roughly cap-
Atmos. Chem. Phys., 14, 11011–11029, 2014
of sub-40 nm
particles (Fig. 7c) and the diurnal evolution of the NMD
(Fig. 7e). The model however has a tendency to overpredict
the number concentrations of larger N40−100 nm particles and
does not capture the sharp increase in those on 29 July. During August, PBEs were characterized by larger starting diameters (> 10 nm) suggesting that new particle formation occurred upwind of the site or above the PBL, and that already
somewhat grown particles were transported to the site. During this period, the WRF-Chem,
40 Nucleation-bsoa run, initiated some local nucleation but did not grow these particles
beyond 4 nm on 10, 11 and 14 August and not beyond 8 nm
on 12 August (Fig. 8b). Model results suggest that the sub100 nm particles that were both predicted and observed at the
site on these days were not locally generated through nucleation. Sensitivity simulations were performed for the PBE
day of 10 August to investigate the contribution of the transport of preexisting particles and of the above-PBL nucleation
to predicted sub-100 nm particles (Fig. S8 in the Supplement). In the first sensitivity simulation, the nucleation parameterization was turned off in the model, and the resulting
simulation showed very low number concentrations of sub100 nm particles (< 500 cm−3 , Fig. 8d). In the second simulation, the binary nucleation parameterization was used above
the PBL and no nucleation was used within the PBL. The results suggest that the above-PBL nucleation explained 90 %
www.atmos-chem-phys.net/14/11011/2014/
Y. Y. Cui et al.: Modeling ultrafine particle growth at a pine forest site
11021
PBEs%
Non5PBEs%
PBEs%
Non5PBEs%
PBEs%
Non5PBEs%
PBEs%
Non5PBEs%
Non5PBEs%
PBEs%
Time%of%Day%(MST)%
Time%of%Day%(MST)%
Figure 6:between
Comparison
between
and simulations
inPBE
diurnal
during
Figure 6. Comparison
measurements
andmeasurements
simulations in diurnal
profiles during
days profiles
(left column)
and PBE
non-PBE days (right
column). Black dots are observations, red dots are simulations from Nucleation-bsoa run, and blue dots are simulations from Ref-8bins run.
Error bars show
1σ(left
variability.
Plots
show
diurnal variations
in (a,
b) number
concentrations
4 to 40 nm particles
(N4−40
days
column)
and
Non-PBE
days (right
column).
Black
dots are of
observations,
red dots
are nm ) and (c, d)
of 40 to 100 nm particles (N40−100 nm ), diurnal profiles of (e, f) the number mean diameters (NMD), (g, h) kappa values, and (i, j) number
concentrations
of CCN at 0.5
% SS.
simulations
from
Nucleation-bsoa run, and blue dots are simulations from Ref-8bins run. Error
barsparticles
show 1σpredicted
variability.
show
(a,b) numbersite
concentrations
of 4 to in Sect. 4.1.
of the ultrafine
at thePlots
surface
on diurnal
this par-variations
to theinmeasurement
as already discussed
ticular day (Fig. S8b in the Supplement). The results from
This change in the air mass could have brought already nu40 nm particlesand
(N4-40nm
) and (c,d)
of 40 tothat
100 nm cleated
particles
(N40-100nm
), diurnal
(e,f)
combined Nucleation-bsoa
sensitivity
runs suggest
ultrafine
particles
to theprofiles
site. Asofillustrated
in Fig. 8c
locally formed new particles were not able to grow to de(no-nucleation run), the contribution of primary emitted parthe and
number
mean diametersnucleated
(NMD), particles
(g,h) Kappa ticles
values,
and (i,j) number
concentrations
tectable sizes,
that free-troposphere
to simulated
sub-40 nm
is expected to of
be negligible as
could have been mixed downward into the boundary layer
these particles are emitted into the larger size bins (centered
CCNtoat observed
0.5% SS.> 10 nm particles. On 13 Auand contributed
at 50 nm diameter).
gust, the model starts nucleating particles locally but does not
Modeled 4–40 nm diameter growth rates, and formation
grow them to larger sizes. Larger particles are however prerates (J5 nm , J50 nm , J130 nm ) are shown in Table 1. In compardicted later in the afternoon (after 17:00 MST) and are likely
ison with observations, we find that Nucleation-bsoa
slightly
41
due to changes in the air mass. Local wind roses and backoverestimates the growth rates of sub-40 nm. In addition,
trajectories (Fig. S5 in the Supplement) both suggest a shift
the formation rates are underestimated for 50 nm particles
in wind direction from southwest to southeast during that af(J50 nm ) and overestimated for 100 nm particles (J130 nm )
ternoon, which advected polluted air from Colorado Springs
by the model. Predicted N4−40 nm and N40−100 values are
www.atmos-chem-phys.net/14/11011/2014/
Atmos. Chem. Phys., 14, 11011–11029, 2014
11022
Y. Y. Cui et al.: Modeling ultrafine particle growth at a pine forest site
(a)$Observa+ons$
(c)"
00$$$06$$12$$18$$$$$
00$$$06$$12$$18$$$$$
00$$$06$$12$$18$$$$$
00$$$06$$12$$18$$$$$
00$$$06$$12$$18$$00$$$$$
Time$(MST)$
(b)$Simula+ons$(Nuclea+on5bsoa)$
00"""06"""12""18"""""
00"""06"""12""18"""""
00"""06""12"""18"""""00"""06""12"""18"""""
00"""06""12""18"""00"""""
Time"(MST)"
(d)"
00"""06"""12""18"""""
00"""06"""12""18"""""
00"""06""12"""18"""""00"""06""12"""18"""""
00"""06""12""18"""00"""""
Time"(MST)"
00$$$06$$12$$18$$$$$
00$$$06$$12$$18$$$$$
00$$$06$$12$$18$$$$$
00$$$06$$12$$18$$$$$
00$$$06$$12$$18$$00$$$$$
Time$(MST)$
(e)"
00"""06"""12""18"""""
00"""06"""12""18"""""
00"""06""12"""18"""""00"""06""12"""18"""""
00"""06""12""18"""00"""""
Time"(MST)"
Figure
7: Temporal
evolution of the number
(a) observed
(b) simulatedduring
(Nucleation-bsoa)
number
Figure 7. Temporal evolution of the (a) observed and (b)
simulated
(Nucleation-bsoa)
sizeand
distributions,
26–30 July
2011.
size distributions,
during
July(d)
26-30,
2011.nm,
Time
series
of number
concentrations
particles
Time series of number concentrations of particles in size ranges
of (c) 4–40
nm and
40–100
and
(e) number
mean
diameter of
(NMD;
see
Eq. 1) as observed and predicted at the MEFO site. Measurements
are of
indicated
by the
line (OBS),
base
case ismean
green,
“Nucleation-on”
in size ranges
(c) 4-40nm
and black
(d) 40-100nm,
and (e)
number
diameter
(NMD, see
is blue, “Nucleation-bsoa” is red, and “Nucleation-off” isequation
orange,1)respectively
(see Table 2 for the model run descriptions).
as observed and predicted at the MEFO site. Measurements are indicated by the
black line (OBS), base case is green, “Nucleation-on” is blue, “Nucleation-bsoa” is red, and
isfound
orange,for
respectively
(see Tablethat
2 for does
the model
descriptions).
comparable to observations, with the exception of “Nucleation-off”
N4−40 nm
the simulation
notrun
account
for nucleation
42
on 29 July and 10 August, which is underestimated even
processes (Nucleation-off) with a factor of 5 underpredicin the Nucleation-bsoa run. These results indicate that the
tion of both N4−40 nm and N40−100 nm levels. Results from
43
model configuration and spatial resolutions are not suffiruns that include nucleation without condensational growth
ciently accurate to capture all of the nucleation sources, and
by organic vapors (Nucleation-on) generally overestimate
perhaps that the physical and chemical conditions encounN4−40 nm and underpredict the observed NMD by a factor
tered during nucleation events are not adequately represented
of 2 suggesting that ultrafine particle growth is not captured
by measurements performed at MEFO.
by the model. The comparison between Nucleation-on and
Nucleation-bsoa runs emphasizes the key role of biogenic
4.4 Sensitivity to the treatment of nucleation
VOC to the growth of freshly nucleated particles. The presence of biogenic secondary organic aerosol formation in the
There are large differences in simulation results in time seNucleation-bsoa run results in a decrease of N4−40 nm , by alries due to changes in the nucleation representation in WRFmost an order of magnitude, and an increase in N40−100 nm by
Chem (Figs. 7c–e and 8c–e). As already shown, the dea factor of 2 compared with Nucleation-on. Nucleation-bsoa
fault WRF-Chem simulation (Ref-8bins) does not explicbetter simulates N40−100 nm during PBE days but overestiitly simulate sub-40 nm particles, and shows large biases
mates N40−100 nm during non-PBE days. Overall, our results
in N40−100 nm concentrations (Figs. 7c, d, 8c, d) and NMD
suggest that the condensational growth from semi-volatile or(Figs. 7e, 8e) during the campaign. The number size disganic compounds plays an important role in PBEs over the
tributions are not captured during the PBE days suggestColorado Front Range, and that including the AN represening that this default model version is not suitable for studytation in the model considerably improves the simulation of
ing aerosol effect on CCN and clouds in forested environPBEs.
ments. As expected, large differences with observations are
Atmos. Chem. Phys., 14, 11011–11029, 2014
www.atmos-chem-phys.net/14/11011/2014/
Y. Y. Cui et al.: Modeling ultrafine particle growth at a pine forest site
11023
(a)"Observa0ons"
(c)"
00"""06""12""18"""""
00"""06""12""18"""""
00"""06""12""18"""""
00"""06""12""18"""""
00"""06""12""18""00"""""
Time"(MST)"
(b)"Simula0ons"(Nuclea0on:bsoa)"
00"""06"""12""18"""""
00"""06"""12""18"""""
00"""06""12"""18"""""00"""06""12"""18"""""
00"""06""12""18"""00"""""
Time"(MST)"
(d)"
00"""06"""12""18"""""
00"""06"""12""18"""""
00"""06""12"""18"""""00"""06""12"""18"""""
00"""06""12""18"""00"""""
Time"(MST)"
00"""06""12""18"""""
00"""06""12""18"""""
00"""06""12""18"""""
00"""06""12""18"""""
00"""06""12""18""00"""""
Time"(MST)"
(e)"
00"""06"""12""18"""""
00"""06"""12""18"""""
00"""06""12"""18"""""00"""06""12"""18"""""
00"""06""12""18"""00"""""
Time"(MST)"
Figure 8: Similar to Figure 7 but for the August 10-14, 2011 time period.
Figure 8. Similar to Fig. 7 but for the 10–14 August 2011 time period.
4.5 Composition of ultrafine particles during PBEs and
effects on CCN
TDCIMS measurements shown in Fig. 9a suggest that ultrafine aerosols observed at MEFO during PBE days are enriched in sulfate. The molar ratio of water-soluble species,
which is defined as the abundance of a specific ion divided
by the sum of all ion abundances, suggests that sub-20 nm
particles during the PBE of 10 August are made of ∼ 61 %
sulfate, ∼ 37 % organics and < 1 % nitrate. These values are
similar to aerosol mass spectrometer measurements of bulk
submicron (< 1 µm) aerosol composition averaged for 8, 9
and 11 August during non-PBE days. The plot shows a clear
difference in the relative abundance of sulfate during the PBE
(∼ 61 %) vs. non-PBEs (∼ 41 %). However, this increase in
sulfate cannot be attributed to the presence of PBEs, due to
the difference in size distributions considered here (20 nm vs.
submicron).
Figure 9b shows simulated mass fractions of sulfate and
organics in ∼ 20 nm particles during PBE days (28, 29 July
and 10 August) and non-PBE days (11 and 14 August). Results for PBEs show a factor of 2 increases in the relative
contribution of sulfate to aerosol mass concentrations relative to non-PBE days. However, the relative fraction of sulfate in ∼ 20 nm particles during PBEs is larger in the meawww.atmos-chem-phys.net/14/11011/2014/
45
surements than in model predictions. This difference could
result from the
limitations
in
the
detection
of
organic
species
44
by the TDCIMS instrument leading to an underprediction
of the relative fraction of organics compared to sulfate. The
fact that we are considering different days could also explain this discrepancy (i.e., measurements report values for
10 August, whereas the model results are averaged over several PBE days). Model predictions for 10 August (Fig. S8 in
the Supplement) show a higher fraction of sulfate (∼ 40 %).
In addition, model results for the Nucleation-bsoa simulation
(Fig. S9 in the Supplement) indicate that organic aerosols
account for 40 to 75 % of the ultrafine (4–20 nm) particulate mass. The comparison with the Nucleation-off sensitivity simulation that has a factor of 3 lower amounts of sulfate,
ammonium, and organics in the 4–20 nm range illustrates the
importance of nucleation processes in predicting the ultrafine
aerosol composition (see Fig. S9 in the Supplement).
Changes in submicron particle composition during PBEs
can affect their hygroscopicity and, therefore, modify their
ability to form CCN. Here we compare the measured and predicted volume-averaged hygroscopicity parameter (kappa)
(Fig. 10). For calculations of kappa in WRF-Chem, we consider typical hygroscopicity values shown in parentheses
(Chapman et al., 2009) for individual compounds including
sulfate (0.5), ammonium (0.5), nitrate (0.5), black carbon
Atmos. Chem. Phys., 14, 11011–11029, 2014
11024
Y. Y. Cui et al.: Modeling ultrafine particle growth at a pine forest site
Nucleation-bsoa simulates an increase in the afternoon values of kappa, that increase is not as pronounced as in the
observations (Fig. 6g).
The time series of measured and simulated CCN
(0.5 % SS) number concentrations are shown in Fig. 10c–d.
In this study, CCN concentrations are calculated at 0.5 % SS
in the WRF-Chem model. As CCN measurements were
mainly performed at high supersaturation (Sect. 3.1), here
we compare model results with CCN observations at 0.5 %
SS. As previously mentioned (Sec. 4.1), only particles with
APE((10(Aug)(
Non$APE((average(
Non3PBE'(average'
PBE'(10'Aug)'
diameters larger than 60 nm are likely to activate at 0.5 % SS.
(
bulk(8,9,11(Aug)(
'bulk'8,9,11'Aug)'
The Nucleation-bsoa run reasonably simulates the CCN
(0.5 % SS) concentrations in both time series (Fig. 10c, d)
WRF3Chem'simula7ons'
and diurnal profiles (Fig. 6i, j) except on 29 July as expected.
Figure 6i shows that the Nucleation-bsoa run captures the
magnitudes of CCN (0.5 % SS) during the daytime, with
however a slight underestimation of the afternoon values during PBE days. The Nucleation-bsoa simulation reproduces
more accurately CCN (0.5 % SS) concentrations than the
Ref-8bins run, especially during PBE days. This difference
suggests that sub-40 nm particles and their growth to larger
sizes (> 60 nm) that can activate at 0.5 % SS significantly
contribute to CCN. The Nucleation-off simulation underesFigure 9. (a) TDCIMS measurements of negative ion molar ratios
timates by a factor of 3 the CCN (0.5 % SS) number concenin bulk submicron aerosols during non-PBE days (8, 9, 11 August)
tration compared to Nucleation-bsoa (Fig. 10). This indicates
and in 20measurements
nm (± 0.5 nm)ofparticles
during
a PBE
day in
(10bulk
August).
Figure 9: (a) TDCIMS
negative
ion molar
ratios
submicron aerosols
that the ability of the modified WRF-Chem to predict PBEs is
(b) Changes in simulated mass fractions of sulfate and organics in
during Non-PBE days (8, 9, 11 August) and in 20 nm (± ½ nm) particles during a PBEdependent
day (10 on including both AN nucleation parameterization
∼ 20 nm particles between PBE days (28, 29 July and 10 August)
and
secondary organic aerosol (SOA) formation. Comparing
and non-PBE
days (11
andfractions
14 August).
August). (b) Changes
in simulated
mass
of sulfate and organics in ~20nm particles
the results of Nucleation-bsoa with Nucleation-off during the
between PBE days (Jul 28, 29, and August 10) and non-PBE days (August 11 and 14).
two simulating periods, we find that the nucleation explains
67 % of near-surface CCN (0.5 % SS) concentrations at the
(10−6 ), organic compounds (0.14), other inorganics (OIN,
MEFO site. This is an extreme case; however, it illustrates
0.14), sodium (1.16), and chloride (1.16). The calculated
that the accurate treatment of nucleation in 3-D models is
kappa value is the average of the hygroscopicity of individimportant for predicting CCN (0.5 % SS) concentrations and
ual species weighted by their respective volume concentraaerosol number concentration in general.
tions for aerosol sizes below 100 nm. For the Nucleationbsoa run, the model reasonably simulates the measured values of kappa. The Nucleation-bsoa simulation generally cap5 Summary and conclusions
tures kappa variability in the time series (Fig. 10a, b) except
for the lowest observed values during the nighttime that are
Small particle burst events (PBEs), indicative of nucleationoverestimated by the model. We should note that 29 July has
mode and Aitken-mode particles, were observed at the
very high values of kappa (> 0.3) indicative of an increased
MEFO site during the 2011 BEACHON-RoMBAS field
contribution of sulfate aerosols during the PBE. The model
campaign. Four representative PBEs were studied that
46
does not reproduce those high values, at least in part beshowed a rapid increase in the number of 4–30 nm diamecause the simulations do not capture the SO2 transport adter particles from midday to early afternoon in this region.
equately on this day (see Sect. 4.3). The comparison of averNumber concentrations of 4 to 40 nm particles ranged from
age diurnal profiles of observed and predicted kappa values
∼ 16 000 to 28 000 cm−3 , and 40 to 100 nm particles ranged
during PBE and non-PBE days (Fig. 6g–h) shows that the
from 4000 to 12 000 cm−3 . The average growth rate during
Nucleation-bsoa run improves simulations of hygroscopicPBEs of sub-40 nm particles was 2.3 nm h−1 , and the averity compared to the model default simulation Ref-8bins. In
age formation rates of ∼ 5, ∼ 50, and ∼ 130 nm diameter
both the Nucleation-bsoa run and measurements, kappa valparticles during PBEs were 0.74 cm−3 s−1 , 0.18 cm−3 s−1 ,
ues vary from ∼ 0.05 to 0.2 during PBE and non-PBE days,
and 0.013 cm−3 s−1 respectively. The size distributions of
and these values are typically a factor of 2 lower than the deultrafine particles imply that non-local nucleation sources,
fault model simulation (Ref-8bins) which does not account
including air masses originating above the PBL and upfor the formation of secondary organic aerosols. Although
wind sources, impact MEFO. The diurnal profiles of SO2
(a) TDCIMS'measurements'
Atmos. Chem. Phys., 14, 11011–11029, 2014
www.atmos-chem-phys.net/14/11011/2014/
Y. Y. Cui et al.: Modeling ultrafine particle growth at a pine forest site
11025
Figure 10. Observed and predicted (Nucleation-bsoa) (a, b) volume-averaged hygroscopicity (kappa) and (c, d) CCN concentrations at high
supersaturation condition (0.5 % SS) from 26–30 July and 10–14 August 2011. The blue line shows the results without nucleation within
Figure model
10: Observed
and predicted (Nucleation-bsoa) (a,b) volume-averaged hygroscopicity
PBL from “Nucleation-off”
run.
(Kappa) and (c,d) CCN concentrations at high supersaturation condition (0.5% SS) from 26-30
and 10-14 August
2011. The blue
line showsThe
the Supplement
results without
nucleation
within
PBLis available online
and monoterpene July
concentrations
were investigated
during
related
to this
article
PBE and non-PBEfrom
days.
Considerable
differences
between
at
doi:10.5194/acp-14-11011-2014-supplement.
“Nucleation-off” model run.
PBEs and non-PBEs indicate that pollution plumes rich in
SO2 combined with primary particles that were advected
from the Colorado Front Range. Furthermore, enhanced biogenic monoterpenes concentrations significantly affect partiAcknowledgements. The authors would like to acknowledge data
cle number concentrations and CCN during PBE days.
contributions, interesting discussions and editing from Lisa Kaser
A modified version of the WRF-Chem model was ap(University of Innsbruck, Austria, and ASP postdoc at National
plied to study PBEs during this campaign. The model was
Center for Atmospheric Research, NCAR), Ezra Levin (Colorado
extended to include a parameterization of activation nuState University), David Gochis (National Center for Atmospheric
cleation (AN) and the formation of SOA from biogenic
Research, NCAR), Jerome Fast (Pacific Northwest National
and anthropogenic precursors. It also was used to simulate
Laboratory, PNNL), and Christoph Knote (National Center for
Atmospheric Research, NCAR). This research has been supported
the corresponding volume-averaged hygroscopicity parameby the DOE DE-FG0208ER64627 grant, and NCAR which is
ter (kappa) and CCN concentrations. Comparisons with the
operated by the University Corporation for Atmospheric Research
default WRF-Chem model (containing eight particle diamon behalf of the National Science Foundation. Authors would
eter bins and binary homogeneous nucleation parameterilike to thank in particular the generous support of the NCAR’s
zation) indicate that AN parameterization more accurately
Advanced Study Program/Graduate Visitor Program. P. Winkler
simulates PBEs in the 4–100 nm size range, including onacknowledges financial support from the Austrian Science Fund
set times, number concentrations and number mean diam(FWF, project no. J3198-N21). J. N. Smith acknowledges support
eters. The sensitivity simulations using the updated model
from the National Science Foundation (ATM-0919317) and US
without nucleation parameterization suggest that PBEs inDepartment of Energy (DE-SC0006861).
47
fluence the composition of small particles. Furthermore, the
updated WRF-Chem simulations were able to represent variEdited by: R. Holzinger
ations and magnitudes of kappa and number concentration
of CCN (0.5 % SS), suggesting that the model can be used
References
to study the connection between new particle formation and
cloud formation. Our results from the enhanced WRF-Chem
Adams, P. J. and Seinfeld, J. H.: Predicting global aerosol size distrimodel highlighted the important role of the mixing of urbutions in general circulation models, J. Geophys. Res.-Atmos.,
ban and forest air masses in the formation of PBEs, and the
107, 4370, doi:10.1029/2001JD001010, 2002.
value of the MEFO site in studying PBEs due to its location
Brioude, J., Angevine, W. M., McKeen, S. A., and Hsie,
at the intersection of different air masses, and with help of
E.-Y.: Numerical uncertainty at mesoscale in a Lagrangian
improved treatment of PBEs in CCN simulations and future
model in complex terrain, Geosci. Model Dev., 5, 1127–1136,
doi:10.5194/gmd-5-1127-2012, 2012.
research for other representative forest sites adjacent to urban
Brioude, J., Arnold, D., Stohl, A., Cassiani, M., Morton, D.,
areas.
Seibert, P., Angevine, W., Evan, S., Dingwell, A., Fast, J. D.,
www.atmos-chem-phys.net/14/11011/2014/
Atmos. Chem. Phys., 14, 11011–11029, 2014
11026
Y. Y. Cui et al.: Modeling ultrafine particle growth at a pine forest site
Easter, R. C., Pisso, I., Burkhart, J., and Wotawa, G.: The Lagrangian particle dispersion model FLEXPART-WRF version
3.1, Geosci. Model Dev., 6, 1889–1904, doi:10.5194/gmd-61889-2013, 2013.
Chapman, E. G., Gustafson Jr., W. I., Easter, R. C., Barnard, J. C.,
Ghan, S. J., Pekour, M. S., and Fast, J. D.: Coupling aerosolcloud-radiative processes in the WRF-Chem model: Investigating the radiative impact of elevated point sources, Atmos. Chem.
Phys., 9, 945–964, doi:10.5194/acp-9-945-2009, 2009.
Choi, W., Faloona, I. C., McKay, M., Goldstein, A. H., and
Baker, B.: Estimating the atmospheric boundary layer height
over sloped, forested terrain from surface spectral analysis during BEARPEX, Atmos. Chem. Phys., 11, 6837–6853,
doi:10.5194/acp-11-6837-2011, 2011.
Chou, M. D., Suarez, M. J., Ho, C. H., Yan, M. M. H., and Lee,
K. T.: Parameterizations for cloud overlapping and shortwave
single-scattering properties for use in general circulation and
cloud ensemble models, J. Climate, 11, 202–214, 1998.
Dal Maso, M., Kulmala, M., Lehtinen, K. E. J., Makela, J. M.,
Aalto, P., and O’Dowd, C. D.: Condensation and coagulation
sinks and formation of nucleation mode particles in coastal and
boreal forest boundary layers, J. Geophys. Res.-Atmos., 107,
8097, doi:10.1029/2001JD001053, 2002.
Dal Maso, M., Kulmala, M., Riipinen, I., Wagner, R., Hussein, T.,
Aalto, P. P., and Lehtinen, K. E. J.: Formation and growth of fresh
atmospheric aerosols: eight years of aerosol size distribution data
from SMEAR II, Hyytiala, Finland, Boreal Environ. Res., 10,
323–336, 2005.
de Foy, B., Lei, W., Zavala, M., Volkamer, R., Samuelsson, J., Mellqvist, J., Galle, B., Martínez, A.-P., Grutter, M., Retama, A., and
Molina, L. T.: Modelling constraints on the emission inventory
and on vertical dispersion for CO and SO2 in the Mexico City
Metropolitan Area using Solar FTIR and zenith sky UV spectroscopy, Atmos. Chem. Phys., 7, 781–801, doi:10.5194/acp-7781-2007, 2007.
de Foy, B., Fast, J. D., Paech, S. J., Phillips, D., Walters, J. T.,
Coulter, R. L., Martin, T. J., Pekour, M. S., Shaw, W. J., Kastendeuch, P. P., Marley, N. A., Retama, A., and Molina, L. T.: Basinscale wind transport during the MILAGRO field campaign and
comparison to climatology using cluster analysis, Atmos. Chem.
Phys., 8, 1209–1224, doi:10.5194/acp-8-1209-2008, 2008.
DiGangi, J. P., Henry, S. B., Kammrath, A., Boyle, E. S., Kaser, L.,
Schnitzhofer, R., Graus, M., Turnipseed, A., Park, J-H., Weber,
R. J., Hornbrook, R. S., Cantrell, C. A., Maudlin III, R. L., Kim,
S., Nakashima, Y., Wolfe, G. M., Kajii, Y., Apel, E.C., Goldstein,
A. H., Guenther, A., Karl, T., Hansel, A., and Keutsch, F. N.: Observations of glyoxal and formaldehyde as metrics for the anthropogenic impact on rural photochemistry, Atmos. Chem. Phys.,
12, 9529–9543, doi:10.5194/acp-12-9529-2012, 2012.
Dusek, U., Frank, G. P., Hildebrandt, L., Curtius, J., Schneider, J.,
Walter, S., Chand, D., Drewnick, F., Hings, S., Jung, D., Borrmann, S., Andreae, M. O.: Size Matters More Than Chemistry
for Cloud-Nucleating Ability of Aerosol Particles, Science, 312,
1375–1378, doi:10.1126/science.1125261, 2006.
Dusek, U., Frank, G. P., Curtius, J., Drewnick, F., Schneider,
J., Kurten, A., Rose, D., Andreae, M. O., Borrmann, S., and
Poschl, U.: Enhanced organic mass fraction and decreased
hygroscopic- ity of cloud condensation nuclei (CCN) during
Atmos. Chem. Phys., 14, 11011–11029, 2014
new particle formation events, Geophys. Res. Lett., 37, L03804,
doi:10.1029/2009GL040930, 2010.
Emmons, L. K., Apel, E. C., Lamarque, J.-F., Hess, P. G., Avery,
M., Blake, D., Brune, W., Campos, T., Crawford, J., DeCarlo, P.
F., Hall, S., Heikes, B., Holloway, J., Jimenez, J. L., Knapp, D. J.,
Kok, G., Mena-Carrasco, M., Olson, J., O’Sullivan, D., Sachse,
G., Walega, J., Weibring, P., Weinheimer, A., and Wiedinmyer,
C.: Impact of Mexico City emissions on regional air quality from
MOZART-4 simulations, Atmos. Chem. Phys., 10, 6195–6212,
doi:10.5194/acp-10-6195-2010, 2010.
Fast, J. D., Gustafson, W. I. J., Easter, R. C., Zaveri, R. A.,
Barnard, J. C., Chapman, E. G., Grell, G. A., and Peckham,
S. E.: Evolution of ozone, particulates, and aerosol direct radiative forcing in the vicinity of Houston using a fully coupled
meteorology-chemistry-aerosol model, J. Geophys. Res.-Atmos.,
111, D21305, doi:10.1029/2005JD006721, 2006.
Fast, J., Aiken, A. C., Allan, J., Alexander, L., Campos, T., Canagaratna, M. R., Chapman, E., DeCarlo, P. F., de Foy, B., Gaffney,
J., de Gouw, J., Doran, J. C., Emmons, L., Hodzic, A., Herndon,
S. C., Huey, G., Jayne, J. T., Jimenez, J. L., Kleinman, L., Kuster,
W., Marley, N., Russell, L., Ochoa, C., Onasch, T. B., Pekour,
M., Song, C., Ulbrich, I. M., Warneke, C., Welsh-Bon, D., Wiedinmyer, C., Worsnop, D. R., Yu, X.-Y., and Zaveri, R.: Evaluating simulated primary anthropogenic and biomass burning
organic aerosols during MILAGRO: implications for assessing
treatments of secondary organic aerosols, Atmos. Chem. Phys.,
9, 6191–6215, doi:10.5194/acp-9-6191-2009, 2009.
Fuchs, N. and A. Sutugin,: High-dispersed aerosols, in Topics in
Current Aerosol Research,edited by: G. M. Hidy and J. R. Brock,
Pergamon, Oxford, UK, 2, 1–60, 1971.
Fry, J. L., Draper, D. C., Zarzana, K. J., Campuzano-Jost, P., Day,
D. A., Jimenez, J. L., Brown, S. S., Cohen, R. C., Kaser, L.,
Hansel, A., Cappellin, L., Karl, T., Hodzic Roux, A., Turnipseed,
A., Cantrell, C., Lefer, B. L., and Grossberg, N.: Observations of
gas- and aerosol-phase organic nitrates at BEACHON-RoMBAS
2011, Atmos. Chem. Phys., 13, 8585–8605, doi:10.5194/acp-138585-2013, 2013.
Grell, G. A. and Devenyi, D.: A generalized approach to parameterizing convection combining ensemble and data assimilation techniques, Geophys. Res. Lett., 29, 38-1–38-4,
doi:10.1029/2002GL015311, 2002.
Grell, G. A., Peckham, S. E., Schmitz, R., McKeen, S. A., Frost, G.,
Skamarock, W. C., and Eder, B.: Fully coupled “online” chemistry within the WRF model, Atmos. Environ., 39, 6957–6975,
2005.
Guenther, A., Karl, T., Harley, P., Wiedinmyer, C., Palmer, P. I.,
and Geron, C.: Estimates of global terrestrial isoprene emissions
using MEGAN (Model of Emissions of Gases and Aerosols from
Nature), Atmos. Chem. Phys., 6, 3181–3210, doi:10.5194/acp-63181-2006, 2006.
Gustafson, W. I. J., Chapman, E. G., Ghan, S. J., Easter, R.
C., and Fast, J. D.: Impact on modeled cloud characteristics
due to simplified treatment of uniform cloud condensation nuclei during NEAQS 2004, Geophys. Res. Lett., 34, L19809,
doi:10.1029/2007GL030021, 2007.
Hong, S. Y., Noh, Y., and Dudhia, J.: A new vertical diffusion package with an explicit treatment of entrainment processes, Mon.
Weather Rev., 134, 2318–2341, 2006.
www.atmos-chem-phys.net/14/11011/2014/
Y. Y. Cui et al.: Modeling ultrafine particle growth at a pine forest site
Jung, J., Miyazaki, Y., and Kawamura, K.: Different characteristics of new particle formation between urban and deciduous forest sites in Northern Japan during the summers of 2010–2011,
Atmos. Chem. Phys., 13, 51–68, doi:10.5194/acp-13-51-2013,
2013.
Kaser, L., Karl, T., Schnitzhofer, R., Graus, M., Herdlinger-Blatt,
I. S., DiGangi, J. P., Sive, B., Turnipseed, A., Hornbrook, R. S.,
Zheng, W., Flocke, F. M., Guenther, A., Keutsch, F. N., Apel, E.,
and Hansel, A.: Comparison of different real time VOC measurement techniques in a ponderosa pine forest, Atmos. Chem. Phys.,
13, 2893–2906, doi:10.5194/acp-13-2893-2013, 2013.
Kerminen, V. M. and Kulmala, M.: Analytical formulae connecting
the “real” and the “apparent” nucleation rate and the nuclei number concentration for atmospheric nucleation events, J. Aerosol
Sci., 33, 609–622, 2002.
Kerminen, V. M., Lihavainen, H., Komppula, M., Viisanen, Y., and
Kulmala, M.: Direct observational evidence linking atmospheric
aerosol formation and cloud droplet activation, Geophys. Res.
Lett., 32, L14803, doi:10.1029/2005GL023130, 2005.
Kim, S., Karl, T., Guenther, A., Tyndall, G., Orlando, J., Harley,
P., Rasmussen, R., and Apel, E.: Emissions and ambient distributions of Biogenic Volatile Organic Compounds (BVOC) in a
ponderosa pine ecosystem: interpretation of PTR-MS mass spectra, Atmos. Chem. Phys., 10, 1759–1771, doi:10.5194/acp-101759-2010, 2010.
Kirkby, J., Curtius, J., Almeida, J., Dunne, E., Duplissy, J., Ehrhart,
S., Franchin, A., Gagne, S., Ickes, L., Kurten, A., Kupc, A., Metzger, A., Riccobono, F., Rondo, L., Schobesberger, S., Tsagkogeorgas, G., Wimmer, D., Amorim, A., Bianchi, F., Breitenlechner,
M., David, A., Dommen, J., Downard, A., Ehn, M., Flagan, R. C.,
Haider, S., Hansel, A., Hauser, D., Jud, W., Junninen, H., Kreissl,
F., Kvashin, A., Laaksonen, A., Lehtipalo, K., Lima, J., Lovejoy, E. R., Makhmutov, V., Mathot, S., Mikkila, J., Minginette,
P., Mogo, S., Nieminen, T., Onnela, A., Pereira, P., Petaja, T.,
Schnitzhofer, R., Seinfeld, J. H., Sipila, M., Stozhkov, Y., Stratmann, F., Tome, A., Vanhanen, J., Viisanen, Y., Vrtala, A., Wagner, P. E., Walther, H., Weingartner, E., Wex, H., Winkler, P. M.,
Carslaw, K. S., Worsnop, D. R., Baltensperger, U., and Kulmala,
M.: Role of sulphuric acid, ammonia and galactic cosmic rays in
atmospheric aerosol nucleation, Nature, 476, 429–U77, 2011.
Kuang, C., McMurry, P. H., McCormick, A. V., and Eisele, F.
L.: Dependence of nucleation rates on sulfuric acid vapor concentration in diverse atmospheric locations, J. Geophys. Res.Atmos.,113, D10209, doi:10.1029/2007JD009253, 2008.
Kulmala, M.: How particles nucleate and grow, Science, 302, 1000–
1001, 2003.
Kulmala, M., Hameri, K., Aalto, P. P., Makela, J. M., Pirjola, L.,
Nilsson, E. D., Buzorius, G., Rannik, U., Dal Maso, M., Seidl,
W., Hoffman, T., Janson, R., Hansson, H. C., Viisanen, Y., Laaksonen, A., and O’Dowd, C. D.: Overview of the international
project on biogenic aerosol formation in the boreal forest (BIOFOR), Tellus B, 53, 324–343, 2001.
Kulmala, M., Lehtinen, K. E. J., and Laaksonen, A.: Cluster activation theory as an explanation of the linear dependence between
formation rate of 3nm particles and sulphuric acid concentration,
Atmos. Chem. Phys., 6, 787–793, doi:10.5194/acp-6-787-2006,
2006.
Kulmala, M., Kontkanen, J., Junninen, H., Lehtipalo, K., Manninen, H. E., Nieminen, T., Petaja, T., Sipila, M., Schobesberger,
www.atmos-chem-phys.net/14/11011/2014/
11027
S., Rantala, P., Franchin, A., Jokinen, T., Jarvinen, E., Aijala, M.,
Kangasluoma, J., Hakala, J., Aalto, P. P., Paasonen, P., Mikkila,
J., Vanhanen, J., Aalto, J., Hakola, H., Makkonen, U., Ruuskanen, T., Mauldin, R. L., Duplissy, J., Vehkamaki, H., Back, J.,
Kortelainen, A., Riipinen, I., Kurten, T., Johnston, M. V., Smith,
J. N., Ehn, M., Mentel, T. F., Lehtinen, K. E. J., Laaksonen, A.,
Kerminen, V. M., and Worsnop, D. R.: Direct Observations of
Atmospheric Aerosol Nucleation, Science, 339, 943–946, 2013.
Laaksonen, A., Hamed, A., Joutsensaari, J., Hiltunen, L., Cavalli,
F., Junkermann, W., Asmi, A., Fuzzi, S., and Facchini, M. C.:
Cloud condensation nucleus production from nucleation events
at a highly polluted region, Geophys. Res. Lett., 32, L06812,
doi:10.1029/2004GL022092, 2005.
Levin, E. J. T., Prenni, A. J., Petters, M. D., Kreidenweis, S. M.,
Sullivan, R. C., Atwood, S. A., Ortega, J., DeMott, P. J., and
Smith, J. N.: An annual cycle of size-resolved aerosol hygroscopicity at a forested site in Colorado, J. Geophys. Res.-Atmos., 117,
D06201, doi:10.1029/2011JD016854, 2012.
Levin, E. J. T., Prenni, A. J., Palm, B. B., Day, D. A., CampuzanoJost, P., Winkler, P. M., Kreidenweis, S. M., DeMott, P. J.,
Jimenez, J. L., and Smith, J. N.: Size-resolved aerosol composition and its link to hygroscopicity at a forested site in Colorado,
Atmos. Chem. Phys., 14, 2657–2667, doi:10.5194/acp-14-26572014, 2014.
Lin, Y., Langand Farley, R. D., and Orville, H. D.: Bulk parameterization of the snow field in a cloud model, J. Climate Appl.
Meteorol., 22, 1065–1092, 1983.
Liu, X., Easter, R. C., Ghan, S. J., Zaveri, R., Rasch, P., Shi, X.,
Lamarque, J.-F., Gettelman, A., Morrison, H., Vitt, F., Conley,
A., Park, S., Neale, R., Hannay, C., Ekman, A. M. L., Hess, P.,
Mahowald, N., Collins, W., Iacono, M. J., Bretherton, C. S., Flanner, M. G., and Mitchell, D.: Toward a minimal representation
of aerosols in climate models: description and evaluation in the
Community Atmosphere Model CAM5, Geosci. Model Dev., 5,
709–739, doi:10.5194/gmd-5-709-2012, 2012.
Luo, G. and Yu, F.: Simulation of particle formation and number concentration over the Eastern United States with the WRFChem + APM model, Atmos. Chem. Phys., 11, 11521–11533,
doi:10.5194/acp-11-11521-2011, 2011.
Matsui, H., Koike, M., Kondo, Y., Takegawa, N., Wiedensohler, A.,
Fast, J. D., and Zaveri, R. A.: Impact of new particle formation on the concentrations of aerosols and cloud condensation
nuclei around Beijing, J. Geophys. Res.-Atmos., 116, D19208,
doi:10.1029/2011JD016025, 2011.
McFiggans, G., Artaxo, P., Baltensperger, U., Coe, H., Facchini, M.
C., Feingold, G., Fuzzi, S., Gysel, M., Laaksonen, A., Lohmann,
U., Mentel, T. F., Murphy, D. M., O’Dowd, C. D., Snider, J. R.,
and Weingartner, E.: The effect of physical and chemical aerosol
properties on warm cloud droplet activation, Atmos. Chem.
Phys., 6, 2593–2649, doi:10.5194/acp-6-2593-2006, 2006.
McMurry, P. H., Fink, M., Sakurai, H., Stolzenburg, M. R.,
Mauldin, R. L., Smith, J., Eisele, F., Moore, K., Sjostedt, S.,
Tanner, D., Huey, L. G., Nowak, J. B., Edgerton, E., and Voisin,
D.: A criterion for new particle formation in the sulfur-rich Atlanta atmosphere, J. Geophys. Res.-Atmos., 110, 10, D22S02,
doi:10.1029/2005JD005901, 2005.
Merikanto, J., Spracklen, D. V., Mann, G. W., Pickering, S. J.,
and Carslaw, K. S.: Impact of nucleation on global CCN, At-
Atmos. Chem. Phys., 14, 11011–11029, 2014
11028
Y. Y. Cui et al.: Modeling ultrafine particle growth at a pine forest site
mos. Chem. Phys., 9, 8601–8616, doi:10.5194/acp-9-8601-2009,
2009.
Mikkonen, S., Romakkaniemi, S., Smith, J. N., Korhonen, H.,
Petäjä, T., Plass-Duelmer, C., Boy, M., McMurry, P. H., Lehtinen,
K. E. J., Joutsensaari, J., Hamed, A., Mauldin III, R. L., Birmili,
W., Spindler, G., Arnold, F., Kulmala, M., and Laaksonen, A.: A
statistical proxy for sulphuric acid concentration, Atmos. Chem.
Phys., 11, 11319–11334, doi:10.5194/acp-11-11319-2011, 2011.
Mlawer, E. J., Taubman, S. J., Brown, P. D., Iacono, M. J., and
Clough, S. A.: Radiative transfer for inhomogeneous atmospheres: RRTM, a validated correlated-k model for the longwave,
J. Geophys. Res.-Atmos., 102, 16663–16682, 1997.
O’Dowd, C. D., Hämeri, K., Mäkelä, J. M., Pirjola, L., Kulmala,
M., Jennings, S. G., Berresheim, H., Hansson, H.-C., de Leeuw,
G., Kunz, G. J., Allen, A. G., Hewitt, C. N., Jackson, A., Viisanen, Y., and Hoffmann, T.: A dedicated study of New Particle
Formation and Fate in the Coastal Environment (PARFORCE):
Overview of objectives and achievements, J. Geophys. Res., 107,
8108, doi:10.1029/2001JD000555, 2002.
Ortega, J., Turnipseed, A., Guenther, A. B., Karl, T. G., Day, D. A.,
Gochis, D., Huffman, J. A., Prenni, A. J., Levin, E. J. T., Kreidenweis, S. M., DeMott, P. J., Tobo, Y., Patton, E. G., Hodzic, A.,
Cui, Y. Y., Harley, P. C., Hornbrook, R. S., Apel, E. C., Monson,
R. K., Eller, A. S. D., Greenberg, J. P., Barth, M. C., CampuzanoJost, P., Palm, B. B., Jimenez, J. L., Aiken, A. C., Dubey, M. K.,
Geron, C., Offenberg, J., Ryan, M. G., Fornwalt, P. J., Pryor, S.
C., Keutsch, F. N., DiGangi, J. P., Chan, A. W. H., Goldstein, A.
H., Wolfe, G. M., Kim, S., Kaser, L., Schnitzhofer, R., Hansel,
A., Cantrell, C. A., Mauldin, R. L., and Smith, J. N.: Overview
of the Manitou Experimental Forest Observatory: site description
and selected science results from 2008 to 2013, Atmos. Chem.
Phys., 14, 6345–6367, doi:10.5194/acp-14-6345-2014, 2014.
Petäjä, T., Mauldin, III, R. L., Kosciuch, E., McGrath, J., Nieminen, T., Paasonen, P., Boy, M., Adamov, A., Kotiaho, T., and
Kulmala, M.: Sulfuric acid and OH concentrations in a boreal
forest site, Atmos. Chem. Phys., 9, 7435–7448, doi:10.5194/acp9-7435-2009, 2009.
Petters, M. D. and Kreidenweis, S. M.: A single parameter representation of hygroscopic growth and cloud condensation nucleus
activity, Atmos. Chem. Phys., 7, 1961–1971, doi:10.5194/acp-71961-2007, 2007.
Pierce, J. R. and Adams, P. J.: Uncertainty in global CCN concentrations from uncertain aerosol nucleation and primary emission
rates, Atmos. Chem. Phys., 9, 1339–1356, doi:10.5194/acp-91339-2009, 2009.
Pierce, J. R., Riipinen, I., Kulmala, M., Ehn, M., Petäjä, T., Junninen, H., Worsnop, D. R., and Donahue, N. M.: Quantification of
the volatility of secondary organic compounds in ultrafine particles during nucleation events, Atmos. Chem. Phys., 11, 9019–
9036, doi:10.5194/acp-11-9019-2011, 2011.
Pierce, J. R., Leaitch, W. R., Liggio, J., Westervelt, D. M., Wainwright, C. D., Abbatt, J. P. D., Ahlm, L., Al-Basheer, W., Cziczo, D. J., Hayden, K. L., Lee, A. K. Y., Li, S.-M., Russell, L. M., Sjostedt, S. J., Strawbridge, K. B., Travis, M.,
Vlasenko, A., Wentzell, J. J. B., Wiebe, H. A., Wong, J. P. S.,
and Macdonald, A. M.: Nucleation and condensational growth to
CCN sizes during a sustained pristine biogenic SOA event in a
forested mountain valley, Atmos. Chem. Phys., 12, 3147–3163,
doi:10.5194/acp-12-3147-2012, 2012.
Atmos. Chem. Phys., 14, 11011–11029, 2014
Reddington, C. L., Carslaw, K. S., Spracklen, D. V., Frontoso, M.
G., Collins, L., Merikanto, J., Minikin, A., Hamburger, T., Coe,
H., Kulmala, M., Aalto, P., Flentje, H., Plass-Dülmer, C., Birmili, W., Wiedensohler, A., Wehner, B., Tuch, T., Sonntag, A.,
O’Dowd, C. D., Jennings, S. G., Dupuy, R., Baltensperger, U.,
Weingartner, E., Hansson, H.-C., Tunved, P., Laj, P., Sellegri, K.,
Boulon, J., Putaud, J.-P., Gruening, C., Swietlicki, E., Roldin, P.,
Henzing, J. S., Moerman, M., Mihalopoulos, N., Kouvarakis, G.,
Ždímal, V., Zíková, N., Marinoni, A., Bonasoni, P., and Duchi,
R.: Primary versus secondary contributions to particle number
concentrations in the European boundary layer, Atmos. Chem.
Phys., 11, 12007–12036, doi:10.5194/acp-11-12007-2011, 2011.
Rosenfeld, D., Lohmann, U., Raga, G. B., O’Dowd, C. D., Kulmala,
M., Fuzzi, S., Reissell, A., and Andreae, M. O.: Flood or drought:
How do aerosols affect precipitation?, Science, 321, 1309– 313,
2008.
Sihto, S.-L., Kulmala, M., Kerminen, V.-M., Dal Maso, M., Petäjä,
T., Riipinen, I., Korhonen, H., Arnold, F., Janson, R., Boy, M.,
Laaksonen, A., and Lehtinen, K. E. J.: Atmospheric sulphuric
acid and aerosol formation: implications from atmospheric measurements for nucleation and early growth mechanisms, Atmos. Chem. Phys., 6, 4079–4091, doi:10.5194/acp-6-4079-2006,
2006.
Sipila, M., Berndt, T., Petaja, T., Brus, D., Vanhanen, J., Stratmann, F., Patokoski, J., Mauldin, Roy L., I., Hyvarinen, A.-P.,
Lihavainen, H., and Kulmala, M.: The Role of Sulfuric Acid in
Atmospheric Nucleation, Science, 327, 1243–1246, 2010.
Smith, J. N., Moore, K. F., McMurry, P. H., and Eisele, F. L.: Atmospheric measurements of sub-20 nm diameter particle chemical composition by thermal desorption chemical ionization mass
spectrometry, Aerosol Sci. Technol., 38, 100–110, 2004.
Somers, C. M., McCarry, B. E., Malek, F., and Quinn, J. S.: Reduction of particulate air pollution lowers the risk of heritable
mutations in mice, Science, 304, 1008–1010, 2004.
Spracklen, D. V., Carslaw, K. S., Kulmala, M., Kerminen, V.-M.,
Mann, G. W., and Sihto, S.-L.: The contribution of boundary
layer nucleation events to total particle concentrations on regional and global scales, Atmos. Chem. Phys., 6, 5631–5648,
doi:10.5194/acp-6-5631-2006, 2006.
Stohl, A., Forster, C., Frank, A., Seibert, P., and Wotawa, G.:
Technical note: The Lagrangian particle dispersion model
FLEXPART version 6.2, Atmos. Chem. Phys., 5, 2461–2474,
doi:10.5194/acp-5-2461-2005, 2005.
Voisin, D.,. Smith, J. N, Sakurai, H., McMurry P. H., and Eisele, F.
L.: Thermal desorption chemical ionization mass spectrometer
for ultrafine particle chemical composition, Aerosol Sci. Technol., 37, 471–475, 2003.
Westervelt, D. M., Pierce, J. R., Riipinen, I., Trivitayanurak, W.,
Hamed, A., Kulmala, M., Laaksonen, A., Decesari, S., and
Adams, P. J.: Formation and growth of nucleated particles into
cloud condensation nuclei: model-measurement comparison, Atmos. Chem. Phys., 13, 7645–7663, doi:10.5194/acp-13-76452013, 2013.
Wexler, A. S., Lurmann, F. W., and Seinfeld, J. H.: Modeling Urban
and Regional Aerosols. I. Model Development, Atmos. Environ.,
28, 531–546, 1994.
Young, L. H., Benson, D. R., Kameel, F. R., Pierce, J. R.,
Junninen, H., Kulmala, M., and Lee, S.-H.: Laboratory studies of H2 SO4 / H2 O binary homogeneous nucleation from
www.atmos-chem-phys.net/14/11011/2014/
Y. Y. Cui et al.: Modeling ultrafine particle growth at a pine forest site
the SO2+OH reaction: evaluation of the experimental setup
and preliminary results, Atmos. Chem. Phys., 8, 4997–5016,
doi:10.5194/acp-8-4997-2008, 2008.
Zaveri, R. A. and Peters, L. K.: A new lumped structure photochemical mechanism for large-scale applications, J. Geophys. Res.Atmos., 104, 30387–30415, 1999.
Zaveri, R. A., Easter, R. C., Fast, J. D., and Peters, L.
K.: Model for Simulating Aerosol Interactions and Chemistry (MOSAIC), J. Geophys. Res.-Atmos., 113, D13204,
doi:10.1029/2007JD008782, 2008.
www.atmos-chem-phys.net/14/11011/2014/
11029
Zhang, H., Zhang, Z., Cui, T., Lin, Y.-H., Bhathela, N. A., Ortega, J., Worton, D. R., Goldstein, A. H., Guenther, A., Jimenez,
J. L., Gold, A., and Surratt, J. D.: Secondary Organic Aerosol
Formation via 2-Methyl-3-buten-2-ol Photo oxidation: Evidence
of Acid-Catalyzed Reactive Uptake of Epoxides, Environ. Sci.
Technol., 1, 242–247, 2014.
Zhang, R. Y., Suh, I., Zhao, J., Zhang, D., Fortner, E. C., Tie, X.
X., Molina, L. T., and Molina, M. J.: Atmospheric new particle
formation enhanced by organic acids, Science, 304, 1487–1490,
2004.
Atmos. Chem. Phys., 14, 11011–11029, 2014


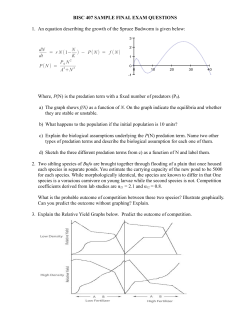


© Copyright 2026