
Fiscal Year 2009 Annual Financial Report And Shareholder Letter
Fiscal Year 2009
Annual Financial Report
And Shareholder Letter
January 2010
To the Shareholders and Cast Members of The Walt Disney Company:
As I was drafting this letter, word came about the passing of a true Disney legend, Roy E.
Disney. Roy devoted the better part of his life to our Company, and during his 56 year tenure, he was
involved on many levels with many businesses, most notably animation. No one was a bigger
champion of this art form than Roy, and it was at his urging that we returned to a full commitment to
animation in the mid-1980s. Roy also introduced us to Pixar in the 1990s, a relationship that has proven
vital to our success. Roy understood the essence of Disney, and his passion for the Company, his
appreciation of its past and his keen interest in its future will be sorely missed.
Last year was both an interesting and challenging one for your Company. On the positive side,
we released two extraordinary animated films, Up and The Princess and the Frog that exemplify the very
best of what we do. We received the go-ahead from China’s government to build a new theme park in
Shanghai. We acquired Marvel Entertainment, whose portfolio of great stories and characters and
talented creative staff complement and strengthen our own. And we reached an agreement to
distribute live-action films made by Steven Spielberg’s DreamWorks SKG.
At the same time, we faced a severe global economic downturn and an acceleration of secular
challenges that affect several of our key businesses. Earnings per share for the year, excluding certain
items affecting comparability between years (1), fell by 20% to $1.82 from the record $2.28 we reported
in fiscal year 2008. Revenues were down 4% to $36.1 billion.
Throughout, we’ve remained focused on advancing our strategic objectives of building the
Company’s position as a leader in the creation of high quality branded content; of using technology to
make that content more compelling and to reach more consumers in more ways; and of making Disney
an even more prominent and successful provider of entertainment globally. We believe our strategy is
the right one and I’m confident it will keep us competitive and enhance our ability to deliver long-term
value to shareholders.
We’re really pleased the Chinese government has given approval for a Disney theme park in
Shanghai. We look forward to finalizing a deal with our partners in Shanghai to build a world-class
resort. With 1.3 billion people, increasing affluence and one of the world’s most unique and dynamic
cultures, China is an important and promising country for Disney.
We’re also excited to welcome to the Disney family the talented team at Marvel. Marvel’s brand,
characters and stories are well-known globally and their popularity cuts across age, gender and
cultural boundaries. Marvel’s business really complements ours and all that we’ve been doing to
maximize and extend the value of Disney’s creative properties across our businesses, media platforms
and geographical markets.
In pursuing our expansion strategy, we’ve also focused on how to confront challenges to our
media businesses brought about by advances in technology, the abundance of choice and changing
consumer preference. We’ve really looked hard at how we could innovate and bring down the cost of
making, marketing and distributing the content we create without sacrificing the quality that
consumers have come to expect of us.
During the course of the last year, we took several steps in that direction. ABC Entertainment
and ABC Studios merged into a single organization dedicated to producing and marketing compelling
programming for ABC and other platforms. Walt Disney Studios streamlined its production,
1
marketing and distribution teams to manage the release of motion pictures from theaters all the way to
handheld devices. And we brought together under a new segment, Disney Interactive Media Group,
our console and online game units so that we can adapt quickly as the gaming market evolves.
We are also reassessing our business models to make sure we continue to be competitive in this
new environment. Decisions are being made on issues related to timing to market, pricing and scope of
distribution that we believe can give us the necessary agility to respond to rapid technological change
and to meet the expectations of consumers who increasingly enjoy entertainment how, when and
where they want it.
Ultimately, though, what sets Disney apart more than anything else is the strength of our brands
and the quality of our entertainment, a distinction we are determined to uphold. Last year, despite the
downturn, and apart from our purchase of Marvel, we invested extensively in entertainment and
experiences we believe will delight Disney, ABC and ESPN fans for years to come.
Our Parks and Resorts business is expanding with the addition of attractions and features that
bring together great creativity, fantastic new technology and some of our most beloved characters and
stories at Disney’s California Adventure, at Hong Kong Disneyland and at the Magic Kingdom at Walt
Disney World. We are also greatly expanding our geographical reach and type of experience available
to vacationing families with the opening of our new family resort in Hawaii in 2011 and the launch of
two magnificent new cruise ships in 2011 and 2012.
Movies remain at the core of what we do, providing many of the rich stories, memorable
characters and compelling worlds that are Disney’s hallmarks. Going forward, we will focus almost
exclusively on making branded films from Disney, Pixar and Marvel. Consumers know and love these
brands and this gives us a competitive advantage. A high quality Disney, Pixar or Marvel film can be
of great value to the entire company over many years. We will also be distributing DreamWorks films,
taking advantage of our Disney global studio infrastructure without much additional risk.
At our media networks, ABC got off to a solid start in the fall season with several of the most
watched shows, including new offerings we are proud of like Modern Family, Flash Forward, The Middle
and V. These shows are attracting the viewers most coveted by advertisers, both on TV and the web,
and affirm the benefit of investing in content that’s smartly written and presented, universal in appeal
and adaptable to different technology platforms. The same holds true of Disney Channel, which last
year had its best ever domestic ratings, and successfully launched the new boy-focused Disney XD
Channel.
Now thirty years old, ESPN remains an incredible innovator, both technologically and in the
quality and scope of its content, and in doing so has built and maintains a truly great brand. Last year,
it made a major move internationally with its purchase of Premier League rights in the United
Kingdom and has deepened its relationship with its most avid fans by setting up local sports portals in
key cities including Chicago, Dallas, Boston and Los Angeles. ESPN’s emphasis on cutting-edge
platforms, ranging from ESPN360.com to the popular SportsCenter iPhone app, insures its content
is relevant and easily accessible no matter what sport you love or where you happen to be.
We’ve been investing in our future in other ways as well. Disney has always had a strong
culture, rooted in our deep pride in what we do every day and a firm understanding of the enormous
responsibility that comes with being stewards of a top global brand. As such, we’ve intensified our
corporate social responsibility efforts to make them even more integral to the way we do business.
Last March, we published our first comprehensive Corporate Responsibility Report
(www.disney.com/crreport), a detailed multimedia portrait of our approach to everything from
charitable giving to workplace diversity, and from environmental measures to online safety for kids.
The scope of our activities is truly impressive, in large part due to the enthusiastic participation of our
2
Cast Members and employees, and the report has helped solidify Disney’s reputation as one of the
world’s most admired companies.
We’re particularly proud of the ambitious long-range environmental goals we have set and with
the accompanying three to five year targets to reduce emissions, waste, electricity and fuel use, as well
as impact on water and eco-systems. We are also committed to using our skills as a media company to
inspire kids to take more personal responsibility for preserving the planet we share.
These programs are practical from a business perspective and in keeping with our heritage.
People all over the world have high expectations of Disney and meeting these standards requires that
we not only deliver entertainment people love, but also behave responsibly in everything we do. When
we do so effectively, we are admired by our employees, shareholders and consumers and that’s good
for our businesses and brands.
It’s also positive from a business perspective when our employees and Cast Members have the
opportunity to gain experience in various parts of the organization. It gives them a new set of
challenges, new perspectives and a great opportunity for continued growth. Longer term, the practice
of motivating and developing Cast Members and employees by providing new or expanding
opportunities will help us attract and retain talented people and will serve this company well.
Over the last year, we’ve been putting into motion such an approach and have started with
changes at the senior management level. On January 1, 2010 Tom Staggs, our chief financial officer for
the last decade, became Chairman, Walt Disney Parks and Resorts, while Jay Rasulo, who held that
position for seven years, became our CFO. In Europe, our executive team is now led by Diego Lerner,
who has very effectively built our Latin American operations over the last decade. And Rich Ross has
become Chairman of Walt Disney Studios in the wake of his first-rate performance as head of Disney
Channel’s global operations.
Last year was a demanding one. But it’s also been a period that’s reinforced some key themes:
that quality must remain at the forefront of what we do; that we must not be afraid to take risks and
challenge the status quo; and that the passion and creativity of our employees and Cast Members is
what makes The Walt Disney Company not only successful, but truly special.
We have many challenges ahead, but I like how we are positioned, who we are and what we
stand for. It’s truly been an honor serving as the President and CEO for the last four years with each
new day bringing new challenges and opportunities for our Company. So, on behalf of all of us at
Disney, I’d like to thank you for your continued support and the faith you show in us to keep
exceeding your expectations in everything we do.
Robert A. Iger
President and Chief Executive Officer
The Walt Disney Company
This year, we have chosen to save environmental resources and reduce costs by separating our narrative
review of the year’s business from our annual financial report and moving the business review to an engaging,
on-line format. Our annual financial report is attached, and you can find our “Year in Review” at
www.Disney.com/investors.
(1) For a reconciliation of earnings per share excluding certain items affecting comparability
between years to reported earnings per share, see the “Additional Information” at the end of this
report.
3
UNITED STATES
SECURITIES AND EXCHANGE COMMISSION
Washington, D.C. 20549
FORM 10-K
ANNUAL REPORT PURSUANT TO SECTION 13 OR 15(d) OF THE
SECURITIES EXCHANGE ACT OF 1934
For the Fiscal Year Ended October 3, 2009
Commission File Number 1-11605
Incorporated in Delaware
500 South Buena Vista Street, Burbank, California 91521
(818) 560-1000
Securities Registered Pursuant to Section 12(b) of the Act:
Title of Each Class
I.R.S. Employer Identification
No. 95-4545390
Name of Each Exchange
on Which Registered
Common Stock, $.01 par value
New York Stock Exchange
Securities Registered Pursuant to Section 12(g) of the Act: None.
Indicate by check mark if the registrant is a well-known seasoned issuer, as defined in Rule 405 of the
Securities Act.
Yes ✓
No
Indicate by check mark if the registrant is not required to file reports pursuant to Section 13 or Section 15(d)
of the Act.
Yes
No ✓
Indicate by check mark whether the registrant (1) has filed all reports required to be filed by Section 13 or
15(d) of the Securities Exchange Act of 1934 during the preceding 12 months and (2) has been subject to such
filing requirements for the past 90 days.
Yes ✓
No
Indicate by check mark whether the registrant has submitted electronically and posted on its corporate Web
site, if any, every Interactive Data File required to be submitted and posted pursuant to Rule 405 of Regulation
S-T during the preceding 12 months (or for such shorter period that the registrant was required to submit and
post such files).
Yes ✓
No
Indicate by check mark if disclosure of delinquent filers pursuant to Rule 405 of Regulation S-K is not
contained herein, and will not be contained, to the best of registrant’s knowledge, in definitive proxy or
information statements incorporated by reference in Part III of this Form 10-K or any amendment to this Form
10-K. [ ]
Indicate by check mark whether the registrant is a large accelerated filer, an accelerated filer, a
non-accelerated filer, or a smaller reporting company. See the definitions of “large accelerated filer”, “accelerated
filer”, and “smaller reporting company” in Rule 12b-2 of the Exchange Act (Check one).
Large accelerated filer
✓
Accelerated filer
Non-accelerated filer (do not check if
smaller reporting company)
Smaller reporting company
Indicate by check mark whether the registrant is a shell company (as defined in Rule 12b-2 of the Act).
Yes
No ✓
The aggregate market value of common stock held by non-affiliates (based on the closing price on the last
business day of the registrant’s most recently completed second fiscal quarter as reported on the New York Stock
Exchange-Composite Transactions) was $31.9 billion. All executive officers and directors of the registrant and all
persons filing a Schedule 13D with the Securities and Exchange Commission in respect to registrant’s common
stock have been deemed, solely for the purpose of the foregoing calculation, to be “affiliates” of the registrant.
There were 1,865,010,858 shares of common stock outstanding as of November 20, 2009.
Documents Incorporated by Reference
Certain information required for Part III of this report is incorporated herein by reference to the proxy
statement for the 2010 annual meeting of the Company’s shareholders.
THE WALT DISNEY COMPANY AND SUBSIDIARIES
TABLE OF CONTENTS
Page
PART I
ITEM 1.
Business . . . . . . . . . . . . . . . . . . . . . . . . . . . . . . . . . . . . . . . . . . . . . . . . . . . . . . . . . . . . . . . . . . . . . . . . . . . . . .
1
ITEM 1A.
Risk Factors . . . . . . . . . . . . . . . . . . . . . . . . . . . . . . . . . . . . . . . . . . . . . . . . . . . . . . . . . . . . . . . . . . . . . . . . . .
18
ITEM 1B.
Unresolved Staff Comments . . . . . . . . . . . . . . . . . . . . . . . . . . . . . . . . . . . . . . . . . . . . . . . . . . . . . . . . . . . .
23
ITEM 2.
Properties . . . . . . . . . . . . . . . . . . . . . . . . . . . . . . . . . . . . . . . . . . . . . . . . . . . . . . . . . . . . . . . . . . . . . . . . . . . .
23
ITEM 3.
Legal Proceedings . . . . . . . . . . . . . . . . . . . . . . . . . . . . . . . . . . . . . . . . . . . . . . . . . . . . . . . . . . . . . . . . . . . . .
25
ITEM 4.
Submission of Matters to a Vote of Security Holders . . . . . . . . . . . . . . . . . . . . . . . . . . . . . . . . . . . . . . .
26
Executive Officers of the Company . . . . . . . . . . . . . . . . . . . . . . . . . . . . . . . . . . . . . . . . . . . . . . . . . . . . . . . . . . . . . . . . . . .
26
PART II
ITEM 5.
Market for the Company’s Common Equity, Related Stockholder Matters and Issuer Purchases
of Equity Securities . . . . . . . . . . . . . . . . . . . . . . . . . . . . . . . . . . . . . . . . . . . . . . . . . . . . . . . . . . . . . . . . . .
27
ITEM 6.
Selected Financial Data . . . . . . . . . . . . . . . . . . . . . . . . . . . . . . . . . . . . . . . . . . . . . . . . . . . . . . . . . . . . . . . . .
28
ITEM 7.
Management’s Discussion and Analysis of Financial Condition and Results of Operations . . . . . .
29
ITEM 7A.
Quantitative and Qualitative Disclosures About Market Risk . . . . . . . . . . . . . . . . . . . . . . . . . . . . . . . .
52
ITEM 8.
Financial Statements and Supplementary Data . . . . . . . . . . . . . . . . . . . . . . . . . . . . . . . . . . . . . . . . . . . .
53
ITEM 9.
Changes in and Disagreements with Accountants on Accounting and Financial Disclosure . . . . . .
53
ITEM 9A.
Controls and Procedures . . . . . . . . . . . . . . . . . . . . . . . . . . . . . . . . . . . . . . . . . . . . . . . . . . . . . . . . . . . . . . .
53
ITEM 9B.
Other Information . . . . . . . . . . . . . . . . . . . . . . . . . . . . . . . . . . . . . . . . . . . . . . . . . . . . . . . . . . . . . . . . . . . . .
53
PART III
ITEM 10.
Directors, Executive Officers and Corporate Governance . . . . . . . . . . . . . . . . . . . . . . . . . . . . . . . . . . .
54
ITEM 11.
Executive Compensation . . . . . . . . . . . . . . . . . . . . . . . . . . . . . . . . . . . . . . . . . . . . . . . . . . . . . . . . . . . . . . .
54
ITEM 12.
Security Ownership of Certain Beneficial Owners and Management and Related Stockholder
Matters . . . . . . . . . . . . . . . . . . . . . . . . . . . . . . . . . . . . . . . . . . . . . . . . . . . . . . . . . . . . . . . . . . . . . . . . . . . .
54
ITEM 13.
Certain Relationships and Related Transactions, and Director Independence . . . . . . . . . . . . . . . . . .
54
ITEM 14.
Principal Accountant Fees and Services . . . . . . . . . . . . . . . . . . . . . . . . . . . . . . . . . . . . . . . . . . . . . . . . . . .
54
PART IV
ITEM 15.
Exhibits and Financial Statement Schedules . . . . . . . . . . . . . . . . . . . . . . . . . . . . . . . . . . . . . . . . . . . . . .
55
SIGNATURES . . . . . . . . . . . . . . . . . . . . . . . . . . . . . . . . . . . . . . . . . . . . . . . . . . . . . . . . . . . . . . . . . . . . . . . . . . . . . . . . . . . . . .
58
Consolidated Financial Information – The Walt Disney Company . . . . . . . . . . . . . . . . . . . . . . . . . . . . . . . . . . . . . . . . .
60
PART I
ITEM 1. Business
The Walt Disney Company, together with its subsidiaries, is a diversified worldwide entertainment company
with operations in five business segments: Media Networks, Parks and Resorts, Studio Entertainment, Consumer
Products and Interactive Media. For convenience, the terms “Company” and “we” are used to refer collectively to the
parent company and the subsidiaries through which our various businesses are actually conducted.
Information on the Company’s revenues, operating income, and identifiable assets appears in Note 1 to the
Consolidated Financial Statements included in Item 8 hereof. The Company employed approximately 144,000 people
as of October 3, 2009.
MEDIA NETWORKS
The Media Networks segment is comprised of a domestic broadcast television network, television production
and distribution operations, domestic television stations, international and domestic cable networks, domestic
broadcast radio networks and stations, and publishing and digital operations.
Domestic Broadcast Television Network
The Company operates the ABC Television Network, which as of October 3, 2009, had affiliation agreements
with 233 local stations reaching 99% of all U.S. television households. The ABC Television Network broadcasts
programs in the following “dayparts”: early morning, daytime, primetime, late night, news, children and sports.
The ABC Television Network produces its own programs or acquires broadcast rights from other third-parties,
as well as entities that are owned by or affiliated with the Company and pays varying amounts of compensation to
affiliated stations for broadcasting the programs and commercial announcements included therein. The ABC Television
Network derives substantially all of its revenues from the sale to advertisers of time in network programs for
commercial announcements. The ability to sell time for commercial announcements and the rates received are
primarily dependent on the size and nature of the audience that the network can deliver to the advertiser as well as
overall advertiser demand for time on network broadcasts.
ABC.com is the official web site of the ABC Television Network and provides access to full length episodes of
ABC shows online. ABCNews.com provides in-depth worldwide news coverage online. ABCNews.com also offers
broadband subscriptions to the 24-hour live internet news channel, ABC News Now and to video-on-demand news
reports from all ABC News broadcasts.
Television Production and Distribution
The Company produces and distributes live action and animated television programming under the ABC
Studios, ABC Media Productions, and ABC Family Productions labels. Program development is carried out in
collaboration with independent writers, producers, and creative teams, with a focus on half-hour comedies, one-hour
dramas, and reality series primarily for primetime broadcasts. Primetime programming produced either for our
networks or for third parties in the 2009/2010 television season include the returning one-hour dramas Army Wives,
Brothers & Sisters, Castle, Criminal Minds, Desperate Housewives, Ghost Whisperer, Grey’s Anatomy, Lost, Private Practice,
Raising the Bar, and Ugly Betty; the returning half-hour comedies Gary Unmarried and Scrubs; and new primetime series
that premiered in the fall of 2009 which included the one-hour drama Flash Forward, and the half-hour comedies Cougar
Town and Ruby & The Rockits. Grey’s Anatomy, Criminal Minds, and Ghost Whisperer entered the domestic syndication
market during 2009. We also produce Jimmy Kimmel Live for late night and a variety of primetime specials for network
television and live-action syndicated programming. Syndicated programming includes Live! with Regis and Kelly, a
daily talk show, At the Movies, a weekly motion picture review program; Who Wants to Be a Millionaire, a game show;
and Legend of the Seeker, a one-hour drama.
Disney-ABC Domestic Television and Disney-ABC-ESPN Television International distribute the Company’s
productions domestically and internationally, respectively. The Company’s productions are also distributed in DVD
format by the Studio Entertainment segment and online.
1
Domestic Television Stations
The Company owns ten television stations, six of which are located in the top-ten markets in the United States.
All of our television stations are affiliated with the ABC Television Network and collectively reach 23% of the nation’s
television households. Each owned station broadcasts three digital channels: the first consists of local, ABC Television
Network, and syndicated programming; the second is the Live Well HD Network; and the third consists of weather
reports powered by AccuWeather.
Live Well HD Network debuted in April 2009 and provides high-definition programming focusing on lifestyle
topics such as interior design, healthy cooking, and outdoor activities.
Markets and details for the stations we own are as follows:
Market
TV Station
Channel
Television
Market
Ranking (1)
New York, NY
Los Angeles, CA
Chicago, IL
Philadelphia, PA
San Francisco, CA
Houston, TX
Raleigh-Durham, NC
Fresno, CA
Flint, MI
Toledo, OH
WABC-TV
KABC-TV
WLS-TV
WPVI-TV
KGO-TV
KTRK-TV
WTVD-TV
KFSN-TV
WJRT-TV
WTVG-TV
7
7
7
6
7
13
11
30
12
13
1
2
3
4
6
10
27
55
66
73
(1)
Based on Nielsen Media Research, U.S. Television Household Estimates, January 1, 2009
Cable Networks
Our cable networks group provides national programming networks, licenses television programming in
domestic and international markets and invests in foreign television broadcasting, programming, production and
distribution entities. Programming at our cable networks is both internally produced and acquired from third parties.
The two primary brands for our cable networks are ESPN and Disney Channel. In addition to cable network
operations, we have ESPN- and Disney- branded radio operations which are managed together with the cable
operations.
Cable networks derive a majority of their revenues from fees charged to cable, satellite and telecommunications
service providers (Multi-channel Video Service Providers or MVSPs) and, for certain networks (primarily ESPN and
ABC Family), the sale to advertisers of time in network programs for commercial announcements. Generally, the
Company’s cable networks operate under multi-year carriage agreements with MVSPs that include contractually
determined fees. The amounts that we can charge to MVSPs for our cable network services are largely dependent on
competition and the quality and quantity of programming that we can provide. The ability to sell time for commercial
announcements and the rates received are primarily dependent on the size and nature of the audience that the network
can deliver to the advertiser as well as overall advertiser demand. Certain programming developed by our cable
networks is also distributed in DVD format by our home entertainment division in the Studio Entertainment segment
and online.
2
The Company’s significant cable networks and our ownership percentage and estimated subscribers as of
October 3, 2009 are set forth in the following table:
Estimated
Domestic
Subscribers
(in millions) (1)
Estimated
International
Subscribers
(in millions) (2)
Ownership %
99
99
64
70
5
55
—
—
—
—
—
—
80.0
80.0
80.0
80.0
80.0
80.0
98
—
74
—
—
—
98
73
96
40
76
9
7
10
—
—
100.0
100.0
100.0
100.0
99.9
100.0
100.0
100.0
99
99
98
72
55
54
14
—
—
—
—
—
—
—
42.1
42.1
42.1
42.1
42.1
42.1
42.1
ESPN
ESPN
ESPN2
ESPN Classic
ESPNEWS
ESPN Deportes
ESPNU (2)
Disney Channels Worldwide
Disney Channel
Playhouse Disney
Disney XD/Toon Disney
Disney Cinemagic
Jetix Europe
Hungama
ABC Family
SOAPnet
A&E/Lifetime
A&E
Lifetime Television
The History Channel
Lifetime Movie Network
The Biography Channel
History International
Lifetime Real Women (2)
(1)
Estimated U.S. subscriber counts according to Nielsen Media Research as of September 2009
(2)
Subscriber counts are not rated by Nielsen and are based on internal management reports. ESPN and A&E
programming is distributed internationally through other networks discussed below.
ESPN ESPN is a multimedia, multinational sports entertainment company that operates six domestic television
sports networks: ESPN, ESPN2, ESPN Classic, ESPNEWS, ESPN Deportes (a Spanish language network) and ESPNU (a
network devoted to college sports). ESPN also operates four high-definition television simulcast services, ESPN HD,
ESPN2 HD, ESPNEWS HD and ESPNU HD. ESPN programs the sports schedule on the ABC Television Network,
which is branded ESPN on ABC. ESPN owns, has equity interests in or has distribution agreements with 46
international sports networks reaching households in more than 197 countries and territories in 16 languages including
a 50% equity interest in ESPN Star Sports, which distributes sports programming throughout most of Asia. ESPN holds
a 30% equity interest in CTV Specialty Television, Inc., which owns The Sports Network, The Sports Network 2, Le
Réseau des Sports, ESPN Classic Canada, the NHL Network and Discovery Canada. ESPN also owns NASN Limited
(NASN) which operates cable television networks in Europe dedicated to North American sporting events.
ESPN also operates:
• ESPN.com – which delivers comprehensive sports news, information and video to millions of online fans each
month
• ESPN360.com – which is a broadband service available to 50 million subscribers that delivers more than 3,000
live events
• ESPN Mobile Properties – which delivers content, including live game coverage, alerts and highlights, to
mobile service providers
3
• ESPN Regional Television – which is a syndicator of collegiate sports programming
• The ESPN Radio Network and five ESPN Radio stations
• ESPN The Magazine
• BASS – which is an association of bass fishing enthusiasts
• ESPN Enterprises – which develops branded licensing opportunities
• ESPN Zone – which is a sports themed dining and entertainment facility.
ESPN holds a 20% equity interest in The Active Network, Inc., a domestic online community and marketing
platform for individuals and event organizers to participate in and promote sports and recreational activities.
The ESPN Radio Network is carried on more than 750 stations, of which 355 are full-time, making it the largest
sports radio network in the United States.
Markets and details for the stations we own are as follows:
Market
Radio
Station
Broadcast
Band
Radio
Market
Ranking (1)
New York, NY
Los Angeles, CA
Chicago, IL
Dallas-Fort Worth, TX
Pittsburgh, PA
WEPN
KSPN
WMVP
KESN
WEAE
AM
AM
AM
FM
AM
1
2
3
5
25
(1)
Based on Fall 2009 Arbitron Radio Market Rankings
The ESPN Zone concept combines three interactive areas under one roof for a complete sports and entertainment
experience: the Studio Grill, offering dining in an ESPN studio environment; the Screening Room, offering fans an
exciting sports viewing environment; and the Sports Arena, challenging guests with a variety of interactive and
competitive games. The Company currently operates six ESPN Zone restaurants located in Anaheim, California;
Baltimore, Maryland; Chicago, Illinois; Las Vegas, Nevada; New York, New York; and Washington, D.C. The Company
also licenses an ESPN Zone restaurant located in Los Angeles, California.
Disney Channels Worldwide
Disney Channel Disney Channel is a 24-hour cable network with programming targeted to children and families
through original series and movies. Shows developed and produced internally for initial exhibition on Disney Channel
include live-action comedy series, animated programming and educational preschool series, as well as projects for the
Disney Channel Original Movie franchise. Live-action comedy series include Hannah Montana, JONAS, Sonny With A
Chance, The Suite Life on Deck and Wizards of Waverly Place. Disney Channel also airs the animated program, Phineas and
Ferb. Original series for preschoolers include the animated series Disney’s Mickey Mouse Clubhouse, Handy Manny, My
Friends Tigger & Pooh, Disney’s Little Einsteins and Special Agent Oso, as well as the live-action series Imagination Movers.
Programming is also acquired from third parties and includes content from Disney’s theatrical film and television
programming library.
The ABC Television Network’s Saturday morning children’s daypart, “ABC Kids” includes many of the liveaction and animated series produced for Disney Channel, including Hannah Montana.
Playhouse Disney Playhouse Disney provides learning-focused programming for preschoolers. In the U.S., the
daily Playhouse Disney programming block is aired on Disney Channel. Playhouse Disney is aired internationally with
channels in Latin America, Europe, Asia, Australia and Africa.
4
Disney XD In February 2009, the Toon Disney television and online platforms in the U.S. were rebranded to
become Disney XD. Disney XD has a mix of live-action and animated programming for kids ages 6-14, targeting boys
and their quest for discovery, accomplishment, sports, adventure and humor. The programming includes original
series, movies and short-form content, as well as sports-themed series developed with ESPN.
In the U.S., Disney XD is seen on a 24-hour network. Disney XD channels have launched in Latin America,
Europe and Asia building its distribution base to 107 countries/territories. As discussed below, many of the Disney XD
channels were previously Jetix channels.
Disney Cinemagic Disney Cinemagic is a premium subscription service in Europe. Disney Cinemagic shows
Disney movies, classic and newer Disney cartoons and shorts as well as animated television series such as Disney’s
House of Mouse, Lilo & Stitch: The Series, and Tarzan.
Jetix During fiscal 2009, the Company acquired an additional 26% interest in Jetix Europe, a publicly traded
pan-European integrated children’s entertainment company (bringing our total ownership interest to over 99%). The
Company also has 100% ownership interest in Jetix Latin America. The Company is re-branding the Jetix channels to
either Disney Channel or Disney XD which should be completed by the end of calendar year 2009.
Hungama Hungama is a kids general entertainment cable network in India which features a mix of anime, Hindilanguage series and game shows.
ABC Family ABC Family is a U.S. television programming service that targets adults 18-34. ABC Family’s slate of
original programming includes The Secret Life of the American Teenager, Greek, Lincoln Heights and the new series Make It
or Break It. ABC Family also premiered two new original comedies in 2009: 10 Things I Hate About You, inspired by the
hit 1999 film of the same name, and Ruby & The Rockits. Additionally, ABC Family airs content acquired from third
parties, and products from our owned theatrical film library. ABC Family also features branded programming holiday
events such as “13 Nights of Halloween” and “25 Days of Christmas”.
ABCFamily.com creates digital extensions to ABC Family programming that feature interactivity and social
networking. The site also features user-generated content and online programming that can be downloaded and
customized based on preferences of individual users.
SOAPnet SOAPnet offers same day episodes of daytime dramas at night for convenient viewing and also original
programming. Programming includes same-day episodes of daytime dramas such as All My Children, Days of Our Lives,
One Life to Live, General Hospital and The Young and the Restless; primetime series The O.C., One Tree Hill, Beverly Hills
90210, The Gilmore Girls; and original programs like Southern Belles: Louisville, Being Erica, Holidate and Bank of Mom and
Dad.
Content related to SOAPnet’s programming is available on SOAPnet.com, including video extras, games, blogs,
community forums, photos and downloadable content. Additionally, SOAPNETIC is a broadband fee service that
provides behind-the-scenes coverage of the world of daytime dramas.
A&E/Lifetime On September 15, 2009, the Company and the Hearst Corporation (Hearst) both contributed their
50% interest in Lifetime Entertainment Services LLC (Lifetime) to A&E Television Networks, LLC (AETN) in exchange
for an increased interest in AETN. The Company has a 42% ownership interest in the combined AETN/Lifetime. See
Note 4 to the Consolidated Financial Statements for further discussion.
The A&E Television Networks include A&E, The History Channel, The Biography Channel and History
International. A&E offers entertainment ranging from reality series to original movies, dramatic series, and justice
shows. The History Channel offers original non-fiction series and event-driven specials. The Biography Channel offers
original series about prominent people and their lives, including the “Biography” series. History International focuses
on the culture and history of various countries throughout the world from the perspective of locals. Internationally,
A&E programming is available in 125 countries through joint ventures and distribution agreements with affiliates.
Lifetime Entertainment Services includes Lifetime Television, Lifetime Movie Network and Lifetime Real
Women. Lifetime Television is devoted to women’s lifestyle programming. Lifetime Movie Network is a 24-hour movie
channel. Lifetime Real Women is a 24-hour cable network with programming from a woman’s point of view.
5
The Company’s share of the financial results of AETN/Lifetime is reported under the heading “Equity in the
income of investees” in the Company’s Consolidated Statements of Income.
Radio Disney Radio Disney is a 24/7 radio network for kids, tweens and families. Radio Disney is available on 49
terrestrial radio stations and on RadioDisney.com, Sirius and XM satellite radio, iTunes Radio Tuner, XM/DIRECTV
and mobile phones. Radio Disney programming can be downloaded via the iTunes Music Store. Radio Disney is also
available throughout most of South America via a separate Spanish language terrestrial broadcast.
Radio Disney stations we own are as follows:
Market
Station
Broadcast
Band
Market
Ranking (1)
New York, NY
Los Angeles, CA
Chicago, IL
San Francisco, CA
Dallas-Fort Worth, TX
Houston, TX
Atlanta, GA
Philadelphia, PA
Boston, MA
Detroit, MI
Miami, FL
Seattle, WA
Phoenix, AZ
Minneapolis, MN
Tampa, FL
Denver, CO
St. Louis, MO
Portland, OR
Charlotte, NC
Sacramento, CA
Cleveland, OH
Salt Lake City, UT
San Antonio, TX
Kansas City, MO
Orlando, FL
Milwaukee, WI
Indianapolis, IN
Providence, RI
Norfolk, VA
Greensboro, NC
Jacksonville, FL
West Palm Beach, FL
Hartford, CT
New Orleans, LA
Louisville, KY
Richmond, VA
Albany, NY
Tulsa, OK
Albuquerque, NM
Little Rock, AR
Wichita, KS
WQEW
KDIS
WRDZ
KMKY
KMKI
KMIC
WDWD
WWJZ
WMKI
WFDF
WMYM
KKDZ
KMIK
KDIZ
WWMI
KDDZ
WSDZ
KDZR
WGFY
KIID
WWMK
KWDZ
KRDY
KPHN
WDYZ
WKSH
WRDZ
WDDZ
WHKT
WCOG
WBWL
WMNE
WDZK
WBYU
WDRD
WDZY
WDDY
KMUS
KALY
KDIS
KQAM
AM
AM
AM
AM
AM
AM
AM
AM
AM
AM
AM
AM
AM
AM
AM
AM
AM
AM
AM
AM
AM
AM
AM
AM
AM
AM
FM
AM
AM
AM
AM
AM
AM
AM
AM
AM
AM
AM
AM
FM
AM
1
2
3
4
5
6
7
8
10
11
12
13
15
16
19
20
21
23
24
27
29
30
31
32
34
37
39
41
43
45
46
47
50
52
54
55
63
65
68
85
98
(1)
Based on Fall 2009 Arbitron Radio Market Rankings
6
Competition and Seasonality
The ABC Television Network, Disney Channel, ESPN, ABC Family Channel and the ESPN and Radio Disney
networks and our other broadcast and cable networks compete for viewers primarily with other television and cable
networks, independent television stations and other media, such as DVDs, video games and the internet. With respect
to the sale of advertising time, our broadcasting operations, certain of our cable networks and our television and radio
stations compete with other television networks and radio stations, independent television stations, MVSPs and other
advertising media such as newspapers, magazines, billboards, and the internet. Our television and radio stations
primarily compete for viewers in individual market areas. A television or radio station in one market generally does
not compete directly with stations in other markets.
The growth in the number of networks distributed by MVSPs has resulted in increased competitive pressures for
advertising revenues for both our broadcasting and cable networks. The Company’s cable networks also face
competition from other cable networks for carriage by MVSPs. The Company’s contractual agreements with MVSPs
are renewed or renegotiated from time to time in the ordinary course of business. Consolidation and other market
conditions in the cable and satellite distribution industry and other factors may adversely affect the Company’s ability
to obtain and maintain contractual terms for the distribution of its various cable programming services that are as
favorable as those currently in place.
The Company’s Media Networks businesses also compete for the acquisition of sports and other programming.
The market for programming is very competitive, particularly for sports programming. The Company currently has
sports rights agreements with the National Football League (NFL), college football (including college bowl games) and
basketball conferences, National Basketball Association (NBA), National Association of Stock Car Auto Racing
(NASCAR), Major League Baseball (MLB), World Cup and various soccer leagues, and Golf and Tennis Associations.
The Company’s internet web sites and digital products compete with other web sites and entertainment products
in their respective categories.
Advertising revenues at the Media Networks are subject to seasonal advertising patterns and changes in
viewership levels. Revenues are typically somewhat higher during the fall and somewhat lower during the summer
months. Affiliate revenues are typically collected ratably throughout the year. Certain affiliate revenues at ESPN are
deferred until annual programming commitments are met, and these commitments are typically satisfied during the
second half of the Company’s fiscal year, which generally results in higher revenue recognition during this period.
Federal Regulation
Television and radio broadcasting are subject to extensive regulation by the Federal Communications
Commission (FCC) under federal laws and regulations, including the Communications Act of 1934, as amended.
Violation of FCC regulations can result in substantial monetary forfeitures, limited renewals of licenses and, in
egregious cases, denial of license renewal or revocation of a license. FCC regulations that affect our Media Networks
segment include the following:
• Licensing of television and radio stations. Each of the television and radio stations we own must be licensed by
the FCC. These licenses are granted for periods of up to eight years, and we must obtain renewal of licenses as
they expire in order to continue operating the stations. We (or the acquiring entity in the case of a divestiture)
must also obtain FCC approval whenever we seek to have a license transferred in connection with the
acquisition or divestiture of a station. The FCC may decline to renew or approve the transfer of a license in
certain circumstances. Although we have generally received such renewals and approvals in the past, there
can be no assurance that we will always obtain necessary renewals and approvals in the future.
• Television and radio station ownership limits. The FCC imposes limitations on the number of television stations
and radio stations we can own in a specific market, on the combined number of television and radio stations
we can own in a single market and on the aggregate percentage of the national audience that can be reached
by television stations we own. Currently:
• FCC regulations may restrict our ability to own more than one television station in a market, depending on
the size and nature of the market. We do not own more than one television station in any of the ten
markets in which we own a television station.
7
• Federal statutes permit our television stations in the aggregate to reach a maximum of 39% of the national
audience (for this purpose, FCC regulations attribute to UHF television stations only 50% of the television
households in their market). For purposes of the FCC’s rules, our 10 stations reach approximately 23% of
the national audience.
• FCC regulations in some cases impose restrictions on our ability to acquire additional radio or television
stations in the markets in which we own radio stations, but we do not believe any such limitations are
material to our current operating plans.
• Dual networks. FCC rules currently prohibit any of the four major television networks – ABC, CBS, Fox and
NBC – from being under common ownership or control.
• Regulation of programming. The FCC regulates broadcast programming by, among other things, banning
“indecent” programming, regulating political advertising and imposing commercial time limits during
children’s programming. Broadcasters face a heightened risk of being found in violation of the indecency
prohibition by the FCC because of recent FCC decisions, coupled with the spontaneity of live programming.
In the past several years, the FCC increased enforcement activities with respect to indecency, and a number of
significant indecency cases against various broadcasters remain pending in the courts. Moreover, Congress
recently increased penalties for broadcasting indecent programming to a maximum of $325,000 per violation.
Federal legislation and FCC rules also limit the amount of commercial matter that may be shown on broadcast
or cable channels during programming designed for children 12 years of age and younger. In addition,
broadcast channels are generally required to provide a minimum of three hours per week of programming
that has as a “significant purpose” meeting the educational and informational needs of children 16 years of
age and younger. FCC rules also give television station owners the right to reject or refuse network
programming in certain circumstances or to substitute programming that the licensee reasonably believes to
be of greater local or national importance.
• Cable and satellite carriage of broadcast television stations. With respect to cable systems operating within a
television station’s Designated Market Area, FCC rules require that every three years each television station
elect either “must carry” status, pursuant to which cable operators generally must carry a local television
station in the station’s market, or “retransmission consent” status, pursuant to which the cable operator must
negotiate with the television station to obtain the consent of the television station prior to carrying its signal.
Under the Satellite Home Viewer Improvement Act and its successor, the Satellite Home Viewer Extension
and Reauthorization Act, satellite carriers are permitted to retransmit a local television station’s signal into its
local market with the consent of the local television station. Under must carry, if a satellite carrier elects to
carry one local station in a market, the satellite carrier must carry the signals of all local television stations that
also request carriage. Certain of the satellite carriage provisions are set to expire on December 31, 2009,
although legislation is pending that would continue many of the relevant provisions.
• Digital television. All of the Company’s stations now operate exclusively on digital channels, and we are
evaluating various options with respect to use of digital capabilities.
• Cable and Satellite Carriage of Programming. The Communications Act and FCC rules regulate some aspects of
negotiations regarding cable and satellite retransmission consent, and some cable and satellite companies
have sought regulation of additional aspects of the carriage of programming on cable and satellite systems.
Litigation has been instituted against the Company, other program providers and distributors seeking among
other things to achieve similar ends. New legislation, court action or regulation in this area could, depending
on its specific nature, have an impact on the Company’s operations.
The foregoing is a brief summary of certain provisions of the Communications Act and other legislation and of
specific FCC rules and policies. Reference should be made to the Communications Act, other legislation, FCC rules and
public notices and rulings of the FCC for further information concerning the nature and extent of the FCC’s regulatory
authority.
FCC laws and regulations are subject to change, and the Company generally cannot predict whether new
legislation, court action or regulations, or a change in the extent of application or enforcement of current laws and
regulations, would have an adverse impact on our operations.
8
PARKS AND RESORTS
The Company owns and operates the Walt Disney World Resort in Florida, the Disneyland Resort in California,
the Disney Vacation Club, the Disney Cruise Line, and Adventures by Disney. The Company manages and has
effective ownership interests of 51% and 47%, respectively, in Disneyland Paris and Hong Kong Disneyland Resort.
The Company also licenses the operations of the Tokyo Disney Resort in Japan. The Company’s Walt Disney
Imagineering unit designs and develops new theme park concepts and attractions as well as resort properties. In
November 2009, the Company’s Project Application Report (PAR) for a Disney theme park in the Pudong district of
Shanghai received approval from the relevant authorities of the central government of China. The PAR approval will
enable the Company and its Shanghai partners to move forward toward a final agreement to build and operate a park
and begin preliminary development work.
The businesses in the Parks and Resorts segment generate revenues predominately from the sale of admissions to
the theme parks; room nights at the hotels; merchandise, food and beverage sales; sales and rentals of vacation club
properties; and cruise vacation packages. Costs consist principally of labor; depreciation; costs of merchandise, food
and beverage sold; marketing and sales expense; repairs and maintenance; and entertainment.
Walt Disney World Resort
The Walt Disney World Resort is located 22 miles southwest of Orlando, Florida, on approximately 25,000 acres
of owned land. The resort includes theme parks (the Magic Kingdom, Epcot, Disney’s Hollywood Studios and Disney’s
Animal Kingdom); hotels; vacation club properties; a retail, dining and entertainment complex; a sports complex;
conference centers; campgrounds; golf courses; water parks; and other recreational facilities designed to attract visitors
for an extended stay.
The Walt Disney World Resort is marketed through a variety of international, national and local advertising and
promotional activities. A number of attractions in each of the theme parks are sponsored by other corporations through
long-term agreements.
Magic Kingdom – The Magic Kingdom, which opened in 1971, consists of seven themed lands: Main Street USA,
Adventureland, Fantasyland, Frontierland, Liberty Square, Mickey’s Toontown Fair and Tomorrowland. Each land
provides a unique guest experience featuring themed rides and attractions, live Disney character interaction,
restaurants, refreshment areas and merchandise shops. Additionally, there are daily parades and a nighttime fireworks
extravaganza, Wishes.
Epcot – Epcot, which opened in 1982, consists of two major themed areas: Future World and World Showcase.
Future World dramatizes certain historical developments and addresses the challenges facing the world today through
major pavilions devoted to showcasing science and technology improvements, communication, energy, transportation,
using your imagination, life and health, nature and food production, the ocean environment and space. World
Showcase presents a community of nations focusing on the culture, traditions and accomplishments of people around
the world. Countries represented with pavilions include the United States, Canada, China, France, Germany, Italy,
Japan, Mexico, Morocco, Norway and the United Kingdom. Both areas feature themed rides and attractions,
restaurants and merchandise shops. Epcot also features Illuminations: Reflections of Earth, a nighttime entertainment
spectacular.
Disney’s Hollywood Studios – Disney’s Hollywood Studios, which opened in 1989, consists of a theme park, a
radio studio and a film and television production facility. The park centers on Hollywood as it was during the 1930’s
and 1940’s and provides various attractions, themed food service and merchandise facilities. The production facility
consists of three sound stages, merchandise shops and a back lot and currently hosts both feature film and television
productions. Disney’s Hollywood Studios also features Fantasmic!, a nighttime entertainment spectacular.
Disney’s Animal Kingdom – Disney’s Animal Kingdom, which opened in 1998, consists of a 145-foot Tree of
Life centerpiece surrounded by six themed areas: Dinoland U.S.A., Africa, Rafiki’s Planet Watch, Asia, Discovery
Island and Camp Minnie-Mickey. Each themed area contains adventure attractions, entertainment shows, restaurants
and merchandise shops. The park features more than 300 species of mammals, birds, reptiles and amphibians and 3,000
varieties of trees and plants.
9
Hotels and Other Resort Facilities – As of October 3, 2009, the Company owned and operated 17 resort hotels at
the Walt Disney World Resort, with a total of approximately 22,000 rooms and 468,000 square feet of conference
meeting space. In addition, Disney’s Fort Wilderness camping and recreational area offers approximately 800
campsites.
The Walt Disney World Resort also hosts a 120-acre retail, dining and entertainment complex known as
Downtown Disney, which consists of the Marketplace, West Side and Pleasure Island. Downtown Disney is home to
the 50,000-square-foot World of Disney retail store featuring Disney-branded merchandise, Cirque du Soleil, the House
of Blues, and the Company’s DisneyQuest facility. A number of the Downtown Disney facilities are operated by third
parties that pay rent and license fees to the Company. In September 2008, the Company commenced a project to
enhance Pleasure Island, which will feature new shopping and dining experiences to entertain guests of all ages. The
project is expected to be completed in 2012.
Disney’s Wide World of Sports, which opened in 1997, is a 220-acre sports complex providing professional
caliber training and competition, festival and tournament events and interactive sports activities. The complex’s venues
accommodate multiple sporting events, including baseball, tennis, basketball, softball, track and field, football and
soccer. Its stadium, which has a seating capacity exceeding 9,500, is the spring training site for MLB’s Atlanta Braves.
The Amateur Athletic Union hosts more than 30 championship events per year at the facility. The Company is
currently in the process of rebranding Disney’s Wide World of Sports complex to ESPN’s Wide World of Sports, which
is expected to be completed in 2010.
In the Downtown Disney Resort area, seven independently-operated hotels are situated on property leased from
the Company. These hotels have a capacity of approximately 3,700 rooms. Additionally, the Walt Disney World Swan
and the Walt Disney World Dolphin hotels, which have approximately 2,300 total rooms, are independently operated
on property leased from the Company near Epcot.
Other recreational amenities and activities available at the Walt Disney World Resort include four championship
golf courses, miniature golf courses, full-service spas, tennis, sailing, water skiing, swimming, horseback riding and a
number of other noncompetitive sports and leisure time activities. The resort also includes two water parks: Blizzard
Beach and Typhoon Lagoon.
Disneyland Resort
The Company owns 461 acres and has the rights under long-term lease for use of an additional 49 acres of land in
Anaheim, California. The Disneyland Resort includes two theme parks (Disneyland and Disney’s California
Adventure), three hotels and Downtown Disney, a retail, dining and entertainment complex designed to attract visitors
for an extended stay.
The entire Disneyland Resort is marketed as a destination resort through international, national and local
advertising and promotional activities. A number of the attractions and restaurants at both of the theme parks are
sponsored by other corporations through long-term agreements.
Disneyland – Disneyland, which opened in 1955, consists of Main Street USA and seven principal areas:
Adventureland, Critter Country, Fantasyland, Frontierland, New Orleans Square, Tomorrowland and Toontown.
These areas feature themed rides and attractions, shows, restaurants, merchandise shops and refreshment stands.
Additionally, Disneyland offers daily parades and a nighttime entertainment spectacular, Fantasmic!.
Disney’s California Adventure – Disney’s California Adventure, which opened in 2001, is adjacent to
Disneyland and includes four principal areas: Golden State, Hollywood Pictures Backlot, Paradise Pier and “a bug’s
land”. These areas include rides, attractions, shows, restaurants, merchandise shops and refreshment stands.
In October 2007, the Company announced a multi-year expansion that brings new entertainment and familyoriented attractions to Disney’s California Adventure, including an entirely new 12-acre Cars Land inspired by the
animated film Cars and a new nighttime water spectacular, World of Color.
Hotels and Other Resort Facilities – Disneyland Resort includes three Company-owned and operated hotels: the
969-room Disneyland Hotel, the 481-room Disney’s Paradise Pier Hotel, and Disney’s Grand Californian Hotel & Spa, a
10
deluxe hotel located adjacent to Disney’s California Adventure. Disney’s Grand Californian Hotel & Spa was recently
expanded and now has 948 rooms as well as fifty vacation club units.
Disneyland Resort also includes Downtown Disney, a themed 15-acre outdoor complex of entertainment, dining
and shopping venues, located adjacent to both Disneyland Park and Disney’s California Adventure. A number of the
Downtown Disney facilities are operated by third parties that pay rent and license fees to the Company.
Disneyland Paris
The Company has a 51% effective ownership interest in Disneyland Paris, a 4,800-acre development located in
Marne-la-Vallée, approximately 20 miles east of Paris, France, which was developed pursuant to a 1987 master
agreement with French governmental authorities. The Company manages and has a 40% equity interest in Euro Disney
S.C.A., a publicly-traded French entity that is the holding company for Euro Disney Associés S.C.A.(Disney S.C.A), the
primary operating company of Disneyland Paris. Euro Disney S.C.A. and its subsidiaries operate Disneyland Paris,
which includes two theme parks (Disneyland Park and Walt Disney Studios Park); seven themed hotels; convention
centers; a shopping, dining and entertainment complex; and a 27-hole golf facility. Of the 4,800 acres comprising the
site, approximately 2,400 acres have been developed to date which includes the Val d’Europe development discussed
below. An indirect, wholly-owned subsidiary of the Company is responsible for managing Disneyland Paris. Euro
Disney S.C.A. is required to pay royalties and management fees to certain indirect, wholly-owned subsidiaries of The
Walt Disney Company based on the operating performance of the resort.
Disneyland Park – Disneyland Park, which opened in 1992, consists of Main Street and four principal themed
areas: Adventureland, Discoveryland, Fantasyland and Frontierland. These areas include themed rides, attractions,
shows, restaurants, merchandise shops and refreshment stands. Disneyland Park also features a daily parade.
Walt Disney Studios Park – Walt Disney Studios Park opened in March 2002 adjacent to Disneyland Park. The
park takes guests into the worlds of cinema, animation and television and includes four principal themed areas: Front
Lot, Toon Studios, Production Courtyard and Backlot. These areas each include themed rides, attractions, shows,
restaurants, merchandise shops and refreshment stands.
Hotels and Other Facilities – Disneyland Paris operates seven resort hotels, with a total of approximately 5,800
rooms and 250,000 square feet of conference meeting space. In addition, several on-site hotels opened between 2003
and 2006 that are owned and operated by third-party developers and provide approximately 2,400 rooms.
Disneyland Paris also includes Disney Village, a seven-acre retail, dining and entertainment complex, located
between the theme parks and the hotels. A number of the Disney Village facilities are operated by third parties that pay
rent and license fees to a subsidiary of Euro Disney S.C.A.
Val d’Europe is a planned community that is being developed near Disneyland Paris. The completed phases of
the development include: a town center, which consists of a shopping center; a 150-room hotel; office, commercial, and
residential space; and a regional train station. Third parties operate these developments on land leased or purchased
from Euro Disney S.C.A. and its subsidiaries.
In fiscal 2005, Euro Disney S.C.A. completed a financial restructuring, which provided for an increase in capital
and refinancing of its borrowings. Pursuant to the financial restructuring, the Company agreed to conditionally and
unconditionally defer certain management fees and royalties and convert them into long-term subordinated debt and
provide a new ten year line of credit for liquidity needs, which is currently €100 million.
Hong Kong Disneyland Resort
The Company owns a 47% interest in Hong Kong Disneyland Resort through Hongkong International Theme
Parks Limited, an entity in which the Government of the Hong Kong Special Administrative Region (HKSAR) owns a
53% majority interest. A separate Hong Kong subsidiary of the Company is responsible for managing Hong Kong
Disneyland Resort.
Located on 311 acres on Lantau Island, the resort is in close proximity to the Hong Kong International Airport.
Hong Kong Disneyland Resort includes one theme park and two themed hotels.
11
Hong Kong Disneyland – Hong Kong Disneyland opened in 2005 and consists of the following themed lands:
Adventureland, Fantasyland, Main Street USA and Tomorrowland. These areas feature themed rides and attractions,
shows, restaurants, merchandise shops and refreshment stands. Additionally, there are daily parades and a nighttime
fireworks extravaganza.
Hotels – Hong Kong Disneyland Resort includes two themed hotels: the 400-room Hong Kong Disneyland Hotel
and the 600-room Disney’s Hollywood Hotel.
In July 2009, the Company and the HKSAR agreed to a capital realignment and expansion plan for Hong Kong
Disneyland. The expansion will bring three new themed areas to Hong Kong Disneyland, which are scheduled to be
completed in phases by 2014. Pursuant to the plan, the Company converted a loan to Hong Kong Disneyland into
equity and made an additional $40 million capital contribution and the HKSAR converted a like amount of its loan into
equity. This increased the Company’s effective ownership interest from 43% to 47% as of October 3, 2009. The
Company expects to make additional capital contributions over approximately five years to fund the expansion of
Hong Kong Disneyland. See Note 7 to the Consolidated Financial Statements.
Based on the operating performance of Hong Kong Disneyland Resort, the Company is entitled to receive
royalties and management fees. The Company has, however, waived management fees and deferred royalties for the
2008 and 2009 fiscal years.
Tokyo Disney Resort
Tokyo Disney Resort is located on approximately 494 acres of land, six miles east of downtown Tokyo, Japan.
The resort includes two theme parks (Tokyo Disneyland and Tokyo DisneySea); three Disney-branded hotels; six
independently operated hotels; and a retail, dining and entertainment complex.
Tokyo Disneyland – Tokyo Disneyland, which opened in 1983, was the first Disney theme park to open outside
the United States. Tokyo Disneyland consists of seven principal areas: Adventureland, Critter Country, Fantasyland,
Tomorrowland, Toontown, Westernland and World Bazaar.
Tokyo DisneySea – Tokyo DisneySea, adjacent to Tokyo Disneyland, opened in 2001. The park is divided into
seven unique “ports of call,” including Mediterranean Harbor, American Waterfront, Port Discovery, Lost River Delta,
Mermaid Lagoon, Mysterious Island and Arabian Coast.
Hotels and Other Resort Facilities – The resort includes the 504-room Disney Ambassador Hotel, the 502-room
Tokyo DisneySea Hotel MiraCosta and the 705-room Tokyo Disneyland Hotel. The resort also includes the Disney
Resort Line monorail, which links theme parks and resort hotels with Ikspiari, a retail, dining and entertainment
complex; Bon Voyage, a Disney-themed merchandise location; as well as the first Cirque du Soleil theatre in Japan.
The Company earns royalties on revenues generated by the Tokyo Disney Resort, which is owned and operated
by Oriental Land Co., Ltd. (OLC), a Japanese corporation in which the Company has no equity interest. OLC markets
the Tokyo Disney Resort through a variety of local, domestic and international advertising and promotional activities.
In addition, third parties sponsor many of the theme park attractions under long-term arrangements.
Disney Vacation Club
The Disney Vacation Club (DVC) offers ownership interests in ten resort facilities located at the Walt Disney
World Resort; Disneyland Resort; Vero Beach, Florida; and Hilton Head Island, South Carolina. Available units at each
facility are offered for sale under a vacation ownership plan and are operated as rental property until the units are sold.
DVC inventory consists of a mix of units ranging from one bedroom studios to three bedroom villas. Unit counts in this
document are presented in terms of two bedroom equivalents. As of October 3, 2009, DVC has 3,060 units including the
second phase of Disney’s Animal Kingdom Villas, Bay Lake Tower at Disney’s Contemporary Resort and the
Treehouse Villas at Disney’s Saratoga Springs Resort & Spa, all of which opened in 2009 on Walt Disney World Resort
property. Additionally, DVC opened its first property on the West Coast in 2009 with the opening of 50 units at
Disney’s Grand Californian Hotel & Spa at Disneyland Resort. In 2007, the Company purchased 21 acres of oceanfront
property on the island of Oahu, Hawaii, which will be home to a new DVC resort. This resort, scheduled to open in
phases beginning in 2011, will include 350 traditional hotel rooms and 480 vacation club units.
12
Disney Cruise Line
Disney Cruise Line, which is operated out of Port Canaveral, Florida, is a vacation cruise line that includes two
85,000-ton ships, the Disney Magic and the Disney Wonder. Both ships cater to children, families and adults, with
distinctly-themed areas and activities for each group. Each ship features 877 staterooms, 73% of which are outside and
provide guests with ocean views. Cruise vacations often include a visit to Disney’s Castaway Cay, a 1,000-acre private
Bahamian island. The Company packages three, four and seven-day cruise vacations with visits to the Walt Disney
World Resort and also offers cruise-only options.
In 2007, the Company announced that it is expanding its cruise business by adding two new ships, the Disney
Dream in 2011 and the Disney Fantasy in 2012. The new ships will each be approximately 128,000 tons with 1,250
staterooms. In 2009, the Company announced that the Disney Wonder will move its home to the Port of Los Angeles in
2011, to accommodate Pacific itineraries.
Adventures by Disney
Adventures by Disney, which began operations in 2005, offers a series of all-inclusive guided vacation tour
packages at predominantly non-Disney sites around the world. The Company provided 22 specialized excursion
packages during 2009.
Walt Disney Imagineering
Walt Disney Imagineering provides master planning, real estate development, attraction and show design,
engineering support, production support, project management and other development services, including research and
development for the Company’s operations.
Competition and Seasonality
The Company’s theme parks and resorts as well as Disney Cruise Line and Disney Vacation Club compete with
other forms of entertainment, lodging, tourism and recreational activities. The profitability of the leisure-time industry
may be influenced by various factors that are not directly controllable, such as economic conditions including business
cycle and exchange rate fluctuations, travel industry trends, amount of available leisure time, oil and transportation
prices and weather patterns.
All of the theme parks and the associated resort facilities are operated on a year-round basis. Historically, the
theme parks and resort business experiences fluctuations in theme park attendance and resort occupancy resulting
from the seasonal nature of vacation travel and local entertainment excursions. Peak attendance and resort occupancy
generally occur during the summer months when school vacations occur and during early-winter and spring-holiday
periods.
STUDIO ENTERTAINMENT
The Studio Entertainment segment produces and acquires live-action and animated motion pictures,
direct-to-video content, musical recordings and live stage plays.
The Company distributes produced and acquired films (including its film and television library) in the theatrical,
home entertainment and television markets. Each of these market windows is discussed in more detail below.
In August 2009, the Company entered into an agreement with DreamWorks Studios (“DreamWorks”) to
distribute live-action motion pictures produced by DreamWorks over the next seven years under the Touchstone
Pictures banner. As part of the agreement, the Company will provide certain financing, which as of October 3, 2009,
totaled $100 million.
Theatrical Market
Walt Disney Pictures, a subsidiary of the Company, produces and acquires live-action motion pictures focusing
on the production of Disney-branded films that are distributed primarily under the Walt Disney Pictures, Touchstone
Pictures and Disneynature banners. Miramax Film Corp. (Miramax), another subsidiary of the Company, acquires and
13
produces motion pictures under the Miramax banner. The Company also owns and distributes motion pictures under
the Dimension banner that were produced and distributed by the Company under that banner with initial release dates
before September 30, 2005. The Company also produces and distributes animated motion pictures under the banners
Walt Disney Pictures and Pixar.
During fiscal 2010, we expect to distribute domestically approximately 14 feature films under the Walt Disney
Pictures, Pixar, Touchstone Pictures and Disneynature banners and approximately seven films under the Miramax
banner. These releases include several live-action family films and full-length animated films, with the remainder
targeted to teenagers and/or adults. As of October 3, 2009, the Company had released domestically 949 full-length liveaction features, 83 full-length animated features, approximately 548 cartoon shorts and 53 live action shorts under the
Walt Disney Pictures, Pixar, Touchstone Pictures, Hollywood Pictures, Miramax and Dimension banners.
We distribute and market our filmed products principally through our own distribution and marketing
companies in the U.S. In the international markets, we distribute our filmed products both directly and through
independent distribution companies or joint ventures. Films released theatrically in the U.S. can be released
simultaneously in international territories or generally up to six months later.
The Company incurs significant marketing and advertising costs before and throughout the theatrical release of a
film in an effort to generate public awareness of the film, to increase the public’s intent to view the film and to help
generate consumer interest in the subsequent home entertainment and other ancillary markets. These costs are
expensed as incurred; therefore, we typically incur losses on a film in the theatrical markets, including in periods prior
to the theatrical release of the film.
Home Entertainment Market
In the domestic market, we distribute home entertainment releases directly under each of our motion picture
banners. In the international market, we distribute home entertainment releases under each of our motion picture
banners both directly and through independent foreign distribution companies. In addition, we acquire and produce
original content for direct-to-video release.
The domestic and international home entertainment window typically starts four to six months after the
theatrical release in each market with the issuance of a variety of physical and electronic versions of each title
(including DVD, Blu-ray and electronic formats). Most titles are sold simultaneously to both “rentailers,” such as
Blockbuster, and retailers, such as Wal-Mart and Best Buy.
As of October 3, 2009 under the banners Walt Disney Pictures, Pixar, Touchstone Pictures, Hollywood Pictures,
Miramax and Dimension, there were approximately 1,900 active produced and acquired titles, including 1,500 liveaction titles and 400 animated titles, in the domestic home entertainment marketplace and approximately 2,900 active
produced and acquired titles, including 2,400 live-action titles and 500 animated titles, in the international marketplace.
Television Market
Pay-Per-View (PPV)/Video-on-Demand (VOD): Generally about one to two months after the home entertainment
window begins, the studio’s television distributors, Disney-ABC Domestic Television and Disney-ABC-ESPN
Television International, license titles for use on a PPV/VOD basis in the cable and satellite markets, as well as for
internet, console games, and mobile platforms. PPV/VOD services deliver one-time rentals electronically to consumers
at a price comparable to that of physical media rentals.
Pay Television (Pay 1): There are generally two pay television windows. The first window is generally sixteen
months in duration and follows the PPV/VOD window. The Company has licensed exclusive domestic pay television
rights to substantially all films released under the Walt Disney Pictures, Pixar, Touchstone Pictures, Hollywood
Pictures, Miramax and Dimension banners to the Starz pay television service through fiscal 2013.
Free Television (Free 1): The Pay 1 window is followed by a television window with telecasts accessible to
consumers without charge. This free window may last up to 84 months. Motion pictures are usually sold in the Free 1
window on an ad-hoc basis to major networks, including the ABC Television Network, and basic cable services,
including ABC Family, Disney Channel, Disney XD, and SOAPnet.
14
Pay Television 2 (Pay 2) and Free Television 2 (Free 2): In the U.S., Free 1 is generally followed by a fourteen- month
Pay 2 window under our license arrangement with Starz, and finally by a Free 2 window. The Free 2 window is a
syndication window where films are licensed both to basic cable networks and to third-party television station groups.
Major packages of the Company’s feature films have been licensed for broadcast under multi-year agreements.
International Television: The Company also licenses its theatrical and television properties outside of the U.S. The
typical windowing sequence is broadly consistent with the domestic cycle such that titles premiere on television in
PPV/VOD then air in pay TV before airing in free TV. Windowing strategies are developed in response to local market
practices and conditions, and the exact sequence and length of each window can vary country by country.
Disney Music Group
The Disney Music Group includes Walt Disney Records, Hollywood Records (including the Mammoth Records
and Buena Vista Records labels), Lyric Street Records, Buena Vista Concerts and Disney Music Publishing.
Walt Disney Records produces and distributes compact discs and music DVDs in the United States and licenses
our music properties throughout the rest of the world. Music categories include infant, children’s read-along, teens,
all-family and soundtracks from film and television series distributed by Walt Disney Pictures and Disney Channel.
Hollywood Records develops, produces and markets recordings from talent across a spectrum of popular music.
Nashville-based Lyric Street Records develops, produces and markets recordings in the country music genre.
Each of the labels commissions new music for the Company’s motion picture and television programs, records
the songs and licenses the song copyrights to others for printed music, records, audio-visual devices, public
performances and digital distribution. Buena Vista Concerts produces live-entertainment events with artists signed to
the Disney Music Group record labels.
Disney Music Publishing controls the copyrights of thousands of musical compositions derived from the
Company’s motion picture, television, record and theme park properties, as well as musical compositions written by
songwriters under exclusive contract. It is responsible for the management, protection, and licensing of the Disney
song catalog on a worldwide basis, including licensing for printed music, records, audio-visual works and new media.
Disney Theatrical Group
The Disney Theatrical Group includes both Disney Theatrical Productions and Disney Live Family
Entertainment.
Disney Theatrical Productions develops, produces and licenses live entertainment events. The Company has
produced and licensed Broadway musicals around the world, including Beauty and the Beast, The Lion King, Elton
John & Tim Rice’s Aida, Mary Poppins (a co-production with Cameron Mackintosh Ltd), TARZAN®, the professional
touring stage version of High School Musical, and The Little Mermaid. In addition, the Company licenses musicals for
local school and community theatre productions.
Disney Live Family Entertainment delivers worldwide touring productions under the Disney On Ice and Disney
Live! brands under a license to Feld Entertainment. North American tours for Disney Live! Rockin’ Road Show and Disney
On Ice’s latest ice show, Celebrations!, were launched in August 2009 and September 2009, respectively.
Competition and Seasonality
The Studio Entertainment businesses compete with all forms of entertainment. A significant number of
companies produce and/or distribute theatrical and television films, exploit products in the home entertainment
market, provide pay television programming services and sponsor live theater. We also compete to obtain creative and
performing talents, story properties, advertiser support and broadcast rights that are essential to the success of our
Studio Entertainment businesses.
The success of Studio Entertainment operations is heavily dependent upon public taste and preferences. In
addition, Studio Entertainment operating results fluctuate due to the timing and performance of releases in the
theatrical, home entertainment and television markets. Release dates are determined by several factors, including
competition and the timing of vacation and holiday periods.
15
CONSUMER PRODUCTS
The Consumer Products segment engages with licensees, manufacturers, publishers and retailers throughout the
world to design, develop, publish, promote and sell a wide variety of products based on existing and new Disney
characters and other Company intellectual property through its Merchandise Licensing, Publishing and Retail
businesses. In addition to leveraging the Company’s film and television properties, Consumer Products also develops
new intellectual property with the potential of also being used in the Company’s other businesses.
Merchandise Licensing
The Company’s worldwide merchandise licensing operations include a diverse range of product categories, the
most significant of which are: toys, apparel, accessories, footwear, home furnishings, home décor, health, beauty, food,
stationery and consumer electronics. The Company licenses characters from its film, television and other properties
and earns royalties, which are usually based on a fixed percentage of the wholesale or retail selling price of the
products. Some of the major properties licensed by the Company include Mickey Mouse, Winnie the Pooh, Disney
Princess, Cars, Hannah Montana, and High School Musical. The Company also designs individual products and creates
exclusive themed and seasonal promotional campaigns for retailers based on characters, movies and TV shows.
Publishing
Disney Publishing Worldwide (DPW) publishes children’s books and magazines in multiple countries and
languages. DPW’s businesses include Disney Global Book Group, Global Children’s Magazines, Disney FamilyFun
Group, and Disney English. In fiscal 2009, the Disney Global Books Group published titles around the world in support
of such franchises as Disney Princess, Disney Fairies, Winnie the Pooh, Mickey Mouse Clubhouse, Handy Manny, High School
Musical, Cars and Hannah Montana, and of the films Bolt, UP, and G-Force. The Global Children’s Magazines business
launched new titles in over 30 languages to support Disney Channel hits, including High School Musical, Hannah
Montana, JONAS, and Camp Rock. The Disney FamilyFun Group includes the Disney FamilyFun and Disney en Familia
magazines, special publications and branded books, and custom media solutions. Disney English currently offers more
than 400 hours of classroom programming for young children at five Disney English centers in Shanghai.
Retail
The Company markets Disney-themed products directly through retail stores operated under the Disney Store
name and through internet sites in North America (as DisneyStore.com and DisneyOutlet.com) and the United
Kingdom (as DisneyStore.co.uk). The stores, which are generally located in leading shopping malls and other retail
complexes, carry a wide variety of Disney merchandise and promote other businesses of the Company. The Company
owns and operates 231 stores in North America and 109 stores in Europe. In Japan, the stores are operated by a
subsidiary of Oriental Land Co., Ltd. under a licensing arrangement.
Competition and Seasonality
The Company’s merchandise licensing, publishing and retail businesses compete with other licensors, publishers
and retailers of character, brand and celebrity names. Based on independent surveys, we believe the Company is the
largest worldwide licensor of character-based merchandise based on retail sales. Operating results for the licensing and
retail businesses are influenced by seasonal consumer purchasing behavior and by the timing and performance of
animated theatrical releases and cable programming broadcasts.
INTERACTIVE MEDIA
The Disney Interactive Media Group creates and delivers Disney-branded entertainment and lifestyle content
across interactive media platforms. The primary operating businesses of the Disney Interactive Media Group are
Disney Interactive Studios which produces video games for global distribution and Disney Online which produces
web sites and online virtual worlds in the United States and internationally. The Disney Interactive Media Group’s
internet operations derive revenue from a combination of advertising and sponsorships, subscription services and
e-commerce. The Disney Interactive Media Group also manages the Company’s Disney-branded mobile phone
initiative in Japan and provides technical infrastructure services to the Company’s non Disney-branded websites, such
16
as ABC.com and ESPN.com, and to its Disney-branded e-commerce websites, principally DisneyStore.com and Walt
Disney Parks and Resorts Online. The Disney Interactive Media Group is reimbursed for the cost of providing these
technical infrastructure services, and since these other websites are managed within the Company’s other segments,
the financial results of these websites are reported within the Company’s other segments rather than as part of the
Disney Interactive Media Group.
Disney Interactive Studios
Disney Interactive Studios creates, develops, markets and distributes multi-platform video games worldwide
based on the Company’s creative content, including Pirates of the Caribbean, High School Musical and The Chronicles of
Narnia and from properties developed by Disney Interactive Studios, such as Pure and Spectrobes. The division has been
increasing its investment in internally developed and published games through the acquisition of studios and
increased product development spending. Disney Interactive Studios also licenses properties for games, such as Cars,
Finding Nemo and Ratatouille to third-party publishers. The Company has a licensing agreement with THQ, Inc. that
includes one upcoming Pixar title.
Disney Online
Disney Online develops, publishes and distributes content for Disney-branded online services intended for
family entertainment. Disney Online produces Disney.com, DisneyFamily.com, which is an online lifestyle destination
for moms, and a portfolio of virtual worlds, including Club Penguin, Disney’s Toontown and Disney’s Pirates of the
Caribbean Online. Disney.com integrates many of the Company’s Disney-branded internet sites including sites for the
Disney Channel, Disney Parks and Resorts, Walt Disney Pictures and Disney Consumer Products.
Competition and Seasonality
The Company’s internet sites and products compete with other internet sites and products. The Company’s
video game business competes primarily with other publishers of video game software and other types of home
entertainment. Operating results for the video game business fluctuate due to the timing and performance of video
game releases which are determined by several factors, including theatrical releases and cable programming
broadcasts, competition and the timing of holiday periods. Revenues from our internet and mobile operations are
generally not subject to significant seasonal trends.
INTELLECTUAL PROPERTY PROTECTION
The Company’s businesses throughout the world are affected by its ability to exploit and protect against
infringement of its intellectual property, including trademarks, trade names, copyrights, patents and trade secrets.
Important intellectual property includes rights in the content of motion pictures, television programs, electronic games,
sound recordings, character likenesses, theme park attractions, books and magazines. Risks related to the protection
and exploitation of intellectual property rights are set forth in Item 1A – Risk Factors.
AVAILABLE INFORMATION
Our annual report on Form 10-K, quarterly reports on Form 10-Q, current reports on Form 8-K and amendments
to those reports are available without charge on our website, www.disney.com/investors, as soon as reasonably
practicable after they are filed electronically with the SEC. We are providing the address to our internet site solely for
the information of investors. We do not intend the address to be an active link or to otherwise incorporate the contents
of the website into this report.
17
ITEM 1A. Risk Factors
For an enterprise as large and complex as the Company, a wide range of factors could materially affect future
developments and performance. In addition to the factors affecting specific business operations identified in
connection with the description of these operations and the financial results of these operations elsewhere in this
report, the most significant factors affecting our operations include the following:
Recent changes in U.S., global, or regional economic conditions could have a continuing adverse effect on the
profitability of some or all of our businesses.
The recent decline in economic activity in the United States and other regions of the world in which we do
business has affected demand for some of our products and services, and continuation of this condition could
adversely affect demand for any of our businesses, thus reducing our revenue and earnings. The decline in economic
conditions has reduced and could continue to reduce spending at our parks and resorts, purchase of or prices for
advertising on our broadcast or cable networks or owned stations, performance of our home entertainment releases,
and purchases of Company-branded consumer products. A continuing decline in economic conditions could also
reduce attendance at our parks and resorts or prices that MVSPs pay for our cable programming. Economic conditions
have also and could continue to impair the ability of those with whom we do business to satisfy their obligations to us.
In addition, an increase in price levels generally, or in price levels in a particular sector such as the energy sector, could
result in a shift in consumer demand away from the entertainment and consumer products we offer, which could also
adversely affect our revenues and, at the same time, increase our costs. Changes in exchange rates for foreign
currencies may reduce international demand for our products, increase our labor or supply costs in non-United States
markets, or reduce the United States dollar value of revenue we receive from other markets.
Changes in public and consumer tastes and preferences for entertainment and consumer products could reduce
demand for our entertainment offerings and products and adversely affect the profitability of any of our
businesses.
Each of our businesses creates entertainment or consumer products whose success depends substantially on
consumer tastes and preferences that change in often unpredictable ways. The success of our businesses depends on
our ability to consistently create and distribute filmed entertainment, broadcast and cable programming, online
material, electronic games, theme park attractions, hotels and other resort facilities and consumer products that meet
the changing preferences of the broad consumer market. Many of our businesses increasingly depend on worldwide
acceptance of our offerings and products outside the United States, and their success therefore depends on our ability
to successfully predict and adapt to changing consumer tastes and preferences outside as well as inside the United
States. Moreover, we must often invest substantial amounts in film production, broadcast and cable programming,
electronic games, theme park attractions, or hotels and other resort facilities before we learn the extent to which these
products will earn consumer acceptance. If our entertainment offerings and products do not achieve sufficient
consumer acceptance, our revenue from advertising sales (which are based in part on ratings for the programs in which
advertisements air) or subscription fees for broadcast and cable programming and online services, from theatrical film
receipts or home video or electronic game sales, from theme park admissions, hotel room charges and merchandise,
food and beverage sales, from sales of licensed consumer products or from sales of our other consumer products and
services may decline and adversely affect the profitability of one or more of our businesses.
Changes in technology and in consumer consumption patterns may affect demand for our entertainment products
or the cost of producing or distributing products.
The media entertainment and internet businesses in which we participate depend significantly on our ability to
acquire, develop, adopt and exploit new technologies to distinguish our products and services from those of our
competitors. In addition, new technologies affect the demand for our products, the time and manner in which
consumers acquire and view some of our entertainment products and the options available to advertisers for reaching
their desired markets. For example:
• the success of our offerings in the home entertainment market depends in part on consumer preferences with
respect to home entertainment formats, including DVD players and personal video recorders, as well as the
availability of alternative home entertainment offerings and technologies, including web-based delivery of
entertainment offerings;
18
• technological developments offer consumers an expanding array of entertainment options and if consumers
favor options we have not yet fully developed rather than the entertainment products we offer, our sales may
be adversely affected.
The success of our businesses is highly dependent on the existence and maintenance of intellectual property rights
in the entertainment products and services we create.
The value to us of our intellectual property rights is dependent on the scope and duration of our rights as
defined by applicable laws in the United States and abroad and the manner in which those laws are construed. If those
laws are drafted or interpreted in ways that limit the extent or duration of our rights, or if existing laws are changed,
our ability to generate revenue from our intellectual property may decrease, or the cost of obtaining and maintaining
rights may increase.
The unauthorized use of our intellectual property rights may increase the cost of protecting these rights or
reduce our revenues. New technologies such as the convergence of computing, communication, and entertainment
devices, the falling prices of devices incorporating such technologies, and increased broadband internet speed and
penetration have made the unauthorized digital copying and distribution of our films, television productions and other
creative works easier and faster and enforcement of intellectual property rights more challenging. There is evidence
that unauthorized use of intellectual property rights in the entertainment industry generally is a significant and rapidly
growing phenomenon. Inadequate laws or weak enforcement mechanisms to protect intellectual property in one
country can adversely affect the results of the Company’s operations worldwide, despite the Company’s efforts to
protect its intellectual property rights. These developments require us to devote substantial resources to protecting our
intellectual property against unlicensed use and present the risk of increased losses of revenue as a result of unlicensed
digital distribution of our content and sales of unauthorized DVDs, Blu-ray discs and other products.
With respect to intellectual property developed by the Company and rights acquired by the Company from
others, the Company is subject to the risk of challenges to our rights in intellectual property by third parties. Successful
challenges to our rights in intellectual property may result in increased costs for obtaining rights or the loss of the
opportunity to earn revenue from the intellectual property that is the subject of challenged rights. The Company is not
aware of any challenges to its intellectual property rights that it currently foresees having a material effect on its
operations.
A variety of uncontrollable events may reduce demand for our products and services, impair our ability to provide
our products and services or increase the cost of providing our products and services.
Demand for our products and services, particularly our theme parks and resorts, is highly dependent on the
general environment for travel and tourism. The environment for travel and tourism, as well as demand for other
entertainment products, can be significantly adversely affected in the United States, globally or in specific regions as a
result of a variety of factors beyond our control, including: adverse weather conditions or natural disasters (such as
excessive heat or rain, hurricanes and earthquakes); health concerns; international, political or military developments;
and terrorist attacks. These events and others, such as fluctuations in travel and energy costs and computer virus
attacks or other widespread computing or telecommunications failures, may also damage our ability to provide our
products and services or to obtain insurance coverage with respect to these events. In addition, we derive royalties
from the sales of our licensed goods and services by third parties and the management of businesses operated under
brands licensed from the Company, and we are therefore dependent on the successes of those third parties for that
portion of our revenue. A wide variety of factors could influence the success of those third parties and if negative
factors significantly impacted a sufficient number of our licensees they could adversely affect the profitability of one or
more of our businesses. We obtain insurance against the risk of losses relating to some but not all of these events, and
when insurance is obtained it is subject to deductibles, exclusions and caps. The types and levels of coverage we obtain
vary from time to time depending on our view of the likelihood of specific types and levels of loss in relation to the cost
of obtaining coverage for such types and levels of loss.
Changes in our business strategy or restructuring of our businesses may increase our costs or otherwise affect the
profitability of our businesses.
As changes in our business environment occur we may need to adjust our business strategies to meet these
changes or we may otherwise find it necessary to restructure our operations or particular businesses or assets. In
19
addition, external events including acceptance of our theatrical offerings and changes in macro-economic conditions
may impair the value of our assets. When these changes or events occur, we may incur costs to change our business
strategy and may need to write down the value of assets. We may also need to invest in new businesses that have
short-term returns that are negative or low and whose ultimate business prospects are uncertain. In any of these
events, our costs may increase, we may have significant charges associated with the write-down of assets or returns on
new investments may be lower than prior to the change in strategy or restructuring.
Turmoil in the financial markets could increase our cost of borrowing and impede access to or increase the cost of
financing our operations and investments.
U.S. and global credit and equity markets experienced significant disruption beginning in late 2008, making it
difficult for many businesses to obtain financing on acceptable terms. In addition, equity markets experienced rapid
and wide fluctuations in value. These conditions tended to increase the cost of borrowing and if they recur, our cost of
borrowing could increase and it may be more difficult to obtain financing for our operations or investments. In
addition, our borrowing costs can be affected by short and long-term debt ratings assigned by independent rating
agencies which are based, in significant part, on the Company’s performance as measured by credit metrics such as
interest coverage and leverage ratios. A decrease in these ratings would likely increase our cost of borrowing and/or
make it more difficult for us to obtain financing. The disruption in the global financial markets also impacted some of
the financial institutions with which we do business. A similar decline in the financial stability of financial institutions
could affect our ability to secure credit-worthy counterparties for our interest rate and foreign currency hedging
programs and could affect our ability to settle existing contracts.
Increased competitive pressures may reduce our revenues or increase our costs.
We face substantial competition in each of our businesses from alternative providers of the products and services
we offer and from other forms of entertainment, lodging, tourism and recreational activities. We also must compete to
obtain human resources, programming and other resources we require in operating our business. For example:
• Our broadcast and cable networks, stations and online offerings compete for viewers with other broadcast,
cable and satellite services as well as with home video products and internet usage.
• Our broadcast and cable networks and stations compete for the sale of advertising time with other broadcast,
cable and satellite services, and the internet, as well as with newspapers, magazines and billboards.
• Our cable networks compete for carriage of their programming with other programming providers.
• Our broadcast and cable networks compete for the acquisition of creative talent and sports and other
programming with other broadcast and cable networks.
• Our theme parks and resorts compete for guests with all other forms of entertainment, lodging, tourism and
recreation activities.
• Our studio operations compete for customers with all other forms of entertainment.
• Our studio operations, broadcast and cable networks and publishing businesses compete to obtain creative
and performing talent, story properties, advertiser support, broadcast rights and market share.
• Our consumer products segment competes in the character merchandising and other licensing, publishing,
and retail activities with other licensors, publishers and retailers of character, brand and celebrity names.
• Our interactive media video game operations compete primarily with other publishers of video game
software and other types of home entertainment.
Competition in each of these areas may divert consumers from our creative or other products, or to other
products or other forms of entertainment, which could reduce our revenue or increase our marketing costs.
Competition for the acquisition of resources can increase the cost of producing our products and services.
20
Sustained increases in costs of pension and postretirement medical and other employee health and welfare benefits
may reduce our profitability.
With approximately 144,000 employees, our profitability is substantially affected by costs of pension benefits and
current and postretirement medical benefits. We may experience significant increases in these costs as a result of
macro-economic factors, which are beyond our control, including increases in the cost of health care. In addition,
changes in investment returns and discount rates used to calculate pension expense and related assets and liabilities
can be volatile and may have an unfavorable impact on our costs in some years. These macro-economic factors as well
as the decline in the fair value of pension plan assets may put upward pressure on the cost of providing pension and
medical benefits and may increase future funding contributions. Although we have actively sought to control increases
in these costs, there can be no assurance that we will succeed in limiting cost increases, and continued upward pressure
could reduce the profitability of our businesses.
Our results may be adversely affected if long-term programming or carriage contracts are not renewed on
sufficiently favorable terms.
We enter into long-term contracts for both the acquisition and the distribution of media programming and
products, including contracts for the acquisition of programming rights for sporting events and other programs, and
contracts for the distribution of our programming to MVSPs. As these contracts expire, we must renew or renegotiate
the contracts, and if we are unable to renew them on acceptable terms, we may lose programming rights or distribution
rights. Even if these contracts are renewed, the cost of obtaining programming rights may increase (or increase at faster
rates than our historical experience) or the revenue from distribution of programs may be reduced (or increase at
slower rates than our historical experience). With respect to the acquisition of programming rights, particularly sports
programming rights, the impact of these long-term contracts on our results over the term of the contracts depends on a
number of factors, including the strength of advertising markets, effectiveness of marketing efforts and the size of
viewer audiences. There can be no assurance that revenues from programming based on these rights will exceed the
cost of the rights plus the other costs of producing and distributing the programming.
Changes in regulations applicable to our businesses may impair the profitability of our businesses.
Our broadcast networks and television stations are highly regulated, and each of our other businesses is subject
to a variety of United States and overseas regulations. These regulations include:
• United States FCC regulation of our television and radio networks, our national programming networks, and
our owned television stations. See Item 1 – Business – Media Networks, Federal Regulation.
• Environmental protection regulations.
• Federal, state and foreign privacy and data protection laws and regulations.
• Regulation of the safety of consumer products and theme park operations.
• Imposition by foreign countries of trade restrictions or motion picture or television content requirements or
quotas.
• Domestic and international tax laws or currency controls.
Changes in any of these regulatory areas may require us to spend additional amounts to comply with the
regulations, or may restrict our ability to offer products and services that are profitable.
Labor disputes may disrupt our operations and adversely affect the profitability of any of our businesses.
A significant number of employees in various of our businesses are covered by collective bargaining agreements,
including employees of our theme parks and resorts as well as writers, directors, actors, production personnel and
others employed in our media networks and studio operations. In addition, the employees of licensees who
manufacture and retailers who sell our consumer products may be covered by labor agreements with their employers.
In general, a labor dispute involving our employees or the employees of our licensees or retailers who sell our
consumer products may disrupt our operations and reduce our revenues, and resolution of disputes may increase our
costs.
21
Provisions in our corporate documents and Delaware state law could delay or prevent a change of control, even if
that change would be beneficial to shareholders.
Our Restated Certificate of Incorporation contains a provision regulating the ability of shareholders to bring
matters for action before annual and special meetings and authorizes our Board of Directors to issue and set the terms
of preferred stock. The regulations on shareholder action could make it more difficult for any person seeking to acquire
control of the Company to obtain shareholder approval of actions that would support this effort. The issuance of
preferred stock could effectively dilute the interests of any person seeking control or otherwise make it more difficult
to obtain control. In addition, provisions in our Restated Certificate of Incorporation require supermajority shareholder
approval of some acquisition transactions and we are subject to the anti-takeover provisions of the Delaware General
Corporation Law, either of which could have the effect of delaying or preventing a change of control in some
circumstances.
The seasonality of certain of our businesses could exacerbate negative impacts on our operations.
Each of our businesses is normally subject to seasonal variations, as follows:
• Revenues in our Media Networks segment are subject to seasonal advertising patterns and changes in
viewership levels. In general, advertising revenues are somewhat higher during the fall and somewhat lower
during the summer months. Affiliate revenues are typically collected ratably throughout the year. Certain
affiliate revenues at ESPN are deferred until annual programming commitments are met, and these
commitments are typically satisfied during the second half of the Company’s fiscal year, which generally
results in higher revenue recognition during this period.
• Revenues in our Parks and Resorts segment fluctuate with changes in theme park attendance and resort
occupancy resulting from the seasonal nature of vacation travel and local entertainment excursions. Peak
attendance and resort occupancy generally occur during the summer months when school vacations occur
and during early-winter and spring-holiday periods.
• Revenues in our Studio Entertainment segment fluctuate due to the timing and performance of releases in the
theatrical, home entertainment, and television markets. Release dates are determined by several factors,
including competition and the timing of vacation and holiday periods.
• Revenues in our Consumer Products segment are influenced by seasonal consumer purchasing behavior and
by the timing and performance of theatrical releases and cable programming broadcasts.
• Revenues in our Interactive Media segment fluctuate due to the timing and performance of video game
releases which are determined by several factors, including theatrical releases and cable programming
broadcasts, competition and the timing of holiday periods. Revenues from certain of our internet and mobile
operations are subject to similar seasonal trends.
Accordingly, if a short term negative impact on our business occurs during a time of high seasonal demand (such
as hurricane damage to our parks during the summer travel season), the effect could have a disproportionate effect on
the results of that business for the year.
The Company’s acquisition of Marvel is expected to cause short term dilution in earnings per share and there can
be no assurance that anticipated improvements in earnings per share will be realized.
On August 31, 2009, the Company entered into an agreement to acquire Marvel Entertainment, Inc. in a merger
transaction. Based on the number of fully diluted shares of Marvel common stock outstanding as of September 18,
2009, the Company expects (assuming there is no adjustment to the exchange ratio) that the number of issued and
outstanding shares will increase by approximately 58.5 million shares as a result of the merger. We expect that the
merger will initially result in lower earnings per share than we would have earned in the absence of the merger. We
expect that over time the merger will yield benefits to the combined company such that the merger will ultimately be
accretive to earnings per share. However, there can be no assurance that the increase in earnings per share expected in
the long term will be achieved. In order to achieve increases in earnings per share as a result of the merger, the
combined company will, among other things, need to effectively continue the successful operations of Marvel after the
22
merger, develop successful new content (including future feature films and television series or sequels to Marvel
productions) based on Marvel characters and successfully integrate Marvel products into the combined company’s
various distribution channels.
ITEM 1B. Unresolved Staff Comments
The Company has received no written comments regarding its periodic or current reports from the staff of the
Securities and Exchange Commission that were issued 180 days or more preceding the end of its 2009 fiscal year and
that remain unresolved.
ITEM 2. Properties
The Walt Disney World Resort, Disneyland Resort and other properties of the Company and its subsidiaries are
described in Item 1 under the caption Parks and Resorts. Film library properties are described in Item 1 under the
caption Studio Entertainment. Radio and television stations owned by the Company are described under the caption
Media Networks.
23
The Company and its subsidiaries own and lease properties throughout the world. In addition to the properties
noted above, the table below provides a brief description of other significant properties and the related business
segment.
Location
Property /
Approximate Size
Use
Business Segment (1)
Burbank, CA
Land (52 acres) &
Buildings (2,000,000 ft2)
Owned Office/Production/
Warehouse
Corp/Studio/Media/CP
Burbank, CA &
surrounding cities (2)
Buildings (1,800,000 ft2)
Leased Office/Warehouse
(includes 12,000 ft2 sublet to
third party tenants)
Corp/Studio/Media/CP/
IMG
Glendale, CA & North
Hollywood, CA
Land (154 acres) &
Buildings (2,500,000 ft2)
Owned Office/Warehouse
(includes 650,000 ft2 sublet
to third party tenants)
Corp/Studio/Media/CP/
TP&R/IMG
Glendale, CA
Buildings (160,000 ft2)
Leased Office/Warehouse
Corp
Los Angeles, CA
Land (22 acres) &
Buildings (600,000 ft2)
Owned Office/Production/
Technical
Media
Los Angeles, CA
Buildings (180,000 ft2)
Leased Office/Production/
Technical
Media/Studio/IMG
New York, NY
Land (6.5 acres) &
Buildings (1,400,000 ft2)
Owned Office/Production/
Technical (includes
15,000 ft2 sublet to third
party tenants)
Media
New York, NY
Buildings (660,000 ft2)
Leased Office/Production/
Warehouse (includes
10,000 ft2 sublet to third
party tenants)
Studio/Media/IMG
Bristol, CT
Land (115 acres) &
Buildings (720,000 ft2)
Owned Office/Production/
Technical
Media
Bristol, CT
Buildings (440,000 ft2)
Leased Office/Warehouse/
Technical
Media
Emeryville, CA
Land (21 acres) &
Buildings (270,000ft2)
Owned Office/Production/
Technical (includes
20,000 ft2 sublet to third
party tenants)
Studio
Emeryville, CA
Buildings (125,000 ft2)
Leased Office/Storage
Studio
USA & Canada
Land and Buildings
(Multiple sites and sizes)
Owned and Leased Office/
Production/Transmitter/
Retail/ Warehouse
Corp/Studio/Media/CP/
TP&R/IMG
Hammersmith, England
Land (1 acre) &
Building (85,000 ft2)
Owned Office
Corp/Studio/Media/CP/
IMG
Hammersmith, England
Building (225,000 ft2)
Leased Office (includes
25,000 ft2 sublet to third
party tenants)
Corp/Studio/Media/CP/
IMG
Europe, Asia,
Australia & Latin
America
Buildings (Multiple sites
and sizes)
Leased Office/Retail/
Warehouse
Corp/Studio/Media/CP/
IMG
(1)
Corp – Corporate, CP – Consumer Products, TP&R – Theme Parks and Resorts and IMG – Interactive Media
Group
(2)
Surrounding cities include North Hollywood, CA and Sun Valley, CA
24
ITEM 3. Legal Proceedings
Milne and Disney Enterprises, Inc. v. Stephen Slesinger, Inc. On November 5, 2002, Clare Milne, the granddaughter
of A. A. Milne, author of the Winnie the Pooh books, and the Company’s subsidiary Disney Enterprises, Inc. (DEI) filed
a complaint against Stephen Slesinger, Inc. (SSI) in the United States District Court for the Central District of California.
On November 4, 2002, Ms. Milne served notices to SSI and DEI terminating A. A. Milne’s prior grant of rights to
Winnie the Pooh, effective November 5, 2004, and granted all of those rights to DEI. In their lawsuit, Ms. Milne and
DEI sought a declaratory judgment, under United States copyright law, that Ms. Milne’s termination notices were
valid; that SSI’s rights to Winnie the Pooh in the United States terminated effective November 5, 2004; that upon
termination of SSI’s rights in the United States, the 1983 licensing agreement that is the subject of the Stephen Slesinger,
Inc. v. The Walt Disney Company lawsuit (the “state court action”) terminated by operation of law; and that, as of
November 5, 2004, SSI was entitled to no further royalties for uses of Winnie the Pooh. SSI filed (a) an answer denying
the material allegations of the complaint and (b) counterclaims seeking a declaration that (i) Ms. Milne’s grant of rights
to DEI is void and unenforceable and (ii) DEI remains obligated to pay SSI royalties under the 1983 licensing
agreement. The District Court ruled that Milne’s termination notices were invalid. The Court of Appeals for the Ninth
Circuit affirmed, and on June 26, 2006, the United States Supreme Court denied Milne’s petition for a writ of certiorari.
On August 1, 2003, SSI filed an amended answer and counterclaims and a third-party complaint against Harriet Hunt
(heir to E. H. Shepard, illustrator of the original Winnie the Pooh stories), who had served a notice of termination and a
grant of rights similar to Ms. Milne’s, and asserted counterclaims against the Company allegedly arising from the
Milne and Hunt terminations and the grant of rights to DEI for (a) unlawful and unfair business practices; and
(b) breach of the 1983 licensing agreement.
On October 19, 2006, the parties stipulated to SSI’s filing its Fourth Amended Answer and Counterclaims (Fourth
Amended Answer) seeking (a) to invalidate the Hunt termination notice, (b) to terminate the Company’s rights
vis-à-vis SSI, and (c) damages in excess of two billion dollars, among other relief. That stipulation also provided that
Hunt and the Company need not respond to the Fourth Amended Answer until the conclusion of two events: the state
court appeal in Stephen Slesinger, Inc. v. The Walt Disney Company, and the trial in the District Court on the validity of
the Hunt termination notice. SSI then sought to withdraw both the Fourth Amended Answer and its stipulation, but on
November 3, 2006, the District Court denied that request. SSI’s motion for summary judgment on the validity of Hunt’s
2002 attempt to recapture E. H. Shepard’s rights was granted on February 15, 2007, and thereafter, on March 27, 2007,
the District Court dismissed as moot all claims against Hunt and three of SSI’s counterclaims against the Company
related to the Company’s agreements with Milne and Hunt concerning the termination and disposition of their rights.
On January 3, 2008, the California Supreme Court denied SSI’s petition for review in the state court action, whereupon
on April 21, 2008, the Company moved for summary judgment on all of SSI’s claims in the District Court action. On
June 3, 2008, the District Court ordered further briefing on the issue of whether SSI’s misconduct in the state court
action warrants dismissal of all of its claims in the District Court, and then on July 29, 2008, the District Court referred
the summary judgment motion to a Special Master, who rendered a sealed recommendation on March 26, 2009. On
May 19, 2009, the District Court granted the Company’s motion for summary judgment and dismissed without
prejudice SSI’s four contract and fraud counterclaims and invited the parties to file summary judgment motions on the
remaining infringement and unfair competition claims. On September 25, 2009, the District Court granted the
Company’s motion for summary judgment on SSI’s remaining claims and on October 21, 2009, SSI and the Company
filed applications for attorneys’ fees. On November 5, 2009, SSI appealed from the District Court’s judgment to the
Court of Appeals for the Ninth Circuit.
Relatedly, on December 4, 2006, August 22, 2007, February 8, April 18, August 27 and October 31, 2008, and
February 17, July 27, and November 17, 2009, SSI initiated proceedings in the United States Patent and Trademark
Office (PTO) seeking cancellation of certain Winnie the Pooh trademark registrations and opposing applications for
other Winnie the Pooh trademarks. Prior to July 27, the PTO had already suspended the then-pending proceedings on
the grounds that the relief sought is effectively duplicative of that sought in the Fourth Amended Answer. On
October 8, 2009, the Company advised the PTO of the District Court’s grant of summary judgment against SSI, and
requested dismissal of all of SSI’s pending proceedings. Also, on April 18, October 16 and October 27, 2008 and July 28,
2009, SSI initiated actions before the Canadian Intellectual Property Office (“CIPO”) opposing applications for certain
Winnie the Pooh trademarks. On August 4, 2009, SSI requested an extension of time to oppose another application by
the Company for a Winnie the Pooh trademark. On September 4, 2008, and February 12 and March 10, 2009, the
Company filed answers to the actions before the CIPO, denying SSI’s claims.
25
The Company, together with, in some instances, certain of its directors and officers, is a defendant or
codefendant in various other legal actions involving copyright, breach of contract and various other claims incident to
the conduct of its businesses. Management does not expect the Company to suffer any material liability by reason of
such actions.
ITEM 4. Submission of Matters to a Vote of Security Holders
No matters were submitted to a vote of shareholders during the fourth quarter of the fiscal year covered by this
report.
Executive Officers of the Company
The executive officers of the Company are elected each year at the organizational meeting of the Board of
Directors, which follows the annual meeting of the shareholders, and at other Board of Directors meetings, as
appropriate. Each of the executive officers has been employed by the Company in the position or positions indicated in
the list and pertinent notes below. Except as noted, each of the executive officers has been employed by the Company
for more than five years.
At October 3, 2009, the executive officers of the Company were as follows:
Name
Age
Title
Executive
Officer Since
Robert A. Iger
58
President and Chief Executive Officer (1)
2000
Thomas O. Staggs
48
Senior Executive Vice President and Chief
Financial Officer
1998
Alan N. Braverman
61
Senior Executive Vice President, General
Counsel and Secretary
2003
Kevin A. Mayer
47
Executive Vice President, Corporate Strategy,
Business Development and Technology (2)
2005
Christine M. McCarthy
54
Executive Vice President, Corporate Finance
and Real Estate and Treasurer (3)
2005
Mary Jayne Parker
48
Executive Vice President and Chief Human
Resources Officer (4)
2009
(1)
Mr. Iger was appointed President and Chief Executive Officer effective October 2, 2005. He was President and
Chief Operating Officer from January 2000.
(2)
Mr. Mayer was named Executive Vice President, Corporate Strategy, Business Development, and Technology of
the Company in June 2005 and was designated an executive officer in October 2005. He previously was Partner
and Head of the Global Media and Entertainment Practice of L.E.K. Consulting LLC, a consulting firm, from
February 2002.
(3)
Ms. McCarthy was named Executive Vice President, Corporate Finance and Real Estate in June 2005 and has been
Treasurer since January 2000. Prior to her appointment as Executive Vice President, Corporate Finance and Real
Estate, Ms. McCarthy was Senior Vice President and Treasurer from January 2000 to June 2005.
(4)
Ms. Parker was named Executive Vice President – Human Resources and Chief Human Resources Officer of the
Company, effective September 1, 2009, and designated an executive officer of the Company October 2, 2009.
Ms. Parker was previously Senior Vice President of Human Resources for Walt Disney Parks and Resorts from
October 2005 to July 2007 and Vice President Human Resources Administration for Walt Disney Parks and Resorts
from March 2003 to October 2005.
On November 12, 2009, the Company announced that Mr. Staggs would become Chairman, Walt Disney Parks
and Resorts Worldwide, effective January 1, 2010, and that James A. Rasulo, currently Chairman, Walt Disney Parks
and Resorts Worldwide, will become Senior Executive Vice President and Chief Financial Officer of the Company.
Mr. Rasulo, 53, has held his current position since 2005, and before that was President, Walt Disney Parks and Resorts,
since 2002.
26
PART II
ITEM 5. Market for the Company’s Common Equity, Related Stockholder Matters and Issuer Purchases of Equity
Securities
The Company’s common stock is listed on the New York Stock Exchange under the ticker symbol “DIS”. The
following table shows, for the periods indicated, the high and low sales prices per share of common stock as reported
in the Bloomberg Financial markets services.
Sales Price
High
2009
4th Quarter
3rd Quarter
2nd Quarter
1st Quarter
2008
4th Quarter
3rd Quarter
2nd Quarter
1st Quarter
Low
$
28.68
26.29
24.83
32.95
$
22.05
17.54
15.14
18.60
$
34.85
35.02
33.23
35.69
$
28.55
29.57
26.30
30.68
The Company declared a $648 million dividend ($0.35 per share) on December 3, 2008 related to fiscal 2008,
which was paid in the second quarter of fiscal 2009. The Board of Directors has not declared a dividend related to fiscal
2009 as of the date of this report.
As of October 3, 2009, the approximate number of common shareholders of record was 1,009,288.
The following table provides information about Company purchases of equity securities that are registered by
the Company pursuant to Section 12 of the Exchange Act during the quarter ended October 3, 2009:
Period
Total Number
of Shares
Purchased (1)
June 28, 2009 – July 31, 2009
August 1, 2009 – August 31, 2009
September 1, 2009 – October 3, 2009
156,772
118,524
1,443,928
Total
1,719,224
Average Price
Paid
per Share
$
Total Number of
Shares
Purchased as
Part of Publicly
Announced
Plans or
Programs
Maximum
Number of
Shares that
May Yet Be
Purchased
Under the
Plans or
Programs (2)
24.28
26.27
26.08
—
—
1,310,900
180 million
180 million
179 million
25.93
1,310,900
179 million
(1)
408,324 shares were purchased on the open market to provide shares to participants in the Walt Disney Investment
Plan and Employee Stock Purchase Plan. These purchases were not made pursuant to a publicly announced
repurchase plan or program.
(2)
Under a share repurchase program implemented effective June 10, 1998, the Company is authorized to repurchase
shares of its common stock. On May 1, 2007, following share repurchases made through May 1, 2007, the
Company’s Board of Directors increased the repurchase authorization to a total of 400 million shares as of that
date. The repurchase program does not have an expiration date.
27
ITEM 6. Selected Financial Data
(in millions, except per share data)
Statements of income
Revenues
Income from continuing operations
before the cumulative effect of
accounting changes
Per common share
Earnings from continuing
operations before the
cumulative effect of
accounting changes
Diluted
Basic
Dividends
Balance sheets
Total assets
Long-term obligations
Shareholders’ equity
Statements of cash flows
Cash provided (used) by:
Continuing operating activities
Continuing investing activities
Continuing financing activities
2008 (2)
2009 (1)
$
36,149
$
37,843
2007 (3)(4)
$
4,427
3,307
35,510
2006 (3)(5)
$
4,674
33,747
2005 (3)(6)
$
3,304
31,374
2,460
$
1.76
1.78
0.35
$
2.28
2.34
0.35
$
2.24
2.33
0.31
$
1.60
1.65
0.27
$
1.19
1.21
0.24
$
63,117
16,939
33,734
$
62,497
14,889
32,323
$
60,928
14,916
30,753
$
59,998
13,974
31,820
$
53,158
14,102
26,210
$
5,064
(2,096)
(2,552)
$
5,446
(2,162)
(3,953)
5,398
(618)
(3,619)
$
5,960
(220)
(5,166)
$
4,139
(1,682)
(2,899)
$
(1)
The fiscal 2009 results include restructuring and impairment charges ($0.17 per diluted share), a non-cash gain in
connection with the merger of Lifetime and AETN ($0.08 per diluted share) and a gain on the sale of our investment in
two pay television services in Latin America ($0.04 per diluted share). Including the impact of rounding, these items
collectively resulted in a net adverse impact of $0.06 per diluted share.
(2)
The fiscal 2008 results include an accounting gain related to the acquisition of the Disney Stores North America and a
gain on the sale of movies.com (together $0.01 per diluted share), the favorable resolution of certain income tax matters
($0.03 per diluted share), a bad debt charge for a receivable from Lehman Brothers ($0.03 per diluted share) and an
impairment charge ($0.01 per diluted share). These items collectively had no net impact on earnings per share.
(3)
During fiscal 2007, the Company concluded the spin-off of the ABC Radio business and thus reports ABC Radio as
discontinued operations for all periods presented (see Note 5 to the Consolidated Financial Statements for further
discussion).
(4)
The fiscal 2007 results include gains from the sales of E! Entertainment and Us Weekly (together $0.31 per diluted share),
the favorable resolution of certain income tax matters ($0.03 per diluted share), an equity-based compensation plan
modification charge ($0.01 per diluted share) and an impairment charge ($0.01 per diluted share). These items
collectively resulted in a net benefit of $0.32 per diluted share.
(5)
During fiscal 2006, the Company completed an all stock acquisition of Pixar for $7.5 billion. In addition, results include
gains on sales of a Spanish cable equity investment and Discover Magazine (together $0.02 per diluted share), the
favorable resolution of certain income tax matters ($0.02 per diluted share), a net benefit associated with the completion
of the Pixar acquisition ($0.01 per diluted share) and an impairment charge ($0.01 per diluted share). These items
collectively resulted in a net benefit of $0.04 per diluted share.
(6)
The fiscal 2005 results include the favorable resolution of certain income tax matters ($0.06 per diluted share), a benefit
from the restructuring of Euro Disney’s borrowings ($0.02 per diluted share), an income tax benefit from the repatriation
of foreign earnings under the American Jobs Creation Act ($0.02 per diluted share), a gain on the sale of the Mighty
Ducks of Anaheim ($0.01 per diluted share), a write-off of investments in leveraged leases ($0.03 per diluted share), a
write-down related to the MovieBeam venture ($0.02 per diluted share), an impairment charge for a cable television
investment in Latin America ($0.01 per diluted share) and restructuring and impairment charges related to the sale of
The Disney Stores North America ($0.01 per diluted share). These items collectively resulted in a net benefit of $0.04 per
diluted share.
28
ITEM 7. Management’s Discussion and Analysis of Financial Condition and Results of Operations
CONSOLIDATED RESULTS
(in millions, except per share data)
% Change
Better/(Worse)
2008
2009
Revenues
Costs and expenses
Restructuring and impairment charges
Other income (expense)
Net interest expense
Equity in the income of investees
$
36,149
(30,452)
(492)
342
(466)
577
$
2007
37,843
(30,400)
(39)
(59)
(524)
581
$
2009
vs.
2008
35,510
(28,655)
(26)
1,004
(593)
485
(4)
—
nm
nm
11
(1)
2008
vs.
2007
%
%
7
(6)
(50)
nm
12
20
%
%
%
%
%
%
%
Income from continuing operations
before income taxes and minority
interests
Income taxes
Minority interests
5,658
(2,049)
(302)
7,402
(2,673)
(302)
7,725
(2,874)
(177)
(24)
23
—
%
%
%
(4)
7
(71)
%
%
%
Income from continuing operations
Discontinued operations, net of tax
3,307
—
4,427
—
4,674
13
(25)
nm
%
(5)
nm
%
Net income
$
3,307
$
4,427
$
4,687
(25)
%
(6)
%
Diluted Earnings per share (1):
Earnings per share, continuing
operations
Earnings per share, discontinued
operations
$
1.76
$
2.28
$
2.24
(23)
%
2
%
0.01
nm
Earnings per share
Basic Earnings per share:
Earnings per share, continuing
operations
Earnings per share, discontinued
operations
Earnings per share
Weighted average number of common
and common equivalent shares
outstanding:
Diluted
Basic
(1)
—
—
nm
$
1.76
$
2.28
$
2.25
(23)
%
1
%
$
1.78
$
2.34
$
2.33
(24)
%
—
%
0.01
nm
2.34
(24)
—
—
$
1.78
$
2.34
$
1,875
1,948
2,092
1,856
1,890
2,004
nm
%
—
%
The calculation of diluted earnings per share assumes the conversion of the Company’s convertible senior notes
into 45 million shares of common stock for periods presented prior to their redemption in the third quarter of fiscal
2008. Related after-tax interest expense of $12 million for fiscal 2008 and $21 million for fiscal 2007 has been added
back for the calculation of diluted earnings per share.
29
Organization of Information
Management’s Discussion and Analysis provides a narrative on the Company’s financial performance and
condition that should be read in conjunction with the accompanying financial statements. It includes the following
sections:
•
•
•
•
•
•
•
•
•
•
•
Consolidated Results
Business Segment Results – 2009 vs. 2008
Non-Segment Items – 2009 vs. 2008
Pension and Benefit Costs
Business Segment Results – 2008 vs. 2007
Non-Segment Items – 2008 vs. 2007
Liquidity and Capital Resources
Contractual Obligations, Commitments, and Off Balance Sheet Arrangements
Accounting Policies and Estimates
Accounting Changes
Forward-Looking Statements
CONSOLIDATED RESULTS
2009 vs. 2008
Revenues for the year decreased 4%, or $1.7 billion, to $36.1 billion; net income decreased 25%, or $1.1 billion, to
$3.3 billion; and diluted earnings per share decreased 23% to $1.76.
Net income for the current year included certain items that affected comparability, including restructuring and
impairment charges ($0.17 per diluted share), a non-cash gain in connection with the merger of Lifetime and AETN
($0.08 per diluted share) and a gain on the sale of our investment in two pay television services in Latin America ($0.04
per diluted share). Including the impact of rounding, these items collectively resulted in a net adverse impact of $0.06
per diluted share. Fiscal 2008 included an accounting gain related to the acquisition of the Disney Stores North
America and a gain on the sale of movies.com (together $0.01 per diluted share), the favorable resolution of certain
income tax matters ($0.03 per diluted share), a bad debt charge for a receivable from Lehman Brothers ($0.03 per
diluted share) and an impairment charge ($0.01 per diluted share). These items collectively had no net impact on
earnings per share. The current year results also include the benefit from one additional week of operations compared
to fiscal 2008 and fiscal 2007 due to the timing of our fiscal period end. Fiscal 2010 will not include an additional week
and will be a fifty-two week fiscal year.
The decrease in diluted earnings per share reflected lower operating results and the items discussed above,
partially offset by a decrease in weighted average shares outstanding. The decrease in operating results was primarily
due to lower broadcast and cable advertising revenues, a decline in worldwide sales of DVD units, decreased guest
spending at our domestic parks and resorts and Disneyland Paris, higher programming costs and production cost
amortization at our cable and broadcast businesses, lower performance of our movies in worldwide theatrical and
television distribution and lower earned revenue at our licensing business. These decreases were partially offset by
contractual rate increases on revenues from MVSPs (Affiliate Fees), principally at ESPN, cost mitigation activities at
Walt Disney World Resort and Disneyland Paris and higher international and domestic sales of ABC Studios
productions.
2008 vs. 2007
Revenues for the year increased 7%, or $2.3 billion, to $37.8 billion; net income decreased 6%, or $260 million, to
$4.4 billion; and diluted earnings per share increased 1% to $2.28.
As discussed above, net income for fiscal 2008 included certain items which affected comparability. Fiscal 2007
included gains from the sales of E! Entertainment and Us Weekly (together $0.31 per diluted share), the favorable
resolution of certain income tax matters ($0.03 per diluted share), income from the discontinued operations of the ABC
Radio business ($0.01 per diluted share), an equity-based compensation plan modification charge ($0.01 per diluted
share) and an impairment charge ($0.01 per diluted share). These items collectively resulted in a net benefit of $0.33 per
diluted share.
30
The increase in diluted earnings per share for fiscal 2008 was the result of an increase in segment operating
results and a decrease in weighted average shares outstanding, partially offset by the absence of the gains in fiscal 2007
discussed above. Higher segment operating results reflected increases in Affiliate Fees and advertising revenues at our
cable businesses, higher guest spending and attendance at Walt Disney World Resort and Disneyland Paris, and strong
sales of licensed products, partially offset by a decline in worldwide DVD sales.
Restructuring and Impairment Charges
The Company recorded charges totaling $492 million for the current year which included impairment charges of
$279 million and restructuring costs of $213 million. The most significant of the impairment charges were $142 million
related to FCC radio licenses and $65 million related to our investment in UTV Software Communications Limited
(UTV). The restructuring charges included severance and other related costs as a result of various ongoing
organizational and cost structure initiatives across our businesses. Restructuring and impairment charges for the prior
year consisted of an impairment charge of $39 million related to FCC radio licenses.
Other Income (Expense)
Other income (expense) is as follows (in millions):
Gain on Lifetime/AETN transaction (1)
Gain on sale of investment in two pay television
services in Latin America
Gain related to the acquisition of the Disney Stores
North America
Gain on sale of movies.com
Bad debt charge for Lehman Brothers receivable
Gain on sale of equity investment in E! Entertainment
Gain on sale of equity investment in Us Weekly
Equity-based compensation plan modification charge
Other income (expense)
(1)
$
2009
228
$
$
2008
—
114
—
—
—
—
—
—
—
342
18
14
(91)
—
—
—
(59)
$
$
2007
—
—
$
—
—
—
780
272
(48)
1,004
On September 15, 2009, the Company and Hearst both contributed their 50% interest in Lifetime to AETN in
exchange for an increased interest in AETN. The transaction resulted in a $228 million non-cash gain. See Note 4 to
the Consolidated Financial Statements for further details of this transaction.
BUSINESS SEGMENT RESULTS – 2009 vs. 2008
% Change
Better/(Worse)
(in millions)
Revenues:
Media Networks
Parks and Resorts
Studio Entertainment
Consumer Products
Interactive Media
$
$
Segment operating income
Media Networks
Parks and Resorts
Studio Entertainment
Consumer Products
Interactive Media
16,209
10,667
6,136
2,425
712
36,149
$
$
15,857
11,504
7,348
2,415
719
37,843
2007
$
$
14,913
10,626
7,491
1,990
490
35,510
2
(7)
(16)
—
(1)
(4)
%
%
%
%
%
%
6
8
(2)
21
47
7
%
%
%
%
%
%
(4)
(25)
(84)
(22)
(14)
(21)
%
%
%
%
%
%
10
11
(9)
13
11
8
%
%
%
%
%
%
(loss) (1):
$
$
(1)
2008
2009
2008
vs.
2007
2009
vs.
2008
4,765
1,418
175
609
(295)
6,672
$
$
4,981
1,897
1,086
778
(258)
8,484
$
$
4,534
1,710
1,195
689
(291)
7,837
Segment operating income includes equity in the income of investees. In the Business Segment results discussion,
equity in the income of investees is included in segment operating income but does not affect segment revenues or
costs and expenses.
31
The Company evaluates the performance of its operating segments based on segment operating income, and
management uses aggregate segment operating income as a measure of the overall performance of the operating
businesses. The Company believes that information about aggregate segment operating income assists investors by
allowing them to evaluate changes in the operating results of the Company’s portfolio of businesses separate from
factors other than business operations that affect net income. The following table reconciles segment operating income
to income from continuing operations before income taxes and minority interests.
% Change
Better/(Worse)
(in millions)
Segment operating income
Corporate and unallocated shared
expenses
Restructuring and impairment charges (1)
Other income (expense)
Net interest expense
Income from continuing operations before
income taxes and minority interests
(1)
2008
2009
$
$
6,672
$
(460)
(39)
(59)
(524)
(398)
(492)
342
(466)
$
8,484
2007
$
5,658
7,402
$
2008
vs.
2007
2009
vs.
2008
7,837
(21)
%
8
%
(497)
(26)
1,004
(593)
13
nm
nm
11
%
%
%
%
7
(50)
nm
12
7,725
(24)
%
(4)
%
%
The fiscal 2008 and 2007 amounts consist of impairment charges for FCC radio licenses which were previously
reported in Media Networks operating income in the fiscal 2008 and 2007 financial statements. For the fiscal 2009
financial statements, these amounts have been reclassified to “Restructuring and Impairment Charges” in the
consolidated statements of income to conform to the fiscal 2009 presentation.
Media Networks
The following table provides supplemental revenue and operating income detail for the Media Networks
segment:
% Change
Better/(Worse)
(in millions)
Revenues
Cable Networks
Broadcasting
Segment operating income
Cable Networks
Broadcasting
2008
2009
2007
2009
vs.
2008
2008
vs.
2007
$
10,555
5,654
$
10,041
5,816
$
9,167
5,746
5
(3)
%
%
10
1
%
%
$
16,209
$
15,857
$
14,913
2
%
6
%
$
4,260
505
$
4,139
842
$
3,603
931
3
(40)
%
%
15
(10)
%
%
$
4,765
$
4,981
$
4,534
(4)
%
10
%
Revenues
Media Networks revenues increased 2%, or $352 million, to $16.2 billion, consisting of a 5% increase, or $514
million, at the Cable Networks offset by a 3% decrease, or $162 million, at Broadcasting.
Increased Cable Networks revenues were primarily due to growth of $614 million from Affiliate Fees, partially
offset by a decrease of $149 million from advertising revenues. Affiliate Fees are generally derived from fees charged
on a per-subscriber basis, and the increase in the current year was primarily due to contractual rate increases at ESPN
and, to a lesser extent, at the domestic Disney Channel and ABC Family, the impact of the additional week of
32
operations and subscriber growth at ESPN. Lower advertising revenue reflected a decrease at ESPN, partially offset by
an increase at ABC Family. The decrease at ESPN reflected fewer units sold, partially offset by higher rates. The
increase at ABC Family reflected increased units sold and higher rates. Higher Affiliate Fees at the domestic Disney
Channel were more than offset by lower DVD sales.
Certain of the Company’s contracts with cable and satellite operators include annual live programming
commitments. In these cases, recognition of revenues subject to the commitments is deferred until the annual
commitments are satisfied, which generally results in higher revenue recognition in the second half of the year.
Decreased Broadcasting revenues were primarily due to lower advertising sales at the ABC Television Network
and at the owned television stations, partially offset by higher international and domestic sales of ABC Studios
productions driven by Grey’s Anatomy, Private Practice, and Criminal Minds. Lower advertising revenues at the ABC
Television Network reflected lower primetime ratings.
Costs and Expenses
Costs and expenses, which consist primarily of programming rights costs, production costs, participation costs,
distribution and marketing expenses and general and administrative costs, increased 5%, or $539 million, to $12.0
billion, consisting of a 6% increase, or $367 million, at the Cable Networks and a 3% increase, or $172 million, at
Broadcasting. The increase at Cable Networks was driven by higher rights costs at ESPN due to contractual rate
increases for key contracts and costs of new and renewed contracts for college and international sports programming
and increased programming costs at ABC Family due to more original series. The increase at Broadcasting was driven
by higher programming and production costs and a bad debt charge in connection with a bankruptcy of a syndication
customer. Higher programming and production costs reflected more hours of original scripted primetime
programming at the ABC Television Network and higher production cost amortization related to sales of ABC Studios
productions.
Sports Programming Costs
The Company has various contractual commitments for the purchase of rights for multi-year sports
programming packages, including the National Football League, college football (including college bowl games) and
basketball conferences, National Basketball Association, NASCAR, Major League Baseball, World Cup and various
soccer leagues, and Golf and Tennis Associations. The costs of these contracts have increased significantly in recent
years. We enter into these contractual commitments with the expectation that, over the life of the contracts, revenue
from advertising during the programming and Affiliate Fees will exceed the costs of the programming. While contract
costs may initially exceed incremental revenues and negatively impact operating income, it is our expectation that the
combined value to our networks from all of these contracts will result in long-term benefits. The actual impact of these
contracts on the Company’s results over the term of the contracts is dependent upon a number of factors, including the
strength of advertising markets, effectiveness of marketing efforts and the size of viewer audiences.
Segment Operating Income
Segment operating income decreased 4%, or $216 million, to $4.8 billion for the year due to a decrease of $337
million at Broadcasting, partially offset by an increase of $121 million at the Cable Networks. The decrease at
Broadcasting was primarily due to lower advertising sales, higher programming costs and the syndication customer
bad debt charge, partially offset by increased sales of ABC Studios productions. The increase at the Cable Networks
was primarily due to growth at ESPN and ABC Family.
Parks and Resorts
Revenues
Parks and Resorts revenues decreased 7%, or $837 million, to $10.7 billion due to decreases of $531 million at our
domestic operations and $306 million at our international operations.
33
The following table presents attendance, per capita theme park guest spending, and hotel statistics for our
domestic properties:
East Coast
Fiscal Year
2008
Fiscal Year
2009
Parks
Increase/ (decrease)
Attendance
Per Capita Guest
Spending
Hotels (1)
Occupancy
Available Room Nights
(in thousands)
Per Room Guest
Spending
$
(1)
West Coast
Total Domestic
Fiscal Year
2008
Fiscal Year
2009
Fiscal Year
2008
Fiscal Year
2009
—
%
2
%
7
%
—
%
2
%
2
%
(4)
%
3
%
(9)
%
2
%
(6)
%
3
%
87
%
90
%
80
%
88
%
87
%
89
%
8,566
8,732
205
$
223
801
817
$
315
$
339
9,367
9,549
$
214
$
233
Per room guest spending consists of the average daily hotel room rate as well as guest spending on food,
beverages and merchandise at the hotels. Hotel statistics include rentals of Disney Vacation Club units.
At our domestic operations, decreased revenue reflected a decrease in guest spending, principally at our parks
and resorts, and lower gains on securitized sales of ownership interests at Disney Vacation Club. Decreased guest
spending at the domestic parks and resorts reflected lower average ticket prices, lower average daily hotel room rates
and decreased merchandise spending. These decreases were partially offset by an increase in revenue recognition at
Disney Vacation Club in connection with the completion of a vacation club property.
At our international operations, lower revenues resulted from a decrease at Disneyland Paris due to the
unfavorable impact of foreign currency translation as a result of the strengthening of the U.S. dollar against the Euro
and decreased guest spending. Decreased guest spending was due to lower average ticket prices, decreased
merchandise spending and lower average daily hotel room rates.
Costs and Expenses
Costs and expenses, which consist primarily of labor, depreciation, costs of merchandise, food and beverage sold,
marketing and sales expense, repairs and maintenance and entertainment, decreased 4%, or $358 million. The decrease
in costs and expenses was driven by decreases at Disneyland Paris and the Walt Disney World Resort, partially offset
by an increase at Disney Vacation Club. The decrease at Disneyland Paris was due to the favorable impact of foreign
currency translation as a result of the strengthening of the U.S. dollar against the Euro and savings from cost mitigation
activities partially offset by labor and other cost inflation. The decrease at the Walt Disney World Resort was driven by
savings from cost mitigation activities, partially offset by labor and other cost inflation. The increase at Disney Vacation
Club was driven by higher per unit cost of sales and expense recognition in connection with the completion of a
vacation club property.
Segment Operating Income
Segment operating income decreased 25%, or $479 million, to $1.4 billion, due to decreases at our domestic
operations and at Disneyland Paris.
Studio Entertainment
Revenues
Revenues decreased 16%, or $1.2 billion, to $6.1 billion primarily due to decreases of $978 million in worldwide
home entertainment, $129 million in music distribution and $106 million in worldwide television distribution.
The decrease in worldwide home entertainment revenues was primarily due to lower unit sales and net effective
pricing, reflecting the overall decline in the DVD market and the strength of Pirates of the Caribbean: At World’s End in
the prior year. Significant other titles included WALL-E and The Chronicles of Narnia: Prince Caspian in the current year
while the prior year included Ratatouille, National Treasure 2: Book of Secrets and Enchanted.
34
Lower revenues in music distribution reflected the strong performance of the Hannah Montana concert tour and
Miley Cyrus and Jonas Brothers CD titles in the prior year. The decrease in worldwide television distribution was driven
by fewer significant titles in the current year.
Cost and Expenses
Costs and expenses, which consist primarily of production cost amortization, distribution and marketing
expenses, product costs and participation costs decreased 5%, or $305 million, primarily due to decreases in worldwide
home entertainment and music distribution, partially offset by an increase in worldwide theatrical distribution.
The decrease in costs at worldwide home entertainment was primarily due to lower distribution costs and
production cost amortization resulting from a decline in DVD unit sales. The decrease in music distribution reflected
the absence of costs associated with the Hannah Montana concert tour in the prior year. Increased costs and expenses in
worldwide theatrical distribution reflected higher marketing costs for current year releases and higher film cost writedowns.
Segment Operating Income
Segment operating income decreased 84%, or $911 million, to $175 million primarily due to decreases at
worldwide home entertainment, worldwide theatrical distribution and worldwide television distribution.
Consumer Products
Revenues
Revenues were essentially flat at $2.4 billion as an increase of $131 million at our retail business was offset by
decreases of $86 million at Merchandise Licensing and $44 million at Publishing. The increase at our retail business was
primarily due to the acquisition of the Disney Stores North America during the third quarter of fiscal 2008 (see
discussion of the Disney Stores acquisition below), partially offset by the unfavorable impact of foreign currency
translation at The Disney Stores Europe as a result of the strengthening of the U.S. dollar against the British pound and
Euro. The decrease at Merchandise Licensing was primarily due to lower earned royalty revenue across multiple
product categories due to the difficult retail environment as well as the strength of Hannah Montana and High School
Musical properties in the prior year. The decrease at Publishing reflected lower magazine sales driven by the closure of
Wondertime magazine.
Costs and Expenses
Costs and expenses, which consist primarily of cost of sales, salaries and benefits, marketing and occupancy,
increased 11%, or $181 million, to $1.8 billion primarily due to an increase at our retail business, partially offset by a
decrease at Publishing. The increase at retail was due to the acquisition of the Disney Stores North America in the third
quarter of fiscal 2008, partially offset by a favorable impact of foreign currency translation at The Disney Stores Europe
as a result of the strengthening of the U.S. dollar against the British pound and Euro. The decrease at Publishing
reflected lower cost of sales and other operating costs.
Segment Operating Income
Segment operating income decreased 22%, or $169 million, to $609 million due to lower results at Merchandise
Licensing and at our retail business, which reflected the adverse impact of a full year of company-owned operations at
the Disney Stores North America in fiscal 2009 whereas the prior year included five months of company-owned
operations and seven months of licensed operations.
Disney Stores Acquisition
On April 30, 2008, the Company acquired certain assets of the Disney Stores North America for approximately
$64 million of cash from, and terminated its long-term licensing arrangement for the Disney Stores with, The
Children’s Place, the former licensee. The Company acquired the inventory, leasehold improvements, and certain fixed
assets of, and assumed the leases on, 229 stores. The Company conducted the wind-down and closure of an additional
88 stores but did not assume the leases on these stores.
35
Interactive Media
Revenues
Interactive Media revenues decreased 1%, or $7 million, to $712 million primarily due to a decrease of $58 million
at Disney Interactive Studios, driven by lower sales of self-published video games and decreased licensing revenues,
partially offset by increases of $39 million at our mobile phone service business in Japan, which was launched in the
second quarter of fiscal 2008, and $11 million at Disney Online driven by increased subscription revenues at Club
Penguin.
At Disney Interactive Studios, lower self-published video games sales reflected decreased net effective pricing
and unit sales. Significant current year titles included High School Musical 3, Sing It and Bolt as compared to the prior
year, which included High School Musical, Turok, Hannah Montana 2 and Pure. The decrease in licensing revenues was
primarily due to the performance of WALL-E, Cars and Ratatouille in the prior year.
Costs and Expenses
Costs and expenses, which consist primarily of video game and internet product development costs, cost of sales,
distribution and marketing expenses, general and administrative costs, and technology infrastructure costs, increased
4%, or $35 million, to $1.0 billion.
The increase was primarily due to higher unit cost of sales and distribution costs, which included the costs for
bundled accessories and music royalties for certain current-year titles at Disney Interactive Studios, higher expenses at
our mobile phone service business in Japan driven by a full year of operations, partially offset by a decrease at Disney
Online driven by lower marketing costs.
Segment Operating Loss
Segment operating loss increased 14%, or $37 million, to $295 million driven by lower results at Disney
Interactive Studio partially offset by improved results at Disney Online.
NON-SEGMENT ITEMS – 2009 vs. 2008
Corporate and Unallocated Shared Expenses
Corporate and unallocated shared expense decreased 13%, from $460 million to $398 million, driven by savings
from cost mitigation activities and an increase in allocation of costs to the business segments.
Net Interest Expense
Net interest expense is detailed below:
(in millions)
2008
2009
Interest expense
Interest and investment income
$
(588)
122
$
(712)
188
Net interest expense
$
(466)
$
(524)
% Change
Better/(Worse)
17 %
(35) %
11
%
The decrease in interest expense and interest and investment income for the year was driven by lower effective
interest rates.
Effective Income Tax Rate
The effective tax rate was comparable to the prior year at 36.2% as the favorable impact of legislative changes in
the current year was offset by the favorable resolution of certain income tax matters in the prior year.
Minority Interests
Minority interest expense was flat at $302 million for the current year as the impact of lower financing costs at
Hong Kong Disneyland and improved operating results at ESPN were offset by lower performance at Disneyland
Paris. The minority interest is determined on income after royalties, financing costs and income taxes.
36
PENSION AND POSTRETIREMENT MEDICAL BENEFIT COSTS
Pension and postretirement medical benefit plan costs affect results in all five segments, with approximately
one-half of these costs being borne by the Parks and Resorts segment. The Company recognized pension and
postretirement medical benefit plan expenses of $214 million, $255 million and $278 million for fiscal years 2009, 2008
and 2007, respectively. The decrease in fiscal 2009 was primarily due to an increase in the discount rate used to
measure the present value of plan obligations. The assumed discount rate reflects market rates for high-quality
corporate bonds currently available. The Company’s discount rate was determined by considering the average of
pension yield curves constructed from a large population of high quality corporate bonds. The resulting discount rate
reflects the matching of plan liability cash flows to the yield curves.
We expect pension and postretirement medical costs to increase by approximately $268 million to $482 million in
fiscal 2010 primarily due to a decrease in the discount rate used to measure the present value of plan obligations and
asset returns that were below the assumed return. The decrease in the discount rate and the asset return shortfall
versus our expected return in fiscal 2009 also resulted in an increase in the underfunded status of our plans and an
increase in unrecognized pension and postretirement medical expense which totals $2.8 billion ($1.8 billion after-tax) as
of October 3, 2009. If our investment performance does not improve relative to our long-term assumption and/or
discount rates do not increase, we expect that pension and post-retirement medical costs will continue to be
considerably higher than fiscal 2009 for the next few years as a result of amortizing these unrecognized expenses. See
Note 11 to the Consolidated Financial Statements for further details of the impacts of our pension and postretirement
medical plans on our financial statements. During fiscal 2009, the Company made contributions to its pension and
postretirement medical plans totaling $473 million, which included discretionary contributions above the minimum
requirements for pension plans. The Company expects pension and post-retirement medical plan contributions in fiscal
2010 to range from $350 million to $450 million, which is expected to include discretionary contributions above the
minimum requirements. Final minimum funding requirements for fiscal 2010 will be determined based on our
January 1, 2010 funding actuarial valuation which will be available late fiscal 2010. See “Item 1A – Risk Factors” for the
impact of factors affecting pension and postretirement medical costs.
BUSINESS SEGMENT RESULTS – 2008 vs. 2007
Media Networks
Revenues
Media Networks revenues increased 6%, or $944 million, to $15.9 billion, consisting of a 10% increase, or $874
million, at the Cable Networks and a 1% increase, or $70 million, at Broadcasting.
Increased Cable Networks revenues were primarily due to growth of $654 million from Affiliate Fees and $206
million from advertising revenues. Increased Affilitate Fees in fiscal 2008 were driven by increases at ESPN and, to a
lesser extent, the worldwide Disney Channels and ABC Family. The increase at ESPN was primarily due to contractual
rate increases and subscriber growth, the increase at the worldwide Disney Channels was driven by subscriber growth
and the increase at ABC Family was due to contractual rate increases. Higher advertising revenues at ESPN and ABC
Family reflected improved rates and ratings. Higher DVD sales, primarily High School Musical, were partially offset by
the favorable settlement of a claim with an international distributor in fiscal 2007.
Increased Broadcasting revenues reflected higher international sales of ABC Studios productions partially offset
by decreased advertising revenues, largely at the owned television stations. Increased international sales of ABC
Studios productions were driven by Grey’s Anatomy, Private Practice and Reaper. Fiscal 2008 revenues at the ABC
Television Network were comparable to fiscal 2007 as the impact of lower ratings was offset by higher advertising rates
and digital media revenues.
Costs and Expenses
Costs and expenses increased 6%, or $609 million, to $11.5 billion, consisting of an 7% increase, or $448 million, at
the Cable Networks and a 3% increase, or $161 million, at Broadcasting. The increase at Cable Networks was primarily
due to increased costs at ESPN and to a lesser extent, the worldwide Disney Channels, driven by higher programming,
administrative and marketing costs. These increases were partially offset by the absence of Major League Baseball
programming costs at ABC Family. The increase at Broadcasting was primarily due to higher production cost
amortization related to international sales of our programs.
37
Segment Operating Income
Segment operating income increased 10%, or $447 million, to $5.0 billion due to an increase of $536 million at the
Cable Networks partially offset by a decrease of $89 million at Broadcasting. The increase at the Cable Networks was
primarily due to growth at ESPN, higher income at our cable equity investments, and increases at ABC Family and the
domestic Disney Channels, partially offset by a favorable settlement of a claim with an international distributor in
fiscal 2007. The decrease at Broadcasting was due to lower advertising revenues at the owned television stations. The
increase in income at our cable equity investments was primarily due to higher affiliate and advertising revenue at
Lifetime and a gain on the sale of a European cable channel.
ABC Radio Transaction
On June 12, 2007, the Company completed the spin-off of its wholly-owned subsidiary, ABC Radio Holdings,
Inc., which was then merged into a subsidiary of Citadel Broadcasting Corporation (Citadel). Prior to the spin-off, the
Company consolidated its ABC Radio business, consisting of 22 large-market radio stations and the ABC Radio
Network businesses, under ABC Radio Holdings, Inc. The transaction did not include the Company’s ESPN Radio or
Radio Disney network and station businesses. The results of the ABC Radio business have been reported as
discontinued operations for all periods presented. The Company now includes the ESPN Radio and Radio Disney
network and stations businesses with Cable Networks in the Media Networks segment. Prior to the transaction, the
Company’s radio businesses were included with Broadcasting in the Media Networks segment. Previously reported
results have been reclassified to reflect this presentation.
Summarized financial information for the discontinued operations is as follows (in millions, except per share
data):
2007
Revenues
Income from discontinued operations before income taxes
Income from discontinued operations, net of tax
Diluted EPS, discontinued operations
$
372
45
13
0.01
Parks and Resorts
Revenues
Parks and Resorts revenues increased 8%, or $878 million, to $11.5 billion due to increases of $439 million at our
domestic operations and $439 million at our international operations.
The following table presents attendance, per capita theme park guest spending, and hotel statistics for our
domestic properties:
East Coast
Fiscal Year
2008
Parks
Increase/(decrease)
Attendance
Per Capita Guest
Spending
Hotels (1)
Occupancy
Available Room Nights
(in thousands)
Per Room Guest
Spending
$
(1)
West Coast
Fiscal Year
2007
Fiscal Year
2008
Total Domestic
Fiscal Year
2007
Fiscal Year
2008
Fiscal Year
2007
2
%
6
%
—
%
(1)
%
2
%
3
%
3
%
3
%
2
%
2
%
3
%
3
%
90
%
89
%
88
%
92
%
89
%
89
%
8,566
223
8,614
$
217
801
$
339
810
$
309
9,367
$
233
9,424
$
Per room guest spending consists of the average daily hotel room rate as well as guest spending on food,
beverages and merchandise at the hotels. Hotel statistics include rentals of Disney Vacation Club units.
38
225
At our domestic operations, growth in revenues was primarily due to increases at the Walt Disney World Resort
and Disney Vacation Club. Revenue growth at Walt Disney World Resort was primarily due to increased guest
spending and theme park attendance. Increased guest spending was due to higher average ticket prices, increased food
and beverage sales and higher average daily hotel room rates. At Disney Vacation Club, revenue growth reflected
higher vacation club ownership sales, including extensions of the term of ownership on existing vacation club
properties.
At our international operations, revenue growth resulted from an increase at Disneyland Paris due to the
favorable impact of foreign currency translation as a result of the weakening of the U.S. dollar against the Euro and
increased guest spending and theme park attendance. Increased guest spending was due to higher average daily hotel
room rates and average ticket prices.
Costs and Expenses
Costs and expenses increased 8%, or $691 million, primarily due to increases at Disneyland Paris, Walt Disney
World Resort and Disney Vacation Club. The increase at Disneyland Paris was due to the unfavorable impact of
foreign currency translation as a result of the weakening of the U.S. dollar against the Euro, labor cost inflation and
higher volume-related costs. The increase at the Walt Disney World Resort was due to labor and other cost inflation,
new guest offerings and volume-related costs. The increase at Disney Vacation Club was driven by higher per unit cost
of sales.
Segment Operating Income
Segment operating income increased 11%, or $187 million, to $1.9 billion, primarily due to increases at
Disneyland Paris and the Walt Disney World Resort.
Studio Entertainment
Revenues
Revenues decreased 2%, or $143 million, to $7.3 billion primarily due to decreases of $117 million in worldwide
television distribution, $112 million in domestic theatrical distribution, and $66 million in domestic home
entertainment, partially offset by an increase of $147 million in international home entertainment.
The decrease in worldwide television distribution revenues was driven by the absence of the multi-season sale of
Home Improvement which occurred in fiscal 2007. Lower revenues in domestic theatrical distribution reflected the strong
performance of fiscal 2007 titles, including Pirates of the Caribbean: At World’s End, Ratatouille, and Wild Hogs, compared
to the titles in fiscal 2008, which included National Treasure 2: Book of Secrets and WALL-E. Lower revenues in domestic
home entertainment were primarily due to a decline in unit sales reflecting the performance of Pirates of the Caribbean:
At World’s End and Ratatouille in fiscal 2008 compared to Pirates of the Caribbean: Dead Man’s Chest and Cars in fiscal
2007.
Revenue growth in international home entertainment was primarily due to a higher unit sales mix of television
series DVD sets, which have higher average unit sales prices.
Cost and Expenses
Costs and expenses for fiscal 2008 were comparable to fiscal 2007 as decreases in worldwide television
distribution and domestic theatrical distribution were largely offset by an increase in international home entertainment.
Lower costs and expenses in worldwide television distribution were primarily due to a decrease in amortization
and participation costs driven by the absence of the Home Improvement sale. The decrease in domestic theatrical
distribution was primarily due to lower amortization expense reflecting decreased revenues for fiscal 2008 releases and
lower film cost write-downs. The increase in international home entertainment was primarily due to higher
distribution costs driven by extensive marketing campaigns in fiscal 2008.
Segment Operating Income
Segment operating income decreased 9%, or $109 million, to $1.1 billion primarily due to lower revenues in
domestic home entertainment.
39
Consumer Products
Revenues
Revenues increased 21%, or $425 million, to $2.4 billion, due to increases of $196 million at our retail business
and $181 million at Merchandise Licensing.
The increase at our retail business was due to the acquisition of the Disney Stores North America during the
third quarter of fiscal 2008. The revenue growth at Merchandise Licensing was primarily due to higher earned royalties
across multiple product categories, led by Hannah Montana and High School Musical merchandise, partially offset by
lower recognition of minimum guarantee revenues.
Costs and Expenses
Costs and expenses increased 26%, or $336 million, to $1.6 billion primarily due to the acquisition of the Disney
Stores North America during the third quarter of fiscal 2008, and higher salary and benefits expenses and increased
participation costs at Merchandise Licensing.
Segment Operating Income
Segment operating income increased 13%, or $89 million, to $778 million due to growth at Merchandise
Licensing, partially offset by a decrease at our retail business.
Interactive Media
Revenues
Interactive Media revenues increased 47%, or $229 million, to $719 million primarily due to increases of $160
million at Disney Interactive Studios and $71 million at Disney Online.
The increase at Disney Interactive Studios was primarily due to the performance of new High School Musical,
Hannah Montana and Turok self-published video games in fiscal 2008 compared to Pirates of the Caribbean, Spectrobes and
Meet the Robinsons games in fiscal 2007. The increase at Disney Online reflected higher virtual world subscription
revenue due to a full year of Club Penguin, which was acquired in the fourth quarter of fiscal 2007.
Costs and Expenses
Costs and expenses increased 25%, or $193 million, to $974 million driven by increases at Disney Interactive
Studios and Disney Online, partially offset by lower costs related to the domestic mobile phone service, which was
shut down in the first quarter of fiscal 2008. The increase at Disney Interactive Studios reflected higher product,
distribution and marketing costs associated with volume growth and increased investment in video game
development. At Disney Online the increase was driven by higher development and marketing costs related to the
Disney.com website and virtual worlds, including the impact of a full year of Club Penguin, and the Family.com
website.
Segment Operating Loss
Segment operating loss decreased 11%, or $33 million, to $258 million driven by reduced costs due to the
shutdown of the domestic mobile phone service in the first quarter of fiscal 2008, partially offset by higher marketing
costs at Disney Online.
NON-SEGMENT ITEMS – 2008 vs. 2007
Corporate and Unallocated Shared Expenses
Corporate and unallocated shared expense decreased 7%, from $497 million to $460 million, primarily due to an
increase in allocation of costs to the business segments, partially offset by higher investments in strategic initiatives.
40
Net Interest Expense
Net interest expense is detailed below:
(in millions)
2007
2008
% Change
Better/(Worse)
Interest expense
Interest and investment income
$
(712)
188
$
(746)
153
5 %
23 %
Net interest expense
$
(524)
$
(593)
12
%
Net interest expense decreased 12% for the year driven by lower effective interest rates and a gain on the sale of
an investment, partially offset by higher average debt balances.
Effective Income Tax Rate
The effective income tax rate decreased 1.1 percentage points from 37.2% in 2007 to 36.1% in 2008. The lower
effective tax rate for the year was primarily due to increased benefits from Internal Revenue Code (IRC) Section 199
related to qualified domestic production activities.
Minority Interests
Minority interest expense increased from $177 million to $302 million reflecting the impact of improved results at
Disneyland Paris, ESPN and Hong Kong Disneyland. The minority interest is determined on income after royalties,
financing costs and income taxes.
LIQUIDITY AND CAPITAL RESOURCES
The change in cash and cash equivalents is as follows:
(in millions)
2008
2009
Cash provided by continuing operations
Cash used by continuing investing activities
Cash used by continuing financing activities
Cash flows from discontinued operations
$
Increase/(decrease) in cash and cash equivalents
$
5,064
(2,096)
(2,552)
—
416
2007
$
5,446
(2,162)
(3,953)
—
$
5,398
(618)
(3,619)
98
$
(669)
$
1,259
Operating Activities
Cash provided by continuing operating activities for fiscal 2009 decreased 7% or $382 million to $5.1 billion as
compared to fiscal 2008. The decrease was driven by lower segment operating results and higher contributions to our
pension plans, partially offset by lower income tax payments and a decreased net investment in working capital.
Cash provided by continuing operating activities for fiscal 2008 increased 1% or $48 million to $5.4 billion as
compared to fiscal 2007. The increase was driven by higher segment operating results and lower pension contributions,
partially offset by increased film and television spending and higher net investment in working capital including
higher spending on Disney Vacation Club properties.
41
Depreciation expense from continuing operations is as follows:
(in millions)
2008
2009
Media Networks
Cable Networks
Broadcasting
$
Total Media Networks
$
$
89
79
179
168
822
326
803
342
790
304
1,148
1,145
1,094
50
29
28
128
41
18
21
123
31
16
18
132
Studio Entertainment
Consumer Products
Interactive Media
Corporate
Total depreciation expense from continuing operations
89
90
197
Parks and Resorts
Domestic
International
Total Parks and Resorts
$
108
89
2007
$
1,580
1,527
$
1,459
The Company’s Studio Entertainment and Media Networks segments incur costs to acquire and produce
television and feature film programming. Film and television production costs include all internally produced content
such as live action and animated feature films, animated direct-to-video programming, television series, television
specials, theatrical stage plays or other similar product. Programming costs include film or television product licensed
for a specific period from third parties for airing on the Company’s broadcast, cable networks, and television stations.
Programming assets are generally recorded when the programming becomes available to us with a corresponding
increase in programming liabilities. Accordingly, we analyze our programming assets net of the related liability.
The Company’s film and television production and programming activity for fiscal years 2009, 2008 and 2007 are
as follows:
(in millions)
2008
2009
Beginning balances:
Production and programming assets
Programming liabilities
$
Spending:
Film and television production
Broadcast programming
Amortization:
Film and television production
Broadcast programming
Change in film and television production and
programming costs
Other non-cash activity
Ending balances:
Production and programming assets
Programming liabilities
5,935
(1,108)
$
42
$
5,650
(1,118)
4,827
4,472
4,532
3,421
3,896
3,237
3,812
2,906
3,898
7,317
7,049
6,804
(3,486)
(3,788)
(3,076)
(3,672)
(3,223)
(3,696)
(7,274)
(6,748)
(6,919)
43
301
(115)
(154)
54
55
5,935
(1,108)
5,756
(1,040)
$
5,682
(1,210)
2007
4,716
$
4,827
5,682
(1,210)
$
4,472
Investing Activities
Investing activities from continuing operations consist principally of investments in parks, resorts, and other
property and acquisition and divestiture activity. The Company’s investments in parks, resorts and other property
from continuing operations for the last three years are as follows:
(in millions)
2008
2009
Media Networks:
Cable Networks
Broadcasting
Parks and Resorts:
Domestic
International
Studio Entertainment
Consumer Products
Interactive Media
Corporate
$
151
143
$
1,753
$
793
140
126
51
40
90
1,039
143
135
46
21
75
$
206
132
2007
$
1,578
127
106
816
256
85
30
38
108
$
1,566
Capital expenditures for the Parks and Resorts segment are principally for theme park and resort expansion, new
rides and attractions, cruise ships, recurring capital and capital improvements. The increase in capital expenditures at
domestic parks and resorts in fiscal 2009 reflected spending on Disney’s California Adventure expansion and
construction progress payments on two new cruise ships. The decrease in capital expenditures at international parks
and resorts in fiscal 2008 reflected lower expenditures at Disneyland Paris as a result of completion of projects related
to a multi-year investment program established with the 2005 Financial Restructuring (See Note 7 to the Consolidated
Financial Statements).
Capital expenditures at Media Networks primarily reflect investments in facilities and equipment for expanding
and upgrading broadcast centers, production facilities, and television station facilities. The increase in fiscal 2008 was
driven by the construction of new production and television station facilities.
Other Investing Activities
During fiscal 2009, acquisitions totaled $517 million and included the purchase of additional interests in Jetix
Europe N.V. and UTV (See Note 4 to the Consolidated Financial Statements), partially offset by proceeds totaling $185
million from the sale of our investment in two pay television services in Latin America.
During fiscal 2008, acquisitions totaled $660 million which included an additional interest in UTV.
During fiscal 2007, the Company received $1.5 billion in proceeds from the sales of our interests in E!
Entertainment Television and Us Weekly. Acquisitions totaled $608 million driven by Club Penguin Entertainment,
Inc. and NASN Limited (see Note 4 to the Consolidated Financial Statements).
Financing Activities
Cash used in continuing financing activities decreased by $1.4 billion to $2.6 billion in fiscal 2009 and consisted of
repayments of borrowings, the payment of dividends and repurchases of common stock. The decrease from fiscal 2008
was due to lower share repurchases, partially offset by higher repayments of borrowings and decreased proceeds from
stock option exercises. Cash used in continuing financing activities during fiscal 2008 and 2007 of $4.0 billion and $3.6
billion, respectively, consisted of share repurchases and dividends, partially offset by borrowings and the proceeds
from stock option exercises. Borrowings during fiscal 2007 included $1.35 billion of pre-spin-off borrowings of ABC
Radio Holdings, Inc. that were removed from the Company’s balance sheet in connection with the spin-off.
43
During the year ended October 3, 2009, the Company’s borrowing activity was as follows:
(in millions)
September 27,
2008
Commercial paper borrowings
U.S. medium-term notes
European medium-term notes
Other foreign currency
denominated debt (1)
Capital Cities / ABC debt
Film financing
Other (2)
Euro Disney borrowings
Hong Kong Disneyland
borrowings (3)
$
Total
$
1,985
7,005
318
Additions
$
—
1,500
—
Other
Activity
Payments
$
(1,985)
(880)
—
$
October 3,
2009
—
(7)
29
$
—
7,618
347
825
178
248
374
2,457
—
—
250
—
—
—
(60)
(174)
(7)
(121)
79
(2)
26
131
8
904
116
350
498
2,344
1,249
—
(375)
(350)
524
14,639
$
1,750
$
(3,602)
$
(86)
$
12,701
(1)
The other activity is primarily the impact of foreign currency translation as a result of the weakening of the U.S.
dollar against the Japanese yen.
(2)
The other activity is primarily market value adjustments for debt with qualifying hedges.
(3)
The other activity is due to the conversion of the HKSAR’s loan to equity pursuant to the capital realignment and
expansion plan (See Note 7 to the Consolidated Financial Statements).
The Company’s bank facilities are as follows:
Committed
Capacity
(in millions)
Bank facilities expiring February 2010
Bank facilities expiring February 2011
Total
Capacity
Used
Unused
Capacity
$
2,225
2,225
$
—
237
$
2,225
1,988
$
4,450
$
237
$
4,213
These bank facilities allow for borrowings at LIBOR-based rates plus a spread, which depends on the Company’s
public debt rating and can range from 0.175% to 0.75%. As of October 3, 2009, the Company had not borrowed under
these bank facilities. The Company also has the ability to issue up to $800 million of letters of credit under the facility
expiring in 2011, which if utilized, reduces available borrowing under this facility. As of October 3, 2009, $326 million
of letters of credit had been issued of which $237 million was issued under this facility.
The Company may use commercial paper borrowings up to the amount of its unused bank facilities (see above),
in conjunction with term debt issuance and operating cash flow, to retire or refinance other borrowings before or as
they come due.
As of the filing date of this report, the Board of Directors had not yet declared a dividend related to fiscal 2009.
The Company paid a $648 million dividend ($0.35 per share) during the second quarter of fiscal 2009 related to fiscal
2008. The Company paid a $664 million dividend ($0.35 per share) during the second quarter of fiscal 2008 related to
fiscal 2007; and paid a $637 million dividend ($0.31 per share) during the second quarter of fiscal 2007 related to fiscal
2006.
During fiscal 2009, the Company repurchased 5 million shares of Disney common stock for $138 million. During
fiscal 2008, the Company repurchased 139 million shares of Disney common stock for $4.5 billion. During fiscal 2007,
the Company repurchased 202 million shares of Disney common stock for $6.9 billion. As of October 3, 2009, the
Company had remaining authorization in place to repurchase 179 million additional shares. The repurchase program
does not have an expiration date.
44
We believe that the Company’s financial condition is strong and that its cash balances, other liquid assets,
operating cash flows, access to debt and equity capital markets and borrowing capacity, taken together, provide
adequate resources to fund ongoing operating requirements and future capital expenditures related to the expansion of
existing businesses and development of new projects. However, the Company’s operating cash flow and access to the
capital markets can be impacted by macroeconomic factors outside of its control. See “Item 1A – Risk Factors”. In
addition to macroeconomic factors, the Company’s borrowing costs can be impacted by short and long-term debt
ratings assigned by independent rating agencies, which are based, in significant part, on the Company’s performance
as measured by certain credit metrics such as interest coverage and leverage ratios. As of December 2, 2009, Moody’s
Investors Service’s long and short-term debt ratings for the Company were A2 and P-1, respectively, with stable
outlook; Standard & Poor’s long and short-term debt ratings for the Company were A and A-1, respectively, with
CreditWatch negative; and Fitch’s long and short-term debt ratings for the Company were A and F-1, respectively,
with stable outlook. The Company’s bank facilities contain only one financial covenant, relating to interest coverage,
which the Company met on October 3, 2009, by a significant margin. The Company’s bank facilities also specifically
exclude certain entities, such as Euro Disney and Hong Kong Disneyland, from any representations, covenants or
events of default.
Euro Disney has covenants under its debt agreements that limit its investment and financing activities and
require it to meet certain annual financial performance covenants. Subject to final third-party review as provided in its
debt agreements, Euro Disney believes that it has complied with its financial performance covenants for fiscal year
2009.
CONTRACTUAL OBLIGATIONS, COMMITMENTS AND OFF BALANCE SHEET ARRANGEMENTS
The Company has various contractual obligations which are recorded as liabilities in our consolidated financial
statements. Other items, such as certain purchase commitments and other executory contracts are not recognized as
liabilities in our consolidated financial statements but are required to be disclosed in the footnotes to the financial
statements. For example, the Company is contractually committed to acquire broadcast programming and make
certain minimum lease payments for the use of property under operating lease agreements.
The following table summarizes our significant contractual obligations and commitments on an undiscounted
basis at October 3, 2009 and the future periods in which such obligations are expected to be settled in cash. In addition,
the table reflects the timing of principal and interest payments on outstanding borrowings. Additional details
regarding these obligations are provided in the Notes to the Consolidated Financial Statements, as referenced in the
table:
Payments Due by Period
(in millions)
Borrowings (Note 9) (1)
Operating lease
commitments (Note 15)
Capital lease obligations (Note 15)
Sports programming
commitments (Note 15)
Broadcast programming
commitments (Note 15)
$
Total sports and other
broadcast programming
commitments
Other (2)
Total contractual obligations (3)
(1)
Less than
1 Year
Total
$
17,240
$
1,690
1-3
Years
$
3,642
4-5
Years
$
3,993
More than
5 Years
$
7,915
2,036
790
421
33
684
68
414
64
517
625
17,979
2,973
5,975
5,551
3,480
3,228
2,050
717
358
103
21,207
4,832
5,023
1,250
6,692
2,504
5,909
337
3,583
741
46,105
$
8,417
$
13,590
$
10,717
$
13,381
Amounts exclude market value adjustments totaling $291 million, which are recorded in the balance sheet.
Amounts include interest payments based on contractual terms for fixed rate debt, and on current interest rates for
variable rate debt.
45
(2)
Other commitments primarily comprise contractual commitments for the construction of two new cruise ships,
creative talent and employment agreements and unrecognized tax benefits. Creative talent and employment
agreements include obligations to actors, producers, sports personnel, television and radio personalities and
executives.
(3)
Contractual commitments include the following:
Liabilities recorded on the balance sheet
Commitments not recorded on the balance sheet
$
14,448
31,657
$
46,105
The Company also has obligations with respect to its pension and postretirement medical benefit plans. See Note
11 to the Consolidated Financial Statements.
Contingent Commitments and Contractual Guarantees
The Company also has certain contractual arrangements that would require the Company to make payments or
provide funding if certain circumstances occur. The Company does not currently expect that these arrangements will
result in any significant amounts being paid by the Company. See Note 15 to the Consolidated Financial Statements for
information regarding the Company’s contingent commitments and contractual guarantees.
Legal and Tax Matters
As disclosed in Notes 10 and 15 to the Consolidated Financial Statements, the Company has exposure for certain
legal and tax matters.
ACCOUNTING POLICIES AND ESTIMATES
We believe that the application of the following accounting policies, which are important to our financial position
and results of operations, require significant judgments and estimates on the part of management. For a summary of
our significant accounting policies, including the accounting policies discussed below, see Note 2 to the Consolidated
Financial Statements.
Film and Television Revenues and Costs
We expense film and television production, participation and residual costs over the applicable product life cycle
based upon the ratio of the current period’s revenues to the estimated remaining total revenues (Ultimate Revenues)
for each production. If our estimate of Ultimate Revenues decreases, amortization of film and television costs may be
accelerated. Conversely, if estimates of Ultimate Revenues increase, film and television cost amortization may be
slowed. For film productions, Ultimate Revenues include revenues from all sources that will be earned within ten years
from the date of the initial theatrical release. For television series, we include revenues that will be earned within ten
years from delivery of the first episode, or if still in production, five years from delivery of the most recent episode, if
later.
With respect to films intended for theatrical release, the most sensitive factor affecting our estimate of Ultimate
Revenues (and therefore affecting future film cost amortization and/or impairment) is domestic theatrical
performance. Revenues derived from other markets subsequent to the domestic theatrical release (e.g. the home video
or international theatrical markets) have historically been highly correlated with domestic theatrical performance.
Domestic theatrical performance varies primarily based upon the public interest and demand for a particular film, the
popularity of competing films at the time of release and the level of marketing effort. Upon a film’s release and
determination of domestic theatrical performance, the Company’s estimates of revenues from succeeding windows
and markets are revised based on historical relationships and an analysis of current market trends. The most sensitive
factor affecting our estimate of Ultimate Revenues for released films is the extent of home entertainment sales
achieved. Home entertainment sales vary based on the number and quality of competing home video products, as well
as the manner in which retailers market and price our products.
With respect to television series or other television productions intended for broadcast, the most sensitive factors
affecting estimates of Ultimate Revenues is the program’s rating and the strength of the advertising market. Program
ratings, which are an indication of market acceptance, directly affect the Company’s ability to generate advertising
46
revenues during the airing of the program. In addition, television series with greater market acceptance are more likely
to generate incremental revenues through the eventual sale of the program rights in the syndication, international and
home entertainment markets. Alternatively, poor ratings may result in a television series cancellation, which would
require the immediate write-off of any unamortized production costs. A significant decline in the advertising market
would also negatively impact our estimates.
We expense the cost of television broadcast rights for acquired movies, series and other programs based on the
number of times the program is expected to be aired or on a straight-line basis over the useful life, as appropriate.
Amortization of those television programming assets being amortized on a number of airings basis may be accelerated
if we reduce the estimated future airings and slowed if we increase the estimated future airings. The number of future
airings of a particular program is impacted primarily by the program’s ratings in previous airings, expected
advertising rates and availability and quality of alternative programming. Accordingly, planned usage is reviewed
periodically and revised if necessary. Rights costs for multi-year sports programming arrangements are amortized
based upon the ratio of the current period’s revenues to Ultimate Revenues (the Projected Revenue Method) or on a
straight-line basis over the contract period, as appropriate. Revenues include both advertising revenues and an
allocation of Affiliate Fees. If the annual contractual payments related to each season over the term of a multi-year
sports programming arrangement approximate each season’s rights cost based on the Projected Revenue Method, we
expense the related annual payments during the applicable season. If Ultimate Revenues change significantly from
projections, amortization of the rights costs may be accelerated or slowed.
Costs of film and television productions are subject to regular recoverability assessments which compare the
estimated fair values with the unamortized costs. The net realizable value of the television broadcast program licenses
and rights are reviewed using a daypart methodology. A daypart is defined as an aggregation of programs broadcast
during a particular time of day or programs of a similar type. The Company’s dayparts are early morning, daytime,
late night, primetime, news, children, and sports (includes network and cable). The net realizable values of other cable
programming assets are reviewed on an aggregated basis for each cable channel. Individual programs are written-off
when there are no plans to air or sublicense the program. Estimated values are based upon assumptions about future
demand and market conditions. If actual demand or market conditions are less favorable than our projections, film,
television and programming cost write-downs may be required.
Revenue Recognition
The Company has revenue recognition policies for its various operating segments that are appropriate for the
circumstances of each business. See Note 2 to the Consolidated Financial Statements for a summary of these revenue
recognition policies.
We reduce home entertainment and software product revenues for estimated future returns of merchandise and
for customer programs and sales incentives. These estimates are based upon historical return experience, current
economic trends and projections of customer demand for and acceptance of our products. If we underestimate the level
of returns and concessions in a particular period, we may record less revenue in later periods when returns exceed the
estimated amount. Conversely, if we overestimate the level of returns and concessions for a period, we may have
additional revenue in later periods when returns and concessions are less than estimated.
Revenues from advance theme park ticket sales are recognized when the tickets are used. For non-expiring,
multi-day tickets, we recognize revenue over a three-year time period based on estimated usage, which is derived from
historical usage patterns. If actual usage is different than our estimated usage, revenues may not be recognized in the
periods the related services are rendered. In addition, a change in usage patterns would impact the timing of revenue
recognition.
Pension and Postretirement Medical Plan Actuarial Assumptions
The Company’s pension and postretirement medical benefit obligations and related costs are calculated using a
number of actuarial assumptions. Two critical assumptions, the discount rate and the expected return on plan assets,
are important elements of expense and/or liability measurement which we evaluate annually. Other assumptions
include the healthcare cost trend rate and employee demographic factors such as retirement patterns, mortality,
turnover and rate of compensation increase.
The discount rate enables us to state expected future cash payments for benefits as a present value on the
measurement date. A lower discount rate increases the present value of benefit obligations and increases pension
47
expense. The guideline for setting this rate is a high-quality long-term corporate bond rate. We decreased our discount
rate to 5.75% at the end of fiscal 2009 from 7.80% at the beginning of fiscal 2009 to reflect market interest rate conditions
at our October 3, 2009 measurement date. This decrease in the discount rate will affect net periodic pension and
postretirement medical expense in fiscal 2010. The assumed discount rate reflects market rates for high-quality
corporate bonds currently available. The Company’s discount rate was determined by considering the average of
pension yield curves constructed of a large population of high quality corporate bonds. The resulting discount rate
reflects the matching of plan liability cash flows to the yield curves. A one percentage point decrease in the assumed
discount rate would have increased total net periodic pension and postretirement medical expense for fiscal 2010 by
$169 million and would increase the projected benefit obligation at October 3, 2009 by $1.3 billion, respectively. A one
percentage point increase in the assumed discount rate would have decreased these amounts by $149 million and $1.1
billion, respectively.
To determine the expected long-term rate of return on the plan assets, we consider the current and expected asset
allocation, as well as historical and expected returns on each plan asset class. A lower expected rate of return on
pension plan assets will increase pension expense. Our long-term expected return on plan assets was 7.75% and 7.50%
for the 2009 and 2008 actuarial valuations, respectively. The increase in the rate used for the year end 2009 actuarial
valuation was due to changes in the ranges of expected returns on certain plan asset classes. A one percentage point
change in the long-term return on pension plan asset assumption would impact fiscal 2010 annual pension and
postretirement medical expense by approximately $57 million.
See Note 11 to the Consolidated Financial Statements for more information on our pension and postretirement
medical plans.
Goodwill, Intangible Assets and Investments
The Company is required to test goodwill and other indefinite-lived intangible assets for impairment on an
annual basis and between annual tests if current events or circumstances require an interim impairment assessment.
Goodwill is allocated to various reporting units, which are generally an operating segment or one reporting level below
the operating segment. The Company compares the fair value of each reporting unit to its carrying amount to
determine if there is potential goodwill impairment. If the fair value of a reporting unit is less than its carrying value,
an impairment loss is recorded to the extent that the fair value of the goodwill within the reporting unit is less than the
carrying value of its goodwill.
To determine the fair value of our reporting units, we generally use a present value technique (discounted cash
flow) corroborated by market multiples when available and as appropriate. We apply what we believe to be the most
appropriate valuation methodology for each of our reporting units. The discounted cash flow analyses are sensitive to
our estimates of future revenue growth and margins for these businesses. We include in the projected cash flows an
estimate of the revenue we believe the reporting unit would receive if the intellectual property developed by the
reporting unit that is being used by other reporting units was licensed to an unrelated third party at its fair market
value. These amounts are not necessarily the same as those included in segment operating results. We believe our
estimates of fair value are consistent with how a marketplace participant would value our reporting units.
In light of recent adverse economic conditions in the global economy, the Company’s long-term cash flow
projections are subject to a greater degree of uncertainty than usual. If we had established different reporting units or
utilized different valuation methodologies or assumptions, the impairment test results could differ, and we could be
required to record impairment charges. Because of the way the accounting rules work, a relatively modest reduction in
our estimate of the fair value of our Broadcasting reporting unit could result in a significant goodwill impairment
charge.
The Company is required to compare the fair values of other indefinite-lived intangible assets to their carrying
amounts. If the carrying amount of an indefinite-lived intangible asset exceeds its fair value, an impairment loss is
recognized. Fair values of other indefinite-lived intangible assets are determined based on discounted cash flows or
appraised values, as appropriate.
The Company has cost and equity investments. The fair value of these investments is dependent on the
performance of the investee companies, as well as volatility inherent in the external markets for these investments. In
assessing the potential impairment for these investments, we consider these factors, as well as the forecasted financial
performance of our investees and market values, where available. If these forecasts are not met or market values
indicate an other-than-temporary decline in value, impairment charges may be required.
48
During the current year, the Company tested its goodwill and other intangible assets, investments and long-lived
assets for impairment and recorded non-cash impairment charges of $279 million. The impairment charges include
$142 million for FCC radio licenses and $65 million for our investment in UTV. During fiscal years 2008 and 2007, the
Company recorded non-cash impairment charges of $39 million and $26 million, respectively, related to FCC radio
licenses. The FCC radio license impairment charges reflected overall market declines in certain radio markets in which
we operate. These impairment charges, which were estimated using a discounted cash flow model, were recorded in
“Restructuring and impairment charges” in the Consolidated Statements of Income.
Allowance for doubtful accounts
We evaluate our allowance for doubtful accounts and estimate collectibility of accounts receivable based on our
analysis of historical bad debt experience in conjunction with our assessment of the financial condition of individual
companies with which we do business. In light of the recent turmoil in the domestic and global economy that has
affected many companies, our estimates and judgments with respect to the collectibility of our receivables from these
companies have become subject to greater uncertainty than in more stable periods. If our estimate of uncollectible
accounts is too low, costs and expenses may increase in future periods, and if it is too high, cost and expenses may
decrease in future periods.
Contingencies and Litigation
We are currently involved in certain legal proceedings and, as required, have accrued estimates of the probable
and estimable losses for the resolution of these claims. These estimates have been developed in consultation with
outside counsel and are based upon an analysis of potential results, assuming a combination of litigation and
settlement strategies. It is possible, however, that future results of operations for any particular quarterly or annual
period could be materially affected by changes in our assumptions or the effectiveness of our strategies related to these
proceedings. See Note 15 to the Consolidated Financial Statements for more detailed information on litigation
exposure.
Income Tax Audits
As a matter of course, the Company is regularly audited by federal, state and foreign tax authorities. From time
to time, these audits result in proposed assessments. Our determinations regarding the recognition of income tax
benefits are made in consultation with outside tax and legal counsel where appropriate and are based upon the
technical merits of our tax positions in consideration of applicable tax statutes and related interpretations and
precedents and upon the expected outcome of proceedings (or negotiations) with taxing and legal authorities. The tax
benefits ultimately realized by the Company may differ from those recognized in our financial statements based on a
number of factors, including the Company’s decision to settle rather than litigate a matter, relevant legal precedent
related to similar matters and the Company’s success in supporting its filing positions with taxing authorities.
Stock Option Compensation Expense
Each year during the second quarter, the Company awards stock options and restricted stock units to a broadbased group of management and creative personnel (the Annual Grant). The Company uses a binomial valuation
model which takes into account variables such as volatility, dividend yield, and the risk-free interest rate. The binomial
valuation model also considers the expected exercise multiple (the multiple of exercise price to grant price at which
exercises are expected to occur on average) and the termination rate (the probability of a vested option being cancelled
due to the termination of the option holder) in computing the value of the option. Accordingly, the Company believes
that the binomial valuation model should produce a fair value that is representative of the value of an employee
option.
In fiscal years 2009, 2008, and 2007, the weighted average assumptions used in the options-pricing models were
as follows:
2008
2009
Risk-free interest rate
Expected volatility
Dividend yield
Termination rate
Exercise multiple
2.0
47
1.19
7.5
1.39
49
%
%
%
%
3.6
29
1.02
7.5
1.39
2007
%
%
%
%
4.5
26
0.79
7.4
1.38
%
%
%
%
Although the initial fair value of stock options is not adjusted after the grant date, changes in the Company’s
assumptions may change the value of, and therefore the expense related to, future stock option grants. The
assumptions that cause the greatest variation in fair value in the binomial valuation model are the expected volatility
and expected exercise multiple. Increases or decreases in either the expected volatility or expected exercise multiple
will cause the binomial option value to increase or decrease, respectively.
The volatility assumption considers both historical and implied volatility and may be impacted by the
Company’s performance as well as changes in economic and market conditions. See Note 13 to the Consolidated
Financial Statements for more detailed information. If the expected volatility of 47% used by the Company during 2009
was increased or decreased by five percentage points (i.e. to 52% or to 42%), the weighted average grant date fair value
of our 2009 stock option grants would have increased by 9% or decreased by 7%, respectively.
The expected exercise multiple may be influenced by the Company’s future stock performance, stock price
volatility, and employee turnover rates. If the exercise multiple assumption of 1.39 used by the Company during 2009
were increased to 1.6 or decreased to 1.2, the weighted average binomial value of our 2009 stock option grants would
have increased by 7% or decreased by 8%, respectively.
ACCOUNTING CHANGES
Revenue Arrangements with Multiple Deliverables
In October 2009, the Financial Accounting Standards Board (FASB) issued guidance on revenue arrangements
with multiple deliverables effective for the Company’s 2011 fiscal year, although early adoption is permitted. The
guidance revises the criteria for separating, measuring, and allocating arrangement consideration to each deliverable in
a multiple element arrangement. The guidance requires companies to allocate revenue using the relative selling price
of each deliverable, which must be estimated if there is no history of selling the deliverable on a stand-alone basis nor
third-party evidence of selling price. The Company is assessing the potential effect of this guidance on its financial
statements.
Transfers and Servicing of Financial Assets
In June 2009, the FASB issued guidance on transfers and servicing of financial assets to eliminate the concept of a
qualifying special-purpose entity, change the requirements for off balance sheet accounting for financial assets
including limiting the circumstances where off balance sheet treatment for a portion of a financial asset is allowable,
and require additional disclosures. The guidance is effective for the Company’s 2011 fiscal year. The Company does
not expect that the adoption of this guidance will have a material impact on its financial statements.
Variable Interest Entities
In June 2009, the FASB issued guidance to revise the approach to determine when a variable interest entity (VIE)
should be consolidated. The new consolidation model for VIEs considers whether the Company has the power to direct
the activities that most significantly impact the VIE’s economic performance and shares in the significant risks and
rewards of the entity. The guidance on VIE’s requires companies to continually reassess VIEs to determine if
consolidation is appropriate and provide additional disclosures. The guidance is effective for the Company’s 2011 fiscal
year. The Company is assessing the potential effect of this guidance on its financial statements.
Collaborative Arrangements
In December 2007, the FASB issued guidance that defines collaborative arrangements and establishes accounting
and reporting requirements for such arrangements. A collaborative arrangement is a contractual arrangement that
involves a joint operating activity, for example an agreement to co-produce and distribute a motion picture with
another studio. The guidance is effective for the Company’s 2010 fiscal year. The Company does not expect that the
adoption of the guidance on collaborative arrangements will have a material impact on its financial statements.
Business Combinations
In December 2007, the FASB issued guidance that establishes principles and requirements for determining how a
company recognizes and measures the fair value of certain assets and liabilities acquired in a business combination,
including noncontrolling interests, contingent consideration, and certain acquired contingencies. The guidance on
business combinations also requires acquisition-related transaction expenses and restructuring costs be expensed as
incurred rather than capitalized. This guidance will be applicable prospectively to business combinations beginning in
the Company’s 2010 fiscal year.
50
Noncontrolling Interest (Minority Interests)
In December 2007, the FASB issued guidance on the accounting and reporting for a noncontrolling interest in a
subsidiary. Upon adoption of this guidance, the Company will be required to report its noncontrolling interests as a
separate component of shareholders’ equity. The Company will also be required to present net income attributable to
the noncontrolling interests and net income attributable to the shareholders of the Company separately in its
consolidated statements of income. Currently, noncontrolling interests are reported between liabilities and
shareholders’ equity in the Company’s statement of financial position and the related income attributable to
non-controlling interests is reflected as an expense in arriving at net income. The guidance is effective for the
Company’s 2010 fiscal year and requires retroactive adoption of the presentation and disclosure requirements for
existing non-controlling interests. All other requirements are to be applied prospectively.
Employee Compensation – Retirement Benefits
In September 2006, the FASB issued guidance that requires recognition of the overfunded or underfunded status
of defined benefit pension and other postretirement plans as an asset or liability in the statement of financial position
and changes in that funded status to be recognized in comprehensive income in the year in which the changes occur.
The guidance on retirement benefits also requires measurement of the funded status of a plan as of the end of the fiscal
year. The Company adopted the recognition provision in fiscal year 2007 which resulted in a $261 million charge to
accumulated other comprehensive income. The Company adopted the measurement date provision by remeasuring
plan assets and benefit obligations at the beginning of fiscal 2009. Adoption of the measurement date provisions
resulted in a reduction of $35 million to retained earnings and a $100 million benefit to accumulated other
comprehensive income.
Key assumptions used for the measurement of pension and postretirement medical plans at the beginning of
fiscal 2009 were 7.80% for the discount rate, 7.50% for the rate of return on plan assets, and 5.00% for salary increases.
Based on this measurement of plan assets and benefit obligations, pension and postretirement medical costs decreased
to approximately $214 million for fiscal 2009 compared to $255 million for fiscal 2008. The decrease in pension and
postretirement medical expense was primarily due to an increase in the discount rate used to measure the present
value of plan obligations.
The Company remeasured plan assets and benefit obligations at October 3, 2009 in accordance with new
guidance on accounting for retirement plans. Key assumptions for the measurement at October 3, 2009 were 5.75% for
the discount rate, 7.75% for the rate of return on plan assets, and 4.50% for salary increases. Based on the measurement
at October 3, 2009, the Company recorded an increase in unrecognized pension and postretirement medical expense,
which totals $2.8 billion ($1.8 billion after-tax) as of October 3, 2009.
Income Tax
In July 2006, the FASB issued guidance which clarifies the accounting for income taxes by prescribing a
minimum probability threshold that a tax position must meet before a financial statement benefit is recognized. The
minimum threshold is defined as a tax position that is more likely than not to be sustained upon examination by the
applicable taxing authority, including resolution of any related appeals or litigation processes, based on the technical
merits of the position. The tax benefit to be recognized is measured as the largest amount of benefit that is greater than
fifty percent likely of being realized upon ultimate settlement. The Company adopted the guidance on income taxes at
the beginning of fiscal year 2008. Applying the guidance on income taxes to all tax positions upon adoption resulted in
reductions of $148 million and $15 million to opening retained earnings and minority interests, respectively.
FORWARD-LOOKING STATEMENTS
The Private Securities Litigation Reform Act of 1995 provides a safe harbor for forward-looking statements made
by or on behalf of the Company. We may from time to time make written or oral statements that are “forwardlooking,” including statements contained in this report and other filings with the Securities and Exchange Commission
and in reports to our shareholders. Such statements may, for example, express expectations or projections about future
actions that we may take, including restructuring or strategic initiatives, or about developments beyond our control
including changes in domestic or global economic conditions. These statements are made on the basis of management’s
views and assumptions as of the time the statements are made and we undertake no obligation to update these
statements. There can be no assurance, however, that our expectations will necessarily come to pass. Significant factors
affecting these expectations are set forth under Item 1A – Risk Factors of this Report on Form 10-K.
51
ITEM 7A. Quantitative and Qualitative Disclosures About Market Risk
The Company is exposed to the impact of interest rate changes, foreign currency fluctuations, commodity
fluctuations and changes in the market values of its investments.
Policies and Procedures
In the normal course of business, we employ established policies and procedures to manage the Company’s
exposure to changes in interest rates, foreign currencies, commodities, and the fair market value of certain investments
in debt and equity securities using a variety of financial instruments.
Our objectives in managing exposure to interest rate changes are to limit the impact of interest rate volatility on
earnings and cash flows and to lower overall borrowing costs. To achieve these objectives, we primarily use interest
rate swaps to manage net exposure to interest rate changes related to the Company’s portfolio of borrowings. By
policy, the Company targets fixed-rate debt as a percentage of its net debt between minimum and maximum
percentages.
Our objective in managing exposure to foreign currency fluctuations is to reduce volatility of earnings and cash
flow in order to allow management to focus on core business issues and challenges. Accordingly, the Company enters
into various contracts that change in value as foreign exchange rates change to protect the U.S. dollar equivalent value
of its existing foreign currency assets, liabilities, commitments, and forecasted foreign currency revenues and expenses.
The Company utilizes option strategies and forward contracts that provide for the purchase or sale of foreign
currencies to hedge probable, but not firmly committed, transactions. The Company also uses forward and option
contracts to hedge foreign currency assets and liabilities. The principal foreign currencies hedged are the Euro, British
pound, Japanese yen, and Canadian dollar. Cross-currency swaps are used to effectively convert foreign currency
denominated borrowings to U.S. dollar denominated borrowings. By policy, the Company maintains hedge coverage
between minimum and maximum percentages of its forecasted foreign exchange exposures generally for periods not to
exceed four years. The gains and losses on these contracts offset changes in the U.S. dollar equivalent value of the
related exposures.
Our objectives in managing exposure to commodity fluctuations are to use commodity derivatives to reduce
volatility of earnings and cash flows arising from commodity price changes. The amounts hedged using commodity
swap contracts are based on forecasted levels of consumption of certain commodities, such as fuel oil and gasoline.
It is the Company’s policy to enter into foreign currency and interest rate derivative transactions and other
financial instruments only to the extent considered necessary to meet its objectives as stated above. The Company does
not enter into these transactions or any other hedging transactions for speculative purposes.
Value at Risk (VAR)
The Company utilizes a VAR model to estimate the maximum potential one-day loss in the fair value of its
interest rate, foreign exchange, and market sensitive equity financial instruments. The VAR model estimates were
made assuming normal market conditions and a 95% confidence level. Various modeling techniques can be used in a
VAR computation. The Company’s computations are based on the interrelationships between movements in various
interest rates, currencies, and equity prices (a variance/co-variance technique). These interrelationships were
determined by observing interest rate, foreign currency, and equity market changes over the preceding quarter for the
calculation of VAR amounts at fiscal year end. The model includes all of the Company’s debt as well as all interest rate
and foreign exchange derivative contracts and market sensitive equity investments. Forecasted transactions, firm
commitments, and receivables and accounts payable denominated in foreign currencies, which certain of these
instruments are intended to hedge, were excluded from the model.
The VAR model is a risk analysis tool and does not purport to represent actual losses in fair value that will be
incurred by the Company, nor does it consider the potential effect of favorable changes in market factors.
VAR on a combined basis decreased to $34 million at October 3, 2009 from $68 million at September 27, 2008. The
decrease was primarily due to increased diversification benefits across financial instruments and lower volatility of
interest rates and foreign exchange rates.
52
The estimated maximum potential one-day loss in fair value, calculated using the VAR model, is as follows
(unaudited, in millions):
Fiscal Year 2009
Year end VAR
Average VAR
Highest VAR
Lowest VAR
Beginning of year VAR (year end fiscal 2008)
Interest Rate
Sensitive
Financial
Instruments
$
$
$
$
$
24
52
86
24
53
Currency
Sensitive
Financial
Instruments
$
$
$
$
$
19
23
33
19
24
Equity Sensitive
Financial
Instruments
$
$
$
$
$
0
1
1
0
1
Combined
Portfolio
$
$
$
$
$
34
66
100
34
68
The VAR for Euro Disney and Hong Kong Disneyland is immaterial as of October 3, 2009 and accordingly, has
been excluded from the above table.
ITEM 8. Financial Statements and Supplementary Data
See Index to Financial Statements and Supplemental Data on page 60.
ITEM 9. Changes in and Disagreements with Accountants on Accounting and Financial Disclosure
None.
ITEM 9A. Controls and Procedures
Evaluation of Disclosure Controls and Procedures
We have established disclosure controls and procedures to ensure that the information required to be disclosed
by the Company in the reports that it files or submits under the Securities Exchange Act of 1934 is recorded, processed,
summarized and reported within the time periods specified in SEC rules and forms and that such information is
accumulated and made known to the officers who certify the Company’s financial reports and to other members of
senior management and the Board of Directors as appropriate to allow timely decisions regarding required disclosure.
Based on their evaluation as of October 3, 2009, the principal executive officer and principal financial officer of
the Company have concluded that the Company’s disclosure controls and procedures (as defined in Rules 13a-15(e)
and 15d-15(e) under the Securities Exchange Act of 1934) are effective.
Management’s Report on Internal Control Over Financial Reporting
Management’s report set forth on page 61 is incorporated herein by reference.
Changes in Internal Controls
There have been no changes in our internal control over financial reporting during the fourth quarter of the fiscal
year ended October 3, 2009, that have materially affected, or are reasonably likely to materially affect, our internal
control over financial reporting.
ITEM 9B. Other Information
None.
53
PART III
ITEM 10. Directors, Executive Officers and Corporate Governance
Information regarding Section 16(a) compliance, the Audit Committee, the Company’s code of ethics and
background of the directors appearing under the captions “Section 16(a) Beneficial Ownership Reporting Compliance,”
“Committees,” “Corporate Governance Guidelines and Code of Ethics” and “Election of Directors” in the Company’s
Proxy Statement for the 2010 annual meeting of Shareholders is hereby incorporated by reference.
Information regarding executive officers is included in Part I of this Form 10-K as permitted by General
Instruction G(3).
ITEM 11. Executive Compensation
Information appearing under the captions “Board Compensation” and “Executive Compensation” in the 2010
Proxy Statement (other than the “Compensation Committee Report,” which is deemed furnished herein by reference) is
hereby incorporated by reference.
ITEM 12. Security Ownership of Certain Beneficial Owners and Management and Related Stockholder Matters
Information setting forth the security ownership of certain beneficial owners and management appearing under
the caption “Stock Ownership” and information in the “Equity Compensation Plans” table appearing under the caption
“Equity Compensation Plans” in the 2010 Proxy Statement is hereby incorporated by reference.
ITEM 13. Certain Relationships and Related Transactions, and Director Independence
Information regarding certain related transactions appearing under the captions “Certain Relationships and
Related Person Transactions” and information regarding director independence appearing under the caption “Director
Independence” in the 2010 Proxy Statement is hereby incorporated by reference.
ITEM 14. Principal Accountant Fees and Services
Information appearing under the captions “Auditor Fees and Services” and “Policy for Approval of Audit and
Permitted Non-Audit Services” in the 2010 Proxy Statement is hereby incorporated by reference.
54
PART IV
ITEM 15. Exhibits and Financial Statement Schedules
(1) Financial Statements and Schedules
See Index to Financial Statements and Supplemental Data at page 60.
(2) Exhibits
The documents set forth below are filed herewith or incorporated herein by reference to the location indicated.
Location
Exhibit
2.1
Agreement and Plan of Merger, by and among the
Company, Maverick Acquisition Sub, Inc., Maverick
Merger Sub, LLC and Marvel Entertainment, Inc.,
dated as of August 31, 2009.
Exhibit 2.1 to the Current Report on Form 8-K of the
Company dated August 31, 2009
3.1
Amended and Restated Certificate of Incorporation of
the Company
Annex C to the Joint Proxy Statement/ Prospectus
included in the Registration Statement on Form S-4
(No. 333-88105) of the Company, filed Sept. 30, 1999
3.2
Bylaws of the Company
Exhibit 3.1 to the Current Report on Form 8-K of the
Company dated June 29, 2007
4.1
Amended and Restated Five Year Credit Agreement
dated as of February 22, 2006
Exhibit 10.1 to the Current Report on Form 8-K of the
Company, filed March 31, 2006
4.2
Amended and Restated Four Year Credit Agreement
dated as of February 22, 2006
Exhibit 10.2 to the Current Report on Form 8-K of the
Company filed March 31, 2006
4.3
Indenture, dated as of Nov. 30, 1990, between DEI
and Bankers Trust Company, as Trustee
Exhibit 2 to the Current Report on Form 8-K of DEI,
dated Jan. 14, 1991
4.4
Indenture, dated as of Mar. 7, 1996, between the
Company and Citibank, N.A., as Trustee
Exhibit 4.1(a) to the Current Report on Form 8-K of
the Company, dated March 7, 1996
4.5
Senior Debt Securities Indenture, dated as of
September 24, 2001, between the Company and Wells
Fargo Bank, N.A., as Trustee
Exhibit 4.1 to the Current Report on Form 8-K of the
Company, dated September 24, 2001
4.6
Other long-term borrowing instruments are omitted
pursuant to Item 601(b)(4)(iii) of Regulation S-K. The
Company undertakes to furnish copies of such
instruments to the Commission upon request
10.1
Amended and Restated Employment Agreement,
dated as of December 23, 2008, between the Company
and Robert A. Iger
Exhibit 10.1 to the Form 10-Q of the Company for the
quarter ended December 27, 2008
10.2
Amended and Restated Employment Agreement,
dated as of December 18, 2008 between the Company
and Thomas O. Staggs
Exhibit 10.2 to the Form 10-Q of the Company for the
quarter ended December 27, 2008
10.3
Employment Agreement, dated as of October 1, 2008
between the Company and Alan N. Braverman
Exhibit 10.1 to the Current Report on Form 8-K of the
Company dated October 3, 2008
10.4
Employment Agreement dated as of October 1, 2008
between the Company and Kevin A. Mayer
Exhibit 10.1 to the Current Report on Form 8-K of the
Company dated October 3, 2008
10.5
Employment Agreement dated as of September 1,
2009 between the Company and Jayne Parker
Filed herewith
10.6
Description of Directors Compensation
Filed herewith
55
Exhibit
Location
10.7
Amended and Restated Director’s Retirement Policy
Exhibit 10.4 to the Current Report on Form 8-K of the
Company filed December 1, 2006
10.8
Form of Indemnification Agreement for certain
officers and directors
Annex C to the Proxy Statement for the 1987 annual
meeting of DEI
10.9
1995 Stock Option Plan for Non-Employee Directors
Exhibit 20 to the Form S-8 Registration Statement
(No. 33-57811) of DEI, dated Feb. 23, 1995
10.10
Amended and Restated 1995 Stock Incentive Plan
and Rules
Exhibit 10.17 to the Form 10-K of the Company for
the year ended September 27, 2008
10.11
Amendment to Amended and Restated 1995 Stock
Incentive Plan
Item 1.01(a) of Current Report on Form 8-K of the
Company filed September 23, 2004
10.12
Amended and Restated 2002 Executive Performance
Plan
Exhibit 10.1 to the Current Report on Form 8-K of the
Company, filed March 12, 2009
10.13
Management Incentive Bonus Program
The section of the Proxy Statement for the 2008
annual meeting of the Company titled “Annual
Bonus Incentives for Named Executive Officers”
10.14
Amended and Restated 1997 Non-Employee
Directors Stock and Deferred Compensation Plan
Annex II to the Proxy Statement for the 2003 annual
meeting of the Company
10.15
Amended and Restated 2005 Stock Incentive Plan
Annex A to the Proxy Statement for the 2009 annual
meeting of the Company
10.16
The Walt Disney Company/Pixar 1995 Stock Plan
Exhibit 10.1 to the Form S-8 Registration Statement
(N0. 333-133840) of the Company dated May 5, 2006
10.17
Amended and Restated The Walt Disney Company/
Pixar 2004 Equity Incentive Plan
Exhibit 10.1 to the Current Report on Form 8-K of the
Company filed December 1, 2006
10.18
Amended and Restated Key Employees Deferred
Compensation and Retirement Plan
Exhibit 10.28 to the Form 10-K of the Company for
the year ended September 27, 2008
10.19
Amended and Restated Benefit Equalization Plan of
ABC, Inc.
Exhibit 10.29 to the Form 10-K of the Company for
the year ended September 27, 2008
10.20
Group Personal Excess Liability Insurance Plan
Exhibit 10(x) to the Form 10-K of the Company for
the period ended September 30, 1997
10.21
Family Income Assurance Plan (summary
description)
Exhibit 10(y) to the Form 10-K of the Company for
the period ended September 30, 1997
10.22
Amended and Restated Severance Pay Plan
Exhibit 10.4 to the Form 10-Q of the Company for the
quarter ended December 27, 2008
10.23
Form of Restricted Stock Unit Award Agreement
(Time-Based Vesting)
Exhibit 10(aa) to the Form 10-K of the Company for
the period ended September 30, 2004
10.24
Form of Restricted Stock Unit Award Agreement
(Bonus Related)
Exhibit 10.3 to the Current Report on Form 8-K of the
Company filed December 15, 2006
10.25
Form of Performance-Based Stock Unit Award
Exhibit 10.5 to the Form 10-Q of the Company for the
quarter ended December 27, 2008
10.26
Form of Performance-Based Stock Unit Award
Agreement (Dual Performance Goals)
Exhibit 10.1 to the Current Report on Form 8-K of the
Company filed December 15, 2006
10.27
Form of Performance-Based Stock Unit Award
Agreement (Total Shareholder Return/Average
Annual Adjusted EPS Growth Goals)
Exhibit 10.5 to the Form 10-Q of the Company for the
period ended December 29, 2007
56
Exhibit
Location
10.28
Form of Non-Qualified Stock Option Award
Agreement (Seven-year Form)
Exhibit 10.3 to the Form 10-Q of the Company for the
period ended March 28, 2009
10.29
Form of Restricted Stock Unit Award Agreement in
Lieu of Equitable Adjustment
Exhibit 10.1 to the Form 10-Q of the Company for the
period ended June 30, 2007
10.30
Voting Agreement, by and between The Walt Disney
Company and Mr. Isaac Perlmutter, dated as of
August 31, 2009
Exhibit 10.1 to the Current Report on Form 8-K of the
Company dated August 31, 2009
21
Subsidiaries of the Company
Filed herewith
23
Consent of PricewaterhouseCoopers LLP
Filed herewith
31(a)
Rule 13a – 14(a) Certification of Chief Executive
Officer of the Company in accordance with Section
302 of the Sarbanes-Oxley Act of 2002
Filed herewith
31(b)
Rule 13a-14(a) Certification of Chief Financial Officer
of the Company in accordance with Section 302 of the
Sarbanes-Oxley Act of 2002
Filed herewith
32(a)
Section 1350 Certification of Chief Executive Officer
of the Company in accordance with Section 906 of the
Sarbanes-Oxley Act of 2002*
Furnished herewith
32(b)
Section 1350 Certification of Chief Financial Officer of
the Company in accordance with Section 906 of the
Sarbanes-Oxley Act of 2002*
Furnished herewith
101
The following materials from the Company’s Annual
Report on Form 10-K for the year ended October 3,
2009 formatted in Extensible Business Reporting
Language (XBRL): (i) the Consolidated Statements of
Income, (ii) the Consolidated Balance Sheets, (iii) the
Consolidated Statements of Cash Flows, (iv) the
Consolidated Statements of Shareholders’ Equity and
(v) related notes, tagged as blocks of text
Furnished herewith
* A signed original of this written statement required by Section 906 has been provided to the Company and will be
retained by the Company and furnished to the Securities and Exchange Commission or its staff upon request.
57
SIGNATURES
Pursuant to the requirements of Section 13 or 15(d) of the Securities Exchange Act of 1934, the registrant has duly
caused this report to be signed on its behalf by the undersigned, thereunto duly authorized.
THE WALT DISNEY COMPANY
(Registrant)
Date: December 2, 2009
By: /s/ ROBERT A. IGER
(Robert A. Iger, President and Chief
Executive Officer)
Pursuant to the requirements of the Securities Exchange Act of 1934, this report has been signed below by the
following persons on behalf of the registrant and in the capacities and on the dates indicated.
Title
Signature
Date
Principal Executive Officer
/s/ ROBERT A. IGER
(Robert A. Iger)
President and Chief Executive Officer
December 2, 2009
Principal Financial and Accounting Officers
/s/ THOMAS O. STAGGS
(Thomas O. Staggs)
Senior Executive Vice President and Chief
Financial Officer
December 2, 2009
/s/ BRENT A. WOODFORD
(Brent A. Woodford)
Senior Vice President-Planning and Control
December 2, 2009
Director
December 2, 2009
/s/ JOHN E. BRYSON
(John E. Bryson)
Director
December 2, 2009
/s/ JOHN S. CHEN
(John S. Chen)
Director
December 2, 2009
/s/ JUDITH L. ESTRIN
(Judith L. Estrin)
Director
December 2, 2009
/s/ ROBERT A. IGER
(Robert A. Iger)
Director
December 2, 2009
/s/ STEVEN P. JOBS
(Steven P. Jobs)
Director
December 2, 2009
/s/ FRED H. LANGHAMMER
(Fred H. Langhammer)
Director
December 2, 2009
/s/ AYLWIN B. LEWIS
(Aylwin B. Lewis)
Director
December 2, 2009
Directors
/s/ SUSAN E. ARNOLD
(Susan E. Arnold)
58
Signature
Title
Date
/s/ MONICA C. LOZANO
(Monica C. Lozano)
Director
December 2, 2009
/s/ ROBERT W. MATSCHULLAT
(Robert W. Matschullat)
Director
December 2, 2009
/s/ JOHN E. PEPPER, JR.
(John E. Pepper, Jr.)
Chairman of the Board and Director
December 2, 2009
/s/ ORIN C. SMITH
(Orin C. Smith)
Director
December 2, 2009
59
THE WALT DISNEY COMPANY AND SUBSIDIARIES
INDEX TO FINANCIAL STATEMENTS AND SUPPLEMENTAL DATA
Page
Management’s Report on Internal Control Over Financial Reporting . . . . . . . . . . . . . . . . . . . . . . . . . . . . . . . . . . . . . . .
61
Report of Independent Registered Public Accounting Firm . . . . . . . . . . . . . . . . . . . . . . . . . . . . . . . . . . . . . . . . . . . . . . .
62
Consolidated Financial Statements of The Walt Disney Company and Subsidiaries
Consolidated Statements of Income for the Years Ended October 3, 2009, September 27, 2008, and
September 29, 2007 . . . . . . . . . . . . . . . . . . . . . . . . . . . . . . . . . . . . . . . . . . . . . . . . . . . . . . . . . . . . . . . . . . . . . . . . . . . .
63
Consolidated Balance Sheets as of October 3, 2009 and September 27, 2008 . . . . . . . . . . . . . . . . . . . . . . . . . . . . . .
64
Consolidated Statements of Cash Flows for the Years Ended October 3, 2009, September 27, 2008, and
September 29, 2007 . . . . . . . . . . . . . . . . . . . . . . . . . . . . . . . . . . . . . . . . . . . . . . . . . . . . . . . . . . . . . . . . . . . . . . . . . . . .
65
Consolidated Statements of Shareholders’ Equity for the Years Ended October 3, 2009, September 27, 2008,
and September 29, 2007 . . . . . . . . . . . . . . . . . . . . . . . . . . . . . . . . . . . . . . . . . . . . . . . . . . . . . . . . . . . . . . . . . . . . . . . .
66
Notes to Consolidated Financial Statements . . . . . . . . . . . . . . . . . . . . . . . . . . . . . . . . . . . . . . . . . . . . . . . . . . . . . . . .
67
All schedules are omitted for the reason that they are not applicable or the required information is included in
the financial statements or notes.
60
MANAGEMENT’S REPORT ON INTERNAL CONTROL OVER FINANCIAL REPORTING
Management is responsible for establishing and maintaining adequate internal control over financial reporting,
as such term is defined in Exchange Act Rule 13a-15(f). The Company’s internal control over financial reporting
includes those policies and procedures that (i) pertain to the maintenance of records that, in reasonable detail,
accurately and fairly reflect the transactions and dispositions of the assets of the Company; (ii) provide reasonable
assurance that transactions are recorded as necessary to permit preparation of financial statements in accordance with
generally accepted accounting principles, and that receipts and expenditures of the Company are being made only in
accordance with authorizations of management and directors of the Company; and (iii) provide reasonable assurance
regarding prevention or timely detection of unauthorized acquisition, use, or disposition of the Company’s assets that
could have a material effect on the financial statements.
Internal control over financial reporting is designed to provide reasonable assurance regarding the reliability of
financial reporting and the preparation of financial statements prepared for external purposes in accordance with
generally accepted accounting principles. Because of its inherent limitations, internal control over financial reporting
may not prevent or detect misstatements. Also, projections of any evaluation of effectiveness to future periods are
subject to the risk that controls may become inadequate because of changes in conditions, or that the degree of
compliance with the policies or procedures may deteriorate.
Under the supervision and with the participation of management, including our principal executive officer and
principal financial officer, we conducted an evaluation of the effectiveness of our internal control over financial
reporting based on the framework in Internal Control – Integrated Framework issued by the Committee of Sponsoring
Organizations of the Treadway Commission. Based on our evaluation under the framework in Internal Control –
Integrated Framework, management concluded that our internal control over financial reporting was effective as of
October 3, 2009.
The effectiveness of our internal control over financial reporting as of October 3, 2009 has been audited by
PricewaterhouseCoopers LLP, an independent registered public accounting firm, as stated in their report which is
included herein.
61
REPORT OF INDEPENDENT REGISTERED PUBLIC ACCOUNTING FIRM
To the Board of Directors and Shareholders of The Walt Disney Company
In our opinion, the accompanying consolidated balance sheets and the related consolidated statements of income,
shareholders’ equity and cash flows present fairly, in all material respects, the financial position of The Walt Disney
Company and its subsidiaries (the Company) at October 3, 2009 and September 27, 2008, and the results of their
operations and their cash flows for each of the three years in the period ended October 3, 2009 in conformity with
accounting principles generally accepted in the United States of America. Also in our opinion, the Company
maintained, in all material respects, effective internal control over financial reporting as of October 3, 2009, based on
criteria established in Internal Control – Integrated Framework issued by the Committee of Sponsoring Organizations of
the Treadway Commission (COSO). The Company’s management is responsible for these financial statements, for
maintaining effective internal control over financial reporting and for its assessment of the effectiveness of internal
control over financial reporting, included in the accompanying Management’s Report on Internal Control over
Financial Reporting. Our responsibility is to express opinions on these financial statements and on the Company’s
internal control over financial reporting based on our integrated audits. We conducted our audits in accordance with
the standards of the Public Company Accounting Oversight Board (United States). Those standards require that we
plan and perform the audits to obtain reasonable assurance about whether the financial statements are free of material
misstatement and whether effective internal control over financial reporting was maintained in all material respects.
Our audits of the financial statements included examining, on a test basis, evidence supporting the amounts and
disclosures in the financial statements, assessing the accounting principles used and significant estimates made by
management, and evaluating the overall financial statement presentation. Our audit of internal control over financial
reporting included obtaining an understanding of internal control over financial reporting, assessing the risk that a
material weakness exists, and testing and evaluating the design and operating effectiveness of internal control based on
the assessed risk. Our audits also included performing such other procedures as we considered necessary in the
circumstances. We believe that our audits provide a reasonable basis for our opinions.
As discussed in Notes 2 and 3 to the consolidated financial statements, the Company changed its method of accounting
for uncertainty in income taxes in 2008 and its method of accounting for pension and other postretirement benefit plans
in 2007 and 2009.
A company’s internal control over financial reporting is a process designed to provide reasonable assurance regarding
the reliability of financial reporting and the preparation of financial statements for external purposes in accordance
with generally accepted accounting principles. A company’s internal control over financial reporting includes those
policies and procedures that (i) pertain to the maintenance of records that, in reasonable detail, accurately and fairly
reflect the transactions and dispositions of the assets of the company; (ii) provide reasonable assurance that
transactions are recorded as necessary to permit preparation of financial statements in accordance with generally
accepted accounting principles, and that receipts and expenditures of the company are being made only in accordance
with authorizations of management and directors of the company; and (iii) provide reasonable assurance regarding
prevention or timely detection of unauthorized acquisition, use, or disposition of the company’s assets that could have
a material effect on the financial statements.
Because of its inherent limitations, internal control over financial reporting may not prevent or detect misstatements.
Also, projections of any evaluation of effectiveness to future periods are subject to the risk that controls may become
inadequate because of changes in conditions, or that the degree of compliance with the policies or procedures may
deteriorate.
PRICEWATERHOUSECOOPERS LLP
Los Angeles, California
December 2, 2009
62
CONSOLIDATED STATEMENTS OF INCOME
(in millions, except per share data)
2008
2009
Revenues
$
Costs and expenses
Restructuring and impairment charges
Other income (expense)
Net interest expense
Equity in the income of investees
Income from continuing operations before income
taxes and minority interests
Income taxes
Minority interests
36,149
$
2007
37,843
$
35,510
(30,452)
(30,400)
(28,655)
(492)
(39)
(26)
342
(59)
(466)
(524)
(593)
577
581
485
5,658
7,402
7,725
(2,049)
(2,673)
(2,874)
(302)
(302)
(177)
1,004
Income from continuing operations
3,307
4,427
4,674
Discontinued operations, net of tax
—
—
13
Net income
$
3,307
$
4,427
$
4,687
Diluted Earnings per share:
Earnings per share, continuing operations
$
1.76
$
2.28
$
2.24
Earnings per share, discontinued operations
Earnings per share
Basic Earnings per share:
Earnings per share, continuing operations
0.01
$
1.76
$
2.28
$
2.25
$
1.78
$
2.34
$
2.33
Earnings per share, discontinued operations
Earnings per share
—
—
—
—
$
Weighted average number of common and
common equivalent shares outstanding:
Diluted
Basic
1.78
2.34
$
2.34
1,875
1,948
2,092
1,856
1,890
2,004
See Notes to Consolidated Financial Statements
63
$
0.01
CONSOLIDATED BALANCE SHEETS
(in millions, except per share data)
October 3,
2009
September 27,
2008
ASSETS
Current assets
Cash and cash equivalents
Receivables
Inventories
Television costs
Deferred income taxes
Other current assets
$
Total current assets
Film and television costs
Investments
Parks, resorts and other property, at cost
Attractions, buildings and equipment
Accumulated depreciation
Projects in progress
Land
Intangible assets, net
Goodwill
Other assets
3,417
4,854
1,271
631
1,140
576
$
3,001
5,373
1,124
541
1,024
603
11,889
11,666
5,125
2,554
5,394
2,249
32,475
(17,395)
31,493
(16,310)
15,080
1,350
1,167
15,183
1,169
1,180
17,597
17,532
2,247
21,683
2,022
2,428
21,465
1,763
$
63,117
$
62,497
$
5,616
1,206
2,112
$
5,980
3,529
2,082
LIABILITIES AND SHAREHOLDERS’ EQUITY
Current liabilities
Accounts payable and other accrued liabilities
Current portion of borrowings
Unearned royalties and other advances
Total current liabilities
Borrowings
Deferred income taxes
Other long-term liabilities
Minority interests
Commitments and contingencies (Note 15)
Shareholders’ equity
Preferred stock, $.01 par value Authorized – 100 million shares,
Issued – none
Common stock, $.01 par value Authorized – 3.6 billion shares,
Issued – 2.6 billion shares
Retained earnings
Accumulated other comprehensive loss
Treasury stock, at cost, 781.7 million shares at October 3, 2009 and
777.1 million shares at September 27, 2008
$
See Notes to Consolidated Financial Statements
64
8,934
11,591
11,495
1,819
5,444
1,691
11,110
2,350
3,779
1,344
—
—
27,038
31,033
(1,644)
26,546
28,413
(81)
56,427
54,878
(22,693)
(22,555)
33,734
32,323
63,117
$
62,497
CONSOLIDATED STATEMENTS OF CASH FLOWS
(in millions)
2008
2009
OPERATING ACTIVITIES OF CONTINUING OPERATIONS
Net income
Income from discontinued operations
Depreciation and amortization
Gains on sales of equity investments and businesses
Deferred income taxes
Equity in the income of investees
Cash distributions received from equity investees
Minority interests
Net change in film and television costs
Equity-based compensation
Impairment charges
Other
Changes in operating assets and liabilities
Receivables
Inventories
Other assets
Accounts payable and other accrued liabilities
Income taxes
$
3,307
—
1,631
(342)
323
(577)
505
302
(43)
457
279
(247)
$
INVESTING ACTIVITIES OF CONTINUING OPERATIONS
Investments in parks, resorts and other property
Sales of investments
Proceeds from sales of equity investments and businesses
Acquisitions
Other
Cash used in continuing investing activities
FINANCING ACTIVITIES OF CONTINUING OPERATIONS
Commercial paper borrowings, net
Borrowings
Reduction of borrowings
Dividends
Repurchases of common stock
Exercise of stock options and other
Cash used in continuing financing activities
Increase/(decrease) in cash and cash equivalents
Cash and cash equivalents, beginning of year
4,687
(13)
1,491
(1,052)
(137)
(485)
420
177
115
419
26
(91)
(355)
52
9
77
58
5,064
5,446
5,398
(1,753)
46
185
(517)
(57)
(1,578)
70
14
(660)
(8)
(1,566)
5
1,530
(608)
21
(2,096)
(2,162)
(618)
(1,985)
1,750
(1,617)
(648)
(138)
86
(701)
1,706
(477)
(664)
(4,453)
636
1,847
3,143
(2,294)
(637)
(6,923)
1,245
(3,953)
(2,552)
CASH FLOWS OF DISCONTINUED OPERATIONS
Net cash provided by operating activities of discontinued
operations
Net cash used in investing activities of discontinued
operations
Net cash provided by financing activities of discontinued
operations
$
(594)
(329)
(64)
488
(50)
468
(117)
(565)
(325)
8
Cash provided by continuing operations
4,427
—
1,582
(14)
(128)
(581)
476
302
(301)
402
39
(209)
2007
(3,619)
—
—
23
—
—
(3)
—
—
78
(669)
3,670
416
3,001
1,259
2,411
Cash and cash equivalents, end of year
$
3,417
$
3,001
$
3,670
Supplemental disclosure of cash flow information:
Interest paid
$
485
$
555
$
551
Income taxes paid
$
1,609
$
2,768
$
2,796
See Notes to Consolidated Financial Statements
65
CONSOLIDATED STATEMENTS OF SHAREHOLDERS’ EQUITY
(in millions, except per share data)
Shares
BALANCE AT SEPTEMBER 30, 2006
Net income
Market value adjustments for investments
and hedges
Foreign currency translation and other
Increase in minimum pension liability
adjustment
2,062
—
Comprehensive income
Exercise of stock options and issuance of
restricted stock and stock options
Common stock repurchases
Dividends ($0.31 per share)
Adoption of new benefit plan accounting
guidance (net of tax of $154 million)
Distribution of ABC Radio business
22,377
—
$
20,630
4,687
$
(8)
—
Treasury
Stock
$
(11,179)
—
Total
Shareholders’
Equity
$
31,820
4,687
—
—
—
—
—
—
(71)
77
—
—
(71)
77
—
—
—
106
—
106
57
(202)
—
1,823
—
7
—
—
1,917
—
Comprehensive income
Exercise of stock options and issuance of
restricted stock and stock options
Redemption of convertible senior notes
Common stock repurchases
Dividends ($0.35 per share)
Adoption of new income tax guidance
—
—
$
24,207
—
$
—
—
(644)
—
—
—
—
132
(261)
—
24,805
4,427
$
(157)
—
—
(6,923)
—
1,823
(6,923)
(637)
—
—
$
(18,102)
—
(261)
132
$
30,753
4,427
—
—
—
—
—
—
120
(27)
—
—
120
(27)
—
—
—
25
(42)
—
25
(42)
4,503
31
45
(139)
—
—
BALANCE AT SEPTEMBER 27, 2008
Net income
Market value adjustments for investments
and hedges
Foreign currency translation and other
Pension and postretirement medical plan
adjustments:
Reclassification of prior net gains to net
income
Net actuarial loss
BALANCE AT OCTOBER 3, 2009
$
Retained
Earnings
4,799
BALANCE AT SEPTEMBER 29, 2007
Net income
Market value adjustments for investments
and hedges
Foreign currency translation and other
Pension and postretirement medical plan
adjustments:
Reclassification of prior losses to net
income
Net actuarial loss
Comprehensive income
Adoption of new pension and postretirement
medical plan measurement date and other
(net of tax of $37 million)
Exercise of stock options and issuance of
restricted stock and stock options
Common stock repurchases
Dividends ($0.35 per share)
Common
Stock
Accumulated
Other
Comprehensive
Income
(Loss)
1,854
—
1,012
1,320
—
7
—
$
26,546
—
—
—
—
(671)
(148)
$
28,413
3,307
—
—
—
—
—
$
(81)
—
—
—
(4,453)
—
—
$
(22,555)
—
1,012
1,320
(4,453)
(664)
(148)
$
32,323
3,307
—
—
—
—
—
—
(57)
(33)
—
—
(57)
(33)
—
—
—
—
—
—
(4)
(1,569)
—
—
(4)
(1,569)
1,644
—
—
(32)
100
—
68
12
(5)
—
485
—
7
—
—
(655)
—
—
—
—
(138)
—
485
(138)
(648)
1,861
$
27,038
$
31,033
$
See Notes to Consolidated Financial Statements
66
(1,644)
$
(22,693)
$
33,734
NOTES TO CONSOLIDATED FINANCIAL STATEMENTS
(Tabular dollars in millions, except per share amounts)
1
Description of the Business and Segment Information
The Walt Disney Company, together with the subsidiaries through which businesses are conducted (the
Company), is a diversified worldwide entertainment company with operations in the following business segments:
Media Networks, Parks and Resorts, Studio Entertainment, Consumer Products and Interactive Media.
DESCRIPTION OF THE BUSINESS
Media Networks
The Company operates the ABC Television Network and ten owned television stations, as well as the ESPN
Radio Network and Radio Disney Network (the Radio Networks) and 46 owned radio stations. Both the television and
radio networks have affiliated stations providing coverage to households throughout the United States. The Company
has cable networks that are principally involved in the production and distribution of cable television programming,
the licensing of programming in domestic and international markets, and investing in foreign television broadcasting,
production, and distribution entities. Primary cable programming services that operate through consolidated
subsidiaries are the ESPN-branded networks, Disney Channel Worldwide, SOAPnet, Disney XD and ABC Family.
Other programming services that operate through a joint venture and are accounted for under the equity method
include A&E Television Networks and Lifetime Entertainment Services. The Company also produces original
television programming for network, first-run syndication, pay, and international syndication markets, along with
original animated television programming for network, pay, and international syndication markets. Additionally, the
Company operates ABC-, ESPN-, ABC Family- and SOAPnet-branded internet businesses.
On June 12, 2007, the Company completed the spin-off of its wholly owned subsidiary, ABC Radio Holdings,
Inc., and its merger into a subsidiary of Citadel Broadcasting Corporation (Citadel). Prior to the spin-off, the Company
consolidated its ABC Radio Business, consisting of 22 large-market radio stations and the ABC Radio Network
businesses, under ABC Radio Holdings, Inc. The transaction did not include the Company’s ESPN Radio or Radio
Disney network and station businesses. Additional information regarding this transaction is included in Note 5.
Parks and Resorts
The Company owns and operates the Walt Disney World Resort in Florida and the Disneyland Resort in
California. The Walt Disney World Resort includes four theme parks (the Magic Kingdom, Epcot, Disney’s Hollywood
Studios, and Disney’s Animal Kingdom), 17 resort hotels, a retail, dining, and entertainment complex, a sports
complex, conference centers, campgrounds, golf courses, water parks, and other recreational facilities. The Disneyland
Resort includes two theme parks (Disneyland and Disney’s California Adventure), three resort hotels, and a retail,
dining and entertainment complex. The Company manages and has an effective 51% ownership interest in Disneyland
Paris, which includes two theme parks (Disneyland Park and Walt Disney Studios Park), seven themed hotels, two
convention centers, a shopping, dining and entertainment complex, and a 27-hole golf facility. The Company also
manages and has a 47% ownership interest in Hong Kong Disneyland Resort, which includes one theme park and two
resort hotels. The Company earns royalties on revenues generated by the Tokyo Disneyland Resort, which includes
two theme parks and three Disney-branded hotels, and is owned and operated by an unrelated Japanese corporation.
The Company also manages and markets vacation club ownership interests through the Disney Vacation Club,
operates the Disney Cruise Line out of Port Canaveral, Florida, and Adventures by Disney. The Company’s Walt
Disney Imagineering unit designs and develops new theme park concepts and attractions, as well as resort properties.
Studio Entertainment
The Company produces and acquires live-action and animated motion pictures for worldwide distribution to the
theatrical, home entertainment, and television markets. The Company distributes these products through its own
distribution and marketing companies in the United States and foreign markets primarily under the Walt Disney
Pictures, Touchstone Pictures, Miramax, Pixar, and Disneynature banners, as well as Dimension for titles released prior
to September 30, 2005. The Company also produces stage plays, musical recordings and live entertainment events.
67
Consumer Products
The Company licenses the name “Walt Disney,” as well as the Company’s characters and visual and literary
properties, to various manufacturers, retailers, show promoters, and publishers throughout the world. The Company
also engages in retail and online distribution of products through The Disney Store and DisneyStore.com. The Disney
Store is owned and operated in Europe and North America and franchised in Japan. The Company publishes
entertainment and educational books and magazines for children and families.
Disney Interactive Media Group
The Company creates and delivers Disney-branded entertainment and lifestyle content across interactive media
platforms. The primary operating businesses are Disney Interactive Studios, which produces video games for global
distribution, and Disney Online, which produces web sites and online virtual worlds in the United States and
internationally. The Interactive Media Group also manages Disney-branded mobile phone initiatives.
SEGMENT INFORMATION
The operating segments reported below are the segments of the Company for which separate financial
information is available and for which segment results are evaluated regularly by the Chief Executive Officer in
deciding how to allocate resources and in assessing performance.
Segment operating results reflect earnings before corporate and unallocated shared expenses, restructuring and
impairment charges, other income (expense), net interest expense, income taxes, and minority interests. Segment
operating income includes equity in the income of investees. Equity investees consist primarily of AETN/Lifetime,
which is a cable business included in the Media Networks segment. Corporate and unallocated shared expenses
principally consist of corporate functions, executive management, and certain unallocated administrative support
functions.
Equity in the income of investees by segment is as follows:
2008
2009
Media Networks
Studio Entertainment
Consumer Products
Interactive Media
Corporate
(1)
(1)
$
567
(4)
2
2
10
$
596
—
—
(3)
(12)
$
484
—
—
—
1
$
577
$
581
$
485
Substantially all of these amounts relate to investments at Cable Networks.
68
2007
The following segment results include allocations of certain costs, including information technology, pension,
legal, and other shared services costs, which are allocated based on metrics designed to correlate with consumption.
These allocations are agreed-upon amounts between the businesses and may differ from amounts that would be
negotiated in arm’s length transactions. In addition, all significant intersegment transactions have been eliminated
except that Studio Entertainment revenues and operating income include an allocation of Consumer Products and
Interactive Media revenues, which is meant to reflect royalties on sales of merchandise based on certain Studio film
properties.
2008
2009
Revenues
Media Networks
Parks and Resorts
Studio Entertainment
Third parties
Intersegment
$
Consumer Products
Third parties
Intersegment
Interactive Media
Third parties
Intersegment
Total consolidated revenues
Segment operating income (loss)
Media Networks
Parks and Resorts
Studio Entertainment
Consumer Products
Interactive Media
Total segment operating income
Reconciliation of segment operating income to income
from continuing operations before income taxes and
minority interests
Segment operating income
Corporate and unallocated shared expenses
Restructuring and impairment charges
Other income (expense)
Net interest expense
Income from continuing operations
before income taxes and minority
interests
$
16,209
10,667
$
15,857
11,504
2007
$
14,913
10,626
6,016
120
7,167
181
7,308
183
6,136
7,348
7,491
2,533
(108)
2,569
(154)
2,140
(150)
2,425
2,415
1,990
724
(12)
746
(27)
523
(33)
712
719
490
36,149
$
37,843
$
35,510
$
4,765
1,418
175
609
(295)
$
4,981
1,897
1,086
778
(258)
$
4,534
1,710
1,195
689
(291)
$
6,672
$
8,484
$
7,837
$
6,672
(398)
(492)
342
(466)
$
8,484
(460)
(39)
(59)
(524)
$
7,837
(497)
(26)
1,004
(593)
$
5,658
$
7,402
$
7,725
69
2008
2009
Capital expenditures from continuing operations
Media Networks
Cable Networks
Broadcasting
Parks and Resorts
Domestic
International
Studio Entertainment
Consumer Products
Interactive Media
Corporate
Total capital expenditures from
continuing operations
Depreciation expense from continuing operations
Media Networks
Parks and Resorts
Domestic
International
Studio Entertainment
Consumer Products
Interactive Media
Corporate
Total depreciation expense from
continuing operations
Identifiable assets (1)(2)
Media Networks
Parks and Resorts
Studio Entertainment
Consumer Products
Interactive Media
Corporate (3)
Total consolidated assets
Supplemental revenue data
Media Networks
Advertising (4)
Affiliate Fees
Parks and Resorts
Merchandise, food and beverage
Admissions
Revenues
United States and Canada
Europe
Asia Pacific
Latin America and Other
Segment operating income
United States and Canada
Europe
Asia Pacific
Latin America and Other
$
151
143
$
206
132
2007
$
793
140
126
51
40
90
1,039
143
135
46
21
75
127
106
816
256
85
30
38
108
$
1,753
$
1,578
$
1,566
$
197
$
179
$
168
803
342
41
18
21
123
822
326
50
29
28
128
$
1,580
$
1,527
$
26,936
16,945
11,104
1,278
988
5,866
$
26,786
16,916
11,123
1,393
987
5,292
$
63,117
$
62,497
$
6,624
7,407
$
7,197
6,793
790
304
31
16
18
132
$
1,459
$
7,112
6,139
3,653
3,623
3,445
3,403
3,454
3,342
$
27,508
6,012
1,860
769
$
28,506
6,805
1,811
721
$
27,286
5,898
1,732
594
$
36,149
$
37,843
$
35,510
$
4,923
1,158
430
161
$
6,500
1,423
386
175
$
6,052
1,192
437
156
$
6,672
$
8,484
$
7,837
70
2008
2009
Long-lived assets
United States and Canada
Europe
Asia Pacific
Latin America and Other
(5)
(1)
$
43,570
3,708
1,805
188
$
43,521
3,923
1,786
189
$
49,271
$
49,419
Identifiable assets include amounts associated with equity method investments. Equity method investments by
segment are as follows:
2008
2009
Media Networks
Studio Entertainment
Corporate
(2)
$
2,166
2
5
$
1,861
6
6
$
2,173
$
1,873
Goodwill and intangible assets by segment are as follows:
2008
2009
Media Networks
Parks and Resorts
Studio Entertainment
Consumer Products
Interactive Media
Corporate
$
17,438
172
5,032
410
650
228
$
17,340
172
5,021
446
677
237
$
23,930
$
23,893
(3)
Primarily deferred tax assets, investments, fixed assets, and other assets.
(4)
Advertising revenue includes amounts reported in Interactive Media.
(5)
Long-lived assets include total assets less current assets, financial investments and derivatives recorded in other
non-current assets.
2
Summary of Significant Accounting Policies
Principles of Consolidation
The consolidated financial statements of the Company include the accounts of The Walt Disney Company and its
majority-owned and controlled subsidiaries. Intercompany accounts and transactions have been eliminated in
consolidation. In December 1999, DVD Financing, Inc. (DFI), a subsidiary of Disney Vacation Development, Inc. and an
indirect subsidiary of the Company, completed a receivable sale transaction that established a facility that permits DFI
to sell receivables arising from the sale of vacation club memberships on a periodic basis. In connection with this
facility, DFI prepares separate financial statements, although its separate assets and liabilities are also consolidated in
these financial statements. DFI’s ability to sell new receivables under this facility ended on December 4, 2008. (See Note
16 for further discussion of this facility)
Reporting Period
The Company’s fiscal year ends on the Saturday closest to September 30 and consists of fifty-two weeks with the
exception that approximately every six years, we have a fifty-three week year. When a fifty-three week year occurs, the
Company reports the additional week in the fourth quarter. Fiscal 2009 is a fifty-three week year beginning on
September 28, 2008 and ending on October 3, 2009.
Reclassifications
Certain reclassifications have been made in the fiscal 2008 and fiscal 2007 financial statements and notes to
conform to the fiscal 2009 presentation.
71
Use of Estimates
The preparation of financial statements in conformity with generally accepted accounting principles requires
management to make estimates and assumptions that affect the amounts reported in the financial statements and
footnotes thereto. Actual results may differ from those estimates.
Revenue Recognition
Broadcast advertising revenues are recognized when commercials are aired. Revenues from television
subscription services related to the Company’s primary cable programming services are recognized as services are
provided. Certain of the Company’s existing contracts with cable and satellite operators include annual live
programming commitments. In these cases, recognition of revenues subject to the commitments is deferred until the
annual commitments are satisfied, which generally results in higher revenue recognition in the second half of the year.
Revenues from advance theme park ticket sales are recognized when the tickets are used. For non-expiring,
multi-day tickets, we recognize revenue over a three-year time period based on estimated usage, which is derived from
historical usage patterns.
Revenues from the theatrical distribution of motion pictures are recognized when motion pictures are exhibited.
Revenues from video and video game sales, net of anticipated returns and customer incentives, are recognized on the
date that video units are made available for sale by retailers. Revenues from the licensing of feature films and television
programming are recorded when the material is available for telecast by the licensee and when certain other conditions
are met.
Merchandise licensing advances and guarantee royalty payments are recognized based on the contractual royalty
rate when the licensed product is sold by the licensee. Non-refundable advances and minimum guarantee royalty
payments in excess of royalties earned are generally recognized as revenue at the end of the contract term.
Revenues from our internet and mobile operations are recognized as services are rendered. Advertising revenues
at our internet operations are recognized when advertisements are viewed online.
Taxes collected from customers and remitted to governmental authorities are presented in the Consolidated
Statements of Income on a net basis.
Advertising Expense
Advertising costs are expensed as incurred. Advertising expense for fiscal 2009, 2008 and 2007 was $2.7 billion,
$2.9 billion and $2.6 billion, respectively.
Cash and Cash Equivalents
Cash and cash equivalents consist of cash on hand and marketable securities with original maturities of three
months or less.
Investments
Debt securities that the Company has the positive intent and ability to hold to maturity are classified as “held-tomaturity” and reported at amortized cost. Debt securities not classified as held-to-maturity and marketable equity
securities are classified as either “trading” or “available-for-sale”. Trading and available-for-sale securities are recorded
at fair value with unrealized gains and losses included in earnings or accumulated other comprehensive income/
(loss), respectively. All other equity securities are accounted for using either the cost method or the equity method.
The Company regularly reviews its investments to determine whether a decline in fair value below the cost basis
is other than temporary. If the decline in fair value is determined to be other than temporary, the cost basis of the
investment is written down to fair value, and the amount of the write-down is included in the Consolidated Statements
of Income.
Translation Policy
The U.S. dollar is the functional currency for the majority of our international operations. The local currency is
the functional currency for Euro Disney, Hong Kong Disneyland, Jetix and international locations of The Disney Stores.
72
For U.S. dollar functional currency locations, foreign currency assets and liabilities are remeasured into U.S.
dollars at end-of-period exchange rates, except for nonmonetary balance sheet accounts, which are remeasured at
historical exchange rates. Revenue and expenses are remeasured at average exchange rates in effect during each period,
except for those expenses related to the non-monetary balance sheet amounts, which are remeasured at historical
exchange rates. Gains or losses from foreign currency remeasurement are included in income.
For local currency functional locations, assets and liabilities are translated at end-of-period rates while revenues
and expenses are translated at average rates in effect during the period. Equity is translated at historical rates and the
resulting cumulative translation adjustments are included as a component of accumulated other comprehensive
income.
Inventories
Inventory primarily includes vacation timeshare units, merchandise, materials, and supplies. Carrying amounts
of vacation ownership units are carried at the lower of cost or net realizable value. Carrying amounts of merchandise,
materials, and supplies inventories are generally determined on a moving average cost basis and are stated at the lower
of cost or market.
Film and Television Costs
Film and television costs include capitalizable production costs, production overhead, interest, development
costs, and acquired production costs and are stated at the lower of cost, less accumulated amortization, or fair value.
Acquired programming costs for the Company’s television and cable networks are stated at the lower of cost, less
accumulated amortization, or net realizable value. Acquired television broadcast program licenses and rights are
recorded when the license period begins and the program is available for use. Marketing, distribution, and general and
administrative costs are expensed as incurred.
Film and television production, participation and residual costs are expensed based on the ratio of the current
period’s revenues to estimated remaining total revenues (Ultimate Revenues) from all sources on an individual
production basis. Ultimate Revenues for film productions include revenues that will be earned within ten years from
the date of the initial theatrical release. For television network series, we include revenues that will be earned within
ten years from delivery of the first episode, or if still in production, five years from delivery of the most recent episode,
if later. For acquired film libraries, remaining revenues include amounts to be earned for up to twenty years from the
date of acquisition. Costs of film and television productions are subject to regular recoverability assessments which
compare the estimated fair values with the unamortized costs. The amount by which the unamortized costs of film and
television productions exceed their estimated fair values is written off. Film development costs for projects that have
been abandoned or have not been set for production within three years are generally written off.
We expense the cost of television broadcast rights for acquired movies, series and other programs based on the
number of times the program is expected to be aired or on a straight-line basis over the useful life, as appropriate.
Rights costs for multi-year sports programming arrangements are amortized based upon the ratio of the current
period’s revenues to Ultimate Revenues (the Projected Revenue Method) or on a straight-line basis over the contract
period, as appropriate. Ultimate Revenues for multi-year sports programming rights include both advertising revenues
and an allocation of Affiliate Fees. If the annual contractual payments related to each season over the term of a multiyear sports programming arrangement approximate each season’s rights cost based on the Projected Revenue Method,
we expense the related annual payments during the applicable season. Individual programs are written-off when there
are no plans to air or sublicense the program.
The net realizable value of network television broadcast program licenses and rights is reviewed using a daypart
methodology. A daypart is defined as an aggregation of programs broadcast during a particular time of day or
programs of a similar type. The Company’s dayparts are early morning, daytime, late night, primetime, news, children,
and sports (includes network and cable). The net realizable values of other cable programming assets are reviewed on
an aggregated basis for each cable channel.
Internal-Use Software Costs
The Company expenses costs incurred in the preliminary project stage of developing or acquiring internal use
software, such as research and feasibility studies, as well as costs incurred in the post-implementation/operational
stage, such as maintenance and training. Capitalization of software development costs occurs only after the
73
preliminary-project stage is complete, management authorizes the project, and it is probable that the project will be
completed and the software will be used for the function intended. As of October 3, 2009 and September 27, 2008,
capitalized software costs, net of accumulated depreciation, totaled $595 million and $526 million, respectively. The
capitalized costs are amortized on a straight-line basis over the estimated useful life of the software, ranging from 3-10
years.
Software Product Development Costs
Software product development costs incurred prior to reaching technological feasibility are expensed. We have
determined that technological feasibility of the software is not established until substantially all product development
is complete.
Parks, Resorts and Other Property
Parks, resorts, and other property are carried at historical cost. Depreciation is computed on the straight-line
method over estimated useful lives as follows:
Attractions
Buildings and improvements
Leasehold improvements
Land improvements
Furniture, fixtures and equipment
25 – 40 years
20 – 40 years
Life of lease or asset life if less
20 – 40 years
3 – 25 years
Goodwill and Other Intangible Assets
The Company is required to test goodwill and other indefinite-lived intangible assets for impairment on an
annual basis and between annual tests if current events or circumstances require an interim impairment assessment.
Goodwill is allocated to various reporting units, which are generally an operating segment or one reporting level below
the operating segment. The Company compares the fair value of each reporting unit to its carrying amount to
determine if there is potential goodwill impairment. If the fair value of a reporting unit is less than its carrying value,
an impairment loss is recorded to the extent that the fair value of the goodwill within the reporting unit is less than the
carrying value of its goodwill.
To determine the fair value of our reporting units, we generally use a present value (discounted cash flow)
technique corroborated by market multiples when available and as appropriate. We apply what we believe to be the
most appropriate valuation methodology for each of our reporting units. We include in the projected cash flows an
estimate of the revenue we believe the reporting unit would receive if the intellectual property developed by the
reporting unit that is being used by other reporting units was licensed to an unrelated third party at its fair market
value. These amounts are not necessarily the same as those included in segment operating results.
In light of recent adverse economic conditions in the global economy, the Company’s long-term cash flow
projections are subject to a greater degree of uncertainty than usual. If we had established different reporting units or
utilized different valuation methodologies or assumptions, the impairment test results could differ, and we could be
required to record impairment charges. Because of the way the accounting rules work, a relatively modest reduction in
our estimate of the fair value of our Broadcasting reporting unit could result in a significant goodwill impairment
charge.
The Company is required to compare the fair values of other indefinite-lived intangible assets to their carrying
amounts. If the carrying amount of an indefinite-lived intangible asset exceeds its fair value, an impairment loss is
recognized. Fair values of other indefinite-lived intangible assets are determined based on discounted cash flows or
appraised values, as appropriate.
During the current year, the Company tested its goodwill and other intangible assets for impairment. The
Company recorded non-cash impairment charges of $142 million for FCC radio licenses. During fiscal years 2008 and
2007, the Company recorded non-cash impairment charges of $39 million and $26 million, respectively, related to FCC
radio licenses. The FCC radio license impairment charges reflected overall market declines in certain radio markets in
which we operate. The FCC radio license and goodwill impairment charges, which were estimated using a discounted
cash flow model, were recorded in “Restructuring and impairment charges” in the Consolidated Statements of Income.
74
Amortizable intangible assets, the majority of which are copyrights, are generally amortized on a straight-line
basis over periods of up to 31 years.
Risk Management Contracts
In the normal course of business, the Company employs a variety of financial instruments to manage its
exposure to fluctuations in interest rates, foreign currency exchange rates, and investments in equity and debt
securities, including interest rate and cross-currency swap agreements; forward, option and “swaption” contracts and
interest rate caps.
The Company formally documents all relationships between hedging instruments and hedged items, as well as
its risk management objectives and strategies for undertaking various hedge transactions. There are two types of
derivatives into which the Company enters: hedges of fair value exposure and hedges of cash flow exposure. Hedges
of fair value exposure are entered into in order to hedge the fair value of a recognized asset, liability, or a firm
commitment. Hedges of cash flow exposure are entered into in order to hedge a forecasted transaction (e.g. forecasted
revenue) or the variability of cash flows to be paid or received, related to a recognized liability or asset (e.g. floating
rate debt).
The Company designates and assigns the financial instruments as hedges of forecasted transactions, specific
assets or specific liabilities. When hedged assets or liabilities are sold or extinguished or the forecasted transactions
being hedged are no longer expected to occur, the Company recognizes the gain or loss on the designated hedging
financial instruments.
Option premiums and unrealized gains on forward contracts and the accrued differential for interest rate and
cross-currency swaps to be received under the agreements are recorded on the balance sheet as other assets. Unrealized
losses on forward contracts and the accrued differential for interest rate and cross-currency swaps to be paid under the
agreements are included in liabilities. Realized gains and losses from hedges are classified in the income statement
consistent with the accounting treatment of the items being hedged. The Company accrues the differential for interest
rate and cross-currency swaps to be paid or received under the agreements as interest rates and exchange rates change
as adjustments to interest expense over the lives of the swaps. Gains and losses on the termination of effective swap
agreements, prior to their original maturity, are deferred and amortized to interest expense over the remaining term of
the underlying hedged transactions.
The Company enters into risk management contracts that are not designated as hedges and do not qualify for
hedge accounting. These contracts are intended to offset certain economic exposures of the Company and are carried at
market value with any changes in value recorded in earnings. Cash flows from hedging activities are classified in the
Consolidated Statements of Cash Flows under the same category as the cash flows from the related assets, liabilities or
forecasted transactions (see Notes 9 and 17).
Income Taxes
The Company accounts for current and deferred income taxes and when appropriate, deferred tax assets and
liabilities are recorded with respect to temporary differences in the accounting treatment of items for financial
reporting purposes and for income tax purposes. Where, based on the weight of all available evidence, it is more likely
than not that some amount of recorded deferred tax assets will not be realized, a valuation allowance is established for
that amount that, in management’s judgment, is sufficient to reduce the deferred tax asset to an amount that is more
likely than not to be realized.
In July 2006, the FASB issued guidance which clarifies the accounting for income taxes by prescribing a
minimum probability threshold that a tax position must meet before a financial statement benefit is recognized. The
minimum threshold is defined as a tax position that is more likely than not to be sustained upon examination by the
applicable taxing authority, including resolution of any related appeals or litigation processes, based on the technical
merits of the position. The tax benefit to be recognized is measured as the largest amount of benefit that is greater than
fifty percent likely of being realized upon ultimate settlement. The Company adopted this guidance on its income tax
positions at the beginning of fiscal year 2008 which resulted in reductions of $148 million and $15 million to opening
retained earnings and minority interests, respectively.
75
Earnings Per Share
The Company presents both basic and diluted earnings per share (EPS) amounts. Basic EPS is calculated by
dividing net income by the weighted average number of common shares outstanding during the year. Diluted EPS is
based upon the weighted average number of common and common equivalent shares outstanding during the year
which is calculated using the treasury-stock method for equity-based awards and assumes conversion of the
Company’s convertible senior notes which were redeemed during fiscal 2008 (see Note 12). Common equivalent shares
are excluded from the computation in periods for which they have an anti-dilutive effect. Stock options for which the
exercise price exceeds the average market price over the period are anti-dilutive and, accordingly, are excluded from
the calculation.
A reconciliation of income from continuing operations and the weighted average number of common and
common equivalent shares outstanding for calculating diluted earnings per share from continuing operations is as
follows:
2008
2009
Income from continuing operations
Interest expense on convertible senior notes (net of tax)
Weighted average number of common shares
outstanding (basic)
Weighted average dilutive impact of equity-based
compensations awards
Weighted average assumed conversion of convertible
senior notes
Weighted average number of common and common
equivalent shares outstanding (diluted)
2007
$
3,307
—
$
4,427
12
$
4,674
21
$
3,307
$
4,439
$
4,695
1,856
1,890
2,004
19
34
43
—
24
45
1,875
1,948
2,092
For fiscal 2009, 2008 and 2007, options for 145 million, 70 million and 43 million shares, respectively, were
excluded from the diluted EPS calculation because they were anti-dilutive.
Subsequent Events
The Company evaluated subsequent events through December 2, 2009.
3
New Accounting Pronouncements
Revenue Arrangements with Multiple Deliverables
In October 2009, the Financial Accounting Standards Board (FASB) issued guidance on revenue arrangements
with multiple deliverables effective for the Company’s 2011 fiscal year, although early adoption is permitted. The
guidance revises the criteria for separating, measuring, and allocating arrangement consideration to each deliverable in
a multiple element arrangement. The guidance requires companies to allocate revenue using the relative selling price
of each deliverable, which must be estimated if the Company does not have a history of selling the deliverable on a
stand-alone basis or third-party evidence of selling price. The Company is assessing the potential effect of this guidance
on its financial statements.
Transfers and Servicing of Financial Assets
In June 2009, the FASB issued guidance on transfers and servicing of financial assets to eliminate the concept of a
qualifying special-purpose entity, change the requirements for off balance sheet accounting for financial assets
including limiting the circumstances where off balance sheet treatment for a portion of a financial asset is allowable,
and require additional disclosures. The guidance is effective for the Company’s 2011 fiscal year. The Company does
not expect that the adoption of this guidance will have a material impact on its financial statements.
Variable Interest Entities
In June 2009, the FASB issued guidance to revise the approach to determine when a variable interest entity (VIE)
should be consolidated. The new consolidation model for VIEs considers whether the Company has the power to direct
the activities that most significantly impact the VIE’s economic performance and shares in the significant risks and
76
rewards of the entity. The guidance on VIE’s requires companies to continually reassess VIEs to determine if
consolidation is appropriate and provide additional disclosures. The guidance is effective for the Company’s 2011 fiscal
year. The Company is assessing the potential effect of this guidance will have,on its financial statements.
Collaborative Arrangements
In December 2007, the FASB issued guidance that defines collaborative arrangements and establishes accounting
and reporting requirements for such arrangements. A collaborative arrangement is a contractual arrangement that
involves a joint operating activity, for example an agreement to co-produce and distribute a motion picture with
another studio. The guidance is effective for the Company’s 2010 fiscal year. The Company does not expect that the
adoption of the guidance on collaborative arrangements will have a material impact on its financial statements.
Business Combinations
In December 2007, the FASB issued guidance that establishes principles and requirements for determining how a
company recognizes and measures the fair value of certain assets and liabilities acquired in a business combination,
including noncontrolling interests, contingent consideration, and certain acquired contingencies. The guidance on
business combinations also requires acquisition-related transaction expenses and restructuring costs be expensed as
incurred rather than capitalized. This guidance will be applicable prospectively to business combinations beginning in
the Company’s 2010 fiscal year.
Noncontrolling Interest (Minority Interest)
In December 2007, the FASB issued guidance on the accounting and reporting for a noncontrolling interest in a
subsidiary. Upon adoption of this guidance, the Company will be required to report its noncontrolling interests as a
separate component of shareholders’ equity. The Company will also be required to present net income attributable to
the noncontrolling interests and net income attributable to the shareholders of the Company separately in its
consolidated statements of income. Currently, noncontrolling interests are reported between liabilities and
shareholders’ equity in the Company’s statement of financial position and the related income attributable to noncontrolling interests is reflected as an expense in arriving at net income. The guidance is effective for the Company’s
2010 fiscal year and requires retroactive adoption of the presentation and disclosure requirements for existing noncontrolling interests. All other requirements are to be applied prospectively.
Employee Compensation – Retirement Benefits
In September 2006, the FASB issued guidance that requires recognition of the overfunded or underfunded status
of defined benefit pension and other postretirement plans as an asset or liability in the statement of financial position
and changes in that funded status to be recognized in comprehensive income in the year in which the changes occur.
The guidance on retirement benefits also requires measurement of the funded status of a plan as of the end of the fiscal
year. The Company adopted the recognition provision in fiscal year 2007 which resulted in a $261 million charge to
accumulated other comprehensive income. The Company adopted the measurement date provision by remeasuring
plan assets and benefit obligations at the beginning of fiscal 2009. Adoption of the measurement date provisions
resulted in a reduction of $35 million to retained earnings and a $100 million benefit to accumulated other
comprehensive income.
Key assumptions used for the measurement of pension and postretirement medical plans at the beginning of
fiscal 2009 were 7.80% for the discount rate, 7.50% for the rate of return on plan assets, and 5.00% for salary increases.
Based on this measurement of plan assets and benefit obligations, pension and postretirement medical costs decreased
to approximately $214 million for fiscal 2009 compared to $255 million for fiscal 2008. The decrease in pension and
postretirement medical expense was primarily due to an increase in the discount rate used to measure the present
value of plan obligations.
The Company remeasured plan assets and benefit obligations at October 3, 2009 in accordance with new
guidance on accounting for retirement plans. Key assumptions for the measurement at October 3, 2009 were 5.75% for
the discount rate, 7.75% for the rate of return on plan assets, and 4.50% for salary increases. Based on the measurement
at October 3, 2009, the Company recorded an increase in unrecognized pension and postretirement medical expense,
which totals $2.8 billion ($1.8 billion after-tax) as of October 3, 2009.
Income Tax
In July 2006, the FASB issued guidance which clarifies the accounting for income taxes by prescribing a
minimum probability threshold that a tax position must meet before a financial statement benefit is recognized. The
minimum threshold is defined as a tax position that is more likely than not to be sustained upon examination by the
77
applicable taxing authority, including resolution of any related appeals or litigation processes, based on the technical
merits of the position. The tax benefit to be recognized is measured as the largest amount of benefit that is greater than
fifty percent likely of being realized upon ultimate settlement. The Company adopted the guidance on income taxes at
the beginning of fiscal year 2008. Applying the guidance on income taxes to all tax positions upon adoption resulted in
reductions of $148 million and $15 million to opening retained earnings and minority interests, respectively.
4
Acquisitions
A&E / Lifetime
On September 15, 2009, the Company and the Hearst Corporation (Hearst) both contributed their 50% interests in
Lifetime Entertainment Services LLC (Lifetime) to A&E Television Networks, LLC (AETN) in exchange for an
increased interest in AETN. Prior to this transaction, the Company and Hearst each held 37.5% of AETN while NBC
Universal (NBCU) held 25%. The Company accounted for the transaction as a sale of a portion of its interest in Lifetime
which resulted in a $228 million non-cash pre-tax gain ($142 million after-tax) reflecting the difference between the
Company’s carrying amount of the Lifetime interest sold and the fair value of the incremental AETN interest received.
Following the transaction the Company’s ownership interest in the combined AETN/Lifetime is approximately 42%.
Under the terms of the agreement, NBCU may elect or be required to exit the combined AETN/Lifetime over a period
of up to 15 years, in which event the Company and Hearst would each own 50%. The Company will account for its
interest in the combined AETN/Lifetime as an equity method investment consistent with how it previously accounted
for AETN and Lifetime.
Marvel
On August 31, 2009, the Company announced an agreement to acquire Marvel Entertainment, Inc. (Marvel) in a
cash and stock transaction. Under the terms of the agreement Marvel shareholders would receive $30 per share in cash
and 0.7452 Disney shares for each Marvel share they own. At closing, the amount of cash and stock will be adjusted if
necessary so that the total value of the Disney stock issued as merger consideration based on its trading value at that
time is not less than 40% of the total merger consideration. Based upon Disney’s stock price as of November 20, 2009,
the acquisition purchase price would be approximately $4 billion. The acquisition is subject to the effectiveness of a
registration statement with respect to Disney shares to be issued in the transaction and other customary closing
conditions. The acquisition is also subject to the approval of Marvel shareholders.
Jetix Europe
In December 2008, the Company acquired an additional 26% interest in Jetix Europe N.V., a publicly traded
pan-European kids’ entertainment company, for approximately $354 million (bringing our total ownership interest to
over 99%). The Company intends to acquire the remaining outstanding shares through statutory buy-out proceedings.
UTV
On May 9, 2008, the Company acquired a 24% interest (bringing its fully undiluted interest to 37%) in UTV
Software Communications Limited (UTV), a media company headquartered and publicly traded in India, for
approximately $197 million. In accordance with Indian securities regulations, the Company was required to make an
open tender offer to purchase up to an additional 23% of UTV’s publicly traded voting shares for a price equivalent to
the May 9th, 2008 Indian rupee purchase price. In November 2008, the Company completed the open offer and
acquired an incremental 23% of UTV’s voting shares for approximately $138 million bringing its undiluted interest to
60%. Due to the change in the exchange rate between the US dollar and the Indian rupee from May to November, the
US dollar price per share was lower in November than in May. UTV’s founder has a four year option to buy all or a
portion of the shares acquired by the Company during the open offer period at a price no less than the Company’s
open offer price. If the trading price upon exercise of the option exceeds the price paid by the Company, then the
option price is capped at the Company’s open offer price plus a 10% annual return. The Company does not have the
right to vote the shares subject to the option until the expiration of the option and accordingly the Company’s
ownership interest in voting shares is 48%. In addition to the acquisition of UTV, on August 5, 2008, the Company
invested $28 million in a UTV subsidiary, UTV Global Broadcasting Limited (along with UTV, the “UTV Group”). The
Company’s investment in the UTV Group is accounted for under the equity method.
Although UTV’s operating performance to date has generally been consistent with our expectations, in light of
recent economic conditions we have tempered our future expectations. Based on the Company’s internal valuation of
the UTV business, which was estimated using a discounted cash flow model, we recorded non-cash impairment
charges totaling $65 million in fiscal 2009. The Company’s carrying value of its investment in the UTV Group of $298
78
million significantly exceeds the current trading value, and the Company will continue to monitor its investment in the
UTV Group. UTV has recently announced that it is considering raising additional capital which could consist of equity
shares of UTV stock, debentures or foreign currency convertible bonds. If UTV issued additional shares, depending
upon the price of the issuance, an incremental impairment of our investment in UTV Group could be required.
The Disney Stores North America
On April 30, 2008, the Company acquired certain assets of the Disney Stores North America for approximately
$64 million in cash from, and terminated its long-term licensing arrangement for the Disney Stores with, The Children’s
Place, the former licensee. The Company acquired the inventory, leasehold improvements, and certain fixed assets of,
and assumed the leases on 229 stores. The Company conducted the wind-down and closure of an additional 88 stores
but did not assume the leases on these stores.
In connection with the acquisition, the Company waived its rights to certain claims against The Children’s Place
and in accordance with the applicable accounting guidance recorded an $18 million non-cash gain for the estimated fair
value of the claims. The gain is classified in “Other income (expense)” in the Consolidated Statement of Income.
Club Penguin
On August 1, 2007, the Company acquired all of the outstanding shares of Club Penguin Entertainment, Inc.
(Club Penguin), a Canadian company that operates clubpenguin.com, an online virtual world for children. The
purchase price included upfront cash consideration of approximately $350 million and additional consideration of up
to $350 million payable if Club Penguin achieved predefined earnings targets in calendar years 2008 and 2009. There
have been no additional payments of consideration for Club Penguin. Remaining additional consideration of up to
$175 million is potentially payable based on calendar year 2009 results.
NASN
On February 1, 2007, the Company acquired all the outstanding shares of NASN, an Irish company that operates
cable television networks in Europe dedicated to North American sporting events and related programming, for
consideration valued at $112 million consisting of cash and assumption of debt. In February, 2009, NASN was
rebranded as ESPN America.
The changes in the carrying amount of goodwill for the years ended October 3, 2009 and September 27, 2008 are
as follows:
Media
Networks
Parks and
Resorts
Studio
Entertainment
Consumer
Products
Interactive
Media
Total
Balance at September 29, 2007
Acquisitions
Other, net
$
15,456
30
14
$
173
—
(1)
$
4,788
—
(37)
$
425
—
(2)
$
557
61
1
$
21,399
91
(25)
Balance at September 27, 2008
Acquisitions
Impairments
Other, net
$
15,500
258
—
(14)
$
172
—
—
—
$
4,751
—
—
(14)
$
423
—
—
(1)
$
619
20
(29)
(2)
$
21,465
278
(29)
(31)
Balance at October 3, 2009
$
15,744
$
172
$
4,737
$
422
$
608
$
21,683
5
Dispositions and Other Income (Expense)
ABC Radio Transaction
On June 12, 2007, the Company completed the spin-off of its wholly-owned subsidiary, ABC Radio Holdings,
Inc., and its merger into a subsidiary of Citadel Broadcasting Corporation (Citadel). Prior to the spin-off, the Company
consolidated its ABC Radio business, consisting of 22 large-market radio stations and the ABC Radio Network
businesses, under ABC Radio Holdings, Inc. The transaction did not include the Company’s ESPN Radio or Radio
Disney network and station businesses.
As a result of the spin-off and merger, Company shareholders received approximately 0.0768 shares of Citadel
common stock in exchange for each share of Disney common stock held as of June 6, 2007. As part of the transaction,
the Company retained $1.35 billion of cash, representing the proceeds from debt raised by ABC Radio Holdings, Inc.
prior to the spin-off. This debt and the assets and liabilities of the ABC Radio business were removed from the
Company’s balance sheet as a distribution at book value. Consequently, there was no gain or loss recorded and the
negative net book value of $132 million was credited to retained earnings.
79
Results of the ABC Radio business have been reported as discontinued operations for all periods.
Summarized financial information for the discontinued ABC Radio business through the date of the spin-off is as
follows (in millions):
Income Statement Data:
2007
Revenues
Income from discontinued operations before income
taxes
$
372
$
45
Other Dispositions
The following dispositions occurred during fiscal 2009, 2008 and 2007:
• On December 22, 2008, the Company sold its investment in two pay television services in Latin America for
approximately $185 million, resulting in a pre-tax gain of $114 million.
• The movies.com business was sold for $17 million on June 18, 2008, resulting in a pre-tax gain of $14 million.
• The Company’s 39.5% interest in E! Entertainment Television was sold for $1.23 billion on November 21, 2006,
resulting in a pre-tax gain of $780 million ($487 million after-tax).
• The Company’s 50% interest in Us Weekly was sold for $300 million on October 2, 2006, resulting in a pre-tax
gain of $272 million ($170 million after-tax).
These gains are reported in “Other income (expense)” in the Consolidated Statements of Income.
Other income (expense)
Other income (expense) is as follows:
2008
2009
Gain on Lifetime/AETN transaction
Gain on sale of investment in two pay television services
in Latin America
Gain related to the acquisition of the Disney Stores North
America
Gain on sale of movies.com
Bad debt charge for Lehman Brothers receivable
Gain on sale of equity investment in E!
Gain on sale of equity investment in Us Weekly
Equity-based compensation plan modification charge
$
Other income (expense)
6
$
$
228
2007
—
$
—
114
—
—
—
—
—
—
—
—
18
14
(91)
—
—
—
—
—
—
780
272
(48)
$
342
(59)
$ 1,004
Investments
Investments consist of the following:
October 3,
2009
Investments, equity basis (1)
Investments, other
Investment in aircraft leveraged leases
(1)
September 27,
2008
$
2,173
341
40
$
1,873
334
42
$
2,554
$
2,249
Equity investments consist of investments in companies over which the Company has significant influence but not
the majority of the equity or risks and rewards.
80
Investments, Equity Basis
A summary of combined financial information for equity investments, which primarily includes cable
investments such as AETN /Lifetime, is as follows:
2008
2009
2007
Results of Operations:
Revenues
$
4,656
$
4,981
$
4,351
Net Income
$
1,346
$
1,455
$
1,137
October 3,
2009
Balance Sheet
Current assets
Non-current assets
Current liabilities
Non-current liabilities
Shareholders’ equity
September 27,
2008
$
2,928
5,561
$
3,230
1,653
$
8,489
$
4,883
$
1,369
1,002
6,118
$
1,403
1,191
2,289
$
8,489
$
4,883
Investments, Other
As of October 3, 2009 and September 27, 2008, the Company held $78 million and $72 million, respectively, of
securities classified as available-for-sale and $263 million and $262 million, respectively, of non-publicly traded costmethod investments.
In 2009, 2008 and 2007, the Company had no significant gains or losses on available-for-sale securities.
In 2009, 2008 and 2007, the Company recorded non-cash charges of $86 million (principally related to our
investment in UTV Group), $26 million and $18 million, respectively, to reflect other-than-temporary losses in value of
certain investments.
81
7
Euro Disney and Hong Kong Disneyland
The Company has a 51% effective ownership interest in the operations of Euro Disney and a 47% ownership
interest in the operations of Hong Kong Disneyland which are both variable interest entities and are consolidated in the
Company’s financial statements.
The following table presents a condensed consolidating balance sheet for the Company as of October 3, 2009,
reflecting the impact of consolidating the balance sheets of Euro Disney and Hong Kong Disneyland.
Before
Euro Disney
and Hong Kong
Disneyland
Consolidation
Cash and cash equivalents
Other current assets
$
Total current assets
Investments
Fixed assets
Other assets
2,811
8,218
Euro Disney,
Hong Kong
Disneyland and
Adjustments
$
11,029
3,600
13,080
31,009
606
254
Total
$
860
(1,046)
4,517
68
3,417
8,472
11,889
2,554
17,597
31,077
Total assets
$
58,718
$
4,399
$
63,117
Current portion of borrowings
Other current liabilities
$
1,075
7,178
$
131
550
$
1,206
7,728
Total current liabilities
Borrowings
Deferred income taxes and other long-term
liabilities
Minority interests
Shareholders’ equity
Total liabilities and shareholders’ equity
$
8,253
8,758
681
2,737
8,934
11,495
7,084
889
33,734
179
802
—
7,263
1,691
33,734
58,718
$
4,399
$
63,117
The following table presents a condensed consolidating income statement of the Company for the year ended
October 3, 2009, reflecting the impact of consolidating the income statements of Euro Disney and Hong Kong
Disneyland.
Before
Euro Disney
and Hong Kong
Disneyland
Consolidation (1)
Revenues
Cost and expenses
Restructuring and impairment charges
Other expense
Net interest expense
Equity in the income of investees
$
Income (loss) before income taxes and minority
interests
Income taxes
Minority interests
Net income
(1)
34,174
(28,486)
(492)
342
(324)
523
Euro Disney,
Hong Kong
Disneyland and
Adjustments
$
5,737
(2,049)
(381)
$
3,307
1,975
(1,966)
—
—
(142)
54
Total
$
(79)
—
79
$
—
36,149
(30,452)
(492)
342
(466)
577
5,658
(2,049)
(302)
$
3,307
These amounts include Euro Disney and Hong Kong Disneyland under the equity method of accounting. As such,
royalty and management fee income from these operations is included in Revenues and our share of their net
income/(loss) is included in Equity in the income of investees.
82
The following table presents a condensed consolidating cash flow statement of the Company for the year ended
October 3, 2009, reflecting the impact of consolidating the cash flow statements of Euro Disney and Hong Kong
Disneyland.
Before
Euro Disney
and Hong Kong
Disneyland
Consolidation
Cash provided by operations
Investments in parks, resorts, and other property
Other investing activities
Cash used in financing activities
$
Increase/(decrease) in cash and cash equivalents
Cash and cash equivalents, beginning of year
Cash and cash equivalents, end of year
4,896
(1,610)
(726)
(2,057)
Euro Disney,
Hong Kong
Disneyland and
Adjustments
$
503
2,308
$
2,811
168
(143)
383
(495)
Total
$
(87)
693
$
606
5,064
(1,753)
(343)
(2,552)
416
3,001
$
3,417
Euro Disney Financial Restructuring
Effective October 1, 2004, Euro Disney, the Company, and Euro Disney’s lenders finalized a Memorandum of
Agreement (MOA) related to the financial restructuring of Euro Disney (the 2005 Financial Restructuring) which
provided for new financing as well as the restructuring of Euro Disney’s existing financing at that time. The
transactions contemplated by the MOA were fully implemented on February 23, 2005 with the completion of a
€253 million equity rights offering in which the Company invested €100 million. The MOA included provisions for
deferral of certain royalties and management fees payable by Euro Disney to the Company as follows:
• Royalties and management fees for fiscal 2005 through fiscal 2009, totaling €125 million, payable to the
Company have been deferred and converted into subordinated long-term borrowings
• Royalties and management fees for fiscal 2007 through fiscal 2014, of up to €25 million per year, are subject to
conditional deferral and conversion into subordinated long-term borrowings if operating results do not
achieve specified levels. Royalties and management fees for fiscal 2008 and 2007, subject to conditional
deferral, were not deferred and have been paid. Based on operating results and subject to third-party
confirmation, the Company will defer €25 million of royalties and management fees subject to conditional
deferral for fiscal 2009
Certain indirect, wholly-owned subsidiaries of The Walt Disney Company have liability as current or former
general partners of Disney S.C.A. In addition to their equity interest in Disney S.C.A., certain of these subsidiaries of
the Company have been capitalized with interest-bearing demand notes with an aggregate face value of €200 million.
In addition, interest of €35 million has accrued on the notes from the date of issuance and has been added to the
amount owed.
Hong Kong Disneyland capital realignment
In July 2009, the Company entered into a capital realignment and expansion plan for Hong Kong Disneyland
(HKDL) with the Government of the Hong Kong Special Administrative Region (HKSAR), Hong Kong Disneyland’s
majority shareholder. Key provisions of the plan include:
• The Company converted its $354 million term and revolving credit facility loan to HKDL into equity during
fiscal 2009. This was accompanied by conversion of an equal amount of the HKSAR loan to HKDL into equity
• The Company will make approximately $0.45 billion of equity contributions over approximately five years to
fund an expansion of HKDL and other financial needs during this period. The actual amount of equity
contributions by the Company may differ depending on the actual final cost of the expansion and operating
results of HKDL during the relevant timeframe. The HKSAR will convert an additional amount of its loan to
HKDL equal to these contributions into equity, subject to a maximum conversion amount that would leave
approximately $128 million (HK $1.0 billion) of the HKSAR loan to HKDL outstanding. At October 3, 2009,
the HKSAR loan to HKDL was $524 million. During fiscal 2009, the Company made equity contributions
totaling $40 million in addition to the conversion of its $354 million loan to HKDL into equity
83
As a result of the above arrangement, the Company’s interest in HKDL increased from 43% to 47% during fiscal
2009 and is projected to increase to approximately 48%, although the Company’s ending ownership will depend on the
aggregate amount of equity contributions made by the Company pursuant to the expansion plan.
8
Film and Television Costs
Film and Television costs are as follows:
October 3,
2009
Theatrical film costs
Released, less amortization
Completed, not released
In-process
In development or pre-production
$
1,513
379
1,516
136
September 27,
2008
$
1,444
373
1,430
126
3,544
3,373
824
204
129
17
789
396
211
16
1,174
1,412
Television broadcast rights
1,038
1,150
Less current portion
5,756
631
5,935
541
Television costs
Released, less amortization
Completed, not released
In-process
In development or pre-production
Non-current portion
$
5,125
$
5,394
Based on management’s total gross revenue estimates as of October 3, 2009, approximately 84% of unamortized
film and television costs for released productions (excluding amounts allocated to acquired film and television
libraries) are expected to be amortized during the next three years. Approximately $632 million of accrued
participation and residual liabilities will be paid in fiscal year 2010. The Company expects to amortize, based on
current estimates, approximately $1.5 billion in capitalized film and television production costs during fiscal 2010.
At October 3, 2009, acquired film and television libraries have remaining unamortized costs of $325 million,
which are generally amortized straight-line over a weighted-average remaining period of approximately 11 years.
84
9
Borrowings
The Company’s borrowings at October 3, 2009 and September 27, 2008, including the impact of interest rate
swaps designated as hedges, are summarized below:
2009
2008
1,985
7,005
318
825
178
248
374
—
5.19%
2.89%
0.75%
8.75%
—
—
$ —
1,400
347
904
—
—
—
9,833
10,933
4.34%
1,480
362
502
1,469
482
506
524
1,249
2009
Commercial paper borrowings
U.S. medium-term notes
European medium-term notes
Other foreign currency denominated debt
Capital Cities/ABC debt
Film financing
Other (4)
$
Euro Disney (ED) and Hong Kong
Disneyland (HKDL):
ED – CDC loans
ED – Credit facilities & other
ED – Other advances
HKDL – Senior and other
borrowings
Total borrowings
Less current portion
Total long-term borrowings
$
Interest rate and
Cross-Currency Swaps (2)
Stated
Interest
Rate (1)
$
—
7,618
347
904
116
350
498
Pay Floating
Pay Fixed
$
Effective
Interest
Rate (3)
—
—
—
—
—
—
—
—
3.67%
0.60%
0.70%
8.37%
—
—
2,651
—
3.03%
5.03%
3.75%
3.03%
—
—
—
—
—
—
5.12%
6.70%
3.21%
3.34%
—
—
2.93%
2,868
3,706
4.29%
—
—
4.58%
12,701
1,206
14,639
3,529
4.33%
1.26%
2,651
138
—
—
3.38%
0.99%
11,495
$
11,110
$ 2,513
$
Swap
Maturities
2010-2018
2010-2013
2013
—
(1)
The stated interest rate represents the weighted-average coupon rate for each category of borrowings. For floating rate borrowings, interest
rates are based upon the rates at October 3, 2009; these rates are not necessarily an indication of future interest rates.
(2)
Amounts represent notional values of interest rate and cross-currency swaps as of October 3, 2009.
(3)
The effective interest rate includes the impact of existing and terminated interest rate and cross-currency swaps on the stated rate of interest
and reflects the estimated market interest rate for certain Euro Disney borrowings as of the time that they were modified during the 2005
restructuring. Other adjustments to the stated interest rate such as purchase accounting adjustments and debt issuance costs did not have a
material impact on the overall effective interest rate.
(4)
Includes market value adjustments for debt with qualifying hedges totaling $291 million and $202 million at October 3, 2009 and
September 27, 2008, respectively.
Commercial Paper
At October 3, 2009, the Company did not have commercial paper debt outstanding. The Company had bank
facilities totaling $4.5 billion to support its commercial paper borrowings, with half of the facilities scheduled to expire
in February 2010 and the other half in February 2011. These bank facilities allow for borrowings at LIBOR-based rates
plus a spread, which depends on the Company’s public debt rating and can range from 0.175% to 0.75%. The Company
also has the ability to issue up to $800 million of letters of credit under the facility expiring in 2011, which if utilized,
reduces available borrowing under this facility. As of October 3, 2009, $326 million of letters of credit had been issued,
of which $237 million was issued under this facility, leaving total available borrowing capacity of nearly $4.2 billion
under these bank facilities. The Company’s bank facilities contain only one financial covenant, relating to interest
coverage, which the Company met on October 3, 2009 by a significant margin. The Company’s bank facilities also
specifically exclude certain entities, including Euro Disney and Hong Kong Disneyland, from any representations,
covenants, or events of default. As of October 3, 2009, the Company had not borrowed against the facilities.
Shelf Registration Statement
At October 3, 2009, the Company had a shelf registration statement which allows the Company to issue various
types of debt instruments, such as fixed or floating rate notes, U.S. dollar or foreign currency denominated notes,
redeemable notes, global notes, and dual currency or other indexed notes. Issuances under the shelf registration will
require the filing of a prospectus supplement identifying the amount and terms of the securities to be issued. Our
ability to issue debt is subject to market conditions and other factors impacting our borrowing capacity.
85
U.S. Medium-Term Note Program
At October 3, 2009, the total debt outstanding under U.S. medium-term note programs was $7.6 billion. The
maturities of current outstanding borrowings range from 1 to 84 years and stated interest rates range from 0% to 7.55%.
European Medium-Term Note Program
At October 3, 2009, the Company had a European medium-term note program for the issuance of various types
of debt instruments such as fixed or floating rate notes, U.S. dollar or foreign currency denominated notes, redeemable
notes and index linked or dual currency notes. The size of the program is $4 billion. The remaining capacity under the
program is $3.7 billion, subject to market conditions and other factors impacting our borrowing capacity. The
remaining capacity under the program replenishes as outstanding debt under the program matures. At October 3,
2009, the total debt outstanding under the program was $347 million. The maturities of outstanding borrowings range
from 1 to 4 years, and stated interest rates range from 0.85% to 4.90%. The Company has outstanding borrowings
under the program denominated in U.S. dollars and Japanese Yen (JPY).
Other Foreign Currency Denominated Debt
In connection with the acquisition of Club Penguin Entertainment, Inc. in July 2007, the Company executed a
credit agreement denominated in Canadian (CAD) dollars and borrowed CAD$328 million ($303 million at October 3,
2009 exchange rates). The loan bears interest at CAD LIBOR plus 0.225% (0.72% at October 3, 2009) and matures in
2013.
In July 2008, the Company executed a loan agreement denominated in JPY and borrowed JPY54 billion ($601
million at October 3, 2009 exchange rates). The loan bears interest at Japanese LIBOR plus 0.42% (0.77% at October 3,
2009) and matures in 2013.
Capital Cities/ABC Debt
In connection with the Capital Cities/ABC, Inc. acquisition in 1996, the Company assumed various debt
previously issued by Capital Cities/ABC, Inc. At October 3, 2009, the outstanding balance was $116 million, matures in
2021 and has a stated interest rate of 8.75%.
Film Financing
In August 2005, the Company entered into a film financing arrangement with a group of investors to fund up to
approximately $500 million for 40% of the production and marketing costs of a slate of up to thirty-two live-action
films, excluding certain titles such as The Chronicles of Narnia series and, in general, sequels to previous films (including
the Pirates of the Caribbean sequels) not included in the slate, in return for approximately 40% of the future net cash
flows generated by these films. By entering into this transaction, the Company is able to share the risks and rewards of
the performance of its live-action film production and distribution activity with outside investors. As of October 3,
2009, the investors have participated in the funding of thirty-two films. The cumulative investment in the slate by the
investors, net of the cash flows generated by the slate that are returned to the investors, is classified as borrowings.
Interest expense recognized from these borrowings is variable and is determined using the effective interest method
based on the projected profitability of the film slate.
The last film of the slate was completed in fiscal 2009. The Company has the option at 5, 10 and 15 years from
inception of the film financing arrangement to buy the investors’ remaining interest in the slate at a price that is based
on the then remaining projected future cash flows that the investors would receive from the slate. As of October 3,
2009, borrowings under this arrangement totaled $350 million.
Euro Disney Borrowings
October 3,
2009
CDC senior debt
CDC subordinated debt – original and 1994 financing
CDC subordinated debt – Walt Disney Studios Park financing
$
CDC loans
Credit facilities and other
Other advances
349
400
731
September 27,
2008
$
1,469
482
506
1,480
362
502
$
86
2,344
354
405
710
$
2,457
Euro Disney — Caisse des Dépôts et Consignations (CDC) loans. Pursuant to Euro Disney’s original financing and the
terms of a 1994 financial restructuring, Euro Disney borrowed funds from the CDC. As of October 3, 2009, these
borrowings consisted of approximately €240 million ($349 million at October 3, 2009 exchange rates) of senior debt and
€276 million ($400 million at October 3, 2009 exchange rates) of subordinated debt. The senior debt is collateralized
primarily by the Disneyland Park, certain hotels, and land assets of Disneyland Paris with a net book value of
approximately €1.3 billion ($1.9 billion at October 3, 2009 exchange rates), whereas the subordinated debt is unsecured.
Interest on the senior and subordinated debt is payable semiannually. CDC loans of €473 million ($686 million at
October 3, 2009 exchange rates) bear interest at a fixed rate of 5.15%. The remaining CDC loans of €43 million ($63
million at October 3, 2009 exchange rates) bear interest at a fixed rate of 6.15%. The loans mature from fiscal year 2010
to fiscal year 2024.
Euro Disney also executed a credit agreement with the CDC to finance a portion of the construction costs of Walt
Disney Studios Park. As of October 3, 2009, approximately €503 million ($731 million at October 3, 2009 exchange rates)
of subordinated loans were outstanding under this agreement. The loans bear interest at a fixed rate of 5.15% per
annum. The loans mature between fiscal years 2015 and 2028.
Pursuant to the 2005 Financial Restructuring, the CDC agreed to conditionally defer and convert to subordinated
long-term borrowings, if operating results do not achieve specified levels, interest payments up to a maximum amount
of €20 million ($29 million at October 3, 2009 exchange rates) per year for fiscal year 2005 through fiscal year 2012 and
€23 million ($33 million at October 3, 2009 exchange rates) for each of the fiscal years 2013 and 2014. Euro Disney has
deferred €20 million of interest originally payable for each of fiscal year 2005 and 2006 as well as €7 million of accrued
interest (collectively €47 million). Euro Disney did not defer any CDC interest for fiscal years 2007 and 2008. Euro
Disney deferred €15 million ($22 million at October 3, 2009 exchange rates) of interest in fiscal 2009 and will defer the
remaining €5 million ($7 million at October 3, 2009 exchange rates) in the first quarter of fiscal 2010. This deferral is
subject to third party confirmation of Euro Disney’s operating results.
Euro Disney — Credit facilities and other. Pursuant to Euro Disney’s original financing with a syndicate of
international banks and the terms of a 1994 financial restructuring, Euro Disney borrowed funds which are
collateralized primarily by the Disneyland Park, the hotels, and land assets of Disneyland Paris with a net book value
of approximately €1.3 billion ($1.9 billion at October 3, 2009 exchange rates). At October 3, 2009, the total balance
outstanding was €249 million ($362 million at October 3, 2009 exchange rate). The loans mature between fiscal years
2010 and 2013.
Euro Disney — Other advances. Advances of €331 million ($481 million at October 3, 2009 exchange rates) are
collateralized by certain hotel assets and bear interest at a fixed rate of 3.0%. The remaining advances of €15 million
($21 million at October 3, 2009 exchange rate) are collateralized by certain hotel assets and bear interest at EURIBOR
plus 3% (3.75% at October 3, 2009). The advances are expected to mature between fiscal years 2010 and 2017.
Euro Disney has covenants under its debt agreements that limit its investment and financing activities and
require it to meet certain annual financial performance covenants. Subject to final third-party review as provided in its
debt agreements, Euro Disney believes that it has complied with its financial performance covenants for fiscal year
2009.
October 3,
2009
Hong Kong Disneyland Borrowings
Term loan facility
Revolving credit facility
$
—
—
September 27,
2008
$
283
90
Senior loans
—
373
Other borrowings
524
876
$
524
$
1,249
Hong Kong Disneyland — Senior loans. At the beginning of fiscal 2009, the Company entered into a term loan and
revolving credit facility agreement with Hong Kong Disneyland pursuant to which Hong Kong Disneyland borrowed
HK$2.3 billion (approximately $292 million) under a term loan and HK$700 million (approximately $90 million) under
87
a HK$1.0 billion ($129 million) revolving credit facility. These funds were used to repay Hong Kong Disneyland’s
commercial term loan and revolving credit facility along with related accrued interest. All outstanding amounts under
this term loan and revolving credit facility to Hong Kong Disneyland were subsequently converted to equity (see Hong
Kong Disneyland capital realignment plan below) and an undrawn revolving facility of HK$300 million
(approximately $39 million) remained in place as of October 3, 2009.
Hong Kong Disneyland — Other borrowings. Hong Kong Disneyland has an unsecured loan facility of HK$4.1
billion ($524 million at October 3, 2009 exchange rates) from the HKSAR that is scheduled to mature on dates through
September 12, 2030. The interest rate on this loan is subject to biannual revisions, but is capped at an annual rate of
6.75% (until March 12, 2014), 7.625% (until March 12, 2022) and 8.50% (until September 12, 2030). As of October 3, 2009,
the rate on the loans was 3.34%.
Hong Kong Disneyland Capital Realignment Plan
In July 2009, the Company entered into a capital realignment and expansion plan (the Plan) for Hong Kong
Disneyland with the HKSAR. Pursuant to the Plan, the Company converted its $354 million term and revolving credit
facility loan to Hong Kong Disneyland into equity during the fourth quarter of fiscal 2009. This was accompanied by
conversion of an equal amount of the HKSAR loan to Hong Kong Disneyland into equity. See Note 7 for further details
of the Plan.
Total borrowings excluding market value adjustments, have the following scheduled maturities:
Before Euro Disney
and Hong Kong
Disneyland
Consolidation
2010
2011
2012
2013
2014
Thereafter
Euro Disney and
Hong Kong
Disneyland
Total
$
1,055
1,120
1,262
1,734
1,451
2,920
$
131
175
223
196
56
2,087
$
1,186
1,295
1,485
1,930
1,507
5,007
$
9,542
$
2,868
$
12,410
The Company capitalizes interest on assets constructed for its parks, resorts, and other property and on theatrical
productions. In 2009, 2008 and 2007, total interest capitalized was $57 million, $62 million, and $37 million,
respectively. Interest expense, net of capitalized interest, for 2009, 2008 and 2007 was $588 million, $712 million and
$746 million.
88
10
Income Taxes
2008
2009
Income From Continuing Operations Before Income
Taxes and Minority Interests
Domestic (including U.S. exports)
Foreign subsidiaries
Income Tax Expense / (Benefit)
Current
Federal
State
Foreign
$
5,472
186
$
6,692
710
$
7,344
381
$
5,658
$
7,402
$
7,725
$
1,278
195
312
$
2,072
366
362
$
2,368
303
330
2,800
1,785
Deferred
Federal
State
$
$
Total deferred tax assets
Deferred tax liabilities
Depreciable, amortizable and other property
Licensing revenues
Leveraged leases
Other, net
Total deferred tax liabilities
Net deferred tax liability before valuation
allowance
Valuation allowance
Net deferred tax liability
$
3,001
296
(32)
(95)
(32)
(118)
(9)
264
(127)
(127)
2,049
October 3,
2009
Components of Deferred Tax Assets and Liabilities
Deferred tax assets
Accrued liabilities
Foreign subsidiaries
Equity-based compensation
Minority interest net operating losses
2007
(2,083)
(626)
(409)
(328)
$
2,673
2,874
September 27,
2008
$
(1,354)
(569)
(371)
(316)
(3,446)
(2,610)
3,238
373
49
77
3,167
269
49
81
3,737
3,566
291
388
956
370
679
$
$
1,326
The valuation allowance principally relates to a $328 million deferred tax asset for the minority interest share of
operating losses at Euro Disney. The ultimate utilization of the minority interest share of the net operating losses,
which have an indefinite carryforward period, would not have an impact on the Company's consolidated net income
as any income tax benefit would be offset by a charge to minority interest in the income statement.
As of October 3, 2009, the Company had undistributed earnings of foreign subsidiaries of approximately $124
million, for which deferred taxes have not been provided. The Company intends to reinvest these earnings for the
foreseeable future. If these amounts were distributed to the United States, in the form of dividends or otherwise, the
Company would be subject to additional U.S. income taxes. Determination of the amount of unrecognized deferred
income tax liabilities on these earnings is not practicable because such liability, if any, is dependent on circumstances
existing if and when remittance was to occur.
89
A reconciliation of the effective income tax rate to the federal rate is as follows:
Federal income tax rate
State taxes, net of federal benefit
Domestic production activity deduction
Other, including tax reserves and related interest
2009
2008
2007
35.0%
2.6
(1.8)
0.4
35.0%
3.0
(1.3)
(0.6)
35.0%
2.8
(0.5)
(0.1)
36.2%
36.1%
37.2%
The American Jobs Creation Act of 2004 made a number of changes to the income tax laws including the creation of
a deduction for qualifying domestic production activities. The deduction equals three percent of qualifying net income
for fiscal 2007, six percent for fiscal 2008 through 2010, and nine percent for fiscal 2011 and thereafter. Our tax
provisions for fiscal years 2009, 2008, and 2007 reflect benefits of $100 million, $97 million and $41 million, respectively,
resulting from this deduction.
The Company adopted new accounting guidance for income taxes at the beginning of fiscal year 2008. See Note 2
for the impact of adopting this guidance.
A reconciliation of the beginning and ending amount of gross unrecognized tax benefits, excluding the related
accrual for interest, is as follows:
2008
2009
Balance at the beginning of the year
Increases for current year tax
positions
Increases for prior year tax positions
Decreases in prior year tax positions
Settlements with taxing authorities
$
Balance at the end of the year
$
$
655
630
99
221
(189)
(106)
63
17
(7)
(42)
$
686
655
The year end 2009 and 2008 balances include $367 million and $353 million, respectively, that if recognized,
would reduce our income tax expense and effective tax rate after giving effect to offsetting benefits from other tax
jurisdictions.
As of year end 2009 and 2008, the Company had $142 million and $127 million, respectively, in accrued interest
related to unrecognized tax benefits. During 2009 and 2008, the Company accrued additional interest of $27 million and
$47 million, respectively, and recorded reductions in accrued interest of $12 million and $57 million, respectively, as a
result of audit settlements and other prior-year adjustments. The Company’s policy is to report interest and penalties
as a component of income tax expense.
During the current year, the Internal Revenue Service commenced a limited issue focused examination with
respect to the Company’s federal income tax returns filed for its fiscal years 2005 through 2007. The Company is also
subject to state and local and foreign tax audits. In the current year, the California examination of fiscal years 2004 and
2005 was completed. The Company is no longer subject to examination in any of its major state or foreign tax
jurisdictions for years prior to 2002.
In the next twelve months, it is reasonably possible that our unrecognized tax benefits could change due to
payments for or resolution of open tax matters for post-2002 years. These resolutions and payments would reduce our
unrecognized tax benefits by $109 million.
In fiscal 2009, income tax benefits attributable to equity-based compensation transactions were less than the
amounts recorded based on grant date fair value. Accordingly, a shortfall of $26 million was charged to shareholders’
equity. In fiscal years 2008 and 2007, income tax benefits attributable to equity-based compensation transactions
exceeded amounts recorded at grant date and accordingly were credited to shareholders’ equity and totaled $45
million and $123 million, respectively .
90
11
Pension and Other Benefit Programs
The Company maintains pension and postretirement medical benefit plans covering most of its employees not
covered by union or industry-wide plans. Employees hired after January 1, 1994 and employees generally hired after
January 1, 1987 for certain of our media businesses are not eligible for postretirement medical benefits. With respect to
its qualified defined benefit pension plans, the Company’s policy is to fund, at a minimum, the amount necessary on an
actuarial basis to provide for benefits in accordance with the requirements of the Employee Retirement Income Security
Act of 1974, as amended by the Pension Protection Act of 2006 (PPA). Pension benefits are generally based on years of
service and/or compensation.
The Company adopted new accounting guidance on retirement benefits that requires measurement of plan
funded status as of the end of the fiscal year. Previously, the measurement date for the plans was June 30. Upon
adoption, the Company remeasured plan assets and benefit obligations at the end of fiscal 2008 which resulted in a
reduction of $35 million to retained earnings and a $100 million benefit to accumulated other comprehensive income at
the beginning of fiscal 2009. Net periodic benefit cost for fiscal 2009 was based on this remeasurement of plan assets
and benefit obligations. The amounts in the tables below for fiscal 2009 reflect an October 3, 2009 measurement date
whereas the amounts for fiscal 2008 reflect the June 30, 2008 measurement date.
The following chart summarizes the benefit obligations, assets, funded status and balance sheet impacts
associated with the pension and postretirement medical benefit plans based upon the actuarial valuations prepared as
of October 3, 2009 and June 30, 2008 (the Plan Measurement Dates).
Pension Plans
September 27,
2008
October 3,
2009
Projected benefit obligations
Beginning obligations
Adoption of new measurement date
Service cost
Interest cost
Actuarial (loss) / gain
Plan amendments and other
Benefits paid
Ending obligations
Fair value of plans' assets
Beginning fair value
Adoption of new measurement date
Actual return on plan assets
Contributions
Benefits paid
Expenses
Ending fair value
Underfunded status of the plans
Contributions after Plan Measurement Date
Net balance sheet liability
Amounts recognized in the balance sheet
Non-current assets
Current liabilities
Non-current liabilities
Postretirement Medical Plans
October 3,
2009
September 27,
2008
$
(5,249)
452
(164)
(363)
(1,835)
(8)
175
$
(5,242)
—
(187)
(325)
360
(14)
159
$
(1,030)
102
(17)
(71)
(235)
—
24
$
(6,992)
$
(5,249)
$
(1,227)
$
(1,030)
$
4,955
(420)
25
468
(175)
(20)
$
5,160
—
(39)
17
(159)
(24)
$
351
(33)
(9)
12
(24)
—
$
372
—
(7)
12
(26)
—
$
4,833
$
4,955
$
297
$
351
$
(2,159)
n/a
$
(294)
4
$
(930)
n/a
$
(679)
3
$
(2,159)
$
(290)
$
(930)
$
(676)
$
8
(14)
(2,153)
$
215
(10)
(495)
$
—
(14)
(916)
$
—
(14)
(662)
$
(2,159)
$
(290)
$
(930)
$
(676)
91
$
(1,011)
—
(22)
(63)
40
—
26
The components of net periodic benefit cost and key assumptions are as follows:
Pension Plans
Postretirement Medical Plans
2008
2009
2007
2008
2009
2007
Service costs
Interest costs
Expected return on plan assets
Amortization of prior year service costs
Recognized net actuarial (gain)/loss
Special termination benefits
$
164
363
(370)
14
(9)
—
$
187
325
(356)
13
25
—
$
166
297
(302)
4
47
5
$
17
71
(26)
(2)
(8)
—
$
22
63
(25)
(1)
2
—
$
22
59
(21)
(1)
2
—
Net periodic benefit cost
$
162
$
194
$
217
$
52
$
61
$
61
Assumptions:
Discount rate
Rate of return on plan assets
Salary increases
Year 1 increase in cost of benefits
Rate of increase to which the cost of benefits is
assumed to decline (the ultimate trend rate)
Year that the rate reaches the ultimate trend
rate
7.00%
7.50%
5.00%
n/a
6.35%
7.50%
4.00%
n/a
5.75%
7.75%
n/a
8.50%
7.00%
7.50%
n/a
9.00%
6.35%
7.50%
n/a
9.00%
n/a
n/a
n/a
5.00%
5.00%
5.00%
n/a
n/a
n/a
2019
2016
2015
5.75%
7.75%
4.50%
n/a
Net periodic benefit cost is based on assumptions determined at the prior-year end measurement date.
Accumulated other comprehensive loss, before tax, as of October 3, 2009 consists of the following amounts that
have not yet been recognized in net periodic benefit cost:
Pension Plans
Unrecognized prior service credit / (cost)
Unrecognized net actuarial loss
$
Total amounts included in accumulated other
comprehensive loss
Prepaid / (accrued) pension cost
Net balance sheet liability
(73)
(2,542)
Postretirement
Medical Plans
$
(2,615)
456
$
(2,159)
11
(180)
Total
$
(169)
(761)
$
(930)
(62)
(2,722)
(2,784)
(305)
$
(3,089)
Amounts included in accumulated other comprehensive loss, before tax, as of October 3, 2009 that are expected
to be recognized as components of net periodic benefit cost during fiscal 2010 are:
Pension Plans
Postretirement
Medical Plans
Total
Prior service credit / (cost)
Net actuarial loss
$
(14)
(155)
$
2
(7)
$
(12)
(162)
Total
$
(169)
$
(5)
$
(174)
Plan Funded Status
At October 3, 2009, the Company had pension plans with accumulated benefit obligations exceeding the fair
value of plan assets. The projected benefit obligation, accumulated benefit obligation and aggregate fair value of plan
assets for pension plans with accumulated benefit obligations in excess of plan assets were $6.3 billion, $5.7 billion and
$4.1 billion, respectively, as of October 3, 2009 and $397 million, $332 million and $0 million as of September 27, 2008,
respectively.
For pension plans with projected benefit obligations in excess of plan assets, the projected benefit obligation and
aggregate fair value of plan assets were $6.3 billion and $4.2 billion, respectively, as of October 3, 2009 and $3.9 billion
and $3.4 billion as of September 27, 2008, respectively.
92
The Company’s total accumulated pension benefit obligations at October 3, 2009 and September 27, 2008 were
$6.4 billion and $4.8 billion, respectively, of which 97% for both years was vested.
The accumulated postretirement medical benefit obligations and fair value of plan assets for postretirement
medical plans with accumulated postretirement medical benefit obligations in excess of plan assets were $1.2 billion
and $297 million, respectively, at October 3, 2009 and $1.0 billion and $351 million, respectively, at September 27, 2008.
Plan Assets
A significant portion of the assets of the Company’s defined benefit plans are managed on a commingled basis in
a third party master trust. The investment policy and allocation of the assets in the master trust were approved by the
Company’s Investment and Administrative Committee which has oversight responsibility for the Company’s
retirement plans. The investment policy ranges for the major asset classes are as follows:
Asset Class
Minimum
Equity Securities
Debt Securities
Alternative Investments
Cash
Maximum
40 %
25 %
10 %
0 %
60 %
45 %
30 %
5 %
Alternative investments principally include venture capital, private equity and real estate partnerships.
The Company’s defined benefit plans asset mix (including assets held outside of the master trust) at the Plan
Measurement Dates for each fiscal year end is as follows:
Asset Class
Securities (1)
Equity
Debt Securities
Alternative Investments
Cash
Total
(1)
2009
2008
44 %
38 %
17 %
1 %
47 %
35 %
16 %
2 %
100
%
100
%
Equity securities include 2.8 million shares of Company common stock valued at $77 million (2% of total plan
assets) and $92 million (2% of total plan assets) at 2009 and 2008, respectively.
Plan Contributions
During fiscal 2009, the Company made contributions to its pension and postretirement medical plans totaling
$473 million, which included discretionary contributions above the minimum requirements for pension plans. The
Company expects pension and postretirement medical plan contributions in fiscal 2010 to range from $350 million to
$450 million which is expected to include discretionary contributions above the minimum requirements. Final
minimum funding requirements for fiscal 2010 will be determined based on our January 1, 2010 funding actuarial
valuation which will be available late fiscal 2010.
Estimated Future Benefit Payments
The following table presents estimated future benefit payments for the next ten fiscal years:
Pension Plans
2010
2011
2012
2013
2014
2015 – 2019
(1)
$
217
233
253
277
304
1,968
Estimated future benefit payments are net of expected Medicare subsidy receipts of $68 million.
93
Post Retirement
Medical Plans (1)
$
33
36
38
41
45
282
Assumptions
Actuarial assumptions, such as the discount rate, long-term rate of return on plan assets and the healthcare cost
trend rate, have a significant effect on the amounts reported for net periodic benefit cost as well as the related benefit
obligations.
Discount Rate — The assumed discount rate for pension and postretirement medical plans reflects the market
rates for high-quality corporate bonds currently available. The Company’s discount rate was determined by
considering the average of pension yield curves constructed of a large population of high quality corporate bonds. The
resulting discount rate reflects the matching of plan liability cash flows to the yield curves.
Long-term rate of return on plan assets — The long-term rate of return on plan assets represents an estimate of longterm returns on an investment portfolio consisting of a mixture of equities, fixed income and alternative investments.
When determining the long-term rate of return on plan assets, the Company considers long-term rates of return on the
asset classes (both historical and forecasted) in which the Company expects the pension funds to be invested. The
following long-term rates of return by asset class were considered in setting the long-term rate of return on plan assets
assumption:
Equity Securities
Debt Securities
Alternative Investments
9% – 11%
4% – 8%
8% – 20%
Healthcare cost trend rate — The Company reviews external data and its own historical trends for healthcare costs
to determine the healthcare cost trend rates for the postretirement medical benefit plans. For the 2009 actuarial
valuation, we assumed an 8.5% annual rate of increase in the per capita cost of covered healthcare claims with the rate
decreasing in even increments over ten years until reaching 5.0%.
Sensitivity — A one percentage point (ppt) change in the key assumptions would have had the following effects
on the projected benefit obligations as of October 3, 2009 and on cost for fiscal 2010:
Pension and Postretirement Medical Plans
Expected
Long-Term
Rate of Return
On Assets
Discount Rate
Increase/(decrease)
1 ppt decrease
1 ppt increase
Net Periodic
Pension and
Postretirement
Medical Cost
$
169
(149)
Projected
Benefit
Obligations
$
1,328
(1,140)
Net Periodic
Pension and
Postretirement
Cost
$
57
(57)
Postretirement Medical Plans
Assumed Healthcare Cost
Trend Rate
Net Periodic
Postretirement
Medical Cost
(24)
38
Projected
Benefit
Obligations
(175)
218
Multi-employer Plans
The Company participates in various multi-employer pension plans under union and industry-wide agreements.
In 2009, 2008 and 2007, the contributions to these plans, which are expensed as incurred, were $52 million, $56 million
and $54 million, respectively.
Defined Contribution Plans
The Company has savings and investment plans that allow eligible employees to allocate up to 20% of their
salary through payroll deductions depending on the plan in which the employee participates. The Company matches
50% of the employee’s pre-tax contribution up to plan limits. In 2009, 2008 and 2007, the costs of these plans were $51
million, $52 million and $42 million, respectively.
94
12
Shareholders’ Equity
As of the filing date of this report, the Board of Directors had not yet declared a dividend related to fiscal 2009.
The Company paid a $648 million dividend ($0.35 per share) during the second quarter of fiscal 2009 related to fiscal
2008. The Company paid a $664 million dividend ($0.35 per share) during the second quarter of fiscal 2008 related to
fiscal 2007. The Company paid a $637 million dividend ($0.31 per share) during the second quarter of fiscal 2007
related to fiscal 2006.
During fiscal 2009, the Company repurchased 5 million shares of Disney common stock for $138 million. During
fiscal 2008, the Company repurchased 139 million shares of Disney common stock for $4.5 billion. During fiscal 2007,
the Company repurchased 202 million shares of Disney common stock for $6.9 billion. On May 1, 2007, the Board of
Directors of the Company increased the share repurchase authorization to a total of 400 million shares. As of October 3,
2009, the Company had remaining authorization in place to repurchase 179 million additional shares. The repurchase
program does not have an expiration date.
In April 2008, the Company redeemed $1.3 billion of convertible senior notes. Pursuant to the redemption,
substantially all of the notes were converted into 45 million shares of the Company’s common stock.
The par value of the Company’s outstanding common stock totaled approximately $26 million.
The Company also has 1.0 billion shares of Internet Group stock at $.01 par value authorized. No shares are
issued and outstanding.
Accumulated other comprehensive income (loss), net of tax(1), is as follows:
October 3,
2009
September 27,
2008
Market value adjustments for hedges and investments
Foreign currency translation and other
Unrecognized pension and postretirement medical expense
$
18
105
(1,767)
$
78
137
(296)
Accumulated other comprehensive loss (1)
$
(1,644)
$
(81)
(1)
13
Accumulated other comprehensive income(loss) and components of other comprehensive income(loss) are
recorded net of tax using a 37% estimated statutory tax rate.
Equity-Based Compensation
Under various plans, the Company may grant stock options and other equity-based awards to executive,
management, and creative personnel. The Company’s approach to long-term incentive compensation contemplates
awards of stock options and restricted stock units (RSUs). Certain RSUs awarded to senior executives vest based upon
the achievement of market and/or performance conditions (Performance RSUs).
Stock options are generally granted at exercise prices equal to or exceeding the market price at the date of grant.
Effective in January 2003, options became exercisable ratably over a four-year period from the grant date, while options
granted prior to January 2003 generally vest ratably over five years. Effective in the second quarter of 2005, options
granted generally expire seven years after the grant date, while options granted prior to the second quarter of 2005
generally expire ten years after the grant date. At the discretion of the Compensation Committee of the Company’s
Board of Directors, options can occasionally extend up to 15 years after date of grant. Effective in January 2009, RSUs
(excluding Performance RSUs) vest ratably over a four-year period from the date of grant, while RSUs granted prior to
January 2009 and Performance RSUs generally vest 50% on each of the second and fourth anniversaries of the grant
date. Stock options and RSUs are generally forfeited by employees who terminate prior to vesting. Shares available for
future option and RSU grants at October 3, 2009 totaled 83 million. Starting March 2009 for our primary plan, each
share granted subject to a stock option award reduces the number of shares available by one share while each share
granted subject to a RSU award reduces the number of shares available by two shares. The Company satisfies stock
option exercises and vesting of RSUs with newly issued shares.
95
Each year, during the second quarter, the Company awards stock options and restricted stock units to a broadbased group of management and creative personnel (the Annual Grant). The fair value of options is estimated based on
the binomial valuation model. The binomial valuation model takes into account variables such as volatility, dividend
yield, and the risk-free interest rate. The binomial valuation model also considers the expected exercise multiple (the
multiple of exercise price to grant price at which exercises are expected to occur on average) and the termination rate
(the probability of a vested option being cancelled due to the termination of the option holder) in computing the value
of the option.
In fiscal years 2009, 2008 and 2007, the weighted average assumptions used in the option-valuation model were
as follows:
2009
Risk-free interest rate
Expected volatility
Dividend yield
Termination rate
Exercise multiple
2.0
47
1.19
7.5
1.39
2008
%
%
%
%
3.6
29
1.02
7.5
1.39
%
%
%
%
2007
4.5
26
0.79
7.4
1.38
%
%
%
%
Although the initial fair value of stock options is not adjusted after the grant date, changes in the Company’s
assumptions may change the value of, and therefore the expense related to, future stock option grants. The
assumptions that cause the greatest variation in fair value in the binomial valuation model are the expected volatility
and expected exercise multiple. Increases or decreases in either the expected volatility or expected exercise multiple
will cause the binomial option value to increase or decrease, respectively.
The volatility assumption considers both historical and implied volatility and may be impacted by the
Company’s performance as well as changes in economic and market conditions.
Compensation expense for RSUs (excluding Performance RSUs) and stock options is recognized ratably over the
vesting period of the award. Compensation expense for RSUs is based upon the market price of the shares underlying
the awards on the grant date. Compensation expense for Performance RSUs reflects the estimated probability that the
market and/or performance conditions will be met and is recognized ratably over the service period of the award.
The impact of stock options and RSUs on income for fiscal 2009, 2008 and 2007 was as follows:
2008
2009
Stock option compensation expense
RSU compensation expense
$
Equity-based compensation plan modification charge (1)
Total equity-based compensation expense (2)
Tax impact
229
228
$
214
188
2007
$
213
158
457
—
402
—
371
48
457
(169)
402
(149)
419
(155)
Reduction in net income
$
288
$
253
$
264
Tax benefit reported in cash flow from continuing
financing activities
$
4
$
47
$
116
(1)
In anticipation of the ABC Radio transaction, the Company needed to determine whether employee equity-based
compensation awards would be adjusted for the dilutive impact of the transaction on outstanding employee
awards. Certain of the Company’s plans required such adjustments to be made on an equitable basis. All other
plans permitted such adjustments to be made. In order to treat all employees consistently with respect to the ABC
Radio transaction (and other similar future transactions), the Company amended the plans such that all plans
require equitable adjustments for such transactions. In connection with these amendments, the Company was
required to record a non-cash charge of $48 million in the first quarter of fiscal 2007 representing the estimated fair
value of this modification with respect to vested equity-based employee compensation awards.
96
(2)
Equity-based compensation expense is net of capitalized equity-based compensation and includes amortization of
previously capitalized equity-based compensation costs. Capitalized equity-based compensation totaled $13
million, $55 million and $103 million in 2009, 2008 and 2007, respectively.
The following table summarizes information about stock option transactions (shares in millions):
2008
2009
Shares
Outstanding at beginning
of year
Awards forfeited
Awards granted
Awards exercised
Awards expired/
cancelled
171
(3)
17
(7)
(8)
Weighted
Average
Exercise
Price
$
Shares
28.37
29.69
21.29
17.66
177
(4)
30
(27)
34.23
(5)
2007
Weighted
Average
Exercise
Price
$
Weighted
Average
Exercise
Price
Shares
27.36
29.49
30.12
21.79
212
(5)
25
(53)
44.12
(2)
$
25.85
27.71
34.22
24.52
56.00
Outstanding at end of
year
170
26.79
171
28.37
177
27.36
Exercisable at end of year
111
26.62
101
27.72
108
27.07
The following tables summarize information about stock options vested and expected to vest at October 3, 2009
(shares in millions):
Vested
Range of Exercise Prices
Number of
Options
Weighted
Average
Exercise Price
7
9
32
35
20
4
3
1
10.38
18.25
23.81
29.04
33.65
39.85
42.21
117.30
$ 0 — $ 15
$ 16 — $ 20
$ 21 — $ 25
$ 26 — $ 30
$ 31 — $ 35
$ 36 — $ 40
$ 41 — $ 45
$ 46 — $185
Weighted Average
Remaining Years of
Contractual Life
2.6
4.4
3.3
2.9
2.5
0.7
1.0
0.4
111
Expected to Vest
Number of
Options
Range of Exercise Prices
(1)
$ 0 — $ 15
$ 16 — $ 20
$ 21 — $ 25
$ 26 — $ 30
$ 31 — $ 35
1
12
4
24
11
Weighted
Average
Exercise Price
13.37
20.68
24.43
29.26
33.94
52
(1)
Number of options expected to vest is total unvested options less estimated forfeitures.
97
Weighted Average
Remaining Years of
Contractual Life
3.8
6.3
3.7
5.6
4.5
The following table summarizes information about RSU transactions (shares in millions):
2008
2009
Units
Unvested at beginning of
year
Granted
Vested
Forfeited
28
15
(8)
(2)
Unvested at end of year
33
Weighted
Average
Grant-Date
Fair Value
$
Units
29.95
20.89
31.20
26.61
27
11
(7)
(3)
25.82
28
2007
Weighted
Average
Grant-Date
Fair Value
$
Units
29.01
29.92
26.45
29.69
23
12
(6)
(2)
29.95
27
Weighted
Average
Grant-Date
Fair Value
$
25.74
34.22
26.20
27.78
29.01
RSU grants include 3.0 million shares, 2.3 million shares and 1.4 million shares of Performance RSUs in 2009,
2008 and 2007, respectively. Approximately 7.4 million shares of the unvested RSUs as of October 3, 2009 are
Performance RSUs.
The weighted average grant-date fair values of options granted during 2009, 2008 and 2007 were $7.43, $8.25 and
$9.27, respectively. The total intrinsic value (market value on date of exercise less exercise price) of options exercised
and RSUs vested during 2009, 2008 and 2007 totaled $252 million, $529 million, and $735 million, respectively. The
aggregate intrinsic values of stock options vested and expected to vest at October 3, 2009 were $306 million and
$100 million, respectively.
As of October 3, 2009, there was $315 million of unrecognized compensation cost related to unvested stock
options and $446 million related to unvested RSUs. That cost is expected to be recognized over a weighted-average
period of 1.7 years for stock options and 1.9 years for RSUs.
Cash received from option exercises for 2009, 2008 and 2007 was $119 million, $591 million and $1.3 billion,
respectively. Tax benefits realized from tax deductions associated with option exercises and RSU activity for 2009, 2008
and 2007 totaled $90 million, $183 million and $267 million, respectively.
98
14
Detail of Certain Balance Sheet Accounts
October 3,
2009
Current receivables
Accounts receivable
Other
Allowance for doubtful accounts
Other current assets
Prepaid expenses
Other
Parks, resorts and other property, at cost
Attractions, buildings and improvements
Leasehold improvements
Furniture, fixtures and equipment
Land improvements
$
4,794
396
(336)
$
5,207
414
(248)
$
4,854
$
5,373
$
464
112
$
478
125
$
576
$
603
$
15,929
693
12,228
3,625
$
15,444
553
11,739
3,757
31,493
(16,310)
1,169
1,180
32,475
(17,395)
1,350
1,167
Accumulated depreciation
Projects in progress
Land
$
Intangible assets
Copyrights
Other amortizable intangible assets
Accumulated amortization
$
Net amortizable intangible assets
FCC licenses
Trademarks
Other indefinite lived intangible assets
17,597
358
296
(249)
$
$
Accounts payable and other accrued liabilities
Accounts payable
Payroll and employee benefits
Other
Other long-term liabilities
Deferred revenues
Capital lease obligations
Program licenses and rights
Participation and residual liabilities
Pension and postretirement medical plan liabilities
Other (1)
Includes unrecognized tax benefits.
99
17,532
357
282
(198)
441
858
1,109
20
405
713
1,109
20
Other non-current assets
Receivables
Pension related assets
Prepaid expenses
Other
(1)
September 27,
2008
$
2,247
$
2,428
$
1,225
8
136
653
$
801
215
128
619
$
2,022
$
1,763
$
4,002
1,259
355
$
4,355
1,376
249
$
5,616
$
5,980
$
250
226
217
451
3,069
1,231
$
320
241
223
378
1,157
1,460
$
5,444
$
3,779
15
Commitments and Contingencies
Commitments
The Company has various contractual commitments for broadcast rights for sports, feature films and other
programming, aggregating approximately $21.2 billion, including approximately $0.9 billion for available
programming as of October 3, 2009, and approximately $18.0 billion related to sports programming rights, primarily
NFL, college football (including college bowl games) and basketball conferences, NBA, NASCAR, and MLB.
The Company has entered into operating leases for various real estate and equipment needs, including retail
outlets and distribution centers for consumer products, broadcast equipment, and office space for general and
administrative purposes. Rental expense for the operating leases during 2009, 2008, and 2007, including common-area
maintenance and contingent rentals, was $615 million, $550 million, and $482 million, respectively.
The Company also has contractual commitments for the construction of two new cruise ships, creative talent and
employment agreements and unrecognized tax benefits. Creative talent and employment agreements include
obligations to actors, producers, sports personnel, television and radio personalities, and executives.
Contractual commitments for broadcast programming rights, future minimum lease payments under
non-cancelable operating leases, and creative talent and other commitments totaled $28.1 billion at October 3, 2009,
payable as follows:
Operating
Leases
Broadcast
Programming
2010
2011
2012
2013
2014
Thereafter
Other
Total
$
5,023
3,437
3,255
3,226
2,683
3,583
$
421
366
318
234
180
517
$
1,250
1,357
1,147
203
134
741
$
6,694
5,160
4,720
3,663
2,997
4,841
$
21,207
$
2,036
$
4,832
$
28,075
The Company has non-cancelable capital leases, primarily for land and broadcast equipment, which had gross
carrying values of $402 million and $423 million at October 3, 2009 and September 27, 2008, respectively. Accumulated
amortization related to these capital leases totaled $95 million and $114 million at October 3, 2009 and September 27,
2008, respectively. Future payments under these leases as of October 3, 2009 are as follows:
2010
2011
2012
2013
2014
Thereafter
$
33
34
34
32
32
625
Total minimum obligations
Less amount representing interest
$
790
(548)
Present value of net minimum obligations
Less current portion
242
(16)
Long-term portion
$
226
Contractual Guarantees
The Company has guaranteed bond issuances by the Anaheim Public Authority that were used by the City of
Anaheim to finance construction of infrastructure and a public parking facility adjacent to the Disneyland Resort.
Revenues from sales, occupancy and property taxes from the Disneyland Resort and non-Disney hotels are used by the
City of Anaheim to repay the bonds. In the event of a debt service shortfall, the Company will be responsible to fund
100
the shortfall. As of October 3, 2009, the remaining debt service obligation guaranteed by the Company was
$373 million, of which $96 million was principal. To the extent that tax revenues exceed the debt service payments in
subsequent periods, the Company would be reimbursed for any previously funded shortfalls. To date, tax revenues
have exceeded the debt service payments for Anaheim bonds.
ESPN STAR Sports, a joint-venture in which ESPN owns a 50% equity interest, has an agreement for global
programming rights to International Cricket Council Events from 2007 through 2015. Under the terms of the
agreement, ESPN and the other joint-venture partner have jointly guaranteed the programming rights obligation of
approximately $0.9 billion over the remaining term of the agreement.
Accounts Receivable Risk
In light of the recent turmoil in the domestic and global economy, our estimates and judgments with respect to
the collectibility of our receivables have become subject to greater uncertainty than in more stable periods.
Legal Matters
Milne and Disney Enterprises, Inc. v. Stephen Slesinger, Inc. On November 5, 2002, Clare Milne, the granddaughter
of A. A. Milne, author of the Winnie the Pooh books, and the Company’s subsidiary Disney Enterprises, Inc. (DEI) filed
a complaint against Stephen Slesinger, Inc. (SSI) in the United States District Court for the Central District of California.
On November 4, 2002, Ms. Milne served notices to SSI and DEI terminating A. A. Milne’s prior grant of rights to
Winnie the Pooh, effective November 5, 2004, and granted all of those rights to DEI. In their lawsuit, Ms. Milne and
DEI sought a declaratory judgment, under United States copyright law, that Ms. Milne’s termination notices were
valid; that SSI’s rights to Winnie the Pooh in the United States terminated effective November 5, 2004; that upon
termination of SSI’s rights in the United States, the 1983 licensing agreement that is the subject of the Stephen Slesinger,
Inc. v. The Walt Disney Company lawsuit (the “state court action”) terminated by operation of law; and that, as of
November 5, 2004, SSI was entitled to no further royalties for uses of Winnie the Pooh. SSI filed (a) an answer denying
the material allegations of the complaint and (b) counterclaims seeking a declaration that (i) Ms. Milne’s grant of rights
to DEI is void and unenforceable and (ii) DEI remains obligated to pay SSI royalties under the 1983 licensing
agreement. The District Court ruled that Milne’s termination notices were invalid. The Court of Appeals for the Ninth
Circuit affirmed, and on June 26, 2006, the United States Supreme Court denied Milne’s petition for a writ of certiorari.
On August 1, 2003, SSI filed an amended answer and counterclaims and a third-party complaint against Harriet Hunt
(heir to E. H. Shepard, illustrator of the original Winnie the Pooh stories), who had served a notice of termination and a
grant of rights similar to Ms. Milne’s, and asserted counterclaims against the Company allegedly arising from the
Milne and Hunt terminations and the grant of rights to DEI for (a) unlawful and unfair business practices; and
(b) breach of the 1983 licensing agreement.
On October 19, 2006, the parties stipulated to SSI's filing its Fourth Amended Answer and Counterclaims (Fourth
Amended Answer) seeking (a) to invalidate the Hunt termination notice, (b) to terminate the Company's rights
vis-à-vis SSI, and (c) damages in excess of two billion dollars, among other relief. That stipulation also provided that
Hunt and the Company need not respond to the Fourth Amended Answer until the conclusion of two events: the state
court appeal in Stephen Slesinger, Inc. v. The Walt Disney Company, and the trial in the District Court on the validity of
the Hunt termination notice. SSI then sought to withdraw both the Fourth Amended Answer and its stipulation, but on
November 3, 2006, the District Court denied that request. SSI’s motion for summary judgment on the validity of Hunt’s
2002 attempt to recapture E. H. Shepard’s rights was granted on February 15, 2007, and thereafter, on March 27, 2007,
the District Court dismissed as moot all claims against Hunt and three of SSI’s counterclaims against the Company
related to the Company’s agreements with Milne and Hunt concerning the termination and disposition of their rights.
On January 3, 2008, the California Supreme Court denied SSI’s petition for review in the state court action, whereupon
on April 21, 2008, the Company moved for summary judgment on all of SSI's claims in the District Court action. On
June 3, 2008, the District Court ordered further briefing on the issue of whether SSI’s misconduct in the state court
action warrants dismissal of all of its claims in the District Court, and then on July 29, 2008, the District Court referred
the summary judgment motion to a Special Master, who rendered a sealed recommendation on March 26, 2009. On
May 19, 2009, the District Court granted the Company’s motion for summary judgment and dismissed without
prejudice SSI’s four contract and fraud counterclaims and invited the parties to file summary judgment motions on the
remaining infringement and unfair competition claims. On September 25, 2009, the District Court granted the
Company’s motion for summary judgment on SSI’s remaining claims and on October 21, 2009, SSI and the Company
filed applications for attorneys’ fees. On November 5, 2009, SSI appealed from the District Court’s judgment to the
Court of Appeals for the Ninth Circuit.
101
Relatedly, on December 4, 2006, August 22, 2007, February 8, April 18, August 27 and October 31, 2008, and
February 17, July 27, and November 17, 2009, SSI initiated proceedings in the United States Patent and Trademark
Office (PTO) seeking cancellation of certain Winnie the Pooh trademark registrations and opposing applications for
other Winnie the Pooh trademarks. Prior to July 27, the PTO had already suspended the then-pending proceedings on
the grounds that the relief sought is effectively duplicative of that sought in the Fourth Amended Answer. On
October 8, 2009, the Company advised the PTO of the District Court’s grant of summary judgment against SSI, and
requested dismissal of all of SSI’s pending proceedings. Also, on April 18, October 16 and October 27, 2008 and July 28,
2009, SSI initiated actions before the Canadian Intellectual Property Office (“CIPO”) opposing applications for certain
Winnie the Pooh trademarks. On September 4, 2008, and February 12 and March 10, 2009, the Company filed answers
to the actions before the CIPO, denying SSI’s claims.
The Company, together with, in some instances, certain of its directors and officers, is a defendant or
codefendant in various other legal actions involving copyright, breach of contract and various other claims incident to
the conduct of its businesses. Management does not expect the Company to suffer any material liability by reason of
such actions.
16
Fair Value Measurement
In September 2006, the FASB issued guidance on fair value measurements which provides a common definition
of fair value and establishes a framework to make the measurement of fair value in generally accepted accounting
principles more consistent and comparable. This guidance also requires expanded disclosures to provide information
about the extent to which fair value is used to measure assets and liabilities, the methods and assumptions used to
measure fair value, and the effect of fair value measures on earnings.
The Company adopted the guidance at the beginning of fiscal 2009 for fair value measurements of financial
assets and liabilities and fair value measurements of non-financial assets and liabilities made on a recurring basis. In
February 2008, the FASB updated the guidance, which delays the effective date for all nonrecurring fair value
measurements of nonfinancial assets and nonfinancial liabilities until the Company’s 2010 fiscal year. The Company
does not expect the adoption of the guidance for nonrecurring fair value measurements of nonfinancial assets and
nonfinancial liabilities will have a material impact on its financial statements.
Fair value is defined as the amount that would be received for selling an asset or paid to transfer a liability in an
orderly transaction between market participants and requires that assets and liabilities carried at fair value be classified
and disclosed in the following three categories:
• Level 1 – Quoted prices for identical instruments in active markets
• Level 2 – Quoted prices for similar instruments in active markets; quoted prices for identical or similar
instruments in markets that are not active; and model-derived valuations in which all significant inputs and
significant value drivers are observable in active markets
• Level 3 – Valuations derived from valuation techniques in which one or more significant inputs or significant
value drivers are unobservable
The Company’s assets and liabilities measured at fair value on a recurring basis are summarized in the following
table by the type of inputs applicable to the fair value measurements.
Fair Value Measurements at October 3, 2009
Description
Assets
Investments
Derivatives (1)
Residual Interests
Liabilities
Derivatives (1)
Other
Total
Level 1
$
8
—
—
Level 2
$
—
—
$
8
102
68
549
—
Level 3
$
(297)
—
$
320
2
—
64
Total
$
—
(13)
$
53
78
549
64
(297)
(13)
$
381
(1)
The Company enters into master netting arrangements by counterparty with respect to certain derivative
contracts. Contracts in a liability position totaling $170 million have been netted against contracts in an asset
position in the Condensed Consolidated Balance Sheet.
The fair value of Level 2 investments is primarily determined by reference to market prices based on recent
trading activity and other relevant information including pricing for similar securities as determined by third-party
pricing services.
The fair values of Level 2 derivatives, which consist of interest rate and foreign currency hedges, are primarily
determined based on the present value of future cash flows using internal models that use observable inputs such as
interest rates, yield curves and foreign currency exchange rates. Counterparty credit risk, which is mitigated by master
netting agreements and collateral posting arrangements with certain counterparties, did not have a material impact on
derivative fair value estimates.
Level 3 residual interests consist of our residual interests in securitized vacation ownership mortgage receivables
and are valued using a discounted cash flow model that considers estimated interest rates, discount rates, prepayment,
and defaults. There were no material changes in the residual interests in fiscal 2009.
Fair Value of Financial Instruments
In addition to the financial instruments listed above, the Company’s financial instruments also include cash, cash
equivalents, receivables, accounts payable and borrowings.
The fair values of cash and cash equivalents, receivables and accounts payable approximated the carrying values.
The estimated year end fair values of other financial instruments subject to fair value disclosures, determined based on
broker quotes or quoted market prices or interest rates for the same or similar instruments and the related carrying
amounts are as follows:
2008
2009
Carrying
Amount
Asset/(Liability)
Investments
Borrowings
Derivative contracts
$
Carrying
Amount
Fair Value
78
(12,701)
252
$
78
(12,643)
252
$
74
(14,639)
224
Fair Value
$
74
(14,848)
224
Transfers of Financial Assets
In December 2008, the FASB issued guidance to expand disclosure about transfers of financial assets.
Through December 4, 2008, the Company sold mortgage receivables arising from the sales of its vacation
ownership units under a facility that expired on December 4, 2008 and was not renewed. The Company sold
$17 million and $147 million of mortgage receivables during the years ended October 3, 2009, and September 27, 2008,
respectively, which resulted in gains totaling $4 million and $32 million for fiscal 2009 and fiscal 2008, respectively.
The Company continues to service the sold receivables and has a residual interest in those receivables. As of
October 3, 2009, the outstanding principal amount for sold mortgage receivables was $399 million and the carrying
value of the Company’s residual interest, which is recorded in other long-term assets, was $64 million.
The Company repurchases defaulted mortgage receivables at their outstanding balance. The Company did not
make material repurchases in the years ended October 3, 2009 or September 27, 2008. The Company generally has been
able to sell the repurchased vacation ownership units for amounts that exceed the amounts at which they were
repurchased.
The Company also provides credit support for the outstanding balance of the sold mortgage receivables which
the mortgage receivable acquirer may draw on in the event of losses under the facility. During fiscal 2009, the
Company amended certain terms of its agreement with the mortgage receivable acquirer including a provision for the
Company to provide support for up to 70% of the outstanding balance of sold mortgage receivables. The Company
maintains a reserve for estimated credit losses related to these receivables.
103
Credit Concentrations
The Company continually monitors its positions with, and the credit quality of, the financial institutions that are
counterparties to its financial instruments and does not anticipate nonperformance by the counterparties. In 2008,
Lehman Brothers Commercial Corporation defaulted on a $91 million trade settlement. The Company is pursuing
collection of this amount, but has fully reserved the amount.
The Company does not expect that it would realize a material loss, based on the fair value of its derivative
financial instruments as of October 3, 2009, in the event of nonperformance by any single derivative counterparty. The
Company enters into transactions only with derivative counterparties that have a credit rating of A- or better. The
Company’s current policy regarding agreements with derivative counterparties is generally to require collateral in the
event credit ratings fall below A- or in the event aggregate exposures exceed limits as defined by contract. In addition,
the Company limits the amount of investment credit exposure with any one institution.
The Company does not have material cash and cash equivalent balances with financial institutions that have a
credit rating of less than A-. As of October 3, 2009, the Company’s balances that exceeded 10% of cash and cash
equivalents with individual financial institutions were 38% compared to 63% as of September 27, 2008.
The Company’s trade receivables and financial investments do not represent a significant concentration of credit
risk at October 3, 2009 due to the wide variety of customers and markets into which the Company’s products are sold,
their dispersion across geographic areas, and the diversification of the Company’s portfolio among issuers.
17
Derivative Instruments
The Company manages its exposure to various risks relating to its ongoing business operations according to a
risk management policy. The primary risks managed with derivative instruments are interest rate risk and foreign
exchange risk.
The following table summarizes the gross fair value of the Company’s derivative positions as of October 3, 2009:
Current
Assets
Derivatives designated as hedges
Derivatives not designated as hedges
$
Gross fair value of derivatives
Counterparty netting
Total Derivatives (1)
(1)
$
Other Assets
88
37
297
127
125
(98)
424
(72)
27
352
Other
Accrued
Liabilities
$
$
Other LongTerm
Liabilities
(115)
(72)
(55)
(55)
(187)
103
(110)
67
(84)
(43)
Refer to Note 16 for further information on derivative fair values and counterparty netting.
Interest Rate Risk Management
The Company is exposed to the impact of interest rate changes primarily through its borrowing activities. The
Company’s objective is to mitigate the impact of interest rate changes on earnings and cash flows and on the market
value of its investments and borrowings. In accordance with its policy, the Company targets its fixed-rate debt as a
percentage of its net debt between a minimum and maximum percentage. The Company typically uses pay-floating
and pay-fixed interest rate swaps to facilitate its interest rate management activities.
The Company designates pay-floating interest rate swaps as fair value hedges of fixed-rate borrowings
effectively converting fixed-rate borrowings to variable rate borrowings indexed to LIBOR. As of October 3, 2009 and
September 27, 2008, the total notional amount of the Company’s pay-floating interest rate swaps was $1.6 billion.
During fiscal 2009 and fiscal 2008, $105 million and $68 million in gains, respectively, from mark to market adjustments
on pay-floating swaps and an offsetting $105 million and $68 million in losses, respectively, from mark to market
adjustments on hedged borrowings were included in net interest expense in the Consolidated Statements of Income,
respectively.
104
The Company designates pay-fixed interest rate swaps as cash flow hedges of interest payments on floating-rate
borrowings. Pay-fixed swaps effectively convert floating rate borrowings to fixed-rate borrowings. The unrealized
gains or losses from these cash flow hedges are deferred in accumulated other comprehensive income (AOCI) and
recognized as the interest payments occur. The notional amount of these contracts at October 3, 2009 and September 27,
2008 and the gains or losses recognized in income for the years then ended were not material.
Foreign Exchange Risk Management
The Company transacts business globally and is subject to risks associated with changing foreign currency
exchange rates. The Company’s objective is to reduce earnings and cash flow fluctuations associated with foreign
currency exchange rate changes enabling management to focus on core business issues and challenges.
The Company enters into option and forward contracts that change in value as foreign currency exchange rates
change to protect the value of its existing foreign currency assets, liabilities, firm commitments and forecasted but not
firmly committed foreign currency transactions. In accordance with policy, the Company hedges its forecasted foreign
currency transactions for periods generally not to exceed five years within an established minimum and maximum
range of annual exposure. The gains and losses on these contracts offset changes in the U.S. dollar equivalent value of
the related forecasted transaction, asset, liability or firm commitment. The principal currencies hedged are the Euro,
British pound, Japanese yen and Canadian dollar. Cross-currency swaps are used to effectively convert foreign
currency-denominated borrowings into U.S. dollar denominated borrowings.
The Company designates foreign exchange forward and option contracts as cash flow hedges of firmly
committed and forecasted foreign currency transactions. As of October 3, 2009 and September 27, 2008, the total
notional amount of the Company’s net foreign exchange cash flow hedges was $2.8 billion and $2.3 billion,
respectively. Mark to market gains and losses on these contracts are deferred in AOCI and are recognized in earnings
when the hedged transactions occur, offsetting changes in the value of the foreign currency transactions. The Company
recognized gains of $81 million and losses of $12 million in AOCI on foreign exchange contracts designated as cash
flow hedges for the years ended October 3, 2009 and September 27, 2008, respectively. Gains of $183 million and losses
of $200 million were reclassified from AOCI into revenue and costs and expenses for fiscal 2009 and fiscal 2008,
respectively. Gains and losses recognized related to ineffectiveness for the years ended October 3, 2009 and
September 27, 2008 were not material. Deferred losses recorded in AOCI for contracts that will mature in the next
twelve months totaled $32 million.
Foreign exchange risk management contracts with respect to foreign currency assets and liabilities are not
designated as hedges and do not qualify for hedge accounting. The notional amount of these foreign exchange
contracts at October 3, 2009 was $2.1 billion. For the year ended October 3, 2009, the Company recognized a net gain of
$140 million in costs and expenses on these foreign exchange contracts which generally offset the recognition of the
related economic exposures.
Risk Management – Other Derivatives Not Designated as Hedges
The Company enters into certain other risk management contracts that are not designated as hedges and do not
qualify for hedge accounting. These contracts, which include pay fixed interest rate swaps, commodity swap contracts
and credit default swaps, are intended to offset economic exposures of the Company and are carried at market value
with any changes in value recorded in earnings.
The notional amount of these contracts at October 3, 2009 and September 27, 2008 was $253 million and
$266 million, respectively. The gains or losses recognized in income for fiscal 2009 and fiscal 2008 were not material.
Contingent Features
The Company’s derivative financial instruments may require the Company to post collateral in the event that a
net liability position with a counterparty exceeds limits defined by contract and varying with Disney’s credit rating. If
the Company’s credit ratings were to fall below investment grade, certain counterparties would have the right to
terminate our derivative contracts, which could lead to a net payment to or from the Company for the aggregate net
value by counterparty of our derivative contracts. The aggregate fair value of all derivative instruments with creditrisk-related contingent features that are in a net liability position by counterparty on October 3, 2009 was not material.
105
18
Restructuring and Impairment Charges
The Company recorded charges totaling $492 million during fiscal 2009 which included impairment charges of
$279 million and restructuring costs of $213 million. The most significant of the impairment charges was $142 million
related to FCC radio licenses and $65 million related to our investment in UTV Group. The Company recognized
restructuring costs for severance and other related costs as a result of various ongoing organizational and cost structure
initiatives across our businesses based primarily on our existing severance plans or statutory requirements.
Restructuring and impairment charges for fiscal years 2008 and 2007 consisted of impairment charges of $39 million
and $26 million, respectively, related to FCC radio licenses.
106
QUARTERLY FINANCIAL SUMMARY
(In millions, except per share data)
(unaudited)
2009
Revenues
Net income
Earnings per share:
Diluted
Basic
Q1
Q2
Q3
Q4
(1)(2)(3)(4)
2008 (1)(2)
Revenues
Net income
Earnings per share:
Diluted
Basic
$
9,599
845
$
8,087
613
$
8,596
954
$
9,867
895
$
0.45
0.46
$
0.33
0.33
$
0.51
0.51
$
0.47
0.48
$
10,452
1,250
$
8,710
1,133
$
9,236
1,284
$
9,445
760
$
0.63
0.66
$
0.58
0.60
$
0.66
0.68
$
0.40
0.41
(1)
Results for the fourth quarter of fiscal 2009 include a non-cash gain in connection with the merger of Lifetime
Entertainment Services and A&E Television Networks ($0.07 per diluted share) and restructuring and impairment
charges ($0.06 per diluted share). The fourth quarter of fiscal 2008 included a bad debt charge for a receivable from
Lehman Brothers ($0.03 per diluted share) and an impairment charge ($0.01 per diluted share).
(2)
Results for the third quarter of fiscal 2009 include restructuring and impairment charges ($0.01 per diluted share).
The third quarter of fiscal 2008 included an accounting gain related to the acquisition of the Disney Stores North
America and a gain on the sale of movies.com (together $0.01 per diluted share) and favorable resolutions of
certain prior-year income tax matters ($0.03 per diluted share)
(3)
Results for the second quarter of fiscal 2009 include restructuring and impairment charges ($0.11 per diluted share)
(4)
Results for the first quarter of fiscal 2009 include a gain on the sale of our investment in two pay television services
in Latin America ($0.04 per diluted share).
ADDITIONAL INFORMATION
Reconciliations
The following table reconciles reported earnings per share to earnings per share excluding certain items affecting
comparability between years.
2009
2008
Change
Diluted EPS as reported
Exclude:
Restructuring and impairment charges
Other (income)/expense(1)
Favorable resolution of certain income tax matters
$ 1.76
$ 2.28
(23)%
Diluted EPS excluding certain items
$ 1.82
(1)
0.17
(0.11)
—
0.01
0.02
(0.03)
$ 2.28
nm
nm
nm
(20)%
Other (income)/expense for the current year consists of a non-cash gain in connection with the merger of Lifetime and A&E ($228 million pre-tax)
and a gain on the sale of our investment in two pay television services in Latin America ($114 million pre-tax). Other (income)/expense for the
prior year consists of an accounting gain related to the acquisition of the Disney Stores North America ($18 million pre-tax), a gain on the sale of
movies.com ($14 million pre-tax) and a bad debt charge for a receivable from Lehman Brothers ($91 million pre-tax).
Comparison of five-year cumulative total return
The following graph compares the performance of the Company’s common stock with the performance of the two
indicated indexes assuming $100 was invested on September 30, 2004 in the Company’s common stock and the two
indexes.
$200
$150
$100
$50
$0
September 30, 2004
$100
$100
$100
September 30, 2005
$108
$112
$110
September 30, 2006
$140
$124
$110
September 29, 2007
$159
$145
$122
September 27, 2008
$153
$113
$104
October 3, 2009
$129
$105
$ 99
The Walt Disney Company
S&P 500 Index
Peer Group Index
The peer group index is a custom index consisting of the surviving companies that were formerly included in the
Standard & Poor’s Entertainment and Leisure Index. Although this index was discontinued in January 2002, the
Company believes the companies included in the index continue to provide a representative sample of enterprises in
the primary lines of business in which the Company engages. These companies are, in addition to The Walt Disney
Company, media enterprises Time Warner Inc., CBS Corporation (formerly Viacom Inc.) (Class B common stock) and
Viacom Inc. (created on December 31, 2005 by the separation of the company formerly known as Viacom Inc. into two
publicly held companies, CBS Corporation and Viacom Inc.); resort and leisure-oriented companies Carnival
Corporation, Marriott International, Inc. and Starwood Hotels and Resorts Worldwide, Inc.; and consumer-oriented
businesses Brunswick Corporation, Darden Restaurants, Inc., McDonald’s Corporation, Starbucks Corporation, Yum!
Brands, Inc. and Wendy’s-Arby’s Group Inc.
BOARD OF DIRECTORS
SENIOR CORPORATE OFFICERS
PRINCIPAL BUSINESSES
John E. Pepper, Jr.
Chairman of the Board
The Walt Disney Company
Former Chairman and Chief Executive Officer
The Procter & Gamble Company and
Co-Chairman, National Underground Railroad
Freedom Center
Robert A. Iger
President and Chief Executive Officer
THE WALT DISNEY STUDIOS
Richard S. Ross
Chairman, The Walt Disney Studios
Susan E. Arnold
Former President-Global Business Units
The Procter & Gamble Company
John E. Bryson
Senior Advisor to Kohlberg Kravis Roberts & Co.
Former Chairman and Chief Executive Officer
Edison International
James A. Rasulo
Senior Executive Vice President and
Chief Financial Officer
Alan N. Braverman
Senior Executive Vice President and
General Counsel and Secretary
Kevin A. Mayer
Executive Vice President
Corporate Strategy, Business Development
and Technology
Christine M. McCarthy
Executive Vice President
John S. Chen
Chairman, Chief Executive Officer and President Corporate Finance and Real Estate and
Treasurer
Sybase, Inc.
WALT DISNEY PARKS AND RESORTS
Thomas O. Staggs
Chairman, Walt Disney Parks and Resorts
Worldwide
MEDIA NETWORKS
George W. Bodenheimer
Co-Chairman, Disney Media Networks
and President,
ESPN, Inc. and ABC Sports
Anne M. Sweeney
Co-Chairman, Disney Media Networks
and President,
Disney•ABC Television Group
Judith L. Estrin
Chief Executive Officer
JLabs, LLC
Jayne Parker
Executive Vice President and Chief Human
Resources Officer
DISNEY CONSUMER PRODUCTS
Andrew P. Mooney
Chairman, Disney Consumer Products
Worldwide
Robert A. Iger
President and Chief Executive Officer
The Walt Disney Company
Zenia B. Mucha
Executive Vice President
Corporate Communications
WALT DISNEY INTERNATIONAL
Andy Bird
Chairman, Walt Disney International
Steven P. Jobs
Chief Executive Officer
Apple Inc.
Ronald L. Iden
Senior Vice President
Global Security
DISNEY INTERACTIVE MEDIA GROUP
Stephen H. Wadsworth
President, Disney Interactive Media Group
Fred H. Langhammer
Chairman, Global Affairs
The Estee Lauder Companies Inc.
Brent A. Woodford
Senior Vice President
Planning and Control
Aylwin B. Lewis
President and Chief Executive Officer
Potbelly Sandwich Works
Monica C. Lozano
Publisher and Chief Executive Officer
La Opinión
Robert W. Matschullat
Former Vice Chairman and
Chief Financial Officer
The Seagram Company Ltd.
Orin C. Smith
Former President and Chief Executive Officer
Starbucks Corporation
STOCK EXCHANGES
Disney common stock is listed for trading on the
New York Stock Exchange under the ticker
symbol DIS. As of October 3, 2009, the
approximate number of common shareholders
of record was 1,009,288.
REGISTRAR AND STOCK TRANSFER AGENT
The Walt Disney Company
Shareholder Services
611 N. Brand Boulevard, Suite 6100
Glendale, California 91203
(818) 553-7200
E-mail: [email protected]
Internet: www.disneyshareholder.com
A copy of the Company’s annual report filed
with the Securities and Exchange Commission
(Form 10-K) will be furnished without charge
to any shareholder upon written request to the
address listed above.
DIRECT REGISTRATION SERVICES
The Walt Disney Company common stock can
be issued in direct registration (book entry or
uncertificated) form. The stock is DRS (Direct
Registration System) eligible.
(This page intentionally left blank)
Cert no. SCS-COC-000648
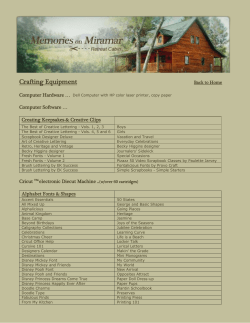


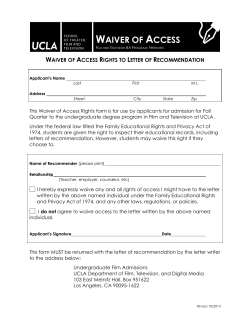


![—Not Warranting it’s adequate in ... [Sample Litigation Hold Letter from ... case, but it’s an example]](http://cdn1.abcdocz.com/store/data/000030073_2-6c36fd0490099ab95b4eb05c9c11a0b9-250x500.png)


© Copyright 2026