
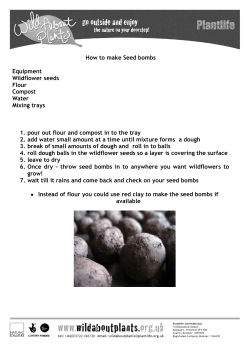
African Journal of Agricultural
Vol. 9(43), pp. 3215-3225, 23 October, 2014 DOI: 10.5897/AJAR2014.9022 Article Number: D7E039F48159 ISSN 1991-637X Copyright © 2014 Author(s) retain the copyright of this article http://www.academicjournals.org/AJAR African Journal of Agricultural Research Full Length Research Paper A comparative analysis of the agronomic characteristics and economic benefits of using certified seed and farmer saved seed of rice (Oryza sativa L.) at different nutrient management regimes: Evidence from on-farm testing in the Guinea Savanna rice growing ecologies of Ghana W. Dogbe1, S. Aliyu1, I. Y. B. Inusah1*, S. K. Nutsugah1, P. M. Etwire1, W. Doku2, M. Mawunya1, E. O. Krofa1, E. Halolo1 and A. Abdul-Rahman1 1 CSIR-Savanna Agricultural Research Institute, Box 52, Nyankpala - Tamale, Ghana. 2 Agricultural Value Chain Mentorship Project (AGRA - DANADA), Ghana. Received 22 July, 2014; Accepted 16 September, 2014 The agronomic performance and economic benefit of rice seed from two sources (farmer-saved and certified seed) at different nutrient management regimes in the Guinea Savanna agro-ecological zone of Ghana were evaluated. A total of 14 on-farm multi-locational trials were established in 2011 and 2012 cropping seasons using Participatory Learning and Action Research (PLAR-IRM) approach to technology dissemination. Regression analysis shows statistically significant differences (P <0.01) of treatment effect in terms of grain yield (kg/ha) for both certified and farmer-saved seed. The highest grain yield of 6,833 kg/ha was recorded for certified seed at full fertilizer recommendation rate for the 2012 growing season while the lowest grain yield of 30 kg/ha was recorded for famer saved seed at zero fertilizer management level for the same cropping season. Returns from cultivating certified rice seed was found to be economically superior to farmer saved seed at all levels of fertilizer management. Key words: Certified improved rice, farmer learning centres, Guinea Savanna agro-ecological zone, integrated soil fertility management. INTRODUCTION The importance of good quality seed in increasing whole farm productivity cannot in anyway be underestimated (Minot, 2008; Kshetri, 2010; Boland et al., 2011; Guei et al., 2011; Thompson and Scoones, 2012; Entwire et al., 2013; Poonia, 2013). The green revolution of the 1960s was a compact of technologies (variety, input, credit, market, etc) yet the role improved seed cultivars/varieties played in its success is a notable fact within the *Corresponding author. E-mail: [email protected] Author(s) agree that this article remain permanently open access under the terms of the Creative Commons Attribution License 4.0 International License 3216 Afr. J. Agric. Res. agricultural research community and various food policy think tank organizations (Briggs, 2009; Tomita, 2009; IFPRI, 2012; Cassman and Grassini, 2013). Seed is the pivotal point around which various approaches or concepts of increasing agricultural productivity revolve. Whether conventional or organic, starting with a clean, healthy and pure seed or seedling for planting is always the emphasis of farmers, agricultural extension officers, and research workers alike (Kshetri, 2010; Boland et al., 2011). Advances in molecular biology and biotechnological applications of the 21st century have introduced novel approaches such as recombinant DNA technology for precision gene(s) isolation, cloning, and incision at the cellular level. Nevertheless, focus still remains on seed as the fundamental laboratory through which productivity issues in agriculture can be addressed. This is because almost all the products of these technologies such as increased yield (Daoura et al., 2014), pest and disease resistance (Kamthan et al., 2012; Zeller et al., 2013), improved nutrition or biofortification (Stein, 2008; Dawe et al., 2002; Bhullar and Gruissem, 2013) and others all rely on seed as the focal point for ‘housing’ and ‘marketing’ these technologies. Against this backdrop, the issue of seed has constantly been one keenly contested, nay controversial, with various groups having their interests to promote and safeguard. Whether it is the introduction of hybrid seed and the accompanying protest by certain interest groups or the more recent sizzling debates on genetically modified (GM) crop seeds/cultivars (Halford and Shewry, 2000; Marchant, 2001; Dibden et al., 2013; Tironi et al., 2013), seed has always caused controversies in agriculture. One aspect to the debate on seed has to do with the issue of certified seed against farmer saved seed. The argument for a long time has been whether the extra costs on certified seed was really worth it? and in particular, for the self-pollinated inbreed lines of crop cultivars where farmers can make seed selection from their farms or at worse just pick lots from the grain harvested and use same as seed the next season. Researchers and extension workers alike generally stipulate that certified seed is superior to farmer saved seed, given a fundamental understanding that certified seed meets all the requirements of good seed. However, empirical evidence generated from on-farm trials to support this claim and use it as proof to convince farmers on the need to use certified seed especially for certain important grain cereals critical to food security in Ghana is lacking (Personal communication).This has often times been demanded during important policy discussions on food security in Ghana (Personal communication). With the world population expected to reach nine billion by 2050 (Falkenmark, 2001; Buhaug and Urdal, 2013), feeding the increasingly urbanized populated world is certainly one of the greatest challenges confronting humanity in this century (Koning and Ittersum, 2009). Globally, the importance of rice to food security is unquestionable to the extent that it has almost become synonymous to food security is certain geographical locations (Dawe and Timmer, 2012; Mariano and Giesecke, 2014). With a per capita consumption ranging from 21-38 kg, a national average of 22.1 kg per annum and a significant continuous increment in annual production, (Kula and Dormon, 2009; SRID, 2012), the significance of rice with respect to food security in Ghana is undisputable. With a population growth rate of 2.5% and an annual rice demand growth rate of 8.9%, a supply of 1.6 million tons of rice will be needed annually in Ghana by 2015 (Ofori et al., 2010). However, rice productivity at the local level is too low to meet this annual national rice demand (Angelucci et al., 2013). Indeed, the Ghana Minister for Food and Agriculture (MoFA) at a recent ‘Meet-the-Press’ meeting with newsmen in Accra, stated that “the average annual rice import bill stood at US$ 306 million with domestic production accounting for only 46% of total supply and the shortfall of 56% being met by imports”. The minister underscored the importance of developing a National Seed road map as an integral component of a national strategy to accelerate the growth of the rice industry (GhanaWeb, 2014). Years of research breeding programmes (both locally and at international research centres) have resulted in improved genotypes of rice (Hazell, 2010; Peng et al., 2010; Renkow and Byerlee, 2010; Ragasa et al., 2013). Most of these genotypes have been made available to farmers. A great proportion of rice farmers in Ghana use improved genotypes in their cultivation (Ragasa et al., 2013). However, the average yields recorded by rice farmers in Ghana continue to fall far below the potential yields reported by research and experimental stations. In as much these farmers continue to cultivate rice paying little attention to Integrated Rice Management (IRM) recommendations which among others, underscores integrated soil fertility management (ISFM) and the use of certified rice seed planting. Numerous interventions in the rice industry have also taken place in Ghana. These notwithstanding, only about 23% of the total area currently being cropped to rice is under certified seed (Etwire et al., 2013). Several yield gap analysts (Tran, 1996; Duwari et al., 1998; Evans and Fischer, 1999; Ofori et al., 2010) have suggested that this must be one of the factors why rice grain yields are always far below the average achievable yields at farm level. We report here, the results of two year on-farm trials comparing the performances of certified seed against famer saved seed of rice at different fertilizer management regimes in the GuineaSavanna rice growing ecologies of Ghana. MATERIALS AND METHODS Site selection and description The experiments were conducted in the Guinea Savanna agroecological zone (GSZ) of Ghana. Six communities were used as Dogbe et al. 3217 Table 1. Communities that hosted FLC learning plots. S/No District Community (host) 1 Tamale metropolitan Cheshie 2 Tolon Woribogu-kukuo 3 Karaga Karaga 4 East Gonja Libi 5 Yendi Kpatia 6 West Mamprusi Katabanawa GPS coordinates of FLC (GPSmap 60CSX) ⁰ N 09 21’ 18.5’’ ⁰ W 000 55’ 18.2’’ N 09⁰ 25’ 07.9’’ W 001⁰ 02’ 21.6’’ N 09⁰ 55’ 23.7’’ W 000⁰ 25’ 57.5’’ N 09⁰ 10’ 43.2’’ W 000⁰ 37’ 32.0’’ N 09⁰ 52’ 30.8’’ W 000⁰ 02’ 53.0’’ ⁰ N 10 35’ 03.7’’ ⁰ W 000 56’ 57.3’’ Figure 1. Map of northern Region of Ghana indicating districts where trials were sited ( ) (Created by Rarelibra (2014) for public domain use). sites for the experiments during the two year period (Table 1; Figure 1). The selected sites were representative of the various major rice growing ecologies in the Guinea Savanna zone of Ghana. The soils in Guinea Savanna agro-ecological zone of Ghana are dominated by Savanna Ochrosols. These soils are moderately deep to deep and are generally developed over granites and stones. Decomposing rock or hard rock may be encountered within 150 cm depth. The topsoils are generally thin (<20 cm), greyish brown sandy loam, weak granular and friable. They are light, varying in texture from coarse sands to loams. The subsoils range from red in summits to brownish yellow middle slope soils (especially on some sandstone soils). Ironstone concretions and sandstone brashes of about 10 to 40% commonly occur in some of these soils. The subsoils are relatively heavy, varying from coarse sandy loams to clays with varying amounts of gravel (Adu, 1995; Asiamah et al., 1996). According to Owusu-Bennoah et al. (1995), the texture of the soils in the northern part of Ghana varies from loamy sand, sandy loam to loam. The reported pH range of the soils is from 5.4 to 6.1. Majority of the soils in the GSZ occupy gentle undulating to gently rolling topography, yet are more vulnerable to erosion than 3218 Afr. J. Agric. Res. Table 2. Treatment combinations used in the study. Treatment levels (T) T0 T1 T2 T3 T4 Treatment description No fertilizer 0.5 RRF 0.5 RRF + 3 t/ha *Compost RRF RRF rate + 3 t/ha Compost Fertilizer regime explanation No NPK; No compost Half recommended fertilization rate of NPK Half recommended fertilization rate plus 3t/ha compost Recommended fertilization rate of NPK Recommended fertilization rate plus 3t/ha compost Table 3. Field layout of certified and farmer-saved seed demonstrations. *RF - Recommended fertilization rate of NPK. The recommended chemical fertilization regime for rice in the study area is NPK (60-40-40)/ha; usually provided as 267 kg/ha Compound fertilizer NPK (15-15-15) as basal manure and 44 kg/ha Urea (N46) or 95 kg/ha Sulphate of ammonia (N21) as top dresser. Certified seed + No fertilizer Certified seed + 0.5 RF Certified seed + 0.5 RF + 3t/ha compost Certified seed + RRF Certified seed +RF + 3 t/ha compost Farmer saved seed + No fertilizer Farmer saved seed + 0.5 RF Farmer saved seed + 0.5 RRF + 3 t/ha compost Farmer saved seed + RRF Farmer saved seed +RRF + 3 t/ha compost those soils occurring on the more strongly rolling relief of forest agro-ecological zones in the southern parts of Ghana. The GSZ is characterized by a uni-modal rainfall pattern with an annual mean of 1030 mm (May-October) with high degree of variability. The area has an extreme moisture regime relationship with about 5 months of rainy season and 7 months of dry season (NAES, 1993). A Farmer Learning Centre (FLC) is established in a focal community for 15 to 20 Farmer Based Organisations (FBOs) in a district where CSIR-SARI is implementing several Integrated Soil Fertility Management (ISFM) trials with farmers. Using the concept of FLCs in the catchment area farmers, machinery service providers and agro-input dealers and aggregators are inter-linked to enhance their productivity. Certified seed used for the trials was improved high yielding rice cultivar called Gbewaa rice, released by the CSIRSARI in 2012. Gbewaa rice is medium maturing (110 to 115 days) with a yield potential of 6,900 kg/ha. In the case of the farmer-saved seed, each hosting FBO was asked to provide their own seeds. Enquiries were made to ensure that such seed lots had no immediate history of coming from a certified source such as the Seed Inspectorate Unit of the Plant Protection and Regulatory Services Division (SIU/PPRSD) of the Ministry of Food and Agriculture (MoFA) or any seed dealer approved by the MoFA. Treatment description and application The experimental design was factorial and comprised two levels of seed (certified seed and farmer saved seed) as main plot and five levels of fertilizer (T0 -T4) as sub plot factors (Table 2). A complete demonstration plot at each FLC measured 2000 m2. Half of the field was used as treatment plots and the remaining was used by the host FBO as ‘Farmers’ Practice plot. The field layout is shown in Table 3. In the table, five sub plots in each main plot were randomly assigned and labelled as shown. A space of 0.50 m alley was created between two adjacent plots. The evaluation of certified and farmer-saved seed at different fertilizer management regimes constituted one of five different demonstrations at each FLC The trials were used for the purposes of research and farmer training through learning by doing approaches of Participatory Learning and Action Research (PLAR) FARMER’S PRACTICE (IRRI, 1998; Wopereis et al., 2008) for technology dissemination. The management of the all trial plots was mainly the responsibility of the various famer-based organizations hosting the demonstrations with regular backstopping from the CSIR-SARI researchers and MoFA Agricultural Extension Agents (AEAs). Data was collected for statistical analysis with the assistance of AEAs. Seeds were dibbled (at three - four per hill) at planting distance of 20 x 20 cm using a seed rate of 50 kg/ha for both the certified seed (CS) and the farmer-saved seed (FSS) plots. CS plots were thinned to one-two plants per stand after first hand weeding just before basal (first) fertilizer application. For all the different fertilizers levels and combinations, the basal fertilizers were applied 3 weeks after planting (WAP) whereas top-dressing fertilization was done at 6 WAP (after second hand weeding), except the compost treatment which was spread and worked into the designated plots before planting. Each treatment plot was enclosed by small bunds or levees to minimise lateral movement of fertilizers from one plot to others. All necessary agronomic practices were carried out as recommended for rice production in the GSZ. Deco compost The compost used in the study was Deco compost, produced from solid municipal waste and marketed by Deco Co. Ltd., Tamale Ghana. Jordão et al. (2006) found that the application of composted urban solid wastes to soils increased the available concentrations of Cu, Pb and Ni in the soil according to the increase in the doses of the compost used. Businelli et al. (2009) found that municipal waste compost amendment resulted in a significant enhancement of the metal loadings in the amended topsoils, particularly for Cu, Zn and Pb. Shulan et al. (2012) have however, indicated that particle size fractionation changed the physical properties and chemical component distribution of compost and that for more environmentally friendly agriculture, it was desirable to separate out fine compost fractions (<0.8 mm) because they have low concentrations of nutrients but more heavy metals. Physicochemical analysis report of Deco compost provided by the producers for this study (Table 4) met required standards of safety and rates of compost used were intended for melioration. Dogbe et al. 3219 Table 4. Deco compost physico-chemical analysis report (Source: Deco Co. Ltd). Analysis pH Bulk density (particle size 1.6-0.8 mm) Solids Moisture Organic matter Total Nitrogen (N) Organic Nitrogen Ammonium Nitrogen (NH4 -N) Carbon (C) Carbon/Nitrogen (C/N) ratio Phosphorus (as P2O5) Potassium (as K2O) Calcium (Ca) Magnesium (Mg) Sulphur (S) Sodium (Na) Aluminium (Al) Iron (Fe) Manganese (Mn) Copper (Cu) Zinc (Zn) Nitrite - (N) Agronomic data collection and analysis Data on grain yield and other agronomic important parameters were taken using the standard evaluation system for rice as guideline (IRRI, 2002). Average data of the two years on grain yield for the treatments across all the locations were subjected to regression analysis using the generalized linear model in Genstat 9th edition (Lawes Agricultural Trust, 2007). Economic analysis Weight basis 7.7 0.76 g/cm3 41.2% 58.8% 21.9% 0.85% 0.85% 2.7 mg/kg or 0.0003% 12.05% 14.8 0.56% 1.39% 1.71% 0.27% 0.18% 471 2008.5 mg/kg 3592 mg/kg 200 mg/kg 14.35 mg/kg 97.55 mg/kg 630.2 mg/kg A treatment is said to be economically superior if its marginal rate of return is greater than its acceptable minimum rate of return AMRR AMRR is the minimum returns that farmers expect ). ( to earn from a treatment which is a sum of returns to management and cost of capital or interest. Considering an average interest rate of 30% in northern Ghana and assuming a 100% return to AMRR management, the for this study is estimated to be 130%. A treatment is therefore economically superior if; MRR 130% In order to identify economically superior treatment(s), the study relied on partial budgeting, specifically the marginal rate of return MRR ( ). Analysis of the on-farm data was based on a hectare of land. A partial budget shows the effect of changes in treatments by comparing changes in net benefits to changes in total variable costs. Mathematically: MRRi i j i j Where MRRi is the marginal rate of return for the ith treatment, i is the net benefit of the ith treatment, j is the net benefit of the jth or preceding treatment, i is the total variable cost for the ith treatment and j is the total variable cost for the jth or preceding treatment. RESULTS AND DISCUSSION Table 5 depicts ANOVA results from the regression analysis for mean grain yield for certified and farmer saved seed during the two growing seasons. The analysis shows statistical significant differences (P <0.01) of treatment effect in terms of grain yield (kg/ha) for both certified and farmer saved seed sources (Table 5). Figure 2 shows results of scatter plot and regression while Table 6 summaries descriptive statistics for mean grain yield (kg/ha) for the two cropping seasons for certified and farmer-saved seed. At the various levels of fertilizer management regimes, the performance of the seed from the certified source proved superior relative to the farmer-save seed (Figure 2; Table 6). The highest grain yield of 6833 kg/ha was recorded for T4 - certified 3220 Afr. J. Agric. Res. Table 5. ANOVA results from the regression analysis for mean grain yield for certified and farmer saved seed during the two growing season. Variables Certified seed Farmer saved seed Source of variation Regression Residual Total Change Df 1 3 4 -1 MS 1659748 17254 427877 1659748 F-ratio 96.2 P-value 0.002 96.2 0.002 Regression Residual Total Change 1 3 4 -1 1060805 18315 278938 1060805 57.92 0.005 57.92 0.005 Figure 2. Results of scatter plot and regression for mean grain yield for the two cropping seasons for certified and farmer-saved seed. NB: Fertilizer levels and combination (T) are treatments: T1 – T4. (x-axis). seed at full fertilizer recommendation rate for the 2012 growing season whiles the lowest grain yield of 30 kg/ha was recorded for T0 –famer-saved seed at zero fertilizer management level in the 2012 cropping seasons (Table 6). However, comparing the mean grain yield for the two seed sources (certified and farmer saved seed) at all levels of fertilizer management, the 2011 cropping season gave comparatively higher grain yields (Table 6). Whenever additional compost was introduced in the fertilizer management regime in the study, the effect proved significant, leading to a corresponding linear increment in grain yield for the various seed sources in both seasons (Table 6; Figure 2). The co-efficients of determination (r2) from the regression analysis for certified seed and farmer-saved seed are 0.97 and 0.95 respectively (Figure 2). This indicates a very close fit regression plot with above 90% of variation explained by the regression line in both the certified and farmer saved seed analysis. Certified seed and farmer saved-seed Figure 3 shows a comparison of the average grain yield for the two year cropping seasons for certified seed and farmer-saved seed. It is evident from the figure that for 2011 and 2012, at all fertilizer management levels, rice yields from certified seed plots were much higher relative to yields from farmer-saved seed fields (Table 6; Figure 3). Duwari et al. (1998); IFPRI (2012); Ragasa et al. (2013) and other workers have demonstrated the superior grain yield advantage of certified seed in Dogbe et al. 3221 Table 6. Statistical description of grain yield (kg/ha) for certified and farmer saved seed during the two growing seasons Year Treatment Farmer saved seed Descriptive statistics Max Min Mean No fertilizer 1695 276 923 Half- RF Half RF+ Compost Full RF 2583 948 1598 2252 1141 1707 2618 1437 1852 Full RF + Compost 2502 2083 2318 2011 Certified seed Max Min Mean 2017 995 1516 2877 1235 2325 2888 1514 2465 3408 1922 2847 3244 2212 3152 Farmer saved seed Max Min Mean 2951 30 590 3562 250 982 3907 420 1125 4407 510 1454 6522 580 2090 Certified seed Max Min Mean 4313 40 850 5105 370 1333 4275 410 1488 4463 531 1934 6833 520 2725 Farmer saved seed Max Min Mean 2323 153 757 3073 599 1290 3080 781 1416 3513 974 1653 4512 1332 2204 Certified seed Max Min Mean 3165 518 1183 3991 803 1829 3582 962 1977 3936 1227 2391 5039 1366 2939 2012 Average for two years Figure 3. Comparison of the average grain yield for the two year cropping season for certified seed and farmer-saved seed. 3222 Afr. J. Agric. Res. Table 7. Average chemical and physical properties of cultivated soils in Northern Region of Ghana (After Dogbe et al., 2012). N (%) 0.07 Pmg/kg 4.2 Chemical properties Kmg/kg pH(H2O) 55.6 5.3 contrast to farmers-saved under various conditions. The reasons for the enhanced performance of certified seed are that: 1) it comes with high guarantee of seed viability and purity, healthiness, ensuring optimum plant population and vigorous plant establishment; 2) certified seed by virtue of being (genotypically) true-to-type of improved varieties or cultivars, is better in terms of resources use efficiency (water, radiation, soil nutrients etc.) hence will respond better to application of soil amendments including chemical fertilizers and compost (IRRI, 1998; Boland et al., 2011; Guei et al., 2011; Thompson and Scoones, 2012). The same cannot be said of farmer-saved seed which more often lacks genetic purity. This was evident in this study as at all the levels of soil amendment regimes, the performance of the certified seed proved superior. Also, farmers and AEAs alike observed during field days that the crops from farmer-saved seed did not look as vigorous and healthy as those from the certified seed and this could have contributed to depressed yields of the FSS compared to the CS plots. The report that farmersaved seed significantly losses it vigour after a number of years is well established in De Datta (1981); Guei et al. (2011) and Etwire et al. (2013). Rice farmers in Ghana are unwilling to purchase fresh seed every year and continue to recycle seeds. The phenomenon is very common across Sub-Saharan Africa particular for rice (Dogbe et al., 2012; Etwire et al., 2013). Given the fact that certified seed is so crucial for the success of the rice industry in any rice growing ecology, innovative ideas are required to ensure that good quality seed gets to the rice farmer. One such approach is the concept of Community-based Seed System (CBSS) where farmers are taught and encouraged to use part of their rice farms as ‘seed plots’ and to apply some basic seed production principles such as, improved land preparation practices to minimize mixtures, eliminating off-types by rogueing and storage in clean bags to ensure seed purity. With the active involvement of seed inspectors from the SIU/PPRSD/MoFA good quality rice seed can be made available to many farmers at the community level. This is because the seed systems in most sub-Saharan countries are not very strong and vibrant (Etwire et al., 2013). In the interim, while every effort must be made to rapidly overcome challenges in the seed systems, the relatively quite new concept of CBSS in Ghana needs to be nurtured and developed. CEC(Cmol/kg) 5.05 Physical properties Sand (%) Silt (%) Clay (%) 62.5 27 10.5 Use of deco compost The importance of organic matter to crop productivity via improvement in soil structure, improved water holding capacity, increase in the bio-availability of soil nutrients etc cannot be overstated. Indeed, Young (1976) observed that “The agricultural significance of organic matter in tropical soils is greater than that of any other property with the exception of moisture”. On the other hand, the poor health condition of soils in the Guinea Savanna zones of Ghana and West Africa, particularly with respect to organic matter content has been well documented (Vine, 1966; Asiamah et al., 1996). Summarized soil analysis data across 16 districts in Northern region (CSIR- SARI, 2009) are presented in Table 7. The leader of the soil survey team Dr. W. Dogbe made the following insights: “because of the low organic matter, low CEC and low clay levels in the soil, the nutrient holding capacity of the soil is significantly reduced. It is imperative for farmers to appreciate that the continuous use of only inorganic fertilizers on their soils cannot sustain production of cereals. There is the need therefore to enhance soil health within the cropping system through organic matter build-up”. Against this backdrop, the significantly enhanced grain yields obtained at all treatment levels which included compost relative to the preceding treatment without compost is quite well expected. RESULTS AND IMPLICATIONS DISCUSSION OF ECONOMIC Results of the partial budget for 2011 and 2012 as well as the average for both years are presented in Table 8a, b, c. In the ensuing analysis a dominated treatment was eliminated. A treatment is said to be dominated if its net benefit is lower than another. Analysis of the results showed that 0.5RR + 3 t/ha Deco compost was a dominated treatment hence it was not considered for further analysis. Returns from cultivating certified rice seed was found to be economically superior to farmersaved seed at all levels of fertilizer management. For instance, whereas farmers who utilize certified rice seed and apply half the recommended rate of fertilizer will Dogbe et al. 3223 Table 8a. Partial budgets for 2011. 2011/Treatment No Fert 0.5 RR 0.5RR + 3 t/ha Deco Compost RR RR + 3 t/ha Deco compost Yield CS FS 1516 923 2325 1598 2465 1707 2847 1852 3152 2318 Income CS FS 758 461.5 1162.5 799 1232.5 853.5 1423.5 926 1576 1159 Variable cost CS FS 833.25 808.25 928.25 903.25 1188.25 1163.25 1023.25 998.25 1283.25 1258.25 Net benefit CS FS -75.25 -346.75 234.25 -104.25 44.25 -309.75 400.25 -72.25 292.75 -99.25 Change in net benefit CS FS Change in variable cost CS FS MRR CS FS 309.5 242.5 95 95 3.26 2.55 166 -107.5 32 -27 95 260 95 260 1.75 -0.41 0.34 -0.1 Table 8b. Partial budgets 2012. 2012/Treatment No Fert 0.5 RR 0.5 RR + 3t/ha Deco Compost RR RR + 3 t/ha Deco compost Yield CS FS 850 590 1333 982 1488 1125 1934 1454 2725 2090 Income CS FS 637.5 442.5 999.75 736 1116 843.75 1450.5 1090.5 2043.75 1567.5 Variable cost CS FS 684.21 634.8 803.34 757.3 988.21 941.05 932.82 884.41 1130.88 1076.32 Net benefit CS FS -46.71 -192.3 196.41 -20.8 127.79 -97.3 517.68 206.09 912.88 491.18 Change in net benefit CS FS Change in variable cost CS FS MRR CS FS 243.13 171.5 119.13 122.5 2.04 1.4 321.27 395.19 226.89 285.09 129.48 198.05 127.11 191.91 2.48 1.99 1.79 1.49 Table 8c. Partial budgets – average for 2011 and 2012. Average for 2011 and 2012/ Treatment No Fert. 0.5 RR 0.5 RR + 3 t/ha Deco Compost RR RR + 3 t/ha Deco compost Yield CS FS 1183 756.5 1829 1290 1976.5 1416 2390.5 1653 2938.5 2204 Income CS FS 697.75 452 1081.13 767.75 1174.25 848.63 1437 1008.2 1809.88 1363.25 recoup their investment and still gain an additional income of GH¢ 2.65 for every GH¢1.00 invested, their colleagues who utilize farmer-seed will get an additional income of only GH¢1.98 (Table 8c). Farmers who utilize certified seeds make an Variable cost CS FS 758.73 721.53 865.79 830.28 1088.23 1052.15 978.04 941.33 1207.06 1167.29 Net benefit CS FS -60.98 -269.53 215.33 -62.53 86.02 -203.53 458.96 66.92 602.81 195.96 Change in net benefit CS FS Change in variable cost CS FS MRR CS FS 276.31 207 107.06 108.75 2.65 1.98 243.63 143.85 129.45 129.05 112.24 229..03 111.05 225.96 2.11 0.79 1.06 0.69 incremental income of GH¢0.67 for every GH¢1.00 invested over and above the additional incomes of their counterparts who utilize farmersaved seed. A change in management from no fertilizer to half the recommended rate of fertilizer as well as a change from half the recommended fertilizer rate to the full recommended fertilizer rate were both found to be profitable for certified seed and farmer saved seed as shown in Table 8c. The 3224 Afr. J. Agric. Res. Table 9. Decision criterion for fertilizer management regimes. Changing from No Fert. to 0.5 RR 0.5 RR to RR RR to RR + 3 t/ha Deco compost MRR (%) CS 265 211 79 marginal rate of return was however found to be higher when a farmer cultivates certified seed, in fact, in the case of changing from half the recommended rate to the full recommended rate, the returns to certified seed is twice the returns to farmer-saved seed. Adding 3 tons of Deco compost per hectare to the full recommended rate of fertilizer was found not be worthwhile for both certified and farmer seed. Decision criterion for fertilizer management regimes is summarised in Table 9. Clearly, applying half fertilizer rates or full rates in rice cultivation are both viable options compared to No fertilizer or Recommended rates plus 3 t/ha Deco compost. Compost application to the soil like mulching, does not perform instant miracles. It may not in the short term translate into enhanced rice yields or profit but as far as certified seed was concerned, there was a significant increase in yield of T4 (RR + 3 t/ha compost) relative to all the other treatments. Dogbe et al. (2012) have opined that among the various ways (Conservation agriculture, Green manuring, Composting) available for improving soil organic matter, the use of compost in the short term seems to be most appropriate. Conclusion Returns from cultivating certified rice seed was found to be economically superior to farmer-saved seed at all levels of fertilizer management. Although there often are some concerns about the quality of seed purchased from the agro-input dealers particularly for rice in Ghana, nonetheless the results of this study show that it pays a lot to invest in certified seed. Irrespective of the fertilizer regime adopted by rice producers, they are better off cultivating certified seed as compared to farmer-saved seed. In contrast, farmers are worse off economically if they fail to apply fertilizer or apply a combination of either half or full recommended rates of fertilizer together 3 tons of Deco compost per hectare. Conflict of Interest The authors have not declared any conflict of interest. ACKNOWLEDGEMENTS The authors wish to acknowledge the CSIR-SARI and the MRR (%) FS 198 106 69 AMRR (%) >130 >130 <130 Decision Recommended Recommended Not recommended AGRA–DANIDA sponsored Agricultural Value Chain Mentorship Project for providing the support for this work. We also commend our tireless partners - Ministry of Food and Agriculture (MoFA) Directors and Agricultural Extension Agents in all the19 Districts of northern Region of Ghana in which we have been working for the last four years. REFERENCES Adu SV (1995). Soils of the Nasia Basin, Northern Region, Ghana. Memoir Number 11. Soil Research Institute, Kumasi, Ghana. PMCid:PMC1553320 Angelucci F, Asante-Poku A, Anaadumba P (2013). Analysis of incentives and disincentives for rice in Ghana. Technical notes series, MAFAP, FAO, Rome. Asiamah RD, Senayah JK, Adjei-Gyapong T (1996). Ethno-pedoligical surveys in the semi-arid savanna zone of northern Ghana. An ILEIA initiated project. Soil Research Institute Technical Report No.185, Kumasi, Ghana. Bhullar KN, Gruissem W (2013). Nutritional enhancement of rice for human health: The contribution of biotechnology. Biotechnol. Adv. 31:50–57. http://dx.doi.org/10.1016/j.biotechadv.2012.02.001 Boland M, Dhuyvetter KC, Howe M (2011). Economic issues with Certified and Farmer-Saved Wheat Seed. Agricultural industry competiveness, Enhace the value of Kansas agricultural goods. Kansas State University Agricultural Experiment Station and Cooperative Extension Service. Briggs J (2009). Development: the Green Revolution. In Kitchen, R. and Thrift, N. (eds.) International Encyclopaedia of Human Geography, 634-638. (Elsevier, Oxford). http://dx.doi.org/10.1016/B978-008044910-4.00099-7 Buhaug H, Urdal H (2013). An urbanization bomb?Population growth and social disorder in cities. Glob. Environ. Change 23:1–10. http://dx.doi.org/10.1016/j.gloenvcha.2012.10.016 Businelli D, Massaccccesi L, Said-Pullicino D, Gigliotti G (2009). Longterm distribution, mobility and plant availability of compost-derived heavy metals in a land-fill covering soil. Sci. Total Environ. 407:1426. http://dx.doi.org/10.1016/j.scitotenv.2008.10.052 Cassman KG, Grassini P (2013). Can there be a green revolution in Sub-Saharan Africa without large expansion of irrigated crop production? Global Food Security 2:203–209. http://dx.doi.org/10.1016/j.gfs.2013.08.004 Daoura BG, Chen L, Du Y, Hu Y (2014). Genetic effects of dwarfing gene Rht-5 on agronomic traits in common wheat (Triticum aestivum L.) and QTL analysis on its linked traits. Field Crops Res. 156:22–29. http://dx.doi.org/10.1016/j.fcr.2013.10.007 Dawe D, Robertson R, Unnevehr L (2002): Golden rice: what role could it play in alleviation of vitamin A deficiency? Food Policy 27:541–560. http://dx.doi.org/10.1016/S0306-9192(02)00065-9 Dawe D, Timmer CP (2012). Why stable food prices are a good thing: Lessons from stabilizing rice prices in Asia. Glob. Food Sec. 1:127– 133. http://dx.doi.org/10.1016/j.gfs.2012.09.001 De Datta SK (1981) Principles and Practices of Rice Production. John Wiley and Sons Ltd. pp. 89-145. Dibden J, David GD, Cocklin C (2013). Framing GM crops as a food security solution. J. Rur. Stud. 29:59-70. Dogbe W, Sogbedji J, Buah SSJ, Nutsugah SK, Kanton RAL, Atokple Dogbe et al. IDK, Amankwa A, Wiredu AN, Karikari AS, Djamon K, Osei C, Ajayi O, Ndiaye K (2012). Partnership for improved access to agro-inputs and technology: Some experiences from the emergency rice initiative project in Ghana. Afr. J. Agric. Res. 7(34):2790-4802. Duwari M, Tran DV, Nguyen VN (1998). Reflections on yield gaps in rice production: how to narrow the gaps. International Rice Commission, 98/7-12, Cairo, Egypt. P. 21. Etwire PM, Atokple IDK, Buah SSJ, Abdulai AL, Karikari SA, Peter AP (2013). Analysis of the seed system in Ghana. Int. J. Adv. Agric. Res. 1:7-13. Evans LT, Fischer RA (1999). Yield potential: Its definition, measurement, and significance. Crop Sci. 39:1544-1551 http://dx.doi.org/10.2135/cropsci1999.3961544x Falkenmark M (2001). Book Reviews. Ecol. Econ. 39:309–320. http://dx.doi.org/10.1016/S0921-8009(01)00219-1 GhanaWeb (2014). Ghana takes steps to increase local rice production. Business News: Thursday, 24th April, 2014. Accra, Ghana. Guei RG, Barra A, Silue D (2011). Promoting Smallholder Seed Enterprises: Quality Seed Production of Rice, Maize, Sorghum and Millet In Northern Cameroon. Int. J. Agric. Sustainability 9(1):91-99. http://dx.doi.org/10.3763/ijas.2010.0573 Halford NG, Shewry PR (2000). Genetically modified crops: methodology, benefits, regulation and public concerns. Brit. Med. Bull. 56(1):62-73. http://dx.doi.org/10.1258/0007142001902978 Hazell PBR (2010). An Assessment of the Impact of Agricultural Research in South Asia since the Green Revolution. Handbook Agric. Econ. p. 4. http://dx.doi.org/10.1016/S1574-0072(09)04068-7 International Food Policy Research Institute (IFPRI) (2012). Green Revolution: Curse or Blessing? Sustainable options for ending hunger and poverty. Policy brief, IFPRI, 2033 K Street, N.W., Washington D.C. 20006-1002. USA. International Rice Research Institute (IRRI) (1998). Farmer participatory research and best inbred variety. Los Ba-os, the Philippines, CREMNET-IRRI. P. 11. International Rice Research Institute (IRRI) (2002). Standard Evaluation Systems for Rice. Los Ba-os, Philippines. P. 49 Jordão CP, Nascentes CC, Cecon PR, Fontes RLF, Pereira JL (2006). Heavy metal availability in soil amended with composted urban solid wastes. Environ Monit. Assess. 112:309. http://dx.doi.org/10.1007/s10661-006-1072-y Kamthan A, Kamthan M, Azam M, Chakraborty N, Chakraborty S, Datta A (2012): Expression of a fungal sterol desaturase improves tomato drought tolerance, pathogen resistance and nutritional quality. Scientific Reports 2(951) Koning N, Ittersum MKV (2009). Will the world have enough to eat? Curr. Opin. Environ. Sustain. 1:77–82. http://dx.doi.org/10.1016/j.cosust.2009.07.005 Kshetri BT (2010). On-farm management and quality assessment of farmers' saved wheat seed in the western Terai, Nepal. Agron. J. Nepal (1):2010. Kula O, Dormon E (2009). Food Security Response: Ghana Rice Study. USAID, micro—Report P. 156. Lawes Agricultural Trust (Rothamsted Experimental Station) (2007). GenStat 9th Ed. Genstat Procedure Library. Release PL17.1; VSN International, 5. The Waterhouse, Waterhouse Street, Hemel Hempstead, Hertfordshire HP1 1ES, UK. Marchant R (2001). From the test tube to the table: Public perception of GM crops and how to overcome the public mistrust of biotechnology in food production: EMBO reports 2:5. http://dx.doi.org/10.1093/embo-reports/kve099 Mariano MJM, Giesecke JA (2014). The macro-economic and food security implications of price interventions in the Philippine rice market. Econ. Model. 37:350–361. http://dx.doi.org/10.1016/j.econmod.2013.11.025 3225 Minot N (2008). Promoting a Strong Seed Sector in Sub-Saharan Africa. International Food Policy Research Institute (IFPRI). Policy Brief P. 6. NAES (1993). Report 9.Farm Household Systems in Northern Ghana.Edited by ArturRunge-Metzeger and Lothar Diehl. Research Approach at the Nyankpala Agricultural Research Station (NAES). (Schmidt G & Mercer-Quarshie H).VerlagJosef Margraf, Hohenloher, Str no. 2, Weikersheim, Germany 3(8):36-38. Ofori E, Kyei-Baffour N, Mensah E, Agyare WA (2010). Yield Gap analysis in rice production from stakeholders' perspective at Annum valley bottom irrigation Project at Nobewam in Ghana. ARPN J. Agric. Biol. Sci. 5:6. Owusu-Bennoah E, Ampofo JG, Acquaye DK (1995). Phosphorus status of some semi-arid agricultural soils of northern Ghana. Ghana J. Agric. Sci. 28-29:29-35. Peng S, Huang J, Cassman KG, Laza RC, Visperasa RM, Khushd GS (2010). The importance of maintenance breeding: A case study of the first miracle rice variety-IR8. Field Crops Res. 119:342–347. http://dx.doi.org/10.1016/j.fcr.2010.08.003 Poonia TC (2013). History of Seed Production and its Key issues. Int. J. Food Agric. Vet. Sc. 3(1):148-154. Ragasa C, Dankyi A, Acheampong P, Wiredu AN, Chapo-to A, Asamoah M, Tripp R (2013). Patterns of Adoption of Improved Rice Technologies in Ghana. IFPRI, Working paper 35. Rarelibra (2014). Map of Northern Ghana. Available on line at: http://commons.wikimedia.org/wiki/File:Northern_Ghana_districts.png Renkow M, Byerlee D (2010). The impacts of CGIAR research: A review of recent evidence. Food Policy 35: 391–402. http://dx.doi.org/10.1016/j.foodpol.2010.04.006 Shulan Z, Xiaobo L, Lian D (2012). Physical and chemical characterization of solid municipal waste compost in different particle size fractions. Pol. J. Environ. Stud. 21:(2)509-515. Statistics, Research and Information Division (SRID) (2012). Agriculture in Ghana: Facts and figures. Ministry of Food and Agriculture (MoFA), Accra, Ghana. Stein AJ (2008). Genetic Engineering for the Poor: Golden Rice and Public Health in India. World Development 36(1):144–158. http://dx.doi.org/10.1016/j.worlddev.2007.02.013 Thompson J, Scoones I (2012). The Political Economy of Cereal Seed Systems in Africa's Green Revolution. Future Agriculture consortium, University of Sussex, Brighton BN1 9RE UK. Policy Brief P. 44. Tironi M, Salazar M, Valenzuela D (2013). Resisting and accepting: Farmers' hybrid epistemologies in the GMO controversy in Chile. Technol. Soc. 35:93–104. http://dx.doi.org/10.1016/j.techsoc.2013.01.004 Tomita M (2009). Introgression of Green Revolution sd1 gene into isogenic genome of rice super cultivar Koshihikari to create novel semidwarf cultivar 'Hikarishinseiki' (Koshihikari-sd1). Field Crops Res. 114:173–181. http://dx.doi.org/10.1016/j.fcr.2009.05.004 Tran DV (1996). Evolution of rice yield in Asia and the Pacific.Expert Consultation on Technology, Evolution and Impact for Sustainable Rice Production in Asia-Pacific.Bangkok, Thailand, FAO P.18. Vine H (1966). Tropical soils. In Agriculture in the Tropics (eds. Webster CC, Wilson PN - 1st Ed.) Longmans, London, UK. Wopereis MCS, Defoer T, Idinoba P, Diack S, Dugué MJ (2008). Participatory Learning and Action Research (PLAR) for Integrated Rice Management (IRM) in Inland Valleys of Sub-Saharan Africa: Technical Manual. WARDA Training Series. Cotonou, Benin: Africa Rice Centre P. 128. Young A (1976). Tropical soils and soil survey. Cambridge University Press. Cambridge. Zeller SL, Kalinina O, Schmidt B (2013). Costs of resistance to fungal pathogens in genetically modified wheat. J. Plant Ecol. 6(1):92–100. http://dx.doi.org/10.1093/jpe/rts013


© Copyright 2026