
ANALYSIS OF THE AFFORDABLE CARE ACT (ACA) MEDICAID EXPANSION IN KENTUCKY Kentucky Cabinet for Health and Family Services
ANALYSIS OF THE AFFORDABLE CARE ACT (ACA) MEDICAID EXPANSION IN KENTUCKY Kentucky Cabinet for Health and Family Services EXECUTIVE SUMMARY The Commonwealth of Kentucky faces a critical choice, perhaps the most important decision that Kentucky has ever had to make in terms of health care, its citizens’ overall health, and the entire health care system. Consequently, the Cabinet for Health and Family Services (CHFS) has researched the issue of Affordable Care Act (ACA) Medicaid expansion for several months. CHFS has gathered and read a multitude of published papers to determine the best path forward for Kentucky. CHFS hired Price Waterhouse Coopers, a third party actuarial firm, to perform actuarial projections of cost. The Urban Studies Institute at the University of Louisville was contracted to perform an economic impact study using the same tools they would employ to gauge the economic impact of any large employer deciding to locate a major facility or operations plant within the Commonwealth. This information has been compiled so all parties and persons interested in health care in Kentucky can understand the facts surrounding the ACA. After exhaustive review, CHFS strongly recommends expanding Medicaid in Kentucky. The Cabinet has found that not only will expansion have tremendous benefits for the health of hundreds of thousands of Kentuckians; upon full implementation, it would cost Kentucky more to turn it down. • Medicaid expansion is positive for improved health care. o Kentucky has poor health outcomes. Kentucky is ranked: 50th in smoking 40th in obesity 43rd in sedentary lifestyles 41st in diabetes 48th in poor mental health days1 49th in poor physical health days2 50th in cancer deaths 49th in cardiac heart disease 43rd in high cholesterol 48th in heart attacks 44th in annual dental visits o Multiple studies show improved health outcomes with increased insurance coverage. There are currently 640,000 uninsured Kentuckians, or 17.5 percent of the state’s population under age 65. An estimated 332,000 of these uninsured individuals can gain coverage through the Health Benefit Exchange, including 276,000 individuals whose income is between 138% and 400% FPL 1 2 Number of days in the previous 30 days when a person indicates their activities are limited due to mental health difficulties Number of days in the previous 30 days when a person indicates their activities are limited due to physical health difficulties 1 and will be able to get subsidized coverage. With expansion of Medicaid, the other 308,000 uninsured Kentuckians can gain health insurance coverage through Medicaid. This group includes single men and women making less than approximately $16,000 a year and families of four with an estimated annual income of no more than $32,500. However, the ACA does not allow for subsidized coverage for those under 100% FPL. Therefore, if the Commonwealth does not expand Medicaid, an estimated 206,000 uninsured individuals who fall under that threshold would not be able to get Medicaid or subsidized coverage. • • Expansion would have huge positive economic and budgetary impacts. o Effective January 1, 2014, the federal government is willing to incentivize the state to expand Medicaid to 138% of the Federal Poverty Level (FPL) by funding 100% of the expansion costs for 3 years starting in 2014, then gradually decreasing funding to 90% in 2020. The average federal payment between SFY 2014 and SFY 2021 is over 95% of the costs. o Expansion would create a $15.6 billion economic impact from FY14 to FY21, as well as nearly 17,000 new jobs in Kentucky. o Expansion would create a $802.4 million positive budget impact from FY14 to FY21, from the opportunity to switch certain expenditures from state to federal dollars, increased federal funding, and increased tax revenues associated with the creation of jobs. o A choice must be made soon so the state can make plans to maximize the health and financial impacts. Kentucky can decide to pull back the expansion at any time should funding or circumstances warrant such a move. There are significant costs to state and the state’s businesses if we do not expand, or if the state purchases private insurance. o There are a number of costs that Kentucky will be required to absorb, or continue absorbing, whether or not Medicaid is expanded. These costs mean that, upon full implementation, it would cost the state more not to expand that to expand: Woodwork Effect (people who come “out of the woodwork” that are currently eligible for Medicaid under existing rules, but have not enrolled). Under ACA, substance abuse is an essential health benefit and must be offered to existing Medicaid members. ACA will reduce Federal Disproportionate Share Hospital (DSH) payments to states by $14 billion over the next 10 years, including state‐operated facilities. Kentucky will incur required additional administrative costs necessary to change eligibility programs, change computer systems to accept the new Modified Adjusted Gross income (MAGI) eligibility, and change policies as mandated by ACA. Eligibility simplification will cause a slight surge in Medicaid enrollment. o Upon full implementation in FY21 of the ACA, Kentucky would see a negative $38.9 million impact to the state if it does not expand. o Kentucky employers could face $32 to $48 million in fines annually for failing to provide affordable insurance if Medicaid is not expanded. o Kentucky hospitals will see a cut of an estimated $287.5 million from FY14‐FY21 in DSH payments. 2 • • 20 other states have decided to expand Medicaid. While some states are considering purchasing private insurance for Medicaid enrollees, congressional research has shown that, on average, it is 50% more expensive than traditional Medicaid. Kentucky has an unprecedented opportunity to improve the health outcomes of its citizens by providing more comprehensive insurance coverage through the expansion of Medicaid. No one can dispute that providing necessary care, and medical coverage to the poor has a positive outcome on individual health. Finally, if an employer were interested in investing in the state, creating a $15.6 billion economic impact upon full implementation and nearly 17,000 jobs while significantly reducing the uninsured population, how would the Commonwealth respond? State leadership would jump at the chance to initiate the economic impact and create jobs. ACA expansion is no different. The Commonwealth of Kentucky must make a small investment of General Fund dollars, but the return on that investment is tremendous. It is for these reasons and the issues fully documented in this paper that the Department for Medicaid Services and the Cabinet for Health and Family Services support Medicaid expansion in the Commonwealth of Kentucky. 3 BACKGROUND provides information on Kentucky’s population by age and income level. uninsured The Affordable Care Act Medicaid Expansion Overall, 17.5% of Kentuckians under the age of 65 are uninsured. This percentage varies significantly between children and adults, with 6.7% of Kentucky children and 21.9% of Kentucky adults under 65 uninsured. Senior citizens are not included due to the fact that they are universally eligible for Medicare. Charts 1 and 2 provide information on the insurance status of Kentucky children and adults. The Patient Protection and Affordable Care Act (ACA) was designed to significantly reduce the number of uninsured in the United States through expansion of Medicaid coverage to people with incomes up to 138% of the Federal Poverty Level (FPL) and provision of subsidies to purchase health insurance to people with incomes from 100% to 400% FPL. In its June 2012 ruling on ACA, the United States Supreme Court held that the U.S. Department of Health and Human Services (HHS) may not penalize states that do not expand Medicaid up to 138% FPL by terminating federal funding for the state’s entire Medicaid program. By eliminating the enforcement mechanism, this ruling allows each state to determine whether or not it will implement the ACA Medicaid expansion. (Kentucky Voices for Health [KVH], 2012, Kaiser Commission on Medicaid and the Uninsured [KAISER], (2012)). Chart 1 ‐ Insurance Coverage in Kentucky for Children Under 19 UNINSURED > 400% FPL 4,964 As state leaders make this decision, they are considering a number of financial and non‐financial factors, including the benefit cost in state dollars to adopt the Medicaid expansion, changes in state administrative costs attributable to the expansion, savings to the state from decreasing the number of uninsured residents, the economic impact on the state economy of increased federal Medicaid contributions, and a variety of non‐financial impacts of the Medicaid expansion, including its projected impact on health status and work force factors. INSURED 981,783 Both Kentucky‐specific and national data clearly document the negative impact the lack of health insurance coverage has on individual health outcomes. Kentucky Voices for Health (2012) reports the problems uninsured Kentuckians experience in obtaining needed health care: The Uninsured in Kentucky An estimated 640,974 Kentuckians, of all income levels, under the age of 65, were uninsured in 2010 (United States Census Bureau [CENSUS], (2012). Table 1 Table 1 Kentucky’s Uninsured Population by Income Level Population Income Level Under 65 Uninsured # % UNINSURED 138% ‐ 400% FPL UNINSURED 32,407 < 138% FPL 33,099 Insured # % Above 400% FPL 1,035,639 55,635 5.4% 980,004 94.6% 138% to 400% FPL 1,590,971 276,942 17.4% 1,314,029 82.6% Below 138% FPL 1,026,571 308,397 30.0% 718,174 70.0% TOTAL 3,653,181 640,974 17.5% 3,012,207 81.5% • Kentuckians without health insurance were more than three times more likely to skip needed medical care than insured Kentuckians. • More than half of uninsured Kentuckians did not fill a prescription for medicine. • More than 40% of uninsured Kentuckians did not see a specialist when needed. • Almost one‐third of the uninsured reported using all or most of their savings to pay medical bills in the previous year. (KVH, 2012, p. 2) 4 Chart 2 ‐ Insurance Coverage in Kentucky for Adults Under 65 UNINSURED > 400% FPL 50,671 • UNINSURED 138% ‐ 400% FPL 244,535 UNINSURED < 138% FPL 275,298 • INSURED 2,030,424 not adopt the expansion; and the impact of migration across state lines if some states adopt the expansion and others do not. Non‐financial impacts, including the poor health status of Kentucky citizens; increased access to care with health insurance coverage; reduced mortality and improved health status associated with health insurance coverage; and labor market impacts of expanded coverage. Future considerations concerning the adequacy of health provider resources if Medicaid coverage is expanded. ANALYSIS OF THE ACA MEDICAID EXPANSION IN KENTUCKY Baseline Assumptions Woodwork Effect. Increased Medicaid enrollment and costs associated with ACA are expected for all states, whether or not they implement the Medicaid expansion. This increase in the enrollment of currently eligible, but not enrolled, people is anticipated due to the individual coverage mandate included in ACA, enrollment simplification measures required by ACA, and the information that will saturate news media and general communication channels about health insurance coverage. This phenomenon is called the “woodwork effect.” States that do not implement the Medicaid expansion are expected to experience a smaller Medicaid enrollment increase than those that do expand (Bovbjerg & Hadley, 2007; State Health Reform Assistance Network [SHRAN], 2012; KAISER, 2012). Clear connections have also been documented between lack of health insurance coverage and increased mortality and premature death, as well as increased morbidity. (Sommers, et al., 2012; IOM, 2009; Bovbjerg and Hadley, 2007; Bernstein et al., 2010; Hadley, 2007.) INTRODUCTION Kentucky has analyzed the potential costs and impacts of adopting the ACA Medicaid expansion. This paper presents the results of that analysis, including: • • • Baseline assumptions underlying the analysis. Financial factors: o The cost in state dollars to serve the new ACA eligibles; o The cost in state dollars to serve the “woodwork” population; o The impact of transitioning currently eligible Medicaid populations to the newly eligible group; o The impact of reductions in state programs to serve the uninsured; o Administrative costs associated with the expansion; o The overall impact of the expansion on the Commonwealth’s economy. Special considerations, including the increases in Medicaid eligibles states can expect even if they do As indicated above, enhanced Federal funds participation (FFP) is available to states to serve the ACA Medicaid expansion group. States will continue to receive their regular FFP for the current eligibles who enroll in Medicaid after 2013. In Kentucky, the current FFP rate is 70.55% for Federal Fiscal Year 2013. Kentucky estimated the “woodwork” population using data from the Current Population Survey (CPS). Currently in Kentucky, adults may become eligible for Medicaid only if they have a disability, serve as the caretaker relative for a child who is Medicaid‐eligible, or are pregnant. The income standard for adult caretaker relatives who are currently eligible for Medicaid is not 5 participation, relative to newly eligible participation, anticipated by other states. firmly fixed to a poverty level, but fluctuates, relative to the FPL, based on whether the income is earned or unearned and family size. Forty‐three percent (43%) FPL was identified as the best estimate, general indicator of financial eligibility for this group by Price Waterhouse Coopers, the actuarial firm that currently assists the Commonwealth with actuarial projections for Medicaid. Monthly Cost per Member. Current per member per month (PMPM) Managed Care Organization contract rates were used as the reasonable starting point for estimating monthly costs for newly eligible members, as well as the woodwork population. While the newly eligible population is similar to current enrollees, they are not identical. To account for differences between the expansion population and the current population, the Kentucky analysis applied population cost adjustments: Because Kentucky children with family income up to 200% FPL are currently eligible for Medicaid or the Kentucky Children’s Health Insurance Program (KCHIP), all children with incomes under 138% FPL, who are not currently enrolled in Medicaid, are part of the woodwork population. • Although newly enrolled children are all part of the woodwork population and will not receive the enhanced FFP for the ACA expansion group, ACA also increased the FFP rate for State Children’s Health Insurance (CHIP) Programs. The FFP increase of 23 percentage points, capped at 100%, is effective from Federal Fiscal Years 2016 through 2019. In Kentucky, this translates to an increase in the current KCHIP match rate from approximately 79% to 100%. • • Underlying Population Growth. Historically, changes in the population enrolled in Medicaid are more closely associated with economic changes than with overall population growth. Therefore, population growth was not incorporated into cost estimates of the Medicaid expansion in Kentucky. The newly eligible population will initially be more expensive to serve than the current population as the sickest individuals will quickly enroll. As time passes and enrollment increases, the cost per enrollee should drop below that of current enrollees. For women of childbearing age, the newly enrolled population is less expensive to serve than current enrollees, since Medicaid currently covers all pregnant women with income under 138% FPL. While the same monthly rates were used to estimate costs for the woodwork population, this population is likely to be less expensive to serve than current eligibles. Because this group is currently eligible, but has not taken the steps necessary to enroll, they are likely to be relatively healthy compared to a typical Medicaid enrollee. Take‐up Rate. Historically, enrollment in means‐tested programs never reaches 100% of the eligible population. The usual pattern is for enrollment to increase over a period of several years. (SHRAN, 2012) Current PMPM rates were increased by 4% annually to reflect estimated growth in cost per member, over time. This is the average annual growth in PMPM costs over the previous decade experienced by Kentucky’s Medicaid managed care program in Jefferson County and the surrounding area served by Passport Health Plan. Kentucky has estimated initial enrollment, during 2014, at 55% of the newly eligible population and 31% of the woodwork population. Enrollment is expected to stabilize at 70% for newly eligible members and 39% for woodwork members by January 2016. The newly eligible take‐up rate was developed using a model created by Price Waterhouse Coopers, which relied heavily on prior research conducted by the Congressional Budget Office. (Price Waterhouse Coopers [PwC], 2012) The woodwork take‐up rate is consistent with a thorough review of woodwork Substance Abuse. Kentucky Medicaid currently only covers substance abuse treatment for pregnant women and children. Since ACA requires substance abuse as an essential health benefit (EHB) that must be covered for new eligibles, the estimated cost of substance abuse treatment was added to the monthly cost per member. 6 people at or near the poverty level. In order to avoid estimates that imply an improving or declining economy, estimates have been utilized which reflect current economic conditions and achieve a stabilized participation rate. Substance abuse treatment costs were estimated based on 2011 data from the Massachusetts Medicaid program. (PwC, 2012) Since Kentucky’s Medicaid program is a benchmark plan, Kentucky is required to cover substance abuse for the existing Medicaid population as well beginning January 1, 2014; while separate from the PwC model, substance abuse expenses have also been estimated for the current population. Chart 3 ‐ Newly Eligible Enrollment 200,000 181,187 180,000 Financial Factors 160,000 187,898 187,898 187,898 187,898 187,898 161,055 147,634 140,000 120,000 General Fund Cost of Serving New ACA Eligibles 100,000 80,000 As indicated above, the Federal government will pay 100% of the cost of serving the ACA Medicaid expansion group from 2014 through 2016, with the FFP declining to 90% by 2020. Table 2 shows FFP Rates for the Medicaid expansion population from 2014 through 2020. 60,000 40,000 20,000 ‐ SFY 2014 SFY 2015 SFY 2016 SFY 2017 SFY 2018 SFY 2019 SFY 2020 SFY 2021 TABLE 2 ‐ Enhanced Matching Rate for Adults, 2014 and Beyond CALENDAR YEAR Adults at or below 138% FPL 2014 100% 2015 100% 2016 100% 2017 95% 2018 94% 2019 93% 2020 and Beyond 90% In state Fiscal Year 2021 (July 1, 2020‐June 30, 2021) Kentucky’s share of the direct Medicaid cost of serving the newly eligible population is $151 million. Due to the favorable FFP rate for this group, the federal government will pay 90% of the cost of serving the new eligibles during this time period, nearly $1.4 billion. In other words, if the Commonwealth makes an “investment” of $151 million in state funds, it will experience a “return on investment” of $1.4 billion in federal funds. Table 3 includes estimated Federal and state expenditures for the newly eligible population from SFY 2014 through SFY 2021. Kentucky is expected to serve 147,634 of the new ACA eligibles during State Fiscal Year 2014 (July 1, 2013‐June 30, 2014, or half of the first full year of implementation of the Medicaid expansion), rising to 187,898 during SFY 2021, the first full state fiscal year when the FFP rate will level off at 90%. Chart 3 shows estimates of new eligibles served from SFY 2014 through SFY 2021. Charts 3 and 4 both depict enrollment increasing through SFY 2017 and leveling off. Enrollment is a function of the eligible population and the participation rate. Both of these charts assume that the participation rate stabilizes, which is consistent with Congressional Budget Office predictions. They also assume that the underlying eligible population, individuals at or below 138% FPL is constant. Forecasting a growth or decline in the underlying population would be, effectively, a prediction regarding the underlying economy and Table 3 ‐ Newly Eligible Expenditures Federal Share State Share Total SFY 2014 $ 563 M $ ‐ M $ 563 M SFY 2015 $ 1,193 M $ ‐ M $ 1,193 M SFY 2016 $ 1,312 M $ ‐ M $ 1,312 M SFY 2017 $ 1,260 M $ 33 M $ 1,293 M SFY 2018 $ 1,271 M $ 74 M $ 1,345 M SFY 2019 $ 1,307 M $ 91 M $ 1,398 M SFY 2020 $ 1,330 M $ 124 M $ 1,454 M SFY 2021 $ 1,361 M $ 151 M $ 1,512 M 7 Adults, however, are only eligible if: their income is very low (approximately 43% FPL); and they are the caretaker of a child. Therefore, while many adults may have extremely low income, they are currently ineligible for Medicaid due to being childless. General Fund Cost of Serving Currently Eligible, but not Enrolled (Woodwork) Population The woodwork population is the group of people who are eligible for Medicaid under the current rules, before the ACA Medicaid expansion is implemented, but have not enrolled in the program. As indicated above, Kentucky’s regular FFP rate, currently 70.55%, is used to determine the federal share of the cost of serving this group. Chart 4A ‐ Woodwork Enrollment: Children vs. Adults 14,000 11,924 11,924 11,924 11,924 11,924 9,438 9,787 9,787 9,787 9,787 9,787 SFY 2016 SFY 2017 SFY 2018 SFY 2019 SFY 2020 SFY 2021 11,498 12,000 In Kentucky, an estimated 17,059 woodwork eligibles are expected to enroll in Medicaid during SFY 2014. This will increase to 21,711 in SFY 2021. Chart 4 shows the woodwork eligibles expected to enroll in Kentucky Medicaid from SFY 2014 through SFY 2021. Chart 4A shows the adult and child woodwork population from SFY 2014 through SFY 2021. 10,000 10,221 9,369 8,000 6,000 7,690 8,389 4,000 2,000 ‐ SFY 2014 Chart 4 ‐ Woodwork Enrollment 25,000 20,936 20,000 21,711 21,711 21,711 21,711 SFY 2015 Children 21,711 Adults 18,610 17,059 In SFY 2021, Kentucky’s share of the estimated cost of serving the woodwork population is $36 million; the federal share for serving this group is $83 million. Table 4 provides estimated federal and state expenditures for the woodwork population from SFY 2014 through SFY 2021. It is important to note that some woodwork costs will be incurred, regardless of expansion. 15,000 10,000 5,000 ‐ SFY 2014 SFY 2015 SFY 2016 SFY 2017 SFY 2018 SFY 2019 SFY 2020 SFY 2021 Table 4 ‐ Woodwork Expenditures All children who are in families with incomes below 200% FPL are currently eligible for coverage; therefore, all uninsured children below 138% FPL are considered to be in the woodwork group in the current model. Although newly enrolled children are all part of the woodwork population and will not receive the enhanced FFP for the ACA expansion group, ACA also increased the FFP rate for State Children’s Health Insurance (CHIP) Programs. The FFP increase of 23 percentage points, capped at 100%, is effective from Federal Fiscal Years 2016 through 2019. In Kentucky, this translates to an increase in the current KCHIP match rate from approximately 79% to 100%. Federal Share State Share Total SFY 2014 $ 31 M $ 13 M $ 45 M SFY 2015 $ 66 M $ 28 M $ 94 M SFY 2016 $ 72 M $ 31 M $ 103 M SFY 2017 $ 71 M $ 31 M $ 102 M SFY 2018 $ 74 M $ 32 M $ 106 M SFY 2019 $ 77 M $ 33 M $ 110 M SFY 2020 $ 80 M $ 34 M $ 114 M SFY 2021 $ 83 M $ 36 M $ 119 M Including the new eligibles and the woodwork group, Kentucky’s Medicaid enrollment is expected to rise by 164,693 in SFY 2014, increasing to 209,609 in SFY 2021. 8 Chart 5 shows the total anticipated enrollment increase by year. Table 5 ‐ Total Expenditures Federal Share SFY 2014 $ 595 M SFY 2015 $ 1,259 M SFY 2016 $ 1,384 M SFY 2017 $ 1,331 M SFY 2018 $ 1,344 M SFY 2019 $ 1,384 M SFY 2020 $ 1,410 M SFY 2021 $ 1,444 M Chart 5 ‐ Total Enrollment Increase 250,000 202,123 200,000 209,609 209,609 209,609 209,609 209,609 179,665 164,693 150,000 State Share $ 13 M $ 28 M $ 31 M $ 63 M $ 106 M $ 124 M $ 158 M $ 187 M Total $ 608 M $ 1,287 M $ 1,415 M $ 1,394 M $ 1,450 M $ 1,508 M $ 1,569 M $ 1,631 M 100,000 Table 5 and Chart 6 are based on identical data, but both are necessary to reinforce the primary finding. While there will be some state costs associated with the Medicaid expansion, more than 93% of the total costs over the next 7 years will be borne by the federal government. 50,000 ‐ SFY 2014 SFY 2015 SFY 2016 SFY 2017 SFY 2018 SFY 2019 SFY 2020 SFY 2021 Table 5 and Chart 6 provide information on state and federal shares of expenditures, and total expenditures for both groups of eligibles from SFY 2014 through SFY 2021. Chart 6 ‐ Price Waterhouse Coopers Medicaid Expansion Expenditures $1,800M $1,600M $31M $1,400M $63M $106M $124M $158M $187M $28M $1,200M $1,000M $800M $600M $400M $1384M $13M $1259M $1331M $1344M $1384M SFY 2018 SFY 2019 $1410M $1444M $595M $200M $M SFY 2014 SFY 2015 SFY 2016 SFY 2017 Federal Share SFY 2020 SFY 2021 State Share 9 Financial Impact of Transitioning Currently Eligible Medicaid Populations to Newly Eligible Group Table 6 – Potential General Fund Savings: Kentucky currently covers a small number of individuals through special eligibility categories who would be eligible for Medicaid under the new ACA income eligibility guidelines. This group includes women who are eligible for Medicaid through the Breast and Cervical Cancer Treatment Program (BCCTP), individuals who experience a catastrophic medical expense and must “spend down” to become income eligible for Medicaid, and pregnant women who are currently eligible for Medicaid with incomes up to 185% FPL. Spend‐down Elimination SPEND‐DOWN COSTS SFY 2014 $ 10,450,000 SFY 2015 $ 21,400,000 SFY 2016 $ 21,800,000 SFY 2017 $ 22,200,000 SFY 2018 $ 22,700,000 SFY 2019 $ 23,100,000 SFY 2020 $ 23,600,000 SFY 2021 $ 24,000,000 The specific financial impact of transitioning BCCTP recipients and pregnant women from the current match rate to the enhanced ACA match rate has not been calculated because the General Fund cost reduction will be much smaller and is not necessarily assured. Kentucky could benefit from the enhanced FFP rate for new ACA eligibles for individuals in these categories who have income under 138% FPL and apply after January 1, 2014. The enhanced FFP might also apply to current BCCTP and spend‐down recipients with income under 138% FPL after January 2014. ACA allows states to cover people who qualify for less than full Medicaid benefits as newly eligible under ACA. Financial Impact of Reductions in State Programs for the Uninsured Kentucky currently uses General Fund or local dollars to pay for a variety of health services for low income populations. A portion of the cost of providing the following services can be shifted to federal funds, if Kentucky adopts the ACA Medicaid expansion making adults with income under 138% FPL Medicaid eligible: Although Kentucky BCCTP recipients currently receive the full Medicaid benefit package, their eligibility is time limited, so they may be eligible for enhanced match after January 2014. Enhanced match is also available for low income, spend‐down recipients who could receive full Medicaid coverage without incurring health care charges. After the ACA Medicaid expansion is implemented a pregnant woman with income under 138% FPL would be income eligible for Medicaid without having to document that she is pregnant. In these cases, the financial impact to Kentucky would be the savings to the General Fund between the current state share (29.45%) and a state share from 0% to 10% in 2014 through 2021. • • • • • Transitioning spend‐down recipients with income below 138% FPL to the new ACA eligibility group represents a General Fund savings ranging from $10.5 million in SFY 14 to $24 million in SFY 21. Table 6 shows anticipated General Fund savings from this transition, by year. Outpatient behavioral health services for adults; Preventive health services currently provided by local health departments on a sliding fee schedule to low‐income populations; Insurance coverage for former foster care children; Hospital inpatient costs of prisoners; and Disproportionate Share Hospital (DSH) payments to state hospitals Kentucky devotes significant General Fund and local resources to providing low‐income residents with outpatient behavioral health care through Community Mental Health Centers (CMHC), and preventive health care through the public health system. The behavioral health services required for the new ACA eligibles include both outpatient mental health treatment and substance abuse treatment. 10 As Kentucky Medicaid currently only covers substance abuse treatment for pregnant women and children, the impact of shifting coverage to Medicaid after January 1, 2014 would be considerable, both in terms of the expanded services and of the financial effect of receiving enhanced FFP for these services. Table 7 provides estimates of the potential Federal fund replacement that Kentucky’s local health departments (LHD) and CMHCs would receive from Medicaid expansion. Currently a large portion of this care is being funded by general fund dollars. Federal Medicaid rules do not permit incarcerated individuals to receive Medicaid coverage; therefore Medicaid coverage ceases once a person is incarcerated. After an incarcerated individual has been an inpatient in a medical facility for 24 hours, he/she is no longer considered incarcerated and his/her Medicaid coverage may resume, provided that he/she continues to meet Medicaid eligibility criteria. Under current categorical Medicaid eligibility rules, relatively few prisoners are eligible for Medicaid when they are admitted to prison or if they are hospitalized during a prison stay. Table 7 ‐ Potential Federal Fund Replacement: Community Mental Health Centers and Local Health Departments CMHC LHD SFY 2014 $ 32,000,000 $ 12,500,000 SFY 2015 $ 65,300,000 $ 25,500,000 SFY 2016 $ 66,600,000 $ 26,000,000 SFY 2017 $ 67,900,000 $ 26,500,000 SFY 2018 $ 69,300,000 $ 27,100,000 SFY 2019 $ 70,700,000 $ 27,600,000 SFY 2020 $ 72,100,000 $ 28,200,000 SFY 2021 $ 73,500,000 $ 28,700,000 If Kentucky adopts the ACA Medicaid expansion, adult Medicaid eligibility will be based solely on income. It is anticipated that most incarcerated individuals will be eligible for Medicaid if they are admitted to a hospital while incarcerated. Table 9 includes the financial impact of shifting the cost of inpatient expenditures from the Department of Corrections, at 100% General Funds, to the enhanced ACA match rate, which ranges from 100% to 90% federal funds. Average annual expenditures on inpatient hospital care for incarcerated individuals are currently $10.6 million. The primary reason for the lower figure in SFY 2014 is that $4 million in savings as a result of Medicaid Expansion being included in the current budget enacted by the General Assembly. If Medicaid is not expanded, it will result in a loss of $4 million relative to the current budget. ACA requires states to provide Medicaid coverage to former foster care children through age 25, whether or not the state adopts the ACA Medicaid expansion. Kentucky currently purchases health insurance for this group at an annual cost of approximately $1,000,000. Table 8 provides an estimate of the annual financial impact of transitioning the cost of health insurance coverage for this group from 100% General Funds to the enhanced ACA match rate which ranges from 100% to 90% federal funds. Table 9 ‐ Potential General Fund Savings: Department of Corrections Corrections Savings Table 8 ‐ Potential General Fund Savings: Insurance for Foster Care Children Under 26 DCBS Savings SFY 2014 SFY 2015 SFY 2016 SFY 2017 SFY 2018 SFY 2019 SFY 2020 SFY 2021 $ 520,000 $ 1,060,000 $ 1,080,000 $ 1,100,000 $ 1,120,000 $ 1,140,000 $ 1,160,000 $ 1,180,000 SFY 2014 $ 1,400,000 SFY 2015 $ 7,000,000 SFY 2016 $ 7,200,000 SFY 2017 $ 7,500,000 SFY 2018 $ 7,700,000 SFY 2019 $ 7,900,000 SFY 2020 $ 8,200,000 SFY 2021 $ 8,400,000 It should also be noted that those incarcerated in county jails would be eligible, as well. Through 11 coordination with the Department for Community Based Services, (DCBS) county jails would have the opportunity to enroll their inmates in Medicaid for care received while outside of their facilities more than 24 hours. owned facilities. The DSH reduction therefore represents both a decline in state General Fund expenditures and a reduction in federal fund receipts. Please refer to the table on page 26 to see total fund losses for hospitals by hospital type. Data pertaining specifically to hospital expenses for county jails is presently unavailable. According to the Department for Local Government as well as information from Fayette and Jefferson County, total medical and dental spending for the most recent fiscal year was nearly $30 million. Medical and dental spending for county jails has grown by 134% over the past eight years. County jails will have the ability to have some portion of this paid by Medicaid if expansion occurs. Table 10 ‐ Potential Fund Changes Because ACA was designed to substantially reduce the number of uninsured individuals in the U.S., it also reduces federal Disproportionate Share Hospital (DSH) payments to the states. These reductions will occur whether or not the state adopts the ACA Medicaid expansion. These payments were designed to help states provide support to hospitals that serve a significantly disproportionate number of low‐income, uninsured patients. ACA reduces Medicaid DSH payments by $14 billion over a 10 year period, starting in 2014. The reductions are to be determined with the largest reductions in states with the lowest percentage of uninsured and which do not target payments based on hospitals’ volume of uncompensated care or bad debt. (Rhode Island Senate Fiscal Office, 2010) DSH SFY 2014 General Fund Expenditure Reductions $ 1,900,000 Federal Revenue Decreases $ 800,000 SFY 2015 $ 2,300,000 $ 1,000,000 SFY 2016 $ 2,300,000 $ 1,100,000 SFY 2017 $ 6,900,000 $ 2,100,000 SFY 2018 $ 19,200,000 $ 6,000,000 SFY 2019 $ 21,500,000 $ 9,400,000 SFY 2020 $ 15,400,000 $ 8,500,000 SFY 2021 $ 15,400,000 $ 7,100,000 ACA Coverage Option Changes In addition to the Medicaid expansion up to 138% FPL, ACA includes provisions that could expand coverage by reducing the waiting period prior to enrollment in CHIP for families who voluntarily discontinue private insurance coverage for their children, as well as removing the residency requirement for legally residing immigrant children to qualify for Medicaid coverage. CHIP Waiting Period. Prior to ACA, states were required to have a waiting period for children to be enrolled in the CHIP benefit. In Kentucky, the current KCHIP waiting period is six months. This waiting period is imposed when private insurance coverage is dropped voluntarily, and applies to children with family income between 150% and 200% FPL, the group served through the KCHIP separate insurance program. Table 10 displays the estimated reduction in Kentucky’s state share of hospital DSH payments associated with this reduction in federal Medicaid DSH spending. It is important to understand that this only represents the state match (approximately 30%) of the total DSH reduction. Therefore the $15.4 million General Fund savings in SFY 2021 corresponds to a total DSH reduction of more than $50 million. In the previous fiscal year acute care hospitals received more than $171 million in DSH funds and mental hospitals received $37.1 million. Furthermore, while Kentucky will be required to contribute less in General Fund dollars to match the Federal DSH payment, the Commonwealth will also receive less in federal funds directly since the majority of mental hospital DSH funding goes to state‐ Under ACA, the maximum waiting period is reduced to three months, and states may eliminate the waiting period altogether. Elimination of the waiting period is consistent with ACA’s emphasis on the importance of universal health insurance coverage. By January of 2014 the number of other states without a waiting period will be 16, and at least 5 other states will have a waiting period of less than 3 months. As noted by the Institutes of Health, “When children acquire health insurance 12 ACA includes a number of provisions that will have an impact on eligibility determination costs. First, ACA will increase the number of eligibility applications in states that implement the Medicaid expansion, and likely even in states that do not expand Medicaid eligibility (Bovbjerg & Hadley, 2007; SHRAN, 2012). Second, ACA requires several eligibility determination simplifications, such as reliance on a consistent definition of Modified Adjusted Gross Income (MAGI) to determine financial eligibility; verifying financial data through access to federal databases, rather than through time‐consuming manual processes; and automated eligibility determination approaches. they receive more timely diagnosis of serious health conditions, experience fewer avoidable hospitalizations, have improved asthma outcomes, and miss fewer days of school.” Therefore, the Cabinet for Health and Family Services recommends that Kentucky eliminate its waiting period so that Kentucky is able to give low income children the health care they need to be healthy, productive students and citizens. Residency Requirement for Immigrant Children. Currently, lawfully residing immigrants may be eligible for Medicaid, based on the same eligibility standards that apply to citizens, once they have resided in the United States for five years or more. An option originally included in the Children Health Insurance Program Reauthorization Act of 2009 (CHIPRA) and continued in ACA allows states to enroll lawfully residing immigrant children in Medicaid or CHIP regardless of how long they have lived in the U.S. Twenty‐two other states have adopted this option according to the most recent research. (Fortuny & Chaudry, 2011) Because ACA requires coordination of eligibility and enrollment practices across Medicaid, the Children’s Health Insurance Program and the premium subsidies available through the Health Benefits Exchanges (HBE), some of the work of processing Medicaid applications may be carried out by the HBE. Finally, ACA provides enhanced 90% FFP for developing automated eligibility information systems, and enhanced 75% FFP for operating these systems; this is in comparison to the current 50% FFP for general Medicaid administrative costs. (Bovbjerg & Hadley, 2007; SHRAN, 2012) It is estimated that between 4,500 and 8,000 children in Kentucky would be eligible for Medicaid or KCHIP if the state adopted this option. Removing the residency requirement would result in additional general fund costs between $2.5 million and $6.4 million annually, depending on how many children take advantage of the option, and whether they are eligible for Medicaid or KCHIP. Average expected costs for this coverage is depicted in tables 15A and 15B below. With the goal of providing more children the health care they need, the Cabinet for Health and Family Services recommends that the state adopt this option. Undocumented immigrants are not currently eligible for Medicaid or CHIP, with the exception of time limited Medicaid for emergency medical conditions. This policy will continue when ACA is fully implemented. The Department for Community Based Services estimates that an additional 81 eligibility determination workers and 8 supervisors will be needed to process increased Medicaid and premium subsidy applications during SFY 2014, increasing to an additional 113 workers in SFY 2017 and beyond. This represents an approximately 5% increase in the number of eligibility workers and is based upon expected increase in applications at a case weight per worker of 600. The personnel and operating costs for these workers are expected to be split between Medicaid (80%) and the Kentucky HBE (20%). The state share of the portion of costs attributable to Medicaid ranges from $2.3 million in SFY 2014 to $3.5 million in SFY 2017 and beyond as detailed in Table 11. Administrative Costs Table 11 ‐ DCBS Administrative Cost Increases There are currently two major categories of administrative costs associated with operating state Medicaid programs: eligibility determination costs and the costs of managing the medical services covered by Medicaid. SFY 2014 SFY 2015 SFY 2016 SFY 2017 and Beyond State Share $ 2,300,000 $ 2,700,000 $ 3,200,000 $ 3,500,000 Federal Share $ 1,500,000 $ 1,800,000 $ 2,100,000 $ 2,400,000 13 • DMS Administrative Costs Historically, Kentucky Medicaid has had one of the lowest administrative costs in the nation at slightly below 2% of benefit costs. Administrative costs, including personnel, operating expenses and contracted administrative functions. (Cabinet for Health and Family Services, 2012; Kaiser Commission on Medicaid and the Uninsured, 2003) A little over one‐third of Kentucky Medicaid’s administrative cost is for the eligibility determination function, as addressed above. Subtracting this portion of the administrative cost leaves an estimated 1.3% of benefit costs for the costs of managing the medical services covered by Medicaid. It is anticipated that Medicaid enrollment increases ranging from 21.5% in 2014 to 27.5% in 2021 will have a significant impact on this component of Medicaid administrative costs. Funding will be needed to increase Medicaid Management Information System (MMIS) contracts to process a higher volume of claims and encounters for services provided to the expanded Medicaid population. It is anticipated that other contractual costs will also be impacted. In addition, increased Medicaid staff will be needed to: • • • • • • • • Handle the increased volume of member complaints, MCO complaints, appeals and hearings; and Increase provider enrollment activities, initiatives designed to identify and reclaim provider overpayments, and program integrity activities. Total increased administrative costs are estimated to range from $7.6 million in SFY 2014 to $18.5 million in SFY 2016, leveling off thereafter. The state share of these expenses will be 50%, or $3.8 million in SFY 2014 and $9.25 million in SFY 2016 and beyond. While a large majority of the administrative cost increase is attributable to the ACA Medicaid expansion, Kentucky will experience increased administrative demands even if the expansion is not adopted, due to the increased “Woodwork” eligibles that will enroll, the benefit package and other policy changes required by ACA. A number of the costs discussed above will occur whether or not Kentucky adopts the ACA Medicaid expansion. State Economic Impact Develop, implement and monitor the effectiveness of new benchmark benefit packages; Develop and file the required federal and state policy materials necessary to implement the Medicaid expansion, as well as other policy revisions required by ACA; Revise program manuals and other procedural documents needed for implementing these new policies and policy revisions; Communicate new policies and policy revisions to the Medicaid Managed Care Organizations (MCO) and amend or rebid MCO contracts, as necessary; Increase monitoring of MCO administration and service provision; Educate interested advocacy and provider associations, the general public, potential and actual new Medicaid recipients on Medicaid expansion, benefit packages, how to effectively utilize Medicaid benefits, Medicaid managed care, etc.; Respond to the increased volume of member calls; In addition to the direct General Fund cost of the Medicaid expansion, and the reductions in General Fund expenditures as the uninsured population declines, the economic impact of increased federal Medicaid dollars coming into Kentucky must be considered in analyzing the financial effect of the expansion. According to Dorn 2012 and SHRAN 2012, major economic impacts include: • • • Jobs created; Increases in state and local income and sales tax revenue; and Other tax considerations/economic impacts. The Urban Studies Institute (USI) at the University of Louisville analyzed the potential economic impact of the ACA Medicaid expansion in Kentucky. USI utilized a program called IMPLAN, which relies heavily on the Input‐Output tables produced by the Federal Bureau of Labor and Statistics. 14 created as a response to this level of spending. The job estimates are full‐time equivalent jobs. (Urban Studies Institute, 2012) The logic behind such models is as follows: in order to have $1 million in direct Medicaid spending, several other types of economic activities must occur beforehand. For example, there might be a large degree of administrative, educational and medical equipment spending. The input‐output tables provide the total units of input required to produce one unit of output. In this case, the tables were used to estimate the total units of input required to produce the total Medicaid spending estimated by the PwC analysis. Table 12 shows the total (federal and state) new Medicaid spending that would be generated if Kentucky implements the Medicaid expansion; the number of new jobs to be created by that level of spending; wages and salaries for those new jobs; and the economic impact. Chart 7A contains the essential elements of Table 12 in graph form, while chart 7B depicts the costs and benefits that are occurring as a result of the Affordable Care Act if Medicaid is not expanded. This is the same type of analysis conducted to determine the overall economic impact of TIF (Tax Increment Financing) and TDA (Tourism Development Act) projects administered by the Cabinet for Economic Development. The USI began their analysis by taking the total amount of new Medicaid spending that would occur as a result of the Medicaid Expansion, as estimated by the PwC model, and estimating the amount of indirect and induced spending that would be required to support this level of Medicaid spending. Kentucky is expected to create more than 15,000 new jobs in the first full year of the Medicaid expansion. This is largely due to the additional $600 million in healthcare spending that will be generated as a result of Medicaid expansion. In addition to these direct expenditures, most healthcare providers will spend additional funds in their local communities, purchasing goods to keep their doors open, and their employees will spend their disposable income within the Commonwealth. Indirect spending refers to the inputs that need to be purchased for Medicaid spending to occur, such as Medical supplies and equipment. Induced spending refers to the wages and salaries of medical professionals that will be re‐spent in the economy on consumer purchases such as retail, housing, etc. By 2021, the first full fiscal year in which Kentucky will be responsible for the 10% state match, the Medicaid expansion will be responsible for the employment of more than 16,700 Kentuckians annually. Due to the sectors of the new jobs, those 16,700 working Kentuckians will have an average annual salary of more than $43,000. It is evident that the income and sales tax generated by an additional 16,700 Kentuckians being gainfully employed will be a significant contribution to the state General Fund. The indirect and induced spending components are commonly referred to as the “multiplier effect” in economic development studies. Direct spending is multiplied because it is re‐spent on intermediate goods or filtered back through the economy by employees. The USI model also estimated the number of new jobs 15 Table 12 ‐ Key Indicators from University of Louisville Model Total New Medicaid Jobs Created Economic Impact Spending Wages and Salaries Average Salary SFY 2014 $ 608,100,000 7,600 $ 905,200,000 $ 293,700,000 $ 38,000 SFY 2015 $ 1,287,000,000 15,600 $ 1,872,900,000 $ 605,600,000 $ 39,000 SFY 2016 $ 1,415,200,000 16,100 $ 1,991,400,000 $ 639,700,000 $ 40,000 SFY 2017 $ 1,394,400,000 16,200 $ 2,046,200,000 $ 653,000,000 $ 40,000 SFY 2018 $ 1,450,200,000 16,000 $ 2,082,700,000 $ 660,000,000 $ 41,000 SFY 2019 $ 1,508,200,000 16,300 $ 2,162,800,000 $ 683,000,000 $ 42,000 SFY 2020 $ 1,568,600,000 16,600 $ 2,249,300,000 $ 710,300,000 $ 43,000 SFY 2021 $ 1,631,300,000 16,700 $ 2,293,400,000 $ 724,300,000 $ 43,000 Total $10,863,000,000 $15,603,900,000 $ 4,969,600,000 Chart 7A ‐ Impacts of ACA & Medicaid Expansion $ 350.0 M 16,100 15,600 $ 300.0 M 16,200 16,000 JOBS CREATED $ 260.9 M 16,300 16,600 $ 270.0 M $ 245.0 M $ 243.5 M $ 250.0 M 7,600 $ 222.6 M $ 210.7 M $ 182.2 M $ 200.0 M 16,700 $ 218.9 M GENERAL FUND REVENUE & SAVINGS $ 191.1 M $ 150.0 M $ 157.3 M $ 100.0 M $ 135.2 M $ 87.7 M STATE FUNDS $ 88.3 M $ 50.0 M $ .0 M $ 24.9 M SFY 14 $ 49.9 M $ 54.6 M SFY 15 SFY 16 SFY 17 SFY 18 SFY 19 SFY 20 SFY 21 16 Chart 7B ‐ Impacts of ACA without Medicaid Expansion $240.0 M $190.0 M $140.0 M GENERAL FUND REVENUE & SAVINGS $90.0 M $68.7 M $73.2 M $54.4 M $35.2 M $40.0 M $16.6 M ‐$.1 M $42.9 M $38.3 M $44.3 M $38.9 M $2.5 M $49.2 M $50.1 M $50.0 M $16.7 M $25.5 M ‐$10.0 M STATE FUNDS ‐$60.0 M SFY 14 SFY 15 SFY 16 SFY 17 SFY 18 SFY 19 SFY 20 SFY 21 local occupational taxes as a result of increased economic activity associated with the Medicaid expansion3. Charts 7A and 7B compare the gross costs and benefits of expanding and not‐expanding Medicaid separately. Expanding Medicaid leads to benefits which exceed costs through SFY 21 while failing to expand is associated with costs exceeding benefits in many of the years, and into the future. Charts 8 and 9 are useful for comparing the net costs of these alternatives into side‐ by‐side. In order to estimate the tax collections associated with wage and salary increases, the USI analyzed multiple years of income and sales tax collection data by county to determine an accurate effective tax rate. They determined that the average effective tax rates for Kentucky, as a whole, were 4.14% (income tax) and 4.06% (sales tax). This means that for every $100 in wages and salaries that the Medicaid expansion generates, the General Fund will receive $4.14 and $4.06 in income and sales tax, respectively. USI performed a similar analysis for local taxes, as well. Chart 8 depicts the annual net impact of each option, the amount by which benefits exceed costs, or trail them in the case of chart 7b. As you can see it generates a greater net impact in every year under consideration, while failing to expand not only has a smaller net impact, it has a negative net impact in many years. Please see Table 13 for an estimate of increased tax revenue for the period SFY 14 through SFY 21. Chart 9 considers the cumulative, rather than annual benefits of expansion. Considered as a 7 year policy the net benefits of expansion are $802.4 million, whereas if we fail to expand it will cost the state $38.9 million over that timeframe. 3 The USI model extends through CY 2021. All values beyond that date were calculated by applying ordinary least squares regression analysis to the data produced by USI. The USI analysis also addressed increases in state income and sales tax revenue, as well as increases in 17 Chart 8: Annual Net Impact of ACA & Medicaid Expansion $ 200.0 M $ 156.1 M $ 155.2 M $ 132.3 M $ 150.0 M $ 125.7 M $ 112.7 M $ 100.0 M $ 62.8 M $ 53.9 M $ 50.0 M $ 15.5 M $ .0 M $ 24.4 M $ 23.9 M ‐$ 7.1 M ‐$ 12.8 M ‐$ 16.8 M ‐$ 32.7 M $ 3.7 M ‐$ 33.5 M ‐$ 50.0 M SFY 14 SFY 15 SFY 16 SFY 17 ACA WITHOUT EXPANSION SFY 18 SFY 19 SFY 20 SFY 21 ACA WITH EXPANSION Chart9: Cumulative Net Impact of ACA & Medicaid Expansion $ 900.0 M $ 798.7 M $ 802.4 M $ 744.8 M $ 800.0 M $ 632.1 M $ 700.0 M $ 600.0 M $ 506.4 M $ 500.0 M $ 351.1 M $ 400.0 M $ 300.0 M $ 195.1 M $ 200.0 M $ 100.0 M $ 62.8 M ‐$ 16.8 M $ .0 M ‐$ 49.4 M SFY 15 ‐$ 22.3 M $ 1.6 M ‐$ 5.5 M ‐$ 62.3 M ‐$ 46.8 M SFY 16 SFY 17 SFY 18 SFY 19 SFY 20 ‐$ 38.9 M ‐$ 100.0 M SFY 14 ACA WITHOUT EXPANSION SFY 21 ACA WITH EXPANSION 18 Table 13 ‐ ESTIMATED INCREASES IN TAX REVENUE STATE LOCAL OCC. & INCOME TAX SALES TAX PAYROLL TAX SFY 2014 $ 12,100,000 $ 11,900,000 $ 4,900,000 SFY 2015 $ 25,100,000 $ 24,600,000 $ 10,100,000 SFY 2016 $ 26,500,000 $ 25,900,000 $ 10,600,000 SFY 2017 $ 27,000,000 $ 26,500,000 $ 10,800,000 SFY 2018 $ 27,300,000 $ 26,800,000 $ 11,000,000 SFY 2019 $ 28,300,000 $ 27,700,000 $ 11,300,000 SFY 2020 $ 29,400,000 $ 28,800,000 $ 11,800,000 SFY 2021 $ 30,000,000 $ 29,400,000 $ 12,000,000 Table 14 ‐ Net Impact of Medicaid Expansion GENERAL FUND REVENUES EXPENDITURE SAVINGS & INCREASES & INCREASES FEDERAL FUND DECREASES $87,700,000 $24,900,000 SFY 14 $182,200,000 $49,900,000 SFY 15 $210,600,000 $54,600,000 SFY 16 $243,500,000 $88,300,000 SFY 17 $260,900,000 $135,200,000 SFY 18 $270,000,000 $157,300,000 SFY 19 $245,000,000 $191,100,000 SFY 20 $222,600,000 $218,900,000 SFY 21 Net Fiscal Impact of the Medicaid Expansion Considering all the financial factors identified above, the Commonwealth of Kentucky will experience a SAVINGS in General Funds for all years from SFY 14 through SFY 21 by implementing the Medicaid expansion. NET IMPACT $62,800,000 $132,300,000 $156,000,000 $155,200,000 $125,700,000 $112,700,000 $53,900,000 $3,700,000 Table 15A provides detailed information on the total expenditures, federal funds replacements, General Fund budgetary savings and increased tax revenue associated with the expansion year by year. Table 15B depicts the costs and benefits caused only by the Affordable Care Act, without the added benefits of Medicaid expansion. It is important to emphasize that the costs and benefits in table 15B will occur regardless of Medicaid expansion; it is only through Medicaid expansion that Kentucky will enjoy the additional benefits. Table 14 summarizes the net fiscal impact of the ACA Medicaid expansion, by year. The combined General Fund expenditures in the early years of expansion will be dwarfed by: decreased spending on programs that are now 100% General Fund; increased sales and income tax revenue generated by additional federal expenditures; and increased local option tax revenue. By SFY 2021, the gap between savings and expenditures will have closed considerably, but Medicaid expansion will still be responsible for generating savings and increasing revenues that, when combined, are larger than the additional General Fund outlays. A positive gap exists between savings and expenditures in each year from SFY14 to SFY 21. Even when Kentucky’s match rate stabilizes at 10%, the benefit to the Commonwealth exceeds the expense by $3.7 million. 19 Table 15A: NET IMPACT OF ACA & MEDICAID EXPANSION Federal Funds Replacement Community Mental Health Centers Local Health Departments General Fund Expenditure Reductions Disproportionate Share Hospital Private Insurance for Foster Care Children Spend down Inpatient Hospital Care by Department of Corrections KCHIP Revenue and Savings Subtotal Increased State Taxes State Income Taxes State Sales Taxes State Tax Subtotal Other Taxes Local Occupational & Payroll Taxes Total Revenue Savings & Increases Decreased Federal Funds for Continuing Services Mental Health DSH Reduction Increased General Fund Requirements Administrative Cost Increases Removal of Residency Requirement Substance Abuse for Current Eligibles Woodwork Enrollment Newly Eligible Enrollment Total Expenditure Increases and Federal Fund Decreases Net Impact Cumulative Net Impact SFY 14 SFY 15 SFY 16 SFY 17 SFY 18 SFY 19 SFY 20 SFY 21 $ 32.0 M $ 12.5 M $ 65.3 M $ 25.5 M $ 66.6 M $ 26.0 M $ 67.9 M $ 26.5 M $ 69.3 M $ 27.1 M $ 70.7 M $ 27.6 M $ 72.1 M $ 28.2 M $ 73.5 M $ 28.7 M $ 1.9 M $ .5 M $ 10.5 M $ 2.3 M $ 1.1 M $ 21.4 M $ 2.3 M $ 1.1 M $ 21.8 M $ 6.9 M $ 1.1 M $ 22.2 M $ 19.2 M $ 1.1 M $ 22.7 M $ 21.5 M $ 1.1 M $ 23.1 M $ 15.4 M $ 1.2 M $ 23.6 M $ 15.4 M $ 1.2 M $ 24.0 M $ 1.4 M $ 7.0 M $ 7.2 M $ 7.5 M $ 7.7 M $ 7.9 M $ 8.2 M $ 8.4 M $ .0 M $ 58.8 M $ .0 M $ 122.5 M $ 22.6 M $ 147.6 M $ 47.0 M $ 179.1 M $ 48.8 M $ 195.9 M $ 50.8 M $ 202.7 M $ 26.4 M $ 175.0 M $ .0 M $ 151.2 M $ 12.1 M $ 11.9 M $ 24.1 M $ 25.1 M $ 24.6 M $ 49.6 M $ 26.5 M $ 25.9 M $ 52.4 M $ 27.0 M $ 26.5 M $ 53.5 M $ 27.3 M $ 26.8 M $ 54.1 M $ 28.3 M $ 27.7 M $ 56.0 M $ 29.4 M $ 28.8 M $ 58.2 M $ 30.0 M $ 29.4 M $ 59.3 M $ 4.9 M $ 87.7 M $ 10.1 M $ 182.2 M $ 10.6 M $ 210.6 M $ 10.8 M $ 243.5 M $ 11.0 M $ 260.9 M $ 11.3 M $ 270.0 M $ 11.8 M $ 245.0 M $ 12.0 M $ 222.6 M $ .4 M $ 1.0 M $ 1.1 M $ 2.1 M $ 6.0 M $ 9.4 M $ 8.5 M $ 7.1 M $ 6.1 M $ 2.2 M $ 2.8 M $ 13.5 M $ .0 M $ 10.1 M $ 4.6 M $ 5.7 M $ 28.5 M $ .0 M $ 11.4 M $ 4.8 M $ 6.0 M $ 31.2 M $ .0 M $ 11.7 M $ 5.0 M $ 6.2 M $ 30.6 M $ 32.6 M $ 11.7 M $ 5.2 M $ 6.4 M $ 31.9 M $ 74.0 M $ 11.7 M $ 5.4 M $ 6.7 M $ 33.1 M $ 91.0 M $ 11.7 M $ 5.6 M $ 7.0 M $ 34.5 M $ 123.8 M $ 11.7 M $ 5.9 M $ 7.2 M $ 35.8 M $ 151.2 M $ 24.9 M $ 49.9 M $ 54.6 M $ 88.3 M $ 135.2 M $ 157.3 M $ 191.1 M $ 218.9 M $ 62.8 M $ 62.8 M $ 132.3 M $ 195.1 M $ 156.1 M $ 351.1 M $ 155.2 M $ 506.4 M $ 125.7 M $ 632.1 M $ 112.7 M $ 744.8 M $ 53.9 M $ 798.7 M $ 3.7 M $ 802.4 M 20 Table 15B: NET IMPACT OF ACA4 without Medicaid Expansion Federal Fund Replacement Community Mental Health Centers Local Health Departments General Fund Expenditure Reductions Disproportionate Share Hospital Private Insurance for Foster Care Children Spend down Inpatient Hospital Care by Department of Corrections KCHIP Revenue and Savings Subtotal Increased State Taxes State Income Taxes State Sales Taxes State Tax Subtotal Other Taxes Local Occupational & Payroll Taxes Total Revenue Savings & Increases Decreased Federal Funds for Continuing Services Mental Health DSH Reduction Increased General Fund Requirements Administrative Cost Increases Removal of Residency Requirement Substance Abuse for Current Eligibles Woodwork Enrollment Newly Eligible Enrollment Total Expenditure Increases and Federal Fund Decreases Net Impact Cumulative Net Impact SFY 14 SFY 15 SFY 16 SFY 17 SFY 18 SFY 19 SFY 20 SFY 21 ‐ ‐ ‐ ‐ ‐ ‐ ‐ ‐ ‐ ‐ ‐ ‐ ‐ ‐ ‐ ‐ $ 1.9 M ‐ ‐ $ 2.3 M ‐ ‐ $ 2.3 M ‐ ‐ $ 6.9 M ‐ ‐ $ 19.2 M ‐ ‐ $ 21.5 M ‐ ‐ $ 15.4 M ‐ ‐ $ 15.4 M ‐ ‐ ‐$ 4.0 M ‐$ 4.0 M ‐$ 4.0 M ‐$ 4.0 M ‐$ 4.0 M ‐$ 4.0 M ‐$ 4.0 M ‐$ 4.0 M $ .0 M ‐$ 2.1 M $ .0 M ‐$ 1.7 M $ 22.6 M $ 20.9 M $ 47.0 M $ 49.9 M $ 48.8 M $ 64.0 M $ 50.8 M $ 68.3 M $ 26.4 M $ 37.8 M $ .0 M $ 11.4 M $ .8 M $ .8 M $ 1.7 M $ 1.8 M $ 1.7 M $ 3.5 M $ 1.9 M $ 1.9 M $ 3.8 M $ 1.9 M $ 1.9 M $ 3.8 M $ 2.0 M $ 1.9 M $ 3.9 M $ 2.1 M $ 2.0 M $ 4.1 M $ 2.1 M $ 2.1 M $ 4.2 M $ 2.2 M $ 2.2 M $ 4.4 M $ .3 M ‐$ .1 M $ .7 M $ 2.5 M $ .8 M $ 25.5 M $ .8 M $ 54.4 M $ .8 M $ 68.7 M $ .8 M $ 73.2 M $ .9 M $ 42.9 M $ .9 M $ 16.7 M $ .4 M $ 1.0 M $ 1.1 M $ 2.1 M $ 6.0 M $ 9.4 M $ 8.5 M $ 7.1 M ‐ ‐ $ 2.8 M $ 13.5 M ‐ $ 16.6 M ‐ ‐ $ 5.7 M $ 28.5 M ‐ $ 35.2 M ‐ ‐ $ 6.0 M $ 31.2 M ‐ $ 38.3 M ‐ ‐ $ 6.2 M $ 30.6 M ‐ $ 38.9 M ‐ ‐ $ 6.4 M $ 31.9 M ‐ $ 44.3 M ‐ ‐ $ 6.7 M $ 33.1 M ‐ $ 49.2 M ‐ ‐ $ 7.0 M $ 34.5 M ‐ $ 50.0 M ‐ ‐ $ 7.2 M $ 35.8 M ‐ $ 50.1 M ‐$ 16.8 M ‐$ 16.8 M ‐$ 32.7 M ‐$ 49.4 M ‐$ 12.8 M ‐$ 62.3 M $ 15.5 M ‐$ 46.8 M $ 24.4 M ‐$ 22.3 M $ 23.9 M $ 1.6 M ‐$ 7.1 M ‐$ 5.5 M ‐$ 33.5 M ‐$ 38.9 M 4 The tax figures presented in this table are based upon applying the ratio of tax generation to Medicaid spending in the University of Louisville report to the reduced Medicaid spending that would occur if Medicaid is not expanded. 21 The cumulative effect of these changes is a significant increase in allowable income for families eligible for Medicaid. Again, this will occur whether or not Kentucky decides to implement the ACA Medicaid expansion. Special Considerations As states decide whether or not to adopt the ACA Medicaid expansion, it is important to remember that a number of ACA provisions will expand Medicaid eligibility, even for states that do not adopt the ACA Medicaid expansion to individuals with income below 138% FPL. Some of these provisions will likely lead to increased enrollment of currently eligible individuals, as described in the “woodwork effect” section of this paper. In addition, the following ACA provisions will increase eligibility unrelated to the 138% FPL group: Household Definition. Current household definitions used to determine Medicaid eligibility in Kentucky are fluid. Household size and type can be adjusted, within certain parameters, to maximize the likelihood that family members will be Medicaid‐eligible. Under ACA the household definition will be entirely based on the tax unit reported to the Internal Revenue Service. • Income eligibility will be determined, consistently across the nation, based on Modified Adjusted Gross Income (MAGI); • Income will be determined based on the income tax filing unit, rather than the current household unit; • Assets tests will be eliminated for all applicants for Medicaid except those served in aged, blind and disabled categories; • Application and redetermination processes will be streamlined; • Eligibility determinations must be coordinated across Medicaid, the State Children’s Health Insurance Program (SCHIP) and premium subsidies; and • Foster care children must be covered through age 25. (PwC, 2012) MAGI. Currently, all the earned and unearned income a household receives is considered in determining Medicaid eligibility. Households receive some deductions for earned income. Beginning in 2014, the following sources of income will no longer be considered in determining income eligibility for Medicaid: • • • • • • Asset Test. Currently, adult caretaker relatives and aged, blind and disabled individuals who qualify for Medicaid based on income eligibility must also fall under asset resource limits. Current monthly asset limits are $2,000 for an individual or $4,000 for a couple, with $50 added for each additional household member. After ACA is fully implemented, asset limits will be eliminated for any recipient who qualifies for Medicaid based on the MAGI income determination. Asset limits will still apply to recipients who become eligible through aged, blind or disabled eligibility categories. Application and Redetermination Streamlining and Coordination. ACA includes several factors designed to streamline the eligibility process. These include 12‐ month eligibility redetermination, in comparison to the current 6‐month redetermination timeframe used in Kentucky; pre‐populated, electronically verified renewal applications; client attestation for most eligibility criteria; and one standard application for Medicaid, SCHIP and premium subsidy programs. Impact of Surrounding States Disability or survivor portions of Retirement, Survivors and Disability Insurance (RSDI) payments; VA benefits; Worker’s compensation; Alimony; Child support; and Pre‐tax contributions such as child care costs, retirement savings or flexible spending accounts. Implementation of the ACA Medicaid expansion is an individual state decision, therefore, it is possible that Kentucky and some or all of the surrounding states may make different decisions. If this occurs, there may be some state‐to‐state migration among low‐income populations to allow individuals to take advantage of Medicaid eligibility in nearby states. An analysis of low‐ income, uninsured populations in the seven states surrounding Kentucky indicates that there are more than 150,000 uninsured residents with income below 22 138% FPL living in the counties that touch Kentucky’s borders. In addition, for every 5,000 people who move to Kentucky to obtain coverage through Medicaid, the total state cost in SFY 21 (when the FFP rate stabilizes at 90%) is $3.7 million. (PWC, 2012) Table 16 shows where each border state stand regarding Medicaid expansion as of May 7, 2013. Potential Option to Purchase Private Insurance In recent months CMS has issued preliminary approval for Arkansas’ plan to purchase private insurance through their Health Benefits Exchange for newly eligible enrollees in lieu of enrolling them in Medicaid. While HBE rates are not yet available, preliminary information from the Congressional Budget Office and Massachusetts has indicated that this option could be 50‐66% more expensive than enrolling these individuals in Medicaid. Table 7C is analogous to tables 7A and 7B listed above, but it depicts the estimated total costs and benefits of implementing a plan similar to the one chosen by Arkansas. It is important to note as well that in addition to costs exceeding benefits by 2021, beyond that point costs are expected to continue growing at 3.8% annually, while the combined benefits would only increase at 2.1%, meaning that the gap would continue to expand over time. (Congressional Budget Office, 2012) Table 16: Where States Stand on Medicaid Expansion State Expanding Medicaid? Illinois Yes Indiana Undecided Missouri Undecided Ohio Undecided Tennessee Undecided Virginia Undecided West Virginia Yes Chart 7C ‐ Impacts of Purchasing Private Insurance $350 M $293 M $300 M $304 M $302 M $280 M $276 M $258 M $242 M $250 M $261 M $212 M $200 M GENERAL FUND REVENUE & SAVINGS $211 M $181 M $150 M STATE FUNDS $102 M $100 M $114 M $50 M $ M $59 M $65 M SFY 15 SFY 16 $29 M SFY 14 SFY 17 SFY 18 SFY 19 SFY 20 SFY 21 23 Non‐Financial Factors Table 17 ‐ Selected Kentucky Rankings from America’s Health Rankings, 2012. MEASURE RANK (OUT OF 50) Annual Dental Visit 44 Smoking 50 Obesity 40 Sedentary Lifestyle 43 Children in Poverty 37 Lack of Health Insurance 30 Preventable Hospitalizations 50 Low Birth weight 43 Diabetes 41 Poor Mental Health Days 48 Poor Physical Health Days 49 Cardiovascular Deaths 43 Cancer Deaths 50 Premature Death 44 Infant Mortality 28 Youth Obesity 41 Youth Smoking 43 Cardiac Heart Disease 49 High Cholesterol 43 Heart Attack 48 Stroke 46 High Blood Pressure 46 Preterm Birth 44 While the financial impact of the ACA Medicaid expansion on the state budget and economy is a critical factor in a state’s decision, it is equally important to consider other, non‐financial effects that significantly expanding Medicaid could have on Kentucky’s citizens. These factors include increased access to care, reduced mortality, improved health status and labor market impacts. Kentucky’s National Health Status Ranking Based on national rankings, Kentucky is among the unhealthiest of states. (United Health Foundation [UHF], 2012) Table 17 presents Kentucky’s rankings in selected categories. Since 1990, The United Health Foundation, in partnership with the American Public Health Association and Partnership for Prevention, has analyzed health status in each state, and published its findings in America’s Health Rankings. The rankings are based on four groups of health determinants that can be affected, along with the resultant health outcomes. The determinants include: • • • • Behaviors; Community and environment; Policy; and Clinical care. Source: http://www.americashealthrankings.org/KY/2012 Increased Access to Care In 2012, Kentucky’s overall ranking was 44th among the 50 states. Kentucky’s strengths include low prevalence of binge drinking, low violent crime rate and high immunization coverage. Challenges include high prevalence of smoking (the highest smoking rate in the U.S.), high rate of preventable hospitalizations (also the highest in the U.S., even though it has declined significantly in the past ten years), and high rate of cancer deaths. (UHF, 2012) Kentucky’s overall ranking has fluctuated from 39th to 47th from 1990 through 2012. Both Kentucky‐specific and national reports clearly document that uninsured individuals are much more likely than those with insurance to forgo needed health care because of cost. (KVH, 2012; Centers for Disease Control and Prevention [CDC], 2010; Bernstein et al., 2010; Bovbjerg & Hadley, 2007; IOM, 2009) More specifically, the Centers for Disease Control and Prevention reported that adults with no health insurance were seven times more likely than those continuously insured to forgo needed health care due to cost. The CDC also reported that adults with diabetes or hypertension, who were not consistently insured, were six times more likely to forgo needed health care than those with continuous insurance coverage. (CDC, 2010) 24 Reduced Mortality “The results were striking: expanded Medicaid eligibility cut the number of uninsured adults by about 15%, increased access to care and self‐reported health status, and – most importantly – reduced the statewide death rate among adults by 6%. The scientific literature documents that lack of health insurance coverage is associated with increased mortality rates and premature death. (Bernstein et al., 2010; Bovbjerg & Hadley, 2007; Sommers et al., 2012) Most recently the New England Journal of Medicine study mentioned above reports a 6.1% reduction in mortality in the states that implemented expansions in adult Medicaid eligibility in comparison with neighboring states without expansions. (Sommers et al., 2012) Overall, we found that the Medicaid expansions were linked to 2,840 deaths prevented each year across the three states, with the benefits of coverage greatest for older adults (ages 35‐64), non‐whites, and those living in poorer counties.” Improved health status A large body of literature also demonstrates the relationship between health insurance coverage and improved health outcomes. (IOM, 2009; Bernstein et al., 2010; Bovbjerg & Hadley, 2007; Hadley, 2007) According to the Institute of Medicine, “A robust body of well‐designed, high‐quality research provides compelling findings about the harms of being uninsured and the benefits of gaining health insurance for both children and adults.” (IOM, 2009, p. 2) This relationship has been demonstrated for adults with a variety of acute and chronic health conditions, including stroke, cancer, congestive heart failure, diabetes, heart attack, a variety of acute conditions that require inpatient care, hypertension and serious injury or trauma. ‐ Dr. Benjamin Sommers discussing his article which was published in NEJM at http://gbpi.org This finding is true of preventive health services for both children and adults (IOM, 2009; Bernstein et al., 2010; Bovbjerg and Hadley, 2007), as well as for medical management for chronic illnesses (CDC, 2010; IOM, 2009; Bovbjerg and Hadley, 2007). Those who do not receive appropriate preventive and screening services are more likely to experience preventable illnesses, later diagnosis of acute and chronic illness and treatment delays (Bernstein et al., 2010; IOM, 2009). People who do not receive consistent medical management for chronic illnesses are more likely to experience poorer health outcomes, greater limitations in quality of life, and premature death. (Bernstein et al., 2010; IOM, 2009) The relationship between health insurance coverage and improved health outcomes also holds true for children. “When children acquire health insurance they receive more timely diagnosis of serious health conditions, experience fewer avoidable hospitalizations, have improved asthma outcomes, and miss fewer days of school.” (IOM, 2009, p. 3) Conversely, when both children and adults acquire health insurance, their access to care increases and many of the negative health effects of uninsurance are reduced. (IOM, 2009; CDC, 2010) A recent study published in the New England Journal of Medicine compared access to care in three states that implemented recent expansion in adult Medicaid eligibility in comparison with neighboring states without expansions. This study reported a significant decrease in the rate of delayed care, as well as a significant increase in self‐reported health in the Medicaid expansion states. (Sommers et al., 2012) When children acquire health insurance they receive more timely diagnosis of serious health conditions, experience fewer avoidable hospitalizations, have improved asthma outcomes, and miss fewer days of school. ‐ Institutes of Medicine 25 lack of physical or mental energy needed to complete tasks, increased workplace accidents, and the possible spread of illness to fellow employees. Both of these factors are costly. According to the Current Population Survey (CPS), 2.3% of workers will have an absence from work during a typical week due to injury or illness. Several studies estimating the extent to which presenteeism affects productivity indicate that the average productivity loss caused by some of the most common conditions (such as allergies, depression, musculoskeletal pain and respiratory disorders) is between 5 and 18 percent.” Labor market impacts Increasing health insurance coverage by adopting the Medicaid expansion will have several potential impacts on the labor market in Kentucky, including increasing the supply of labor, improving workforce productivity among employed individuals, and reducing friction in the labor market. The labor supply will be increased through adoption of the ACA Medicaid expansion in several ways. First, as indicated above, health insurance coverage decreases mortality and premature death. This decrease in mortality could lead directly to an increase in individuals available for employment. Second, when health insurance coverage becomes available, covered individuals’ health status improves. This increases the likelihood that these individuals will rejoin the labor force. Finally, making Medicaid coverage available to childless adults removes one of the current key incentives to applying for Supplemental Security Income (SSI) and Supplemental Security Disability Insurance (SSDI). Low and moderate income SSDI recipients and SSI recipients who are capable of work face the reality that their receipt of health insurance, and thus medical care, is connected to their enrollment in SSI or SSDI and their separation from the workforce. Studies have estimated that 30% to 40% of the SSDI population could potentially remain in the workforce, but the combination of a small monthly income and guaranteed health insurance incentivize them to leave the workforce and receive SSDI coverage instead. (Chen & Van Der Klauuw, 2008; Bound, Burkhauser & Nichols, 2001) If Medicaid coverage is available without establishing a disability, a portion of this group may decide to remain in the workforce. The ACA Medicaid expansion also has the potential to improve the efficiency of Kentucky’s workforce. Absenteeism and presenteeism are two factors that reduce employee productivity, according to Council of Economic Advisers [CEA], (2008): The academic literature on absenteeism and presenteeism predominantly focuses on employee wellness programs, as that benefit is believed to be useful in reducing absenteeism and presenteeism. However, providing health insurance coverage through the Medicaid expansion is likely to have the spillover effect of reducing absenteeism and presenteeism for Kentucky’s small employers, by increasing preventive care and treatment for persistent employee health issues. Although the literature does not explicitly address the impact of health insurance coverage on absenteeism and presenteeism, it should be self‐ evident that comprehensive health insurance coverage is the most essential component of any employee wellness program. Labor markets are considered frictional when employees delay job changes or delay accepting job offers because of structural issues. One key friction is employer‐sponsored health insurance. Employees may delay changing jobs because of concerns about loss of health insurance. Making insurance universally available through the ACA Medicaid expansion and the Health Benefits Exchange, with associated premium subsidies for those with income under 400% FPL, removes this obstacle and decreases friction in the labor market. Madrian (1994) estimated that the lack of health insurance options decreased worker mobility by 25%. “Absenteeism, not being present at work as a result of injury or illness, prevents the individual from being productive and may also affect the ability of coworkers to be productive when tasks require collaboration. Presenteeism is the loss of productivity while at work because of a 26 Additional Issues Associated with Not Adopting the ACA Medicaid Expansion Table 18 ‐ Federal Poverty Guidelines by Household Size Household size 1 There are three additional factors to be considered in assessing the impact of the ACA Medicaid expansion in Kentucky: • • • The coverage gap for people with income at or below 100% FPL if Kentucky does not implement the Medicaid expansion; and The impact of the ACA reduction in DSH payments to hospitals; and Increased fines and penalties faced by Kentucky employers if Medicaid is not expanded. % OF FEDERAL POVERTY LEVEL 100% 138% 200% 400% $11,490 $15,856 $22,980 $45,960 2 15,510 21,403 31,020 62,040 3 19,530 26,951 39,060 78,120 4 23,550 32,499 47,100 94,200 5 27,570 38,047 55,140 110,280 6 31,590 43,594 63,180 126,360 7 35,610 49,142 71,220 142,440 8 For each additional person, add 39,630 54,689 79,260 158,520 $4,020 $5,548 $8,040 $16,080 Coverage Gap Impact of DSH Payments When ACA was originally passed, it included health insurance coverage for all Americans. Low‐income people were to be covered through the mandatory expansion of the Medicaid program to those with incomes up to 138% FPL. The Health Benefits Exchanges were to offer coverage to individuals and small groups, with premium subsidies for those with incomes between 100% and 400% FPL. When the Supreme Court ruling effectively made the Medicaid expansion optional, a coverage gap was created for people who are not eligible under a state’s current Medicaid income and categorical eligibility rules, and whose income is too low for them to qualify for premium subsidies through the HBE. In Kentucky, this group is composed of men and women who are not raising a child, are under age 65, are not disabled, and whose income is between 43% and 100% FPL. These people clearly do not have the income needed to purchase private health insurance, without subsidies, so they will remain uninsured if Kentucky does not adopt the ACA Medicaid expansion. According to the Current Population Survey, this group could be as large as 206,000 individuals. Table 18 provides details regarding the Federal Poverty Level by household size. As indicated earlier, because ACA was designed to substantially reduce the number of uninsured individuals in the U.S., it also reduces Federal Disproportionate Share Hospital (DSH) payments to the states. Although the ACA approach to allocating DSH funding among the states is designed to take into account the state’s percentage of uninsured, final rules for the DSH reductions have not yet been published. Therefore, states that do not implement the Medicaid expansion risk losing substantial resources that will be needed by hospitals that serve large numbers of low income, uninsured patients, without the intended reduction in the number of uninsured in the state. Table 19 details the expected DSH reductions that will occur. It does not include state mental hospital DSH Table 19 – DSH Reductions to Hospitals Private State Acute Care Psychiatric Fiscal Year Hospitals Hospitals University Hospitals 2014 $ 2,895,000 $ 88,000 $ 2,439,000 2015 $ 3,474,000 $ 105,000 $ 2,927,000 2016 $ 3,474,000 $ 105,000 $ 2,927,000 2017 $ 10,422,000 $ 316,000 $ 8,780,000 2018 $ 28,949,000 $ 878,000 $ 24,390,000 2019 $ 32,423,000 $ 983,000 $ 27,316,000 2020 $ 23,159,000 $ 702,000 $ 19,512,000 2021 $ 23,159,000 $ 702,000 $ 19,512,000 Total $ 127,955,000 $ 3,879,000 $ 107,803,000 27 reductions, and it assumes that savings secured by ACA in 2021 will be included in the 2021 baseline budget. significant increase in demand for health services, and increased pressure on Kentucky’s health care workforce. The Kentucky Health Benefits Exchange contracted with Deloitte to study Kentucky’s current health care work force; current and future work force shortage areas; policy changes that could increase the supply of health care providers to improve population health; and recommendations for recruiting, reconfiguring and maintaining an adequate health care work force. The results of this analysis will be announced in the coming weeks. Employer Fines and Penalties Under the Affordable Care Act, employees whose employers provide health insurance coverage will generally receive insurance through their employer. However, there are three scenarios in which an individual eligible for employer‐based coverage would be permitted to purchase insurance through the Health Benefits Exchange or enroll in Medicaid: CONCLUSION 1. The cost of the employer based plan exceeds 9.5% of the employee’s household income; 2. The employer‐based plan does not cover the Essential Health Benefits determined by HHS; or 3. The plan does not meet HHS “minimum value” standards. The Cabinet for Health and Family Services has conducted an exhaustive review of ACA Medicaid expansion, including contracting with outside experts. This review makes the overwhelming case that expansion is the right choice for Kentucky. In particular: • If an individual meets one or more of the criteria listed above, they are eligible to purchase insurance through the exchange or enroll in Medicaid. If Medicaid is expanded and those persons between 100% and 138% of FPL choose to enroll, then their employer faces no penalty. However, if Medicaid is not expanded and persons between 100% and 138% of FPL must purchase insurance through HBE with subsidized premiums, then their employers will be responsible for $3,000 in penalties for every employee receiving premium subsidies, with a cap for each company of at $2,000 multiplied by the total number of employees. Using Census data, Jackson Hewitt (2012) has estimated that the cost of these penalties to Kentucky employers could range from $32 million to more than $48 million annually. • • • FUTURE CONSIDERATIONS In addition to the population that will receive Medicaid coverage if Kentucky implements the ACA Medicaid expansion, over 200,000 Kentuckians will also be eligible for some form of health insurance subsidies under ACA. These coverage expansions will lead to a Medicaid expansion, coupled with the Kentucky Health Benefit Exchange, means that every individual currently uninsured, an estimated 640,000 Kentuckians, will have the opportunity to gain health insurance. This will give Kentucky the opportunity to change its dismal health rankings. Medicaid expansion is the right choice for Kentucky’s taxpayers, creating a positive budgetary impact of $802.4 million between SFY 2014 and SFY 2021. Medicaid expansion is the right choice for the economy, creating nearly 17,000 jobs annually, and an economic impact of $15.6 billion between SFY 2014 and SFY 2021. However, if the state chooses to not expand its Medicaid program, it will cost the state more, it will lead to millions in penalties against our businesses and our hospitals will suffer. It is for these reasons and the issues fully documented in this paper that the Department for Medicaid Services and the Cabinet for Health and Family Services support Medicaid expansion on the Commonwealth of Kentucky. 28 WORKS CITED Without Medicaid Expansion, Employers Face Higher Tax Penalties Under ACA. Bernstein, J., Chollet, D., & Peterson, S. (2010) How does insurance coverage improve health outcomes? Mathematica Policy Research. Bound, J., Burkhauser, R., & Nichols, A. (2001). Tracking the Household Income of SSDI and SSI Applicants, University of Michigan, Michigan Retirement Research Center Working Papers. Kaiser Commission on Medicaid and the Uninsured (2012) The cost and coverage implication of the ACA Medicaid expansion: National and state‐by‐state analysis. Holahan, J., Buettgens, M., Carroll, C., & Dorn, S. Bovbjerg, R.R. and Hadley, J. (2007) Why health insurance is important. The Urban Institute: Health Policy Briefs. Kaiser Commission on Medicaid and the Uninsured (2003) The Medicaid resource book. Cabinet for Health and Family Services (2012). Quarterly Report. Submitted to the Legislative Research Commission. Kentucky Voices for Health (2012) The case for Medicaid expansion: Good for the economy, good for health, good for Kentucky. Centers for Disease Control and Prevention (2010). Vital Signs: Health Insurance Coverage and Health Care Utilization—United States, 2006‐2009 and January‐ March 2010. Morbidity and Mortality Weekly Report, 59(44); 1448‐1454. Madrian, Brigitte C. (1994). Employment‐based health insurance and job mobility: Is there evidence of job‐ lock? The Quarterly Journal of Economics, 109(1), p. 27–54. Rhode Island Senate Fiscal Office (2010) Medicaid Disproportionate Share Hospital (DSH) Payments. Issue Brief. Chen, S. & Van der Klauuw, W. (2008). The work disincentive effects of the disability insurance program in the 1990s. Journal of Econometrics, 142(2), pages 757‐784. Sommers, B.D., Baicker, K., & Epstein, A.M. (2012) Mortality and access to care among adults after state Medicaid expansions. The New England Journal of Medicine, 367(11). Congressional Budget Office (2012). Estimates for the Insurance Coverage Provisions of the Affordable Care Act Updated for the Recent Supreme Court Decision. State Health Reform Assistance Network (2012) Medicaid expansion: Framing and planning a financial impact analysis. Prepared by Manatt Health Solutions, Center for Health Care Strategies (CHCS), and State Health Access Data Assistance Center (SHADAC). Council of Economic Advisers (2008) Economic report of the President, p. 99. Dorn, S. (2012). Consideration in assessing state‐specific fiscal effects of the ACA’s Medicaid expansion. Urban Institute Health Policy Center. United Health Foundation (2012) America’s health rankings. Produced as a joint effort with American Public Health Association and Partnership for Prevention. Fortuny, K. & Chaudry, A. (2011). A Comprehensive review of immigrants access to health and human services, Urban Instute. United States Census Bureau (2012) Small Area Health Insurance Estimates. Retrieved electronically from http://www.census.gov/did/www/sahie/index.html Hadley, J. (2007) Insurance coverage, medical care use, and short‐term health changes following an unintentional injury or the onset of a chronic condition. Journal of the American Medical Association, 297(10). Institute of Medicine of the National Academies (2009) America’s uninsured crisis: Consequences for health and health care. Report Brief. Jackson Hewitt Tax Service (2012) The Supreme Court’s ACA Decision and Its Hidden Surprise for Employers: 29

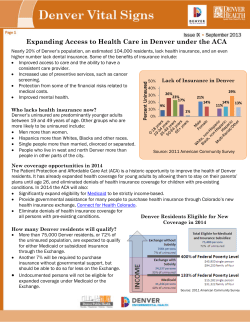


© Copyright 2026