
Effects of North American Free Trade Agreement on Agriculture
Electronic Outlook Report from the Economic Research Service
United States
Department
of Agriculture
WRS-02-1
www.ers.usda.gov
AGRICULTURE AND TRADE REPORTS
July 2002
Effects of North American Free
Trade Agreement on Agriculture
and the Rural Economy
Steven Zahniser and John Link (editors)
Abstract
U.S. agricultural trade with Canada and Mexico has nearly doubled since the implementation of the North American Free Trade Agreement (NAFTA). While only a portion of
this overall increase can be attributed solely to the agreement, NAFTA has allowed
competitive market forces to play a more dominant role in determining agricultural trade
flows among the three countries. By dismantling numerous trade barriers, the agreement
has contributed to an expansion in U.S. agricultural exports and increased the domestic
availability of various farm and food products. In addition, NAFTA has established rules
and institutions that mitigate potential trade frictions and promote foreign direct investment. Conversely, many of the initial trepidations that were voiced concerning declining
agricultural employment and environmental degradation have not materialized. Thus,
NAFTA should be judged not just in the context of the trade gains associated with the
agreement’s agricultural provisions, but also in terms of the benefits derived from
“locking in” key trade, investment, and institutional reforms in an increasingly integrated
North American market.
Keywords: North American Free Trade Agreement, NAFTA, agriculture, Mexico,
Canada, United States, trade, environment, transportation, employment.
FOREWORD
This document is the third in a series of reports about the North American Free
Trade Agreement (NAFTA) and its impact on U.S. agriculture and the rural
economy. The report is prepared in accordance with the North American Free
Trade Agreement Implementation Act, which requires the Secretary of Agriculture
to submit a biennial report on this subject to the U.S. Congress, starting in 1997
and ending in 2011. This edition of the report reflects the research team’s understanding of economic and policy developments through early 2001.
Since NAFTA’s implementation, U.S. agricultural trade with its partners in the
agreement has increased in both size and relative importance. Between 1993 and
2000, U.S. agricultural exports to Canada and Mexico expanded by 59 percent,
while corresponding exports to the rest of the world grew only 10 percent.
Similarly, U.S. agricultural imports from Canada and Mexico increased 86 percent
between 1993 and 2000, compared with 42 percent for U.S. agricultural imports
from the rest of the world.
NAFTA is one of many factors contributing to the economic integration of the
agreement’s member countries. Other factors that are particularly important with
respect to agriculture are unusual weather conditions, population growth, and
changes in exchange rates and macroeconomic performance. With this in mind, the
report provides a careful assessment of NAFTA’s impact in the context of other
events and economic forces.
This report was prepared by an Economic Research Service (ERS) team. Report
Coordinators: Steven Zahniser and John Link. Section Coordinators: Karen Ackerman
(Animal and Plant Health Inspection Service [APHIS]—fruits, vegetables, sugar),
William Hahn (livestock, animal products), and Linwood Hoffman (grains, oilseeds,
cotton). Contributors: Karen Ackerman (selected fruits, sugar), Ed Allen (feed grains,
wheat), Mark Ash (oilseeds), Chris Bolling (investment), Samuel Calhoun (maps),
Linda Calvin (peaches), Nathan Childs (rice), Joseph Cooper (environment), Mildred
Haley (hogs, pork), William Hahn (cattle, beef, poultry, dairy products), William Hall
(Seaport Consultants—transportation), Karen Hamrick (employment), Andy Jerardo
(investment), John Link (policy developments, commodity overview), Gary Lucier
(vegetables), Stephen MacDonald (cotton, employment), Christopher McGath (investment data), Leslie A. Meyer (employment), Wesley Nimon (environment), Agnes
Perez (fruits), Paulette Perry (administrative assistance), Charles Plummer (potatoes),
Susan Pollack (orange juice), Agnes Prentice (list of abbreviations), Robert Skinner
(peanuts), Mark Smith (environment), Nydia Suárez (sugar), John Wainio (domestic
policies), and Steven Zahniser (policy developments, commodity overview, employment, selected fruits).
We gratefully acknowledge Lloyd Coonrod (Foreign Agricultural Service—FAS),
Praveen Dixit, John Dunmore, Carol Goodloe (Office of the Chief Economist—
OCE), Stephen Haley, Joy Harwood, Demcey Johnson, Janet Perry, Daniel Pick, Greg
Pompelli, Roger Mireles (FAS), and Justina Torry (FAS) for their feedback and
comments. In addition, some insights in this report were obtained through activities
funded by FAS’s Emerging Market Program. Finally, special thanks go to Curtis
Kooser (U.S. Department of Labor) and Mary May (U.S. Department of Commerce),
who provided data used in the employment section. Special thanks are extended to
Dana Rayl West and Wynnice Pointer-Napper for editorial and design assistance.
ii ✺ Effects of NAFTA on Agriculture and the Rural Economy / WRS-02-1
Economic Research Service, USDA
CONTENTS
Executive Summary . . . . . . . . . . . . . . . . . . . . . . . . . . . . . . . . . . . . . . . . . . . . . .v
PART I: NAFTA'S IMPACT ON U.S. AGRICULTURE:
A BROAD OVERVIEW . . . . . . . . . . . . . . . . . . . . . . . . . . . . . . . . . . . . . . . .1
Developments in Trade Policies, Domestic Agricultural Programs,
and Dispute Resolution . . . . . . . . . . . . . . . . . . . . . . . . . . . . . . . . . . . . . . . .1
Introduction . . . . . . . . . . . . . . . . . . . . . . . . . . . . . . . . . . . . . . . . . . . . . . . .1
The Canada-U.S. Free Trade Agreement . . . . . . . . . . . . . . . . . . . . . . . . . . .1
The North American Free Trade Agreement . . . . . . . . . . . . . . . . . . . . . . . .2
NAFTA and Domestic Agricultural Policies . . . . . . . . . . . . . . . . . . . . . . . .3
Agricultural Trade Disputes in the NAFTA Era . . . . . . . . . . . . . . . . . . . . .6
Dispute Resolution Mechanisms in NAFTA . . . . . . . . . . . . . . . . . . . . . . . .7
References . . . . . . . . . . . . . . . . . . . . . . . . . . . . . . . . . . . . . . . . . . . . . . . . .9
NAFTA's Impact on U.S. Agricultural Trade: An Overview . . . . . . . . . . . . .10
Introduction . . . . . . . . . . . . . . . . . . . . . . . . . . . . . . . . . . . . . . . . . . . . . . .10
Trends in U.S. NAFTA Trade . . . . . . . . . . . . . . . . . . . . . . . . . . . . . . . . . .10
Evaluating NAFTA's Impact . . . . . . . . . . . . . . . . . . . . . . . . . . . . . . . . . . .11
Investment in Agriculture and Food Processing . . . . . . . . . . . . . . . . . . . . . . .22
Introduction . . . . . . . . . . . . . . . . . . . . . . . . . . . . . . . . . . . . . . . . . . . . . . .22
U.S. Farm and Food-Processing Investment . . . . . . . . . . . . . . . . . . . . . . .22
NAFTA and Foreign Direct Investment . . . . . . . . . . . . . . . . . . . . . . . . . . .23
Recent ERS Research about FDI . . . . . . . . . . . . . . . . . . . . . . . . . . . . . . .25
Conclusion . . . . . . . . . . . . . . . . . . . . . . . . . . . . . . . . . . . . . . . . . . . . . . . .26
References . . . . . . . . . . . . . . . . . . . . . . . . . . . . . . . . . . . . . . . . . . . . . . . .26
Employment in U.S. Agriculture and Related Industries . . . . . . . . . . . . . . . .28
Introduction . . . . . . . . . . . . . . . . . . . . . . . . . . . . . . . . . . . . . . . . . . . . . . .28
Sectoral Employment Levels . . . . . . . . . . . . . . . . . . . . . . . . . . . . . . . . . .28
Federal Assistance with Trade Adjustment . . . . . . . . . . . . . . . . . . . . . . . .31
Textiles and Apparel: A Closer Look . . . . . . . . . . . . . . . . . . . . . . . . . . . .35
Conclusion . . . . . . . . . . . . . . . . . . . . . . . . . . . . . . . . . . . . . . . . . . . . . . . .41
References . . . . . . . . . . . . . . . . . . . . . . . . . . . . . . . . . . . . . . . . . . . . . . . .41
NAFTA, Agricultural Trade, and the Environment . . . . . . . . . . . . . . . . . . . .43
Introduction . . . . . . . . . . . . . . . . . . . . . . . . . . . . . . . . . . . . . . . . . . . . . . .43
The Environmental Impact of Trade Liberalization:
Theory and Evidence . . . . . . . . . . . . . . . . . . . . . . . . . . . . . . . . . . . . . .43
Trade Liberalization and Agriculture: Empirical Evidence . . . . . . . . . . . .44
The North American Agreement on Environmental Cooperation . . . . . . . .45
Environmental Concerns: The Effects of Trade and NAFTA's Rules . . . . .47
Conclusion . . . . . . . . . . . . . . . . . . . . . . . . . . . . . . . . . . . . . . . . . . . . . . . .48
References . . . . . . . . . . . . . . . . . . . . . . . . . . . . . . . . . . . . . . . . . . . . . . . .48
Economic Research Service, USDA
The Effects of NAFTA on Agriculture and the Rural Economy / WRS-02-1 ✺ iii
Modal Choices in the Transportation of U.S.-Mexico Agricultural Trade . . .51
Delays Accompany Growth in U.S.-Mexico Trade . . . . . . . . . . . . . . . . . .51
The Improved Efficiency of Mexican Rail Carriers . . . . . . . . . . . . . . . . . .52
Challenges Facing Intermodal Rail . . . . . . . . . . . . . . . . . . . . . . . . . . . . . .52
Recent Developments in Maritime Systems . . . . . . . . . . . . . . . . . . . . . . .53
Conclusion . . . . . . . . . . . . . . . . . . . . . . . . . . . . . . . . . . . . . . . . . . . . . . . .54
PART II: DETAILED COMMODITY ASSESSMENT . . . . . . . . . . . . . . . . .56
Livestock and Animal Products . . . . . . . . . . . . . . . . . . . . . . . . . . . . . . . . . . . .56
Cattle . . . . . . . . . . . . . . . . . . . . . . . . . . . . . . . . . . . . . . . . . . . . . . . . . . . .56
Beef . . . . . . . . . . . . . . . . . . . . . . . . . . . . . . . . . . . . . . . . . . . . . . . . . . . . .58
Hogs . . . . . . . . . . . . . . . . . . . . . . . . . . . . . . . . . . . . . . . . . . . . . . . . . . . .60
Pork . . . . . . . . . . . . . . . . . . . . . . . . . . . . . . . . . . . . . . . . . . . . . . . . . . . . .63
Poultry Meat . . . . . . . . . . . . . . . . . . . . . . . . . . . . . . . . . . . . . . . . . . . . . .64
Dairy . . . . . . . . . . . . . . . . . . . . . . . . . . . . . . . . . . . . . . . . . . . . . . . . . . . .67
Grains, Oilseeds, and Related Products . . . . . . . . . . . . . . . . . . . . . . . . . . . . .70
Corn . . . . . . . . . . . . . . . . . . . . . . . . . . . . . . . . . . . . . . . . . . . . . . . . . . . . .70
Sorghum . . . . . . . . . . . . . . . . . . . . . . . . . . . . . . . . . . . . . . . . . . . . . . . . . .71
Barley . . . . . . . . . . . . . . . . . . . . . . . . . . . . . . . . . . . . . . . . . . . . . . . . . . .72
Oats . . . . . . . . . . . . . . . . . . . . . . . . . . . . . . . . . . . . . . . . . . . . . . . . . . . . .74
Wheat . . . . . . . . . . . . . . . . . . . . . . . . . . . . . . . . . . . . . . . . . . . . . . . . . . . .75
Rice . . . . . . . . . . . . . . . . . . . . . . . . . . . . . . . . . . . . . . . . . . . . . . . . . . . . .78
Oilseeds and Oilseed Products . . . . . . . . . . . . . . . . . . . . . . . . . . . . . . . . .80
Peanuts and Peanut Products . . . . . . . . . . . . . . . . . . . . . . . . . . . . . . . . . .83
Other Field Crops . . . . . . . . . . . . . . . . . . . . . . . . . . . . . . . . . . . . . . . . . . . . . .86
Dry Beans . . . . . . . . . . . . . . . . . . . . . . . . . . . . . . . . . . . . . . . . . . . . . . . .86
Cotton . . . . . . . . . . . . . . . . . . . . . . . . . . . . . . . . . . . . . . . . . . . . . . . . . . .87
Sugar and Sweeteners . . . . . . . . . . . . . . . . . . . . . . . . . . . . . . . . . . . . . . . .90
Vegetables . . . . . . . . . . . . . . . . . . . . . . . . . . . . . . . . . . . . . . . . . . . . . . . . . . . . .95
Fresh Tomatoes . . . . . . . . . . . . . . . . . . . . . . . . . . . . . . . . . . . . . . . . . . . .95
Processed Tomatoes . . . . . . . . . . . . . . . . . . . . . . . . . . . . . . . . . . . . . . . . .98
Bell Peppers . . . . . . . . . . . . . . . . . . . . . . . . . . . . . . . . . . . . . . . . . . . . . .100
Fresh-Market Cucumbers . . . . . . . . . . . . . . . . . . . . . . . . . . . . . . . . . . . .101
Squash . . . . . . . . . . . . . . . . . . . . . . . . . . . . . . . . . . . . . . . . . . . . . . . . . .103
Eggplant . . . . . . . . . . . . . . . . . . . . . . . . . . . . . . . . . . . . . . . . . . . . . . . . .104
Snap Beans . . . . . . . . . . . . . . . . . . . . . . . . . . . . . . . . . . . . . . . . . . . . . . .105
Fresh and Processed Potatoes . . . . . . . . . . . . . . . . . . . . . . . . . . . . . . . . .106
Frozen Broccoli and Cauliflower . . . . . . . . . . . . . . . . . . . . . . . . . . . . . .108
Fruits and Fruit Juices . . . . . . . . . . . . . . . . . . . . . . . . . . . . . . . . . . . . . . . . .110
Fresh Citrus . . . . . . . . . . . . . . . . . . . . . . . . . . . . . . . . . . . . . . . . . . . . . .110
Orange Juice . . . . . . . . . . . . . . . . . . . . . . . . . . . . . . . . . . . . . . . . . . . . . .111
Fresh Apples . . . . . . . . . . . . . . . . . . . . . . . . . . . . . . . . . . . . . . . . . . . . . .114
Fresh Pears . . . . . . . . . . . . . . . . . . . . . . . . . . . . . . . . . . . . . . . . . . . . . . .117
Fresh Peaches . . . . . . . . . . . . . . . . . . . . . . . . . . . . . . . . . . . . . . . . . . . . .118
Avocados . . . . . . . . . . . . . . . . . . . . . . . . . . . . . . . . . . . . . . . . . . . . . . . .120
Grapes . . . . . . . . . . . . . . . . . . . . . . . . . . . . . . . . . . . . . . . . . . . . . . . . . .121
Cantaloupe . . . . . . . . . . . . . . . . . . . . . . . . . . . . . . . . . . . . . . . . . . . . . . .122
Watermelon . . . . . . . . . . . . . . . . . . . . . . . . . . . . . . . . . . . . . . . . . . . . . .123
iv ✺ Effects of NAFTA on Agriculture and the Rural Economy / WRS-02-1
Economic Research Service, USDA
EXECUTIVE SUMMARY
U.S. agricultural trade with Canada and Mexico has nearly doubled since the
implementation of the North American Free Trade Agreement (NAFTA). While
only a portion of this overall increase can be attributed solely to the agreement,
NAFTA has allowed competitive market forces to play a more dominant role in
determining agricultural trade flows among the three countries. By dismantling
numerous trade barriers, the agreement has contributed to an expansion in U.S.
agricultural exports and increased the domestic availability of various farm and
food products. In addition, NAFTA has established rules and institutions that mitigate potential trade frictions and promote foreign direct investment. Conversely,
many of the initial trepidations that were voiced concerning declining agricultural
employment and environmental degradation have not materialized. Thus, NAFTA
should be judged not just in the context of the trade gains associated with the
agreement's agricultural provisions, but also in terms of the benefits derived from
“locking in” key trade, investment, and institutional reforms in an increasingly
integrated North American market.
What is NAFTA?
NAFTA, which took effect on January 1, 1994, provides for the progressive elimination of most barriers to trade and investment between Canada, Mexico, and the
United States over the 14-year period that ends on January 1, 2008. The agreement
also incorporates the Canada-U.S. Free Trade Agreement (CFTA), whose implementation was completed on January 1, 1998. Although NAFTA's transition is still
in progress, most of the process of tariff elimination for agricultural products has
already taken place. Thus, NAFTA's influence on U.S. agriculture to date should
provide a good indication of the agreement's long-term impact.
NAFTA's Trade Impact
U.S. agricultural trade with Canada and Mexico has continued on an upward trend
since the implementation of NAFTA (fig. A-1). These two countries were the destination for 28 percent of U.S. agricultural exports and the origin of 35 percent of
U.S. agricultural imports in 2000. A decade earlier, these shares were only 17
Figure A-1
U.S. agricultural trade with the NAFTA countries, 1990-2000
U.S. dollars (billions)
16
14
Exports
Imports
12
10
8
6
4
2
0
1990
92
94
96
98
2000
Source: Foreign Agricultural Trade of the United States database.
Economic Research Service, USDA
The Effects of NAFTA on Agriculture and the Rural Economy / WRS-02-1 ✺ v
percent and 25 percent, respectively. However, many of these changes already
were underway prior to NAFTA. Moreover, other factors - such as population
growth, changes in macroeconomic performance and exchange rates, and unusual
weather patterns - generally have had a much stronger effect on U.S agricultural
trade with Canada and Mexico than NAFTA.
A commodity-by-commodity analysis provides a fuller understanding of NAFTA's
impact on U.S. agricultural trade (table A-1). For most commodities, NAFTA's
influence is relatively small, generating a small increase in the export or import of
a particular commodity with either Canada or Mexico. For a handful of commodities, NAFTA has had a much larger impact, with an increase in trade volume of 15
percent or more that is directly attributable to the agreement. This is particularly
true for products whose trade was severely restricted prior to CFTA and NAFTA.
Rice is one such example. U.S. rice exports to Mexico have more than doubled in
volume since NAFTA's implementation, and the gradual reduction of Mexico's
tariffs on U.S. rice has played a key role in the expansion of this trade. Similarly,
U.S. cotton exports to Canada and Mexico have tripled, as the textile and apparel
industries in each NAFTA country were able to integrate more fully due to the
phasing out of various trade barriers related to these sectors. NAFTA also has
provided a boost of at least 15 percent to U.S. pear and apple exports to Mexico.
There has been marked growth in certain U.S. agricultural imports as well. For
instance, NAFTA has raised the volume of U.S. imports of fresh tomatoes from
Mexico by some 8-15 percent, despite the enactment of a price-floor agreement
among principal Mexican and U.S. growers. Similarly, the elimination of U.S.
tariffs on fresh potatoes from Canada has led to increased imports, although an
expansion in Canadian production and processing and the strong U.S. dollar also
are responsible for the growth of this trade. Sugar imports from Mexico have risen
considerably from the small levels allowed prior to NAFTA, although achieving
the modest duty-free amount of 116,000 metric tons has involved excruciating
bilateral consultations.
NAFTA's Investment Impact
An important element of NAFTA is the agreement's rules concerning foreign direct
investment (FDI). These rules strengthen the rights of foreign investors to retain
profits and returns from their initial investments. The combination of trade liberalization and investment reform has stimulated FDI in the North American food
processing industry, with firms in each NAFTA country providing substantial
investment capital.
U.S. direct investment in the Mexican food processing industry has more than
doubled since NAFTA's implementation, reaching $5.3 billion in 1999. Much of
these investments are concentrated in highly processed products such as pasta,
confectionery products, and canned and frozen meats. Similarly, under CFTA and
NAFTA, U.S. FDI in the Canadian food processing industry expanded from $1.8
billion in 1989 to $5.0 billion in 1999. But unlike FDI in Mexico, U.S. FDI in
Canada has been geared more towards the handling and processing of grains.
vi ✺ Effects of NAFTA on Agriculture and the Rural Economy / WRS-02-1
Economic Research Service, USDA
Table A-1—NAFTA has dramatically affected the volume of trade
of certain commodities
Commodity
Annual average of actual trade
Value
Volume
1990-93 1994-2000 1990-93 1994-2000 Units
Estimated change
in trade volume
due solely
to NAFTA
Selected exports to Canada
Beef and veal
Wheat products1
Cotton
Processed tomatoes
349
22
62
71
317
48
91
109
85
27
42
--
92
66
60
--
mt
mt
mt
--
Increase -- High
Increase -- High
Increase -- Medium
Increase -- Medium
Selected exports to Mexico
Rice
Dairy products
Cotton (including linters)
Processed potatoes
Fresh apples
Fresh pears
Corn
Oilseeds
Beef and veal
Sorghum
41
151
102
6
28
16
178
401
149
402
87
162
342
19
61
26
521
740
309
307
161
-80
8
54
31
1,557
1,662
50
3,687
386
-235
28
112
51
4,326
2,956
107
3,083
mt
-mt
mt
mt
mt
mt
mt
mt
mt
Increase -- High
Increase -- High
Increase -- High
Increase -- High
Increase -- High
Increase -- High
Increase -- Medium
Increase -- Medium
Increase -- Medium
Decrease -- High
Selected imports from Canada
Wheat (excluding seed)
136
Wheat products1
38
Beef and veal
111
Corn
21
Fresh potatoes
51
Processed potatoes
50
Cattle and calves
741
268
98
264
30
85
199
857
1,109
72
260
218
274
91
1,063
1,920
185
638
268
380
313
1,185
mt
mt
mt
mt
mt
mt
no
Increase -- High
Increase -- High
Increase -- High
Increase -- Medium
Increase -- Medium
Increase -- Medium
Decrease -- High
Selected imports from Mexico
Wheat products1
4
Cattle and calves
388
Peanuts (shelled & in shell)
*
Sugar (cane & beet)
2
Fresh tomatoes
264
Processed tomatoes
15
Cantaloupe
40
14
300
3
49
470
16
47
6
1,144
*
1
322
-120
21
965
4,323
17
608
-136
mt
no
mt
mt
mt
-mt
Increase -- High
Increase -- High
Increase -- High
Increase -- High
Increase -- Medium
Increase -- Medium
Increase -- Medium
* = Negligible. mt = Metric tons. no = Number.
1 Includes flour, bulgur wheat, starch, gluten, and uncooked pasta.
Estimates reflect changes in trade volume during 1994-2000 due solely to CFTA and NAFTA and
are based on assessments of ERS analysts:
High = A change of more than 15 percent, compared with what would have occurred without CFTA
and NAFTA.
Medium = A change of 6 to 15 percent.
Source for trade data: Foreign Agricultural Trade of the United States database.
NAFTA and Agricultural Employment
By increasing opportunities for U.S. exports and encouraging the more efficient
allocation of economic resources, NAFTA has had a small, positive influence on
U.S. agricultural employment. However, only a few agricultural sectors have experienced substantial changes in their employment levels since NAFTA's implementation, and many of these changes are driven by factors other than the agreement.
Employment in crop production has changed very little, while employment in live-
Economic Research Service, USDA
The Effects of NAFTA on Agriculture and the Rural Economy / WRS-02-1 ✺ vii
stock production has decreased, reflecting technological change and consolidation
in the hog industry and drought and poor ranging conditions in the cattle industry.
Employment in landscaping and horticultural services and in veterinary services
increased substantially during the 1990's, but this growth is most likely due to
factors other than NAFTA, such as consumer preferences and the strength of the
U.S. economy.
Two manufacturing sectors related to agriculture - textiles and apparel - have experienced a definite decline in employment since the implementation of NAFTA.
However, this reduction has been underway since the 1970's and probably would
have continued in the absence of NAFTA. Still, by encouraging the development
of a more integrated textile and apparel industry within North America, NAFTA
has been accompanied by expanded textile and apparel trade among the NAFTA
countries, increased productivity in the U.S. textile and apparel sectors, and the
retention of jobs in the textile sector that would have relocated to other parts of the
world in the absence of the agreement.
Sanitary and Phytosanitary Measures
By “locking in” key trade and investment reforms, the agricultural sectors and governments of the NAFTA countries have been able to devote greater attention to resolving
conflicts related to sanitary and phytosanitary (SPS) measures. Some efforts in this
area have taken place with the trilateral NAFTA Committee on SPS Measures. In
addition, producers in each NAFTA country have worked to meet higher quality standards and to participate actively in the formulation of new standards.
When these efforts have been successful, they have increased agricultural trade.
Efforts to inspect and approve at the regional level, and in some instances at the
level of individual producers, have opened the door to new markets across international borders. Examples of this approach include:
✺ U.S. imports of avocados from certain approved growers in the Mexican state
of Michoacán;
✺ U.S. recognition of the Mexican state of Sonora as being free of hog cholera;
✺ Mexico's lifting of its ban on citrus from Arizona and producing areas in Texas
that are not regulated for fruit fly; and
✺ continuing efforts to design and implement a satisfactory inspection process for
U.S. apple exports to Mexico.
Trade Frictions in the NAFTA Era
Trade growth also generates conflicts. Agricultural producers in each NAFTA
country have been involved in several disputes, many of which concern countervailing-duty (CVD) measures and/or charges of dumping. There are two active
NAFTA dispute resolution panels in this regard. One relates to U.S. exports of
high-fructose corn syrup, and the other to U.S. exports of bovine carcasses.
Previous NAFTA panels have issued rulings in cases involving U.S. exports of
refined sugar to Canada, Canadian exports of live swine to the United States, and
Mexican exports of fresh cut flowers to the United States. Canada and the United
States continue to spar over the activities of the Canadian Wheat Board, and the
Office of the U.S. Trade Representative recently initiated a Section 301 investigation of this subject.
viii ✺ Effects of NAFTA on Agriculture and the Rural Economy / WRS-02-1
Economic Research Service, USDA
Dispute resolution under the formal NAFTA mechanisms represents only a small
part of the process. Most disputes are addressed in earlier stages through governmental consultations and negotiations. The private sector also has begun to play a
larger role in dispute resolution. For example, in two recent disputes over grapes
and cattle, producer groups in Mexico and the United States worked jointly to
resolve regulatory incompatibilities that were at the root of the disagreement.
NAFTA and the Environment
The available evidence suggests that NAFTA is having a combination of positive
and negative environmental effects, as producers select alternative techniques of
production, increase or decrease the scale of production, and modify the crop and
animal composition of their activities in response to changing economic incentives.
But none of these effects are particularly widespread. Studies also suggest that
NAFTA has not encouraged a general weakening of environmental standards.
By helping to elevate incomes in each NAFTA country, the agreement should also
have a positive, long-run effect on the demand for environmental quality and regulation. This effect should be especially pronounced in Mexico, as that country
reduces the gap in per capita income that currently separates it from Canada and
the United States.
One of NAFTA's real innovations was the creation of the North American
Commission for Environmental Cooperation (CEC), which promotes environmental objectives and provides opportunities for environmental organizations and
other stakeholders to voice their concerns. Several public symposia have been held
under the auspices of the CEC. By bringing environmental concerns before policymakers, these gatherings have facilitated the coordination of trade and environmental policies and lessened the potential conflicts between the two.
NAFTA and Transportation
Transportation bottlenecks, especially for trucks at principal ports of entry along
the U.S.-Mexico border, continue to hamper NAFTA trade. Implementing
NAFTA's motor carrier provisions, which allow Mexican trucking firms to have
greater access to the United States, should help to alleviate these bottlenecks.
Several studies have quantified the total delay costs along the entire U.S.-Mexico
border, and the most recent comprehensive study placed these costs at $77.4
million in 1999. This estimate would have been even higher if increases in air
pollution associated with border congestion had been taken into account.
Further development of the Mexican transportation system will have an important
influence on what modes of transportation are used to ship U.S.-Mexico agricultural trade. With the continuing integration of the U.S. and Mexican railway
systems, intermodal rail (truck-rail-truck) may attract increased traffic of
containerized grains. Improvements in the Mexican Port of Veracruz should
increase the competitiveness of ocean grain shipping from U.S. ports along the
Gulf Coast. However, improvements in Mexican grain ports may also lower transportation costs for U.S. competitors.
Economic Research Service, USDA
The Effects of NAFTA on Agriculture and the Rural Economy / WRS-02-1 ✺ ix
Conclusion
By clearing the way for increased trade and investment among Canada, Mexico,
and the United States, NAFTA is enabling agricultural producers and consumers
throughout North America to benefit more fully from their relative strengths and to
respond more efficiently to changing economic conditions. Each NAFTA country
has taken part in the expanded agricultural trade and foreign direct investment
fostered by the agreement. Moreover, the agreement has been accompanied by
substantial improvements in the North American transportation system and in the
institutional capacity of the NAFTA governments to facilitate agricultural trade,
resolve trade disputes, and cooperate on environmental issues. Together, these
developments are resulting in a more prosperous, more integrated North American
economy.
x ✺ Effects of NAFTA on Agriculture and the Rural Economy / WRS-02-1
Economic Research Service, USDA
Part I
NAFTA’s Impact on U.S. Agriculture:
A Broad Overview
Developments in Trade Policies, Domestic
Agricultural Programs, and Dispute Resolution
Introduction
Important changes in trade policies and domestic agricultural programs have accompanied the implementation of the North American Free Trade Agreement
(NAFTA). Some of these changes are explicitly
required by the agreement. NAFTA contains a detailed
schedule for the progressive dismantling of most
barriers to trade and investment between Canada,
Mexico, and the United States. In addition, the agreement creates a set of formal mechanisms for the resolution of trade disputes within the NAFTA region.
Other changes reflect efforts to adapt to the new
economic conditions associated with freer trade, even
though these actions are not explicitly required by
NAFTA. The NAFTA countries have modified their
domestic agricultural policies in order to bring their
agricultural sectors into conformance with their
NAFTA commitments. This has not been an easy task,
since the close link between domestic agricultural
policies and trade barriers makes it difficult to disentangle the two. Moreover, low market prices over the
last several years have motivated Canada and the
United States to increase their government support to
agricultural producers.
Also, the NAFTA countries have strengthened their
institutional capacity to address trade frictions
through a variety of cooperative measures. In many
instances, this has enabled them to resolve trade
disputes without a formal dispute proceeding. Overall,
this combination of trade liberalization and institutional development is enabling regional flows of
trade and investment to grow at an accelerated pace,
bringing the NAFTA countries closer to their common
goal of a unified market.
Economic Research Service, USDA
The Canada-U.S. Free
Trade Agreement
NAFTA is structured as three bilateral agreements, one
between Canada and the United States, a second
between Mexico and the United States, and a third
between Canada and Mexico. The first accord is the
Canada-U.S. Free Trade Agreement (CFTA), which
took effect on January 1, 1989, and is subsumed by
NAFTA. The provisions of the second and third agreements took effect on January 1, 1994, the date of
NAFTA's implementation.
In many respects, CFTA served as a blueprint for
NAFTA. First, CFTA gradually eliminated most tariffs
and non-tariff barriers to U.S.-Canada trade in goods
over the 9-year period that ended on January 1, 1998.
Second, CFTA committed Canada and the United
States to work toward the harmonization of technical
regulations and standards. Third, CFTA established
bilateral dispute settlement panels to rule on cases
involving countervailing and anti-dumping duties.
Similar provisions are all found in NAFTA.
Only a few exceptions were made to CFTA's process of
trade liberalization: U.S. imports of Canadian dairy
products, peanuts and peanut butter, cotton, and sugar
and sugar-containing products; and Canadian imports of
U.S. dairy products, poultry, eggs and margarine. These
restrictions, originally specified as quotas, were later
redefined as tariff-rate quotas (TRQ's) to comply with
the Uruguay Round Agreement on Agriculture (URAA).
A TRQ is simply a quota for a volume of imports at a
favorable tariff. After the quantitative limit is reached, a
higher tariff is applied on additional imports.
As a safeguard measure, CFTA offers special temporary protection to U.S.-Canada trade in fruits and
The Effects of NAFTA on Agriculture and the Rural Economy / WRS-02-1 ✺ 1
vegetables in the form of a price-based tariff snapback
system. This system, which expires on January 1,
2008, guards against imports from either country
depressing domestic prices. Each country may use the
snapback provision to re-impose temporary tariffs
under certain conditions. So far, these safeguards have
rarely been used.
The North American Free
Trade Agreement
As part of NAFTA, most tariffs and non-tariff barriers
governing U.S.-Mexico agricultural trade are being
progressively dismantled. Numerous tariffs and other
restrictions were eliminated immediately upon
NAFTA's implementation. The remainder are to be
phased out during periods of 4, 9, or 14 years,
depending on the commodity and the importing
country (table B-1).
U.S. pear exports to Mexico provide an example of a 4year transition. Prior to NAFTA, Mexico levied a tariff
of 20 percent on U.S. pears. On January 1, 1994, the
day of NAFTA's implementation, Mexico immediately
cut the tariff to 15 percent. On January 1, 1995, Mexico
made a second reduction, dropping the tariff to 11.25
percent. The third and fourth reductions occurred on
January 1, 1996, and January 1, 1997, when Mexico
lowered the tariff to 7.5 percent and 3.75 percent,
respectively. Mexico made its fifth and final reduction
on January 1, 1998, eliminating the tariff in its entirety.
Because this process featured five annual reductions,
some analysts describe this transition as having
occurred over a 5-year period, even though it lasted
only 4 years, from January 1, 1994, to January 1, 1998.
Prior to NAFTA, about 25 percent of the value of U.S.
agricultural exports to Mexico were subject to
licensing requirements. These restrictions were immediately converted to either tariffs or TRQ's. Wheat,
tobacco, cheese, evaporated milk and grapes (shipped
during certain periods of the year) are examples of
products where licensing requirements were converted
to tariffs, which are being phased out over the 9-year
period that ends on January 1, 2003. Other products
subject to licensing - including corn, dry beans,
poultry, barley/malt, animal fats, potatoes, and eggs were converted to TRQ's. Similarly, the United States
converted its import quotas for dairy products,
peanuts, cotton, sugar, and sugar-containing products
to TRQ's. Under the TRQ arrangement, each country
is required to gradually expand each quota, while
phasing out the associated over-quota tariff during the
transition period.
Most products subject to these TRQ's are duty-free up
to the level of the quota. Exempt from this requirement
are those products to which the importing country
applies special safeguards. These provisions offer added
protection against import surges by allowing specified
quantities to be imported at preferential NAFTA rates.
Excess quantities are assessed tariffs equal to the lower
of either the existing tariff rate when NAFTA took
effect or the current most-favored-nation (MFN) rate.
The tariff assessed on in-quota volumes for special safeguard products is being phased out over a 9-year period.
The over-quota tariff will not be phased out until
January 1, 2003, when both the in-quota and over-quota
tariffs are to be eliminated. Mexico applies the special
safeguard to imports of live swine, pork, potato products, fresh apples, and coffee extract on a calendar-year
basis. The United States applies special safeguards on a
seasonal basis to selected horticultural crops. Similar
arrangements govern certain products traded between
Canada and Mexico.
According to NAFTA's rules of origin, products from
countries that are not parties to the agreement do not
qualify for NAFTA tariff reductions, even if the goods
are shipped through a NAFTA country. Moreover, each
NAFTA country is allowed to maintain its own tariff
schedule toward third parties. In fact, both Canada and
Mexico have established additional free-trade agreements with countries other than the United States since
the implementation of NAFTA.
Export subsidies between Canada and the United
States are strictly prohibited, as originally negotiated
under CFTA. Otherwise, NAFTA permits export subsidies if the importing country agrees to them or if the
importer receives subsidies from other countries. This
provision has enabled the United States to continue
using the Dairy Export Incentive Program (DEIP) to
promote dairy product exports to Mexico. In addition,
both Canada and the United States have used government credit guarantees, not considered an export
subsidy under NAFTA, to foster the sale of grains and
oilseeds to Mexico.
NAFTA requires that sanitary and phytosanitary (SPS)
measures be scientifically based, nondiscriminatory,
and transparent, and that these measures restrict trade
in a minimal fashion. The agreement also establishes
the NAFTA Committee on Sanitary and Phytosanitary
Measures to facilitate technical cooperation between
2 ✺ Effects of NAFTA on Agriculture and the Rural Economy / WRS-02-1
Economic Research Service, USDA
Table B-1—Chronology of CFTA and NAFTA
January 1, 1989
Implementation of CFTA
January 1, 1994
Implementation of NAFTA
Mexico eliminates tariffs for United States on sorghum, certain citrus fruit, and fresh strawberries,
as well as a seasonal tariff (December 1 to May 30) for oranges
United States eliminates tariffs for Mexico on corn, sorghum, barley, soymeal, apples, pears,
peaches, fresh strawberries, beef, pork, and poultry, as well as a seasonal tariff (June 1 to
November 30) for oranges
January 1, 1998
Canada and United States complete 9-year transition period associated with CFTA
Remaining Canada-U.S. tariffs are eliminated
Mexico and United States complete 4-year transition period under NAFTA
Mexico eliminates tariffs for United States on pears, plums, and apricots
United States eliminates tariffs for Mexico on non-durum wheat, soyoil, and cotton, as well as a
seasonal tariff (December 1 to May 30) on oranges
January 1, 2003
Mexico and United States to complete 9-year transition period under NAFTA
Mexico to eliminate tariffs for United States on wheat, barley, rice, dairy, soybean meal and soyoil,
poultry, peaches, apples, frozen strawberries, hogs, pork, cotton, and tobacco, as well as a seasonal
tariff (June 1 to November 30) on oranges
United States to eliminate tariffs for Mexico on durum wheat, rice, limes, winter vegetables, dairy
products, and frozen strawberries
October 1, 2007
Mexico and U.S. to eliminate tariffs on U.S.-Mexico sugar trade
January 1, 2008
Mexico and United States to complete 14-year transition period under NAFTA
Mexico to eliminate tariffs for United States on corn, dried beans, and milk powder
United States to eliminate tariffs for Mexico on frozen concentrated orange juice (FCOJ),
winter vegetables, and peanuts.
the NAFTA countries in the development, application,
and enforcement of such measures. Since the agreement's implementation, producers in each NAFTA
country have strived to meet higher quality standards
and to participate actively in the formulation of new
standards.
These efforts hold the promise of further increasing
agricultural trade within North America. Efforts to
inspect and approve produce at the regional level, and
in some instances at the level of individual producers,
have opened the door to new markets across international borders. Examples of this approach include:
✺ U.S. avocado imports from certain approved growers in the Mexican state of Michoacán;
Economic Research Service, USDA
✺ U.S. certification of the Mexican state of Sonora as
a low-risk region for hog cholera;
✺ Mexico's lifting of its ban on citrus from Arizona
and producing areas in Texas that are not regulated
for fruit fly; and
✺ continuing efforts to design and implement a satisfactory inspection process for U.S. apple exports to
Mexico.
NAFTA and Domestic
Agricultural Policies
Beyond the removal of tariffs and non-tariff barriers,
the objectives of CFTA and NAFTA are relatively
modest, certainly when compared to the European
model of economic integration. While members of the
The Effects of NAFTA on Agriculture and the Rural Economy / WRS-02-1 ✺ 3
European Community have adopted a common agricultural policy, the NAFTA members merely agreed to
liberalize the trade of most agricultural products, while
leaving domestic agricultural programs in each country
intact. It was left for each government to adjust its
policies in order to make them compatible with trade
liberalization.
Now in its eighth year, NAFTA has witnessed significant changes in the domestic agricultural policies of its
signatory countries. While these changes generally
were in response to factors other than NAFTA, most
notably domestic budget pressures and the URAA,
NAFTA certainly has had an effect as well. Through
the liberalization of North American trade, each
country has constrained the set of policy instruments
available to policymakers. In particular, both domestic
and trade policy instruments designed to raise
producer prices are now difficult to maintain, as
greater access to markets tends to unify prices within
the free-trade area.
Early Policy Changes Reduced
Government Intervention
United States. In April 1996, 28 months after
NAFTA's implementation, the United States adopted
the Federal Agriculture Improvement and Reform
(FAIR) Act of 1996, which fundamentally changed the
nature of farm support in this country. During the
debate leading to this act, there was some concern
about how U.S. acreage controls and government policies regarding stockpiles of commodities would
perform in the face of Canada's open access to the
U.S. market, particularly with respect to wheat.
The FAIR Act removed the link between income
support payments and farm prices by providing for
predetermined production flexibility contract
payments. These decoupled government payments,1
also referred to as AMTA payments,2 were meant to
provide income support to eligible producers of wheat,
feed grains, upland cotton, and rice over a 7-year
period (1996-2002). The FAIR Act also eliminated
Acreage Reduction Programs (ARP's) and allowed
producers to repay marketing loans at levels below the
1
Policies are generally perceived to be decoupled when transfer
payments are unrelated to the current or future price or quantity of
a commodity produced or marketed, and from the quantity of
inputs used in production.
2 AMTA refers to the Agricultural Market Transition Act, which is
title I of the FAIR Act.
original loan rate in order to reduce the likelihood that
commodities pledged as collateral would be forfeited
to the government.
In addition, the FAIR Act set expenditure levels for the
Export Enhancement Program (EEP), although it did
not eliminate the program. The EEP is a classic
example of a program that is incompatible with a freetrade area since import controls are necessary for the
program to be effective. Otherwise, products from
NAFTA partners would flow into the United States
seeking the higher domestic price induced by the
program. While the EEP has been used to subsidize
the export of several commodities, 80 percent of its aid
prior to 1995 was focused on wheat. Since mid-1995,
the United States had stopped using the EEP to subsidize wheat exports, partly because of the program's
incompatibility with a free-trade area. Just as important, the United States surrendered its GATT Section
22 waiver (which allowed for the imposition of quotas
if imports were deemed to interfere with domestic
support programs) under the terms of the URAA.
Without the threat of quantity restrictions provided by
Section 22, it would be difficult to limit wheat imports
from Canada.
Canada. Canada's domestic agricultural programs also
have undergone considerable reform during the CFTANAFTA period, although the free-trade area probably
has had less of an influence on these changes than in
the United States. The Two-Price Wheat Program is a
good example of how CFTA affected Canada's
domestic agricultural policies. Recognizing that this
program would be unsustainable if Canadian millers
and bakers could import U.S. wheat or flour duty-free,
the Canadian government abandoned the program
before the 1988/89 crop year and offered producers
limited compensation under the Two-Price Wheat
Compensation Act (Klein and Storey, 1998).
In 1995, producer subsidies for grains and oilseeds,
provided through freight subsidies under the Western
Grain Transportation Act (WGTA), were replaced by
two transitional programs, implemented over a 3-year
period to cushion the impact of eliminating the
WGTA. The next year, the Gross Revenue Insurance
Plan (GRIP), a voluntary revenue insurance plan introduced in 1991, was also terminated. GRIP guaranteed
a minimum target revenue for insured crops to
producers who chose to pay the premiums. This left
the Net Income Stabilization Account (NISA) as the
main income safety net for Canadian farmers.
4 ✺ Effects of NAFTA on Agriculture and the Rural Economy / WRS-02-1
Economic Research Service, USDA
Under NISA, which applies to grains, oilseeds, cattle,
hogs, and horticulture, producers can deposit money
annually into an interest bearing account and receive a
matching contribution from the government. Federal
contributions are fixed at 3 percent, while contributions from provincial governments vary by province.
Producer deposits earn a 3-percent interest bonus over
prevailing competitive rates. NISA is a voluntary
program designed to help producers stabilize their
farming income. In years of low income, producers are
permitted to make withdrawals from their individual
accounts. NISA is designed to protect revenue rather
than support prices. As a result of these changes, direct
payments for crops fell by more than 60 percent
between 1996 and 1997.
Mexico. In anticipation of NAFTA and in order to
reduce the fiscal burden associated with its domestic
agricultural programs, Mexico launched the Program
of Direct Support for the Countryside (Programa de
Apoyos Directos para el Campo—PROCAMPO) in
1994. PROCAMPO is a 15-year program of direct
payments that compensates producers for the loss of
input subsidies, price supports, and import protection.
It is designed to provide transitional income support to
farmers, while allowing Mexican agriculture to
undergo structural changes in response to market
conditions and the phasing-out of trade barriers under
NAFTA. Farmers who continue to produce receive
annual PROCAMPO payments based on historical
area planted in nine specified crops.
In 1996, Mexico announced the Alianza para el
Campo (Alliance for the Countryside), a major initiative to improve agricultural productivity that includes
PROCAMPO and other programs. The Alianza budget
covers payments per ton made by the Support Services
for Agricultural Marketing Agency (ASERCA) to firsthand buyers of wheat, corn, and sorghum in certain
Mexican states. The payments are conditional on the
buyers having paid producers an administered
minimum price. In addition, ASERCA pays rice
producers a deficiency payment for each ton marketed,
up to an overall limit. The other Alianza programs
mostly relate to infrastructure and extension-type
assistance. Among these, the most important is
PRODUCE Capitaliza, a program consisting of three
main elements: a “ferti-gation” program (using irrigation canals to deliver liquid fertilizer), a mechanization
program, and a program designed to improve pasture
quality for livestock producers.
Economic Research Service, USDA
Government Support Has Increased in
Recent Years
During the early years of the agreement, the domestic
agricultural policies of the NAFTA countries appeared
to be on a converging path, as each country significantly
reduced the level of government intervention in its agricultural sectors. Although each country continued to
maintain a comprehensive system of government
support for agriculture, there was clearly a move toward
greater market orientation. In particular, the distorting
effects of agricultural policies were substantially
reduced, as each NAFTA country moved away from
programs that relied on market price support payments
to ones which rely on decoupled income support
payments. Figure B-1 illustrates the extent to which the
level of government support to agriculture, as measured
by the Producer Support Estimate (PSE), declined in
each country between 1991-93 (the 3 years preceding
NAFTA) and 1997.3 In 1997, each country's overall
PSE was about 15 percent.
Since early 1998, farmers in each NAFTA country
have faced severely depressed prices, which has led
U.S. and Canadian policymakers to increase assistance
to farmers. In the United States, Congress enacted
emergency appropriations, consisting largely of
supplemental AMTA payments and disaster relief
payments, in October 1998, October 1999, and June
2000. As a result, total government direct payments
reached a record $25.9 billion in Fiscal Year (FY)
2000, after averaging just $6.4 billion per year during
the first 2 years of the FAIR Act (FY's 1996-97).4
While helping to maintain farm incomes, these
payments significantly increased the level of government expenditures on the agricultural sector, reversing
what had been a trend toward reduced government
support. By 1999, the U.S. PSE had increased to 25
percent, before declining to 22 percent in 2000. The
U.S. PSE is the only one among the three NAFTA
countries that was greater during 1998-2000 than it
was immediately prior to NAFTA.
3
The Producer Support Estimate (PSE) is an indicator of the value
of gross transfers to agricultural producers from government policies, as measured by the Organization for Economic Cooperation
and Development (OECD). The PSE comprises support from
consumers and taxpayers in the form of market price support and
budgetary payments to producers.
4 For the Federal government of the United States, fiscal years
begin on October 1 and end on September 30. Thus, FY 2000
began on October 1, 1999 and ended on September 30, 2000.
The Effects of NAFTA on Agriculture and the Rural Economy / WRS-02-1 ✺ 5
Figure B-1
Producer support estimates (PSEs) for the
NAFTA countries
Percent
35
30
United States
25
Canada
20
15
10
5
Mexico
0
1991-93
95
97
99
Note: Prior to 1997, the values correspond to each country's
producer subsidy equivalent, a slightly different measure used
to calculate government support of agriculture.
Source: Organization for Economic Co-operation and Development
(1997,1999, 2001).
In Canada, the federal government instituted the
Agricultural Income Disaster Assistance (AIDA)
Program in December 1998, pledging Can$900 million
(about US$600 million) over 2 years to help producers
caught in the farm crisis. This sum represented 60
percent of a total aid package of Can$1.5 billion
(US$1 billion). Under Canada's cost-sharing arrangement, provincial governments provide 40 percent of
total funding. In 2000, direct program payments to
Canadian producers increased to Can$2.8 billion
(US$1.9 billion), 42 percent above their 1999 level and
nearly double the previous 5-year average (Statistics
Canada, 2001). In addition to AIDA payments, this
total was made up of payments under several ongoing
programs (including NISA, fall cash advances, and the
Crop Insurance Act), as well as three one-time initiatives - the Alberta Farm Income Assistance Program
and the Canada-Manitoba and the CanadaSaskatchewan Adjustment Programs. As a result of
increases in both market price support and budgetary
payments, Canada's PSE rose to 19 percent in 2000.
In July 2000, a 3-year safety net agreement worth
Can$5.5 billion (US$3.7 billion) was signed. This
agreement replaces AIDA with the Canadian Farm
Income Program (CFIP), while continuing other
ongoing programs. The new agreement goes into effect
in 2001 and includes CFIP payments of Can$2.2
billion (US$1.5 billion) over 3 years. However, in
February 2001, Canada's federal government pledged
an additional Can$500 million to CFIP for 2001,
which would increase to Can$833 million (US$555
million) with provincial contributions. In addition,
producers will be eligible to apply under the Spring
Credit Advance Program for interest-free loans of up
to Can$50,000, compared to the previous limit of
Can$20,000 in 2000.
In 2000, Mexico's PSE increased to an estimated 18
percent, even though the budget for the Alianza
program was unchanged compared with 1999, at about
US$500 million. The increase in the PSE was due to
higher producer prices in Mexico and a slight appreciation of the peso. In general, Mexico has not followed
the U.S. and Canadian lead in increasing support to
agricultural producers during the ongoing farm crisis,
citing fiscal constraints.
Agricultural Trade Disputes
in the NAFTA Era
The architects of NAFTA correctly anticipated that the
agreement occasionally would be accompanied by
trade disputes among the signatory countries. Laying
the groundwork for the satisfactory resolution of these
differences, they incorporated provisions within the
agreement that established a new set of formal dispute
settlement mechanisms. In addition, the NAFTA
governments have made a sustained effort since the
agreement's implementation to address matters of
tension in a less adversarial, more cooperative fashion,
before they take the form of a formal dispute.
There are four main sources of trade disputes among
the NAFTA partners. First, on a few occasions, unintended ambiguities in the agreement's text have led to
disputes over how to interpret NAFTA. Second,
domestic policies that influence production, prices, or
trade have direct spillover effects into the agricultural
markets of the other NAFTA countries. With the deepening of trade and the increased integration of the
NAFTA economies, these spillover effects may have
increased, leading to further disputes. Third, a growing
number of disputes are related to sanitary and
phytosanitary issues, which are particularly complicated due to the existence of three different regulatory
frameworks managing diseases and pests within the
region. Fourth, the increased competitive pressures
associated with freer trade have led some industries to
seek protection through trade actions.
6 ✺ Effects of NAFTA on Agriculture and the Rural Economy / WRS-02-1
Economic Research Service, USDA
Dispute Resolution Mechanisms in
NAFTA
NAFTA created several formal mechanisms for the
resolution of trade disputes. The principal mechanisms
of this sort are specified in four chapters of the agreement:
✺ Chapter 11 - disputes related to investment;
✺ Chapter 14 - disputes related to services;
✺ Chapter 19 - disputes related to the application of
antidumping and countervailing duty laws; and
✺ Chapter 20 - disputes related to the general interpretation or application of the agreement.
So far, agricultural trade disputes have been addressed
solely under Chapters 19 and 20.
The arbitration panels associated with NAFTA's
dispute settlement mechanisms have several distinguishing characteristics (Gifford, 1997). First, the
agreement clearly spells out the right to establish a
panel and the conditions under which a panel may be
established. Second, experts may serve on panels in
their personal capacity and not necessarily as government representatives. Third, the panels are marked by
a quasi-judicial process of written submissions,
counter-submissions, oral hearings, and cross-examination. Moreover, this process takes place within the
context of a legal framework of rights and obligations.
Fourth, NAFTA specifies firm timelines concerning
the establishment and operation of the panel. Finally,
no party to a dispute is allowed to block the adoption
of a report.
National antidumping (AD) and countervailing-duty
(CVD) investigations and assessments of duties are
mechanisms that many countries - including the
NAFTA partners - use to address trade practices that
are found to violate specific rules. AD duties may be
imposed if imports are being sold below their
“normal” value (i.e., the price existing in the home
market of the exporting country) and if these imports
are causing or threaten to cause material injury to a
domestic industry. CVD duties may be imposed on
imports that are causing or threaten to cause material
injury to a domestic industry in order to offset subsidies provided to producers or exporters by the government of the exporting country.
Economic Research Service, USDA
Such mechanisms have been in existence for some
time in North America. Canada and the United States
had well-developed laws and institutions of this type
long before CFTA and NAFTA, although the creation
of comparable laws and institutions in Mexico is a
fairly recent development. NAFTA does not prevent
the application of AD or CVD measures, nor does it
provide for harmonized procedures or criteria for
determining whether dumping has occurred or when
and how countervailing duties should be set. However,
the NAFTA countries must follow the rules of the
World Trade Organization (WTO) regarding the application of these measures.
Agricultural producers in each NAFTA country have
been involved in disputes concerning CVD measures
and/or charges of dumping. Several of these cases have
made their way to the NAFTA Secretariat, which
administers the agreement's provisions for dispute
resolution. There are two active NAFTA panels in
agricultural cases under Chapter 19, and both cases
concern Final Antidumping Duty Determinations by
Mexico. One relates to U.S. exports of high-fructose
corn syrup (HFCS); the other relates to U.S. exports of
bovine carcasses. Previous NAFTA panels have issued
rulings in cases involving U.S. exports of refined sugar
to Canada, Canadian exports of live swine to the
United States, and Mexican exports of fresh cut
flowers to the United States.
Two completed agricultural cases under Chapter 20
have involved the United States. One concerned the
interpretation of Canadian TRQ's on poultry, dairy
products, barley, and margarine; the other dealt with
U.S. safeguard duties on broomcorn brooms from
Mexico. In addition, Mexico successfully brought a
case under Chapter 20 concerning U.S. delays in
implementing NAFTA's provisions for cross-border
trucking. On February 6, 2001, the arbitration panel
recommended that “the United States take appropriate
steps to bring its practices with respect to cross-border
trucking services and investment into compliance with
its obligations under the applicable provisions of
NAFTA” (NAFTA Secretariat, 2001). In response, the
U.S. Department of Transportation's Federal Motor
Carrier Safety Administration issued a proposed set of
rules for implementing these provisions in May 2001.
The commentary period for the proposed rules ended
on July 2, 2001.
Occasionally, dispute settlement under NAFTA intersects with dispute settlement under the WTO. For
The Effects of NAFTA on Agriculture and the Rural Economy / WRS-02-1 ✺ 7
example, the United States has requested a WTO panel
review of Mexico's HFCS duties, in addition to using
NAFTA mechanisms.
Dispute resolution under the formal NAFTA mechanisms and AD and CVD actions represent only a very
small part of the resolution process that has occurred
and is strengthening under NAFTA. Most disputes are
addressed in earlier stages through consultation and
negotiation in the other venues that exist for their resolution. By fostering greater communication among
parties engaged in trade, these mechanisms may also
help to prevent trade disputes from occurring. One
may identify three other trade dispute resolution mechanisms, in addition to the NAFTA arbitration panels
and AD and CVD actions: governmental negotiations,
private industry negotiations, and technical working
groups and assistance (table B-2).
Government negotiations offer a venue for resolving
disputes before they reach the litigation or investigation
stage. Ad hoc negotiations have addressed trade disputes
as they occur, as in the cases of U.S.-Canada grain trade
disputes and the U.S.-Mexico tomato dispute. Other
negotiations are conducted in standing committees, such
as the NAFTA SPS Committee. As the number of
disputes relating to SPS measures has grown significantly in recent years, the role of the SPS Committee
has been to facilitate technical cooperation between
NAFTA partners and to enable consultation on SPS
measures. One achievement of the working group has
been the implementation of “regionalization.” This term
refers to the process in which certain regions of countries are declared to be free of pests or disease, thus
permitting some trade to take place, even though disease
or pests are present in other parts of the country. This is
an example of trilateral regulatory management.
Government negotiations have also resolved disputes
through market management and policy management.
Market management may be necessary to assist the
adjustment of sensitive sectors to increased competition under free trade, by stipulating temporary market
conditions such as minimum prices. Government negotiations have also led to policy management in cases
where one country's domestic policy has a direct
impact on producers in other NAFTA countries. While
the scope of NAFTA does not extend to domestic
programs, subsequent government negotiations have
resolved cases in which domestic programs had signif-
Table B-2—Examples of Resolving Trade Disputes through NAFTA
Dispute resolution mechanism
Selected examples
National Countervailing duty (CVD)
or Antidumping (AD) actions
Mexico investigated or implemented duties on HFCS, hogs, apples, and wheat from the
United States and wheat from Canada.
United States investigated or implemented duties on tomatoes and broomcorn brooms
from Mexico, and potatoes, beef, and wheat from Canada.
Canada investigated and placed duties on apples, refined sugar, and potatoes from
United States.
NAFTA arbitration panels
Chapter 19 panels considered Mexican AD duties on U.S. HFCS exports, U.S. refined
sugar and product exports to Canada, Canadian swine exports to United States, and
Mexican fresh cut flower exports to United States.
Chapter 20 panels considered Canadian TRQs on poultry, dairy, barley, and margarine, and
U.S. safeguards on broomcorn brooms from Mexico.
Government negotiations
"Regionalization" has addressed hog cholera, poultry Newcastle disease, avocado fruit fly,
and karnal bunt in Mexico and the United States.
Market management by United States and Mexico established minimum price agreements
for U.S. apples and Mexican tomatoes, and negotiated outcomes for U.S.-Canada trade in
beef, pork, and wheat.
Policy management has modified Mexico's dry bean quota auction system, U.S-Canada
sweetener trade.
Industry negotiations
U.S. and Mexican grape industries resolved dispute over Mexican labeling regulations.
Mexican and U.S. cattle industry negotiations prevented Mexican AD. Advisory
Committee on Private Commercial Disputes Regarding Agricultural Goods is established.
Technical assistance
NAFTA Sanitary and Phytosanitary (SPS) Committee facilitates regional technical
cooperation. United States and Mexico established bilateral Plant Health Working Group
and Karnal Bunt Team. Two countries also are cooperating in development of Mexican
national grading and standards system for perishable commodities.
8 ✺ Effects of NAFTA on Agriculture and the Rural Economy / WRS-02-1
Economic Research Service, USDA
icant trade impacts, and helped smooth out differences
in incompatible policies and regulations.
Private industry has begun to play a larger role in
dispute resolution within the NAFTA region. In two
recent disputes involving grapes and cattle, producer
groups in Mexico and the United States worked
together to address the regulatory incompatibilities and
allegations of dumping that were at the root of the
disagreements. In an effort to minimize litigation by
strengthening private dispute resolution capacity, the
NAFTA governments helped establish the Advisory
Committee on Private Commercial Disputes Regarding
Agricultural Goods. This organization, which is voluntarily supported by growers and shippers in the fruit
and vegetable trade, allows its members to settle
private commercial disputes largely on their own and
in accordance with mutually recognized standards that
are built into the group's by-laws and contracts.
Incompatible national regulatory frameworks are
sometimes the result of inadequate national capacity to
set and enforce standards. Technical assistance
provides a mechanism for resolving or preventing
disputes by building scientific and institutional
capacity. The NAFTA SPS Committee has been one
avenue for facilitating regional technical cooperation.
Other programs have been established to address
scientific cooperation and assistance relating to
specific SPS concerns. Technical assistance and cooperation in developing agricultural statistics and
strengthening analytical capacity can also contribute to
the reduction of trade tensions by improving information and communication.
Proceedings of the Third Agricultural and Food
Policy Systems Information Workshop, University
of Manitoba, October 1997.
Klein, Kurt, and Gary Storey. “Structural
Developments in the Canadian Grains and Oilseeds
Sector.” In R.M.A. Loyns, Ronald D. Knutson and
Karl Meilke (eds.), Economic Harmonization in the
Canadian/U.S./Mexican Grain-Livestock Sector,
Texas A&M University and University of Guelph,
December 1998.
NAFTA Secretariat. “North American Free Trade
Agreement Arbitral Panel Established Pursuant to
Chapter 20 in the Matter of Cross Border Trucking
Services (Secretariat File No. USA-MEX-98-200801), Final Report of the Panel,” February 4, 2001,
<http://www.nafta-sec-alena.org/images/
pdf/ub98010e.pdf>.
Organization for Economic Co-operation and
Development (OECD). Agricultural Policies in
OECD Countries: Measurement of Support and
Background Information. Paris, 1997.
_____. Agricultural Policies in OECD Countries:
Monitoring and Evaluation. Paris, 1999.
_____. Agricultural Policies in OECD Countries: PSE
Tables and Supporting Material.
AGR/CA/APM(2001)2/PART3, February 20, 2001.
Statistics Canada. “Farm Cash Receipts.” The Daily,
February 22, 2001,
<http://www.statcan.ca/Daily/English/010222/
d010222c.htm>.
John Link, John Wainio (202-694-5286,
[email protected]), and Steven Zahniser
(202-694-5230, [email protected])
References
Gifford, Michael N. “Agricultural Policies, Trade
Agreements, and Dispute Settlement.” In R.M.A.
Loyns, Ronald D. Knutson, Karl Meilke, and Daniel
Sumner (eds.), Harmonization, Convergence and
Compatibility in Agriculture and Agri-Food Policy:
Canada, the United States, and Mexico,
Economic Research Service, USDA
The Effects of NAFTA on Agriculture and the Rural Economy / WRS-02-1 ✺ 9
NAFTA’s Impact on U.S. Agricultural Trade:
An Overview
Introduction
NAFTA’s influence on U.S. agricultural trade varies by
commodity and trade partner. In some instances,
NAFTA has had a tremendous impact on the export or
import of a particular commodity with either Canada
or Mexico. In most instances, however, NAFTA has
generated a more modest effect. Through the elimination of numerous trade barriers, Canada, Mexico, and
the United States are enabling producers, consumers,
and other economic agents throughout North America
to respond more efficiently to changing economic
conditions and to benefit more fully from their relative
strengths. Thus, U.S. agricultural trade with Canada
and Mexico has generally grown somewhat more
under NAFTA than it would have otherwise. These
expanded trade ties offer the NAFTA economies additional insulation from the adverse effects of weatherrelated emergencies, localized economic downturns,
and other factors.
Although the transition period for NAFTA’s ambitious
project of trade liberalization is only about one-half
complete, many trade barriers were eliminated immediately upon the agreement’s implementation, and
others are rapidly nearing the end of their phase-out
period. NAFTA’s longest transition period—14 years
(January 1, 1994, to January 1, 2008)—only applies to
a handful of commodities: U.S. imports of Mexican
frozen concentrated orange juice, certain winter
vegetables, sugar, and peanuts; and Mexican imports
of U.S. corn, sugar, dried beans, and milk powder.
Thus, NAFTA’s impact on U.S. agricultural trade to
date should provide a good indication of the agreement’s long-term impact.
Trends in U.S. NAFTA Trade
Since the implementation of NAFTA, U.S. agricultural
trade with its NAFTA partners has grown in size and
importance. Between 1993 and 2000, U.S. agricultural
exports to Canada and Mexico increased from $9.0
billion to a record $14.2 billion, while U.S. agricultural imports from these countries climbed from $7.4
billion to $13.7 billion.
At the same time, NAFTA is facilitating a reorientation
of U.S. agricultural trade in which U.S. exporters and
importers devote greater attention to the North American
market. In 2000, 28 percent of U.S. agricultural exports
was destined for either Canada or Mexico, compared
with 21 percent in 1993 and 17 percent in 1990.
Similarly, Canada and Mexico supplied 33 percent of
U.S. agricultural imports in 2000, compared with 29
percent in 1993 and just 25 percent in 1990.
A comparison of the growth rates for U.S. agricultural
trade with the NAFTA countries and the rest of the
world further underscores the increased importance of
the North American market. Between 1993 and 2000,
U.S. agricultural exports to Canada and Mexico grew
at a compound annual rate of 6.8 percent, in contrast
to 1.4 percent for U.S. agricultural exports to the rest
of the world. Similarly, U.S. agricultural imports from
Canada and Mexico increased at a compound annual
rate of 9.3 percent between 1993 and 2000, while agricultural imports from the rest of the world increased
only 5.2 percent.
Exports to NAFTA Partners
Canada is the second largest foreign customer of U.S.
agriculture (after Japan), accounting for 15 percent of
U.S. agricultural exports in 2000. Even though Canada
is a mature market for U.S. exporters, U.S. agricultural
exports to Canada have increased under CFTA and
NAFTA, from $4.2 billion in 1990 to $7.6 billion in
2000. This expansion corresponds to a compound
annual growth rate of 6.1 percent. Compared with
Mexico, Canada purchases a much broader array of
U.S. agricultural commodities. The top seven
products—feeds and fodders, beef, cattle, coffee,
soybean meal, chocolate, and lettuce—accounted for
only 24 percent of the total in 2000. It takes at least
another 40 commodities to reach the 50-percent mark.
Mexico is a rapidly growing market for U.S. agricultural exports. Since the implementation of NAFTA, U.S.
agricultural exports to Mexico have expanded from $3.6
billion in 1993 to $6.5 billion in 2000, corresponding to
a compound annual growth rate of 8.8 percent. Seven
commodities accounted for 50 percent of the value of
10 ✺ Effects of NAFTA on Agriculture and the Rural Economy / WRS-02-1
Economic Research Service, USDA
this trade in 2000: soybeans, beef, corn, cotton,
sorghum, feeds and fodders, and wheat.
U.S. agricultural exports to Mexico depend heavily on
the health of the Mexican economy. In late 1994, the
Mexican peso collapsed, and the difficult recession
that followed sharply reduced the purchasing power of
Mexican consumers and increased the short-term
competitiveness of Mexican exports. Consequently,
U.S. agricultural exports to Mexico plunged from $4.6
billion in 1994 to $3.5 billion in 1995, a decrease of
more than $1 billion, while Mexican agricultural
exports to the United States surged from $2.9 billion
to $3.8 billion. Fortunately, Mexico has experienced
sustained economic growth since 1996. As a result,
U.S. agricultural exports to Mexico increased 85
percent in value between 1995 and 2000.
U.S. agricultural suppliers hold dominant market
shares in both Canada and Mexico. The U.S. share of
Canada’s total agricultural imports reached 66 percent
in 2000, after hovering in the 61-to-63-percent range
during much of the 1990’s. The U.S. share of the
Mexican market has increased slightly under NAFTA,
from 73 percent during 1990-93 to about 75 percent
during 1994-99.
Imports from NAFTA Partners
Under CFTA and NAFTA, U.S. agricultural imports
from Canada have grown at an average annual rate of
10.6 percent. Between 1990 and 2000, this trade
climbed from $3.2 billion to $8.7 billion. Ten commodities—beef, cattle, pork, biscuits and wafers, potatoes,
cocoa, swine, and feeds and fodders, canola oil, and
wheat—accounted for 52 percent of the total in 2000.
Similarly, U.S. agricultural imports from Mexico have
increased at a compound annual rate of 9.3 percent
under NAFTA. Between 1993 and 2000, imports grew
from $2.7 billion to a record $5.1 billion. This trade is
highly seasonal, as the Mexican growing season
complements the U.S. growing season for a number of
commodities, especially in the category of fruits and
vegetables. In 2000, nine commodities—malt beverages, coffee, tomatoes, cattle, peppers, cucumbers,
grapes, cauliflower, and broccoli—accounted for 55
percent of the value of this trade.
Evaluating NAFTA’s Impact
Obviously, not all of the changes in U.S. agricultural
trade with Canada and Mexico that have occurred
Economic Research Service, USDA
since NAFTA’s implementation may be attributed to
the agreement. Adverse weather conditions, exchangerate movements, macroeconomic performance,
evolving consumer preferences, population growth,
and technological change are but a few of the factors
other than NAFTA that have affected U.S. agricultural
trade over the past 7 years.
The second part of this report contains a detailed,
commodity-level analysis of NAFTA’s impact on U.S.
agricultural trade. Table C-1 summarizes the main
findings of this analysis regarding the estimated
change in U.S. agricultural trade that may be attributed
directly to CFTA and NAFTA, isolating the effect of
these agreements from other factors. For commodities
that were subject to quotas or other quantitative
restrictions prior to the two agreements, the volume of
trade during 1994-2000 was compared with previously
allowed quantities. This assumes no over-quota
trading, except where it was determined that the quantitative restrictions in existence before CFTA and
NAFTA were not enforced. For commodities formerly
subject to tariffs, economic models and expert assessments were used to estimate the impact of tariff
changes.
Livestock and Animal Products
U.S. trade with Canada and Mexico in livestock and
animal products has continued to grow under NAFTA.
Since NAFTA’s implementation, U.S. exports to
Canada and Mexico in this category have averaged
$2.4 billion per year, in contrast to $2.1 billion in 1993
and $1.5 billion in 1990. U.S. imports of livestock and
animal products from the two countries averaged $3.0
billion per year during 1994-2000, up from $2.5
billion in 1993 and $2.0 billion in 1990.
Canada and Mexico’s combined share of U.S. imports
of livestock and animal products also has increased,
but their share of U.S. exports reveals no clear trend.
During 1994-2000, Canada and Mexico supplied 45
percent of U.S. imports in this category, compared
with 42 percent in 1993 and 35 percent in 1990. In
contrast, the two countries accounted for 24 percent of
U.S. exports of livestock and animal products during
1994-2000, 27 percent in 1993, and 22 percent in
1990.
CFTA and NAFTA have affected U.S. trade in livestock and animal products in a variety of ways. Upon
NAFTA’s implementation, Mexico immediately eliminated its tariff on non-breeding cattle from Canada and
The Effects of NAFTA on Agriculture and the Rural Economy / WRS-02-1 ✺ 11
Table C-1—Estimated change in the volume of U.S. agricultural trade with Canada and Mexico due solely
to CFTA and NAFTA, 1994-2000
U.S. exports to
Product
Canada
U.S. imports from
Mexico
Canada
Mexico
Grains and products:
Corn
Sorghum
Barley
Oats
Wheat
Wheat products
Rice
Increase -- low
Little to no trade
Negligible effect
Little to no trade
Negligible effect
Increase -- high
Increase -- low
Increase -- medium
Decrease -- high
Increase -- low
Little to no trade
Increase -- low
Negligible effect
Increase -- high
Increase -- medium
Little to no trade
Increase -- low
Negligible effect
Increase -- high
Increase -- high
Little to no trade
Negligible effect
Little to no trade
Little to no trade
Little to no trade
Increase -- low
Increase -- high
Little to no trade
Oilseeds and products:
Oilseeds
Meals and oilcakes
Vegetable oils
Negligible effect
Negligible effect
Increase -- low
Increase -- medium
Decrease -- low
Increase -- low
Negligible effect
Increase -- low
Increase -- low
Negligible effect
Negligible effect
Negligible effect
Animals and animal products:
Cattle and calves
Beef and veal
Hogs
Pork
Poultry meats
Dairy products
Negligible effect
Increase -- high
Little to no trade
Increase -- low
Increase -- low
Negligible effect
Increase -- high
Increase -- medium
Negligible effect
Increase -- low
Increase -- low
Increase -- high
Decrease -- high
Increase -- high
Negligible effect
Negligible effect
Increase -- low
Negligible effect
Increase -- low
Little to no trade
Little to no trade
Little to no trade
Little to no trade
Little to no trade
Other crops:
Peanuts
Dry beans
Cotton
Sugar
Negligible effect
Little to no trade
Increase -- high
Negligible effect
Negligible effect
Negligible effect
Increase -- high
Negligible effect
Negligible effect
Little to no trade
Little to no trade
Negligible effect
Increase -- high
Little to no trade
Negligible effect
Increase -- high
Fruits and vegetables:
Fresh tomatoes
Processed tomatoes
Bell peppers
Cucumbers
Squash
Eggplant
Snap beans
Fresh potatoes
Processed potatoes
Frozen broccoli and cauliflower
Fresh citrus
Orange juice
Apples
Pears
Peaches
Grapes
Cantaloupe
Watermelon
Negligible effect
Increase -- medium
Increase -- low
Negligible effect
Increase -- low
Increase -- low
Increase -- low
Increase -- low
Increase -- low
Little to no trade
Negligible effect
Increase -- low
Negligible effect
Negligible effect
Negligible effect
Negligible effect
Negligible effect
Negligible effect
Increase -- low
Increase -- low
Negligible effect
Little to no trade
Little to no trade
Little to no trade
Little to no trade
Increase -- low
Increase -- high
Little to no trade
Little to no trade
Little to no trade
Increase -- high
Increase -- high
Little to no trade
Increase -- low
Little to no trade
Little to no trade
Increase -- low
Increase -- low
Increase -- low
Increase -- low
Negligible effect
Little to no trade
Increase -- low
Increase -- medium
Increase -- medium
Increase -- low
Little to no trade
Little to no trade
Negligible effect
Little to no trade
Little to no trade
Little to no trade
Little to no trade
Little to no trade
Increase -- medium
Increase -- medium
Increase -- low
Increase -- low
Negligible effect
Increase -- low
Increase -- low
Little to no trade
Little to no trade
Increase -- low
Increase -- low
Increase -- low
Little to no trade
Little to no trade
Little to no trade
Negligible effect
Increase -- medium
Increase -- low
Estimates reflect changes in trade volume during 1994-2000 due solely to CFTA and NAFTA and are based on assessments of ERS analysts:
High = A change of more than 15 percent, compared to what would have occurred without CFTA and NAFTA
Medium = A change of 6 to 15 percent
Low = A change of 2 to 5 percent
Negligible effect = Less than 2 percent.
Source: Economic Research Service, USDA.
12 ✺ Effects of NAFTA on Agriculture and the Rural Economy / WRS-02-1
Economic Research Service, USDA
the United States, a tariff that it had imposed for all
countries in late 1992. This tariff elimination is estimated to have increased the number of U.S. cattle
exported to Mexico in 1994 by some 18-33 percent.
Since then, exports have fluctuated in response to
short-term economic conditions in both countries,
ranging from a low of $14 million in 1995 to a high of
$131 million in 1997.
With respect to U.S.-Canada cattle trade, the exemption
of Canadian beef from the U.S. Meat Import Law has
had a greater impact than CFTA and NAFTA tariff
changes. In addition, the Restricted Feed Cattle
Program (originally called the North-West Pilot
Program) enables U.S. feeder cattle to be shipped to
selected Canadian feedlots without going through the
usual quarantine procedures. This program has helped
to increase U.S. cattle exports to Canada from roughly
40,000 head in 1996 and 1997 to about 350,000 head in
2000. About 180,000 cattle participated in the program
in 2000, and some 203,000 are taking part in 2001.
The elimination of Mexican tariffs on U.S. beef,
coupled with sustained economic growth in Mexico,
has given a sizable boost to U.S. beef exports to
Mexico. During 1994-2000, this trade averaged $309
million per year, in contrast to $135 million during
1989-93. Although small in total value, Mexican beef
exports to the United States have trebled under
NAFTA—expanding from an annual average of
$2 million during 1989-93 to $12 million during
1994-2000.
CFTA and NAFTA have had an especially powerful
effect on U.S.-Canada beef trade. Perhaps the greatest
impact is due to the removal of import quotas from
this trade. In addition, the agreements provide the two
countries with much greater access to each other’s
beef market, in comparison to both pre-CFTA levels
and the general levels afforded by the Uruguay Round
Agreement on Agriculture (URAA).
In an environment of freer trade, U.S. beef imports from
Canada have grown steadily, from $191 million in 1990
to $981 million in 2000. In contrast, U.S. beef exports
to Canada have trended downward over the last 7 years,
from $365 million in 1994 to $299 million in 2000.
This shifting trade balance is partially due to increased
U.S. investment in Canadian meat processing. For
instance, U.S. firms own the two largest slaughter plants
in Canada. Still, U.S. beef exports to Canada are
perhaps twice as high as they would have been other-
Economic Research Service, USDA
wise, due to the greater market access secured by CFTA
and incorporated within NAFTA.
CFTA and NAFTA have had little effect on North
American hog trade, since the health restrictions and
duties that influence this trade are not directly related
to either agreement. Due to animal health concerns,
U.S. hog imports from Mexico are non-existent, and
Canadian hog imports from the United States are small
in number. Following Mexico’s imposition of
antidumping duties in early 1999, U.S. hog exports to
Mexico dropped from about 208,000 head in 1998 to
52,000 head in 2000. Although U.S. hog imports from
Canada quadrupled between 1989 and 2000—climbing
from 1.1 million to 4.4 million head—this development is not due to CFTA and NAFTA since this trade
already was duty-free at the time of CFTA’s implementation.
Tariff elimination in U.S.-Canada pork trade has
provided a small boost to U.S. pork exports to Canada.
Exports averaged $82 million per year during 19942000, up from $32 million in 1993 and $26 million in
1990. In contrast, U.S. pork imports from Canada
demonstrated no clear trend during the 1990’s. Imports
averaged $485 million per year during 1994-2000,
above the 1993 level of $307 million but somewhat
below (in real terms) the 1990 level of $428 million.
As part of NAFTA, Mexico is phasing out its tariffs on
U.S. and Canadian pork. This has provided a small
stimulus to U.S. pork exports to Mexico. During 19942000, this trade averaged $93 million per year, in
contrast to $59 million during 1989-93. However, the
far more significant drivers of this export growth have
been the rapid recovery of the Mexican economy
following its recession in 1995 and continuing
economic growth since then.
NAFTA’s impact on U.S. poultry exports to Canada
and Mexico is difficult to assess. Canada maintains a
“permanent” tariff-rate quota (TRQ) for poultry that
will not be eliminated under NAFTA, but it has consistently allowed imports above that amount. In fact,
prior to CFTA, the Canadian government would often
offer supplemental permits for chicken imports in
excess of existing quotas. Similarly, Mexico has not
enforced the quantitative limits of its TRQ on U.S.
poultry, so it is possible that the Mexican government
would have waived its licensing requirement for U.S.
poultry had NAFTA not been implemented.
The Effects of NAFTA on Agriculture and the Rural Economy / WRS-02-1 ✺ 13
Currently, U.S. imports of Mexican poultry products
are virtually non-existent due to U.S. health restrictions. However, Mexico and the United States are
working together to specify conditions under which
Mexico can safely export such products to the United
States. For instance, processors in the Mexican states
of Sinaloa and Sonora are now allowed to import live
birds from the United States for slaughter and
processing and then ship the processed parts back to
the United States, subject to USDA approval of the
Mexican facilities.
NAFTA has not had much effect on U.S.-Canada dairy
trade, as CFTA did not substantially address the quantitative restrictions that govern this trade. NAFTA has
expanded U.S. access to the Mexican dairy market, but
other factors have worked to limit U.S. dairy exports
to Mexico. International prices for dairy products have
declined, and the United States reduced its subsidies
for dairy exports as part of the URAA. As a result,
U.S. dairy exports to Mexico averaged $162 million
per year during 1994-2000, roughly the same as the
1989-93 average.
Grains and Feed
For most grains and grain products, the impact of
NAFTA on U.S.-Canada and U.S.-Mexico trade is
small in comparison to the influence of other factors.
Generally, NAFTA has amplified expansions in trade
that would have occurred without the agreement. In
addition, NAFTA has tempered reductions in trade,
such as those that resulted from Mexico’s severe recession in 1995.
Under NAFTA, the Canadian and Mexican markets
have grown in importance to U.S. grain and feed
traders. During 1994-2000, NAFTA’s share of U.S.
grain and feed exports averaged 17 percent, compared
with 13 percent in 1993 and 11 percent in 1990.
NAFTA’s share of U.S. imports in this category averaged 61 percent during 1994-2000—a dramatic
increase from the levels of 57 percent in 1993 and 48
percent in 1990.
Two-way trade in grains and feed has long been a
feature of U.S.-Canada economic relations. Each
country is a major supplier of these commodities to
the world, and each counts the other as one of its most
important export markets. This somewhat unusual situation has led to frictions between the two countries.
Still, this two-way trade has continued to grow under
NAFTA. U.S. grain and feed exports to Canada aver-
aged $1.2 billion during 1994-2000, up from $960
million in 1993 and $576 million in 1990. U.S.
imports of Canadian grain and feed averaged $1.5
billion during 1994-2000, in contrast to $948 million
in 1993 and $538 million in 1990.
CFTA and NAFTA have facilitated a geographic reorientation of the Canadian grain sector. Prior to CFTA,
Canadian grain flows tended to move in an East-West
direction that was artificially imposed by trade barriers
and transportation subsidies. Now, these flows are
more likely than in the past to move from north to
south.
U.S. exports constitute the vast majority of U.S.Mexico grain and feed trade. These exports averaged
$1.5 billion per year during 1994-2000, in contrast to
$924 million during 1989-93. The United States is a
key supplier of cereals to Mexico, accounting for 89
percent of Mexican imports during 1994-99. Canada
supplied 9 percent. U.S. imports of Mexican grains
and feed averaged $137 million during 1994-2000,
more than 3 times the 1989-93 average of $42 million.
In 2000, U.S. grain and feed exports to Canada and
Mexico equaled $3.1 billion. In terms of value, the
most important commodities in this trade were corn
($637 million), sorghum ($442 million), and wheat
($197 million). The major subcategory of feeds and
fodder (excluding oilcakes) accounted for $639
million. Grain and feed imports from Canada and
Mexico totaled $1.9 billion. The commodities with the
largest share of these imports were wheat ($228
million), oats ($117 million), and barley ($75 million).
Biscuits and wafers accounted for $509 million.
The NAFTA countries are implementing many significant changes in their trade policies for grains and feed.
With respect to corn, NAFTA’s most prominent change
is Mexico’s replacement of import licensing with a
TRQ, which itself will be eliminated in 2008. In addition, Mexico has consistently permitted imports of
U.S. corn to surpass the quantitative level specified by
the TRQ without applying the high over-quota tariff
allowed by NAFTA. Beginning on June 7, 2001,
Mexico levied minor over-quota tariffs of 1 percent on
yellow corn and 3 percent on white corn, following a
long period in which no over-quota tariff was applied.
These minor tariffs will remain in effect until the end
of 2001.
These policies have facilitated U.S. corn exports to
Mexico. During 1994-2000, this trade averaged $521
14 ✺ Effects of NAFTA on Agriculture and the Rural Economy / WRS-02-1
Economic Research Service, USDA
million per year, compared with $400 million in 1990
and just $35 million in 1993, a year in which this trade
was unusually low. Reforms in Mexico’s domestic
agricultural policies and a series of severe droughts
have provided additional stimulus to U.S. corn exports.
CFTA and NAFTA have had a small effect on U.S.Canada corn trade, which just entered its fourth year of
being completely free from tariff restrictions. U.S. corn
exports to Canada averaged $112 million per year
during 1994-2000, in contrast to $80 million in 1993
and $72 million in 1990. Corresponding imports from
Canada averaged $30 million during 1994-2000, which
also was the value of this trade in 1992 and 1993.
Upon NAFTA’s implementation, Mexico immediately
eliminated its seasonal tariff on U.S. sorghum.
However, U.S. sorghum exports to Mexico also have
been affected by the greater access provided by
Mexico to U.S. corn. In response to these changes and
significant modifications of Mexico’s domestic agricultural policies, many livestock producers in Mexico
have switched from sorghum to corn feed. Thus, the
combined effect of the tariff reductions for corn and
sorghum has been to discourage Mexican sorghum
imports from the United States. In recent years,
declining sorghum prices have boosted U.S. sorghum
exports to Mexico, from $250 million in 1997 to $441
million in 2000.
CFTA and NAFTA gradually eliminated the tariffs on
U.S.-Canada wheat trade, providing a substantial boost
to U.S. imports of Canadian wheat. During 1994-2000,
these imports averaged $268 million per year, up from
$210 million in 1993 and $80 million in 1990. U.S.
wheat product exports to Canada also have benefited
from tariff elimination. This trade averaged $48
million per year during 1994-2000, compared with $27
million in 1993 and $12 million in 1990.
Despite Canada’s elimination of its tariff on U.S.
wheat, Canadian imports of this product in the form of
grain remain inconsequential. The low level of this
trade reflects both Canada’s historic strength in wheat
production and the long-term impact of continuing
restrictions on wheat imports as a result of various
regulatory actions. In 1998, Canada and the United
States negotiated an agreement on wheat trade regulations that should improve U.S. access to the Canadian
market. However, the two countries continue to spar
over the activities of the Canadian Wheat Board, and
the Office of the U.S. Trade Representative recently
initiated a Section 301 investigation of this subject.
Economic Research Service, USDA
As part of NAFTA, Mexico eliminated its importlicensing requirement and is now phasing out its tariffs
on U.S. and Canadian wheat. These actions have
provided a small stimulus to U.S. wheat exports to
Mexico. This trade averaged $195 million per year
during 1994-2000, compared with $70 million during
1989-93. In response to market incentives, Mexican
farmers have devoted less land to wheat than in
previous years. Thus, NAFTA may be indirectly
fostering U.S. wheat exports to Mexico by encouraging Mexican farmers to produce other crops.
Mexico’s phytosanitary requirements effectively ban
rice imports from Asia, allowing the United States to
serve as the predominant foreign supplier of rice to the
Mexican market. In 2000, U.S. rice exports to Mexico
equaled $102 million, compared with $56 million in
1993. Should Asian rice exporters satisfactorily
address Mexico’s phytosanitary requirements, the tariff
advantage enjoyed by the United States under NAFTA
would become extremely important. However, rough
rice accounts for the bulk of Mexico’s rice imports,
and no major Asian rice exporter currently allows this
product to be exported.
Oilseeds and Oilseed Products
NAFTA’s impact on U.S.-Canada trade in oilseeds and
related products is substantially different from its
impact on U.S.-Mexico trade. With respect to U.S.Canada trade, CFTA and NAFTA have made a small
contribution to increased two-way trade in processed
goods, particularly vegetable oil. With respect to U.S.Mexico trade, NAFTA has led to increased U.S.
soybean exports, as Mexican vegetable oil demand is
primarily satisfied by domestically produced oil
crushed from imported oilseeds.
As is the case with agricultural trade as a whole,
NAFTA is facilitating a process in which Canada and
Mexico account for a greater share of U.S. trade in
oilseeds and oilseed products. During 1994-2000,
these two countries purchased 16 percent of U.S.
oilseed and oilseed product exports, in contrast to 14
percent in 1993 and 11 percent in 1990. Similarly,
Canada and Mexico supplied an average of 38 percent
of U.S. oilseed and oilseed product imports during
1994-2000, up from 37 percent in 1993 and 30 percent
in 1990. Mexico accounted for 69 percent of U.S.
oilseed and oilseed product exports to NAFTA countries during 1994-2000.
The Effects of NAFTA on Agriculture and the Rural Economy / WRS-02-1 ✺ 15
In 2000, U.S. oilseed and oilseed product exports to
Canada and Mexico equaled $1.6 billion. The most
important commodities in this trade were soybeans
($750 million), soybean meal ($189 million), and
sunflower oil ($87 million). The United States supplies
about three-fourths of Canada’s total oilseed imports
(in value terms) and is the predominant exporter of
soybeans to Mexico. During 1994-99, the United
States supplied 96 percent of Mexican soybean
imports in terms of volume, while Argentina and
Brazil supplied 2 percent and 1 percent, respectively.
U.S. oilseed and oilseed product imports from Canada
and Mexico totaled $636 billion in 2000, with canola
oil and rapeseed accounting for $228 million and $52
million, respectively.
CFTA and NAFTA have not greatly affected U.S.Canada oilseed trade, which was relatively free of restrictions at the time of CFTA’s implementation. However, tariff reductions under the two agreements have
boosted vegetable oil trade between the two countries.
During 1994-2000, U.S. vegetable oil exports to
Canada averaged $185 million per year, in contrast to
$100 million in 1993 and $57 million in 1990. U.S.
imports of Canadian vegetable oil (including waxes)
averaged $322 million during 1994-2000, up from
$213 million in 1993 and $89 million in 1990.
By reducing barriers to U.S. feed grains, NAFTA has
facilitated a noteworthy expansion in the Mexican feed
industry. This development has created a much larger
demand within Mexico for protein meal and the
imported soybeans needed to product this product.
Thus, NAFTA has provided an important indirect
impetus to U.S. soybean exports to Mexico. This trade
averaged $674 million per year during 1994-2000,
compared with $334 million per year during 1989-93.
As part of NAFTA, the United States established a tariffrate quota (TRQ) for raw peanuts from Mexico, enabling
Mexico to export substantial quantities of that product to
the United States for the first time. Between 1994 and
2000, this trade increased from $1 million to $4 million,
although it often fluctuates from one year to the next.
Other Field Crops
NAFTA has had an important impact on U.S. trade of
other field crops. Two noteworthy examples—cotton
and sugar—are discussed here.
NAFTA affects U.S. cotton trade via two routes. First,
NAFTA is paving the way for duty-free cotton trade
within North America. Canada did not levy a tariff on
imported cotton prior to CFTA, and the United States
and Mexico have completed the first 7 years of their 9year transition to duty-free trade in cotton. Second,
NAFTA’s rules of origin provide for virtually unlimited access to the U.S. market for textiles and apparel
manufactured by a NAFTA member from yarn and
fiber produced by a NAFTA member. Ultimately,
NAFTA will assure free trade within North America
not only for cotton but also for many products made
from cotton.
These changes have combined with more powerful
developments, including the peso devaluation and
various difficulties facing Asian textile exporters, to
boost U.S. cotton exports to Canada and Mexico.
During 1994-2000, these exports (including linters)
averaged $432 million, in contrast to $250 million in
1993 and $112 million in 1990. In 2000, these exports
reached $578 million.
Mexico and the United States are moving toward freer
trade in sugar through the application of a complicated
formula, based on the difference between projected
production and projected domestic consumption, that
is used to calculate the duty-free quotas for this trade.
This process is occurring over a lengthy transition
period (1994-2007). So far, U.S. imports of Mexican
cane and beet sugar have grown from $64,000 in 1993
to $29 million in 2000. This development, coupled
with low world prices for sugar, places additional
stress on the U.S. sugar program.
Regarding U.S.-Canada sugar trade, the United States
initially interpreted CFTA as meaning that any U.S.
imports of Canadian sugar in excess of the U.S. TRQ
should be subject to the low CFTA tariff rather than
the prohibitive second-tier tariff associated with the
TRQ. This action greatly stimulated these imports
during 1990-94. But in 1995, the United States began
to apply the most-favored-nation (MFN) tariff to overquota imports, in accordance with the URAA.
Vegetables
North American vegetable trade has continued to
flourish under NAFTA. U.S. vegetable exports to
Canada and Mexico (including dried beans, dried peas,
and dried lentils) averaged $1.7 billion per year during
1994-2000, in contrast to $1.3 billion in 1993 and $1.0
billion in 1990. U.S. vegetable imports from its
NAFTA partners also have grown, from $1.2 billion in
1990 and $1.4 billion in 1993 to an average of $2.2
16 ✺ Effects of NAFTA on Agriculture and the Rural Economy / WRS-02-1
Economic Research Service, USDA
billion since 1994. In 2000, this trade encompassed
$2.0 billion in U.S. exports and $3.0 billion in U.S.
imports.
Over the last decade, the United States has solidified
its position as Canada’s main foreign supplier of vegetables. The United States accounted for 81 percent of
Canada’s vegetable imports during 1994-2000, compared with just 70 percent during 1984-88. Mexico
supplied 8 percent of Canadian vegetable imports
during 1994-2000. The United States also accounted
for 85 percent of Mexico’s vegetable imports during
1994-2000, while Canada supplied 11 percent.
Mexico has long been a major supplier of vegetables
to the U.S. market, accounting for 40 percent of the
total value of U.S. vegetable imports during 19942000. However, Canada’s share of the U.S. market has
risen in recent years, from 10 percent in 1990 to 25
percent in 2000. Overall, Canada and Mexico’s share
of U.S. vegetable imports has increased under NAFTA,
from 53 percent in 1990 and 55 percent in 1993 to an
average of 59 percent during 1994-2000.
the absence of these changes. CFTA and NAFTA also
have contributed to increased U.S. tomato sauce
exports to Canada. This trade expanded from $4
million in 1990 and $43 million in 1993 to an annual
average of $53 million during 1994-2000.
In a major development, U.S. (and Mexican) tomatoes
now face increased competition from Canada, due to a
rapidly growing greenhouse industry in that country.
U.S. tomato imports from Canada have ballooned from
$3 million in 1990 to $161 million in 2000. Tariff
reductions are a small contributing factor to the emergence of this trade, which is driven in large part by
increasing U.S. demand for high-quality, higher-priced
tomatoes and the strong U.S. dollar.
NAFTA has provided a moderate boost to U.S. imports
of processed tomatoes from Mexico. Over the past
several years, this trade has branched out from primarily tomato paste into tomato juice and sauce. Tomato
juice imports were non-existent until 1996 but equaled
$7 million in 2000. Similarly, tomato sauce imports
were minor until 2000, when they reached $4 million.
U.S. vegetable imports from its NAFTA partners
totaled $3.0 billion in 2000. Some of the most important components of this trade in terms of value were
tomatoes ($573 million), potatoes ($434 million), and
peppers ($386 million). Corresponding exports to
Canada and Mexico equaled $2.0 billion.
Commodities with a large share of this trade included
lettuce ($168 million), tomatoes ($143 million), and
potatoes ($77 million).
Through Mexico’s establishment of TRQ’s for
processed potato products from the United States,
NAFTA has had a large, positive impact on U.S.
processed potato exports to Mexico, particularly for
frozen french fries. As the TRQ’s for this product
expands during the transition to free trade, U.S.
exports of frozen french fries to Mexico have
increased substantially, from $6 million in 1993 to $22
million in 2000.
CFTA and NAFTA have had an important impact on
two of the largest components of U.S. vegetable trade
with Canada and Mexico: tomatoes and potatoes. U.S.
tomato imports from Mexico expanded from an annual
average of $256 million during 1989-93 to $470
million during 1994-2000. Although NAFTA tariff
reductions have provided a moderate boost to this
trade, NAFTA’s influence has been tempered by a
series of price floors implemented by principal
Mexican and U.S. growers under a suspension agreement to settle an antidumping investigation.
U.S. imports of Canadian potatoes (fresh and frozen)
averaged $274 million during 1994-2000, in contrast
to $104 million in 1990 and $129 million in 1993.
Although the elimination of U.S. tariffs on Canadian
potatoes has provided a moderate boost to this trade,
other factors have played an important role, including
the expansion in Canadian potato production and
processing and the relative strength of the U.S. dollar.
U.S. tomato exports to Canada have fluctuated under
CFTA and NAFTA. During 1994-2000, this trade averaged $105 million, up from $80 million in 1990 but
down from $111 million in 1993. ERS analysts estimate that the tariff changes initiated by CFTA have
increased the volume of this trade by some 14-18
percent, compared with what would have occurred in
Economic Research Service, USDA
Fruits and Fruit Juices
Overall, U.S. fruit trade with Canada and Mexico has
grown substantially since the implementation of
NAFTA. U.S. imports of fruits and prepared fruits
(including juice) from Canada and Mexico have grown
from $410 million in 1990 and $422 million in 1993
to an average of $792 million per year during 19942000. Corresponding exports have averaged $1.3
The Effects of NAFTA on Agriculture and the Rural Economy / WRS-02-1 ✺ 17
billion under NAFTA, in contrast to $888 million in
1990 and $1.0 billion in 1993.
U.S.-Canada trade in fruits and prepared fruits is well
established. Excluding juices, U.S. exports of such
products did not demonstrate a clear trend over the
past decade, fluctuating between $686 million in 1994
and $794 million in 2000. In contrast, U.S. juice
exports to Canada increased gradually over this period.
During 1994-2000, this trade averaged $222 million
per year, in contrast to $162 million in 1993 and $138
million in 1990. In value terms, orange juice accounts
for 55 percent of these exports. U.S. orange juice
exports to Canada averaged $121 million during 19942000, compared with $83 million in both 1990 and
1993. Through the elimination of Canada’s tariff on
retail-ready orange juice and technological changes in
the packaging and marketing of orange juice, the
composition of this trade has shifted from frozen
concentrate to single-strength juice.
U.S. imports of Canadian fruits and prepared fruits
grew steadily during the 1990’s. During 1994-2000,
these imports (excluding juices) averaged $116
million, up substantially from $62 million in 1990.
Berries other than strawberries constitute more than
half of this trade. U.S. imports of Canadian fruit juice
are relatively small, averaging $18 million during
1994-2000.
to the end of Mexican licensing requirements, U.S.
grape exports to Mexico have averaged $22 million
per year under NAFTA, in contrast to $3 million
during 1989-93. The elimination of Mexican tariffs on
U.S. pears has strengthened U.S. pear exports to
Mexico. This trade averaged $26 million per year
during 1994-2000, compared with $14 million during
1989-93. Continuing economic growth in Mexico
should provide an additional impetus to this trade,
which reached $42 million in 2000.
U.S.-Mexico apple trade has faced many challenges
since NAFTA’s implementation, including Mexico’s
economic crisis of late 1994 and 1995, the levying of
antidumping duties by Mexico, and difficulties in
securing an inspection process that facilitated trade
while addressing phytosanitary concerns. As a result,
U.S. apple exports to Mexico have fluctuated substantially, from $40 million in 1995 to $102 million in
2000. Still, NAFTA tariff reductions and the elimination of Mexico’s licensing requirement have provided
a substantial boost to U.S. apple exports to Mexico.
This trade averaged $61 million per year during 19942000, compared with $23 million during 1990-93.
Trade data clearly show the deleterious consequences
of the peso devaluation and subsequent recession on
U.S. exports of fruits and prepared fruits to Mexico.
Between 1994 and 1995, total exports in this category
(including juice) plummeted from $197 million to $91
million. During 1994-2000, this trade averaged $163
million per year, in contrast to $70 million during
1989-93. With the continued expansion of the Mexican
economy, this trade reached $277 million in 2000,
signaling the probable long-term opportunities in
Mexico for U.S. fruit exporters.
U.S. imports of Mexican fruits and prepared fruits
have averaged $586 million per year under NAFTA,
up from $287 million during 1989-93. This growth
reflects expanding consumer demand associated with
the strong U.S. economy, changing consumer preferences in the United States, and, to a lesser extent,
changes in trade restrictions under NAFTA. For
example, the gradual elimination of the seasonal U.S.
tariffs on Mexican cantaloupe has facilitated U.S.
cantaloupe imports from Mexico. This trade averaged
$47 million per year during 1994-2000, compared with
$42 million during 1989-93. Holding all other factors
constant, NAFTA and URAA tariff changes were
expected to increase this trade by some 17-25 percent
above what would have occurred in the absence of
these agreements.
NAFTA has had a substantial impact on several
aspects of U.S. fruit trade with Mexico. Thanks in part
Steven Zahniser (202-694-5230,
[email protected]) and John Link
18 ✺ Effects of NAFTA on Agriculture and the Rural Economy / WRS-02-1
Economic Research Service, USDA
Economic Research Service, USDA
Table C-2—U.S. agricultural trade with NAFTA (Mexico and Canada), 1992-2000
Value
Commodity
1993
1994
1995
43,159
42,915
46,251
56,347
8,746
2,164
1,873
785
166
170
1,227
1,006
1,356
8,937
2,126
1,770
839
170
171
1,321
1,028
1,511
10,163
2,401
2,188
871
184
169
1,515
1,184
1,652
9,345
1,868
2,094
794
210
179
1,372
1,193
1,635
n.a.
n.a.
n.a.
n.a.
n.a.
n.a.
24,799
25,137
27,031
30,263
6,522
103
290
2,228
1,245
828
391
37
1,072
139
244
373
361
0
59
16
90
430
7,384
94
281
2,467
1,341
1,008
380
42
1,379
310
253
387
440
0
65
19
103
468
8,194
59
385
2,326
1,151
1,372
438
66
1,491
326
310
460
663
0
78
21
110
418
9,467
47
660
2,739
1,409
1,403
570
94
1,746
423
304
494
641
2
79
31
131
526
n.a.
n.a.
n.a.
6,539
13,923
151,133
18,361
2,223
n.a.
n.a.
n.a.
17,779
1,553
n.a.
n.a.
n.a.
1996
Share of world
1997
1998
1999
2000
1993
1994
60,417
57,217
51,815
48,278
11,583
2,165
3,198
809
227
198
1,486
1,562
1,937
11,963
2,718
2,360
881
229
204
1,701
1,770
2,100
13,169
2,891
2,909
880
256
206
1,918
1,626
2,483
12,700
2,833
2,829
935
267
223
1,871
1,563
2,180
1,635
379
1,538
11,798
9,724 13,121
165,282 173,518 189,345
1,878
13,841
221,502
1,908
15,077
233,162
33,520
36,160
36,908
37,737
10,556
44
640
2,800
1,121
1,669
616
88
2,066
618
354
607
814
16
94
30
155
562
11,561
63
742
3,053
1,119
1,862
639
90
2,201
576
389
715
800
0
117
39
185
666
12,482
57
649
3,132
1,144
1,707
808
107
2,727
668
451
865
872
0
113
41
227
728
12,881
40
576
3,294
1,000
1,815
993
96
2,715
609
494
1,019
707
5
109
43
248
727
7,771
7,400
9,026
15,965 16,867 19,582
177,899 207,032 229,469
9,908
21,469
253,881
19,220 26,084
1,969
-122
-6,136 -7,021
-4,167 -7,143
-12,617 -33,514
21,057
402
-8,030
-7,628
-32,379
1995
1999
2000
51,580
100.0
100.0
100.0
100.0
100.0
100.0
100.0
100.0
14,195
3,304
3,070
1,041
278
249
2,042
1,599
2,612
20.8
26.5
12.6
35.9
36.9
16.8
43.7
14.1
n.a.
22.0
26.0
16.1
33.5
34.7
14.9
42.0
16.4
n.a.
16.6
17.0
11.2
29.9
32.8
15.1
37.7
13.3
n.a.
19.2
19.3
15.3
30.5
35.8
15.4
38.9
14.4
n.a.
20.9
23.8
15.4
31.6
34.6
14.5
41.0
14.6
n.a.
25.4
27.2
20.8
34.6
39.0
12.7
45.4
17.1
n.a.
26.3
27.7
20.2
37.2
35.6
15.4
43.5
19.1
n.a.
27.5
27.9
22.4
37.9
39.0
18.3
45.7
18.7
n.a.
2,067
2,251
14,767 16,446
253,509 290,290
n.a.
n.a.
n.a.
n.a.
n.a.
n.a.
n.a.
n.a.
n.a.
n.a.
n.a.
n.a.
n.a.
n.a.
n.a.
n.a.
n.a.
n.a.
n.a.
n.a.
n.a.
n.a.
n.a.
n.a.
38,991
100.0
100.0
100.0
100.0
100.0
100.0
100.0
100.0
13,740
24
589
3,764
1,152
1,875
852
89
2,977
573
504
1,199
636
1
118
47
281
783
29.4
8.8
18.4
41.9
100.0
57.0
27.6
6.4
54.9
95.4
22.4
19.0
37.5
0.1
31.1
4.8
37.9
n.a.
30.3
5.5
15.5
40.4
100.0
59.6
29.6
10.1
53.1
94.7
26.0
20.7
43.4
0.0
33.4
5.0
37.5
n.a.
31.3
4.1
20.2
45.6
99.7
60.7
35.2
14.9
54.7
94.0
22.8
20.2
36.6
22.3
32.6
6.0
37.9
n.a.
31.5
3.7
23.0
46.0
100.0
62.8
32.1
9.6
58.6
91.9
18.8
20.8
39.9
5.7
30.2
5.2
40.9
n.a.
32.0
5.1
19.1
47.0
99.6
62.9
31.7
10.9
59.4
88.8
21.0
21.1
37.6
12.4
31.4
6.5
45.3
n.a.
33.8
4.7
18.9
45.2
100.0
59.3
37.0
16.1
62.3
88.1
26.8
22.8
42.0
0.9
26.6
6.6
48.6
n.a.
34.1
3.3
19.9
45.2
100.0
60.7
36.0
12.2
59.3
88.4
31.1
23.4
38.2
3.9
23.6
7.2
48.8
n.a.
35.2
2.1
21.8
45.3
100.0
60.7
31.4
11.8
62.9
89.5
32.1
25.2
34.3
2.6
24.1
7.8
51.1
n.a.
10,067
22,549
269,553
12,187 11,276
25,068 25,016
308,432 366,764
n.a.
n.a.
n.a.
n.a.
n.a.
n.a.
n.a.
n.a.
n.a.
n.a.
n.a.
n.a.
n.a.
n.a.
n.a.
n.a.
n.a.
n.a.
n.a.
n.a.
n.a.
n.a.
n.a.
n.a.
14,907
687
-8,159
-7,472
-36,391
10,541
-181
-10,120
-10,301
-54,923
n.a.
n.a.
n.a.
n.a.
n.a.
n.a.
n.a.
n.a.
n.a.
n.a.
n.a.
n.a.
n.a.
n.a.
n.a.
n.a.
n.a.
n.a.
n.a.
n.a.
n.a.
n.a.
n.a.
n.a.
n.a.
n.a.
n.a.
n.a.
n.a.
n.a.
n.a.
n.a.
n.a.
n.a.
n.a.
n.a.
n.a.
n.a.
n.a.
n.a.
$ Million
Agricultural exports to world
Exports to NAFTA:
Agriculture, total
Animals & animal products
Grains & feeds
Fruits & preparations, ex. juice
Fruit juices, including frozen
Nuts & preparations
Vegetables & preparations
Oilseeds & products
Other
Forestry
Agriculture & forestry, total
Agric. & non-agric., total
The Effects of NAFTA on Agriculture and the Rural Economy / WRS-02-1 ✺ 19
1992
Agricultural imports from world
Imports from NAFTA:
Agriculture, total
Bananas & plantains
Coffee, including products
Animals & animal products
Cattle, live
Grains, products, & feeds
Fruits & preparations
Fruit juices, incl. frozen
Vegetables & preparations
Tomatoes
Sugar & related products
Beverages, ex. fruit juices
Oilseeds & products
Cotton, ex. linters
Seeds, field & garden
Cut flowers
Nursery stock, bulbs, etc.
Other
Forestry
Agriculture & forestry, total
Agric. & non-agric., total
Trade balance:
Agriculture with world
Agriculture with NAFTA
Forestry with NAFTA
Agric. & forestry with NAFTA
Agric. & non-agric. with NAFTA
26,897
1,026
-7,488
-6,462
-40,124
1996
1997
1998
Percent
n.a. = not available or does not apply.
Sources: For forestry data, FAS BICO reports; for all other data, Foreign Agricultural Trade of the United States database.
12,588
455
-9,025
-8,570
-76,474
20 ✺ Effects of NAFTA on Agriculture and the Rural Economy / WRS-02-1
Table C-3—U.S. agricultural trade with Mexico, 1992-2000
Commodity
1992
1993
1994
1995
43,159
42,915
46,251
56,347
3,804
1,259
1,061
77
7
37
158
717
488
3,619
1,176
887
111
8
37
172
656
571
4,594
1,363
1,228
185
12
44
250
852
661
n.a.
n.a.
n.a.
n.a.
n.a.
n.a.
24,799
Value
1996
Economic Research Service, USDA
1997
1998
1999
2000
60,417
57,217
51,815
48,278
3,541
825
1,062
85
6
33
141
833
555
5,445
1,088
2,069
95
7
45
249
1,099
792
5,178
1,534
1,165
117
8
44
281
1,192
838
6,160
1,673
1,639
128
15
47
432
1,156
1,069
5,634
1,574
1,576
190
16
60
376
1,051
791
413
5,007
50,843
249
3,790
46,292
250
5,695
56,761
292
5,470
71,378
25,137
27,031
30,263
33,520
2,379
103
252
375
341
53
321
26
809
133
31
169
42
0
7
12
7
173
2,720
94
251
460
430
60
314
31
1,058
304
38
186
29
0
8
14
8
169
2,895
59
333
388
352
85
358
58
1,125
315
69
219
27
0
7
15
6
147
3,836
47
592
602
546
105
475
80
1,306
406
91
275
32
2
9
23
8
187
n.a.
n.a.
n.a.
318
3,038
39,917
300
3,195
49,493
18,361
1,425
n.a.
n.a.
n.a.
17,779
899
n.a.
n.a.
n.a.
1995
1994
1999
2000
51,580
100.0
100.0
100.0
100.0
100.0
100.0
100.0
100.0
6,545
1,879
1,709
247
30
80
464
1,033
1,104
8.4
14.6
6.3
4.7
1.7
3.6
5.7
9.0
n.a.
9.9
14.7
9.0
7.1
2.3
3.8
6.9
11.8
n.a.
6.3
7.5
5.7
3.2
0.9
2.8
3.9
9.3
n.a.
9.0
9.7
9.9
3.6
1.1
3.5
6.5
10.2
n.a.
9.1
13.4
7.6
4.2
1.2
3.1
6.8
9.9
n.a.
11.9
15.7
11.7
5.0
2.3
2.9
10.2
12.2
n.a.
11.7
15.4
11.3
7.6
2.1
4.1
8.7
12.9
n.a.
12.7
15.9
12.5
9.0
4.2
5.9
10.4
12.1
n.a.
367
6,527
79,010
395
435
6,029
6,980
86,909 111,349
n.a.
n.a.
n.a.
n.a.
n.a.
n.a.
n.a.
n.a.
n.a.
n.a.
n.a.
n.a.
n.a.
n.a.
n.a.
n.a.
n.a.
n.a.
n.a.
n.a.
n.a.
n.a.
n.a.
n.a.
36,160
36,908
37,737
38,991
100.0
100.0
100.0
100.0
100.0
100.0
100.0
100.0
3,765
44
570
175
122
128
508
74
1,499
580
121
360
37
16
11
20
10
194
4,111
63
664
231
177
158
530
65
1,484
517
129
484
32
0
18
24
11
216
4,688
57
511
273
206
156
676
91
1,791
567
158
631
50
0
14
25
13
243
4,883
40
446
363
293
161
854
71
1,679
490
177
759
43
5
14
27
14
229
5,079
24
464
479
406
168
701
68
1,778
412
175
884
39
1
14
30
16
238
10.8
8.8
16.5
7.8
32.0
3.4
22.8
4.7
42.1
93.4
3.4
9.1
2.5
0.1
4.1
3.6
2.8
n.a.
10.7
5.5
13.4
6.7
30.6
3.7
24.2
8.8
40.0
91.7
5.8
9.8
1.8
n.a.
2.9
3.7
2.1
n.a.
12.7
4.1
18.1
10.0
38.6
4.6
29.4
12.7
41.0
90.1
6.9
11.2
1.8
22.3
3.8
4.5
2.3
n.a.
11.2
3.7
20.4
2.9
10.9
4.8
26.5
8.1
42.5
86.3
6.4
12.4
1.8
5.6
3.5
3.4
2.5
n.a.
11.4
5.1
17.1
3.6
15.7
5.3
26.2
7.9
40.1
79.7
7.0
14.3
1.5
8.0
4.9
4.0
2.7
n.a.
12.7
4.7
14.9
3.9
18.0
5.4
30.9
13.6
41.0
74.9
9.4
16.6
2.4
0.6
3.4
4.1
2.7
n.a.
12.9
3.3
15.4
5.0
29.3
5.4
31.0
9.1
36.6
71.0
11.1
17.4
2.3
3.9
3.1
4.6
2.7
n.a.
13.0
2.1
17.2
5.8
35.2
5.4
25.9
8.9
37.6
64.3
11.1
18.6
2.1
2.6
2.8
4.8
2.9
n.a.
304
4,140
61,684
393
4,158
72,963
440
4,551
85,830
407
5,095
94,709
416
378
5,299
5,457
109,721 135,926
n.a.
n.a.
n.a.
n.a.
n.a.
n.a.
n.a.
n.a.
n.a.
n.a.
n.a.
n.a.
n.a.
n.a.
n.a.
n.a.
n.a.
n.a.
n.a.
n.a.
n.a.
n.a.
n.a.
n.a.
19,220 26,084
1,699
-295
113
-55
1,812
-350
1,350 -15,392
26,897
1,680
-143
1,537
-16,202
21,057
1,067
-148
919
-14,452
14,907
1,472
-40
1,432
-15,699
10,541
751
-21
730
-22,812
n.a.
n.a.
n.a.
n.a.
n.a.
n.a.
n.a.
n.a.
n.a.
n.a.
n.a.
n.a.
n.a.
n.a.
n.a.
n.a.
n.a.
n.a.
n.a.
n.a.
n.a.
n.a.
n.a.
n.a.
n.a.
n.a.
n.a.
n.a.
n.a.
n.a.
n.a.
n.a.
n.a.
n.a.
n.a.
n.a.
n.a.
n.a.
n.a.
n.a.
$ Million
Agricultural exports to world
Exports to Mexico:
Agriculture, total
Animals & animal products
Grains & feeds
Fruits & preparations, ex. juice
Fruit juices, including frozen
Nuts & preparations
Vegetables & preparations
Oilseeds & products
Other
Forestry
Agriculture & forestry, total
Agric. & non-agric., total
Agricultural imports from world
Imports from Mexico:
Agriculture, total
Bananas & plantains
Coffee, including products
Animals & animal products
Cattle, live
Grains, products, & feeds
Fruits & preparations
Fruit juices, incl. frozen
Vegetables & preparations
Tomatoes
Sugar & related products
Beverages, ex. fruit juices
Oilseeds & products
Cotton, ex. linters
Seeds, field & garden
Cut flowers
Nursery stock, bulbs, etc.
Other
Forestry
Agriculture & forestry, total
Agric. & non-agric., total
Trade balance:
Agriculture with world
Agriculture with Mexico
Forestry with Mexico
Agric. & forestry with Mexico
Agric. & non-agric. with Mexico
Share of world
1996
1997
1993
1998
Percent
n.a. = not available or does not apply.
Sources: For forestry data, FAS BICO reports; for all other data, Foreign Agricultural Trade of the United States database.
12,588
1,466
57
1,523
-24,577
Economic Research Service, USDA
Table C-4—U.S. agricultural trade with Canada, 1992-2000
Commodity
1992
1993
1994
1995
Value
1996
1997
1998
1999
2000
1993
1994
1995
$ Million
Agricultural exports to world
Exports to Canada:
Agriculture, total
Animals & animal products
Grains & feeds
Fruits & preparations, ex. juice
Fruit juices, including frozen
Nuts & preparations
Vegetables & preparations
Oilseeds & products
Other
Forestry
Agriculture & forestry, total
Agric. & non-agric., total
The Effects of NAFTA on Agriculture and the Rural Economy / WRS-02-1 ✺ 21
Agricultural imports from world
Imports from Canada:
Agriculture, total
Bananas & plantains
Coffee, including products
Animals & animal products
Cattle, live
Grains, products, & feeds
Fruits & preparations
Fruit juices, incl. frozen
Vegetables & preparations
Tomatoes
Sugar & related products
Beverages, ex. fruit juices
Oilseeds & products
Cotton exc. linters
Seeds, field & garden
Cut flowers
Nursery stock, bulbs, etc.
Other
Forestry
Agriculture & forestry, total
Agric. & non-agric., total
Trade balance:
Agriculture with world
Agriculture with Canada
Forestry with Canada
Agric. & forestry with Canada
Agric. & non-agric. with Canada
Share of world
1996
1997
1998
1999
2000
Percent
43,159
42,915
46,251
56,347
60,417
57,217
51,815
48,278
51,580
100.0
100.0
100.0
100.0
100.0
100.0
100.0
100.0
4,942
905
812
708
159
133
1,068
289
868
5,317
950
883
728
162
134
1,149
372
940
5,569
1,038
960
686
171
126
1,265
332
991
5,804
1,042
1,032
709
204
145
1,231
360
1,080
6,138
1,077
1,130
714
220
154
1,237
462
1,144
6,785
1,184
1,195
763
222
160
1,420
578
1,262
7,009
1,218
1,270
752
241
160
1,485
470
1,414
7,066
1,258
1,253
745
251
163
1,495
512
1,389
7,650
1,425
1,361
794
248
169
1,579
566
1,508
12.4
11.8
6.3
31.2
35.2
13.2
38.0
5.1
n.a.
12.0
11.2
7.0
26.4
32.4
11.0
35.1
4.6
n.a.
10.3
9.5
5.5
26.7
31.8
12.3
33.9
4.0
n.a.
10.2
9.6
5.4
26.9
34.7
11.9
32.4
4.3
n.a.
11.9
10.4
7.8
27.4
33.5
11.3
34.3
4.8
n.a.
13.5
11.5
9.1
29.5
36.7
9.8
35.2
4.9
n.a.
14.6
12.3
9.0
29.6
33.5
11.3
34.8
6.3
n.a.
14.8
12.0
9.9
28.9
34.8
12.5
35.3
6.6
n.a.
n.a.
n.a.
n.a.
1,113
6,430
100,444
1,222
130
1,288
6,791
5,934
7,426
114,439 127,226 132,584
1,586
8,371
150,124
1,541
8,550
154,152
1,672
1,816
8,738
9,466
166,600 178,941
n.a.
n.a.
n.a.
n.a.
n.a.
n.a.
n.a.
n.a.
n.a.
n.a.
n.a.
n.a.
n.a.
n.a.
n.a.
n.a.
n.a.
n.a.
n.a.
n.a.
n.a.
n.a.
n.a.
n.a.
24,799
25,137
27,031
30,263
33,520
36,160
36,908
37,737
38,991
100.0
100.0
100.0
100.0
100.0
100.0
100.0
100.0
4,143
0
38
1,852
903
775
70
11
263
6
213
204
319
0
53
4
83
257
4,664
0
30
2,007
911
948
66
11
322
6
214
201
411
0
56
5
95
299
5,299
0
52
1,938
799
1,287
80
9
366
10
241
241
635
0
71
6
103
271
5,631
0
68
2,137
863
1,298
95
14
439
17
213
219
608
0
70
7
124
339
6,791
0
70
2,625
999
1,541
108
14
568
37
234
247
777
0
83
10
146
368
7,450
0
78
2,821
943
1,704
109
25
716
59
260
231
767
0
98
15
174
449
7,794
0
137
2,859
938
1,551
132
16
936
101
293
235
822
0
99
16
214
485
7,998
0
130
2,931
708
1,654
139
25
1,036
120
318
260
664
0
94
15
234
497
8,662
0
126
3,285
746
1,707
151
21
1,198
161
329
315
597
0
104
18
265
545
18.6
0.0
2.0
34.0
67.9
53.5
4.8
1.7
12.8
2.0
19.0
9.8
35.0
n.a.
27.0
1.2
35.1
n.a.
19.6
0.0
2.1
33.7
69.4
55.9
5.4
1.3
13.0
3.0
20.2
10.8
41.7
0.0
30.5
1.4
35.4
n.a.
18.6
0.0
2.1
35.6
61.0
56.1
5.8
2.2
13.8
3.9
15.9
9.0
34.8
0.0
28.9
1.5
35.6
n.a.
20.3
0.0
2.5
43.2
89.1
58.0
5.6
1.6
16.1
5.6
12.4
8.5
38.1
0.0
26.7
1.7
38.4
n.a.
20.6
0.0
2.0
43.5
83.9
57.5
5.4
3.0
19.3
9.1
14.1
6.8
36.1
4.4
26.5
2.5
42.6
n.a.
21.1
0.0
4.0
41.3
81.9
53.9
6.0
2.5
21.4
13.3
17.4
6.2
39.6
0.3
23.2
2.5
45.9
n.a.
21.2
0.0
4.5
40.2
70.7
55.3
5.0
3.2
22.6
17.4
20.0
6.0
35.9
n.a.
20.5
2.6
46.1
n.a.
22.2
0.0
4.7
39.5
64.8
55.2
5.5
2.8
25.3
25.1
20.9
6.6
32.2
0.0
21.3
2.9
48.2
n.a.
n.a.
n.a.
n.a.
6,221
10,885
111,216
7,471
7,096
8,633
12,770 12,727 15,424
128,406 145,348 156,506
9,468
16,918
168,051
9,660
17,454
174,844
11,771 10,898
19,769 19,560
198,711 230,838
n.a.
n.a.
n.a.
n.a.
n.a.
n.a.
n.a.
n.a.
n.a.
n.a.
n.a.
n.a.
n.a.
n.a.
n.a.
n.a.
n.a.
n.a.
n.a.
n.a.
n.a.
n.a.
n.a.
n.a.
18,361
798
n.a.
n.a.
n.a.
17,779
653
-5,108
-4,455
-10,772
19,220 26,084
270
173
-6,249 -6,966
-5,979 -6,793
-13,967 -18,122
21,057
-665
-7,882
-8,547
-17,927
14,907
-785
-8,119
-8,904
-20,692
10,541
-932
-10,099
-11,031
-32,111
n.a.
n.a.
n.a.
n.a.
n.a.
n.a.
n.a.
n.a.
n.a.
n.a.
n.a.
n.a.
n.a.
n.a.
n.a.
n.a.
n.a.
n.a.
n.a.
n.a.
n.a.
n.a.
n.a.
n.a.
n.a.
n.a.
n.a.
n.a.
n.a.
n.a.
n.a.
n.a.
n.a.
n.a.
n.a.
n.a.
n.a.
n.a.
n.a.
n.a.
26,897
-653
-7,345
-7,998
-23,922
n.a. = Not available or does not apply.
Sources: For forestry data, FAS BICO reports; for all other data, Foreign Agricultural Trade of the United States database.
12,588
-1,012
-9,082
-10,094
-51,897
Investment In Agriculture and
Food Processing
Introduction
Prior to the implementation of NAFTA, there was
some concern about the agreement's potential impact
on agricultural investment. Some people thought that
investment in U.S. agriculture might decline because
of the agreement, especially if capital flowed to
Canada and Mexico instead of the United States.
This scenario is not borne out by the available data.
Between 1993 and 1999, nominal capital expenditures
in U.S. agriculture increased from $12.5 billion to
$16.0 billion (fig. D-1). In real terms, annual farm
capital expenditures climbed steadily between 1995
and 1998, before declining slightly in 1999.
In addition, food-processing companies in each
NAFTA country viewed the agreement as an excellent
opportunity to increase their foreign direct investment
(FDI) in the other NAFTA countries. In 1998, sales of
U.S. food industry affiliates exceeded $14 billion in
Canada and $12 billion in Mexico, easily surpassing
the value of U.S. processed food exports to those
countries ($5.1 billion to Canada and $2.8 billion to
Mexico).
Figure D-1
Farm business capital expenditures, 1978-99
$ billions
$ billions
25
2.5
20
2.0
Current $
(left axis)
15
1.5
1.0
10
Real $ (1935-39=100)
(right axis)
5
0
1978
0.5
0
81
84
87
90
Source: Economic Research Service, USDA.
93
96
99
U.S. Farm and Food Processing
Investment
Farm Capital Expenditures
It is difficult to assign capital expenditures to pre- and
post-NAFTA eras. Negotiations for the agreement
were underway in 1991. The accord was approved in
1993 and became effective January 1, 1994. Thus,
many investment decisions were made well before the
adoption of NAFTA, as farmers and other investors
appraised the potential effects of the agreement as it
was being negotiated.
Farmers may have taken a second look at their capital
investment decisions as they discovered that the effects
of NAFTA were more favorable than some had anticipated. In 1994, farm capital expenditures (as defined by
ERS) increased slightly in nominal terms but decreased
in real terms. In 1999, these expenditures exceeded their
level in 1993, in both real and nominal terms.
Farm capital expenditures in several regions of the
country rebounded in 1999, even though the total for
the United States decreased slightly (table D-1).
Between 1994 and 1999, capital expenditures in the
Southern Plains experienced the greatest proportionate
increase (58 percent), followed by the Pacific States
(50 percent). Capital expenditures in the Corn Belt
underwent the smallest increase (10 percent).
In the States bordering Mexico, some producers initially
thought that they might lose markets due to NAFTA.
Fruit and vegetable growers in Florida and the Pacific
States, particularly California, feared that competition
from Mexico would lower their economic returns.
However, export opportunities in the NAFTA countries
were more robust than anticipated. In this context,
capital expenditures in the Southeast and the Pacific
regions fluctuated during 1994-99, with the Pacific
States experiencing a surge in expenditures in 1999. In
the Northeast, where the agricultural and food sectors
have become increasingly integrated with their Canadian
counterparts, capital expenditures generally increased in
the first half of the 1990's, held fairly steady during
1996-98, and then increased sharply in 1999.
22 ✺ Effects of NAFTA on Agriculture and the Rural Economy / WRS-02-1
Economic Research Service, USDA
Table D-1—Capital expenditures in U.S. agriculture, 1991-99
Year
Total
Northeast
Lake
Corn Belt
Northern
Plains
1991
1992
1993
1994
1995
1996
1997
1998
1999
13,140
12,616
13,868
13,880
13,776
15,196
16,244
17,956
17,932
970
929
963
930
1,050
1,174
1,134
1,130
1,265
1,644
1,826
1,846
1,910
1,782
1,960
2,113
1,970
2,328
2,920
2,636
2,975
2,986
2,891
2,915
3,209
3,098
3,307
1,451
1,412
1,653
1,613
1,621
1,864
1,959
1,498
1,908
Appalachia
Southeast
Plains
Million dollars
1,219
691
1,292
755
1,308
858
1,224
871
1,512
1,014
1,625
957
1,590
1,043
1,332
752
1,683
1,223
Delta
Southern
Mountain
735
659
790
727
694
770
820
664
866
1,224
1,159
1,323
1,193
1,396
1,233
1,469
1,025
1,888
906
791
944
1,061
1,230
1,213
1,278
1,038
1,417
Pacific
1,377
1,154
1,303
1,361
1,525
1,481
1,627
1,445
2,043
Source: Compiled from ERS information. Data exclude dwellings.
Capital Stock in U.S. Agriculture and
Food Processing
In nominal terms, the capital stock in U.S. agriculture
(defined as fixed reproducible tangible wealth)
increased gradually over the 1993-98 period and then
declined slightly in 1999 (fig. D-2). This upturn follows
a period of relative stability in the capital stock's
nominal value that dates back to the late 1980's.
NAFTA, together with transition payments under the
Federal Agriculture Improvement and Reform Act of
1996, may have sustained this period of stability.
In real terms, the capital stock in U.S. farms has
decreased slowly since the implementation of NAFTA,
continuing a trend that dates back to 1980. This means
that much capital stock, such as farm equipment and
Figure D-2
Total capital stock in U.S. agriculture, excluding
operator dwellings, 1978-99
$ billions
$ billions
160
16
140
14
Current $
(left axis)
120
12
100
10
80
8
Real $ (1935-39=100)
(right axis)
60
6
40
4
20
2
0
1978
0
81
84
87
90
93
96
99
farm buildings, has not been fully replaced. There are
many reasons for this, including the consolidation of
farms and the more efficient use of machinery and
equipment, resulting in economies of scale.
In contrast, investment in food processing has grown
in both nominal and real terms since NAFTA's implementation. The U.S. food and beverage industry
increased its capital stock in real terms by nearly 9
percent from 1993 to 1999. Fixed private capital
investment in the total U.S. economy grew by nearly
16 percent during this period, compared to a 4-percent
increase in agriculture (U.S. Department of
Commerce, Bureau of Economic Analysis).
NAFTA and Foreign Direct Investment
An important element of NAFTA that is often overlooked is the agreement's rules concerning FDI. These
rules generally strengthen the rights of foreign
investors to retain profits and returns from their initial
investments. They also guarantee equal treatment to
foreign and domestic investors alike under the laws of
each NAFTA country and prohibit new laws that
would change the status of foreign investments, once
they are established.
This combination of trade liberalization and investment reform has stimulated FDI in the North
American food processing industry, with firms in each
NAFTA country providing substantial investment
capital. For producers, FDI has meant greater dissemination of new technology and gains in efficiency. For
consumers, it has meant lower food costs, expanded
choices in food and beverages, and greater uniformity
in food quality. Other benefits include an increase in
employment attributable to U.S. affiliates in Mexico
Source: Economic Research Service, USDA.
Economic Research Service, USDA
The Effects of NAFTA on Agriculture and the Rural Economy / WRS-02-1 ✺ 23
and Canada, as well as to Mexican and Canadian affiliates in the United States, and increased earnings from
U.S. investments abroad.
U.S. FDI in Mexico's Processed
Food Industry
U.S. FDI in Mexico's processed food industry increased
from $2.3 billion in 1993 to $5.3 billion in 1999. The
largest amount of new money in recent years occurred
in 1997, although new direct investment continued to
flow into Mexico in 1998 and 1999. In addition, funds
from affiliates in Mexico were reinvested, but at a lower
rate than the high point of 1996. These positive trends
began in the late 1980's, when the Mexican government
changed many of its rules governing FDI. The enactment of NAFTA further increased investor confidence in
Mexico, creating a synergy between investment and
trade. Mexico is now the second largest host country
(after the United Kingdom) for U.S. FDI in processed
foods and beverages.
Nearly three-fourths of U.S. FDI in Mexico's
processed food industry is concentrated in highly
processed products. Examples include mayonnaise and
salad dressing, concentrates and flavorings, confectionery products, pasta and related products, and
canned and frozen meats. Only 5 percent is in
processed fruits and vegetables. Another 15 percent is
in beverages, and about one-tenth is in grain milling or
bakery products (Secretaría de Comercio y Fomento
Industrial, 1997).
U.S. FDI in Canada's Processed
Food Industry
Between 1989 and 1999, U.S. FDI in Canada's $40billion processed food industry expanded from $1.8
billion to $5.0 billion. In 1999, some U.S. companies
disinvested in Canadian firms, and a smaller amount of
earnings were reinvested. This marks the slowing of a
trend that began prior to the Canada-U.S. Free Trade
Agreement (CFTA) and reflects the heightened integration of the U.S. and Canadian food processing
sectors. Canada is the third largest host country for
U.S. FDI in processed foods. Total FDI in Canada's
food and agricultural sectors equaled $20.5 billion in
1999, with most of the investment coming from the
United States, the United Kingdom, and Australia
(Statistics Canada, 2000).
There are many specific examples of U.S. FDI in the
Canadian agriculture and food processing. Cargill was
the first U.S. firm to have grain-handling assets in
Canada. ConAgra has built new elevators throughout
the Canadian prairies, and Archer-Daniels-Midland
(ADM) has forged a strategic alliance with United
Grain Growers (UGG), with options for procurement.
New facilities also have been built to handle increased
cross-border trade. Joint ventures between the
Saskatchewan Wheat Pool (SWP) and General Mills in
Sweetgrass, Montana, and Northgate, North Dakota,
are facilitating trade in both directions. U.S. firms also
have acquired major Canadian grain-processing firms.
A joint venture also was formed between Schrier and
Prairie Malt (Cargill). The U.S. firm Rahr has a plant
in Alix, Alberta, and ConAgra recently acquired
Canada Malt, the largest malting company in Canada.
In addition, two of the largest U.S. flour-milling firms,
ADM and ConAgra, are major participants in Canada's
flour industry.
Mexican FDI in the U.S. Processed
Food Industry
Mexican firms also have increased their investments in
U.S. food companies. In 1999, Mexican FDI in the
U.S. processed food and beverage industry equaled
$1.0 billion. As recently as 1997, this total was just
$304 million. Large companies based in Mexico own a
variety of U.S. enterprises engaged in food processing.
GIBSA, one of Mexico's largest bread making companies, is a leading investor in U.S. bread-baking companies. Other examples include Gruma (a major tortilla
maker), Minsa (a large corn milling company), and
DESC (a maker of Mexican-style food products).
Canadian FDI in the U.S. Processed
Food Industry
In contrast, Canada's presence in the U.S. processed
food industry declined to $610 million in 1999, as the
Bronfman family (Seagram's) liquidated its industry
assets. This is a sharp departure from the first several
years of NAFTA, as Canadian FDI in the U.S.
processed food industry grew without interruption
from $5.1 billion in 1993 to $7.6 billion in 1997,
exceeding the U.S. presence in Canada.
The recent decline in Canadian FDI in the U.S.
processed food industry coincides with lower FDI
from all countries in the U.S. processed food industry.
Factors contributing to this overall decline include the
strong U.S. dollar and the relative maturity of the U.S.
food processing sector. However, there are examples
that run counter to this trend. In 2001, George Weston,
24 ✺ Effects of NAFTA on Agriculture and the Rural Economy / WRS-02-1
Economic Research Service, USDA
Ltd., a Toronto baking and food retailing company,
acquired Best Foods Brand baking products in the
United States, an acquisition costing $1.7 billion.
Recent ERS Research about FDI
ERS has completed several studies about the basis for
U.S. FDI in the Canadian and Mexican processed food
industries, as well as the general relationship between
trade and FDI. Whether FDI complements or substitutes for trade is crucial to whether FDI is viewed as
beneficial to U.S. agriculture and food processing.
Gopinath, Pick, and Vasavada (1999) study the determinants of exports and FDI by the U.S. processed food
industry with respect to 10 developed countries
(Australia, Belgium, Canada, France, Germany, Japan,
the Netherlands, Italy, Spain, and the United Kingdom)
during 1982-94. The authors find a small but negative
relationship between export price and the sales of
foreign affiliates in the U.S. processed food industry,
which suggests that exports and FDI are weak substitutes. In addition, the authors offer evidence that the
U.S. food processing industry uses FDI as a means to
“jump” the protectionist policies of other countries.
Bolling and Somwaru (2000) evaluate the impact of
various factors on the presence or absence of FDI in
the 43 sub-sectors of the Canadian and Mexican
processed food industries. Industry size, as measured
by industry sales, is found to be the principal determinant for U.S. firms choosing one sub-sector over
another for FDI in both Canada and Mexico. U.S.
exports and industry concentration also are significant
determinants. U.S. exports to Mexico are negatively
related to U.S. FDI in the Mexican processed food
industry, indicating a competitive relationship. In the
Canadian case, the relationship between exports and
FDI is positive but statistically insignificant. These
differing results may reflect the fact that the Canadian
and U.S. economies are more closely intertwined than
the Mexican and U.S. economies. They also may be
due to the type of products traded between the United
States and the two host countries.
Bolling and Somwaru's model correctly predicts the
presence of U.S. FDI in Canada's meat packing, evaporated and dried milk, canned fruits and vegetables,
chocolate and cocoa, bottled and canned soft drinks,
and prepared fresh and frozen fish industries. For
Mexico, the model was able to predict the presence of
Economic Research Service, USDA
U.S. FDI in sausage and preparations, evaporated and
dried milk, frozen fruits and vegetables, prepared
feeds, bread and bakery products, soybean oil, malt
beverages, bottled and canned soft drinks, and macaroni and noodles. The authors conclude that FDI
prevails only in certain sub-sectors, which can be
explained reasonably well by the above mentioned
trade and industry characteristics.
Bolling, Neff, and Handy (1998) find that U.S. FDI
in the processed food industries of the Western
Hemisphere countries generally complements U.S.
exports. Most product sales from these investments stay
in the host country, rather than being re-exported to the
United States. This is particularly true in the case of
Mexico. Regional trade agreements, such as NAFTA
and MERCOSUR (the Southern Common Market), and
liberalized rules concerning foreign investment have
encouraged investors in the processed food industry.
In an analysis of annual data for 1973-99, Jerardo
(2001) determines that exports and FDI in the
processed food industry have a quantifiable relationship. Preliminary estimates suggest that a $1-billion
increase in U.S. processed food exports to Canada is
accompanied by an additional $749 million of U.S.
FDI in Canada's processed food industry. In the case
of Mexico, FDI may be used to predict exports,
although the statistical evidence is somewhat weaker.
The estimates suggest that a $1-billion rise in U.S.
FDI in the Mexican processed food industry is joined
by $114 million in additional U.S. processed food
exports to Mexico.
Jerardo also identifies several new patterns in exports
and FDI since the implementation of CFTA and
NAFTA. Before CFTA, the U.S. processed food
industry preferred by large margins to invest directly
in Canada (fig. D-3). Following CFTA's implementation in 1989, U.S. processed food exports to Canada
began to accelerate, and soon, these exports began to
parallel U.S. FDI in Canada's processed food industry.
With respect to Mexico, FDI and exports closely
tracked each other before NAFTA, with exports
usually exceeding investments (fig. D-4). Starting in
1988, FDI and exports substantially increased. After
NAFTA's implementation in 1994, U.S. FDI continued
its sharp upward trend, leaving exports behind, especially in the wake of the peso devaluation in December
1994.
The Effects of NAFTA on Agriculture and the Rural Economy / WRS-02-1 ✺ 25
Conclusion
Figure D-3
U.S. foreign direct investment (FDI) in the Canadian
processed food industry and U.S. processed food
exports to Canada, 1973-99
$ million
6,000
5,000
4,000
3,000
FDI
2,000
1,000
Chris Bolling (202-694-5212, [email protected])
and Andy Jerardo (202-694-5323,
[email protected])
Exports
0
1973 76
79
82
85
88
91
94
97
Sources: For U.S. direct investment in food and kindred products,
based on historical cost, U.S. Department of Commerce, Bureau
of Economic Analysis; for U.S. exports of processed food (SIC 20),
Foreign Agricultural Trade of the United States database.
Figure D-4
U.S. foreign direct investment (FDI) in the Mexican
processed food industry and U.S. processed food
exports to Mexico, 1973-99
$ million
6,000
5,000
FDI
3,000
2,000
Exports
1,000
76
79
82
85
88
91
94
References
Bolling, Christine, and Agapi Somwaru. “U.S. Foreign
Direct Investment in Foreign Food Processing
Industries.” Selected paper, American Agricultural
Economics Association (AAEA) Annual Meeting,
Tampa, Florida, August 2000.
Bolling, Christine, Steve Neff, and Charles Handy.
U.S. Foreign Direct Investment in the Western
Hemisphere Processed Food Industry. U.S.
Department of Agriculture, Economic Research
Service, Agricultural Economic Report No. 760
(ERS-AER-760). Washington, D.C., March 1998.
Bolling, Christine, and Constanza Valdes. The U.S.
Presence in Mexico's Agribusiness. ERS FAER-253,
July 1994.
4,000
0
1973
NAFTA has coincided with rising capital expenditures
in the U.S. farm economy through 1999. The increased
capital expenditures in production are somewhat
striking, given that agricultural capital expenditures are
slow to adjust to changing economic conditions and
that commodity prices have been relatively low.
Econometric studies demonstrate that NAFTA has
fostered a positive synergy between trade and FDI in
the North American processed food industry. As a
result, U.S. exports and U.S. FDI have grown together.
This combination is one of NAFTA's success stories.
97
Sources: For U.S. direct investment in food and kindred products,
based on historical cost, U.S. Department of Commerce, Bureau
of Economic Analysis; for U.S. exports of processed food (SIC 20),
Foreign Agricultural Trade of the United States database.
Colyer, Dale. “Foreign Direct Investment in the
Primary Sector of Mexico.” Paper presented at the
Northeastern Agricultural and Resource Economics
Meeting, Ithaca, New York, June 22-25, 1998.
Gopinath, Munisamy, Daniel Pick, and Utpal
Vasavada. “The Economics of Foreign Direct
Investment and Trade with an Application to the
U.S. Food Processing Industry.” American Journal
of Agricultural Economics, Vol. 81 (May 1999), pp.
442-452.
Jerardo, Andy. “The Complementary Relationship
between U.S. Direct Investment and U.S. Exports in
the Processed Food Industries of Canada and
Mexico.” Unpublished paper, 2001.
26 ✺ Effects of NAFTA on Agriculture and the Rural Economy / WRS-02-1
Economic Research Service, USDA
Secretaría de Comercio y Fomento Industrial
(SECOFI), Subsecretaría de Negociaciones
Comerciales Internacionales, Dirección General de
Inversión Extranjera. “Inversión de Estados Unidos
en Mexico.” Mexico City, November 1997.
Somwaru, Agapi, and Christine Bolling.
“Macroeconomic Factors Affecting Growth in U.S.
Foreign Direct Investment.” Selected paper,
American Agricultural Economics Annual Meeting,
Nashville, Tennessee, August 1999.
Economic Research Service, USDA
Statistics Canada. Balance of Payments Statistics,
Foreign Direct Investment in Canada by SIC
Category, 1999. Ottawa, Ontario, Canada, 2000.
U.S. Department of Commerce, Bureau of Economic
Analysis. Survey of Current Business, Washington,
D.C., selected issues.
_____. U.S. Direct Investment Abroad: Operations of
Parent Companies and Their Foreign Affiliates.
Washington, DC, selected issues.
The Effects of NAFTA on Agriculture and the Rural Economy / WRS-02-1 ✺ 27
Employment in U.S. Agriculture
and Related Industries
Introduction
Sectoral Employment Levels
NAFTA has likely had a small, positive effect on
employment in U.S. agriculture. By opening the door
to new export opportunities and allowing for the more
efficient allocation of productive resources across
economic sectors and geographic areas, NAFTA
should increase opportunities for agricultural employment, as the United States enjoys a clear comparative
advantage in many sectors within agriculture. At the
same time, employment opportunities are narrowing in
some agriculture-related industries in which the United
States is less competitive, such as textiles and apparel.
These structural changes generally predate NAFTA,
but the accord reinforces these long-term trends.
Table E-1 lists CPS estimates of U.S. employment from
1989 to 2000 for agriculture and 10 manufacturing
sectors related to agriculture: lumber and wood products,
furniture and fixtures, farm machinery and equipment,
food and kindred products, tobacco manufacturing,
textile manufacturing, apparel and other finished textile
products, paper and allied products, leather and leather
products, and forestry and fisheries,. Asterisks in the
table identify estimates that are statistically different
from the corresponding estimate for 2000.
Because U.S. agriculture is generally not labor-intensive, NAFTA's influence on employment in the sector
has been relatively small to date. Over the long run,
however, NAFTA may alter appreciably the composition and size of U.S. agricultural employment. This
would especially be the case if Mexico further specializes in labor-intensive agricultural activities while the
United States and Canada intensify their focus on
capital-intensive ones. NAFTA-related flows of agricultural products are quite large in comparison to total
U.S. agricultural trade, so the agreement is likely to
play an important role in sharpening this process.
This section uses data from the Current Population
Survey (CPS) to identify statistically significant
changes in employment in agriculture and agriculturerelated industries. These developments are placed in
the context of other explanatory factors, as well as
each sector's contribution to gross domestic product
(GDP) and foreign trade, in order to draw inferences
about NAFTA's effects on employment. The section
also profiles agriculture-related certifications under
two Federal programs for workers who are displaced
by international trade: the Trade Adjustment
Assistance (TAA) and NAFTA Transitional
Adjustment Assistance (NAFTA-TAA) Programs.
Finally, the section takes a closer look at the textile
and apparel industries, whose economic restructuring
is partially related to NAFTA.
Agricultural Employment. According to CPS estimates, U.S. agricultural employment totaled 3,305,000
in 2000. Although this estimate is larger than the estimates for the pre-NAFTA period of 1989-93, the
differences between the estimate for 2000 and the estimates for 1989-93 are not statistically significant.
Thus, the CPS does not provide sufficient information
to conclude that the level of agricultural employment
in 2000 was any different from agricultural employment during the 5 years immediately prior to NAFTA.
However, several components of agricultural employment—livestock production, landscaping and horticultural services, and veterinary services—have
demonstrated a statistically significant change since
the implementation of CFTA and NAFTA (fig. E-1).
This finding does not extend to crop production,
whose estimated level of employment in 2000 was not
statistically different from the corresponding estimates
for 1989-99.
Employment in livestock production contracted from
an average of 1,211,000 during 1989-93 to 993,000 in
2000, a decline of 18 percent. Although this reduction
coincides with the two trade agreements, it is strongly
associated with major developments in the livestock
sector that are not the product of CFTA and NAFTA.
The U.S. hog industry experienced substantial technological change and consolidation during the 1990's,
while drought and poor ranging conditions have motivated a reduction of U.S. cattle inventories since 1996
(Gustafson, 2000; Mathews, et al., 1999).
28 ✺ Effects of NAFTA on Agriculture and the Rural Economy / WRS-02-1
Economic Research Service, USDA
Economic Research Service, USDA
Table E-1—Employed persons by selected industry, age 16 years and over
Industry
1989
1990
1991
117,342 *
118,793 *
117,718 *
3,199
1,028
1,228 *
n.a.
624 *
n.a.
3,223
1,000
1,207 *
n.a.
682 *
334
3,269
1,023
1,236 *
n.a.
698 *
312
Lumber and wood products, except
furniture
Logging
Sawmills, planing mills, and millwork
Wood buildings and mobile homes
Miscellaneous wood products
792
151
426
60
156
789
156
418
63
152
Furniture and fixtures
664
694
1992
1993
1994
1995
1996
1997
1998
1999
2000
Thousands
Total
Agriculture
Agricultural production, crops
Agricultural production, livestock
Veterinary services
Landscape and horticultural services
Agricultural services, n.e.c.
Farm machinery and equipment
The Effects of NAFTA on Agriculture and the Rural Economy / WRS-02-1 ✺ 29
Food and kindred products
Meat products
Dairy products
Canned, frozen, and preserved fruits
and vegetables
Grain mill products
Bakery products
Sugar and confectionary products
Beverage industries
Miscellaneous and not specified
Tobacco manufactures
96
1,821 *
456
208 *
239
147
233
111
219
209
118,477 * 120,259 * 123,060 *
124,900 *
126,708 *
3,250
1,005
1,225 *
156 *
703 *
162
3,115
925
1,158 *
165 *
697 *
170
3,409
1,011
1,319 *
164 *
750 *
165
3,440
1,046
1,304 *
170 *
743 *
177
3,443
1,030
1,217 *
198
803
196
721
143
367
62
149
689 *
138
338 *
59 *
154
712
140
352 *
76
144
732
145 *
386
60 *
141
816
169 *
411
87
150
631
608
634
662
645
106
111
115
1,856
482
177
1,752
473
144
1,764
489
158
252 *
142
239
108
242
213
217
145
226
114
230
202
210
138
206
125
204
236 *
99
129,558 *
131,463 *
133,488 *
3,399
987
1,206
199
813
n.a.
3,378
1,014
1,094
206
881
n.a.
3,281
958
998
215
920
n.a.
135,208
3,305
995
993
217
903
n.a.
795
158
403
82
153
820
154
413
82
170
863
133
442
102
186
824
126
429
102
168
784
123
421
95
145
661
661
675
661
645
114
114
106
105
117
105
99
1,797 *
482
156
1,749
475
161
1,701
442
142
1,708
461
125
1,698
470
122
1,655
439
124
1,644
475
144
1,662
456
153
231
141
233
107
220
228 *
220
141
240
104
203
204
223
144
235
99
211
207
220
145
219
98
232
208
227
154
224
102
208
191
208
161
230
102
192
199
180
148
228
98
193
179
193
157
232
94
197
181
54
47
59
52
54
50
53
49
59
52
46
48
688 *
127
63
427 *
705 *
114
75
446 *
700 *
113
60
452 *
652 *
105
50
416 *
632 *
133 *
53
372 *
643 *
108
67
403 *
670 *
112
96
398 *
619 *
97
83
364 *
634
101
81
365 *
595
97
85
329
524
86
93
271
519
86
73
294
1,172 *
1,008 *
164
1,108 *
953 *
154
1,073 *
916 *
157
1,053 *
895 *
157
1,033 *
877 *
157
1,009 *
834 *
175
1,011 *
827 *
185
954 *
791 *
163
945 *
789 *
156
825 *
678 *
147
733
583
150
708
563
145
Paper and allied products
Pulp, paper, and paperboard mills
Miscellaneous paper and pulp products
Paperboard containers and boxes
749 *
349 *
197
203
737 *
332 *
200
205
740 *
328 *
197
214
733 *
314 *
203
216
723 *
292 *
208
222
703 *
293 *
194
217
723 *
299 *
216
207
668
275 *
199
193
683 *
265
206
212
683 *
251
229
203
640
233
210
197
595
221
196
179
Leather and leather products
Footwear, except rubber and plastic
Forestry and fisheries
Forestry
Fishing, hunting, and trapping
152 *
89 *
179
98
81
140 *
90 *
171
89
82
139 *
83 *
160
81
79
136 *
81 *
172
93
80
123
65 *
185
102
83
135 *
71 *
177
112
65
144 *
74 *
152
71
81
140 *
67 *
127
68
60
127 *
70 *
139
71
68
108
56
131
67
64
87
43
135
72
63
92
39
152
84
68
Textile mill products
Knitting mills
Carpets and rugs
Yarn, thread, and fabric mills
Apparel and other finished textile
products
Apparel and accessories, except knit
Miscellaneous fabricated textile products
* = Difference between this estimate and the corresponding estimate for 2000 is statistically significant at the 95-percent confidence level.
n.a. = not available, n.e.c. = not elsewhere classified.
Sources: Annual averages from household data in U.S. Department of Labor, Bureau of Labor Statistics (BLS), Employment and Earnings, various issues; supplemented with updates from
BLS (1999) and from BLS directly.
Figure E-1
Employment in subsectors of U.S. agriculture,
age 16 and over, 1989-2000
Thousand
1,400
Livestock production
1,200
1,000
Crop production
800
600
Landscaping and horticultural services
400
200
Veterinary services
0
1989
91
93
95
97
99
Source: Annual averages from household data in U.S. Department
of Labor, Bureau of Labor Statistics (BLS), Employment and
Earnings, various issues; supplemented with updates from BLS
(1999) and from BLS directly. Series for veterinary services
begins in 1992.
The U.S. Agricultural Censuses provide a glimpse of
these developments. Between 1992 and 1997, the
number of farms with live swine dropped from
191,347 to 109,754, while the U.S. inventory of hogs
and pigs climbed from 57 million to 61 million head.
Over the same period, the number of U.S. farms with
cattle and calves declined from 1,074,349 to 1,046,863
(USDA/NASS, 1999: 30, 34).
Two agricultural subsectors have shown a substantial
increase in employment. Employment in veterinary
services climbed from an average of 161,000 in 1992
and 1993 to 217,000 in 2000, an increase of 35
percent. Meanwhile, employment in landscaping and
horticultural services surged from an average of
660,000 during 1988-93 to 903,000 in 2000, an
increase of 37 percent. To a small degree, freer trade in
livestock and animal products may have boosted the
demand for veterinary services. In general, however,
these increases in employment reflect consumer preferences concerning gardening, landscaping, and pet
ownership, rising U.S. incomes, and the strength of the
U.S. economy.
ment during the CFTA-NAFTA period (fig. E-2). None
of the remaining agriculture-related industries showed a
statistically significant change in employment.
U.S. textile and apparel employment peaked at 2.45
million in 1973. Since then, the two industries have
experienced a sustained decline in employment—a
trend that has continued under CFTA and NAFTA.
Textile and apparel employment was estimated at 1.9
million in 1988 (the last year before CFTA), 1.7
million in 1993 (the last year before NAFTA), and 1.2
million in 2000. In recent years, the apparel industry
has felt this contraction more sharply than the textile
industry. Apparel employment dropped from an
average of 1,104,000 during 1988-93 to 708,000 in
2000, a decrease of 36 percent. In contrast, textile
employment fell from an average of 682,000 during
1988-93 to 519,000 in 2000, a decrease of 24 percent.
These reductions are part of a long-term process of
economic restructuring within the two industries.
Many activities that that can be performed at lower
cost outside the United States have been relocated to
other countries, and the remaining U.S. producers have
made substantial gains in productivity. Of the 14
subsectors of the U.S. textile and apparel industries for
which productivity data are reported, all but one experienced productivity gains over the 1990-99 period
Figure E-2
U.S. employment in selected agriculture-related
industries, age 16 and over, 1989-2000
Thousand
1,400
1,200
1,000
Paper and allied products
800
600
Textile mill products
400
200
0
Manufacturing Related to Agriculture. Four agriculturerelated manufacturing sectors—textile mill products,
apparel and other finished textile products, paper and
allied products, and leather and leather products—have
exhibited a statistically significant decline in employ-
Apparel and other finished textiles
Leather and leather products
1989
91
93
95
97
99
Source: Annual averages from household data in U.S. Department
of Labor, Bureau of Labor Statistics (BLS), Employment and
Earnings, various issues; supplemented with updates from BLS
(1999) and from BLS directly.
30 ✺ Effects of NAFTA on Agriculture and the Rural Economy / WRS-02-1
Economic Research Service, USDA
(U.S. Department of Labor, Bureau of Labor Statistics,
2001).
NAFTA has played an important role in this process.
Through strict rules of origin and the progressive elimination of trade barriers within North America,
NAFTA has enabled Mexican and Canadian producers
to expand their share of the U.S. market by a substantial margin. In terms of value, Mexico and Canada
supplied 19 percent of U.S. textile and apparel imports
in 1999, compared with just 9 percent in 1993. In
terms of square-meter equivalents, Mexico and Canada
have been the number-one and number-two exporters
of textiles and apparel to the United States since 1998
(Green, 1999; U.S. Department of Commerce, Office
of Textiles and Apparel, 2001).
As part of a more integrated and more competitive
textile and apparel sector within North America, U.S.
producers are often the primary suppliers of intermediate textile and apparel products to their counterparts
in Canada and Mexico. Between 1993 and 2000, U.S.
textile and apparel exports to these two countries
increased from $3.5 billion to $9.5 billion. Moreover,
Canada and Mexico accounted for 87 percent of the
total increase in U.S. textile exports and 52 percent of
the total increase in U.S. apparel exports that occurred
over this period. Thus, NAFTA may have facilitated
the retention of U.S. jobs - particularly in the textile
sector - that would have relocated to other parts of the
world in the absence of the agreement.
In paper and allied products, employment dropped
from an average of 736,000 during 1988-93 to 595,000
in 2000, a decrease of 56 percent. Nevertheless, U.S.
exports in this sector to NAFTA countries have
increased substantially. Between 1989-93 and 199499, exports to Canada climbed by 89 percent, and
exports to Mexico increased 91 percent (table E-2).
The increase in imports from Canada and Mexico has
been far more modest, slightly exceeding the overall
growth rate of the U.S. economy. Therefore, CFTA
and NAFTA are likely to have slowed the decrease in
employment in this sector.
Since 1989, the leather and leather products sector has
experienced a marked increase in both total exports and
total imports and a reduction in output. Total exports
were 40 percent higher in 1994-99 than in 1989-93,
while total imports grew by 43 percent. Meanwhile, the
annual average of the industry's GDP declined by 6
Economic Research Service, USDA
percent between 1990-93 and 1994-99 (table E-2). In
this setting, employment in the sector fell from an
average of 138,000 during 1988-93 to 92,000 in 2000, a
decrease of 33 percent. Overall, this change does not
seem to be related to CFTA and NAFTA, as Canada and
Mexico's combined share of U.S. leather product
imports increased only slightly, from an average of 3
percent in 1989-93 to 5 percent in 1994-99.
Federal Assistance with
Trade Adjustment
Trade-related industries are especially important to
rural economies. Exports of goods -including agricultural, manufacturing, and mining products - make up
about two-thirds of U.S. exports. Goods-producing
industries currently account for 26 percent of
nonmetro jobs but just 14 percent of metro jobs,
making goods production disproportionately nonmetro.
Increased growth in U.S. exports translates into greater
employment growth and a lower unemployment rate in
both metro and nonmetro areas.
However, industries and localities do not share equally
in export-led growth, and some suffer adverse effects.
Although layoffs from plant closings and downsizings
constitute a small share of the nonmetro labor force,
these developments can have a large impact on individual rural communities. In such instances, assistance
is clearly warranted, not only to help displaced and
dislocated workers, but also to help affected communities as they adapt economically and develop new
sources of employment.
To assist with this process, the Federal Government
operates the Trade Adjustment Assistance (TAA) and
the NAFTA Transitional Adjustment Assistance
(NAFTA-TAA) Programs. Both programs provide
assistance to workers whose layoffs are determined by
the U.S. Department of Labor (DOL) to have been
caused by international trade. The NAFTA-TAA
Program, which was established by the North
American Free Trade Agreement Implementation Act
of 1993, is virtually identical to the TAA Program. The
main difference between the two programs is that
NAFTA-TAA specifically provides assistance to
workers “who lose their jobs or whose hours of work
and wages are reduced as a result of trade with Canada
or Mexico” (U.S. Department of Labor, 2001). FY
The Effects of NAFTA on Agriculture and the Rural Economy / WRS-02-1 ✺ 31
Table E-2—Employment, output, and foreign trade in agriculture and related industries: 1994-99 versus 1990-93
Employment
Avg.
1994-99
Avg.
1990-93
Percent
Change
Avg.
1990-93
---Thousand--Total
GDP
Avg.
1994-99
Percent
Change
---$ billions---
Avg.
1990-93
Total exports
Avg.
Percent
1994-99 Change
---$ billions---
118,812
128,196
7.9
6,187.7
8,112.6
31.1
431.99
631.32
46.1
5,007
3,214
988
1,207
5,084
3,392
1,008
1,190
1.6
5.5
2.0
-1.4
180.1
76.7
n.a.
n.a.
203.6
82.1
n.a.
n.a.
13.0
6.9
n.a.
n.a.
42.30
23.53
22.62
0.91
54.67
27.93
26.89
1.04
29.2
18.7
18.9
14.7
Agriculture-related industries
5,993
Food and kindred products
1,792
Forestry and fisheries
172
Forestry
91
Fishing, hunting, and trapping
81
Lumber and wood products
728
Furniture and fixtures
642
Tobacco products
53
Textile mill products
672
Apparel and other textile products 1,067
Paper and allied products
733
Leather and leather products
134
5,617
1,693
144
77
67
808
661
51
614
840
683
124
-6.3
-5.6
-16.6
-15.8
-17.5
11.1
3.0
-3.0
-8.6
-21.3
-6.8
-7.8
301.2
103.4
35.2
n.a.
n.a.
32.6
16.4
12.7
24.0
26.7
45.5
4.8
354.2
121.6
41.6
n.a.
n.a.
41.5
22.0
15.9
25.4
26.8
55.1
4.5
17.6
17.6
18.0
n.a.
n.a.
27.0
34.1
25.2
5.8
0.4
21.1
-5.6
55.37
18.77
3.11
0.29
2.82
6.89
2.40
4.60
4.35
4.32
9.44
1.48
75.89
26.74
2.86
0.28
2.57
7.03
3.36
4.95
6.62
8.47
13.87
1.99
37.0
42.5
-8.2
-0.5
-9.0
2.0
40.3
7.6
52.2
96.1
46.9
33.7
Agriculture plus food and
kindred products:
Agriculture
Agricultural production, crops
Agricultural production, livestock
Avg.
1990-93
NAFTA exports
Avg.
Percent
1994-99
Change
Avg.
1990-93
---$ billions--Total
Total imports
Avg.
Percent
1994-99
Change
---$ billions---
NAFTA imports
Avg.
Avg.
Percent
1990-93 1994-99 Change
---$ billions---
125.75
206.60
64.3
523.93
835.21
59.4
132.18
241.11
82.4
8.72
4.00
3.65
0.34
12.37
5.52
5.13
0.39
41.8
38.3
40.6
13.7
25.50
9.10
7.24
1.86
35.30
13.46
11.05
2.42
38.4
48.0
52.6
29.8
7.20
3.63
2.12
1.51
12.02
5.58
3.70
1.88
66.9
53.7
74.7
24.3
Agriculture-related industries
14.48
Food and kindred products
4.73
Forestry and fisheries
0.42
Forestry
0.05
Fishing, hunting, and trapping
0.37
Lumber and wood products
1.49
Furniture and fixtures
1.59
Tobacco products
0.02
Textile mill products
1.64
Apparel and other textile products 1.36
Paper and allied products
2.89
Leather and leather products
0.34
23.58
6.85
0.55
0.08
0.47
1.85
2.12
0.05
3.18
3.31
5.05
0.62
62.8
44.8
30.9
50.5
28.1
24.6
33.3
132.8
93.7
142.8
74.7
83.9
92.64
16.40
5.51
0.94
4.57
6.63
5.52
0.33
5.64
30.78
10.90
10.93
139.52
21.83
7.69
1.52
6.17
13.04
10.19
0.34
7.88
48.10
15.09
15.36
50.6
33.2
39.4
61.5
34.9
96.6
84.6
5.1
39.6
56.3
38.5
40.5
23.08
3.57
1.14
0.03
1.11
4.71
1.98
0.24
0.49
2.23
8.35
0.38
41.99
6.44
1.29
0.04
1.25
9.66
4.27
0.04
1.52
6.99
11.00
0.78
81.9
80.3
12.8
19.2
12.6
105.4
116.3
-81.9
208.5
213.7
31.7
105.0
Agriculture plus food and
kindred products:
Agriculture
Agricultural production, crops
Agricultural production, livestock
GDP figures for forestry and fisheries include some agricultural services as well.
Sources: For employment, U.S. Department of Labor, Bureau of Labor Statistics; for GDP, U.S. Department of Commerce, Bureau of Economic
Analysis; for trade, U.S. Bureau of the Census.
32 ✺ Effects of NAFTA on Agriculture and the Rural Economy / WRS-02-1
Economic Research Service, USDA
2001 appropriations included $342.4 million for TAA
and $64 million for NAFTA-TAA.1
The goal of both programs is to assist individuals in
acquiring the skills necessary for obtaining suitable
reemployment. Assistance includes retraining, income
support while in training, and job search and relocation allowances. A worker group at a plant or a portion
of a plant must be certified by DOL in order for
workers in that group to be individually eligible to
receive benefits. A petition seeking certification may
be filed by three or more workers, their union, or by a
company official on the workers' behalf. Communitybased organizations also are allowed to submit petitions for assistance under the NAFTA-TAA Program.
Assistance to Nonmetro Areas. Nonmetro counties
account for a disproportionately high number of certifications in both programs, compared with the size of the
U.S. population and work force in those counties and the
number of establishments there (Hamrick, MacDonald,
and Meyer, 2000).2 Between January 1994 and
September 1999, DOL certified 6,282 worker groups for
assistance under the TAA Program (table E-3). Of the
5,071 certifications that can be clearly linked to a particular county, 40 percent correspond to nonmetro counties.
Similar analysis of NAFTA-TAA certifications between
January 1994 and January 1999 indicates that about 40
percent of the worker groups certified for assistance
were from nonmetro counties (table E-4). In contrast,
nonmetro counties account for about 20 percent of the
U.S. population, labor force, and number of establishments. The main reason for certification under the
NAFTA-TAA Program was that production at the
affected companies had shifted to Mexico.
1 Two other trade assistance programs are not discussed in this
report: (1) technical assistance to employers through the Trade
Adjustment Assistance Program (see the U.S. Department of
Commerce's web site, http://www.doc.gov, and look under
Economic Development Administration), and (2) the North
American Development Bank, http://www.nadbank.org. For more
information on TAA and NAFTA-TAA, see the web site of the
U.S. Department of Labor's Employment and Training
Administration, http://www.doleta.gov.
2 A few researchers have mistakenly interpreted the estimated
number of affected workers listed in the certification records of the
TAA and NAFTA-TAA programs as a measure of the jobs lost due
to international trade. These estimates actually are an indication
from DOL to State governments of the maximum number of
workers associated with each certification who might require assistance through the programs. For this reason, we focus instead on
the number of certifications and their distribution by State,
economic sector, and metro-nonmetro category.
Economic Research Service, USDA
Apparel and finished textile products is by far the
industry with the largest number of certifications under
both the TAA and NAFTA-TAA Programs. Worker
groups at nonmetro apparel establishments accounted
for 43 percent of non-metro TAA certifications, as
well as 39 percent of all NAFTA-TAA certifications.
Furthermore, about one-third of all nonmetro apparel
establishments received worker-group certification
under the two programs. The textile industry also had
a sizable number of certifications in nonmetro areas,
126 under the TAA Program and 26 under the
NAFTA-TAA Program.
Looking at the number of certifications by county, we
see that the great majority of nonmetro counties in the
Southeast United States had at least one certification
during 1994-98 under either the TAA or the NAFTATAA Program (fig. E-3). Many of these counties had 4
or more certifications, mostly at textile or apparel
plants. In Alabama, North Carolina, and South Carolina,
almost all the certifications in nonmetro counties
occurred in textiles or apparel, and a large number of
nonmetro certifications in Tennessee also took place in
apparel.
Two other regions with high concentrations of
nonmetro certifications were the Pacific Northwest and
the North Atlantic States. In the Pacific Northwest,
nonmetro certifications occurred primarily in lumber
and wood products (excluding furniture), while in the
North Atlantic region, they covered a more diverse set
of manufacturing industries, including textiles and
apparel, leather and leather products, paper products,
metal products, machinery, and electrical and electronic equipment.
Two smaller areas with substantial concentrations of
nonmetro certifications were New Mexico/Texas and
Kansas. Many certifications in these areas pertained to
mining or other extractive industries, although Texas
also featured a large number of apparel certifications. In
these areas, the vast majority of mining and miningrelated certifications took place under the TAA Program
and not under the NAFTA-TAA Program, so it is
unlikely that the economic developments associated
with these certifications are closely related to NAFTA.
Two nonmetro counties with very large numbers of
certifications deserve mention. First, Schuylkill
County, Pennsylvania had 36 certifications during
1994-98. Almost all of these certifications occurred in
textiles or apparel. Second, Williams County, North
Dakota, located in the Williston Basin Oil Field, had
The Effects of NAFTA on Agriculture and the Rural Economy / WRS-02-1 ✺ 33
Table E-3—Trade adjustment assistance program certifications, January 1994 - September 1999
The apparel industry had the most certifications
Industry
Nonmetro
Certifications
Rate1
Number
Agriculture, forestry, and fishing
Mining
Manufacturing-total
Food and kindred products
Tobacco products
Textile mill products
Apparel and other textile products
Lumber and wood products, except furniture
Furniture and fixtures
Paper and allied products
Printing, publishing, and allied industries
Chemicals and allied products
Petroleum refining and related products
Rubber and miscellaneous plastics products
Leather and leather products
Stone, clay, glass, and concrete products
Primary metal industries
Fabricated metal products
Industrial and commercial machinery, and
computer equipment
Electronic and other electrical equipment
Transportation equipment
Measuring, analyzing, controlling instruments
Miscellaneous manufacturing industries
Service sector and construction
Total
Metro
Certifications
Rate1
Percent
7
Number
0.03
5
Total U.S.
Certifications2
Rate1
Percent
Number
Percent
0.01
12
0.01
376
3.30
613
4.56
1,435
5.78
1,855
13
0
126
965
141
24
24
8
15
10
25
98
16
34
38
2.23
0.22
0.00
6.44
27.20
0.68
1.00
2.24
0.08
0.80
2.24
0.81
19.92
0.32
2.58
0.67
3,091
57
1
175
1,007
46
32
49
19
82
15
69
127
77
91
106
1.04
0.37
0.92
3.94
4.86
0.27
0.34
0.89
0.04
0.78
0.90
0.51
8.78
0.66
1.68
0.34
4,758
70
1
301
1,986
191
56
73
27
97
25
93
227
118
125
144
1.25
0.33
0.74
4.70
8.18
0.51
0.47
1.11
0.04
0.78
1.18
0.56
11.71
0.71
1.86
0.39
42
151
51
35
39
0.39
7.02
1.81
3.34
1.43
213
302
104
107
115
0.46
2.01
1.14
1.03
0.73
290
479
158
143
154
0.51
2.79
1.33
1.25
0.84
16
0.00
28
0.00
77
0.00
2,254
0.17
3,447
0.06
6,282
0.09
1TAA
certifications as a percentage of all establishments.
2Total U.S. includes certifications in nonmetro and metro counties, and also certifications for worker groups at companies whose location was listed as "all
locations," at companies certified in Puerto Rico, and at companies in cities that could not be identified as metro or nonmetro. Consequently, U.S. totals may
exceed the sum of the nonmetro and metro categories.
Source: Calculated by ERS using data from Employment and Training Administration, U.S. Department of Labor, and from Enhanced County Business
Patterns data, 1996.
25 certifications, all in mining or related industries and
all under the TAA Program.
ices. Table E-6 summarizes these certifications, as well
as those in the related industry of food processing.
Recent NAFTA-TAA Certifications. An examination of
NAFTA-TAA certifications for all counties (metro and
nonmetro) during 1998-2000 provides additional
insights into the distribution of recent certifications by
State and by industry. Hardly any NAFTA-TAA certifications have occurred in agricultural production and
services. This is largely due to the nature of the
program, which provides assistance to employees rather
than employers and business owners. Of the 1,188 certifications issued between 1998 and 2000, only six were
in agriculture (table E-5). Of the six certifications in
agriculture, four were in crop production, one was in
livestock production, and one was in agricultural serv-
Far more certifications during 1998-2000 were issued in
manufacturing industries related to agriculture. A total
of 546 certifications were issued in the agriculturerelated sectors identified in table E-5, and another 13
were issued in cases involving agriculture-related firms
in other sectors. About three-fourths of the agriculturerelated certifications occurred in two sectors: apparel
and other finished textile products (340 certifications),
and lumber and wood products (71 certifications).
Several States had more than 20 certifications in these
two sectors. In apparel, the States are Georgia (30),
North Carolina (54), Pennsylvania (27), Tennessee (32),
Texas (52), and Virginia (23). In lumber and wood products, Oregon had 35 certifications.
34 ✺ Effects of NAFTA on Agriculture and the Rural Economy / WRS-02-1
Economic Research Service, USDA
Table E-4—Trade adjustment assistance program certifications, January 1994 - September 1999
Nonmetro areas led metro areas in apparel certifications
Industry
Nonmetro
Certifications
Rate1
Number
Agriculture, forestry, and fishing
Mining
Manufacturing-total
Food and kindred products
Tobacco products
Textile mill products
Apparel and other textile products
Lumber and wood products, except furniture
Furniture and fixtures
Paper and allied products
Printing, publishing, and allied industries
Chemicals and allied products
Petroleum refining and related products
Rubber and miscellaneous plastics products
Leather and leather products
Stone, clay, glass, and concrete products
Primary metal industries
Fabricated metal products
Industrial and commercial machinery, and
computer equipment
Electronic and other electrical equipment
Transportation equipment
Measuring, analyzing, controlling instruments
Miscellaneous manufacturing industries
Service sector and construction
Total
Percent
9
0.04
Metro
Certifications
Rate1
Total U.S.
Certifications2
Rate1
Number
Percent
Number
Percent
10
0.01
19
0.02
16
0.14
17
0.13
58
0.23
658
4
0
26
270
100
6
17
4
7
1
15
26
8
8
22
0.79
0.07
0.00
1.33
7.61
0.48
0.25
1.59
0.04
0.37
0.22
0.48
5.28
0.16
0.61
0.39
995
25
0
44
259
30
16
24
12
28
1
38
28
27
28
68
0.33
0.16
0.00
0.99
1.25
0.18
0.17
0.44
0.02
0.27
0.06
0.28
1.94
0.23
0.52
0.22
1,663
29
0
69
531
134
22
41
16
35
2
53
55
35
36
91
0.44
0.14
0.00
1.08
2.19
0.36
0.18
0.62
0.03
0.28
0.09
0.32
2.84
0.21
0.54
0.25
19
78
27
14
6
0.18
3.63
0.96
1.33
0.22
60
164
52
57
34
0.13
1.09
0.57
0.55
0.22
79
244
79
72
40
0.14
1.42
0.66
0.63
0.22
9
0.00
36
0.00
52
0.00
692
0.05
1,058
0.02
1,792
0.03
1
NAFTA-TAA certifications as a percentage of all establishments.
2 Total U.S. includes certifications in nonmetro and metro counties, and also certifications for worker groups at companies whose location was listed as "all
locations," "various locations," or "throughout the state," and at companies in cities that could not be identified as metro or nonmetro. Consequently, U.S.
totals may exceed the sum of the nonmetro and metro categories.
Note: Many worker groups petition for and are certified under both the TAA and NAFTA-TAA Programs. Thus, the number of worker groups certified
under these programs cannot be added together. Approximately 75 percent of the worker groups certified under the NAFTA-TAA Program also are
certified under TAA.
Source: Calculated by ERS using data from Employment and Training Administration, U.S. Department of Labor, and from Enhanced County Business
Patterns data, 1996.
Textiles and Apparel: A Closer Look
The U.S. textile and apparel industries have experienced a deep economic restructuring over the past
several decades. Since the two industries are located
disproportionately in nonmetro counties and are
concentrated in the Southeast (fig. E-4), this process
has had a profound impact on a number of rural
communities, particularly in the Southeast. With
NAFTA and the implementation of multilateral trade
liberalization initiatives, these industries are likely to
experience further restructuring. This means that many
if not most dislocated textile and apparel workers who
Economic Research Service, USDA
find a new job will likely do so in another industry or
occupation.
NAFTA and the WTO's Agreement on
Textiles and Clothing
Substantial progress has been made in the liberalization of world textile and apparel trade over the last
decade and a half. At the regional level, the United
States joined with Canada and Mexico to establish
NAFTA, one of the largest free-trade areas in the
world. At the multilateral level, the Uruguay Round of
trade negotiations yielded the World Trade
Organization's Agreement on Textiles and Clothing
(ATC). Together, these reforms open the U.S. textile
The Effects of NAFTA on Agriculture and the Rural Economy / WRS-02-1 ✺ 35
Figure E-3
TAA and NAFTA-TAA certifications in nonmetro counties, 1994-98
Number of certifications
1 to 3
4 to 9
10 to 36
Metro counties
No certifications
Source: ERS calculations using data from the U.S. Department of Labor, Employment and Training Administration.
and apparel industries to greater competition, while
enabling the sectors to increase their competitiveness
by integrating more closely with the corresponding
industries in Canada and Mexico.
As part of NAFTA, Canada, Mexico, and the United
States are creating a duty-free, quota-free market for
textiles and apparel. To qualify for this enhanced
market access, items must be constructed from yarn
and fiber produced by a NAFTA country, in accordance with the agreement's rules of origin. The last
duties on qualifying textile and apparel trade between
Canada and the United States were eliminated on
January 1, 1998, following the 9-year transition period
specified by CFTA. Similarly, more than 90 percent of
qualifying U.S.-Mexico trade in textiles and apparel
was duty-free as of January 1, 1999, and the two countries are proceeding to eliminate the remaining duties
by January 1, 2003.
The ATC provides a definitive end to the quantitative
restrictions that have governed international trade in
textiles and apparel for over 30 years. Under the ATC,
the quantitative restrictions established by the MultiFiber Arrangement (MFA) and earlier agreements are
being eliminated gradually over the 10-year period that
ends on January 1, 2005. This phase-out contains two
parts: a four-stage process that eliminates the export
restraints contained in previously negotiated bilateral
agreements on products covered by the MFA, and
accelerated quota growth for products still under
restriction during the transition period. The ATC also
deals with other non-MFA restraints related to textiles
and clothing. With the elimination of these restrictions,
tariffs will become the primary mechanism for trade
protection in the textile and apparel industries.
NAFTA's Impact on U.S. Textile and
Apparel Trade
NAFTA's direct impact on U.S. textile and apparel
trade is difficult to quantify due to the lagged impact
of changes in Mexican trade policy during the 1980's,
the peso devaluation of December 1994, and structural
changes in Asian textile production and trade.
However, it is clear that Canada and Mexico's
combined share of U.S. textile and apparel trade has
36 ✺ Effects of NAFTA on Agriculture and the Rural Economy / WRS-02-1
Economic Research Service, USDA
Table E-5—NAFTA-TAA certifications by State and selected two-digit SIC codes, 1998-2000
Total
Agricultural
production
crops (01)
United States
1,188
Alabama
27
Alaska
3
Arizona
20
Arkansas
19
California
70
Colorado
15
Connecticut
12
Delaware
0
District of Columbia
0
Florida
23
Georgia
47
Hawaii
0
Idaho
14
Illinois
24
Indiana
30
Iowa
9
Kansas
5
Kentucky
22
Louisiana
7
Maine
14
Maryland
2
Massachusetts
18
Michigan
46
Minnesota
16
Mississippi
4
Missouri
28
Montana
5
Nebraska
2
Nevada
4
New Hampshire
5
New Jersey
31
New Mexico
4
New York
57
North Carolina
112
North Dakota
0
Ohio
22
Oklahoma
4
Oregon
57
Pennsylvania
104
Puerto Rico
1
Rhode Island
0
South Carolina
30
South Dakota
4
Tennessee
59
Texas
125
Utah
6
Vermont
1
Virginia
31
Washington
33
West Virginia
1
Wisconsin
32
Wyoming
10
See notes at end of table.
Economic Research Service, USDA
4
0
0
0
0
1
0
0
0
0
0
0
0
0
0
0
1
0
0
0
0
0
0
0
0
0
0
0
0
0
1
0
1
0
0
0
0
0
0
0
0
0
0
0
0
0
0
0
0
0
0
0
0
Agricultural
production
livestock (02)
1
0
0
0
0
0
0
0
0
0
0
0
0
0
0
0
0
0
0
0
0
0
0
0
1
0
0
0
0
0
0
0
0
0
0
0
0
0
0
0
0
0
0
0
0
0
0
0
0
0
0
0
0
Agricultural
services (07)
Food and
kindred
products (20)
1
0
0
0
0
0
0
0
0
0
0
0
0
0
0
0
0
0
0
0
0
0
0
0
0
0
0
0
0
0
0
0
0
0
0
0
0
0
1
0
0
0
0
0
0
0
0
0
0
0
0
0
0
20
0
0
1
0
0
0
0
0
0
0
0
0
0
1
0
0
0
0
0
1
0
1
3
1
0
0
0
0
0
0
1
0
1
2
0
0
0
1
1
0
0
0
0
1
2
0
0
1
1
0
1
0
Textile mill
products (22)
45
2
0
1
0
0
1
1
0
0
2
6
0
0
0
0
0
0
0
0
1
0
0
2
0
0
0
0
0
0
0
0
1
3
10
0
0
0
0
2
0
0
3
0
3
3
0
0
3
3
0
0
0
Apparel and
other textile
products (23)
340
20
0
3
4
15
3
2
0
0
10
30
0
0
1
2
1
1
8
4
0
0
4
2
1
2
10
0
0
0
0
3
0
9
54
0
3
0
3
27
0
0
19
0
32
52
2
0
23
3
1
5
1
Continued--
The Effects of NAFTA on Agriculture and the Rural Economy / WRS-02-1 ✺ 37
Table E-5—NAFTA-TAA certifications by State and selected two-digit SIC codes, 1998-2000--Continued
Lumber and
wood products (24)
United States
Alabama
Alaska
Arizona
Arkansas
California
Colorado
Connecticut
Delaware
District of Columbia
Florida
Georgia
Hawaii
Idaho
Illinois
Indiana
Iowa
Kansas
Kentucky
Louisiana
Maine
Maryland
Massachusetts
Michigan
Minnesota
Mississippi
Missouri
Montana
Nebraska
Nevada
New Hampshire
New Jersey
New Mexico
New York
North Carolina
North Dakota
Ohio
Oklahoma
Oregon
Pennsylvania
Puerto Rico
Rhode Island
South Carolina
South Dakota
Tennessee
Texas
Utah
Vermont
Virginia
Washington
West Virginia
Wisconsin
Wyoming
71
0
3
0
1
1
0
0
0
0
0
0
0
10
3
0
0
0
1
1
1
0
0
1
1
0
0
4
0
0
0
0
0
1
0
0
0
0
35
1
0
0
0
0
0
0
0
0
0
6
0
1
0
Furniture and
fixtures (25)
Paper and allied
products (26)
9
0
0
0
1
1
0
0
0
0
0
0
0
0
1
0
0
0
0
0
0
0
0
1
0
0
0
0
0
0
0
0
0
0
1
0
0
0
1
1
0
0
0
0
0
2
0
0
0
0
0
0
0
28
1
0
0
0
2
0
0
0
0
0
1
0
0
1
0
0
0
0
0
3
0
0
1
1
0
1
0
0
0
0
1
0
3
1
0
1
0
2
1
0
0
1
1
0
2
0
0
0
2
0
3
0
Leather and
leather products (31)
33
0
0
1
0
2
0
0
0
0
0
0
0
0
0
0
0
0
0
0
3
0
1
2
0
0
2
0
1
0
1
0
0
2
1
0
0
0
0
2
1
0
0
0
1
10
0
0
0
0
0
3
0
Other agricultureAll other
related certifications certifications
13
0
0
2
2
0
0
0
0
0
0
0
0
2
0
0
0
0
0
0
0
0
0
0
0
0
1
0
0
0
0
0
0
0
1
0
0
0
0
2
0
0
1
0
1
1
0
0
0
0
0
0
0
623
4
0
12
11
48
11
9
0
0
11
10
0
2
17
28
7
4
13
2
5
2
12
34
11
2
14
1
1
4
3
26
2
38
42
0
18
4
14
67
0
0
6
3
21
53
4
1
4
18
0
19
9
No certifications occurred in tobacco manufactures (21).
Source: U.S. Department of Labor, Employment and Training Administration.
38 ✺ Effects of NAFTA on Agriculture and the Rural Economy / WRS-02-1
Economic Research Service, USDA
Table E-6—NAFTA-TAA certifications in production
agriculture and food processing, 1998-2000
Certifications in production agriculture
Year
Firm's location
Product(s)
SIC
2000
New Mexico
Tomatoes
0161
1999
New Hampshire
Greenhouse
0181
1998
California
Iowa
Minnesota
Oregon
Tomatoes
Beans
Beef processing
Seedings
0161
0119
0211
0721
Certifications in food processing
Year
Firm's location
Product(s)
SIC
2000
Maine
Michigan
North Carolina
Tennessee
Texas
Potato chips
Cereal products
Pet treats
Stick candy
Beer
2096
2033
2047
2064
2083
1999
New Jersey
Minnesota
Ice cream products
Choline cloride (a Bcomplex vitamin used
for animal nutrition)
Beer
Distilled spirits
Beer
Beer
Potato chips
Beer
Instant tea
Beer
Beer
2024
Michigan
Michigan
North Carolina
Oregon
Pennsylvania
Texas
Virginia
Washington
Wisconsin
1998
Arizona
Illinois
Massachusetts
New York
Dry pasta
Beef carcasses
Canned fruit
Packaging frozen
fruits and vegetables
2048
2082
2085
2082
2082
2096
2082
2086
2082
2082
2099
2011
2037
2037
Source: U.S. Department of Labor, Employment and Training
Administration.
increased since the implementation of NAFTA, even as
the total value of this trade has continued to rise (figs.
5, 6). In 2000, Canada and Mexico supplied 18 percent
of U.S. textile and apparel imports, compared with 7
percent in 1993. With respect to exports, Canada and
Mexico accounted for 51 percent of the U.S. total in
2000, compared with 34 percent in 1993.
U.S. textile and apparel imports consist largely of
apparel items - 79 percent in 2000. Mexico supplied
14 percent of U.S. apparel imports in 2000, while the
countries and territories of the Caribbean Basin
Initiative (CBI) provided 16 percent.3 Apparel production is a labor-intensive activity and generally can be
carried out at lower cost outside the United States.
Economic Research Service, USDA
With NAFTA and CBI, the United States has exported
increasing amounts of apparel pieces, along with yarn
and fabric, to Mexico and CBI participants, where they
are assembled and returned to the United States as
finished apparel products. As a result, the export-toimport ratio for U.S. textile and apparel trade is
substantially larger for Mexico and CBI partners than
for the world as a whole. In 2000, this ratio equaled
0.60 for Mexico, 0.51 for the CBI, and 0.20 for the
entire world.
Looking Ahead
Through the 1990's, the U.S. textile and apparel industries have boosted their productivity at an average
annual rate of about 4 percent, twice the rate for all
non-durable manufactured goods industries. High
productivity growth, coupled with the other changes
discussed above, has led to declining employment in
the two sectors. DOL's Bureau of Labor Statistics projects that employment in these industries will decline
by an additional 20 percent over the 1998-2008 period
as a result of productivity increases in textiles and
import competition in apparel (Tomson, 2000).
Continued output growth is projected for both industries over the 10-year period.
The implementation of the ATC is likely to result in
the further restructuring of the two industries. Since
1990, a number of studies have suggested that
removing the MFA quotas would result in a decline in
either employment or output in the U.S. textile and
apparel industries ranging from 10 to 25 percent. The
projected impact of MFA quota removal varies
depending on assumptions regarding reciprocal liberalization by the less developed countries and the elasticity of substitution between imported and domestic
goods, among other factors.
Using a static, computable general equilibrium (CGE)
model of the world economy, Diao, MacDonald, Meyer,
and Somwaru (2000) suggest that U.S. textile production could fall slightly under the provisions of the ATC.
Mexico's production also falls under these circum3 The CBI was started in the 1980s to allow quota-free access for
selected countries in Central America and the Caribbean for products produced with U.S. fabric. Currently, 24 countries and territories participate in the CBI: Antigua and Barbuda, Aruba, Bahamas,
Barbados, Belize, British Virgin Islands, Costa Rica, Dominica,
Dominican Republic, El Salvador, Grenada, Guatemala, Guyana,
Haiti, Honduras, Jamaica, Montserrat, Netherlands Antilles,
Nicaragua, Panama, Saint Kitts and Nevis, Saint Lucia, Saint
Vincent and the Grenadines, and Trinidad and Tobago.
The Effects of NAFTA on Agriculture and the Rural Economy / WRS-02-1 ✺ 39
Figure E-4
Textile and apparel: Jobs in textile and apparel manufacturing as percentage of all jobs
in county, 1996
Southeastern counties are most dependent on textile and apparel manufacturing
20+ %
5 % to 19.99%
0.01% to 4.99%
None
Metro counties
Source: ERS calculations using County Business Patterns data.
Figure E-5
Figure E-6
U.S. textile and apparel exports, 1989-2000
U.S. textile and apparel imports, 1989-2000
$ billions
20
$ billions
18
70
80
16
60
14
12
50
World
10
World
40
8
30
Mexico
6
20
4
2
Canada
0
Canada
10
Mexico
0
1989
91
93
95
97
Source: Office of Textiles and Apparel, U.S. Department
of Commerce.
99
1989
91
93
95
97
99
Source: Office of Textiles and Apparel, U.S. Department
of Commerce.
40 ✺ Effects of NAFTA on Agriculture and the Rural Economy / WRS-02-1
Economic Research Service, USDA
stances—Asian exporters gain export share once global
liberalization reduces the preference that countries such
as Mexico currently receive under regional trade agreements. Clothing production in Southeast Asia is estimated 10 percent higher and production in China is
estimated 12 percent higher. Mexico is the only developing country where clothing production falls in this
simulation. Production changes for both the United
States and the rest of North America estimated in this
simulation are less than 1 percent.
The simulation mentioned above assumes that China is
a member of the WTO, but the exact date of China's
WTO accession is still under negotiation. According to
the U.S. International Trade Commission (ITC),
China's accession will have little net effect on the U.S.
textile and apparel industries. Compared with a nonaccession scenario, the main effects of accession
would be to increase the share of U.S. imports from
China and to reduce the share from other countries,
particularly less developed countries in Asia. The ITC
indicates that China's accession would reduce U.S.
clothing output by about 1 percent and U.S. textile
output by about 0.5 percent. An analysis of how these
production changes might affect employment - using
an input-output model at the DOL - suggests that additional U.S. job losses from including China in the
WTO could total 6,100 jobs in the apparel industry
and 2,100 in the textile industry. These reductions are
small compared with the changes that occurred during
the last half of the 1990's.
Conclusion
By increasing export opportunities and improving
economic efficiency, NAFTA has likely had a small,
positive influence on U.S. employment in agriculture
and in manufacturing industries related to agriculture.
However, only a few of these sectors have experienced
substantial changes in their employment levels since
NAFTA's implementation, and many of these changes
are driven by factors other than the agreement.
Employment in crop production has changed relatively
little, while employment in livestock production has
decreased, reflecting technological change and consolidation in the hog industry and drought and poor
ranging conditions in the cattle industry. Employment
in landscaping and horticultural services and in veterinary services increased substantially during the 1990's,
but this growth is most likely due to factors other than
NAFTA, such as consumer preferences and the
strength of the U.S. economy.
Economic Research Service, USDA
Two manufacturing sectors related to agriculture textiles and apparel - have experienced a decline in
employment that is connected to NAFTA. This reduction reflects a long-term process of economic restructuring that was well underway prior to the agreement.
Still, by fostering the development of a more integrated textile and apparel industry within North
America, the agreement has been accompanied by
expanded textile and apparel trade among the NAFTA
countries, increased productivity in the U.S. textile and
apparel sectors, and further reductions in U.S. textile
and apparel employment. To assist workers who are
displaced by international trade, the Federal
Government operates the NAFTA Transitional
Adjustment Assistance (NAFTA-TAA) and the Trade
Adjustment Assistance (TAA) Programs. Such assistance should prove to be particularly important in the
near future as the U.S. textile and apparel industries
adapt to the more liberalized trading environment
created by NAFTA and the World Trade Organization's
Agreement on Textiles and Clothing.
Karen S. Hamrick (202-694-5426,
[email protected]), Stephen A. MacDonald
(202-694-5305, [email protected]), Leslie A.
Meyer (202-694-5307, [email protected]), and
Steven Zahniser (202-694-5230,
[email protected])
References
Diao, Xinshen, Stephen MacDonald, Leslie Meyer,
and Agapi Somwaru. “Ending the Multifiber
Arrangement: A CGE Analysis.” Presentation given
at the Cotton Economics and Marketing Association
Conference, National Cotton Council, Memphis,
Tennessee, January 30, 2000.
Green, Paula L. “Mexico passes China in textile
exports to the United States.” Journal of Commerce,
February 24, 1999, pp. A1 and A3.
Gustafson, Ron. “Decline in Cattle Inventory to
Continue.” Agricultural Outlook (October 2000), p.
2, <http://www.ers.usda.gov/publications/agoutlook/oct2000/ao275a.pdf>.
Hamrick, Karen S., Stephen A. MacDonald, and Leslie
A. Meyer. “International Trade Agreements Bring
Adjustment to the Textile and Apparel Industries.”
Rural Conditions and Trends, Vol. 11, No. 1 (2000),
pp. 31-41,
The Effects of NAFTA on Agriculture and the Rural Economy / WRS-02-1 ✺ 41
<http://www.ers.usda.gov/publications/rcat/rcat111/
rcat111f.pdf>.
Mathews, Kenneth H., Jr., William F. Hahn, Kenneth
E. Nelson, Lawrence A. Duewer, and Ronald A.
Gustafson. U.S. Beef Industry: Cattle Cycles, Price
Spreads, and Packer Concentration. USDA/ERS,
Market and Trade Economics Division, Technical
Bulletin 1874, April 1999,
<http://www.ers.usda.gov/publications/tb1874/>.
Thomson, Allison. “Industry output and employment
projections to 2008.” In U.S. Department of Labor,
Bureau of Labor Statistics, Monthly Labor Review,
Vol. 112, No. 11 (November 1999), pp. 33-50.
Reprinted with corrections, March 2000,
<http://www.bls.gov/opub/mlr/1999/11/art4full.pdf>.
U.S. Department of Agriculture, National Agricultural
Statistics Service (NASS). 1997 Census of
Agriculture: United States Summary and State
Data. Volume 1, Geographic Area Series, Part 51.
AC97-A-51, March 1999,
<http://www.nass.usda.gov/census/census97/volume
1/us-51/toc97.htm>.
U.S. Department of Commerce, Office of Textiles and
Apparel. “U.S. Imports of Total Imports of MFA
Fibers.” Downloaded from
<www.otexa.ita.doc.gov/scripts/tqquantity.exe/runqu
ery?cat=0>, May 17, 2001.
U.S. Department of Labor (DOL), Bureau of Labor
Statistics (BLS). Employment and Earnings, various
issues, 1989 to 2001.
_____. “Labor Force Statistics from the Current
Population Survey,” <http://146.142.4.24/cgibin/srgate>, downloaded 5 March 1999.
_____. “Productivity and Costs: Manufacturing
Industries, 1990-99.” News release USDL 01-141,
May 15, 2001,
<http://www.bls.gov/pdf/iprm0501.pdf>.
U.S. Department of Labor, Employment and Training
Administration. “U.S. Department of Labor
Employment and Training Administration Fact
Sheet,” <http://www.doleta.gov/programs/
factsht/nafta.htm>, downloaded March 15, 2001.
42 ✺ Effects of NAFTA on Agriculture and the Rural Economy / WRS-02-1
Economic Research Service, USDA
NAFTA, Agricultural Trade,
and the Environment
Introduction
Over seven years after its implementation, NAFTA
remains unique in that it is the only trade agreement to
address environmental concerns explicitly in an
accompanying agreement. This accord, known as the
North American Agreement on Environmental
Cooperation (NAAEC), outlines environmental objectives, such as the promotion of sustainable development, enhancing compliance with and enforcement of
environmental laws and regulations, and promoting
policies and practices to prevent pollution.
The existing literature about the environment, international trade, and economic development suggests that
the economic development fostered by trade liberalization offers the prospect for substantial environmental
improvement over the long run, especially for lessdeveloped countries such as Mexico. In the short run,
NAFTA is likely to have a combination of positive and
negative effects on the environment, as producers
select alternative techniques of production, increase or
decrease the scale of production, and modify the crop
and animal composition of their agricultural activities.
In addition, the expansion of trade within North
America is associated with increased traffic, congestion, and air pollution along certain transportation
corridors. Ongoing investments in infrastructure offer
the promise of alleviating these problems.
The Environmental Impact of Trade
Liberalization: Theory and Evidence
Economic theory tells us that trade liberalization
increases wealth. Moreover, wealthier countries tend to
be more willing and able to channel resources into
environmental protection and to have higher environmental standards. Thus, a diverse set of environmental
standards across countries should be expected to
persist due to differences in country-specific attributes
such as per capita income (Bhagwati, 1996). As long
as per capita incomes vary across countries, diverse
environmental preferences are likely to persist.
Higher income countries have greater resources to
allocate not just towards consumer goods but also
Economic Research Service, USDA
towards pollution abatement. As such, freer trade and
differential environmental preferences may result in
the export of some pollution problems from developed
countries (DC's) to less-developed countries (LDC's),
as the latter group specializes in more pollution-intensive industries (Copeland and Taylor, 1994).
Nonetheless, trade-induced increases in per capita
income should create conditions under which all countries, including the LDC's, freely choose strengthened
environmental standards.
Even if trade-induced income growth ultimately
strengthens environmental regulations and enforcement, this begs the question of how trade liberalization
affects short- and long-run environmental outcomes. In
order to understand the economic processes underlying
these outcomes, it is useful to decompose the environmental impact of trade liberalization into three general
categories — a technique effect, a scale effect, and a
composition effect (Cole, Rayner, and Bates, 1998):
Technique Effect. All else being equal,
increasing per capita income tends to result in
calls for increased regulation mandating cleaner
technologies. Trade liberalization thus may
have a technique effect as producers alter
production methods to adopt either cleaner or
dirtier production technologies.
Scale Effect. Empirical evidence has long
linked open economies to economic growth
(Edwards, 1992; Harrison, 1996). Increased
output and scale of production resulting from
trade liberalization, however, may generate
additional pollution emissions and accelerate
the depletion of natural resources.
Composition Effect. Trade liberalization may
also affect the composition of output produced
in an economy, as resources formerly devoted
to protected inefficient industries will be
utilized elsewhere.
These three effects may interact to create an invertedU relationship between income and pollution. Named
in honor of Simon Kuznets, who proposed a similar
relationship between income and income inequality,
The Effects of NAFTA on Agriculture and the Rural Economy / WRS-02-1 ✺ 43
this hypothetical relationship is known as the environmental Kuznets curve (EKC) (World Bank, 1999). The
argument is that when a country develops from an
initially low level of income, the scale effect dominates, as there is increased demand for all inputs,
including using the environment as a sink for waste.
Rising incomes, however, increase the willingness to
pay for environmental amenities. Regulations are
enacted, forcing a shift to cleaner production
processes, as the technique effect reduces harmful
emissions and environmental damage. As resources are
shifted out of protected polluting industries and rising
incomes shift preferences to cleaner goods, the composition and technique effects eventually dominate the
scale effect.
Figure F-1 illustrates this phenomenon in a stylized
EKC for NAFTA countries. Although Stern, Common,
and Barbier (1996) criticize the estimation and usefulness of the EKC, Grossman and Krueger (1995) provide
empirical support of this hypothesis. They find that, for
most pollutants, mean air and water concentrations
increase as per capita GDP initially increases from a
low level of income, but that concentrations begin to
decline before per capita GDP reaches $8,000 in 1985
dollars. Expressed in 1985 dollars, Mexican per capita
GDP was $3,124 in 1999, while Canadian and U.S. per
capita GDP were $14,173 and $22,456, respectively.1
Given that the per capita GDP's of the NAFTA countries
cover a broad range, it is likely that the three countries
lie along different points on the EKC.
Trade Liberalization and Agriculture:
Empirical Evidence
Only a few empirical studies specifically examine the
environmental effects of agricultural trade liberalization, and even fewer studies focus on the NAFTA
countries. While drawing general conclusions is difficult and speculative, the existing research does provide
a few insights.
First, the relative importance of agricultural
externalities2 may differ according to a country's level
of per capita income. For example, the prevalence of
1 To express per capita GDP for 1999 in 1985 dollars, GDP data
from World Bank (2001) were deflated using the implicit price
deflator from U.S. Department of Commerce, Bureau of Economic
Analysis (2001).
2 An externality is a "cost or benefit that falls on third parties and
is therefore ignored by the two parties to a market transaction"
(McEachern, 1997, p. 523).
Figure F-1
Stylized environmental Kuznets curve
Level of pollutant
1.2
1.0
0.8
0.6
0.4
0.2
0
0
3,000
6,000
9,000
12,000
Per capita GDP (in 1985 dollars)
15,000
Source: Economic Research Service, USDA.
extensive methods of agricultural production, in which
output is increased by expanding the area planted,
possibly to marginal lands, may be greater in poorer
countries. In contrast, higher-income countries may be
more likely to employ intensive methods, in which
output is increased by expanding the use of inputs other
than land.
Extensive and intensive methods are associated with
different types of externalities. For example, soil erosion
may be a relatively more important externality for
extensive agriculture while nutrient and pesticide runoff
is relatively more important under intensive agricultural
practices. Agricultural trade liberalization may affect the
overall level of environmental degradation, but it may
also cause shifts between types of effects.
The intensities of fertilizer and tractor utilization are
often thought to be indicative of the intensity of agricultural production. Interestingly, fertilizer usage has
increased in both Canada and the United States since
the implementation of the Canada-U.S. Free Trade
Agreement (CFTA) in 1989, which suggests that agriculture is becoming more intensive in these two countries (fig. F-2). In contrast, fertilizer usage in Mexico
has changed very little since NAFTA's implementation
in 1994, except for a precipitous drop in fertilizer usage
in 1995, on the heels of the peso crisis of December
1994. With respect to tractor utilization, there have been
no major changes among the three NAFTA countries
during the CFTA-NAFTA period (fig. F-3). However,
44 ✺ Effects of NAFTA on Agriculture and the Rural Economy / WRS-02-1
Economic Research Service, USDA
these data do not account for changes in input quality
such as tractor size and fertilizer type.
Recent analysis by the OECD (2000) indicates that
trade liberalization would cause agricultural prices to
decline in countries that historically have pursued
chemical-intensive agriculture. Lower output prices
decrease the incentive to apply costly inputs, so environmental stress from pesticide runoff and ground-
Figure F-2
Fertilizer usage in the NAFTA countries, 1985-98
Metric tons of fertilizer per 1,000 hectares
120
United States
100
80
Mexico
60
40
Canada
20
0
1985
87
89
91
93
95
97
Source: Food and Agriculture Organization of the United Nations
(2001). For each country, total fertilizer consumption is divided
by the total amount of land devoted to arable and permanent
crops.
Figure F-3
Tractor utilization in the NAFTA countries, 1985-98
Number of tractors in use per 1,000 hectares
30
United States
20
Canada
15
10
Mexico
5
0
87
89
91
93
95
The North American Agreement on
Environmental Cooperation
97
Source: Food and Agriculture Organization of the United Nations
(2001). For each country, tractor utilization is divided by the total
amount of land devoted to arable and permanent crops.
Economic Research Service, USDA
A number of researchers have employed sophisticated
economic models to predict the environmental consequences of trade liberalization on agriculture in North
America. For example, a detailed general equilibrium
study of 22 agricultural sub-sectors in Mexico indicates that unilateral trade liberalization by Mexico
would decrease both agricultural output and pollution,
as measured by 13 indicators of water, air, and soil
effluents. Overall Mexican real GDP, however,
increases significantly (Beghin, Dessus, Roland-Holst,
and van der Mensbrugghe, 1997). Using a partial equilibrium model (a simplified model that presumes no
income effects due to price changes) in conjunction
with econometric analysis, Williams and Shumway
(2000) evaluate the impact of NAFTA, economic
growth, research investment, and farm policy. Real
farm income is projected to increase in both the United
States and Mexico, and dramatically so in the latter.
Unlike previous studies, Williams and Shumway's
input and output elasticity estimates lead to predictions
that U.S. and Mexican fertilizer usage will increase
substantially. In addition, their model predicts that
U.S. pesticide usage will increase, while Mexico's
pesticide usage will fall.
In recognition of the potential benefits from the coordination of trade and environmental policies, the North
American Agreement on Environmental Cooperation
(NAAEC) was negotiated in 1993 as a side agreement
to NAFTA. The NAAEC encourages and facilitates
sound domestic environmental policies in conjunction
with trade liberalization. In addition, it created the
Commission for Environmental Cooperation (CEC),
which promotes environmental objectives such as
sustainable development and pollution abatement
while encouraging “win-win” opportunities for both
trade and the environment.
25
1985
water contamination would be relieved in those countries. Conversely, in countries that are better able to
accommodate increased agricultural intensity because
pesticide and fertilizer usage historically has been low,
there should be increased rates of chemical application. On the other hand, the externalities associated
with extensive methods of production may decrease.
The CEC provides numerous opportunities for environmental organizations and other stakeholders to
voice their concerns to policymakers. A recent
The Effects of NAFTA on Agriculture and the Rural Economy / WRS-02-1 ✺ 45
example is the symposium entitled “Understanding the
Linkages between Trade and Environment,” held on
October 11-12, 2000 in Washington, D.C.3 By bringing
environmental concerns before policymakers, these
gatherings facilitate the coordination of trade and environmental policies and lessen potential conflicts
between the two.
In addition to soliciting public input at symposia, the
CEC reviews submissions from interested parties who
claim that a NAFTA country is failing to enforce its
environmental law. Although the CEC has no authority
to force compliance, it may develop and publish a
factual record if warranted in order to encourage
reform. Submissions currently under review include an
allegation that Mexico has failed to enforce its environmental laws that would have prevented a shrimp
farm from, among other things, introducing a species
of shrimp that spread disease to other fishery
resources. The NAAEC also permits each NAFTA
country to challenge the environmental enforcement
effectiveness of any other NAFTA country before an
arbitral panel that possesses the authority to impose
monetary penalties. However, the actions that may be
challenged are restricted to those characterized by a
“persistent pattern” of non-enforcement. Furthermore,
a member country will not be liable if the nonenforcement results from “bona fide decisions to allocate resources to enforcement in respect of other
environmental matters determined to have higher
priorities” (NAAEC). Though no suit has yet been
brought before the arbitral panel, the NAAEC remains
unique among trade agreements in its provision
allowing one member country to challenge the effectiveness of another member country's environmental
protections. Any assessments that levied would be paid
into a fund established in the name of the CEC and
expended to improve the environmental quality of the
country complained against.
The CEC also conducts original research on the environmental effects of NAFTA. In particular, two of the
CEC's three case studies examining the environmental
impacts of NAFTA-induced changes in market structure
focus on agriculture. By definition, case studies are not
comprehensive works, but the topics were chosen
because of a priori beliefs that these subjects have a
strong relationship to NAFTA and the environment.
3
Materials from the symposium are available at
<http://www.cec.org/symposium/index.cfm>.
One agricultural case study examines feedlot production of cattle. It finds that trade liberalization under
NAFTA has reinforced existing patterns of comparative advantage and concentrated the feedlot sector into
larger operations in Kansas and southern Alberta.
Although this concentration has the potential to cause
nitrate contamination of groundwater because waste
management problems are more severe on larger feedlots, this development may have a positive net environmental outcome. Specifically, there may be economies
of scale in waste treatment facilities, and larger, more
visible firms are more likely to adopt state-of-the-art
technology in anticipation of government inspection
and enforcement (Runge and Fox, 1999).
The other agricultural case study concerns Mexican
corn production (Nadal, 1999). As corn producers in
Mexico adjust to changing price dynamics, their
responses could generate important environmental
effects. Potential responses include the modernization of
production techniques or the substitution of corn for
other crops. Modernization involves capital-intensive
production technologies such as irrigation, the intensive
use of agro-chemicals, and the heavy use of mechanized
equipment. Many of these technologies are water-intensive. Thus, their adoption could place increased pressure
on water resources. Similarly, soil quality may be
affected by more intense tillage practices.
On the other hand, a shift from corn to feed grains
such as sorghum or barley may have positive environmental outcomes, as plowing and water usage could
decrease. Since the implementation of NAFTA, total
area harvested in Mexico has remained fairly stable,
but the area devoted to sorghum production has
reached record levels and the area devoted to barley
has increased slightly (fig. F-4). These increases in
feed grains, however, have not come at the expense of
corn production, which has fluctuated due to a series
of droughts. Trade liberalization undoubtedly reinforces a shift to crops in which a country possesses a
comparative advantage, but predicting this shift and
its environmental impact poses a significant challenge. In the case of sorghum, the increase in area
planted may have been driven by increased livestock
production in Mexico.
Modernization may also involve the adoption of
biotechnologies that reduce the need for pesticides and
thus generate positive environmental outcomes.
However, the study indicates some loss of genetic
diversity, as farmers shift from local varieties of corn
46 ✺ Effects of NAFTA on Agriculture and the Rural Economy / WRS-02-1
Economic Research Service, USDA
20, 1998, after its manufacturer, Ethyl Corporation,
filed a suit against the Canadian government under
NAFTA's Chapter 11 provisions on investment
(Baker & McKenzie, 1998). Although no Chapter 11
case has directly involved agriculture, the ongoing
debate concerning the environmental and health
impacts of genetically modified organisms suggests
that this possibility is not implausible.
Figure F-4
Area harvested in Mexico of barley, corn,
and sorghum, 1989-2000
1,000 hectares
10,000
8,000
Corn
6,000
4,000
Sorghum
2,000
Barley
0
1989
91
93
95
97
99
Source: Food and Agriculture Organization of the United Nations
(2001).
to hybrids with higher yields. This loss has been
limited by heterogeneous soil qualities, climates, and
local pests, which degrade the performance of highyield hybrids. Although the case study focuses on the
environmental impacts of potential responses by
Mexican corn producers, the incentives for crop substitution and the intensification of production practices
would likely apply to many other crops as well.
Environmental Concerns: The Effects
of Trade and NAFTA's Rules
Some environmental groups have argued that
NAFTA's rules on investment, as specified in Chapter
11 of the agreement, are flawed. With a few exceptions, Article 1110 of Chapter 11 prohibits each
NAFTA country from “directly or indirectly taking
any actions that nationalize or expropriate the investment of an investor” from another NAFTA country.
Fourteen environmental groups have criticized these
rules and argued against the adoption of similar
language in other multilateral agreements (Downs,
1999). Their concern is that NAFTA's rules allowing
firms to sue member governments for compensation
for “expropriation of an investment” limit a country's
ability to enact and enforce strict environmental laws.
A frequently cited case involves the Canadian
government's revocation of restraints imposed on the
importation and trade of MMT (methylcyclopentadienyl manganese tricarbonyl), a U.S.-made, allegedly
toxic, gas additive. The revocation was made on July
Economic Research Service, USDA
A related concern is that trade liberalization creates an
incentive for countries to lure capital by lowering environmental standards, which in turn may cause other
countries to respond in kind. In contrast to the static
concept of “pollution havens,” this dynamic process is
commonly referred to as the “race-to-the-bottom”
hypothesis. According to the existing (albeit limited)
empirical work, NAFTA has not encouraged a general
weakening of environmental standards (Fredriksson
and Millimet, 2000).
Another concern is that increased agricultural trade
among the NAFTA countries may increase the risk of
introducing harmful non-indigenous species (HNIS)
and diseases to new countries and new geographic
areas. An estimated 40 percent of the insect-pest
species (e.g. Russian wheat aphids and Asian
Gypsy moths) afflicting U.S. agriculture and 50-75
percent of the weed species (e.g. knapweeds and
cheatgrass/medusahead) are not indigenous to the
United States (U.S. Congress, 1995).
The costs of HNIS are undoubtedly significant, in
terms of increased pesticide expenditures and altered if
not irrevocably damaged ecosystems. However, the
difficulty in measuring these costs makes it extremely
challenging to determine what standards should be set
for import screening. A standard of “zero entry” would
be prohibitively expensive, while standards that are too
lax could expose individual agricultural producers and
the natural environment to unacceptable risks. Of
course, HNIS can be introduced via non-agricultural
trade and tourism as well.
To safeguard against HNIS, USDA's Animal and Plant
Health Inspection Service (APHIS) operates agricultural quarantine inspections at international airports,
seaports, and border stations. The important policy
question then is whether current inspection standards
and devoted resources are appropriate given the
increasing level of trade among the NAFTA countries.
Agricultural trade is a significant component of overall
NAFTA trade, and increased international commerce
The Effects of NAFTA on Agriculture and the Rural Economy / WRS-02-1 ✺ 47
likely involves increased transportation and fuel usage.
Thus, expanded agricultural trade may contribute to
increased emissions of pollutants. Economic integration often is concentrated in a few border corridors,
resulting in hotspots of localized environmental stress,
such as the high traffic areas in and around Laredo,
Texas, and Detroit, Michigan (Sierra Club and
Holbrook-White, 2000). A recent study of the border
corridors of Vancouver-Seattle, Winnipeg-Fargo,
Toronto-Detroit, San Antonio-Monterrey, and TucsonHermosillo concludes that NAFTA trade “contributes
significantly to air pollution” in all five corridors (ICF
Consulting, 2001: iv). The study identifies many
opportunities to address these problems, including the
use of cleaner-burning fuels and the alleviation of
delays in border crossings through policy changes and
investments in infrastructure.
certain issues. For example, agricultural exporters can
take actions to reduce the probability that HNIS will
be introduced to new areas.
Although real challenges lie ahead, the North
American Agreement on Environmental Cooperation
(NAAEC) positions NAFTA as the most environmentally sensitive trade agreement to date. Since trade
liberalization generally improves allocative efficiency
and raises per capita incomes, the long-run prospects
for environmental progress in all three NAFTA countries are generally positive.
R. Wesley Nimon (202-694-5605,
[email protected]), Joseph Cooper (202-6945482, [email protected]), and Mark Smith
References
Conclusion
Agricultural trade liberalization under NAFTA is likely
to have affected the environment in a variety of ways,
some positive and others negative. As Canada, Mexico,
and the United States continue to integrate economically, it is highly probable that there will be further
composition effects, as price incentives concentrate
industries in areas possessing a comparative advantage. Crop substitution, technological modernization,
importation of harmful, non-indigenous species
(HNIS), increased use of transportation, and the development of environmentally friendly products are other
examples in which the expanded agricultural trade
associated with NAFTA could have positive or negative effects on the environment.
Assuming that increased trade contributes to rising
future incomes, there is every reason to believe that an
increasing willingness to pay for environmental amenities will translate in the long run into increasingly
stringent domestic environmental regulations and
enforcement. As this process unfolds, the North
American Commission for Environmental Cooperation
(CEC) provides concerned individuals and organizations with new opportunities to raise environmental
issues that policymakers might have otherwise overlooked. These activities facilitate the coordination of
domestic environmental polices with trade-induced
changes in environmental stress. Equally useful is that
the activities organized by the CEC engage civil
society in discussions of complicated transboundary
issues that require international cooperation. Such
cooperation could prove to be crucial in addressing
Baker & McKenzie. “The Clash Between Trade and
the Environment. Ethyl's NAFTA Chapter 11
Investor-State Challenge.” Legal brief, 1998.
<http://www.bakerinfo.com/documents/771_tx.htm>.
Beghin, John, Sebastien Dessus, David Roland-Holst,
and Dominique van der Mensbrugghe. “The Trade
and Environment Nexus in Mexican Agriculture. A
General Equilibrium Analysis.” Agricultural
Economics, Vol. 17, No. 2-3 (December 1997),
pp. 115-131.
Beghin, John, David Roland-Holst, and Dominique
van der Mensbruggle. “Trade Liberalization and the
Environment in the Pacific Basin: Coordinated
Approaches to Mexican Trade and the Environment
Policy.” American Journal of Agricultural
Economics, Vol. 77, No. 3 (August 1995),
pp. 778-785.
Bhagwati, Jagdish. “Trade and the Environment:
Exploring the Critical Linkages.” In Maury E.
Bredahl, Nicole Ballenger, John C. Dunmore, and
Terry R. Roe (eds.), Agriculture, Trade, and the
Environment: Discovering and Measuring the
Critical Linkages (Boulder and London:
HarperCollins, Westview Press, 1996), pp. 13-22.
Cole, M.A., A.J. Rayner, and J.M. Bates. “Trade
Liberalisation and the Environment: The Case of the
Uruguay Round.” The World Economy Vol. 21, No.
3 (May 1998), pp. 337-347.
Commission for Environmental Cooperation (CEC).
“Potential NAFTA Effects: Claims and Arguments
48 ✺ Effects of NAFTA on Agriculture and the Rural Economy / WRS-02-1
Economic Research Service, USDA
1991-1994.” 1996. <http://www.cec.org/pubs_info_
resources/publications/pdfs/english/claimse.pdf>.
Copeland, Brian R., and M. Scott Taylor. “NorthSouth Trade and the Environment.” The Quarterly
Journal of Economics, Vol. 109, Issue 3, No. 438
(August 1994), pp. 755-787.
Downs, David. “Technical Statement by the United
States Environmental Organizations.” Letter and
report sent to Deputy U.S. Trade Representative,
Ambassador Susan G. Esserman, and Acting
Deputy Administrator, U.S. Environmental
Protection Agency, Peter D. Robertson by David
Downs on behalf of 14 Environmental NGO's, June
16, 1999. Reprinted by the Sierra Club.
<http://www.sierraclub.org/trade/summit/letter.asp
and
http://www.sierraclub.org/trade/summit/report.asp>.
Edwards, Sebastian. “Trade Orientation, Distortions,
and Growth in Developing Countries.” Journal of
Development Economics, Vol. 39, No. 1 (July
1992), pp. 31-57.
Food and Agriculture Organization (FAO) of the
United Nations. “FAOSTAT Agriculture Data.”
Downloaded from < http://apps.fao.org/page/collections?subset=agriculture>, April 30, 2001.
Fredriksson, Per G., and Daniel Millimet. “Is There a
Race to the Bottom in Environmental Policies? The
Effects of NAFTA.” Paper presented at the
Commission for Environmental Cooperation's North
American Symposium on Understanding the
Linkages between Trade and Environment.
Washington, D.C., October 11-12, 2000.
<http://www.cec.org/programs_projects/trade_envir
on_econ/pdfs/Fredrik.pdf>.
Grossman, Gene M., and Alan B. Krueger. “Economic
Growth and the Environment.” The Quarterly
Journal of Economics, Vol. 110, No. 2 (May 1995),
pp. 353-77.
Harrison, Ann. “Openness and Growth: A Time-Series,
Cross-Country Analysis for Developing Countries.”
Journal of Development Economics Vol. 48, No. 2
(March 1996), pp. 419-447.
ICF Consulting. “North American Trade and
Transportation Corridors: Environmental Impacts
and Mitigation Strategies.” Paper prepared for the
North American Commission for Environmental
Cooperation, February 21, 2001.
Economic Research Service, USDA
<http://www.cec.org/programs_projects/pollutants_health/trinational/corridors-e.pdf>.
McEachern, William A. Microeconomics: A
Contemporary Introduction. Cincinnati, Ohio:
South-Western College Publishing, 1997.
Nadal, Alejandro. “Maize in Mexico: Some
Environmental Implications of the North American
Free Trade Agreement.” In Assessing Environmental
Effects of the North American Free Trade
Agreement (NAFTA): An Analytic Framework
(Phase II) and Issue Studies. Communications and
Public Outreach Department, Commission for
Economic Cooperation Secretariat, 1999.
<http://www.cec.org/pubs_info_resources/publications/pdfs/english/engmaize.pdf>.
North American Agreement on Environmental
Cooperation (NAAEC). 1993.
<http://www.cec.org/pubs_info_resources/law_treat
_agree/naaec/index.cfm?varlan=english>.
Runge, C. Ford, and Glenn Fox. “Feedlot Production
of Cattle in the United States and Canada: Some
Environmental Implications of the North American
Free Trade Agreement.” In Assessing Environmental
Effects of the North American Free Trade
Agreement (NAFTA): An Analytic Framework
(Phase II) and Issue Studies. Communications and
Public Outreach Department, Commission for
Economic Cooperation Secretariat, 1999.
<http://www.cec.org/pubs_info_resources/publications/pdfs/english/engfeed.pdf>.
Sierra Club and Shelia Holbrook-White. “NAFTA
Transportation Corridors: Approaches to Assessing
Environmental Impacts and Alternatives.” Paper
presented at the North American Symposium on
Understanding the Linkages between Trade and
Environment, Washington, D.C., October 11-12,
2000. <http://www.cec.org/programs_
projects/trade_environ_econ/pdfs/sierra.pdf>.
Stern, David, Michael Common, and Edward Barbier.
“Economic Growth and Environmental
Degradation: The Environmental Kuznets Curve
and Sustainable Development.” World Development,
Vol. 24, No. 7 (July 1996), pp. 1151-1160.
U.S. Congress, Office of Technology Assessment.
Agriculture, Trade, and Environment: Achieving
Complementary Policies, OTA-ENV-617.
Washington, D.C.: U.S. Government Printing
Office, May 1995.
The Effects of NAFTA on Agriculture and the Rural Economy / WRS-02-1 ✺ 49
U.S. Department of Commerce, Bureau of Economic
Analysis. “Table 3.—Price Indexes for Gross
Domestic Product and Gross Domestic Purchases.”
Survey of Current Business (August 2000), p. 132.
<http://www.bea.doc.gov/bea/ARTICLES/NATIONA
L/NIPA/2000/0800gdp.pdf>.
Williams, Shon P., and C. Richard Shumway. “Trade
Liberalization and Agricultural Chemical Use:
United States and Mexico.” American Journal of
Agricultural Economics, Vol. 82, No. 1 (February
2000), pp. 183-199.
World Bank. Greening Industry: New Roles for
Communities, Markets, and Governments. A World
Bank Policy Research Report. New York: Oxford
University Press, Inc., 1999.
_____. “GNI per capita 1999, Atlas method and PPP.”
Table from 2001 World Development Indicators database, April 11, 2001. <http://www.worldbank.org/
data/databytopic/GDP.pdf>.
50 ✺ Effects of NAFTA on Agriculture and the Rural Economy / WRS-02-1
Economic Research Service, USDA
Modal Choices in the Transportation of
U.S.-Mexico Agricultural Trade
Delays Accompany Growth
in U.S.-Mexico Trade
Between 1995 and 2000, U.S.-Mexico trade of all
types more than doubled to $247 billion, with over 4.2
million truck border crossings in 1999. In 2000,
Mexico was the fourth largest market for U.S. agricultural exports ($6.5 billion) and the third largest source
of agricultural imports ($5.1 billion). However, greatly
increased volumes have been accompanied by significant border congestion, especially for trucks at principal ports of entry. Delays can range from several
hours to a full day or more.
Congestion is exacerbated by the way in which truck
cargoes now move across the U.S.-Mexico border.
NAFTA's architects envisioned a transportation system
in which trucks from each NAFTA country would be
able to move freely within the three-country region.
Canadian and U.S. trucks are allowed to move
anywhere within Canada and the United States. In
contrast, the United States delayed implementation of
NAFTA's motor carrier provisions that provide
Mexican trucking firms with greater access to the
United States. The reasons cited for the delay included
concerns about overweight equipment, truck and
trailer condition, driver safety, language difficulties,
and a lack of regulations defining the maximum hours
in which a driver may work in a given period. On May
3, 2001, the United States issued proposed rules to
implement those provisions, following a unanimous
decision against the United States by a NAFTA
Arbitration Panel. At this point in time, however,
Mexican trucks are still limited to a “commercial
zone” about 30 kilometers beyond the point of entry.
U.S.-Mexico trade also must comply with other
requirements. Exports from the United States must be
cleared by a U.S.-based Mexican customs broker.
Agricultural commodities moving northbound must be
inspected first by Mexican and then U.S. authorities,
while agricultural commodities moving southbound
must be inspected by Mexican agricultural authorities
on the U.S. side of the border.
Economic Research Service, USDA
The inability of Mexican trucks to continue beyond the
commercial zone to final destinations within the
United States, coupled with the complexities of paperwork and inspections, has resulted in the development
of a peculiar cross-border transportation system. Longhaul trucks drop their trailers at holding lots on the
Mexican side of the border, where the load waits for
paperwork and inspections to be completed. The trailer
is then taken across the border by a special “drayage
tractor,” normally authorized to circulate only within
the commercial zone. Finally, the trailer is dropped in
a U.S. holding lot, where a U.S. long-haul tractor takes
the trailer to its final destination.
Several studies have attempted to quantify the total
delay costs along the entire U.S.-Mexico border. The
most recent comprehensive study, completed in late
2000 by the Mexican Secretariat of Communications
and Transport (Secretaría de Comunicaciones y
Transport—SCT), placed this cost at $77.4 million in
1999.1 Although these studies differ in terms of their
methodologies, they all yield the same general conclusion: delays at the U.S.-Mexico border result in significant economic costs. Are these delays instrumental in
diverting cargoes from truck to other modes of transportation, such as rail or coastal shipping? And how
do these modes compete?
Nearly 70 percent of northbound and 20 percent of
southbound agricultural products moving across the
U.S.-Mexico border are perishable goods with high
unit values. Northbound traffic of agricultural products
consists mainly of fresh and frozen fruits and vegetables, while southbound perishables consist primarily of
chilled and frozen meats, poultry, and dairy products
moving to large food processors and distributors. As
they do within the United States, these commodities
move largely by truck and are very resistant to diversion to other modes, such as ocean shipping or rail,
despite the numerous difficulties described above.
1
Secretaria de Communicaciones y Transport (SCT), Impacto del
Incremento del Trafico de Carga generado por el Comercio
Exterior sobre la infraestructura de la Frontera Norte, Inorme
Final, 2000, p. 76.
The Effects of NAFTA on Agriculture and the Rural Economy / WRS-02-1 ✺ 51
There are several reasons for this. First, transit times
by truck are generally much shorter than transit times
using more complex modal chains. A 4,000-kilometer
truck haul from central Mexico to Atlanta, Georgia,
takes about 4-5 days, even with possible border delays
of up to 24 hours or more. Rail movements over the
same route are not common, and it is difficult to estimate theoretical transit times for large volumes.
Probably, these would take a minimum of 6-8 days,
and possibly much longer. Truck-ship-truck movements may take 10 days, including waiting in port for
vessels. Second, inventory costs are usually much
lower when using truck, and there are fewer possibilities for damage, compared with using a combination
of transportation modes. Third, the flexibility inherent
in trucking allows for quickly targeted shipments to
many destinations and rapid adaptation to changing
demand patterns, something that is more difficult for
other modes.
of trans-border rail volumes between the early and late
1990's.3
Per-mile operating costs for truck can be 2-3 times that
of rail systems. Despite this, total logistics costs - that
is, transport plus inventory costs - as well as costs of
lost quality, can be much higher for rail than for truck.
The SCT has studied total logistics costs for a variety
of agricultural commodities moving between Nuevo
Laredo and Mexico City, including fresh vegetables,
dressed poultry, and chilled meat. Theoretical rail
logistics costs for these commodities are between 2
and 3 times as high by rail than by truck.2
These new efficiencies have led to greater market
penetration by rail in the movement of grains and
oilseeds from the United States. Traditionally, these
commodities have moved down the Mississippi Valley,
mainly by barge, to Gulf Coast ports and then by ship
to Mexican ports like Veracruz. From there, grains
have traveled inland to Mexico City and other major
destinations by rail. The low unit costs of Mississippi
barging and ocean shipping, combined with very efficient terminal transfer processes within the United
States, have made this somewhat complex modal chain
attractive. Confidential interviews with Mexican transport firms revealed that combined ocean-rail rates may
be as much as 10 percent lower than direct rail rates.
While ocean transport is still the dominant mode, rail
from the U.S. Midwest (largely unit trains) has been
gaining steadily. Accurate statistics on the shares of
total grain traffic corresponding to ship and to rail are
difficult to obtain. It is generally accepted that rail's
share was only about 10 percent prior to privatization.
Current estimates of rail's share range from 20 percent
nationally to higher percentages for grains bound to
destinations in northern Mexico.
The Improved Efficiency of Mexican
Rail Carriers
Despite the strong position of trucking in the perishables market, Mexican rail carriers have become
markedly more efficient since privatization and have
been successful in attracting bulk commodities such as
grain. Trains have become longer, crewing practices
more cost-effective, and locomotives and rail cars are
often the most modern U.S. models. Transit times on
major traffic lanes have improved dramatically over
the past decade. Also important is the high degree of
coordination with U.S. railroads and the formation of
important north-south corridors between central
Mexico and the U.S. Midwest and other destinations.
Together, these improvements spurred a near doubling
2
Felipe Ochoa y Asociados, S.C., Eficiencia de la Infraestructura
en Corredores de Transporte, Caso: Mexico-Nuevo Laredo
(Secretaria Comunicaciones y Transporte, December 1998).
As Mexican rail carriers become increasingly similar
to their U.S. counterparts, it is expected that they will
share a common strength—the efficient movement of
“unit trains” of bulk agricultural commodities. Unit
trains usually contain 50 cars or more, often dedicated to a single commodity and shipper. These trains
are normally loaded at large facilities and are
destined to major customers capable of handling
large volumes at their own unloading installations.
Rail cars in such service may be controlled by the
railway, the shipper, or both. The rail carrier normally
handles line-haul transportation only, which serves to
decrease its costs. Unit trains move through the rail
network with a minimum of switching, which serves
to decrease costs further and to make transit times
lower and more reliable.
Challenges Facing Intermodal Rail
Since their privatization, Mexican railways also
increased development of intermodal services. Rail
3 See Prentice et al. Rail Harmonization in Mexico and North
America: Implications for Agriculture for an overview of changes
in Mexican rail service.
52 ✺ Effects of NAFTA on Agriculture and the Rural Economy / WRS-02-1
Economic Research Service, USDA
intermodal transport involves a container or trailer
moved by truck to a terminal where it is loaded on a
specialized rail car, moved by rail to another terminal
where it is unloaded from the rail car, and then moved
by truck to the final destination. Railways have
promoted intermodal transport as a more efficient
alternative to conventional rail service and as a way to
compete with trucking. The principle is that the
economic gains of long-haul rail transport are sufficient to offset the trucking and terminal costs on both
ends, producing total costs that are lower than a direct
truck movement between origin and final destination.
However, transit times are usually longer and less
consistent than by direct truck. Intermodal transport
works best when rail distances are long and trucking
legs are short, such as from a Mexican auto engine
factory to a U.S. vehicle assembly plant, or from a
container terminal in Southern California to a distant
inland city such as Chicago.
Coordination difficulties, a greater possibility of
damage, and longer transit times in comparison to
direct trucking usually make intermodal rail a poor
choice for high-value perishables. Although the United
States has a much more developed intermodal infrastructure than Mexico, intermodal rail and conventional rail each accounted for only 2 percent of
domestic perishable movements within the United
States in 1999, compared with 96 percent for
trucking.4 Intermodal and conventional rail traffic
within the United States usually involves damageresistant commodities that are relatively insensitive to
time, such as potatoes and lettuce. This traffic generally originates in small areas of concentrated production, such as California's Imperial Valley, and serves
large shippers with sophisticated distribution systems.
Since the Mexican case typically features smaller shippers and geographically dispersed sites of production,
the chances of success for intermodal rail in Mexico
are much lower than in the United States. While some
intermodal rail shipments from Sinaloa to the United
States began in the 1980's, ground has been lost to
trucking due to rail service difficulties and the greater
efficiencies associated with Mexican trucking. Thefts
of copper generator cables and fuel from refrigerated
containers also have been a concern. Intermodal ship-
4
USDA Agricultural Marketing Service, Fresh Fruit and Vegetable
Shipments by Commodities, States and Months, FVAS-4 Calendar
Year 1999.
Economic Research Service, USDA
ment of perishables generates little interest among
Mexican shippers or railroads, and the immediate
prospects for significantly increased transborder shipments of perishables by this mode appear poor.
In contrast, other commodities may eventually see
greater use of intermodal rail. Likely candidates
include identity-preserved grains and other commodities that are insensitive to time. Such shipments would
be largely long-distance movements in which intermodal rail would have cost advantages over trucking
and where consistency of service is less critical,
compared with perishables. Success will depend on the
construction of intermodal terminals in large Mexican
population centers and the development of well-integrated trucking services. Smaller grain shippers in
particular may find intermodal rail service more attractive than infrequent, larger shipments in conventional
rail cars. Newer Mexican food processors lacking rail
access may also find this option attractive.
Recent Developments in
Maritime Systems
Despite gains by railroads in shipping U.S. grains,
Mexican ports and marine terminal companies are not
standing still. In 1998, the Port of Veracruz was
dredged from 31 to 36 feet. By 2003, the Port plans to
dredge to a depth of about 40 feet from the harbor
entrance to the grain terminals, possibly to be financed
half by the Port and half by the private grain terminal
operator, Terminales de Cargas Especializadas (TCE).
The ultimate effects of this investment are likely to be
subtle and complex. If the improvements materialize,
Veracruz could easily accommodate Panamax grain
ships, which should lower ocean shipping rates from
U.S. Gulf ports by 15-20 percent, making these ports
more competitive with the direct rail alternative. But
dredging the Port of Veracruz will also lower ocean
shipping costs for U.S. competitors in the world grain
market, such as Canada and the European Union
(EU).5 Thus, while the market share of rail may erode
as a consequence and marine trade may grow, it is not
clear if U.S. grain and oilseed exports would gain
overall.
In addition, associated transport costs at Veracruz may
rise. Over 90 percent of grain imports are distributed
5 These findings are the result of vessel cost modeling by Seaport
Consultants.
The Effects of NAFTA on Agriculture and the Rural Economy / WRS-02-1 ✺ 53
inland by rail. Rail and truck access to the port area is
currently constrained by antiquated layouts of the rail
yard and marine terminal, as well as by conflicts with
truck traffic, which will become more problematic as
grain ship and consignment sizes increase and as
overall port volumes continue to grow. It is not clear
how a landside modernization of road and rail access
within Veracruz would be conducted now that the port
is split among many private entities and since the port
administration today lacks some of the authority of its
state predecessor. At this point, the ultimate impact of
dredging the Port of Veracruz is unclear. While ocean
transport from all grain exporters should become more
competitive with the direct rail alternative from the
U.S. Midwest, port congestion and poor landside
access may cause inland costs to rise.
Other maritime systems, such as the barging of grain
cars, have had only mixed success. Rail cars from the
U.S. Midwest are loaded onto barges at Gulf Coast
ports and sent to Mexico. Lengthy transit times, the
large weight of empty equipment (tare weight), and
difficulties in providing backhaul cargoes have made
these systems only intermittently profitable. Such
barge systems seem best suited to areas with limited
port facilities for handling ocean vessels and storing
grain, or where direct rail service is erratic. In such
instances, shipments can be delivered to a final destination much more quickly than through a small or
inefficient deepwater port. Several barge services
have been launched and discontinued in the past
decade. Thus, it is not clear if eventually there will
be a niche market for these services as overall trade
volumes grow.
High-value Mexican exports have proven difficult to
divert from direct trucking to ocean shipping, largely
due to the need for lengthy truck hauls from Mexican
production areas to Atlantic ports and then from U.S.
Gulf Coast ports to major U.S. population centers in
the East and upper Midwest. Total transport costs may
be similar, but transit times by truck-marine-truck
modal combinations are often double those for direct
trucking, even given border congestion. These factors
have combined to make maritime services for highvalue goods moving across the Gulf of Mexico only
intermittently successful. Thus, Veracruz is a principal
export point for Mexican fruits and vegetables
destined for Europe, but not for Mexican fruit and
vegetable exports to the United States.
But other ports and maritime services could theoretically serve as alternatives to an increasingly congested
U.S. border on certain trade lanes. One such port is
Manzanillo, located on Mexico's southwest Pacific
coast. Manzanillo is fairly close to the Bajio, an
important agricultural region in south-central Mexico
that produces mangos, avocados, and other high-value
crops. Thus, there may be some long-term potential for
north-south trade between Manzanillo and ports on the
U.S. West Coast. Manzanillo was a small fishing and
general cargo port until recently, when investors from
Chile and other countries modernized the port. The
aim of these investors is to make Manzanillo an important site for importing Chilean fruits during the
Mexican off-season, as well as a modern container
port for automotive and other manufactured goods
from Asia. Manzanillo is also an important export
point for Mexican melons and other fruits bound for
Japan and other Asian markets.
Combined truck-ocean rates between the Bajio and
California ports via Manzanillo were modeled by
Seaport Consulting using vessel, terminal, and other
costs. These rates were found to be about 25-35
percent less than the rates charged for direct truck
service. However, transit times may be up to 3 times
longer by sea than by direct trucking, and currently
there is virtually no movement of perishables on this
route. Should frequency improve and rates remain low,
there may be opportunities to divert northbound and
possibly southbound traffic, such as U.S. apples and
stone fruit, from direct truck service.
This may especially be true in the case of California
apples, which currently are not approved for importation into Mexico. Apples from San Joaquin County
moving through the Port of Oakland and apples from
Kern County moving through the Port of Long Beach
to Mexico City should be very competitive with direct
truck service. Both apple-growing areas are relatively
close to major seaports, which minimizes trucking
distances. Truck-ocean shipping of other products,
such as stone fruit grown in the same areas, may also
prove competitive with direct truck service.
In addition, there may be opportunities for products
from the Bajio, such as mangos and melons, to move
north via truck-ocean shipping to California.
Containerized shipping, with regular schedules and the
ability to handle small consignments, will probably
have the edge over conventional refrigerated shipping,
which requires a full vessel and in-port storage. It is
54 ✺ Effects of NAFTA on Agriculture and the Rural Economy / WRS-02-1
Economic Research Service, USDA
In addition to transportation costs and transit times,
there are other factors that contribute to the resiliency
of existing routes and modes. Our interviews reveal
that agricultural shippers in both Mexico and the
United States strongly prefer dealing with established
commercial and government contacts with whom they
have good working relationships. They are hesitant to
try more complex modal chains and new routes, even
if costs may be somewhat lower.
service levels improve dramatically. As in the United
States, rail carriers will probably focus on larger shippers moving unit trains of bulk agricultural commodities. Improvements at the Port of Veracruz should
increase the competitiveness of ocean grain shipping
from U.S. Gulf Coast ports, and these trade lanes and
associated inland links from the Midwest should
remain strong. But improvements in Mexican grain
ports will also lower costs for U.S. competitors, such
as Canada and the EU. Elsewhere, some alternatives to
trucking may appear, such as coastwise Pacific services, if frequency becomes sufficient to be competitive.
Conclusion
William J. Hall, Seaport Consultants, Inc.
Regardless of border congestion, it seems likely that
perishables will continue to move by truck and will
not be easily diverted to other modes. Rail service will
probably continue to improve, as Mexican carriers
become more modernized and better integrated with
U.S. railroads. Intermodal rail is not likely to gain
much high-value agricultural traffic, but it could eventually attract some containerized grains, but only if
Note: This chapter was completed in conjunction with
activities funded by the USDA Foreign Agricultural
Service's Emerging Markets Program. For more information about this chapter, contact William Coyle (202694-5216, [email protected]).
known that several shipping lanes are actively investigating this option.
Economic Research Service, USDA
The Effects of NAFTA on Agriculture and the Rural Economy / WRS-02-1 ✺ 55
Part II
Detailed Commodity Assessment
Livestock and Animal Products
Cattle
Policy Changes Resulting
from NAFTA
United States. Historically, U.S. tariffs on cattle
entering from Canada and Mexico have been quite
low. Purebred breeding cattle and cattle imported for
dairy purposes were admitted duty-free, while other
cattle were charged 2.2 cents per kilogram. Under
CFTA, the United States began to gradually eliminate
its tariffs on cattle imports from Canada. This process,
originally intended to last 9 years beginning on
January 1, 1989, was accelerated to completion by
January 1, 1993. Under NAFTA, the United States
immediately eliminated its duties on Mexican cattle on
January 1, 1994.
Canada. Even before CFTA, Canada's import regime
for U.S. cattle largely resembled the U.S. regime for
Canadian cattle. Purebred breeding cattle and cattle
intended for dairy purposes were admitted duty-free,
while other cattle were charged 2.2 cents per kilogram.
Under CFTA, the gradual elimination of Canadian
tariffs on U.S. cattle was scheduled for the 9-year
period that began on January 1, 1989. However,
Canada accelerated this process to completion by
January 1, 1993. Canada completely eliminated its
duties on Mexican cattle upon NAFTA's implementation on January 1, 1994.
Mexico. In late 1992, Mexico raised its tariffs on nonbreeding cattle from zero to 15 percent. Once NAFTA
took effect in 1994, Mexico eliminated its tariffs on
U.S. and Canadian cattle.
Cattle Trade under CFTA and NAFTA
The United States trades three basic classes of cattle
with Canada and Mexico: cattle for slaughter, feeder
calves, and purebred breeding cattle. Breeding cattle
trade between the NAFTA countries has been free of
tariffs for many years, even before 1989. Thus, CFTA
and NAFTA have not had a direct effect on trade in
breeding stock.
Mexican and Canadian cattle tend to be leaner than
cattle produced in the United States, although the
reasons for this relative leanness vary between the two
countries. Mexican cattle are considerably leaner than
U.S. cattle, as Mexico does little grain-feeding of its
cattle. Canada feeds its cattle much as the United
States does, but Canada's grading system differs from
that of the United States. The U.S. grading system
rewards marbling, small flecks of fat mixed in the
muscle, and Canada's does not. Moreover, USDA only
grades beef carcasses in the United States, so animals
that are killed and processed in Canada cannot receive
USDA quality grades. Given the premiums that USDA
Choice cattle and beef get in the United States,
Canadian producers have a strong incentive to ship
cattle to the United States so that, once slaughtered,
they can meet USDA grade standards.
U.S.-Canada trade in slaughter cattle runs in both
directions, although Canadian slaughter cattle exports
to the United States are higher than the trade in the
other direction. U.S. shipments of slaughter cattle to
Canada have increased under CFTA and NAFTA, but
the United States remains a substantial net importer of
slaughter cattle from Canada. Because there were few
impediments to U.S.-Canada slaughter cattle trade
prior to 1989, little of the recent increase in this trade
can be directly attributed to the two agreements. U.S.Mexico slaughter cattle trade consists primarily of
U.S. exports to Mexico. The year 1995 was one exception to this general pattern, as recession and drought in
Mexico led to a large number of Mexican cattle being
shipped to the United States for slaughter.
U.S. cattle exports to Mexico have continued to fluctuate under NAFTA, largely due to short-term changes
in the U.S. and Mexican markets. For example, the
peso crisis and subsequent recession in Mexico caused
U.S. exports to drop to 14,641 head in 1995, a
decrease of 89 percent from the previous year. Another
56 ✺ Effects of NAFTA on Agriculture and the Rural Economy / WRS-02-1
Economic Research Service, USDA
short-term fluctuation took place between 1999 and
2000, when U.S. cattle exports to Mexico climbed
from 100,481 to 126,704 head. This increase appears
to be linked to drought in the U.S. Southwest. Dry
conditions led to more culling of cows than usual, and
many of the additional culled cattle were shipped to
Mexico. Although similar factors affected U.S. cattle
exports to Mexico prior to NAFTA, year-to-year
changes in Mexican policy created additional instability. Since NAFTA's implementation, the Mexican
government has pursued a more stable beef and cattle
import policy.
The general pattern of feeder-cattle trade is opposite
that of slaughter-cattle trade. Slaughter cattle generally
move south, with Canada exporting to the United
States and the United States exporting to Mexico. The
United States is a net exporter of feeder cattle to
Canada and a net importer from Mexico.
As is the case with slaughter cattle, feeder cattle trade
among the NAFTA countries changes greatly from
year to year, mostly due to idiosyncratic factors.
Mexican cattle exports to the United States have fluctuated within the same range under NAFTA as they
did in the years immediately prior to the agreement.
The Mexican recession in 1995 led to the shipment of
about 1.6 million cattle out of Mexico. In contrast,
Mexican exports to the United States remained under 1
million head each year during 1996-99, although they
grew to more than 1.2 million in 2000. This increase is
partly due to the same drought that boosted U.S.
slaughter cattle exports. Feeder cattle were shipped
north to U.S. feedlots, as there was insufficient pasture
in Mexico.
NAFTA's effect on Mexican cattle exports to the
United States appears to be small. Export levels are
remarkably similar before and after the start of
NAFTA. As is the case for U.S. slaughter cattle
exports to Mexico, NAFTA's most important influence
is probably its stabilization of Mexican trade policy.
Post-NAFTA agreements have had a major effect on
U.S. feeder calf exports to Canada. In 1997, the United
States and Canada started a program called the NorthWest Pilot Program. Under this program, U.S. feeder
calves could be shipped to selected Canadian feedlots
without going through the usual quarantine procedures. The diseases that Canadian authorities were
most concerned about were blue tongue and anaplas-
Economic Research Service, USDA
mosis. As more feedlots signed on to this program,
which is now called the Restricted Feed Cattle
Program, U.S. cattle exports to Canada increased from
around 40,000 head in 1996 and 1997 to 349,536 head
in 2000.
Trade Issues
U.S. ITC Cattle and Beef Study. The U.S. International
Trade Commission (ITC) investigated the impact of
NAFTA and URAA on the trade of slaughter cattle
and beef, as well as the steps taken by the United
States since 1994 to prevent the transshipment of cattle
and beef through Mexico and Canada to the U.S.
market. An ITC report entitled “Cattle and Beef:
Impact of the NAFTA and Uruguay Round
Agreements on U.S. Trade” was released on July 7,
1997. The report noted the policy changes in beef and
cattle trade due to NAFTA and URAA, and it
concluded that neither agreement had yet had a major
impact on U.S. cattle markets.
R-CALF Dumping and Countervailing Duty (CVD)
Petitions. In the fall of 1998, a group of U.S. cattle
producers called the Ranchers-Cattlemen Action Legal
Fund (R-CALF) filed a petition requesting that ITC
investigate charges that Canada and Mexico were
dumping cattle in the U.S. market at less than their fair
market value. R-CALF also alleged that Canadian
subsidies help that country's producers to sell cattle in
the United States at a discount. The Record of
Understanding (ROU) signed by Canada and the
United States in December 1998 states that if one
country imposes new duties on cattle trade, the other
may re-balance certain commitments made under the
ROU for the duration of the duty increase.
On January 19, 1999, ITC ruled 4-2 that there was
evidence that Canadian cattle shipments pose a sufficient threat to U.S. industry to justify continuing the
probes begun in December 1998 by the U.S.
Department of Commerce (DOC). On May 11, 1999,
DOC issued a preliminary determination that subsidies
were not being provided to producers or exporters of
live cattle in Canada. The final report issued in
November 1999 found no evidence that Canadian
cattle were being dumped into the U.S. market.
In its ruling dated January 19, 1999, ITC also
concluded that there was “no reasonable indication of
material injury or threat of material injury” to the U.S.
The Effects of NAFTA on Agriculture and the Rural Economy / WRS-02-1 ✺ 57
cattle industry due to cattle imports from Mexico.1 For
the period under investigation (1995-98), ITC found
that Mexican cattle shipments were small in terms of
both volume and their overall share of the U.S. market.
Moreover, ITC determined that this trade had not
significantly affected domestic prices and that it was
unlikely that U.S. cattle imports from Mexico would
increase substantially in the future.
Northern Plains Truck Interceptions. In September
1998, the Governor of South Dakota directed the
South Dakota Highway Patrol to intercept commercial
truck traffic carrying Canadian cattle, hogs, or grain.
The governor's actions won at least tacit support from
governors of 4 neighboring States and led to threats by
Canada to take the matter before NAFTA or the WTO.
Resulting negotiations culminated on December 4,
1998, with the signing of a 17-point Record of
Understanding by cabinet members from both countries. Canada agreed to revise and simplify its animal
health regulations governing imports, including its
regulations on the importation of U.S. feeder cattle. In
addition, the two countries agreed to increase their
cooperation regarding cattle trade data and to work
towards the harmonization of animal drug registrations.
Canada would have avoided the over-quota tariffs by
shipping live animals to the United States for
slaughter. This would have increased U.S. cattle
imports by some 20-30 percent. Likewise, U.S. cattle
exports to Canada would have increased if U.S. beef
exports rose to a level at which Canada imposed its
over-quota duty of 25 percent.
NAFTA's greatest influence on U.S.-Mexico cattle
trade is its immediate elimination of Mexico's 15percent duty on live cattle imports. This tariff elimination probably boosted U.S. cattle exports to Mexico by
18-33 percent in the first year of NAFTA. The peso
devaluation in late 1994 and the subsequent recession
in 1995 complicate the analysis of NAFTA's immediate effects. Also, before NAFTA was ratified,
Mexico's beef and cattle policies changed frequently
as policy objectives changed. Usually, the Mexican
government followed policies designed to keep beef
prices low, and the 15-percent duty imposed on cattle
imports in 1992 was an unusual step in the opposite
direction. Mexico's policies under NAFTA have been
much more stable than its policies before the agreement, and this probably has led to increased levels of
cattle trade in both directions.
William Hahn (202-694-5175, [email protected])
NAFTA's Impact on Cattle Trade
U.S.-Canada cattle trade has been influenced more by
the exemption of Canadian beef from the U.S. Meat
Import Law than by tariff changes. Cattle tariffs
between the two countries were low before CFTA, and
they were eliminated completely by 1993. However,
the tariff reductions associated with CFTA might have
had a greater impact on cattle trade if beef imports
from Canada were still subject to the Meat Import
Law. Under this law, the weight of imported cattle was
used to calculate the next year's meat quota. Thus,
higher imports of cattle in one year could lower the
quota for the next year, as imported cattle weights
were subtracted from domestic production.
When the Uruguay Round TRQ for beef was established, the effect of live cattle imports on production
could not be considered as it had under the Meat
Import Law. If Canada had been included in the TRQ,
1
U.S. International Trade Commission, “Live Cattle from Canada
and Mexico, Investigations Nos. 701-TA-386 (Preliminary) and
731-TA-813 (Preliminary), Determinations and Views of the
Commission,” USITC Publication No. 3155, February 1999,
<ftp://ftp.usitc.gov/pub/reports/opinions/PUB3155.PDF>, p. 41.
Beef
Policy Changes Resulting
from NAFTA
United States. Under CFTA and NAFTA, the United
States exempted both Canada and Mexico from the
U.S. Meat Import Law. This exemption from quantitative restrictions on the shipment of fresh, chilled, or
frozen beef was carried forward in calculating the
TRQ's under the Uruguay Round. The United States
also applies a tariff of 2 cents per pound on most types
of imported beef. Under CFTA, this duty originally
was to be eliminated over a 9-year period beginning
on January 1, 1989. However, this process was accelerated to completion, and most U.S.-Canada trade in
fresh, chilled, or frozen beef enjoyed duty-free status
as of July 1993. Under NAFTA, the United States
immediately eliminated its tariffs on Mexican beef on
January 1, 1994.
Mexico. In late 1992, Mexico raised its beef tariffs
from zero to 20 percent for fresh beef and 25 percent
for frozen beef. Once NAFTA took effect, Mexico
eliminated these tariffs for U.S. and Canadian beef.
58 ✺ Effects of NAFTA on Agriculture and the Rural Economy / WRS-02-1
Economic Research Service, USDA
Prior to NAFTA, Mexico also levied a 20-percent tariff
on beef offal from Canada and the United States. This
tariff is being phased out over the 9-year period that
ends on January 1, 2003. For 2001, the tariff equals 8
percent.
from the United States. Given the premium placed on
higher-grading beef in the United States, it makes
more sense for Mexican producers to sell calves to the
United States for feeding than to ship beef.
Canada. Canada exempted both the United States and
Mexico from its Meat Import Law and subsequent
TRQ calculations. Canada phased out its tariffs on
U.S. beef under an accelerated schedule, and it eliminated its tariffs on Mexican beef at the start of
NAFTA.
Beef trade has been subject to trade disputes between
the United States and Canada over the equivalency of
inspections and among all three NAFTA signatories
over charges of dumping. Mexican producers have
charged that the United States has dumped beef in the
Mexican market, while U.S. cattlemen have alleged
dumping of cattle by Canadian and Mexican
producers. Although none of these disputes have
resulted in a major disruption of trade, both issues are
irritants. In 1998, the Governors of several States in
the Northern Plains resorted to stopping Canadian
trucks in order to pressure Canada to limit shipments.
Beef Trade under CFTA and NAFTA
The low U.S. and Canadian tariffs that existed prior to
CFTA did little to restrict U.S.-Canada beef trade. The
Meat Import Laws of both countries were more important barriers to trade, and even these restrictions were
non-binding during about half of the year. U.S. beef
exports to Canada experienced little long-term growth
during the 1990's. This trade equaled 87,480 metric
tons in 2000, somewhat less than its 1991 level of
90,892 metric tons. In contrast, U.S. beef imports from
Canada increased almost without interruption over the
last decade, climbing from 81,138 metric tons in 1990
to 335,163 metric tons in 2000. The relative strength
of the U.S. dollar has played an important role in this
expansion.
Upon NAFTA's implementation, Mexico immediately
eliminated its 20-percent tariff on U.S. (and Canadian)
beef. As a result, U.S. beef exports to Mexico climbed
from 39,444 metric tons in 1993 to 72,341 metric tons in
1994, an increase of 83 percent. However, this increase
is far less dramatic when one remembers that Mexico
had raised its tariff on all imported beef from zero to 20
percent at the end of 1992. In fact, the volume of this
trade in 1994 was only 5 percent higher than the volume
in 1992, prior to the tariff's implementation.
The recession that followed the peso crisis caused U.S.
beef exports to Mexico to drop sharply in 1995, and
exports did not recover fully until 1997. This trade has
grown steadily since 1995, and its volume is now more
than 2½ times greater than its pre-NAFTA levels.
Much of this increase is due to continuing improvement in the Mexican economy. In 2000, U.S. beef
exports to Mexico totaled 178,749 metric tons, with a
value of $531 million.
Mexico ships only a small amount of beef to the
United States, and it is by far a net importer of beef
Economic Research Service, USDA
Trade Issues
Mexican Antidumping Investigation Against U.S. Beef.
An antidumping dispute with Mexico surfaced in June
1994, with charges that U.S. exporters engaged in
discriminatory pricing practices between August 1993
and January 1994. After a brief investigation, the
Mexican government published a preliminary finding
showing some margin of price discrimination on the
part of some U.S. packers, but not a threat of injury
sufficient to justify the immediate imposition of
antidumping duties. Before a final ruling was issued,
the Mexican Confederation of Cattle Producers and the
U.S. National Cattlemen's Association reached an
understanding to improve communication between the
two groups. Subsequently, the complaint was withdrawn.
However, charges were made once again in 1998 that
the United States was dumping beef in Mexico. On
August 1, 1999, Mexico announced antidumping
tariffs that varied by company. U.S. beef exporters
appealed these tariffs, and on October 10, 2000,
Mexico published a set of revised antidumping tariffs
for certain beef exporters. These duties range from
zero to 80 cents per kilogram, depending on the
company and the type of beef.
NAFTA's Impact on Beef Trade
Calculating Canada's share of the quota under the U.S.
Meat Import Law indicates that Canada would have
had been allowed to ship 130 to 135 million pounds of
beef (58,968 to 61,236 metric tons) in 1994. Actual
shipments that year equaled 178,091 metric tons.
Moreover, if the Uruguay Round's TRQ had applied to
The Effects of NAFTA on Agriculture and the Rural Economy / WRS-02-1 ✺ 59
Canada, that country would have been able to export
only about 145 million pounds (65,772 metric tons)
per year to the United States beginning in 1995. The
average level of U.S. beef imports from Canada during
1995-2000 is roughly 4 times this amount, indicating
substantially higher imports due to CFTA and NAFTA.
tervailing duties on U.S. beef, these exports are
expected to continue to grow.
Similarly, the United States has benefited from the
elimination of Canadian import restrictions. Although
Canada had not invoked its Meat Import Act since
1985, it closely monitors beef imports from countries
outside NAFTA. In 1993, Canada imposed a TRQ on
boneless beef from countries other than the United
States. The initial TRQ was set at 72,000 metric tons,
with an over-quota tariff of 25 percent. The United
States exported 67,000 metric tons, or 37 percent of
Canada's boneless beef imports. Canada relaxed the
rules associated with the TRQ in 1994, expanding the
effective TRQ to 91,000 metric tons. Most of the
boneless beef imported by Canada (and the United
States) from countries outside NAFTA is cow and bull
meat. This lean meat is used in the manufacturing of
hamburger and other processed meats. The rules were
relaxed to relieve pressure on this segment of the beef
market.
Policy Changes Resulting
from NAFTA
In 1995, Canada replaced its Meat Import Act with a
TRQ of 76,409 metric tons and an over-quota duty of
30.3 percent. Although the pre-Uruguay Round
surcharge affected lower-value manufacturing beef,
had the United States not been exempt from these
restrictions, it is likely that between one-third and onehalf of U.S. exports to Canada would have been
subject to over-quota duties. This implies that CFTA
and NAFTA may have doubled U.S. beef exports to
Canada. Since 1989, the United States has maintained
a 40- to 50-percent share of the Canadian import
market, considerably above its 10- to 15-percent share
before CFTA, when the United States was subject to
Canada's Meat Import Act.
NAFTA's impact on U.S. beef exports to Mexico is
more difficult to estimate. Mexico's beef tariff of 20
percent was eliminated with NAFTA. However, this
tariff was imposed only in late 1992 and represented a
major change in Mexican beef policy. The level of
beef exports in 1992 prior to the 20-percent tariff is
remarkably similar to the level in 1994, when the tariff
was eliminated as part of NAFTA. Improvements in
the Mexican economy have driven much of the recent
growth in U.S. beef exports to Mexico. Despite coun-
William Hahn (202-694-5175, [email protected])
Hogs
United States. The United States does not levy tariffs
on hog imports, nor did it do so immediately prior to
CFTA and NAFTA. However, the United States did
maintain a countervailing duty on Canadian hogs from
1984 to 1999 (see trade issues section).
Canada. Canada does not levy a duty on hog imports,
a policy that predates CFTA.
Mexico. Prior to 1994, Mexico maintained a 20-percent
duty on non-purebred hogs. Under NAFTA, this duty is
being phased out over the 9-year period that ends on
January 1, 2003. In addition, a safeguard TRQ was
placed on imports. If imports rise above the levels specified by the TRQ, the duty reverts to the lower of the
current most-favored-nation (MFN) or the pre-NAFTA
level. This safeguard, initially set at 46,900 head for
hogs under 50 kilograms and 324,300 for hogs greater
than or equal to 50 kilograms, expands 3 percent each
year. For 2001, the two safeguard thresholds equal
57,681 and 398,848, respectively. The safeguard provision expires on January 1, 2003.
Hog Trade under CFTA and NAFTA
With the exception of certain regions, Mexico is
considered to be hog-cholera endemic, and any hogs
exported to the United States are subject to a 90-day
quarantine. This effectively precludes most hog
imports from Mexico.2 In addition, U.S. hog exports to
Canada are extremely small in number due to disease
problems - pseudorabies - in the United States. In
2000, this trade totaled 4,536 hogs, of which 2,005
were purebred breeding animals. Thus, North
American hog trade consists almost exclusively of
2
Hog cholera was eradicated from the United States in 1978,
following systematic diagnosis, quarantine, destruction of infected
herds, safe disposal, and cleaning and disinfection of affected
premises. Hog cholera is caused by a virus that infects only swine.
The disease spreads easily among swine of all ages, causing high
fever, weakness, reddening of the skin, and high death rates in
infected herds (McKean, p. 285).
60 ✺ Effects of NAFTA on Agriculture and the Rural Economy / WRS-02-1
Economic Research Service, USDA
Canadian exports to the United States and U.S. exports
to Mexico.
In recent years, U.S. imports of live hogs from Canada
have occurred along two main tracks, and the development of this pattern was independent of CFTA and
NAFTA. The United States imports live hogs for
slaughter, primarily from producers in western Canada
and Ontario, but it also imports feeder pigs from
Manitoba and Saskatchewan for finishing in the
United States. Imports of both feeder pigs and
slaughter hogs have increased significantly since 1992.
In 2000, the United States imported 4.4 million live
swine, compared with some 670,000 in 1992. The
dramatic growth in imports is the consequence of
expanding Canadian production capacity, lower
CVD's, available slaughter capacity in the United
States, and low feed prices.
Restructuring in the Canadian slaughter industry is
ongoing and significant. One likely inducement of
restructuring was the recent series of decreases in the
CVD, which highlighted differences in the wage structures of the U.S. and Canadian slaughter industries.
Lower wages in the U.S. slaughter industry allow U.S.
packers to outbid Canadian packers for hogs. The
higher wage structure in Canada has been a determining factor in the closure of several Canadian
slaughter facilities over the past several years. In 1998,
lower wage contracts were adopted in several major
Canadian slaughter facilities, but work stoppages
preceding contract ratification temporarily increased
the flow of Canadian hogs to the United States.
In 2000, Maple Leaf Foods, Inc., opened a large, stateof-the-art facility in Brandon, Manitoba to slaughter
and process hogs. The presence of such a plant in a
prairie province validates the westward shift of the
Canadian pork industry. Although this new facility
increases Canadian slaughter capacity by more than 10
percent, Canada's ability to produce hogs will likely
continue to exceed its capacity to slaughter and
process them. Thus, the flow of Canadian hog exports
to the United States is expected to continue at its
present rate - over 4 million head per year - for the
foreseeable future.
U.S. hog exports to Mexico largely depend on the
health of the Mexican economy. This trade peaked
just prior to the peso crisis and then dropped precipitously, from 123,430 hogs in 1994 to just 4,956 hogs
Economic Research Service, USDA
in 1995. Exports recovered slowly, reaching 40,637
hogs in 1996 and 38,769 hogs in 1997. Record low
hog prices in the United States in 1998 boosted
exports to 207,922 hogs, which in turn precipitated
an antidumping action by the Mexican government
(see trade issues section). Exports fell to 51,915
hogs in 2000, and it is anticipated that trade will
remain at low levels as long as the antidumping
measures are in place.
Trade Issues
Sunset Review of U.S. Countervailing Duty. From
1984 to 1999, the United States maintained a countervailing duty (CVD) on Canadian hogs. However,
policy changes in Canada prompted the U.S.
Department of Commerce (DOC) to declare the CVD
rate to be de minimis, or effectively zero, in September
1998. Following a Sunset Review of the CVD order,
the DOC concluded that its revocation “would not be
likely to lead to continuation or recurrence of a countervailable subsidy.”3 As a result, the CVD order was
revoked, effective January 1, 2000.
Regionalization of Hog Cholera Restrictions. In 1994,
Mexico officially requested that the United States
recognize the states of Sonora, Sinaloa, Chihauhua,
Baja California Sur, and Baja California Norte as lowrisk regions for hog cholera in order to ship pork to
U.S. markets. In 1995, Mexico added Yucatan to this
list. In July 1997, a final rule recognizing Sonora to be
free of hog cholera was published in the Federal
Register. In October 1997, the United States published
final rules that established procedures for recognizing
regions and the levels of risk among regions with
regard to U.S. importation of live animals and animal
products.
Regulation of Pseudorabies. On December 3, 1998,
Canada amended its Health of Animal Regulation to
permit the importation of U.S. slaughter swine from
certain States. This amendment exempts imported
slaughter hogs from States with Stage IV or Stage V
status under the U.S. Pseudorabies Eradication
3
Such Sunset Reviews are part of the commitments made by
the United States in the Uruguay Round. The Uruguay Round
Agreements Act revised the amended Tariff Act of 1930 by
requiring that CVD orders be revoked after 5 years, unless revocation or termination would likely lead to a continuation or recurrence of a countervailable subsidy, and material injury to the
domestic industry.
The Effects of NAFTA on Agriculture and the Rural Economy / WRS-02-1 ✺ 61
Program from undergoing disease testing and quarantine requirements.4
Although the new regulations allowed imports where
they were prohibited in the past, they still strongly
discouraged Canadian packers from importing U.S.
hogs. Requirements that were deemed excessively
onerous include truck washdowns, disposal of manure
in the trucks and waterwash, reconfiguration of plant
grounds to segregate U.S. hogs, and special bangle ear
tags on U.S. hogs. Canadian packers also contested
requirements to slaughter U.S. hogs within 4 hours
after arriving at the plant and within 24 hours after
arriving in Canada. In addition, these animals were to
have traveled to Canadian slaughter plants along
defined routes and within defined time frames.
On March 30, 1999, the Canadian Food Inspection
Agency (CFIA) met with various Canadian stakeholders (including producer associations, packers, and
meat industry officials) to explore various strategies to
address their concerns. The challenge facing CFIA was
to open the channels of trade without weakening the
risk-protection aspects of the regulation.
New regulations amending the Health of Animals Act
were published in the Canada Gazette on October 27,
1999. The regulations amended previous requirements
for animals imported from U.S. States with Stage IV
or Stage V classification with regard to truck washing,
manure handling and disposal, veterinary supervision,
and animal identification.
The new regulations have done little to induce U.S hog
exports to Canada. The minimal flow of this trade is
more a consequence of price rather than policy, as U.S.
packers typically offer higher prices for hogs than
Canadian slaughter operations. In 2000, a total of 2,531
slaughter hogs and feeder pigs were exported to Canada.
Mexican Antidumping Investigations. In March 1993, a
confederation of Mexican pork producers requested an
investigation of alleged dumping by U.S. producers
between May 1991 and May 1992. The investigation
included live hogs as well as a variety of pork products.
4
Pseudorabies is an acute, frequently fatal disease that affects a
portion of the U.S. swineherd. The disease is caused by a herpes
virus and is capable of causing a variety of clinical manifestations,
including death in newborn and adult swine, and fetal death with
abortion in pregnant swine (Thawley, Gustafson, and Ormiston).
In September 1993, the Mexican government found that
there was evidence of dumping, with margins ranging
from zero to 32 percent. The duties were held in
abeyance until a determination was made as to whether
the pork in question was injuring or threatening injury to
the Mexican pork industry. On August 26, 1994, the
Mexican Secretariat of Commerce and Industrial
Promotion (SECOFI) found that there was no evidence
of injury or threat of injury. The case was closed and no
antidumping duties were levied.
On October 21, 1998, SECOFI initiated an antidumping
investigation of U.S. hog exporters at the request of the
Mexican Pork Producers' Council. On January 31, 1999,
Mexico announced its plan to impose “compensatory”
duties on U.S. hogs. The duty equals the difference
between the export price and the “normal reference
value” for production and marketing, fixed at $1.08 per
kilogram. Thus, the duty raised the U.S. export price to
$1.08 per kilogram. This duty remained in effect until
June 1999, when it was re-specified to equal the fixed
rate of $0.351 per kilogram. On October 20, 1999,
SECOFI issued its final decision, continuing the duty of
$0.351 per kilogram.
With U.S. slaughter hogs averaging 57 cents per kilogram (26 cents per pound) in January 1999, U.S. hog
exports to Mexico are clearly at risk. The break-even
price for U.S. hog producers is about 88 cents per
kilogram (40 cents per pound). U.S. hog exports to
Mexico averaged 17,327 hogs per month in 1998. In
2000, they averaged 4,326 per month, clearly showing
the effects of the duty, and since September 2000,
exports have remained below 700 per month. On
October 10, 2000, the Mexican government initiated
its first annual review of its antidumping action. The
results of this review are still pending.
Northern Plains Truck Interceptions. In September
1998, the Governor of South Dakota directed the
South Dakota Highway Patrol to intercept commercial
truck traffic carrying Canadian cattle, hogs, or grain.
These actions won at least tacit support from the
Governors of 4 neighboring States across the northern
tier and led to threats by Canada to take the matter
before NAFTA or the WTO. Resulting negotiations
culminated on December 4 with the signing of a 17point Record of Understanding by cabinet members
from both countries. Canada agreed to revise and
simplify its animal health regulations governing
imports, including its testing and quarantine restrictions on U.S. slaughter swine. In addition, the two
62 ✺ Effects of NAFTA on Agriculture and the Rural Economy / WRS-02-1
Economic Research Service, USDA
countries agreed to work towards harmonizing animal
drug registrations.
NAFTA's Impact on Hog Trade
The direct impact of CFTA and NAFTA on U.S.-Canada
hog trade is fairly limited, but the two agreements have
affected hog trade through several indirect channels.
Canadian analysts believe that CFTA and NAFTA
cleared the way for investment in the hog industry in
western Canada. In addition, lower feed prices in
Canada's prairie provinces (in part due to the elimination
of Canadian rail subsidies under the Western Grain
Transportation Act - WGTA) have increased the incentives for raising livestock there. There also has been
significant growth over the past decade in the export of
live hogs from Manitoba and Ontario, as U.S. packers
have outbid packers in those provinces. With the exception of health restrictions, there are currently no U.S
barriers to Canadian hog imports.
With respect to U.S. hog exports to Mexico, Mexico's
Safeguard TRQ may function to hold the number of
hogs exported below what would have occurred in the
absence of such restrictions. Likely as important,
however, is the collective effect on exports of such
factors as Mexican antidumping duties, domestic hog
prices in the United States, the U.S.-Mexico exchange
rate, and the varying growth rate of the Mexican
economy.
Mildred Haley (202-694-5176, [email protected])
Pork
Policy Changes Resulting
from NAFTA
United States. The majority of U.S. pork imports
enter the country duty-free, but there are duties on
several categories of processed pork, ranging from 1.2
cents per kilogram for sausages to 6.4 cents per kilogram for canned hams. Originally under CFTA, duties
on Canadian pork were to have been phased out over
the 9-year period that ended on January 1, 1998, but
this schedule was accelerated to completion. U.S.
duties on Mexican pork were eliminated at the start of
NAFTA. However, some Mexican states are still
considered to be hog-cholera endemic. Any pork
imported from these states must be cooked and then
sealed in air-tight containers.
Canada. Although CFTA called for Canadian duties
on U.S. pork to be phased out over a 9-year period,
Economic Research Service, USDA
this process was accelerated to completion. Canada
eliminated its duties on Mexican pork at the start of
NAFTA, but any pork imported from Mexico must be
cooked and then sealed in air-tight containers.
Mexico. Prior to 1994, Mexico levied a duty of 20
percent on most pork imports. Under NAFTA, the
duties for Canada and the United States are to be eliminated gradually over the 9-year period that ends on
January 1, 2003. A safeguard quota was placed on
certain cuts of pork. If imports rise above that level,
the duty reverts to the lower of the current MFN or
pre-NAFTA levels. The safeguard, initially set at about
68,500 metric tons for all categories, expands 3
percent each year. The safeguard provision expires at
the end of the 9-year transition.
Pork Trade under CFTA and NAFTA
U.S.-Canada pork trade is now relatively free of trade
barriers. Canadian exports generally move from
Ontario and Quebec to the eastern United States, while
U.S. processors primarily export hams to eastern
Canada. The United States remains a net importer of
pork from Canada, but U.S. pork exports to Canada
experienced substantial growth during the last decade.
Between 1990 and 2000, exports increased from 7,273
to 45,699 metric tons, with most of the growth occurring before 1997. In contrast, U.S. pork imports from
Canada peaked at 200,752 metric tons in 1989 and
then remained below 200,000 metric tons each year
until 1998. In the last several years, imports have
increased tremendously, from 188,355 metric tons in
1997 to 322,301 metric tons in 2000.
Since the implementation of NAFTA, U.S. pork
exports to Mexico have grown from an annual average
of 26,663 metric tons during 1989-93 to 49,372 metric
tons during 1994-2000, while the average annual value
of this trade increased from $59 million to $93
million. The volume of U.S. pork imports from
Mexico continues to be extremely small due to disease
problems in Mexico.
In the first year of NAFTA (1994), U.S. pork exports
to Mexico grew dramatically, increasing 75 percent in
volume and 63 percent in value. The greatest increase
occurred in fresh, chilled, and frozen pork, although
exports of prepared and preserved products also
increased. In the wake of the peso crisis, Mexican
demand for U.S. pork declined appreciably, causing
exports to drop from 50,642 metric tons in 1994 to
20,962 metric tons in 1995.
The Effects of NAFTA on Agriculture and the Rural Economy / WRS-02-1 ✺ 63
Initially, lower-value pork products led the recovery in
this trade. In 1996, U.S. exports to Mexico of prepared
and preserved pork grew 27 percent in volume, while
exports of fresh, chilled, and frozen pork continued to
decline. Since then, higher-value products have registered the biggest increase in volume. Between 1996
and 2000, exports of fresh, chilled, and frozen pork
climbed from 13,728 to 94,839 metric tons. Driven by
continued economic expansion in Mexico, U.S pork
exports to Mexico have expanded at double-digit rates
over the last 4 years. In 2000, this trade reached an alltime high of 109,223 metric tons, valued at $197
million. Although the unit value of U.S. pork exports
to Mexico is still relatively low, Mexico is the second
largest foreign market for U.S. pork in terms of
volume, following Japan.
Trade Issues
Health and Sanitary Issues. As in the case of live
hogs, U.S. health restrictions regarding hog cholera
have led Mexican pork producers to complain that they
are being unjustly prevented from exporting pork to
the United States. Because the United States is
committed to the regionalization of disease restrictions, USDA's Animal and Plant Health Inspection
Service (APHIS) adopted rules in October 1997 that
recognize regions, and levels of risk among those
regions, with regard to the importation of animals and
animal products. Moreover, in July 1997, the United
States officially recognized the Mexican state of
Sonora as being free of hog cholera.
NAFTA's Impact on Pork Trade
CFTA and NAFTA have had a limited impact on North
American pork trade. U.S.-Canada pork trade is relatively free of restrictions, while Mexico has reduced its
tariffs on U.S. and Canadian pork from a pre-NAFTA
level of 20 percent to 4 percent in 2001. While
Mexico's tariff reductions have been an important
contributing factor to the growth of U.S. pork exports
to Mexico, the far more significant drivers of export
growth have been the rapid recovery of the Mexican
economy following its recession in 1995 and continuing economic growth since then.
Mildred Haley (202-694-5176, [email protected])
Poultry Meat
Policy Changes Resulting
from NAFTA
United States. Prior to NAFTA, the United States
imposed tariffs on poultry meat ranging from 2 to 10.6
cents per kilogram. Under CFTA, U.S. tariffs on
Canadian poultry meat were to be gradually reduced
over a 9-year period, beginning on January 1, 1989. As
with other meats, the tariff reductions for poultry were
accelerated to completion, and Canadian poultry now
enter the United States duty-free.
Under NAFTA, the United States immediately eliminated its tariffs on Mexican poultry meat on January 1,
1994. However, all poultry products imported from
Mexico must be cooked and sealed. The United States
is in the process of determining whether parts of
Mexico are free of both highly pathogenic avian
influenza and exotic Newcastle disease. In May 1999,
USDA issued a proposal to ease restrictions on the
importation of poultry and poultry products from the
Mexican states of Sinaloa and Sonora. Under the
proposal, these imports would be subject to documentation that the poultry was indeed from those states
and had not been in contact with exotic Newcastle
disease. Also, since April 24, 2000, the United States
has allowed processors in Sinaloa and Sonora to
import live birds from the United States for slaughter
and processing and then ship the processed parts back
to the United States.
Canada. Prior to URAA, Canada's import quotas were
tied to production decisions for its domestic supply
controls. The import quota for broilers was set at 6.3
percent of the previous year's broiler production, and
the import quota for turkeys was set at 2 percent of the
current year's expected production. Under CFTA (and
subsumed by NAFTA), the global quota allocations
were increased to 7.5 percent for broilers and 3.5
percent for turkeys. Canada has also offered supplemental quotas, which in many cases raise imports well
above the formal quotas. Under URAA, Canada
converted its MFN quotas to a TRQ with a high overquota tariff. Canada's new TRQ also includes poultry
products, which had not been included in its previous
global quotas.
Mexico. Prior to URAA, Mexico controlled poultry
imports through import licenses and a 10-percent duty.
Under NAFTA, a set of initial TRQ's totaling 95,000
metric tons was established on a variety of poultry
64 ✺ Effects of NAFTA on Agriculture and the Rural Economy / WRS-02-1
Economic Research Service, USDA
categories. Quantities above that amount initially were
subject to over-quota duties ranging from 133 to 260
percent. The TRQ's expand 3 percent each year, and
the over-quota tariffs are being phased out over the 9year period that ends on January 1, 2003. To date, the
Mexican government has chosen not to enforce its
poultry TRQ's. Mexico's poultry imports from the
United States, especially in parts and mechanically
deboned meat (MDM), have greatly surpassed the
duty-free levels set by the TRQ's.
Poultry Trade under CFTA and NAFTA
Prior to NAFTA, Canada had poultry production quotas
and import limitations. These two policies make
Canadian poultry meat prices higher than U.S. prices.
The import controls were necessary to make the quotas
an effective, price-increasing policy. The government
had considerable discretion in setting quotas, and it was
common for these quotas to be expanded using supplemental quotas. Even with supplemental quotas,
Canadian prices were above U.S. prices.
Canada did not abandon its production quotas under
NAFTA, but it did increase its import quotas. NAFTA
did not alter Canada's basic mechanism for setting and
allocating these quotas to Canadian importers.
Canadian poultry meat imports were limited to set
percentages of either the previous year's production or
an estimate of current-year production. However, these
quotas could be and often were expanded through the
use of supplemental quotas. U.S. poultry meat exports
to Canada were limited to these quotas.
Canada changed its poultry import scheme in response
to URAA, replacing strict quotas with a TRQ with a
restrictive, over-quota tariff rate. However, this policy
change produces the same result: U.S. exports to
Canada are limited to the quota. Twice since the
implementation of NAFTA, Canada has changed how
it allocates the quota among individual firms. On
January 1, 1996, Canada made its first revision to its
method of allocating import permits for chicken. The
revised system established new allocation pools for
each of the following categories of importer: processors, distributors, or food service. Participants might
have either joined one of those pools or retained a
fixed traditional import allocation.
Since 1999, Canada has allocated the chicken TRQ in
the following fashion. Firms that imported chicken
prior to the introduction of import controls in 1979
receive an allocation comparable to their initial share,
Economic Research Service, USDA
as do processors making chicken products that
compete with non-controlled imports, such as TV
dinners. Food service companies share an allocation
of 2,500 metric tons on the basis of market share. The
remainder of the TRQ is split 70/30 between processors (on the basis of market share) and distributors
(on the basis of equal share). The new system is
designed to increase the import allocation share of
firms that contribute to employment and value-added
activities in Canada, while eliminating allocations to
firms that have not been actively involved in the
chicken industry.
The expansion of import quotas has facilitated a
marked increase in U.S. poultry meat exports to
Canada. During the 1990's, this trade has more than
doubled in volume, climbing from 51,192 metric tons
in 1990 to 115,406 metric tons in 2000, while the
value of this trade increased from $125 million to
$243 million. Poultry meat imports from Canada are
much smaller in volume but have increased substantially in recent years, from about 4,800 metric tons in
1995 and 1996 to 16,377 metric tons in 2000. Chicken
accounts for much of this expansion. Between 1988
and 2000, U.S. chicken meat exports to Canada (fresh
or frozen) increased from 24,130 to 86,662 metric
tons, while the value of this trade increased from $32
million to $132 million.
As with other meats, U.S. poultry meat exports to
Mexico have increased substantially under NAFTA.
The value of this trade has climbed from an annual
average of $120 million during 1989-93 to $216
million during 1994-2000, while the average annual
volume has expanded from 103,032 metric tons to
214,375 metric tons. Much of this growth is due to
continuing improvement in the Mexican economy, and
sales generally have exceeded the within-quota levels
of Mexico's TRQ's.
Mexico is the fourth largest U.S. export market for
chicken meat, accounting for 7 percent of the total
value of U.S. chicken exports in in 2000. Exports of
chicken meat have nearly doubled under NAFTA,
increasing from an annual average of 61,007 metric
tons during 1989-93 to 120,649 metric tons during
1994-2000. The average value of these exports
increased from $57 million to $88 million across the
same two periods.
Mexico is also the most important foreign market for
U.S. turkey meat, accounting for 61 percent of export
value in 2000. Turkey meat exports to Mexico have
The Effects of NAFTA on Agriculture and the Rural Economy / WRS-02-1 ✺ 65
nearly tripled under NAFTA, climbing from an
average of 29,958 metric tons in 1989-93 to 82,976
metric tons in 1994-2000. The value of this trade
expanded from $42 million to $105 million across the
same two periods.
In contrast, U.S. turkey meat exports to Canada (fresh
or frozen) have experienced substantial growth only in
the last several years. After peaking at 2,478 metric
tons in 1989, this trade averaged just 1,619 metric tons
per year during 1990-95. Since 1996, annual export
volume has surpassed the 1989 level, except in 1997.
In 2000, U.S. turkey meat exports to Canada totaled
3,115 metric tons, with a value of $10 million.
Mexican sausage manufactures have argued successfully that charging over-quota rates on mechanically
deboned poultry meat would put them at a price disadvantage by substantially raising the price of a major
input. Imported sausage enters under a lower duty than
poultry meat, and the Mexican poultry sector cannot
supply sufficient quantities of low-priced mechanically
deboned meat (MDM) to serve the domestic sausage
industry. In response to this argument, the Mexican
government has increased the within-quota quantities
for certain kinds of poultry, thereby providing an additional impetus to U.S. poultry exports to Mexico.
Trade Issues
Canada's Poultry TRQ under URAA. Canada's conversion of absolute quotas on poultry to a TRQ system
under URAA resulted in a significant trade dispute
between the United States and Canada. The United
States argued that under NAFTA, neither country may
impose higher tariffs on imports from the other country
than agreed to under NAFTA. The United States also
argued that each country must eliminate tariffs in accordance with NAFTA. Canada's view was that it had the
right to convert non-tariff barriers to TRQ's under
URAA and to apply those TRQ's to the United States
under NAFTA. On December 2, 1996, a NAFTA panel
issued its final report, finding that Canada's application
of its new TRQ's to U.S. goods conforms with its
NAFTA obligations. NAFTA's dispute settlement mechanism contains no appeal process.
Sanitary Issues Concerning U.S.-Mexico Poultry
Trade. Discussions between Mexico and the United
States are continuing as to how the concept of regionalism can be applied to Mexican poultry. Questions
still to be resolved include the disease-free status of
the Mexican states under consideration and the proce-
dures to be used to restrict interstate poultry shipments
from Mexican states not declared to be disease-free.
On April 14, 1999, Mexico implemented a new rule
requiring that all raw poultry imports, except those
destined for further processing, have a certificate stating
that they came from flocks free of avian influenza. The
tests must be done within 15 days of slaughter.
Also, Sinaloa and Sonora may now import live poultry
for slaughter and processing and then ship the meat
back to the United States, under a rule issued by
USDA on April 24, 2000. However, as of the end of
2000, no such import/re-export activities have taken
place. While APHIS has approved the disease-free
status of these two Mexican states, USDA's Food
Safety Inspection Service (FSIS) has yet to approve
any facilities there.
NAFTA's Impact on Poultry Trade
It is difficult to assess the impact of CFTA and
NAFTA on U.S. poultry exports to Canada. Had
Canada strictly enforced its pre-NAFTA quotas of 6.3
percent of production for broilers and 2 percent for
turkeys, U.S. poultry meat exports to Canada could
have been 40-50 percent less than under the CFTA
quotas. However, Canada has a history of offering
supplemental permits to meet internal demand. While
broiler exports declined between 1993 and 1996, they
have since risen sharply. Broiler exports rose 16
percent in 2000 alone.
Although Mexico could have limited U.S. exports to
its TRQ levels, it has been allowing larger in-quota
imports than set under NAFTA. It is likely that this
waiver would have occurred in the absence of NAFTA
and URAA due to pressure from sausage manufacturers. In 2000, Mexico was the third largest market
for broiler exports on a quantity basis and by far the
largest export market for U.S. turkey products.
None of the policy reforms undertaken by the United
States have had much effect on poultry imports from
Canada and Mexico. The United States is one of the
world's low-cost poultry producers and consequently
imports very little poultry from any source.
William Hahn (202-694-5175, [email protected])
66 ✺ Effects of NAFTA on Agriculture and the Rural Economy / WRS-02-1
Economic Research Service, USDA
Dairy
Policy Changes Resulting
from NAFTA
United States. For many years, the United States maintained a series of quotas on dairy products under Section
22 of the Agricultural Adjustment Act of 1932. Under
CFTA and NAFTA, the United States eliminated its
tariffs on Canadian dairy products over the 9-year period
that ended on January 1, 1998, but it retained its quotas
until the URAA took effect. Now, the United States
maintains a system of TRQ's for dairy product imports,
as it is entitled to do under the URAA and NAFTA.
Under NAFTA, the United States provided Mexico
with a basket of TRQ's for dairy products, including
several duty-free TRQ's, meaning that the within-quota
amount enters duty-free. For milk powder, the initial
quotas were 422 metric tons and 43 metric tons,
depending on the type of powder. For cheese, the
initial quota was 5,550 metric tons. Initially, the overquota tariffs on milk powder ranged from 78 to 93.6
percent, and the tariff on cheese equaled 69.5 percent.
Other products were assessed a tariff equal to the
average of import protection during 1989-91. The
TRQ's expand by roughly 3 percent each year over a
9-year period, and on January 1, 2003, the TRQ's and
corresponding over-quota tariffs will be eliminated
altogether. Under URAA, the United States replaced
its quotas with a system of TRQ's and high over-quota
duties. The market access granted to Mexico under
NAFTA was incorporated into the URAA's TRQ's.
Canada. Prior to URAA, Canada maintained a system
of import quotas and licensing requirements to protect
its domestic supply management regime for dairy.
Although Canada gradually eliminated its tariffs on
U.S. dairy products under CFTA and NAFTA, most
quotas and licenses remained in place until the implementation of URAA. Under that agreement, Canada
converted its import quotas for dairy products to a
series of TRQ's. These TRQ's were calculated on the
basis of 5-percent minimum access for all dairy products, with some products receiving greater protection
than others. Given the continuation of these quantitative restrictions, CFTA and NAFTA tariff reductions
have offered few opportunities for the expansion of
U.S. dairy exports to Canada. Moreover, Canada and
Mexico agreed in NAFTA to exclude their bilateral
dairy trade from trade liberalization.
Economic Research Service, USDA
Mexico. Prior to 1994, Mexico regulated its dairy
imports by requiring import licenses. Tariffs tended to be
modest, ranging from zero to 20 percent. Under NAFTA,
Mexico provided the United States with duty-free access
for 40,000 metric tons of milk powder, with an overquota tariff of 48 cents per kilogram but not less than
139 percent ad valorem. The TRQ grows by 3 percent
per year, and the over-quota tariff is being gradually
eliminated over the 14-year period that ends on January
1, 2008. For 2001, the quota equals approximately
49,195 metric tons, and the over-quota tariff rate is 28.3
cents per kilogram but not less than 82.1 percent. The
base tariff rate for other dairy products ranged from 2040 percent. These tariffs are being phased out over the 9year period that ends on January 1, 2003.
Dairy Trade under CFTA and NAFTA
U.S.-Canada dairy trade has shifted a great deal in
percentage terms from one year to the next. The
United States has been a net exporter to Canada
throughout the CFTA-NAFTA era. However, dairy
trade between the two countries is a very small part of
their total production and consumption. Thus, the large
percentage fluctuations in trade have little significance.
U.S. dairy exports to Canada climbed from $18
million in 1988 to $217 million in 2000. Cheese and
whey accounted for 15 percent and 16 percent of
export value, respectively, in 2000. Between 1988 and
2000, U.S. cheese exports to Canada increased in
value from $6 million to $32 million, while the
volume expanded from 1,739 to 9,191 metric tons.
Whey exports to Canada grew from $3 million to $35
million over the same period.
Over the 1988-99 period, U.S. dairy imports from
Canada increased from $22 million to $185 million.
However, this trade dropped to $161 million in 2000,
as Canada had to modify its dairy-pricing system in
response to a WTO ruling that the system functioned
as an export subsidy. U.S. cheese imports from Canada
climbed from $8 million in 1988 to $28 million in
1999 and then declined to $21 million in 2000. In
volume terms, this trade expanded from 2,556 to 7,611
metric tons between 1988 and 1999, before dropping
to 4,373 metric tons in 2000.
Imports of casein and casein mixtures dried up
completely in 2000, although this trade exceeded $1
million in 1989, 1990, and 1995. Fluid milk imports,
including ultra-high temperature [UHT] pasteurized
milk destined for Puerto Rico, have fluctuated greatly
The Effects of NAFTA on Agriculture and the Rural Economy / WRS-02-1 ✺ 67
under CFTA and NAFTA. These imports equaled $16
million in 1999, but just $9 million in 2000. Imports of
butter and butterfat mixtures did not break the mark of
$1 million until 1997. This trade dropped from $14
million in 1999 to $8 million in 2000.
The United States maintains a surplus in its dairy
product trade with Mexico, with exports of $184
million and imports of $21 million in 2000. However,
this surplus has declined in recent years due to
reduced sales of nonfat dry milk and increased imports
of various dairy products from Mexico. U.S. dairy
exports to Mexico peaked at $252 million in 1993, the
year immediately prior to NAFTA's implementation.
Over the last several years, this trade has been in the
neighborhood of $180 million. The drop in export
value is due to decreases in U.S. dairy export subsidies
(mandated by URAA), declining international dairy
prices, and other non-NAFTA factors.
Nonfat dry milk is the largest single category of U.S.
dairy exports to Mexico, accounting for 29 percent of
export value in 2000. Exports to Mexico of this
product continue to fluctuate substantially under
NAFTA, ranging from 2,030 metric tons in 1997 (with
a value of $3 million) to 61,363 metric tons in 1999
(with a value of $88 million). This type of fluctuation
in dairy trade with Mexico was common prior to
NAFTA. U.S. nonfat dry milk exports fluctuate greatly
as Mexico shifts between competing suppliers.
Trade Issues
Canada's TRQ's for Dairy Products. Canada's conversion of its dairy quotas to TRQ's under URAA prompted
a serious trade dispute with the United States. The
United States argued that NAFTA prohibits its member
countries from imposing import tariffs for other member
countries that are higher than what is specified in the
agreement. In addition, the United States argued that
each member country must eliminate tariffs in accordance with NAFTA. Canada's view was that URAA
gave it the right to convert non-tariff barriers to TRQ's
and to apply those TRQ's to the United States.
On December 2, 1996, the NAFTA dispute settlement
panel issued its final report, finding that Canada's
application of its new TRQ's to U.S. goods conforms
with its NAFTA obligations. Consequently, U.S.
access to the Canadian market for dairy products
remains unchanged. There is no appeal process in
NAFTA's dispute settlement mechanism.
Tariff Classification for Butteroil/Sugar Blends. Since
1995, Canadian processors have been importing a
blend of 49 percent butteroil and 51 percent sugar
from various countries, including the United States.
This blend is primarily used to produce ice cream.
When taken separately, the two products face high
import barriers. Butterfat imports face a TRQ, while a
countervailing duty applies to sugar. Currently, there is
neither a tariff nor a quantitative limit concerning how
much of the butteroil/sugar blend may enter Canada,
so imports have increased considerably. Dairy
producers in Canada claimed that the Canadian
government applied the wrong tariff classification
when the product was first imported and that imports
circumvent Canada's TRQ's for dairy products. On
March 26, 1999, the Canadian International Trade
Tribunal (CITT) ruled that imports of butteroil/sugar
blends should not be reclassified under a different
tariff line. Producer entities have filed an appeal, but
the appeal has not yet been decided.
Canadian Export Subsidy Case at the WTO. In May
2001, Canada, New Zealand, and the United States
reconvened before a WTO panel for hearings regarding
Canada's measures to come into compliance with an
earlier WTO ruling against Canada's dairy export
regime. The original WTO panel ruled that Canada's
Special Milk Classes constituted export subsides under
URAA and that Canada therefore was not meeting its
reduction commitments.
During the hearings, New Zealand and the United
States expressed their continued discontent with the
new provincial dairy programs that Canada implemented in August 2000. Although Canada has modified its export program, the United States feels that the
newly instituted measures share all of the critical
elements that made the former special class system an
export subsidy. The WTO Panel is expected to present
their ruling by August 2001.
NAFTA's Impact on Dairy Trade
CFTA and NAFTA have had little direct impact on
U.S. dairy exports to Canada, as there was little
change in dairy access under either agreement. On the
whole, market access into Canada was limited by
quotas and licenses prior to URAA and remains
limited by prohibitive tariffs on over-TRQ quantities.
There have been considerable year-to-year changes in
U.S.-Canada dairy trade on a percentage basis.
However, since the quantities traded between the two
68 ✺ Effects of NAFTA on Agriculture and the Rural Economy / WRS-02-1
Economic Research Service, USDA
countries are small, minor changes in volume and
value produce large percentage changes in trade.
Although NAFTA has expanded U.S. access to the
Mexican market, factors other than NAFTA have
caused U.S. dairy exports to Mexico to decrease,
compared with their level immediately prior to the
agreement. Under URAA, the United States agreed to
Economic Research Service, USDA
cuts in export subsidies, and this has been a major
factor in limiting U.S. dairy exports to Mexico.
Mexico's TRQ's under NAFTA are not an impediment
to U.S. dairy exports, as the United States only fills
about 75 percent of Mexico's import quota for U.S.
dairy products.
William Hahn (202-694-5175, [email protected])
The Effects of NAFTA on Agriculture and the Rural Economy / WRS-02-1 ✺ 69
Grains, Oilseeds, and Related Products
Corn
Policy Changes Resulting
from NAFTA
United States. Before NAFTA, the United States maintained tariffs of $2.00 per metric ton on dent corn and
$9.80 per metric ton on non-seed corn other than dent.
Under NAFTA, the United States immediately eliminated its tariffs on Mexican corn on January 1, 1994,
and it continued to phase-out its tariffs on Canadian
corn, as originally negotiated under CFTA. U.S. tariffs
on Canadian corn were eliminated completely on
January 1, 1998.
Mexico. Under NAFTA, Mexico immediately eliminated its import licensing requirement for corn and
established duty-free TRQ's for the United States and
Canada. Initially, the TRQ's were set at 2.5 million
metric tons for the United States and 1,000 metric tons
for Canada. These levels increase 3 percent each year
during a 14-year transition, until the TRQ is eliminated on January 1, 2008. For 2001, the TRQ's are
3,074,685 metric tons for the United States and 1,230
metric tons for Canada.
and Mexico (table I-1). For example, in 1996, Mexico
suffered a severe drought and imported record amounts
of U.S. corn, even in the face of high U.S. export prices.
Mexico has long been a major market for U.S. corn,
with few imports from other suppliers. Trade has
varied greatly over the years, in large part because of
the impact of weather on Mexican production.
However, Mexico's corn imports shrank to low levels
during 1991-93, mainly due to Mexican agricultural
policies that stimulated domestic corn production.
Mexico's support prices for corn were well above
international levels in the early 1990's, pulling planting
area from other crops and into corn production.
Moreover, Mexican trade barriers made it easier to
purchase sorghum instead of corn.
U.S. corn exports to Mexico have exceeded the dutyfree amount specified by the NAFTA TRQ in each
year except 1997, when Mexican production increased
and total consumption declined (table I-1). Feed use of
corn in Mexico declined in 1996, and has not recovered through 2000. However, with reduced support
Table I-1—U.S. corn exports to Mexico, 1989-2000
Imports above the TRQ levels face an over-quota tariff
that is being phased out over the transition period. In
1994, the over-quota tariff equaled the greater of 206.4
percent ad valorem or 19.7 cents per kilogram. For
2001, it is the greater of 127.1 percent or 12.1 cents per
kilogram. However, Mexico generally has opted not to
apply the over-quota tariff. Beginning on June 7, 2001,
Mexico levied minor over-quota tariffs of 1 percent on
yellow corn and 3 percent on white corn. These tariffs
will remain in effect until the end of 2001.
Canada. Prior to 1989, Canada maintained import
tariffs on corn ranging from 1.73 to 2.77 Canadian
dollars per metric ton. Under CFTA and NAFTA,
Canada gradually eliminated its tariff on U.S. corn
over the 9-year period that ended on January 1, 1998.
Corn Trade under CFTA and NAFTA
U.S. corn exports to NAFTA partners generally have
been increasing under the agreement, but this trade
continues to fluctuate in response to changes in corn
production and the government policies of Canada
Year
Quantitative level of
the NAFTA TRQ
1989
1990
1991
1992
1993
1994
1995
1996
1997
1998
1999
2000
Average,
1989-93
Average,
1994-2000
Actual exports
Volume
Value
---------- Metric tons ---------n.a.
3,844,294
n.a.
3,486,277
n.a.
1,316,066
n.a.
1,137,238
n.a.
288,681
2,500,000
3,054,111
2,575,000
2,858,829
2,652,250
6,314,387
2,731,818
2,566,142
2,813,772
5,245,670
2,898,185
5,051,767
2,985,131
5,194,328
n.a.
2,736,594
Million dollars
435
400
148
129
35
340
359
1,003
317
590
527
511
2,014,511
229
4,326,462
521
n.a. = not applicable
Sources: For trade data, Foreign Agricultural Trade of the United States
database; for TRQs, NAFTA Tariff Schedule of Mexico.
70 ✺ Effects of NAFTA on Agriculture and the Rural Economy / WRS-02-1
Economic Research Service, USDA
prices and increasing consumer demand for meat, U.S.
corn exports to Mexico have stayed above 5 million
metric tons per year since 1998.
The United States also trades smaller but significant
amounts of corn with Canada. U.S. corn exports to
Canada have increased in years when corn production
in eastern Canada failed to keep pace with domestic
demand. Strong demand in Canada, both for feeding
and industrial processing, boosted these exports to 1.2
million metric tons in 1998. However, Canada
harvested a record large corn crop in the fall of that
year, so U.S. corn exports to Canada declined to
968,971 metric tons in 1999. With sharply reduced
production and expanding animal numbers, these
exports reached a record of nearly 1.5 million metric
tons in 2000, with a value of $126 million.
U.S. corn imports from Canada averaged 315,004
metric tons per year during 1992-96, but they slipped
below 220,000 metric tons in 1997, 1998, and 2000,
years of low Canadian production. Imports mainly
move to corn deficit areas in the eastern United States
and to Puerto Rico, where the Jones Act makes transport from U.S. origins prohibitively expensive.
Trade Issues
In response to a complaint filed by the Manitoba Corn
Growers Association, Canada's Commissioner of
Customs and Revenue launched an investigation into
the alleged injurious dumping and subsidization of
certain U.S. corn on August 9, 2000. The investigation
only concerns imports for use or consumption west of
the Manitoba/Ontario border.
On November 7, 2000, the Commissioner made a
preliminary determination of dumping and subsidizing
and assessed a provisional duty of 1.58 Canadian
dollars per bushel. Although the Commissioner's final
determination in February 2001 reduced the combined
dumping and subsidy amounts to 1.30 Canadian
dollars per bushel, the provisional duty remained in
effect until March 7, 2001. On that date, the
Commissioner issued a final ruling that ended the case
and the duties were refunded. Interestingly, the provisional duty had little effect on the volume of Canadian
corn imports from the United States. Instead, its main
impact was to divert imports to border crossings east
of the Manitoba/Ontario border.
Economic Research Service, USDA
NAFTA's Impact on Corn Trade
U.S. corn exports to Mexico are somewhat higher due
to NAFTA than they would have been otherwise.
However, the strong growth in these exports is primarily due to changes in Mexico's domestic agricultural
policies and a series of severe droughts in Mexico.
Prior to NAFTA, Mexico made substantial changes in
its domestic agricultural policies. While these were not
mandated by the trade agreement, they have provided
an important stimulus to U.S.-Mexico corn trade. First,
in the early 1990's, the Mexican government ended its
official prohibition of feeding corn to livestock. This
ban, intended to protect the supply of the country's
staple food grain, was so effective that sorghum had
become Mexico's chief feed grain.
Second, the Mexican government reduced its very high
price supports for corn in order to bring them more in
line with U.S. and international prices. This ended a
policy that distorted land use and inflated the costs of
corn to users. As a result, the amount of arable land
devoted to corn production fell, and prices have come
down to more reasonable levels for industrial users and
feeders.
CFTA and NAFTA have had a small, positive effect on
U.S.-Canada corn trade in both directions. However,
local availability of corn in eastern Canada has had a
greater impact on trade than the two agreements.
Ed Allen (202-694-5288, [email protected])
Sorghum
Policy Changes Resulting from NAFTA
United States. Under NAFTA, the United States immediately eliminated its tariffs on Mexican sorghum on
January 1, 1994.
Mexico. Under NAFTA, Mexico immediately eliminated its seasonal tariff of 15 percent on U.S. sorghum
on January 1, 1994. Canada's improved access to the
Mexican sorghum market under NAFTA is relatively
meaningless since Canada does not produce sorghum
in large quantities due to its cooler climate.
Canada. Under CFTA, Canada immediately eliminated
its tariffs on U.S. sorghum on January 1, 1989. Under
NAFTA, Canada did the same for Mexican sorghum
on January 1, 1994.
The Effects of NAFTA on Agriculture and the Rural Economy / WRS-02-1 ✺ 71
Sorghum Trade under CFTA and NAFTA
The experience of U.S. sorghum exports to Mexico under NAFTA may be divided into two periods: 1994-96
and 1997 to the present. During the first period, export
volume decreased, despite Mexico's tariff elimination
for U.S. sorghum. This decrease in trade is the product
of developments in the Mexican corn sector. Mexican
feed use of sorghum declined during 1991-94, as livestock producers started to use more corn as a feed grain.
Once the Mexican government reduced its very high
support prices for corn, the amount of land devoted to
sorghum increased and sorghum production rebounded.
As a result, Mexican feed use of sorghum has grown
since 1995. Limited water supplies for irrigation also
encourage a shift from corn to sorghum production.
As a result of increased domestic sorghum production
and product switching in livestock rations in favor of
corn, U.S. sorghum exports to Mexico declined from
3.6 million metric tons in 1993 to 3.4 million metric
tons in 1994. Exports fell to 2.2 million metric tons in
1995 and 2.0 million metric tons in 1996, as U.S. corn
exports to Mexico continued to exceed the TRQ.
However, due to higher prices during 1994-96, the
value of these imports changed less than the volume.
In fact, the value actually increased in 1994 and 1996.
This trend reversed itself beginning in 1997, as prices
declined and import volume increased. In 1999,
Mexican imports of U.S. sorghum exceeded 4 million
tons for the first time in 7 years. In 2000, these
imports reached 4.7 million metric tons, nearly
surpassing the record set in 1992. Mexico's feed manufacturers have purchased more U.S. sorghum because
the product automatically enters Mexico duty-free and
is not governed by a TRQ. In contrast, corn importers
must obtain permission from the Mexican government
to utilize the corn TRQ for Canada or the United
States. In 2001, Mexico is likely to import less
sorghum because of the small U.S. crop.
The United States also exports very small amounts of
sorghum to Canada - less than 1 percent of corn's
volume, the leading U.S. feed grain export to Canada.
Under CFTA and NAFTA, U.S. sorghum exports to
Canada have risen from 1,707 metric tons to an
average of 4,121 metric tons during 1996-2000, but
this trade remains small compared to corn.
Trade Issues
In late 1996, the Mexican government's slow issuance
of phytosanitary permits delayed U.S. sorghum exports
to Mexico. After consultations with suppliers,
importers, and end-users, the government began to
issue these permits in a more timely fashion.
NAFTA's Impact on Sorghum Trade
Without NAFTA's elimination of Mexican tariffs on
U.S. sorghum, U.S. sorghum exports to Mexico would
probably have fallen further than they did during
1994-96. Had the reduction in tariffs not occurred, it is
likely that sorghum would have been less pricecompetitive against corn and imports would have
declined further as increasing quantities of feed corn
were imported. However, if corn imports had not
increased (partly as a result of NAFTA), then U.S.
sorghum exports to Mexico would have been much
higher during 1994-2000.
The elimination of Canadian tariffs on U.S. sorghum
has helped the product to compete in the Canadian
market, but transportation costs limit the potential
growth of U.S.-Canada sorghum trade. Other U.S. feed
grains are produced closer to the Canadian border, and
sorghum's price discount is not usually enough to
interest Canadian users.
Ed Allen (202-694-5288, [email protected])
Barley
Policy Changes Resulting
from NAFTA
United States. Under CFTA and NAFTA, the United
States gradually eliminated its tariff on Canadian barley
over the 7-year period that ended on January 1, 1996.
Under NAFTA, the United States immediately eliminated its tariffs on Mexican barley on January 1, 1994.
Mexico. Prior to 1994, Mexico required the licensing
of barley imports from Canada and the United States.
In addition, Mexico's base tariff on barley was the
greater of 128 percent ad valorem or 15.5 cents per
kilogram, while its base tariff on malt was the greater
of 175 percent ad valorem or 21.2 cents per kilogram.
Under NAFTA, Mexico immediately eliminated its
import licensing requirement for U.S. and Canadian
barley on January 1, 1994. In its place, Mexico created a
duty-free TRQ for each country. For 1994, the TRQ's
were set initially at 30,000 metric tons for Canada and
120,000 metric tons for the United States. These
amounts increase by 5 percent each year, until the TRQ's
are eliminated on January 1, 2003. For 2001, the TRQ
72 ✺ Effects of NAFTA on Agriculture and the Rural Economy / WRS-02-1
Economic Research Service, USDA
for the United States equals 168,852 metric tons, and the
TRQ for Canada equals 42,213 metric tons.
Imports above these amounts face an over-quota tariff
that is being phased out over the transition period. For
1994, the initial over-quota tariff for barley was set at
the greater of 122.8 percent ad valorem or 14.8 cents
per kilogram. For malt, the initial over-quota tariff
equaled the greater of 168 percent ad valorem or 20.3
cents per kilogram. For 2001, the over-quota tariff for
barley equals the greater of 48.6 percent or 5.8 cents
per kilogram, while the corresponding tariff for malt
equals the greater of 66.5 percent or 8 cents per kilogram. These tariffs are scheduled for complete elimination on January 1, 2003.
Canada. Under CFTA, Canada agreed to a 9-year
elimination of tariffs on U.S. barley imports. Under
Article 705 of CFTA, Canada agreed to remove its
quantitative restrictions when the 2-year average of the
level of U.S. Government support for barley is less
than that of Canada's.
Canada required import licenses for U.S. barley and
barley products until August 1, 1995, when it
converted these licenses to TRQ's in accordance with
URAA. Over-quota tariffs were initially set at more
than 100 percent and then reduced by 36 percent over
the 6-year period that ended on January 1, 2001. The
within-quota tariff was eliminated on January 1, 1998.
Barley Trade under CFTA and NAFTA
The United States imports significant amounts of
malting barley from Canada, reflecting a trend that
began in the late 1980's. This trade is driven by the
relative strength of the U.S. dollar and a continued
interest in diversified supplies, dating back to the
North American drought of 1988. The largest U.S.
brewer now contracts with Canadian farmers to grow
U.S. barley varieties in Canada for use in the United
States. Following a sharp drop in U.S. feed grain
production in 1993 due to adverse weather, U.S. barley
imports nearly tripled in 1994, reaching a record 1.9
million metric tons. These imports consisted largely of
feed barley. Since 1994, imports generally have
declined in volume. In 2000, this trade equaled
566,375 metric tons, with a value of $75 million.
Virtually all the barley imported by the United States
comes from Canada.
U.S. barley exports to Mexico grew in volume during
the first three years of NAFTA, climbing steadily from
Economic Research Service, USDA
78,058 metric tons in 1993 to 269,610 metric tons in
1996. This placed Mexico as the largest foreign market
for U.S. barley, as sales to other markets slumped.
Since then, competition from Canada has caused U.S.
barley exports to Mexico to decrease. During 19972000, this trade averaged 112,673 metric tons per year.
This level is favorable when compared to 1991-93, but
it is less than the volume of trade in 1989 and 1990.
Still, Mexico is the third largest foreign market for
U.S. barley, following Saudi Arabia and Japan.
Mexico's barley imports are largely tied to the beer
industry. Most U.S. barley exports to Mexico are used
for malting. Rising beer production reflects both
domestic and export demand, with Mexico supplying a
substantial amount of beer to the United States.
Mexico is the largest beer exporter to the United
States, surpassing Canada in 1996 and Holland in
1997. However, the increase in U.S. malting barley
exports to Mexico in 1994 and 1995 was accompanied
by an overall drop in U.S. exports of malting barley.
The expansion of malting facilities in Mexico brought
about a partial shift in imports from barley malt to
malting barley to be processed in Mexico.
Trade Issues
Canadian TRQ on Barley. Under URAA, Canada
converted its barley import license to a TRQ. The United
States viewed the creation of the TRQ as a violation of
NAFTA, since the agreement generally prohibits
member countries from increasing tariffs or introducing
new tariffs. Ultimately, Canada and the United States
presented their arguments before a NAFTA dispute resolution panel. On December 2, 1996, the panel issued its
final report, finding that Canada's application of the TRQ
to U.S. goods conforms with its NAFTA obligations.
However, in 1998, Canada agreed to eliminate the TRQ,
setting the stage for increased U.S. barley exports to
Canada. This trade topped 30,000 metric tons in 1999
and 2000, as product moved to feedlots near the border
in Alberta and Saskatchewan. Still, these volumes are
relatively small.
NAFTA's Impact on Barley Trade
U.S. barley imports from Canada have been very large
since 1994, but the impact of CFTA and NAFTA on
this trade has been minor at best. The sharp rise in
U.S. barley imports from Canada in 1994 was mainly
the result of a feed grain shortage in the United States
caused by flooding in the U.S. Midwest during 1993,
not because of NAFTA.
The Effects of NAFTA on Agriculture and the Rural Economy / WRS-02-1 ✺ 73
NAFTA has had a small, positive impact on U.S. barley
exports to Mexico, with guaranteed annual increases in
the duty-free TRQ of 5 percent. In the absence of
NAFTA, Mexico's import licensing requirement would
have continued to limit barley imports for feed, but it is
likely that Mexico's expanding beer industry would have
encouraged the Mexican government to issue additional
import licenses for malting barley.
Ed Allen (202-694-5288, [email protected])
Oats
Policy Changes Resulting
from NAFTA
United States. The United States already had a Most
Favored Nation (MFN) tariff of zero on oats prior to
1989, and it has continued this policy under CFTA and
NAFTA.
Mexico. Mexico applies an MFN tariff of 10 percent
ad valorem on oats imports. Under NAFTA, Mexico is
phasing out its tariffs on U.S. and Canadian oats over
the 9-year period that ends on January 1, 2003. For
2001, the tariff equals 2 percent.
Canada. Canada already had an MFN tariff of zero on
oats imports prior to 1989, and it has continued this
policy under CFTA and NAFTA. Under Article 705 of
CFTA, Canada ended its import licensing requirement
for U.S. oats and oat products in 1989.
Oat Trade under CFTA and NAFTA
The United States is the largest oats importer in the
world, despite exporting small quantities to the
NAFTA partners, and Canada is the largest oats
exporter to the United States. U.S. oat imports from
Canada are now substantially larger in volume than
they were prior to CFTA, but this trade continues to
experience sharp fluctuations from one year to the
next. During the first 5 years of CFTA (1989-93), U.S.
oat imports from Canada ranged from 296,272 to
984,515 metric tons, compared with 298,580 metric
tons in 1987 and 417,567 metric tons in 1988. In 1994,
this trade reached 1.1 million tons, the first time that
U.S. oat imports from Canada had surpassed the mark
of 1 million metric tons.
subsidies available for Scandinavian oats fell, opening
the door for increased Canadian oat exports to the
United States at the expense of European producers. In
1997, exports reached 1.5 million metric tons, establishing a new record. In 1998 and 1999, they dropped
to about 1.1 million metric tons per year, as the EU
provided increased competition. In 2000, reduced
competition from the EU allowed Canadian oat
exports to the United States to reach 1.4 million metric
tons, with a value of $117 million.
Today, the oats markets of Canada and the United
States are more closely integrated than the markets of
most other commodities. The removal of oats from the
control of the Canadian Wheat Board in 1988 was an
important step that has allowed free markets to evolve.
The relative strength of the U.S. dollar has made
purchases of Canadian oats more attractive, and
Canada generally produces more consistent supplies of
high-quality oats than the United States. While U.S.
oats production has continued to decline, Canada's oats
production has increase slightly in recent years. There
is some evidence of more oats being grown in
Manitoba, closer to the U.S. population centers.
However, the major growing areas are in the more
distant provinces of Alberta and Saskatchewan.
Trade Issues
There have been no trade issues involving oats.
NAFTA's Impact on Oat Trade
CFTA and NAFTA have not directly affected U.S.Canada oat trade, because the U.S. tariff on oats from
Canada and other sources was already set at zero. The
increase in oat imports from Canada during 1994 and
1995 reflects longer-term trends of more integration of
the countries' grain markets, especially with the
removal of the Canadian Wheat Board (CWB) from
oat trade. The United States has increasingly become a
net importer of oats and, because of geographical
proximity, an attractive market for Canada. The accession of Finland and Sweden to the EU accelerated this
trend by limiting their ability to compete in the U.S.
market.
Ed Allen (202-694-5288, [email protected])
Historically, Finland and Sweden have been Canada's
two main competitors in the U.S. market for imported
oats. However, when Finland and Sweden joined the
European Union (EU) in 1995, the amount of export
74 ✺ Effects of NAFTA on Agriculture and the Rural Economy / WRS-02-1
Economic Research Service, USDA
Wheat
Policy Changes Resulting
from NAFTA
United States. Under CFTA, the United States phased
out its tariffs on Canadian wheat over the 9-year period
that ended on January 1, 1998. Under NAFTA, the
United States gradually eliminated its tariffs for
common wheat from Mexico over the 4-year period that
ended on January 1, 1998, and it is doing the same for
durum wheat from Mexico over the 9-year period that
concludes on January 1, 2003. For 2001, the tariff for
durum wheat equals 0.154 cents per kilogram.
Mexico. Under NAFTA, Mexico immediately eliminated its import license requirement for all wheat on
January 1, 1994. In addition, Mexico is phasing out its
tariff on U.S. and Canadian wheat over the 9-year
period that ends on January 1, 2003, starting from a
base of 15 percent ad valorem. For 2001, the tariff rate
equals 3 percent.
Canada. Under CFTA and NAFTA, Canada gradually
eliminated its import tariff on U.S. wheat over the 9year period that ended on January 1, 1998. Under the
provisions of CFTA's Article 705, Canada removed its
import license requirement for U.S. wheat and wheat
products in 1991.
Wheat Trade under CFTA and NAFTA
North American wheat trade has grown erratically
under CFTA and NAFTA, with weather playing an
important role. U.S. wheat exports to Mexico averaged
1.6 million metric tons per year during 1996-2000,
more than 3 times the average volume during 1989-94.
U.S. wheat imports from Canada broke the mark of 1
million metric tons for the first time in 1992 and
peaked at 2.4 million metric tons in 1994. Since then,
imports have ranged from 1.5 to 2.2 million metric
tons per year.
Mexico's total wheat imports and its wheat imports
from the United States declined in the first year of
NAFTA (1994) because favorable weather resulted in a
large Mexican wheat crop. Two years of drought
followed, reducing the Mexican crop and boosting
imports, in spite of the Mexican peso crisis in late
1994 and its accompanying recession in 1995. Lower
exports supplies in Canada also helped to strengthen
U.S. wheat exports to Mexico in 1995. Both Canada
and the United States provide export credit guarantees
to Mexico. These guarantees helped sustain Mexican
Economic Research Service, USDA
wheat imports when foreign exchange might have
been a constraint. Although NAFTA tariff reductions
were implemented gradually, they helped to facilitate
Mexican imports during the drought years of 1995 and
1996 and helped to mitigate the damage to Mexican
import demand caused by the peso crisis.
Since 1996, Mexico's wheat area generally has
remained lower than its level during 1982-95 because
of the many alternative uses for irrigated land. As
wheat consumption has grown with an improving
economy, Mexico's total imports have reached record
levels. However, competition between Canada and the
United States has been intense, since Mexico is
phasing out its tariffs on both Canadian and U.S.
wheat as part of NAFTA. Year-to-year changes in
Mexican wheat production also affect U.S. wheat
exports to Mexico. As a result, U.S. wheat exports to
Mexico have fluctuated over the last 5 years, ranging
from 1.1 million metric tons in 1997 to 1.8 million
metric tons in 1999. In 2000, this trade equaled 1.7
million metric tons, with a value of $197 million.
Canada is the main source of U.S. wheat imports,
being a surplus producer with low transport costs to
much of the U.S. market. In 1994, U.S. wheat imports
from Canada surged to 2.4 million metric tons, an
increase of 36 percent over the previous year's level.
This dramatic increase was caused primarily by
weather-related events in Canada and the United States
and not by CFTA and NAFTA. Wet weather at harvest
time and disease damaged the quality of Canada's
wheat crop in 1993, and since the 1992 crop was also
of low quality, Canada's supply of feed wheat was
exceptionally high. At the same time, summer flooding
in the U.S. Midwest dramatically reduced the size of
the U.S. corn crop. With feed wheat supplies unusually
large in Canada and feed grain supplies tight in the
United States, the stage was set for a surge in U.S.
imports of Canadian wheat.
U.S. wheat imports from Canada dropped to 1.5
million metric tons in 1995 and 1.3 million metric tons
in 1996, as grain supplies on each side of the border
returned to a more normal situation. Moreover, the 1year TRQ and end-use certificates (EUC's) imposed in
the latter stages of 1994 (see Trade Issues section)
may have offset any stimulus to trade caused by
reduced tariffs. Also, U.S. wheat imports from Canada
continued to decline in 1996 because of limited
supplies within Canada and because other export destinations offered higher returns than the U.S. market.
The Effects of NAFTA on Agriculture and the Rural Economy / WRS-02-1 ✺ 75
This was the result of a dramatic increase in world
wheat prices in 1995/96.
Since 1997, U.S. wheat imports have been concentrated
in the U.S. Northeast, where wheat producers from
eastern Canada have a comparative transportation
advantage over wheat growers in the western United
States. During 1997-99, this trade averaged 2.1 million
metric tons per year. In 2000, imports declined slightly
to 1.8 million metric tons, with a value of $227 million.
Trade Issues
Of all the grains, wheat has experienced the most
contentious trade disputes since the implementation of
NAFTA.
Tariff Rate Quota on U.S. Wheat Imports from
Canada. The sharp rise in U.S. wheat imports from
Canada during the 1993/94 crop year, following
several years of increasing imports, resulted in a
request for a U.S. International Trade Commission
(ITC) Section 22 investigation. The ITC determined
that the increased imports of wheat, wheat flour, and
semolina were materially interfering with USDA's
price and income support programs and forwarded its
recommendations for possible action to the President.
These recommendations ranged from a strict import
quota of 900,000 metric tons to various TRQ's.
In September 1994, Canada and the United States
confronted this unfolding dispute by completing a
Memorandum of Understanding (MOU) on Grains.
Under the MOU, the United States established a
temporary TRQ for the 12-month period running from
September 12, 1994 to September 11, 1995. Access at
the lower NAFTA tariff levels was limited to 300,000
metric tons for durum wheat and 1,050,000 metric
tons for other wheat (excluding white winter wheat not
produced in western Canada).
Mexico's Countervailing Duty Investigation on U.S.
and Canadian Wheat Imports. On April 4, 1994, the
Mexican government initiated a countervailing duty
investigation on subsidized wheat imports from the
United States and Canada. Mexico also began to subsidize flour millers that purchased domestic wheat. The
subsidy was set at a value equal to the price difference
between imported and domestic wheat. Austerity
measures led to the cancellation of this subsidy in
1995. In March 1996, the Mexican Government terminated the investigation because the United States had
stopped using the Export Enhancement Program (EEP)
and because Canada had eliminated the Western Grain
Transportation Act (WGTA) on July 31, 1995. The
WGTA was the only wheat export subsidy notified by
Canada in the Uruguay Round negotiations.
Karnal Bunt. A fungal disease has presented challenges to the U.S. wheat industry. Karnal bunt is harmless to humans but can cause an unpleasant odor and
taste in flour made from wheat that is highly affected
by the disease. The fungus is spread by airborne
spores that also can be carried on plants, soil, farm
equipment, and vehicles.
The first discovery of Karnal bunt in the United States
occurred in March 1996 in Arizona. Subsequently, the
fungus was found in parts of California, New Mexico,
and Texas. During 1999 and 2000, the fungus was not
found in national surveys. However, wheat fields in
several parts of Texas were found to be infected in
June 2001. Currently, USDA and the Texas
Department of Agriculture are working to address the
problem, and a Federal quarantine has been imposed
in areas where Karnal bunt was detected.
Canada's initial response to the 1996 discovery was to
ban all imports and trans-shipments of U.S. durum
wheat and all grain imports from the four quarantined
States in order to ensure the integrity of the Canadian
grain system. Although Canada only imports a small
amount of U.S. wheat, approximately 1 million tons of
U.S. wheat annually pass through the Canadian ports
of the St. Lawrence Seaway system to third-country
markets. Following bilateral negotiations with the
United States, Canada agreed to permit in-transit shipments of U.S. wheat through the Seaway once again,
beginning in early April 1996. In-transit shipments are
those that do not stop at Canadian ports. Canada also
allowed non-durum wheat from the United States to be
transshipped through Canadian grain elevators and
agreed to reassess its prohibition on durum wheat
based on additional survey and sampling data provided
by the United States.
Following the signing of a Record of Understanding
on agricultural trade in December 1998, Canadian and
U.S. authorities have worked to establish new
phytosanitary requirements that adequately address the
Karnal bunt problem while providing greater opportunities for U.S. wheat exports to Canada. As part of the
Wheat Access Facilitation Program, approved growers
in eligible States may ship wheat under a “Master
Phytosanitary Certificate.” With this certificate, each
individual wheat shipment is not required to be tested,
76 ✺ Effects of NAFTA on Agriculture and the Rural Economy / WRS-02-1
Economic Research Service, USDA
as long as at least one sample per grower, per crop, is
officially tested and found to be free of Karnal bunt
spores. This program was implemented for Montana
and North Dakota in 1999. In addition, Canada has
applied a “regionalized” approach to the testing of
U.S. wheat exports for Karnal bunt. As of April 1,
1999, Canada recognized 14 States to be free of
Karnal bunt: Connecticut, Maine, Massachusetts,
Michigan, Minnesota, Montana, New Hampshire, New
Jersey, New York, North Dakota, Pennsylvania, Rhode
Island, Vermont, and Wisconsin.
After the first U.S. discoveries of Karnal bunt, Mexico
announced that it would prohibit the importation of
wheat produced or stored in Arizona, New Mexico,
California, and certain parts of Texas. Mexico will
import U.S. wheat from non-quarantined areas if the
grain is tested and certified to be free of Karnal bunt
or, if produced within the quarantine area, fumigated
with methyl bromide.
Karnal bunt has been detected in some areas of northwest Mexico since the late 1970's, long before the
implementation of NAFTA. In 1983, the United States
banned wheat imports from Mexico to prevent the introduction of the fungus. Article 722 of NAFTA established a Committee on Sanitary and Phytosanitary
Measures. In the committee's June 1996 meeting,
Mexico sought recognition from the United States that
the Mexicali Valley region is free of Karnal bunt and
eventually a protocol was established allowing some
Mexican wheat to enter the United States.
End-Use Certificates. As a result of the Article 705
calculations under CFTA, Canada removed its import
licensing requirement for U.S. wheat and wheat products in 1991. Subsequently, Canada required that U.S.
wheat be accompanied by an end-use certificate (EUC)
to ensure that Canadian variety controls and quality
standards are maintained. The purpose of the U.S.
EUC requirement is to prevent imports from benefiting
from U.S. export programs. The United States will
continue this requirement as long as Canada also
maintains its EUC requirement.
The JCG examined the EUC requirements of both
Canada and the United States and concluded that the
requirements were cost-raising irritants to trade. As a
result, the JCG recommended that both countries eliminate their EUC requirements. Unfortunately, Canada
and the United States have not been able to agree upon
a satisfactory replacement for the EUC's.
Economic Research Service, USDA
Section 301 Case. In response to a petition filed by the
North Dakota Wheat Commission on October 23,
2000, the U.S. Trade Representative initiated a Section
301 investigation of certain trade practices of the
Canadian Wheat Board (CWB). It is alleged that the
CWB engages in unreasonable trade practices, both in
the United States and in third countries, and that these
practices have resulted in economic harm to U.S.
wheat growers. According to the petition, the CWB
has pricing flexibility not available to private wheat
traders, which allows it to make standing offers to
undersell U.S. wheat in certain markets, consistently
offering to sell wheat at less than the market value.
NAFTA's Impact on Wheat Trade
Policy changes, including those associated with
NAFTA, resulted in record wheat imports by Mexico
in 1998, even though the tariff reduction was not large.
The indirect effect of NAFTA on Mexico's wheat area
may contribute significantly to increasing imports.
Under NAFTA, U.S. wheat exports to Mexico have
risen from 967,000 tons in 1993 to 1.7 million tons in
2000. The value of these exports jumped from $143
million in 1993 to $344 million in 1996, as U.S. prices
gained strength due to tight supplies and strong
demand, but with lower prices in 1997 and 1998 the
value of wheat shipments has declined.
Tariff reductions under CFTA and NAFTA have
contributed to increased U.S. wheat imports from
Canada. The sharp rise in U.S. wheat imports from
Canada in 1994 was mainly the result of weatherrelated events and not because of the two agreements.
However, NAFTA has facilitated imports, as Canadian
grain flows that used to run from west to east within
Canada due to tariffs, quotas, and transportation subsidies, now move south to the United States, in keeping
with the expectations of location economics.
Confronting uneven State enforcement of U.S. trade
regulations, and asymmetrical wheat trade regulations,
Canada and the United States negotiated an agreement
in 1998 that improved U.S. access to Canadian
markets and allowed for the careful monitoring of
trade. However, U.S. wheat is not moving to Canada in
any significant volume. During 1991-94, U.S. wheat
exports to Canada averaged 21,250 metric tons per
year, but they equaled only 496 metric tons in 2000
and just 20 metric tons in 1999.
Although U.S. wheat exports to Canada in the form of
grain have been insignificant despite CFTA and
The Effects of NAFTA on Agriculture and the Rural Economy / WRS-02-1 ✺ 77
NAFTA tariff reductions, wheat product exports have
continued to grow. Tariff reductions helped increase
U.S. wheat product exports to Canada. Canada
removed its import licensing requirement for U.S.
wheat and wheat products in 1991 under the calculations of CFTA Article 705.
Ed Allen (202-694-5288, [email protected])
Rice
Policy Changes Resulting
from NAFTA
United States. Prior to 1995, the general U.S. tariff on
imported rice ranged from 0.69 to 3.3 cents per kilogram, depending on the type of rice. Under the
URAA, the United States reduced this tariff by 36
percent over the 6-year period that ended on January
1, 2001. For example, the MFN tariff for regular
milled white rice dropped from 2.2 to 1.4 cents per
kilogram. Under NAFTA, the United States is phasing
out its tariff on Mexican rice over the 9-year period
that ends on January 1, 2003.
Mexico. Before NAFTA, Mexico imposed import tariffs
for the United States of 20 percent on brown and milled
rice and 10 percent on rough and broken rice. In 1990,
the tariff rate for milled and brown U.S. rice was raised
from 10 percent to 20 percent in response to demands
from Mexican millers who wanted to maintain a high
mill utilization rate. Under NAFTA, Mexico is gradually
lowering these rates to zero over the 9-year period that
ends on January 1, 2003. For 2001, the tariff rates are 4
percent for brown and milled rice and 2 percent for
rough and broken rice.
Canada. Under CFTA and NAFTA, Canada steadily
reduced its tariffs on milled and semi-milled rice from
the United States, until these tariffs reached zero on
January 1, 1998.
Under URAA, Canada reduced its tariff for broken rice
and whole or semi-milled rice from countries with MFN
status from 5.51 to 3.53 Canadian dollars per metric ton
over the 6-year period that ended on January 1, 2001.
Canada's MFN tariff for 2001 is equivalent to about 2
percent of the average price of Thailand's high quality
long grain rice (100 percent, Grade B).
Canada does not levy an import tariff on brown or
rough rice. Canada produces no rice domestically, and
Mexico does not export rice to Canada.
Rice Trade under CFTA and NAFTA
U.S. rice exports to Canada and Mexico have
increased 81 percent by volume and 54 percent by
value since the inception of NAFTA, even though total
U.S. rice exports have not exhibited any long-term
growth. The volume of rice exports to Mexico in 2000
was more than three times the volume of rice exports
to Canada. U.S. rice trade with Mexico has continued
the general increase that was evident before January
1994 when NAFTA went into effect.
Before the mid-1980's, the Mexican government
severely restricted the importation of rice through tariffs
and quotas. Since 1982, Mexico has undergone phenomenal changes in its economic policy, becoming much
more market-oriented. By the mid-1980's, the government began to phase out its protectionist policies and
introduced major policy reforms to reduce the role of
government in the economy. In 1986, Mexico joined the
General Agreement on Tariffs and Trade (GATT) and
subsequently reduced import tariffs and import requirements for many commodities as a first step to liberalizing trade. The combined effects of this unilateral trade
liberalization and a drought were responsible for Mexico
importing a record 189,000 metric tons (milled basis) of
rice in 1989, with the United States as the sole supplier.
In 2000, the United States exported more than 560,000
metric tons (product-weight basis) of rice to Mexico,
making it the largest single-country foreign market for
U.S. rice that year. On a milled-equivalent basis, over
two-thirds of U.S. rice sales to Mexico are rough rice.
The United States currently has a virtual monopoly on
rice trade with Mexico, primarily due to phytosanitary
restrictions on Asian rice that Mexico enacted in 1993.
During 1990-93, Mexico imported substantial quantities of Asian rice, but Mexico's crop was diminished
by infestations believed to have come from rice
imported from Asia. Citing fears of contamination
from the Khapra beetle and other infestations, the
Mexican government banned the importation of all
Asian rice on September 20, 1993. The Khapra beetle
was eradicated more than 40 years ago in the United
States, and no known U.S. infestation currently exists.
In December 1996, Mexico dropped its absolute ban
on Asian rice in compliance with the WTO. Asian rice
access to Mexico is now subject to a detailed risk
analysis of diseases and pests. Rice imports from Asia
are impractical under these rules. Besides the United
States, Argentina and Uruguay are the only other
major foreign suppliers of rice to the Mexican market.
78 ✺ Effects of NAFTA on Agriculture and the Rural Economy / WRS-02-1
Economic Research Service, USDA
Per capita rice consumption in Mexico has risen slowly
since the mid-1990's, reaching almost 13 pounds in
2000, but it is still less than half the U.S. level. Even
today, Mexico has one of the lowest per capita consumption rates of any Latin American country, implying
substantial room for growth. Rice generally has been the
most expensive food grain in Mexico, with consumer
prices increasing faster than those for other staple foods.
The United States is the largest supplier of rice to
Canada, accounting for about 70 percent of Canada's
annual imports. Thailand supplies most of the rest.
Canada also purchases high-priced basmati rice from
India and Pakistan and small quantities of high-quality
japonica from Italy. Imports from these non-U.S.
sources increased during the 1990's.
Canada's rice imports have exhibited noticeable
growth since the late 1980's, after being nearly stagnant during the prior decade. U.S. rice exports to
Canada reached a record 183,127 metric tons in 1999
and declined slightly to 179,954 metric tons in 2000,
compared with less than 94,000 metric tons in 1988.
More than half of these exports are high-quality,
regular milled, long-grain white rice. Brown rice and
parboiled rice each account for nearly 20 percent.
Canada's imports of rough rice are negligible.
With no domestic rice production, Canada's import
expansion can be traced primarily to population
growth, the changing tastes of consumers, and the
ethnic composition of recent immigrants. Although
growth in per capita use has recently slowed, per
capita consumption is now almost 18 pounds, more
than twice the level estimated in 1985. Lower tariffs
on U.S. rice under CFTA and NAFTA and on rice
from other countries under URAA have slightly
reduced the price of rice in Canada, likely accounting
for a small share of the increase in rice consumption
since 1989. However, the tariff on U.S. rice was not
very high when CFTA went into effect - less than 2
percent of the price of imported U.S. rice - and overall,
rice is an inexpensive food in Canada.
Trade Issues
Mexican Phytosanitary Requirements for Asian Rice.
On December 12, 1996, the Mexican government
issued new import regulations that specified diseasefree requirements for rice of Asian origin and required
extensive quarantines for rice from some countries.
While the new regulations have not yet directly opened
the market to Asian rice, they potentially pave the way
Economic Research Service, USDA
for disease-free Asian varieties to enter Mexico. Asian
access is subject to the presentation of a detailed pest
risk analysis indicating that the applying country is
free of certain pests and diseases. Although Thailand
has long pressured Mexico on this point, there is no
indication that any Asian country has presented the
proper documentation as of yet.
Mexican Detention of Railcars with U.S. Paddy Rice.
In November 1998, Mexican authorities detained a
number of railcars containing U.S. paddy rice destined
for Mexican mills, citing phytosanitary concerns. In
early December 1998, the Mexican government
released the railcars.
Mexico Initiates Antidumping Investigation of U.S.
Milled Rice. In December 2000, the Mexican government began an antidumping investigation concerning
long-grain milled rice from the United States. Mexican
millers allege that U.S. long-grain milled rice is being
sold to Mexican buyers at prices less than those
prevailing in the United States for comparable products. Preliminary results of Mexico's investigation will
be released in late June, indicating whether or not any
antidumping duties will be applied to U.S. exports of
long-grain milled rice.
NAFTA's Impact on Rice Trade
Because Mexico's phytosanitary requirements effectively ban rice imports from Asia, NAFTA has had
only a minor positive effect on U.S. rice exports to
Mexico. However, without these strict phytosanitary
standards, the tariff advantage enjoyed by the United
States under NAFTA would be very important.
Given the unique U.S. position in the Mexican rice
market, it is worthwhile to consider the potential
impact on various classes of rice should Asian
exporters find a way to satisfy Mexican phytosanitary
concerns. In the market for milled rice, Thailand and
Vietnam would likely have a price advantage over the
United States, even when the transportation cost of
shipping rice from Asia to Mexico is taken into
account. However, other factors would favor U.S.
milled rice over Asian rice. First, improvements in the
transportation system to move rice from the United
States to Mexico have increased the competitiveness of
U.S. producers. Second, Mexican consumers seem to
prefer the high quality and consistency of U.S. rice
over lower-quality Asian rice and even high-quality
Thai rice. Finally, U.S. rice can be shipped to Mexico
in a much shorter time and in much smaller amounts
The Effects of NAFTA on Agriculture and the Rural Economy / WRS-02-1 ✺ 79
than rice from Thailand or Vietnam. However, if both
the current ban and NAFTA did not exist, it is quite
conceivable that Thailand and Vietnam would export
substantial quantities of milled rice to Mexico at prices
below the current U.S. level.
In the rough rice market, the United States would still
be competitive, even if Asian exporters satisfactorily
addressed Mexico's phytosanitary concerns. Several
factors are responsible. First, neither Thailand nor
Vietnam export rough rice, preferring to gain the value
added from milling. In fact, no major rice-exporting
country in Asia allows the shipment of rough rice.
Although the major South American exporters export
some rough rice, these shipments are currently quite
small. Second, Mexico places a lower import tariff on
rough rice than on milled rice. And third, Mexican
millers prefer to import rough rice in order to maintain
a high degree of mill utilization and to avoid competition with low-priced foreign milled rice.
However, with the upcoming elimination of Mexico's
preferential tariff on rough rice in 2003, it is not
obvious whether Mexico will continue to import
primarily U.S. rough rice or shift to importing mostly
milled rice, and if so, from which source. Although the
United States would retain its transportation advantage, greater competition from South American
exporters in the milled or rough rice market is
possible, especially should the proposed Free Trade
Agreement of the Americas (FTAA) be completed and
implemented. Both Argentina and Uruguay currently
ship small amounts of rice to Mexico.
The impact of CFTA and NAFTA on U.S. rice exports
to Canada is quite small, probably less than 1 percent
in volume. Continued tariff reductions under NAFTA
have helped the United States remain the major rice
exporter to Canada, and perhaps they have expanded
U.S. sales to Canada by a very small amount.
Although NAFTA gives the United States a price
advantage over other exporters, most Asian rice
exporting countries - except Thailand - currently ship
rice of a quality lower than that favored in highincome countries. Rice shipped from Burma and
Vietnam, as well as non-basmati rice from Pakistan
and India, does not compete with U.S. rice in highquality markets like Canada, and it is highly unlikely
that such competition would have occurred in the
absence of CFTA and NAFTA. With the United States
already Canada's principal supplier of high-quality
long-grain rice, only a small share of expanding sales
can be attributed to NAFTA.
However, Asian rice-exporting countries do possess a
cost advantage over U.S. producers. If any of these
exporters significantly improve the quality of their rice
- by reducing the percent broken, improving their
milling structure, or upgrading their drying, transporting, and packaging facilities - then NAFTA would
become more important to maintaining the U.S.
market position. Thailand already exports high-quality
long grain rice as well as jasmine, its high-priced
specialty rice. U.S. prices are generally well above
prices for Thai rice of comparable quality. Packaging,
marketing, quality, and lower transportation costs are
likely more important to U.S. rice sales to Canada than
the elimination of U.S.-Canada rice tariffs under
CFTA and NAFTA.
For the U.S. rice sector, NAFTA's primary effects have
been increased exports, slightly higher U.S. prices, and
a fractional increase in production due to the higher
prices. Since rough rice accounts for the bulk of the
increase in U.S. exports, little if any expansion in mill
employment has resulted from NAFTA. However, very
small increases in employment resulting from greater
handling and transportation may have resulted due to
larger export volumes.
Nathan Childs (202-694-5292, [email protected])
Oilseeds and Oilseed
Products
Policy Changes Resulting
from NAFTA
United States. Prior to 1989, the United States levied
the following general tariffs on imported oilseeds and
oilseed products:
80 ✺ Effects of NAFTA on Agriculture and the Rural Economy / WRS-02-1
Soybeans
Soybean oil
Soybean meal
Sunflower seeds
Rapeseed
Rapeseed meal
Canola oil
Flaxseed
zero
22.5 percent
0.3 cents per pound
zero
0.4 cents per bushel
0.12 cents per pound
7.5 percent
22 cents per bushel
Economic Research Service, USDA
Under CFTA, the United States immediately eliminated its tariffs for Canada on rapeseed, rapeseed
meal, canola oil, and flaxseed on January 1, 1989.1
Also, the United States phased out the tariffs on
soybean oil and soybean meal over the 9-year period
that ended on January 1, 1998.
Under NAFTA, the United States immediately eliminated its tariffs for Mexico on soybean meal, rapeseed,
rapeseed meal, canola oil, and flaxseed on January 1,
1994. In addition, the United States is phasing out its
tariff on Mexican soybean oil over the 9-year period
that ends on January 1, 2003. For 2001, the soybean
tariff rate is 2 percent.
Mexico. Prior to 1994, Mexico levied a seasonal tariff
of 15 percent on U.S. soybeans. Under NAFTA,
Mexico immediately reduced this tariff to 10 percent
and narrowed the dutiable season from August 1January 31 to October 1-December 31. In addition,
Mexico is phasing out this tariff over the 9-year period
that ends on January 1, 2003. For 2001, the seasonal
tariff equals 2 percent.
Mexico also levied tariffs of 15 percent on soybean
meal, 10 percent on crude soybean oil, and 20 percent
on refined soybean oil before NAFTA. Under the
agreement, Mexico is phasing out these tariffs for the
United States, along with a tariff on minor oilseed
meals and oils, over the 9-year period that ends on
January 1, 2003. For 2001, the tariff rates equal 3
percent for soybean meal, 2 percent for crude soybean
oil, and 4 percent for refined soybean oil.
Canada. Prior to 1989, Canada levied tariffs of 7.5
percent on soybean oil and 10 percent on other
vegetable oils. Rapeseed, soybeans, soybean meal, and
other meals entered duty-free. Under CFTA and
NAFTA, Canada gradually eliminated the tariffs on
soybean oil and other vegetable oils from the United
States over the 9-year period that concluded on
January 1, 1998. Under NAFTA, Canada immediately
eliminated the same tariffs for Mexico on January 1,
1994.
1
Canola seed is a variety of the oil crop rapeseed. Rapeseed oil is
used in industrial applications such as lubricants, rubber, plastics,
and nylon. Canola was bred to have much lower levels of toxic
compounds in its oil and meal than conventional rapeseed, making
the oil safe for food applications and the meal better for livestock
feed. The U.S. Food and Drug Administration (FDA) approved
the use of canola oil in the United States in 1985.
Economic Research Service, USDA
Oilseed Trade under CFTA
and NAFTA
U.S. oilseed exports to Mexico climbed from 2.0
million metric tons in 1993 to 3.7 million metric tons
in 2000, a gain of 89 percent. Over the same period,
the value of these exports rose 62 percent to $766
million. Soybeans comprise about 95 percent of U.S.
oilseed exports to Mexico and account for nearly all
the growth in these exports. Moreover, Mexico's share
of U.S. soybean exports increased from 9 percent in
1993 to 13 percent in 2000, in both value and volume
terms. In contrast, U.S. oilseed imports from Mexico
are negligible and consist primarily of sesame seed.
The volume of U.S. oilseed exports to Mexico dropped
8 percent in 1995 in the wake of the peso crisis and
subsequent recession. These difficult conditions
sharply contracted consumer demand for poultry, pork,
and dairy products, which in turn reduced crushing
demand for oilseed meals used to feed Mexican livestock and dairy animals. As the Mexican economy
recovered in 1996, U.S. oilseed exports to Mexico
swelled 29 percent in volume, while higher prices
raised export value by 54 percent.
During 1997-2000, U.S. oilseed exports to Mexico
experienced moderate but sustained growth, with
annual increases in volume ranging from 5 to 12
percent. However, as greater world supplies depressed
oilseed prices, these exports declined in value from
$917 million in 1997 to $727 million in 1999. In 2000,
increased volume offset a decrease in price, boosting
export value to $766 million. Mexico also is importing
a steadily increasing amount of Canadian rapeseed,
which competes with U.S. exports.
New crushing facilities in Mexico have reduced the
country's dependence on meal imports, even though
U.S. soybean meal is increasingly affordable due to
NAFTA's gradual elimination of Mexico's tariff on that
product. Consequently, U.S. soybean meal exports to
Mexico dropped from 365,433 metric tons in 1994 to
138,592 metric tons in 2000, a decrease of 62 percent.
U.S. soybean meal still accounts for the bulk of
Mexican protein meal imports, however.
Between 1993 and 1998, U.S. vegetable oil exports to
Mexico doubled because of increasing consumption,
declining tariffs, and larger U.S. supplies. The peso
devaluation in December 1994 and short domestic
oilseed supplies also hurt Mexican processors. Once
the peso began to recover and tariffs for soybeans
The Effects of NAFTA on Agriculture and the Rural Economy / WRS-02-1 ✺ 81
declined, the health of Mexico's small domestic oil
processing industry started to improve, making
domestic processors more competitive with imported
oils. Still, U.S. vegetable oil exports to Mexico
equaled 430,279 metric tons in 2000, just 3 percent off
the record set in 1998. In addition, the United States
has gained a larger share of the Mexican vegetable oil
market, as greater canola seed imports have supplanted
imports of canola oil from Canada.
Between 1988 and 2000, U.S. oilseed and oilseed
product exports to Canada increased from $263
million to $566 million. With the prominent exception of vegetable oils, this change generally is not
attributable to CFTA and NAFTA, since many U.S.
oilseeds and oilseed products entered Canada dutyfree prior to CFTA.
U.S. soybean exports to Canada tend to fluctuate sometimes wildly - depending on Canada's domestic
harvest and crush margins. For instance, record
Canadian crops of soybeans and rapeseed in 1994
dropped the volume of U.S. soybean exports to
Canada by nearly 90 percent, compared with 1993.
Improved crushing margins in Canada have encouraged greater U.S. soybean exports to Canada, with
volumes of 327,027 metric tons in 1999 and 325,024
metric tons in 2000.
Canada is one of the largest markets for U.S. soybean
meal, representing 10-15 percent of total U.S. exports.
In response to rising Canadian exports and domestic
consumption, U.S. exports to Canada have climbed
gradually over the past several years, from 650,178
metric tons in 1996 to a record 808,865 metric tons in
2000. These exports were valued at $161 million in
2000. This trade is well established, as Canada did not
levy a tariff on U.S. soybean meal prior to CFTA. For
instance, U.S. soybean meal exports to Canada
equaled 706,539 metric tons in 1988, with a value of
$179 million.
U.S.-Canada vegetable oil trade is a major beneficiary
of CFTA and NAFTA, and this trade is substantial in
both directions. U.S. vegetable oil exports to Canada
increased from 36,798 metric tons in 1988 to 314,930
metric tons in 2000. Canada's share of total U.S.
vegetable oil exports (in volume) grew from 2 percent
to 15 percent over the same period. U.S. vegetable oil
imports from Canada (primarily canola oil) rose from
147,619 metric tons to 635,879 metric tons over the
1990-2000 period. In 2000, these imports were valued
at $322 million. The two major U.S. oilseed-
processing companies have plants in Canada and
Mexico, but not a majority of capacity in either.
The United States is the largest importer of Canadian
protein meals. Under CFTA and NAFTA, U.S. imports
of oilseed meals - primarily canola meal - have
increased more than five-fold, from 235,527 metric
tons in 1998 to 1.2 million metric tons in 2000. By
liberalizing vegetable oil trade, the expansion of
oilseed crushing in Canada has generated more oilseed
meals, which are primarily sold to cattle feedlots in the
United States. In 2000, U.S. canola meal imports from
Canada equaled 1.2 million metric tons, with a value
of $137 million.
The expansion of oilseed crushing in Canada has led
to greater availability of Canadian canola meal and oil
in the U.S. market. Despite a sharp reduction in
Canadian canola production in 1996, U.S. imports of
Canadian canola oils and meals, as well as rapeseed
itself, have continued to grow. High prices for protein
meal pushed U.S. canola meal imports close to 1
million metric tons in 1996 and 1997, and imports
have exceeded this mark each year since. Even record
U.S. canola acreages during 1996-98 could not ease
the relatively tight U.S. vegetable oil market, encouraging greater imports of seed and oil from Canada.
The appreciation of the U.S. dollar vis-à-vis the
Canadian dollar since 1998 also has facilitated larger
volumes of imports. This appreciation has been
coupled with much lower prices for protein meals,
cutting the value of U.S. oilseed meal imports from
Canada by 7 percent in 1998 and 20 percent in 1999.
In 2000, imports rebounded to $146 million (an
increase of 9 percent), as increased volume offset a
decrease in price.
Trade Issues
There have been no major trade issues concerning
oilseeds or oilseed products among the three NAFTA
countries.
NAFTA's Impact on Oilseed Trade
NAFTA's reduction of soybean tariffs increased U.S.
soybean exports to Mexico only marginally above what
would have occurred without the agreement. Instead,
NAFTA's major influence on soybean trade is indirect.
Lower barriers to U.S. feed grains have greatly expanded
the Mexican feeding industry, thereby creating a much
larger demand for protein meal and the imported
soybeans needed to produce it. Mexican oilseed produc-
82 ✺ Effects of NAFTA on Agriculture and the Rural Economy / WRS-02-1
Economic Research Service, USDA
tion has plummeted under import pressure, although
chronic pests and reduced government farm supports
also have eroded the incentives for domestic production.
NAFTA tariff reductions have done little to increase U.S.
soybean meal exports to Mexico because of expanded
Mexican crushing of U.S. soybeans.
In NAFTA's first 7 years, Mexico increased its share of
edible oil that came from crushing imported oilseeds, a
trend boosted by slightly greater tariff reductions for
soybeans than for competing oils and meals. The
majority of Mexican oil demand is now satisfied by oil
crushed from imported oilseeds rather than imported
oils. Still, NAFTA has modestly increased U.S.
vegetable oil exports to Mexico above what would
have occurred without the agreement.
CFTA and NAFTA have not had a major impact on
U.S.-Canada trade in oilseeds and oilseed meals, mainly
because this trade was quite liberal before CFTA. Much
of the expansion in Canada's net trade is due to a larger
surplus of canola meal (mostly used to feed cattle) and a
deficit of soybean meal (mostly used to feed swine and
poultry). Of all the oilseeds and oilseed products, CFTA
and NAFTA have most affected U.S.-Canada trade in
vegetable oil. The growth of this trade has modestly
contributed to lower U.S. prices for domestically
produced oilseeds. Between 1989 and 2000, Canadian
vegetable oil output increased 0.9 million tons, while
South American output expanded by 4.8 million and
Southeast Asian output by 12.4 million. Therefore, gains
in Canadian output have had a comparatively small
impact on the world vegetable oil market. U.S. imports
of Canadian vegetable oil are estimated to be 3-5 percent
higher than what would have occurred without CFTA
and NAFTA. The increase in U.S. vegetable oil exports
to Canada as a result of CFTA is larger in proportionate
terms but considerably smaller in absolute terms.
U.S. soybean crushing capacity expanded by 17 percent
between 1993 and 1999, but employment in the U.S.
oilseed crushing industry dropped from 10,700 in 1992
to 9,500 in 1997 (U.S. Bureau of the Census, 1997
Economic Census). Employment has steadily declined
from 17,000 in 1980, which suggests an ongoing structural change in the industry—increasing
automation—that is not related to NAFTA. In Canada,
oilseed processing expanded sharply over the last decade
as domestic oilseed production doubled. In 1987,
Canada had a daily oilseed processing capacity of 6,850
metric tons. Today, there are 11 oilseed processing plants
Economic Research Service, USDA
in Canada with nearly 1,200 employees and an operating
capacity of 16,865 metric tons per day.
Mark Ash (202-694-5289, [email protected])
Peanuts and Peanut
Products
Policy Changes Resulting
From NAFTA
United States. Prior to NAFTA and URAA, peanut
imports were limited by quotas established under
Section 22 of the Agricultural Marketing Act of 1932.
Under NAFTA, the United States established a TRQ
for Mexican peanuts (shelled/in-shell). The initial
annual quota for 1994 was 3,377 metric tons, with
over-quota tariffs of 120 percent for shelled peanuts
and 186.1 percent for in-shell. The TRQ increases 3
percent each year, and the over-quota duties are scheduled to be phased out by January 1, 2008. For 2001,
the TRQ equals 4,153 metric tons, and the over-quota
tariffs are 81.4 percent for shelled peanuts and 123
percent for in-shell peanuts.
U.S. peanut butter imports from Canada are governed
by URAA. Under the market access commitments of
this agreement, the United States established a TRQ
on imports of peanut butter/paste, with most allocated
to Canada and Argentina. The Canadian portion of the
TRQ is set at 14,500 metric tons. Under NAFTA, there
are no quantitative restrictions on U.S. imports from
Mexico of peanut butter/paste manufactured from
Mexican-grown peanuts. However, the agreement's
rules of origin stipulate that peanuts products imported
from Mexico must be made from Mexican-grown
peanuts in order to qualify for NAFTA benefits.
Mexico. Prior to 1994, Mexico had no tariff or quantitative restrictions on peanuts, but it did maintain a 20percent tariff on peanut butter. Under NAFTA, Mexico
is phasing out its tariff on U.S. peanut butter over the
9-year period that ends on January 1, 2003.
Canada. Canada has no restrictions or tariffs on
peanut imports. However, prior to CFTA, it levied
tariffs of 44.10 Canadian dollars per metric ton on
peanut butter and 7.5 percent on peanut oil. Under
CFTA and NAFTA, Canada gradually eliminated these
tariffs for the United States over the 9-year period that
concluded on January 1, 1998. Under NAFTA, Canada
immediately eliminated its tariffs on peanut oil and
peanut butter from Mexico on January 1, 1994.
The Effects of NAFTA on Agriculture and the Rural Economy / WRS-02-1 ✺ 83
Peanut Trade under CFTA
and NAFTA
During 1994-2000, U.S. exports of peanuts and products to Canada and Mexico totaled over 900,000
metric tons on an in-shell basis, with a value of $642
million. Raw peanuts accounted for the vast majority
of these exports in both the Canadian and the Mexican
cases. Of the 861,000 metric tons of raw peanuts
shipped to these countries during this period, Canada
purchased 70 percent. Although U.S. exports of peanut
products to Canada and Mexico have increased under
NAFTA, they accounted for only 5 percent of the
volume and 10 percent of the value of U.S. peanut and
peanut product shipments to these two countries
during 1994-2000. Peanut butter and paste shipments
totaled nearly 39,000 metric tons on an in-shell basis
($39 million) over the 7-year period and accounted for
81 percent of total U.S. peanut product exports (62
percent of value).
U.S. imports of peanuts and peanut products from
Mexico and Canada have increased under NAFTA.
During 1994-2000, this trade totaled 249,000 metric
tons on an in-shell basis, with a value of $188 million.
Thus, over the 7-year period since NAFTA's implementation, the United States has had a trade surplus of
nearly 660,000 metric tons of peanuts and peanut
products, with a net gain of $455 million from peanut
trade. Peanut products, primarily peanut butter and
paste, make up the majority of U.S. imports in this
category from Canada and Mexico. The United States
imported a total of 212,000 metric tons of peanut
butter and paste from Canada and Mexico during
1994-2000, accounting for 85 percent of total U.S.
imports of such products.
In the first year of NAFTA (1994), U.S. peanut exports
to Mexico (shelled and in-shell) equaled 26,004 metric
tons, a 76-percent increase above the previous year's
level. Exports remained at approximately this level
during Mexico's recession-marred year of 1995.
During 1996-99, exports held fairly steady, with an
annual average of 38,580 metric tons. In 2000, this
trade established a new record of 53,161 metric tons,
with a value of $33 million.
The TRQ that the United States established for Mexican
peanuts enabled Mexico to export substantial quantities
of raw peanuts to the United States for the first time. In
1994, these exports totaled 2,543 metric tons, compared
with the initial TRQ of 3,377 metric tons. Despite the
expanding TRQ, this trade has experienced both
increases and decreases from one year to the next. For
example, exports dropped to 4,442 metric tons in 1999,
a decrease of 21 percent compared with the previous
year's level, as Mexico increased its shipments of peanut
butter and paste. In 2000, Mexican raw peanut exports
to the United States established a new record of 6,512
metric tons, with a value of $4 million.
In July 1998, Mexico began to ship peanut butter/paste
to the United States. (A small amount also was
exported in 1994.) There are no quantitative limits on
this trade, except that the product must be manufactured from peanuts grown in Mexico. In 2000, Mexico
shipped 2,487 metric tons of peanut butter/paste to the
United States, representing 13 percent of total U.S.
imports. According to USDA's Foreign Agricultural
Service, these imports are expected to grow in the
future, as peanut butter/paste produced in Mexico
enjoys a price advantage over U.S. product made with
higher priced peanuts grown under the U.S. peanut
program. Still, these imports are expected to supply
only a small portion of U.S. consumption.2
Shelled or in-shell peanuts represent the majority of
U.S. peanut exports to Canada. Since Canada produces
no peanuts, imports are necessary to fill domestic
demand. Between 1989 and 1992, U.S. peanut exports
(shelled and in-shell) to Canada increased from 46,521
to 77,811 metric tons. During 1994-2000, these shipments averaged 86,141 metric tons per year on an inshell basis.
During the first 9 years of CFTA and NAFTA, U.S.
exports of peanut butter/paste to Canada increased
from 127 metric tons in 1989 to 4,308 metric tons in
1997. Since then, exports have declined steadily,
falling to 1,806 metric tons in 2000. Corresponding
U.S. imports from Canada averaged 14,320 metric
tons per year during 1995-2000, slightly less than the
lower-tariff level specified by the U.S. TRQ.
Trade Issues
There have been no major disputes involving peanuts.
However, a Section 22 action on peanut butter was
considered in 1994, prior to implementation of the
Uruguay Round TRQ and its application to Canada.
2
U.S. Department of Agriculture, Foreign Agricultural Service,
“Oilseeds: World Markets and Trade,” February 2001,
<htttp://www.fas.usda.gov/oilseeds/circular/2002/01-02
febcov.htm>.
84 ✺ Effects of NAFTA on Agriculture and the Rural Economy / WRS-02-1
Economic Research Service, USDA
NAFTA's Impact on Peanut Trade
Although NAFTA has had a direct impact on U.S.Mexico peanut trade, other factors such as the peso
devaluation and loss of access to credit by Mexican
importers probably had a greater influence during the
early years of the agreement. Since the implementation
of NAFTA, U.S. peanut exports to Mexico have
increased, but since Mexico had no tariff or other
import restrictions on this trade prior to 1994, the
increase cannot be directly attributed to the agreement.
Undoubtedly, NAFTA has increased U.S. peanut
imports from Mexico up to the TRQ levels. In 2000,
these imports were almost 5 times the level of total U.S.
peanut imports in 1993. Attributing the entire increase
to NAFTA would suggest that these imports are nearly
500 percent greater in volume (in comparison to a very
low base) than what would have occurred without the
agreement. The bulk of this growth took place in the
Economic Research Service, USDA
first 2 years of the agreement, when Mexican exports
expanded to fill the amount permitted under the TRQ.
The TRQ increases 3 percent per year, so future gains
will be limited to that rate until the over-quota tariff
falls enough to make Mexican peanuts competitive with
domestic production.
CFTA and NAFTA have not affected U.S.-Canada
peanut trade. The U.S. peanut program allows the
export of surplus peanuts but requires that any peanut
products exported from the United States must be
manufactured from quota peanuts. Canada produces no
peanuts, and its peanut butter/paste exports to the
United States generally do not exceed the lower-tariff
level associated with the URAA-specified TRQ.
Robert Skinner (202-694-5213,
[email protected])
The Effects of NAFTA on Agriculture and the Rural Economy / WRS-02-1 ✺ 85
Other Field Crops
Dry Beans
Policy Changes Resulting
from NAFTA
United States. Prior to 1989, the United States maintained import tariffs on dry beans ranging from 1.7 to
3.3 cents per kilogram. Under CFTA, U.S. duties on
Canadian dry beans were to have been phased out over
a 9-year period, but this process was accelerated and
completed ahead of schedule. Under NAFTA, the
United States immediately eliminated its tariffs on
Mexican dry beans on January 1, 1994.
Mexico. Prior to 1994, Mexico restricted dry bean
imports through import licenses. Under NAFTA,
Mexico eliminated its licensing requirement and
granted the United States a duty-free TRQ for
common dry beans of 50,000 metric tons. Canada
received a TRQ of 1,500 metric tons. The over-quota
tariff for both countries was set initially at $480 per
metric ton, but not less than 139 percent ad valorem.
From 1994 to 1999, this tariff was reduced by a total
of 24 percent. Over the period 2000-08, it is being
phased out in equal increments. Concurrently, the
quotas expand 3 percent each year during the 14-year
transition period. For 2001, the over-quota tariff equals
$283.73 per metric ton, but not less than 82.16 percent
ad valorem.
Canada. Prior to 1989, Canada maintained duties
ranging from 2.21 to 3.31 Canadian cents per kilogram
on imported dry beans, depending on the type of bean.
As part of CFTA, Canada agreed to phase out its
tariffs on U.S. dry beans over a 9-year period.
However, this process was accelerated and completed
ahead of schedule.
Dry Bean Trade under CFTA
and NAFTA
The United States is a leading exporter of dry beans.
In 2000, exports of such beans (excluding garbanzo
beans, which are sometimes grouped with dry peas)
totaled $168 million, while imports (excluding
garbanzo beans and guar seeds) equaled $27 million.
Traditionally, Canada has been a relatively minor
market for U.S. dry beans, accounting for 2-3 percent
of U.S. export value. However, Canada has experienced strong export demand (largely from the
European Union) since 1998. This boost in export
demand created a supply gap in Canada in 1999,
leading Canada to import a substantial quantity of lowpriced U.S. beans. These purchases boosted Canada's
share of U.S. dry bean exports to nearly 14 percent of
volume in 1999. The following year, this share
dropped back to 7 percent. Although the Canadian dry
bean crop is much smaller than that of the United
States, Canada is a strong competitor in the world
market, traditionally exporting three-fourths of its
annual production.
In contrast to Canada, Mexico historically has been a
much more active, although highly variable, market for
dry beans from the United States. During 1990-99,
Mexico accounted for 21 percent of the value of U.S.
dry bean exports, with the share ranging from just 5
percent in 1995 to 39 percent in 1998. Mexico
accounted for 19 percent of U.S. dry bean export value
in 2000. U.S. exports fell short of the TRQ in 1994
and 1995, but they exceeded it each year thereafter
until 2000 due to a series of weather reversals (freezes
and droughts) that limited Mexican production. In
2000, export volume to Mexico was just below the
TRQ of 59,703 metric tons.
Dry beans are an important part of the Mexican diet,
with per capita consumption averaging nearly 34
pounds - among the highest in the world. In contrast,
per capita dry bean use is about 8 pounds in the
United States, less than 2 pounds in Canada, and an
estimated 8 pounds for the entire world. Because dry
beans are a staple food in Mexico, imports rise in
years of short domestic output.
Mexico is the world's sixth largest producer of dry
beans, including both broad and round varieties. The
United States is fifth. Most dry bean area in Mexico is
not irrigated and thus susceptible to drought. In fact,
drought-related shortfalls in production have occurred
in each of the past 3 years. In 1998, the Mexican
government authorized auctions of duty-free import
permits over and above the NAFTA quota amount to
cover a drought-related shortfall.
Excluding guar seeds, which are used largely for
industrial purposes, imports accounted for about 4
percent of U.S. dry bean consumption during the
1990's - virtually unchanged from the 1980's. (Imports
86 ✺ Effects of NAFTA on Agriculture and the Rural Economy / WRS-02-1
Economic Research Service, USDA
were 5 percent of use in 2000.) In 2000, about 34
percent of the value of U.S. dry bean imports came
from Canada. These imports primarily serve border
areas of the United States. Reflecting the relative
strength of the U.S. dollar, imports from Canada have
been rising, averaging $7 million during 1995-2000 up 114 percent from 1990-94. Mexico accounted for
about 13 percent of U.S. dry bean imports in 2000,
with much of these imports serving niche markets.
Imports from Mexico averaged $3 million during
1995-2000, 4 times higher than in 1990-94.
The continued escalation of bid prices on NAFTA
auction certificates is causing concern in the U.S. dry
bean industry. Depending on supply and demand,
Mexican importers may be able to pass along some
part of their permit costs to U.S. shippers, Mexican
consumers, or both. Thus, high permit bids may translate into even more depressed market prices for U.S.
shippers, and these prices already were hovering at or
below break-even levels for most bean classes into
2001. In January 2001, the U.S. and Mexican governments conducted informal consultations on this topic.
Trade Issues
NAFTA's Impact on Dry Bean Trade
The timing of Mexican auctions for NAFTA dry bean
import permits has become a sore point to the U.S.
industry over the past several years. During the first 7
months of 1999, Mexico failed to auction the permits
for calendar year 1999, largely due to internal political
reasons. This act of omission brought U.S. dry bean
exports to Mexico to a virtual standstill. Moreover, it
created a tremendous drag on the market, especially
for growers and dealers of pinto and black beans, since
these commodities were already in serious oversupply
in the United States. Ultimately, an auction was held at
the end of August to allocate 1999 import certificates
for 48,000 metric tons of dry beans. The remaining
permits for 9,963 metric tons of duty-free dry beans
were assigned to a Mexican government agency that
purchases food for social feeding programs.
NAFTA has had little direct effect on dry bean trade,
although the irregular timing of Mexico's auctions of
import permits probably has had some influence on
prices. When production shortfalls made it necessary
to import dry beans during the past several years, the
Mexican government issued import permits well in
excess of the TRQ. This type of action is consistent
with Mexico's historical import patterns. Although
increased exports of dry beans to Mexico have occasionally helped to support dry bean prices in the
United States, these exports were not the direct result
of NAFTA.
In January 2000, the Mexican government announced
that it would split the auctioning of NAFTA import
permits into three separate occasions, each for onethird of the 59,703-metric-ton TRQ. The first auction
was held in mid-February in which 19,901 metric tons
of duty-free certificates for 2000 issued. Despite the
original intention to hold three auctions, the final two
auctions were combined into a single auction, originally scheduled for mid-August. However, this event
was postponed until August 29, when the last 39,802
metric tons of permits were finally auctioned. The
average bid was 1.15 pesos per kilogram (about $5.60
per hundred-weight). This is about half the current
grower price in the United States for several bean
classes - including pinto and black beans, the most
significant classes exported to Mexico. The first
auction for 2001 import permits was held March 19,
2001, with permits for 15,374 metric tons of U.S.
duty-free beans bringing a record-high average bid of
2.9 pesos per kilogram ($13.75 per hundred-weight).
Economic Research Service, USDA
NAFTA has facilitated and encouraged communications between member nations, which has helped to
resolve disputes and to address industry concerns.
Because Mexico is an important market for U.S. dry
beans, any uncertainties caused by poor communication could have an adverse effect on the planting and
marketing decisions of U.S. producers and the prices
that they receive.
Gary S. Lucier (202-694-5253, [email protected])
Cotton
Policy Changes Resulting
from NAFTA
United States. Under CFTA and NAFTA, Canada and
the United States gradually eliminated their duties for
each other on yarn and thread that qualify under the
agreements' rules of origin, as well as for all fabric and
apparel. This transition occurred over the 9-year period
that ended on January 1, 1998.
Under NAFTA, the United States established a dutyfree quota for Mexican cotton of 46,000 bales, twoand-one-half times Mexico's previous quota under
Section 22 of the Agricultural Adjustment Act (7
The Effects of NAFTA on Agriculture and the Rural Economy / WRS-02-1 ✺ 87
U.S.C. 624). Prior to NAFTA, U.S. tariffs on cotton
imports ranged from zero to 4.4 cents per kilogram.
The NAFTA quota grows by 3 percent per year, and
the tariff for over-quota shipments is being phased out
over the 9-year period that ends on January 1, 2003.
For 2001, the over-quota tariff is about 7 cents per
kilogram, or 5 percent.
In addition, the United States reduced tariffs and
expanded quota-free access for yarn, fabric, and
apparel derived from yarn and fiber produced by a
NAFTA country. The United States gradually eliminated its duties on 83-99 percent of Mexico's textile
goods that satisfy NAFTA's rules of origin. This transition occurred over the 4-year period that ended on
January 1, 1998. The United States also eliminated its
import quotas for Mexican yarn and for fabric and
apparel produced from yarn and thread from any
NAFTA country.
Mexico. Prior to 1994, Mexico levied a 10-percent
tariff on U.S. cotton. Under NAFTA, Mexico is
phasing out this tariff over the 9-year period that ends
on January 1, 2003. For 2001, the duty equals 3
percent.
On January 1, 1994, Mexico immediately eliminated
its duties for key products of export interest to U.S.
textile producers. Moreover, Mexico gradually eliminated its duties on 60-97 percent of U.S. textiles that
meet NAFTA's rules of origin. This transition occurred
over the 4-year period that ended on January 1, 1998.
Canada. Under CFTA and NAFTA, Canada and the
United States gradually eliminated their duties for
each other on qualifying yarn and thread and on all
fabric and apparel over the 9-year period that ended on
January 1, 1998. Quotas under the Multi Fiber
Arrangement (MFA)1 did not affect U.S.-Canada
textile trade, so Canada made no policy changes in this
area. Similarly, Canada did not levy an import tariff on
cotton prior to CFTA and does not do so today.
Cotton Trade under CFTA and NAFTA
Mexico has become the world's largest importer of raw
cotton, and almost all of these imports come from the
United States. There is also significant two-way trade
1
The MFA is a complex multilateral agreement that establishes
quantitative restrictions for international textile and apparel trade.
Under the World Trade Organization's Agreement on Textile and
Clothing (ATC), these restrictions are now being dismantled.
in textile products, with the United States largely
exporting fabric and other intermediate products and
importing finished goods. Between 1993 and 2000,
U.S. cotton exports to Mexico increased 155 percent,
U.S. exports to Mexico of cotton textiles and apparel
increased 479 percent, and U.S. imports of Mexican
cotton textiles and apparel increased 756 percent. In
2000, the volume of U.S. cotton exports to Mexico
reached 1.7 million bales, while exports and imports of
cotton textiles and apparel equaled roughly 2 and 3
million bales, respectively.
Traditionally, Mexico has been an important producer
and exporter of cotton, but Mexico's role as an
exporter has diminished since the beginning of the
1990's. Since 1992, the United States has supplied at
least half of Mexican cotton consumption. Mexico's
textile industry possesses many new and modernized
spinning units, which operate more efficiently with
U.S. cotton than domestic Mexican cotton due to the
characteristics of U.S. cotton, the location of the mills,
and the nature of the new equipment in the mills. As a
result, imports in the 2000/01 marketing year (August
1, 2000 to July 31, 2001) are expected to be more than
6 times the size of production, even though Mexican
cotton production and, to a lesser extent, Mexican
cotton exports have rebounded since the mid-1990's.
Consumption is estimated to be about 1.9 million bales
higher than production, with the United States virtually the sole import supplier.
U.S.-Mexico trade in cotton textiles also grew significantly during the 1990's, with a large deficit for the
United States. During the late 1980's, Mexico began to
liberalize its cotton and textile industries, and Mexico
- along with the Caribbean Basin Initiative (CBI)
countries - gained quota-free access to the United
States for apparel and other products produced from
U.S. fabric. Under NAFTA, Mexico's access to the
U.S. market has surpassed that of the CBI countries,
but CBI exports to the United States have continued to
grow during the NAFTA era. The U.S. cotton textile
trade deficit with Central America and the Caribbean
now exceeds 1 million bales, compared with the preNAFTA average of 260,000, and trade in each direction is comparable to corresponding levels of
U.S.-Mexico trade.
Cotton textile trade between Mexico and the United
States was already large in both directions prior to
NAFTA, but this trade has soared since the agreement's implementation, becoming perhaps the largest
88 ✺ Effects of NAFTA on Agriculture and the Rural Economy / WRS-02-1
Economic Research Service, USDA
cotton textile trading relationship in the world. U.S.Mexico trade accounts for about 8 percent of world
trade in cotton textiles, as NAFTA has permitted an
increased division of labor between the two countries
while the geographic proximity of the two countries
allows producers to respond quickly to changing fashions. In 1998, Mexico became the largest net supplier
of cotton clothing and textiles to the United States, and
in 2000, the U.S. textile and apparel deficit with
Mexico totaled about 1 million bales, compared with
virtually no deficit in 1993. Note that U.S. raw cotton
exports to Mexico also climbed more than 1 million
bales between 1993 and 2000, essentially mirroring
the changes in textile trade.
Canada's cotton consumption and imports have risen
sharply since the advent of NAFTA. U.S. cotton
exports to Canada, as well as U.S. textile trade with
Canada, have grown steadily since NAFTA's passage,
with large surpluses for the United States in both raw
and processed products. Canada's cotton consumption
and imports were essentially unchanged between 1987
and 1993, but since then cotton consumption has
nearly doubled, and raw cotton imports from the
United States have risen 80 percent. The United States
is Canada's principal export market for textiles, and
one of its largest sources of imports. The United States
enjoyed a surplus in cotton textile trade with Canada
of about 200,000 bales during the 1990's, and U.S. raw
cotton exports to Canada rose from about 170,000
bales to 300,000 bales between 1993 and 2000.
Trade Issues
There have been no significant trade disputes
concerning cotton among the NAFTA countries. In
1998, Mexican cotton producers were concerned about
an influx of imports from the United States under Step
2 of the U.S. Cotton Marketing Loan Program. The
temporary surge ended in December 1998 when the
Step 2 funds were exhausted for the year, and some of
the U.S. cotton imported under this program was transshipped to other countries. Revisions to the operation
of Step 2 mean that the 1998 surge is unlikely to be
repeated.
Mexico is one of the few countries that provides
domestic support to its cotton producers, but these
payments are small, suggesting that any related trade
distortions are also small. During the 2000/01
marketing year, the combined value of payments under
PROCAMPO (Programa de Apoyos Directos al
Campo—Program of Direct Support to the
Economic Research Service, USDA
Countryside), technical assistance, and a program of
emergency payments in its second year was about $16
million.
NAFTA's Impact on Cotton Trade
NAFTA has led to a significant increase in U.S. cotton
exports to Mexico, as Mexico's textile industry has
grown through access to the U.S. market. Preferential
trade rules and technological advances favoring quick
responses by apparel producers to consumer trends
have allowed Mexico to capture much of the increase
in U.S. apparel imports that might have otherwise
gone to Asian exporters. Since Mexico's textile
industry uses U.S. cotton to a far greater extent than
Asian firms, U.S. export opportunities have grown.
Furthermore, some U.S. textile capacity has transferred to Mexico, shifting domestic U.S. cotton
consumption into exports. The result has been an
increase in the U.S. share of world cotton trade, the
elevation of Mexico to the world's largest importer,
and a relatively constant level of U.S. cotton production despite a large increase in apparel imports.
While NAFTA has substantially improved Mexico's
access to the U.S. market, CBI countries - with the
same access as pre-NAFTA Mexico - have continued
to increase their textile exports to the United States.
Furthermore, the timing of changes in U.S.-Mexico
textile trade has been strongly correlated with changes
in exchange rates.
While the Uruguay Round Agreement on Textiles and
Clothing (ATC) still would have increased Mexico's
access to U.S. textile markets had NAFTA not been
implemented, the effect would have been much
smaller. Although the ATC eliminates Multi-Fiber
Arrangement quotas, it permits countries to retain the
most critical import restrictions until 2005. Under
NAFTA, the United States eliminated its duties on the
vast majority of Mexican textiles as of January 1,
1998. It is also likely that the commitment to trade
liberalization represented by NAFTA provided greater
assurance for investment in textile capacity, increasing
the volume of cotton textile trade among the three
NAFTA countries.
NAFTA did little to affect U.S. imports of raw cotton.
While Mexico's quota under NAFTA is larger than its
earlier Section 22 quota, it is substantially smaller than
other U.S. cotton import quotas. During marketing
years 1995-99, the NAFTA TRQ allowed Mexico to
export an average of 51,000 bales per year duty-free,
The Effects of NAFTA on Agriculture and the Rural Economy / WRS-02-1 ✺ 89
and Mexico's average fill rate for this TRQ was 15
percent. U.S. quotas for the rest of the world under
URAA averaged 245,000 bales, with a fill rate of 12
percent. However, the Food, Agriculture,
Conservation, and Trade Act of 1990 created a mechanism that opened even larger quotas for any country
during the infrequent periods that price differentials
favor importing into the United States. During
marketing years 1995-99, these quotas averaged 2.4
million bales, with a fill rate of 10 percent.
Stephen A. MacDonald (202-694-5610,
[email protected])
Sugar and Sweeteners
Policy Changes Resulting
from NAFTA
United States. Prior to CFTA and NAFTA, Mexico and
Canada each had a share of the U.S. sugar import
quota, which began in 1982. Under this quota, Canada
paid the “low” duty of 0.66 cents a pound on refined
beet sugar, and a similar duty was waived for Mexico
under the Generalized System of Preferences. Under
CFTA, the quantity provisions of the U.S. quota
system continued to apply to Canadian sugar, although
duties on within-quota sugar were gradually reduced,
reaching zero on January 1, 1998.
In 1990, the United States unilaterally converted its
absolute sugar import quota to a TRQ system, after a
GATT panel ruled against the absolute quota in a case
brought by Australia. A second-tier tariff of 16 cents a
pound was established to apply to quantities above the
TRQ's first level. The United States interpreted CFTA
to mean that the second-tier tariff could not be applied
against Canada. Thus, from January 1990 through
December 1994, Canadian sugar entered the United
States freely, paying only the low CFTA duty. These
imports from Canada were small relative to the size of
the U.S. market and did not seriously disrupt the U.S.
sugar program.
When the Uruguay Round Agreement on Agriculture
(URAA) was implemented in 1995, Canada became
subject to the most-favored-nation (MFN) over-quota
tariff of approximately 16 cents a pound. The CFTA
tariff applies to shipments within the quota. As a result
of an agreement reached with Canada, 10,300 metric
tons of the refined sugar TRQ and 59,250 metric tons
of the TRQ for certain sugar-containing products
maintained under “Additional U.S. Note 8 and Chapter
17 to the Harmonized Tariff Schedule of the United
States” is allocated to Canada. Because Canada does
not produce raw cane sugar, it is not given a share of
the larger TRQ for raw cane sugar.
Mexico. The following description of Mexican access
to the U.S. market also applies to U.S. access to the
Mexican market.
Mexico's access to the U.S. sugar market depends on
Mexico's “projected net surplus production,” which is
defined as projected production minus projected
domestic consumption. Projected net surplus production is calculated using a formula that stipulates that
high fructose corn syrup (HFCS) should be included
only in the portion of the calculation pertaining to
consumption. Thus, projected Mexican sugar production has to exceed projected Mexican consumption of
both sugar and HFCS for Mexico to be considered a
net surplus producer.
From Fiscal Year (FY) 1994 to FY 2000, Mexico was
entitled to duty-free access for sugar exports to the
United States in the amount of its projected net surplus
production, up to a maximum of 25,000 metric tons,
raw value. If Mexico was not a net surplus producer, it
still enjoyed duty-free access for 7,258 metric tons,
raw value—the “minimum boatload” amount authorized under the U.S. TRQ.
In September 1996, the United States determined that
Mexico was projected to be a net surplus producer of
sugar in FY 1997. Thus, the United States gave
Mexico a duty-free quota of 25,000 metric tons, raw
value, that could be shipped as either raw or refined
sugar. Mexico's duty-free access for FY 1998 through
FY 2000 also was 25,000 metric tons, raw value.
From FY 2001 through FY 2007, Mexico has dutyfree access to the U.S. market for the amount of its
projected net surplus production, up to a maximum of
250,000 metric tons (raw value), with minimum dutyfree access equal to the “minimum boatload.” For FY
2001, Mexico's duty-free access is 116,000 metric
tons, including 7,258 metric tons (raw value) under the
TRQ, 2,954 metric tons (raw value) of refined sugar
and an additional 105,788 metric tons (raw value) (the
quantity which the United States committed to provide
Mexico under NAFTA). Of this total, 113,046 metric
tons (raw value) may be shipped as either raw or
refined sugar. NAFTA envisioned Mexico and the
United States as one sweetener market by FY 2008,
90 ✺ Effects of NAFTA on Agriculture and the Rural Economy / WRS-02-1
Economic Research Service, USDA
with sugar and corn sweetener free to be sold in the
other market without restriction.
In 1999, Mexico installed a TRQ system, with a
second-tier tariff for other countries that is equal to the
U.S. second-tier tariff. Sugar tariffs between the
United States and Mexico declined 15 percent over the
first 6 years of NAFTA, and are scheduled to go to
zero by FY 2008. For FY 2001, the second-tier raw
cane sugar tariff is 10.58 cents a pound, and the
refined sugar tariff is 11.21 cents a pound.
Mexico's barriers to sugar-containing products have
been converted to TRQ's, and the associated secondtier tariffs will decline to zero over 10 years. U.S.
refiners that ship sugar to Mexico under the U.S.
Refined Sugar Re-Export Program receive MFN treatment; NAFTA provides no special benefit for re-export
sugar because it is not considered to be of U.S. origin.
However, NAFTA does allow for reciprocal duty-free
access between the United States and Mexico for
refined sugar made from raw sugar produced in the
other country.
Canada. As a result of CFTA, the Canadian tariff on
U.S. sugar was 0.11 cents a pound, refined basis, in
1997, and became zero in 1998. Canada made no
changes in its sugar trade policies as a result of
NAFTA.
Sugar Trade under CFTA and NAFTA
U.S. sugar imports from Mexico and Canada continue
to be restricted by the U.S. TRQ for sugar, but
Mexico's access under the TRQ has expanded significantly, from a historical “minimum boatload” of 7,258
metric tons (raw value) prior to NAFTA to 116,000
metric tons (raw value) in FY 2001. In FY 1999,
Mexico exported 27,954 metric tons of raw and
refined sugar to the United States within the raw and
refined sugar TRQ's. In addition, Mexico exported a
small amount of raw cane sugar (about 5,000 short
tons, raw value) to the United States at the higher,
over-quota tariff level.
U.S. sugar imports from Canada were under quota
from FY 1982 to FY 1990, ranging from 10,000 to
30,000 tons per year. From FY 1991 to FY 1994, U.S.
sugar imports from Canada averaged about 40,000
tons a year, as Canadian sugar was relatively unrestricted and paid only a low duty. In FY 1996, the
United States allocated 10,300 metric tons of the
refined sugar TRQ to Canada, and Canada continues to
Economic Research Service, USDA
export refined sugar to the United States under the
portions of the refined sugar TRQ that are open to all
countries. In FY 2000, Canada exported close to
11,000 metric tons of refined sugar to the United
States. Additional shipments to the United States are
subject to the second-tier (prohibitive) MFN duty.
U.S. sugar exports to Canada and Mexico have largely
taken place under the U.S. Refined Sugar Re-Export
Program. This program covers raw sugar that has been
imported from another country, refined in the United
States, and re-exported in an equivalent amount. Prior
to FY 1995, U.S. sugar exports to Canada averaged
about 100,000 tons a year. These exports have declined
to almost zero since the Canadian government
imposed antidumping duties in late 1995.
Mexico was a net importer of sugar in the early
1990's. The United States exported 219,000 metric
tons of sugar to Mexico in FY 1991 and 97,000 metric
tons in FY 1992. Since FY 1993, Mexico has become
largely self-sufficient in sugar, and U.S. exports to
Mexico fell to 27,347 metric tons in FY 1996 and
10,960 tons in FY 2000.
Trade Issues
Canadian Antidumping Investigation of Sugar Imports.
On November 6, 1995, the Canadian International Trade
Tribunal (CITT) ruled that sugar imports from the
United States, certain countries in the European Union,
and Korea were being dumped in Canada. Antidumping
duties ranging from 69-85 percent ad valorem were
imposed on U.S. companies, effectively eliminating
most U.S. sugar exports to Canada. On November 3,
2000, Canada renewed these duties for imports of
refined sugar from the United States and certain
European countries. Canada's antidumping margins,
which range from 41-46 percent, will remain in place.
Antidumping margin is the difference between the price
sought in the importing country and the normal value of
the product in the exporting country.
Sugar Re-Export Negotiations. In November 1996, the
United States and Canada held consultations regarding
a Canadian claim that continued use of the U.S. SugarContaining Products Re-Export Program by U.S.
exporters to Canada was a violation of Article 303 of
NAFTA. Under this program, U.S. producers may
obtain sugar at the (lower) world price if they can
demonstrate the re-export of a like amount of sugar in
products within 2 years. Canada claims that this
The Effects of NAFTA on Agriculture and the Rural Economy / WRS-02-1 ✺ 91
program amounts to a duty drawback or deferral and is
prohibited under NAFTA.
The United States and Canada reached an agreement
on September 8, 1997, in which Canada would not
challenge the use of the program. The United States
agreed to allocate to Canada its historical share of
refined sugar and sugar-containing products in two
TRQ's, but overall Canadian access to U.S. TRQ's
remains unchanged.
Under the agreement, the United States allocates
10,300 metric tons of the in-quota quantity of the U.S.
TRQ for refined sugar (raw value) that is a product of
Canada, beginning in FY 1998. In addition, the United
States allocates 59,250 metric tons of the in-quota
quantity of its TRQ for sugar-containing products that
are the product of Canada. This allocation is measured
in the commercial weight of the products. Typically,
these products are dry crystal mixes, cake decorations,
and confections. The total TRQ for this category is
64,709 metric tons.
In addition, Canada is permitted to compete for any
quantity of the refined sugar TRQ that is not allocated
among supplying countries and is not reserved for
specialty sugar. This competition occurs regardless of
whether Canada's allocated share for the year in question has been filled. The settlement also allows the
United States to transfer any unused quantity of
Canada's allocation for sugar-containing products to
the portion of that TRQ that is not allocated among
supplying countries, if Canada informs the United
States that it cannot fill its share.
Mexican Retaliation for Broomcorn TRQ Affects
HFCS. On December 12, 1996, the Mexican government announced increases on import duties on various
U.S. products to compensate for the damage caused to
Mexico when the United States raised its tariffs on
Mexican broomcorn brooms. Included in the list were
certain corn sweeteners: HFCS-42 (tariff line items
1702.40.01 and 1702.40.99), HFCS-55 (1702.60.01),
and crystalline fructose (1792.50.01). Mexican duties
on these items were increased from 10.5 percent to
12.5 percent, effective December 13, 1996. Under
NAFTA, the tariff on these items was scheduled to
drop from 10.5 percent in 1996 to 9 percent in 1997.
In December 1998, the United States removed a safeguard measure meant to protect the U.S. broomcorn
broom industry from Mexican imports. As a result,
Mexico dropped its retaliatory duties on U.S. HFCS
and other U.S. agricultural products and the 12.5percent ad valorem duty was reduced to the NAFTAspecified rate of 6 percent.
Mexican Antidumping Investigation of U.S. HFCS. In
January 1997, Mexico's National Chamber of Sugar
and Alcohol Industries, the association of Mexico's
sugar producers, filed a petition in which it claimed
that U.S. corn wet millers were exporting HFCS to
Mexico at less than fair value. Mexico's Secretariat of
Commerce and Industrial Promotion (Secretaría de
Comercio y Fomento Industrial - SECOFI)2 initiated
an antidumping investigation in the following month.
In June 1997, SECOFI responded by imposing temporary tariffs on two grades of U.S. HFCS. The temporary tariffs, ranging from $66.57 to $175.50 per metric
ton, applied to shipments from Cargill Inc., A. E.
Staley Manufacturing Co., CPC International Inc., and
Archer Daniels Midland Co. After further investigation, SECOFI made the duties permanent in January
1998 at a level between $63.75 and $100.60 a ton for
HFCS-42 and between $55.37 and $175.50 a ton for
HFCS-55.
During 1998, SECOFI investigated a charge made by
the Mexican sugar industry that HFCS-90 was being
imported to avoid the antidumping duties on HFCS55. After a 7-month investigation, SECOFI determined
that this was the case and imposed compensatory
duties, effective September 8, 1998, on certain HFCS
imports from the United States (tariff lines 1702.50.01,
1702.60.01, 1702.60.02, and 1702.60.99). Imports
from A.E. Staley Manufacturing Co. are charged
$90.26 a metric ton, and imports from Archer Daniels
Midland Co. are charged $55.37 a metric ton.
In February 1998, the U.S. Corn Refiners' Association
(CRA) asked for review proceedings of Mexico's
antidumping actions under Chapter 19 of NAFTA. By
late 1998, all five members had been named to the
NAFTA panel. After the fifth panelist named by
Mexico is accepted by the United States, the panel will
review the legal briefs filed by CRA and SECOFI.
Parallel to actions undertaken under NAFTA, the
Office of the U.S. Trade Representative (USTR)
announced its intention on May 8, 1998, to invoke a
WTO dispute proceeding in order to challenge
23
Mexico’s new presidential administration, which took office on
December 1, 2000, has since reorganized SECOFI and renamed it
the Secretariat of Economy (Secretaria de Economia).
92 ✺ Effects of NAFTA on Agriculture and the Rural Economy / WRS-02-1
Economic Research Service, USDA
Mexico's actions. USTR has made two formal requests
for the formation of a WTO panel. Mexico blocked the
first request. The second was made on November 25,
1998, and could not be blocked by Mexico. USTR
argued that Mexico's antidumping measure on U.S.
exports of HFCS is not consistent with the WTO
Antidumping Agreement. This agreement requires that
injury to an entire industry be examined and not just to
part of it. USTR argued that the Mexican government
did not properly establish injury to its entire domestic
sweetener industry as a result of the alleged dumping.
The WTO dispute settlement panel made public its
final report on January 27, 2000. The panel agreed
with the U.S. position that Mexico did not properly
establish injury. The panel further found that Mexico
had not properly determined that there was a likelihood that HFCS imports from the United States were
likely to increase, as would be required to establish the
threat of injury when there is not current injury. The
WTO adopted the ruling of the dispute settlement
panel on February 25, 2000. The panel found Mexico
in violation of the WTO Antidumping Agreement and
required that Mexico correct its antidumping order by
September 22, 2000. Mexico decided not to appeal the
adverse ruling.
On September 20, 2000, the Mexican government
published a final resolution in which it concluded that
it was correct in imposing final antidumping duties
and justified their continuation. Mexico argued that its
domestic sugar industry was harmed by HFCS imports
from the United States. On October 12, the United
States presented a written request for review of
Mexico's compliance with the WTO ruling of February
25, 2000. The WTO's Dispute Settlement Body
approved the U.S. request on October 23, 2000. The
WTO dispute settlement panel has 90 days to report
whether the measures taken by Mexico comply with
WTO rules, but the panel has the option of requesting
more time to make a determination, if necessary.
In May 1998, USTR initiated an investigation under
Section 302 of the Trade Act of 1974, as amended (the
Trade Act), in response to a petition by the CRA,
alleging that the Mexican government had denied fair
and equitable market opportunities to U.S. HFCS
exporters. The CRA argued that the Mexican government had encouraged and supported an agreement
between representatives of the Mexican sugar and soft
drink bottling industries to limit purchases of HFCS
by the soft drink bottling industry. On May 15, 1999,
Economic Research Service, USDA
USTR concluded its formal investigation phase
without determining legally that the Mexican government's alleged practices were actionable under Section
301 of the Trade Act. However, USTR noted that its
investigation had raised enough questions about the
actions of the Mexican government to warrant further
examination and continued consultation on issues
related to HFCS trade.
Mexican Challenge to the Validity of the Side
Agreement. The Mexican government disputes the
validity of an Exchange of Letters in November 1993
between the U.S. Trade Representative (USTR) and
SECOFI. This Exchange of Letters, which is sometimes referred to as a “Side Agreement” or a “Side
Letter,” modified NAFTA's original provisions
pertaining to sugar and HFCS. The U.S. Government
maintains that the Side Agreement is part of NAFTA,
while Mexican officials claim that there are several
versions of the Side Agreement, none of which have
been approved as part of NAFTA by the Mexican
Legislature. Moreover, Mexico maintains that its
version of the Side Letter does not count HFCS
consumption in the formula that defines net surplus
exporter status and does not limit exports to 250,000
metric tons per annum during FY's 2001-07. Under its
interpretation, Mexico has been entitled to export its
total net surplus production to the United States on a
duty-free basis since October 2000.
On March 12, 1998, SECOFI asked for NAFTA
consultations on the validity of the Side Agreement.
Because no agreement was forthcoming, Mexico
formally requested on November 15, 1998, that a
NAFTA Commission meet to resolve the issue. Under
NAFTA, the Commission has several options to
resolve the issue, none of which are binding unless
agreed to by both parties. If the Commission cannot
resolve the dispute within 30 days after it has
convened (or another time period agreed to by both
parties), either party may request the establishment of
an arbitration panel to adjudicate the issue.
SECOFI broke off almost two years of negotiations
with the United States on August 17, 2000, and asked
for the formation of a NAFTA panel to arbitrate
disputes over the amount of sugar Mexico can export
to the United States beginning October 1, 2000.
NAFTA's Impact on Sugar Trade
U.S. sugar trade is largely governed by a TRQ system
whose origins predate NAFTA. However, one key
The Effects of NAFTA on Agriculture and the Rural Economy / WRS-02-1 ✺ 93
NAFTA provision governing U.S-Mexico sugar trade
has had a marked effect on U.S. imports under the
TRQ's. During FY's 1994-99, if Mexico was projected
to be a net surplus producer, it received duty-free
access to the U.S. market for the amount of its surplus,
up to a maximum of 25,000 tons. In the first 2 years of
NAFTA, Mexico filled its original allocation of 7,258
tons, which would have been allocated regardless of
NAFTA. Having been projected to be a net surplus
producer for FY 1997, Mexico was permitted to ship
25,000 tons of sugar duty-free to the United States,
17,742 tons more than its original allocation.
Beginning in FY 2001, Mexico has duty-free access to
the U.S. market for the amount of its surplus sugar
production, as calculated using the Side Agreement's
formula, up to a maximum of 250,000 tons. Thus,
Mexico's access to the U.S. market for sugar has
expanded from 7,258 metric tons prior to NAFTA to
116,000 metric tons in FY 2001.
With regard to U.S.-Canada sugar trade, the United
States interpreted CFTA as meaning that Canadian
sugar in excess of the TRQ's first-tier quantity could
enter under the low CFTA tariff rather than the TRQ's
prohibitive second-tier tariff. As a result, Canadian
sugar exports to the United States rose to about 40,000
tons a year during 1990-94. Almost all of this sugar
came from a single beet sugar factory in Manitoba,
one of two such facilities in Canada. During this
period, the price of refined sugar in the United States
was 25-50 percent higher than in Canada.
NAFTA granted no further concessions to Canada on
sugar. Instead, U.S.-Canadian sugar trade has been
strongly affected by URAA and by antidumping
duties. Each country's actions have limited the ability
of the other to ship increasing quantities of sugar. U.S.
companies are forced to pay antidumping duties
ranging from 69-85 percent. Canadian sugar exporters
must pay higher duty rates on over-quota shipments to
the United States. The Manitoba beet sugar factory
mentioned above was closed in early 1997, with the
loss of the U.S. market cited as the cause of the
closure.
Nydia Suárez (202-694-5259, [email protected])
and Karen Ackerman
94 ✺ Effects of NAFTA on Agriculture and the Rural Economy / WRS-02-1
Economic Research Service, USDA
Vegetables
Fresh Tomatoes
Policy Changes Resulting
from NAFTA
United States. Prior to 1995, the general U.S. tariff on
imported tomatoes equaled 3.3 cents or 4.6 cents per
kilogram, depending on the tariff season (table K-1).
In accordance with the Uruguay Round Agreement on
Agriculture (URAA), the United States gradually
lowered these rates to 2.8 cents and 3.9 cents per kilogram, respectively. These reductions were phased in
over the 6-year period that ended on January 1, 2001.
Under the Canada-U.S. Free Trade Agreement
(CFTA), which was subsumed into NAFTA, the
United States phased out its tariff for fresh tomatoes
from Canada over the 9-year period that ended on
January 1, 1998.
Under NAFTA, the United States gradually eliminated
its tariff for Mexican tomatoes imported during the
periods of July 15 to August 31 and September 1 to
November 14. These reductions occurred over the 4year period that ended on January 1, 1998.
In addition, the United States is phasing out its tariffs
for Mexican tomatoes imported during the tariff
seasons March 1 to July 14 and November 15 to the
last day of February. This gradual elimination is taking
place over a period of 9 years and 2 months. During
this transition, a TRQ is in effect. Imports within the
quota are charged the reduced tariff specified by
NAFTA. Over-quota imports are charged the lower of
the MFN tariff in effect before NAFTA and the MFN
rate in effect at the time of the over-quota trade.
In the first year of NAFTA (1994), the quota for
March 1 to July 14 was 165,500 metric tons, and the
quota for November 15 to the last day of February was
172,300 metric tons. These quotas increase at an
annual rate of 3 percent during the transition. For the
2000/01 season, the quotas were 197,616 and 205,735
metric tons, respectively.
For March 1 to July 14, the TRQ and associated tariffs
will end on January 1, 2003. For November 15 to the
last day of February, the under-quota tariff will be
eliminated on January 1, 2003, and the quantitative
restriction and corresponding over-quota tariff will end
on March 1, 2003.
NAFTA also includes a “snapback” provision, negotiated under CFTA, that allows the United States to reimpose MFN tariff levels for Canadian tomatoes until
2008 under certain price and acreage conditions. These
conditions have not been satisfied to date.
Cherry tomatoes receive separate tariff treatment under
NAFTA. The tariff for Mexican cherry tomatoes for
December 1 to April 30 was eliminated immediately
on January 1, 1994. The base tariff on cherry tomatoes
from May 1 to November 30 is 3.3 cents per kilogram.
This tariff was phased out for Mexico over the 4-year
period that ended on January 1, 1998.
Mexico. Prior to 1994, Mexico imposed a tariff of 10
percent on fresh tomatoes from the United States.
Under NAFTA, Mexico matches U.S. tariffs and transition periods for tomatoes. During the transition, the
duty assessed on U.S. imports may not exceed
Mexico's pre-NAFTA duty.
Table K-1—U.S. tariff rates for imported fresh tomatoes
Tariff Season
General level prior
to 1995
General level as
of January 1, 2001
Level for Canadian
product as of
January 1, 1998
Level for Mexican
product for 2000/01
growing season
Cents per kilogram
November 15 to
Last Day of February
3.3
2.8
zero
Under quota (205,735 metric tons): 0.66
Over quota: 2.8
March 1 to July 14
4.6
3.9
zero
Under quota (197,616 metric tons): 0.92
Over quota: 3.9
July 15 to August 31
3.3
2.8
zero
zero
September 1 to November 14
4.6
3.9
zero
zero
Rates listed do not apply to cherry tomatoes.
Economic Research Service, USDA
The Effects of NAFTA on Agriculture and the Rural Economy / WRS-02-1 ✺ 95
Canada. Prior to 1989, the seasonal Canadian tariff on
imported tomatoes was 5.51 Canadian cents per kilogram, but not less than 15 percent ad valorem. Under
CFTA and NAFTA, this tariff decreased 10 percent per
year, until it fell to zero on January 1, 1998. NAFTA
includes a “snapback” provision, negotiated under
CFTA, that allows Canada to re-impose MFN tariff
levels until 2008 under certain price and acreage
conditions.
Fresh Tomato Trade under CFTA
and NAFTA
Imports constitute a large proportion of U.S. domestic
tomato consumption, and Mexico is the main source of
these imports. In 2000, U.S. imports of fresh tomatoes
equaled 730,063 metric tons, with Mexico accounting
for 81 percent. This share is even higher during the
winter months. However, Mexico's share has eroded
steadily since 1994, when it stood at 95 percent. Most
of the lost market share has gone to greenhouse/hydroponic tomatoes from Canada and the Netherlands.
Despite its declining market share, Mexico has filled
its winter and spring quotas for the United States every
year since 1995. On average, U.S. fresh tomato
imports from Mexico have increased under NAFTA.
During 1994-2000, these imports averaged 607,779
metric tons per year with an average value of $470
million, compared with 335,083 metric tons and $256
million during 1989-93. Imports reached 734,053
metric tons in 1997, their highest level under NAFTA.
Since then, unfavorable weather in Mexico and low
prices in the United States have caused imports to
decline. In 1999, imports dropped to 615,064 metric
tons, with a value of $490 million. In 2000, imports
fell even further to 589,954 metric tons, with a value
of $412 million.
During the winter season, Florida tomato marketing is
governed by Federal Marketing Order Number 966,
which mandates minimum size and grade standards.
Section 8(e), an amendment to the Agricultural
Marketing Agreement Act of 1937, provides that if a
commodity listed in the section is regulated by a
Federal marketing order that imposes regulations
regarding grade, size, quality, or maturity, then the
same or comparable requirements may be imposed on
imports of that commodity. Thus, Federal regulations
concerning Florida tomatoes govern Mexican tomatoes
as well. Winter-season tomatoes from Mexico - but not
roma, cherry, or greenhouse tomatoes - are inspected
at the border by USDA's Agricultural Marketing
Service for quality, condition, and size. All loads are
inspected, and on average, about 1 percent of the
containers in each load is inspected. Less than one-half
of one percent of the inspected shipments fail to meet
the standards.
The United States exports a small amount of fresh
tomatoes to Mexico, and this trade often fluctuates
greatly from one year to the next due to conditions that
usually are not NAFTA-related. For instance, bad
weather hampered Mexican production in 1997, so
U.S. exports to Mexico surged to 17,596 metric tons,
compared with 2,560 metric tons in 1996. As Mexican
production recovered in 1998, exports fell to 4,789
metric tons. Very low prices across the U.S. vegetable
industry boosted exports to 5,837 metric tons in 1999.
In 2000, Mexican producers experienced adverse
weather conditions once again, and U.S. exports
surged to 27,423 metric tons, the highest level during
1989-2000. Exports were valued at $4 million in 1999
and $22 million in 2000.
Canada is the major export market for U.S. freshmarket tomatoes, accounting for 89 percent of such
exports during 1996-2000. For the United States,
Canada has been a relatively steady, mature market
over the past decade, and CFTA and NAFTA have had
little effect on this trade, largely due to Canada's short
growing season which gives them little option but to
import, and the United States is the closest supplier. In
2000, U.S. fresh tomato exports to Canada equaled
144,950 metric tons, up from 110,771 metric tons in
1988 and 137,444 metric tons in 1999. Much of the
recent gain reflected a slump in U.S. shipping-point
prices. Exports were valued at $104 million in 1999
and $121 million in 2000.
U.S. fresh tomato imports from Canada have increased
under CFTA and NAFTA, from a mere 2,115 metric
tons in 1988 to 101,390 metric tons in 2000. In value,
these imports increased from $2 million to $161
million. As a result, Canada's share of the U.S. import
market has expanded from less than 1 percent in 1988
to 14 percent in 2000. The majority of these tomatoes
come from a burgeoning greenhouse/hydroponic
tomato industry centered largely in Ontario and, to a
lesser extent, British Columbia.
Trade Issues
In April 1996, the Florida tomato industry charged
Mexico with selling tomatoes in the U.S. market at
prices below fair market value, thus materially injuring
96 ✺ Effects of NAFTA on Agriculture and the Rural Economy / WRS-02-1
Economic Research Service, USDA
the domestic industry. In response, the U.S. Department
of Commerce (DOC) initiated an antidumping investigation. On October 28, 1996, DOC announced an agreement with principal Mexican producer/exporters to settle
the dispute, and on November 1, 1996, DOC suspended
the investigation. DOC had made a preliminary determination that fresh tomatoes from Mexico were likely to
sell in the United States at less than “fair value.” As long
as the suspension agreement is honored, the antidumping
investigation remains suspended.
The original 5-year suspension agreement (which was
revised in 1998) established a reference price, or
minimum price, covering most fresh Mexican tomatoes exported to the United States. After rebates,
discounts, and so on, the net price of Mexican tomatoes is not allowed to fall below the reference price,
originally set at $5.17 per 25-pound box, or 20.68
cents per pound. This price represents the lowest
average monthly price for fresh-market tomatoes from
Mexico observed at the U.S.-Mexico border during the
base period of 1992-94.
On August 6, 1998, DOC and fresh-market
producer/exporters from Mexico agreed to
amend the suspension agreement to include more
Mexican growers, especially those in Baja
California. Producers in Baja California were
unhappy with the original floor price because it was
too high for them to compete effectively with
growers in California, where production costs are
lower than in Florida. Growers in Baja California
produce for the summer and early fall, roughly the
same season as producers in California.
The amended agreement specifies two time periods,
each with its own floor price. This change acknowledges differences between the shipping season in
Florida and Sinaloa and the shipping season in
California and Baja California. From October 23 to
June 30 (the Florida/Sinaloa season), the minimum
price for Mexican fresh-market tomatoes was raised to
$5.27 per 25-pound box ($0.2108 per pound). From
July 1 to October 22 (the California/Baja California
season), the minimum price decreases to $4.30 per box
($0.1720 per pound).
The agreement required that producer/exporters representing at least 85 percent of traded tomato volume be
signatories. The agreement does not cover non-signatories. U.S. Customs examines tomato shipments from
non-signatories to ensure that product from signatories
is not included. Greenhouse cocktail tomatoes are
Economic Research Service, USDA
exempt from the agreement since they are viewed as a
separate market from field-grown tomatoes. In the
suspension agreement, cocktail tomatoes are defined
as greenhouse tomatoes, generally larger than cherry
tomatoes but smaller than roma or common round
tomatoes, that are harvested and packaged on the vine
for retail sale.
There was strong compliance with the agreement
through 1998, but the price never fell to the level of
the reference price for more than a few days at a time
during this period. In 1999, tomato prices were low for
extended periods, forcing Mexican producers to
restrict export volume in order to prevent prices from
falling below the reference price. The suspension
agreement comes up for its 5-year “sunset” review in
October 2001. As required by the 1994 Uruguay
Round Agreements Act, the DOC and the U.S.
International Trade Commission (ITC) must conduct
reviews no later than 5 years after an antidumping or
countervailing duty order is issued. In these reviews,
the DOC will determine whether revoking the order
would likely result in a continuation or recurrence of
dumping or subsides, while the ITC will determine
whether such a revocation would cause material injury
to the domestic industry.
On March 28, 2001, a group of U.S. greenhouse
tomato producers filed a petition with the ITC alleging
dumping of greenhouse tomatoes by Canada in the
U.S. market. The ITC has started an investigation to
decide if there is a reasonable indication that the U.S.
industry is injured or under threat of injury by the
selling of greenhouse tomatoes from Canada at less
than normal value.
NAFTA's Impact on Fresh Tomato Trade
U.S. tariffs were not an important impediment to fresh
tomato imports before CFTA and NAFTA. Tariff rates
for tomatoes prior to the two agreements were specified in fixed dollar amounts and eroded in value over
time as the general price of tomatoes increased. In
1993, the weighted-average ad valorem tariff was 4.0
percent during the winter season and 5.3 percent
during the rest of the year. Thus, tariff changes to date
have been relatively small, and other factors have had
a greater impact on tomato trade.
U.S. fresh tomato imports from Mexico increased 47
percent in volume between 1993 and 2000. Holding
other factors constant, ERS estimates that NAFTA
tariff changes increased these imports by some 8-15
The Effects of NAFTA on Agriculture and the Rural Economy / WRS-02-1 ✺ 97
percent above what would have occurred without the
agreement. Had only the URAA tariff changes been
implemented, this increase would have been less than
10 percent. When imports increased in 1995 and 1996,
the higher, over-quota tariffs seemed to do little to
slow import growth. Changes in this trade have been
due mostly to factors other than NAFTA, such as the
peso devaluation in December 1994, relatively favorable weather in Mexico compared with Florida, and
technological improvements in Mexican production.
Between 1988 and 2000, U.S. fresh tomato imports
from Canada increased 4,694 percent in volume (from
a very small base), but factors other than CFTA and
NAFTA are primarily responsible for this surge. Based
on average import prices (higher than prevailing fieldgrown prices) and the timing of many shipments
(outside the regular Canadian growing season), the
majority of these imports appear to be
greenhouse/hydroponic varieties. The surge in imports
appears to reflect increasing U.S. demand for highquality, higher-priced tomatoes (due to changing tastes
and relative prosperity during the 1990's) and the
strong U.S. dollar.
U.S. fresh tomato exports to Canada increased 5
percent in volume between 1993 and 2000.
Considering only NAFTA tariff changes, ERS estimates suggest that these exports are 14-18 percent
higher than they would have been without the agreement. With just URAA tariff changes, these exports
would have increased just 6 percent. Clearly, factors
other than tariff reductions are influencing U.S.Canada tomato trade. Noteworthy examples are U.S.
weather conditions, industry promotion programs, and
the rapid development of Canada's greenhouse
industry.
Processed Tomatoes
Policy Changes Resulting
from NAFTA
United States. Prior to 1995, the United States levied
general duties on processed tomato products ranging
from 7.5 percent to 14.7 percent (table K-2). Under
URAA, the United States reduced these duties by 15
percent over the 6-year period that ended on January
1, 2001.
Under CFTA and NAFTA, the United States gradually
reduced its duties on Canadian processed tomatoes by
10 percent per year, starting on January 1, 1989, until
these tariffs fell to zero on January 1, 1998.
Upon NAFTA's implementation, the United States
immediately eliminated its tariffs on tomato juice and
ketchup from Mexico. Also, the United States immediately established a new, lower tariff base of 11.5
percent for Mexican tomato purees, pastes, and sauces.
The United States is phasing out its duties on
processed tomato products from Mexico over the 9year period that ends on January 1, 2003.
Mexico. Prior to 1994, Mexico's duty on imported
tomato paste was 20 percent. Under NAFTA, Mexico
lowered its duties on U.S. processed tomato products
to match U.S. levels.
Canada. Prior to 1989, Canada levied a tariff of 13.6
percent on U.S. processed tomatoes and 15 percent on
ketchup and other tomato sauces from the United
States. Under CFTA and NAFTA, Canada gradually
eliminated these tariffs over the 9-year period that
ended on January 1, 1998.
Gary S. Lucier (202-694-5253, [email protected])
Table K-2—U.S. tariff rates for selected processed tomato products
Product
General level prior
to 1995
General level as
of January 1, 2001
Level for Canadian product as of January 1, 1998
Level for Mexican
product for 2001
Tomato ketchup
7.5 percent
6.375 percent
zero
zero
Tomato juice
0.3 cents per liter
0.255 cents per liter
zero
zero
Tomatoes, whole or in pieces,
and preserved otherwise than
by vinegar or acetic acid
14.7 percent
12.495 percent
zero
2.9 percent
Tomato purees, pastes, and
sauces (HS Chapter 20)
13.6 percent
11.56 percent
zero
2.3 percent
Tomato sauces (HS Chapter 21) 13.6 percent
11.56 percent
zero
2.7 percent
HS = Harmonized Schedule of Tariffs.
Source: Economic Research Service, USDA. Tariff rates for Mexican product are drawn from the NAFTA tariff schedule of the United States.
98 ✺ Effects of NAFTA on Agriculture and the Rural Economy / WRS-02-1
Economic Research Service, USDA
Processed Tomato Trade under CFTA
and NAFTA
The United States is a net exporter of processed tomato
products. In 2000, exports totaled $224 million, while
imports were $96 million. The U.S. is also the world's
largest producer of tomatoes for processing (with about
45 percent of world output) and one of the top five
exporting countries. About 95 percent of production
takes place in California, with some 37 canning and
dehydrating plants in the central valley of California.
Imports accounted for nearly 3 percent of U.S. tomato
product consumption in 2000, compared with 7
percent in 1999. Low inventories and a short crop in
1998 led to a sharp increase in imports in 1999.
Exports absorbed about 6 percent of processing tomato
supply in 2000 - down from 7 percent in 1998 but
above the 5-percent average of the 1990's. After
posting strong growth in the early and mid 1990's, per
capita use of processed tomato products in the United
States has declined to about 72 pounds (on a freshweight basis) in 2000 - the lowest level since 1989.
U.S.-Canada trade in processed tomato products is
substantial, while U.S.-Mexico trade is much less
significant. This is partially explained by the similarity
of the U.S. and Canadian diets. U.S. processed tomato
exports to Canada totaled $107 million in 2000. This
equals 48 percent of all U.S. exports in this category.
Tomato sauce accounted for 50 percent of U.S. exports
to Canada, and tomato paste accounted for 30 percent.
Corresponding imports from Canada equaled $30
million. Thirty-one percent of total U.S. processed
tomato imports in 2000 were from Canada.
Rising U.S. ketchup imports from Canada are the most
notable change in U.S.-Canada processed tomato trade
under CFTA and NAFTA. Between 1989 and 2000,
these imports jumped from 1 metric ton to 39,476
metric tons, and their value climbed from a mere
$3,261 to $21 million. As a result of this growth,
ketchup accounted for 69 percent of U.S. processed
tomato imports from Canada in 2000. Much of this
increase is due to the changing business strategies of a
major U.S. manufacturer.
U.S. exports to Mexico of processed tomato products
totaled $25 million in 2000 - an increase of 178 percent
above the 1993 level. Four product classes accounted
for more than 90 percent of this trade: tomato juice (27
percent), sauces (23 percent), paste (21 percent), and
ketchup (21 percent). Exports to Mexico make up 11
Economic Research Service, USDA
percent of total U.S. processed tomato exports. The
sudden peso devaluation in December 1994 and the
accompanying economic downturn hindered U.S.
exports to Mexico, particularly in 1995.
U.S. processed tomato imports from Mexico equaled
$22 million in 2000. Four product classes accounted
for 93 percent of this trade: tomato juice (34 percent),
tomato powder (25 percent), tomato paste (18 percent),
and tomato sauce (16 percent). The relatively small
share corresponding to tomato paste is somewhat
deceiving, as trade in this product fluctuates greatly
from one year to the next. For instance, paste imports
from Mexico surged from 8,350 metric tons in 1998 to
21,484 metric tons in 1999, largely due to a small U.S.
crop of processing tomatoes in 1998. Following a
record U.S. crop in 1999 and the accumulation of
burdensome stocks, imports dropped to 6,194 metric
tons in 2000. Bulk tomato paste is the main ingredient
for tomato-based sauces and tomato juice, and most of
this paste enters during the spring to supplement the
needs of U.S. tomato product manufacturers.
Trade Issues
There have been no NAFTA-related trade disputes
involving processed tomatoes.
NAFTA's Impact on Processed
Tomato Trade
Between 1994 and 2000, U.S. processed tomato imports
from Mexico were relatively minor. Paste imports were
strong in both 1994 and 1999, as U.S. processors experienced spring-season shortages caused by smaller tomato
crops the previous fall. The United States had excess
supplies of tomato paste throughout most of the 1990's.
Over the past 3 years, tomato product imports from
Mexico have branched out from primarily tomato
paste into tomato juice and sauce. Tomato juice
imports from Mexico were non-existent until 1996 and
did not exceed $1 million until 1998. By 2000, these
imports were valued at $7 million. Similarly, tomato
sauce imports were minor until 2000, when they
reached $4 million. The United States does not levy a
tariff on tomato juice from Mexico, and U.S. tariffs on
Mexican tomato sauce range from 2.3 to 2.7 percent.
Ignoring other changes that have taken place since
1993, tariff changes from NAFTA and URAA are estimated to have increased U.S. processed tomato imports
from Mexico by 10 percent above what would have
occurred otherwise. Had only the URAA tariff changes
The Effects of NAFTA on Agriculture and the Rural Economy / WRS-02-1 ✺ 99
been implemented, the increase would have been about
2 percent. Variations in crop production have an important impact on U.S.-Mexico processed tomato trade.
Between 1993 and 2000, U.S. tomato paste exports to
Canada declined 5 percent in volume, while U.S.
tomato sauce exports to Canada expanded in volume by
50 percent. CFTA and NAFTA tariff reductions probably contributed to the latter increase. With the exception of sauces and ketchup, U.S. exports of processed
tomato products to Canada have not risen substantially
since 1993. Tomato product exports expanded 23
percent in volume between 1993 and 2000, but the
value of this trade increased by just 6 percent. However,
since 1988, the value of U.S. tomato product exports to
Canada has risen 50 percent to $30 million. Declining
prices caused by large U.S. supplies restrained the gain
in value. Without considering other factors, ERS estimates suggest NAFTA and URAA tariff changes alone
increased these imports by 34 percent above what
would have occurred otherwise. Had only URAA been
implemented, the increase attributable to tariff changes
would have been 10 percent.
As mentioned above, rising U.S. ketchup imports from
Canada are the most notable change in U.S.-Canada
processed tomato trade under CFTA and NAFTA. The
increase in this trade is primarily due to the changing
business strategies of a major manufacturer. Its
behavior was likely influenced by the relative strength
of the U.S. dollar and the elimination of ketchup duties
between Canada and the United States.
Gary S. Lucier (202-694-5253, [email protected])
Bell Peppers
Policy Changes Resulting
from NAFTA
United States. Prior to 1995, the general U.S. tariff on
bell peppers was 5.5 cents per kilogram. Under
URAA, the United States gradually lowered this tariff
to 4.7 cents per kilogram over the 6-year period that
ended on January 1, 2001.
Under CFTA and NAFTA, the United States eliminated its tariff on Canadian bell peppers on January 1,
1998, following a 9-year transition period.
Under NAFTA, the United States is gradually eliminating its tariffs on Mexican bell peppers as well. The
tariff for the June-October season was phased out over
the 4-year period that ended on January 1, 1998, and
the tariff for the November-May season is being eliminated over the 9-year period that ends January 1, 2003.
For 2001, the tariff rate for the November-May season
is 1.1 cents per kilogram.
Mexico. Prior to 1994, Mexico imposed a duty of 10
percent on bell peppers. Under NAFTA, Mexico gradually eliminated this tariff over the 4-year period that
ended on January 1, 1998.
Canada. Prior to 1989, the seasonal tariff on bell
peppers was 4.41 Canadian cents per kilogram but not
less than 10 percent. Under CFTA and NAFTA,
Canada reduced its tariff on U.S. bell peppers by 10
percent a year until it reached zero on January 1, 1998.
Bell Pepper Trade under CFTA
and NAFTA
Trade is an important component of the U.S. fresh bell
pepper market. In 2000, imports accounted for about
20 percent of U.S. consumption, while approximately
7 percent of U.S. production was exported. Seventytwo percent of these imports came from Mexico, and
13 percent came from Canada. Per capita use of bell
peppers in the United States climbed 25 percent over
the period 1994-2000 to 8.1 pounds.
During 1994-2000, U.S. imports of Mexican bell
peppers averaged 136,827 metric tons per year,
compared with 91,457 metric tons during 1989-93.
Meanwhile, the average annual value of this trade
increased from $79 million to $125 million. The
sudden devaluation of the Mexican peso in December
1994, along with a 20-percent decline in Florida
production in 1995, had a dramatic impact on this
trade. Imports climbed to 116,173 metric tons in 1995,
an increase of 20 percent above the 1994 level. In
1999, imports reached a record 156,068 metric tons,
up 54 percent from 1993. In 2000, imports equaled
143,097 metric tons, with a value of $135 million.
U.S. imports of Canadian bell peppers have increased
dramatically under CFTA and NAFTA, and these
imports are expected to continue rising due to the
growing popularity of greenhouse-grown product.
Imports equaled 26,017 metric tons in 2000, compared
with just 1,343 metric tons in 1989. The value of these
imports increased from $2 million to $49 million over
the same period. At least one-third of these imports
now come from greenhouse/hydroponic facilities.
100 ✺ Effects of NAFTA on Agriculture and the Rural Economy / WRS-02-1
Economic Research Service, USDA
Peppers from such facilities are priced 2 to 3 times
higher than field-grown varieties.
U.S. export data for fresh peppers include all types of
peppers (e.g., bell, pimento, and chile peppers), but
most of this trade consists of bell peppers. Canada is
the primary export market for U.S. fresh peppers,
accounting for 98 percent of export volume in 2000.
Exports to Canada have increased under CFTA and
NAFTA, even as imports from Canada have grown. In
2000, U.S. fresh pepper exports to Canada reached an
all-time high of 69,741 metric tons, valued at $66
million. In contrast, they equaled 41,671 metric tons in
1988, with a value of $34 million.
A similar analysis applies to imports from Canada.
Between 1989 and 2000, U.S. imports of Canadian bell
peppers increased 1,838 percent in volume, but this
trade was fairly small before CFTA. Tariff elimination
between Canada and the United States occurred gradually, and the relative strength of the U.S. dollar,
increased consumer demand, and adverse weather
conditions have played more prominent roles in the
growth of this trade than CFTA and NAFTA.
Gary S. Lucier (202-694-5253, [email protected])
Fresh-Market Cucumbers
Policy Changes Resulting
from NAFTA
Trade Issues
In March 1996, Florida growers, joined by growers
from several other States and the Florida Department
of Agriculture, petitioned the ITC for economic relief
against import surges of fresh tomatoes and bell
peppers under U.S. trade law. On July 2, 1996, the
ITC found that imports of these commodities were
neither a substantial cause nor a threat of serious
injury to the fresh tomato and bell pepper industries of
the United States.
United States. The general U.S. tariff on fresh-market
cucumbers varies by season. Prior to 1995, tariff rates
ranged from 3.3 cents to 6.6 cents per kilogram (table
K-3). Under URAA, the United States gradually
reduced these tariffs over the 6-year period that ended
on January 1, 2001.
NAFTA's Impact on Bell Pepper Trade
Under CFTA and NAFTA, the United States reduced
its tariffs on Canadian cucumbers by 10 percent a year,
until the tariffs fell to zero on January 1, 1998.
Although U.S. bell pepper imports from Mexico
increased 41 percent in volume between 1993 and 2000,
it is unlikely that NAFTA is the most important factor
affecting this trade. The tariff elimination for Mexican
bell peppers is proceeding gradually, with an annual
tariff reduction of less than 1 percent for the DecemberMay season. Before NAFTA, the average ad valorem
U.S. tariff on Mexican bell peppers was 7.43 percent.
Rising consumer demand, the relative strength of the
U.S. dollar, and adverse weather conditions in U.S.
production areas in some periods more likely explain
the growth in U.S. bell pepper imports from Mexico.
Under NAFTA, the United States eliminated duties on
Mexican cucumbers for the two lowest tariff seasons:
December to February and July to August. The
December-February season is a time of low domestic
production, and the July-August season is one of low
import volume. For the seasons with the higher tariffs,
duties are being gradually eliminated. The March-May
and October-November tariffs are being phased out
over the 14-year period that ends on January 1, 2008.
For 2001, these tariffs equal 3.3 cents per kilogram.
The June-September tariffs were gradually eliminated
over the 4-year period that ended on January 1, 1998.
Table K-3—U.S. tariff rates for imported fresh-market cucumbers
Trade season
General level prior
to 1995
General level as
of January 1, 2001
Level for Canadian
product as of
January 1, 1998
Level for Mexican
product for 2001
Cents per kilogram
March 1 to May 31
June 1 to June 30
July 1 to August 31
September 1 to September 30
October 1 to November 30
December 1 to Last Day of February
6.6
6.6
3.3
6.6
6.6
4.9
5.6
5.6
1.5
5.6
5.6
4.2
zero
zero
zero
zero
zero
zero
3.0
zero
zero
zero
3.0
zero
Source: Economic Research Service, USDA. Tariff rates for Mexican cucumber are drawn from the NAFTA tariff schedule of the United States.
Economic Research Service, USDA
The Effects of NAFTA on Agriculture and the Rural Economy / WRS-02-1 ✺ 101
NAFTA also includes a “snapback” provision, negotiated under CFTA, that allows the United States to reinstitute MFN tariff levels until 2008 for Canadian
cucumbers, under certain price and acreage conditions.
Mexico. Prior to 1994, Mexico's tariff on imported
cucumbers was 10 percent. Under NAFTA, Mexico
is matching the U.S. seasonal tariffs and phase-out
schedule, except that Mexico's transition period lasts
9 years.
Canada. Prior to 1989, Canada's seasonal tariff on
fresh cucumbers (not for processing) was 4.96
Canadian cents per kilogram, but not less than 15
percent. Under CFTA and NAFTA, the tariff declined
10 percent a year, until it reached zero on January 1,
1998. A “snapback” provision remains in place under
certain price and acreage conditions until 2008.
Cucumber Trade under CFTA
and NAFTA
Thanks to salad bars, new varieties, and increased
interest in health and nutrition, U.S. per capita use of
cucumbers increased 47 percent during the 1990's to
6.9 pounds. About 39 percent of domestic use is
imported, with the majority coming from Mexico (90
percent in 2000). In fact, almost all cucumbers in the
U.S. market are from Mexico during the months of
December, January, and February. This large reliance
on imports is due in part to low domestic production
during the winter months. Cucumbers suffer injury at
temperatures below 50 degrees, which is not an
uncommon weather occurrence in Florida during the
winter. Overall, Mexico supplied 90 percent of U.S.
import volume in 2000, while Canada supplied 7
percent. In 1993, these shares were 90 percent and 2
percent, respectively. Roughly half of the cucumbers
imported from Canada are produced in hothouses.
Only 3 percent of U.S. fresh cucumber supply is
exported. In 2000, Canada purchased 90 percent of
these exports, while Mexico bought 7 percent. Under
CFTA and NAFTA, U.S. cucumber exports to Canada
increased from 6,761 metric tons in 1988 to 22,542
metric tons in 2000, while the value of this trade
climbed from $2 million to $22 million.
During 1994-2000, the United States imported an
annual average of 283,031 metric tons of Mexican
cucumbers, compared with 179,230 metric tons during
1989-93. The average annual value of these imports
increased from $73 million to $119 million across the
same two periods. Of all the winter vegetables, cucumbers had the highest pre-NAFTA ad valorem tariff,
19.6 percent during the highest tariff season.
Reflecting low prices in the United States for most
vegetables, the average import value for fresh Mexican
cucumbers declined 16 percent in 1999 to 17.7 cents
per pound. Despite these low prices, imports from
Mexico reached a record 314,462 metric tons in 1999,
an increase of 2 percent over the previous year. In
2000, imports decreased slightly to 312,307 metric
tons, with a value of $150 million. U.S. cucumber
exports to Mexico are small and variable.
The increasing popularity of hothouse-produced,
European-type cucumbers is likely an important factor
behind the 5-fold increase in the volume of freshmarket cucumber imports from Canada since 1994. In
2000, this trade reached a record 22,542 metric tons,
with a value of $ 22 million. Reflecting the presence
of hothouse product, the average unit value for fresh
cucumbers from Canada - 45 cents per pound - was
nearly twice that for all fresh cucumber imports.
Trade Issues
There have been no trade disputes involving
cucumbers.
NAFTA's Impact on Cucumber Trade
Between 1993 and 2000, U.S. imports of Mexican
cucumbers increased 53 percent in volume. Holding
other factors constant, tariff changes under NAFTA
and URAA are estimated to have increased U.S.
imports of Mexican cucumbers by about 3 percent
above what would have occurred otherwise. Had only
the URAA tariff changes been implemented, this
increase would have been less than 1 percent. Other
factors, such as the peso devaluation and adverse
weather conditions, account for much of the observed
changes in U.S.-Mexico cucumber trade. Between
1992 and 1998, U.S. cucumber exports to Canada
decreased steadily in volume from 36,501 metric tons
to 22,654 metric tons. In 1999 and 2000, exports
rebounded to 23,441 metric tons and 25,578 metric
tons, respectively. Factors besides the gradual elimination of tariffs, such as adverse weather conditions in
the United States, the relative strength of the U.S.
dollar, and the growth of greenhouse production in
Canada, are influencing cucumber trade with Canada.
Gary S. Lucier (202-694-5253, [email protected])
102 ✺ Effects of NAFTA on Agriculture and the Rural Economy / WRS-02-1
Economic Research Service, USDA
Squash Trade under CFTA
and NAFTA
Squash
Policy Changes Resulting
from NAFTA
United States. Before 1995, the general U.S. tariff on
squash was 2.4 cents per kilogram. In accordance with
URAA, the United States gradually lowered this tariff
to 1.5 cents per kilogram over the 5-year period that
ended on January 1, 2001.
Under CFTA and NAFTA, the United States reduced
its tariff on Canadian squash by 10 percent per year
until January 1, 1998, when the tariff was eliminated.
Under NAFTA, the United States made several changes
in its tariffs on Mexican squash. First, the United States
phased out the tariff for the July-to-September season
over the 4-year period that ended on January 1, 1998.
Second, the United States is gradually eliminating the
tariff for the more sensitive season of October to June
over the 9½-year period that ends on June 30, 2003.
For this transition, the United States established an
initial TRQ of 120,800 metric tons. The volume of the
TRQ increases at an annual rate of 3 percent over the
transition and is set at 144,242 metric tons for the
2000/01 season (October 1, 2000 to June 30, 2001).
For 2001, the over-quota tariff equals 1.5 cents per
kilogram, and the within-quota tariff equals 0.4 cents
per kilogram. The under-quota tariff will be eliminated
on January 1, 2003, while the TRQ and corresponding
over-quota tariff will disappear on June 30, 2003.
Finally, NAFTA contains a “snapback” provision,
negotiated under CFTA, that allows the United States
until 2008 to re-institute the MFN tariff for Canadian
squash, under certain price and acreage conditions.
NAFTA includes chayote squash in a separate category
from other squash. Prior to 1994, the United States
imposed a tariff of 12.5 percent on Mexican chayote.
This tariff was eliminated immediately upon NAFTA's
implementation on January 1, 1994.
Mexico. Mexico immediately eliminated its 10-percent
duty on U.S. squash upon NAFTA's implementation
on January 1, 1994.
Canada. Prior to 1989, Canada levied an ad valorem
tariff of 5 percent on U.S. squash. Under CFTA and
NAFTA, this tariff declined 10 percent a year, until it
fell to zero on January 1, 1998.
Economic Research Service, USDA
Imports supply about one-third of U.S. squash consumption. The United States receives practically all of its
fresh squash imports (98 percent in 2000) from Mexico.
A minor amount, less than 1 percent each, comes from
Panama and Canada. About 80 percent of U.S. squash
imports arrive between November and April. This squash
competes primarily with product from Florida.
As mentioned earlier, NAFTA places chayote in a
different category from other squash. Costa Rica is the
dominant foreign supplier of chayote to the United
States, with an 81-percent share of the U.S. import
market in 2000. Mexico's share equaled 18 percent,
with exports to the United States totaling 4,238 metric
tons and valued at $1.6 million.
USDA began to collect national production data for
squash in 2000. Georgia, California, and Florida are
the leading producers of domestic squash. Most of the
import competition takes place during the months
when Florida is the primary domestic source. About
half of Florida's squash crop is marketed during
March, April, and May. Per capita use of fresh-market
squash in the United States is estimated to be 4 pounds
and held fairly steady during the 1990's.
U.S. squash imports from Mexico averaged 134,752
metric tons per year during 1994-2000, compared with
79,910 metric tons during 1989-93. Across the same
two periods, the average annual value of these imports
increased from $52 million to $89 million. In the first
two years of the TRQ, (October 1, 1994 to June 30,
1995, and October 1, 1995 to June 30, 1996), 81
percent and 87 percent of the quota was filled, respectively. Since then, the quota has been filled every year.
Imports from Mexico were 148,210 metric tons in
1999 and 148,476 metric tons in 2000, well above the
quota level. These imports were valued at $99 million
and $111 million, respectively. Low prices in the
United States discouraged imports in 1999 and 2000.
U.S. squash exports to Canada are not reported as a
separate category.
Trade Issues
There have been no trade disputes involving squash.
NAFTA's Impact on Squash Trade
Between 1993 and 2000, the volume of U.S. imports
of Mexican squash increased 66 percent. Before
NAFTA, the United States imposed an average ad
The Effects of NAFTA on Agriculture and the Rural Economy / WRS-02-1 ✺ 103
valorem equivalent tariff on Mexican squash of 5.21
percent. Ignoring other developments since 1993, ERS
estimates suggest that NAFTA and URAA tariff
changes together would have increased imports from
Mexico by only 1 percent. Had only the URAA tariff
changes been implemented, the change in imports due
to tariff changes would have been even smaller.
averages about 0.8 pounds per year. During the 1990's,
about 40 percent of the eggplant consumed domestically was imported (37 percent in 2000). The majority
of these imports came from Mexico. However,
Mexico's share of the U.S. import market has eroded
somewhat, falling from 99 percent to 93 percent in
volume terms between 1993 and 2000.
Gary S. Lucier (202-694-5253, [email protected])
U.S. imports of Mexican eggplant experienced little
growth during the 1980's and early 1990's but have
trended higher under NAFTA. During 1994-2000,
imports averaged 29,504 metric tons per year,
compared with 17,529 metric tons during 1989-93.
Across the same two periods, the average annual value
of imports grew from $13 million to $21 million.
Eggplant
Policy Changes Resulting f
rom NAFTA
United States. Prior to 1995, the general U.S. tariff on
eggplant was 2.4 cents per kilogram during the
December-to-March season and 3.3 cents per kilogram
during the rest of the year. Under URAA, the United
States gradually lowered these tariffs to 1.9 cents per
kilogram for the December-to-March season and 2.6
cents per kilogram for the rest of the year. These
reductions were phased in over the 6-year period that
ended on January 1, 2001.
Upon NAFTA's implementation on January 1, 1994,
the United States immediately eliminated its tariffs on
Mexican eggplant for the December-to-March and
July-to-September seasons. Tariffs for the two
remaining seasons, April to June and October to
November, are being phased out over the 9-year period
that ends on January 1, 2003. In addition, an initial
TRQ of 3,700 metric tons was established for the
April-to-June season. The volume of the TRQ
increases at an annual rate of 3 percent during the transition and stands at 4,551 metric tons for 2001. Overquota volume is charged the lower of the pre-NAFTA
rate and the current MFN rate. For 2001, the withinquota rate is 0.6 cents per kilogram, and the overquota rate is 2.6 cents per kilogram.
Mexico. Mexico immediately eliminated its 10-percent
duty on U.S. eggplant upon NAFTA's implementation
on January 1, 1994.
Canada. Prior to 1989, Canada did not levy a tariff on
eggplant. This policy has remained unchanged under
CFTA and NAFTA.
Eggplant Trade Since NAFTA
Trade is important to the U.S. fresh eggplant market.
Per capita consumption of eggplant in the United
States has increased since the mid-1990's and now
After reaching a record high in 1998, low U.S.
vegetable prices and erratic weather in Mexico caused
imports to decline by 15 percent in 1999 to 30,667
metric tons. In 2000, imports reached 36,018 metric
tons, nearly surpassing the record of 1988. The value
of this trade in 2000 was $22 million. Since NAFTA's
implementation in 1994, the eggplant quota has been
completely filled every year.
During the 1990's, an average of 13 percent of U.S.
eggplant supply was exported, compared with 9
percent in 2000. About 99 percent of U.S. exports go
to Canada, with minor amounts going to Mexico.
Trade Issues
There have been no trade disputes involving eggplant.
NAFTA's Impact on Eggplant Trade
Eggplant imports from Mexico have risen tremendously since the advent of NAFTA, with a 101-percent
increase in volume between 1993 and 2000. Before
NAFTA, the average ad valorem equivalent U.S. tariff
on Mexican eggplant was 5.69 percent. Ignoring the
influence of other factors, ERS estimates suggest that
NAFTA and URAA tariff changes would have
increased U.S. imports of Mexican eggplant by 4
percent above what would have occurred otherwise.
Had only URAA been implemented, tariff changes
would have increased this trade by less than 1 percent.
Increased demand associated with the rising popularity
of ethnic cuisines in the United States and the peso
devaluation help to explain the increase in eggplant
imports from Mexico.
Gary S. Lucier (202-694-5253, [email protected])
104 ✺ Effects of NAFTA on Agriculture and the Rural Economy / WRS-02-1
Economic Research Service, USDA
winter seasons. Since peaking at 37 percent in 1997,
Mexico's share of the U.S. market declined in both
1998 and 1999.
Snap Beans
Policy Changes Resulting
from NAFTA
United States. Prior to 1995, the general U.S. tariff on
fresh-market snap beans (not reduced in size) was 7.7
cents per kilogram. In accordance with URAA, the
United States gradually reduced this tariff to 4.9 cents
per kilogram over the 6-year period that ended on
January 1, 2001.
Under CFTA and NAFTA, the United States reduced
its tariff on Canadian snap beans by 10 percent a year,
until the tariff was eliminated on January 1, 1998. A
“snapback” provision for Canada is included until
2008.
Under NAFTA, the United States phased out its tariff
on Mexican snap beans for the June-to-October season
over the 4-year period that ended on January 1, 1998.
The tariff for the November-to-May season is being
phased out over the 9-year period that ends on January
1, 2003. For 2001, this tariff is set at 1.5 cents per
kilogram.
Mexico. Prior to 1994, Mexico levied a tariff of 10
percent on fresh snap beans from the United States.
This tariff was eliminated immediately upon NAFTA's
implementation on January 1, 1994.
Canada. Prior to 1989, the seasonal tariff on snap
beans was 4.41 Canadian cents per kilogram, but not
less than 10 percent. Under CFTA and NAFTA, this
tariff declined 10 percent a year, until it reached zero
on January 1, 1998.
Snap Bean Trade under CFTA and NAFTA
Since 1993, U.S. per capita consumption of freshmarket snap beans increased 40 percent, to 2.1 pounds
in 2000—the highest level since 1964. The United
States was a net exporter of fresh-market snap beans
during the 1990's. On average, 9 percent of domestic
use was supplied by imports - the same as during the
1980's. About 11 percent of supply was exported, up
from 8 percent in the 1980's.
More than three-fourths of imports enter during the
winter season (December to April), supplementing
production in Florida. As measured by shipment
volume, Mexico's share of the entire U.S. fresh snap
bean market averaged 31 percent during the 1997-99
Economic Research Service, USDA
U.S. snap bean imports from Mexico averaged 16,646
metric tons per year during 1994-2000, compared with
11,426 metric tons during 1989-93. Over the same
period, the average annual value of these imports
increased from $13 million to $21 million. Part of the
gain in Mexican imports under NAFTA is attributable
to the peso devaluation in December 1994, which
made it easier for hand-picked Mexican snap beans to
compete with machine-harvested product from Florida.
Imports grew steadily in volume between 1994 and
1997 and then declined in 1998 and 1999, due partly
to lower yields in Mexico and larger U.S. output
(especially in Florida). In 2000, imports equaled
20,673 metric tons - a record high - with a value of
$23 million. Responding to strong demand, domestic
fresh snap bean production reached its highest point
since 1951.
Although imports from Mexico generally have
increased under NAFTA, Mexico's share of total U.S.
snap bean imports has declined slightly, from 94
percent during 1989-93 to 91 percent during 19942000. Canada has picked up much of this lost share,
with its share rising from 5 percent to 7 percent across
the same two periods.
Total U.S. snap bean exports increased 69 percent in
volume between 1993 and 2000, but this development
is largely due to increased sales to the Dominican
Republic and not to NAFTA. Exports to the
Dominican Republic surged from 17 metric tons in
1994 (and zero in 1993) to an average of 11,651
metric tons during 1998-2000.
Still, Canada is the top foreign market for U.S. snap
beans, with a 66-percent share of U.S. export volume
in 2000. Exports to Canada increased from 14,000
metric tons in 1990 (and 3,681 metric tons in 1989) to
20,971 metric tons in 2000. The value of this trade
increased from $14 million to $21 million between
1990 and 2000. Export volume grew steadily during
1998-2000, after experiencing little to no growth
during 1995-97.
Trade Issues
There have been no trade disputes involving snap
beans.
The Effects of NAFTA on Agriculture and the Rural Economy / WRS-02-1 ✺ 105
NAFTA's Impact on Snap Bean Trade
Between 1993 and 2000, U.S. fresh-market snap bean
imports from Mexico increased 92 percent, with much
of this gain occurring in 1995. Prior to NAFTA, the
average ad valorem equivalent U.S. tariff on Mexican
snap beans was 8.04 percent. According to ERS estimates, NAFTA and URAA tariff changes would have
increased U.S. snap bean imports from Mexico by 6
percent above what would have occurred otherwise.
Had only URAA been implemented, this increase
would have been only 3 percent. Other factors - such
as weather, the peso devaluation, and rising demand
for fresh snap beans—likely account for the majority
of the change in trade.
Gary S. Lucier (202-694-5253, [email protected])
Fresh and Processed Potatoes
Policy Changes Resulting
from NAFTA
United States. Prior to 1995, the United States imposed
a general tariff of 0.77 cents per kilogram on all fresh
and seed potatoes, 17.5 percent on frozen potatoes, and
10 percent on frozen french fries, potato chips, and
other prepared potatoes. Under URAA, the United
States gradually reduced these tariffs over the 6-year
period that ended on January 1, 2001. As a result, the
general tariff now equals 0.50 cents per kilogram for
fresh and seed potatoes, 14 percent for frozen french
fries, 8 percent for other french fries, and 6.4 percent for
potato chips and other prepared potatoes.
Under CFTA, the United States implemented many
tariff reductions with respect to Canadian potatoes. On
January 1, 1989, the United States immediately lifted
its tariffs on fresh yellow (Solano) potatoes, seed potatoes, potato chips and other prepared potatoes, and
yellow frozen french fries from Canada. In addition,
the United States gradually eliminated its tariffs for
Canada on frozen potatoes, other fresh potatoes, and
other frozen french fries over the 9-year period that
ended on January 1, 1998.
Under NAFTA, the United States made similar tariff
reductions for Mexico. Tariffs on fresh yellow
(Solano) potatoes, seed potatoes, potato chips and
other prepared potatoes, and yellow frozen french fries
from Mexico were immediately eliminated on January
1, 1994. After a 4-year transition period that concluded
on January 1, 1998, the United States eliminated its
tariffs for Mexico on frozen potatoes, other fresh potatoes, and other frozen french fries.
CFTA allows the United States to implement a “snapback” provision on fresh potatoes from Canada, but
only until 2008. Given certain conditions, the United
States has the discretion to re-institute the tariff level
(0.50 cents per kilogram) associated with most-favorednation (MFN) status, the rate that applies to most countries outside of NAFTA. To date, the United States has
not exercised its “snapback” option for fresh potatoes.
Mexico. Prior to 1994, Mexico imposed tariffs of 15
percent on frozen potatoes and 20 percent on dried
potatoes, frozen french fries, and other prepared potatoes from Canada and the United States. In addition,
Mexico required import licenses for fresh potatoes.
Under NAFTA, all tariffs on processed potatoes from
the United States and Canada are being phased out
over a 9-year period that ends on January 1, 2003. In
addition, Mexico eliminated its import license requirements for Canadian and U.S. fresh potatoes and instituted a TRQ in their place. With an import permit (in
conjunction with the TRQ) and a phytosanitary permit,
fresh potatoes may be exported to Mexico, but the
potatoes must be treated with a sprout inhibitor to
ensure that they cannot be used as seed.
Under the TRQ for fresh potatoes, the United States
initially received a duty-free quota of 15,000 metric
tons. This amount increases at an annual rate of 3
percent during the 9-year transition period. For 2001,
the duty-free quota is 18,448 metric tons. Initially,
over-quota imports were assessed a tariff of $354 per
metric ton, but not less than 272 percent. For 2001, the
over-quota tariff equals $134 per metric ton, but not
less than 103.3 percent ad valorem.
Mexico's processed potato industry is also protected by
TRQ's, but the over-quota tariff is Mexico's MFN rate
of 20 percent. In 1994, the TRQ's for processed potatoes were 1,800 metric tons for frozen potatoes, 200
metric tons for dried potatoes, 3,100 metric tons for
frozen french fries, and 5,400 metric tons for other
prepared potatoes. These quotas grow at an annual rate
of 3 percent. For 2001, the quotas are approximately
2,214 metric tons for frozen potatoes, 246 metric tons
for dried potatoes, 3,813 metric tons for frozen french
fries, and 6,641 metric tons for other prepared potatoes.
Canada. Prior to 1989, the general Canadian tariff on
fresh and seed potatoes was 7.72 Canadian dollars per
106 ✺ Effects of NAFTA on Agriculture and the Rural Economy / WRS-02-1
Economic Research Service, USDA
metric ton, and the tariff on frozen french fries and
other prepared potatoes was 10 percent. Under CFTA
and NAFTA, Canada phased out its tariffs on U.S.
potatoes and potato products, until they reached zero
on January 1, 1998.
Potato Trade with Mexico
Between 1989 and 1993, U.S. fresh potato exports to
Mexico grew from 4,910 metric tons to 17,409 metric
tons. Although the volume of these exports fell slightly
in 1994 and 1995, they rose substantially over the next
4 years to 37,380 metric tons in 1999. In 2000, exports
declined to 30,776 metric tons. U.S. exports to Mexico
of fresh potatoes have exceeded the TRQ in each year
since NAFTA's implementation. The United States
imports virtually no fresh potatoes from Mexico (none
since 1993).
U.S. exports to Mexico of frozen french fries also have
increased under NAFTA. In 1993, exports equaled
8,540 metric tons. In 1994, this total jumped to
13,216, and by 2000, exports had grown to 31,199
metric tons.
Potato chip exports to Mexico have fluctuated under
NAFTA but generally have trended upward. These
exports averaged 8,777 metric tons per year during
1994-2000, compared with 2,584 metric tons during
1989-93. During the 4 years prior to NAFTA (1990-93),
the United States imported an average of 1,528 metric
tons of potato chips from Mexico. Since then, the United
States has only imported a small amount of chips from
Mexico, and only in 3 years: 1994 (448 metric tons),
1997 (0.34 metric tons), and 2000 (0.56 metric tons).
Potato Trade with Canada
U.S. exports to Canada of fresh and seed potatoes have
been substantially higher in volume under CFTA and
NAFTA than they were during the 5 years immediately
prior to CFTA. Exports averaged 126,272 metric tons
per year during 1989-91 and 235,809 metric tons
during 1992-2000, compared with just 43,094 metric
tons during 1984-88. Exports in 2000 equaled 249,822
metric tons.
U.S. exports of frozen french fries to Canada averaged
17,843 metric tons per annum during 1996-2000, more
than double the average of 6,713 metric tons for 199195. Much of this increase is attributable to Canada's
decision in December 1995 to relax its strict packaging and labeling rules for U.S. frozen french fries
sold to the Canadian food service sector. However,
Economic Research Service, USDA
with the rapid expansion of the Canadian french fry
processing industry over the past several years, U.S.
fry exports to Canada sagged somewhat in 1999 and
2000 and are likely to be negatively affected in the
coming years. During 1996-2000, U.S. potato chip
exports to Canada averaged 18,938 metric tons per
year, up from an average of 9,710 metric tons during
1991-95.
U.S. fresh and seed potato imports from Canada have
varied substantially under CFTA and NAFTA, ranging
from a low of 181,990 metric tons in 1992 to a high of
480,961 metric tons in 1998. The annual average for
1996-2000 was 411,847 metric tons, 44 percent above
the 1989-95 average. In 2000, imports equaled
365,287 metric tons.
Potato chip imports from Canada have increased
significantly in the last three years. Imports equaled
2,177 metric tons in 1998 and 4,721 metric tons in
1999, and 17,121 metric tons in 2000. In each of these
years, the volume of trade exceeded the cumulative
total of 1,519 metric tons that occurred during the first
9 years following CFTA's implementation (1989-97).
Except for a small decrease in 1989, U.S. frozen
french fry imports from Canada have increased
steadily under CFTA and NAFTA, from 45,985 metric
tons in 1988 to 480,060 metric tons in 2000. This
expansion corresponds to a compound annual growth
rate of 24 percent.
Trade Issues
Antidumping Duties on U.S. Potatoes. Since 1984,
Canada has imposed an antidumping duty against U.S.
fresh potatoes imported into British Columbia. Potatoes
imported between May 1 and July 31 are not subject to
the duty. The Canadian International Trade Tribunal
(CITT) reviewed the antidumping duties in 2000, and
decided that the duties would continue for another 5
years. The Tribunal concluded that if the duties were
rescinded, U.S. potatoes would enter British Columbia
in high volumes at “dumped prices” that would injure
the domestic industry in that province. CITT considers
“dumped prices” to be significantly below “normal”
prices for potatoes, as calculated by the Canadian
Customs and Revenue Agency.1
1 The complete ruling may be read on the CITT website at
<ftp://ftp.citt.gc.ca/doc/english/Dumping/Reviews/Orders_Reasons/
rr99005e.pdf>.
The Effects of NAFTA on Agriculture and the Rural Economy / WRS-02-1 ✺ 107
Outbreak of Potato Wart on Prince Edward Island. On
January 2, 2001, Canada requested NAFTA
Consultations with the United States with respect to
U.S. restrictions on imports of potatoes from the
province of Prince Edward Island (PEI), following the
discovery of a potato wart outbreak on October 26,
2000. Potato wart is a soil-borne fungus that produces
lesions on potatoes, rendering them unmarketable. The
Canadians believe that they have substantially proven
through scientific sampling of soil that this outbreak is
an isolated problem and that PEI potatoes are free of
the fungus and thus safe to export. Trade sources estimate that PEI potato producers have suffered about
$15 million in damages. The United States buys
almost 10 percent of the annual PEI potato crop. In
1999, about 96,000 metric tons of PEI potatoes were
destined for the United States. On April 30, 2001, the
United States resumed imported PEI potatoes from the
2000 crop year, following months of discussions with
Canadian officials on measures aimed at mitigating the
risk of spreading the potato wart fungus.
99. Imports, particularly of frozen french fries, are
likely to increase over the next several years as the
Canadian processing industry continues to expand.
NAFTA's Impact on Potato Trade
Under NAFTA, the United States immediately lowered
its base tariff on frozen broccoli and cauliflower from
Mexico to 15 percent. This tariff is being phased out
over the 9-year period that ends on January 1, 2003.
U.S. exports of fresh and processed potatoes to Canada
and Mexico have benefited from CFTA and NAFTA.
Increased potato trade with Mexico has primarily been
unilateral, with the United States making significant
gains in the export of processed potato products, particularly french fries. Fresh exports to Mexico are limited
by a TRQ that is relatively large, compared with the
TRQ's for processed potato products. As these restrictions are gradually eliminated, U.S. exports to Mexico
should continue to increase. The United States imports
little to no potatoes or potato products from Mexico
despite the elimination of tariffs on these products.
U.S.-Canada potato trade has increased in both directions under CFTA and NAFTA, with Canada gaining
more exports than the United States. Increased imports
of fresh and processed potatoes from Canada have
occurred for several reasons in addition to the two
agreements. First, Canadian potato production has
expanded greatly, with six record crops in the last 7
years. Second, the Canadian processing industry has
experienced rapid growth, particularly in the provinces
of Manitoba and Alberta. Some of this growth is the
result of direct investment by U.S.-owned companies.
Lamb-Weston owns a plant in Alberta, and the J.R.
Simplot Company is building a plant in Manitoba,
scheduled for completion in 2002. Third, the Canadian
dollar is relatively weak, having depreciated 20
percent vis-a-vis the U.S. dollar over the period 1989-
Charles Plummer (202-694-5256,
[email protected])
Frozen Broccoli and Cauliflower
Policy Changes Resulting
from NAFTA
United States. Prior to 1995, the general U.S. tariff on
frozen broccoli and cauliflower was 17.5 percent.
Under URAA, the United States decreased this tariff
to 14 percent over the 6-year period that ended on
January 1, 2001.
Under CFTA and NAFTA, the United States phased out
its tariff on Canadian frozen broccoli and cauliflower
over the 9-year period that ended on January 1, 1998.
Mexico. Prior to 1994, Mexico levied a 15-percent
tariff on frozen broccoli and cauliflower from the
United States. Under NAFTA, these tariffs are
being phased out over the 9-year period that ends
on January 1, 2003.
Canada. Prior to 1989, Canada imposed a 20-percent
tariff on frozen broccoli and cauliflower from the
United States. Under CFTA and NAFTA, this tariff
declined 10 percent a year, until it fell to zero on
January 1, 1998.
Frozen Broccoli and Cauliflower Trade
under CFTA and NAFTA
When NAFTA was implemented, Mexico was already
the dominant player in the U.S. market for frozen broccoli and cauliflower. During 1989-93, Mexico supplied
91 percent of U.S. frozen broccoli imports and 93
percent of its frozen cauliflower imports. However,
Mexico's share of U.S. frozen broccoli imports declined
from 89 percent in 1993 to 82 percent in 2000, as
lower-cost product from Guatemala increased its market
share from 11 percent to 16 percent. Meanwhile,
Mexico's share of U.S. frozen cauliflower imports
remained fairly constant, dropping slightly from 90
percent to 89 percent over the same period. Guatemala
108 ✺ Effects of NAFTA on Agriculture and the Rural Economy / WRS-02-1
Economic Research Service, USDA
is also the second largest source of U.S. frozen cauliflower imports, with a share of 7 percent in 2000.
In 1992, the United States imported 156,058 metric
tons of frozen broccoli from Mexico - the highest
volume before NAFTA. Since the agreement's implementation, imports have surpassed this level only once
- in 1996, with a volume of 158,779 metric tons.
However, U.S. frozen broccoli imports from Mexico
generally have been larger under NAFTA in both
volume and value terms. During 1994-2000, imports
averaged 144,048 metric tons per year with an average
annual value of $91 million, compared with 120,823
metric tons and $80 million for 1989-93. In 2000,
imports equaled 137,272 metric tons, with a value of
$99 million. Poor weather conditions and pest problems have hampered Mexican production over the past
several years.
U.S. imports of frozen cauliflower from Mexico reached
26,620 metric tons in 1994. Since then, imports have
not regained this level, due to production problems and
reduced demand in the United States. Per capita use of
frozen cauliflower in the United States has declined by
nearly half since the late 1980's, after peaking at 0.9
pounds. In 1999, imports from Mexico reached 20,148
metric tons, their highest level since 1994, with a value
of $16 million. In 2000, they equaled 18,053 metric
tons, with a value of $15 million. On average, U.S.
imports of frozen cauliflower from Mexico have been
smaller under NAFTA. During 1994-2000, imports
averaged 19,270 metric tons, with an average value of
$17 million, compared with 22,571 metric tons and $14
million during 1989-93.
Trade Issues
There have been no trade disputes involving frozen
broccoli and cauliflower.
NAFTA's Impact on Frozen Broccoli and
Cauliflower Trade
Between 1993 and 2000, U.S. imports of frozen broccoli from Mexico increased 3 percent in volume, while
Economic Research Service, USDA
corresponding imports of frozen cauliflower dropped
17 percent. Considering only the impact of NAFTA
and URAA tariff changes, ERS estimates suggest that
U.S. imports of frozen broccoli and frozen cauliflower
from Mexico would have increased by 6 percent and 3
percent respectively above what would have occurred
otherwise. Had only URAA been implemented, tariff
changes would have accounted for a 1-percent increase
in frozen broccoli imports from Mexico and an
increase of less than 1 percent in frozen cauliflower
imports from Mexico.
Production difficulties in Mexico and changes in
consumer demand are likely to have had a greater
impact on U.S.-Mexico frozen broccoli and cauliflower trade than NAFTA tariff changes. Between
1988-90 and 1998-2000, per capita consumption of
frozen broccoli in the United States remained
unchanged. On the other hand, the introduction of
various convenient fresh-cut products helped to drive
per capita consumption of fresh-market broccoli up 59
percent over the same period. Accordingly, fresh broccoli imports from Mexico increased 254 percent in
volume between 1993 and 2000. Between 1988-90 and
1998-2000, U.S. per capita consumption of frozen
cauliflower dropped 27 percent. Per capita consumption of fresh cauliflower - 3 per cent of which is
imported—declined 19 percent over the same period.
Although small relative to Mexican volume, U.S.
imports of frozen broccoli and cauliflower from
Canada have increased substantially under CFTA and
NAFTA. This is likely due to the elimination of tariffs
between Canada and the United States and the strong
U.S. dollar. Between 1989 and 2000, frozen broccoli
imports from Canada jumped by 2,135 percent (from a
very low base) to 2,308 metric tons, while frozen
cauliflower imports increased 335 percent to 6,929
metric tons. U.S. export data are not reported separately for frozen broccoli and cauliflower.
Gary S. Lucier (202-694-5253, [email protected])
The Effects of NAFTA on Agriculture and the Rural Economy / WRS-02-1 ✺ 109
Fruits and Fruit Juices
Fresh Citrus
Policy Changes Resulting
from NAFTA
United States. Before the Canada-U.S. Free Trade
Agreement (CFTA), the general U.S. tariff on fresh
oranges was 2.2 cents per kilogram. For fresh grapefruit, the general tariff was 2.2 cents per kilogram
from August through September, 1.8 cents per kilogram during October, and 2.9 cents per kilogram
during the rest of the year. The general tariff on limes
was 2.2 cents per kilogram.
In accordance with the Uruguay Round Agreement on
Agriculture (URAA), the United States decreased its
tariff on fresh oranges and grapefruit by 15 percent
and its tariff on fresh limes by 20 percent. These
reductions took place over the 6-year period that ended
on January 1, 2001. The tariff now equals 1.9 cents per
kilogram for fresh oranges and 1.8 cents per kilogram
for limes. In addition, the United States reduced its
seasonal tariffs for grapefruit under URAA. These
tariffs fell to 1.9 cents per kilogram for August 1 to
September 30, 1.5 cents per kilogram for October, and
2.5 cents per kilogram for November 1 to July 31.
Under CFTA, which was subsumed into NAFTA, the
United States gradually reduced its tariffs on fresh
oranges and fresh grapefruit from Canada over a 9year period, until they reached zero on January 1,
1998. Under NAFTA, the United States immediately
eliminated its tariff on Mexican oranges during the
June-November period, and it phased out the
December-May tariff over the 4-year period that ended
on January 1, 1998. For Mexican grapefruit, the
United States immediately eliminated the AugustSeptember tariff on January 1, 1994, and it is phasing
out the other tariffs over the 9-year period that ends on
January 1, 2003.
Mexico. Prior to 1994, Mexico levied a tariff of 20
percent on fresh oranges, grapefruit, and limes. Under
NAFTA, Mexico immediately eliminated its tariffs on
oranges, tangerines, and limes from the United States
on January 1, 1994. Mexico imposes a seasonal tariff
on grapefruit similar to that of the United States.
Canada. Prior to 1989, Canada had no tariff on fresh
citrus. This policy has continued under CFTA and
NAFTA.
Fresh Citrus Trade Since NAFTA
The United States is a net exporter of fresh oranges and
grapefruit and a net importer of limes. Almost all U.S.
lime imports originate in Mexico. Historically, U.S.
exports of fresh citrus to Mexico have been quite small
and variable. During the 1990's, Mexico accounted for
less than 1 percent of total U.S. citrus exports.
In 2000, the United States shipped 8,860 metric tons
of fresh oranges and tangerines to Mexico, up 1,577
percent from very low levels in 1993. Export value in
2000 was $5 million, about 1 percent of total fruit and
vegetable exports to Mexico. In 1998, the United
States exported 369 metric tons of grapefruit to
Mexico, up 361 percent from 1993 and valued at
$122,991. However, increasing Mexican grapefruit
production reduced this trade in 1999 and 2000. Under
NAFTA, U.S. grapefruit exports to Mexico have
ranged from 75 metric tons in 2000 to 1,735 metric
tons in 1995.
In the first years of NAFTA, Mexico allowed citrus
imports only from producing areas in California that
are not regulated for fruit fly. In January 1996, the
United States and Mexico finalized a phytosanitary
protocol to allow the export of citrus products from
producing areas in Texas that are not regulated for fruit
fly. The ban on Arizona citrus was lifted in 1997.
Florida is still trying to gain approval for exports of its
citrus fruits to Mexico.
U.S. imports of fresh citrus from Mexico consist
mostly of limes. In 2000, these imports were valued at
$54 million, about 3 percent of total fruit and
vegetable imports from Mexico. Fresh citrus imports
from Mexico reached 211,197 metric tons in 1999, a
92-percent increase from 1993, but slipped to 191,697
tons in 2000. Imports of fresh limes, grapefruit, and
oranges must meet U.S. marketing order minimum
requirements.
U.S. lime consumption has more than doubled since
the 1980's, but domestic production has decreased.
Lime-bearing area in Florida began declining from a
high of 7,300 acres in the 1982/83 growing season
110 ✺ Effects of NAFTA on Agriculture and the Rural Economy / WRS-02-1
Economic Research Service, USDA
(October 1, 1982 to September 30, 1983). After
Hurricane Andrew in August 1992, this area fell to
1,900 acres in 1993. During the 1993/94 and 1994/95
seasons, U.S. lime production accounted for only 3
percent of domestic consumption. Replanting slowed
substantially after a high rate of activity immediately
following the hurricane. Production, however, has been
increasing slowly. In 1999/2000, domestic production
of 44 million pounds accounted for 12 percent of
consumption.
Mexico is the main supplier of limes to the U.S.
market, accounting for 99 percent of total U.S. lime
imports in 2000. Imports from Mexico have grown
steadily over the last decade and first exceeded U.S.
production in 1991. Part of the increase in this trade is
due to the decline in U.S. production following
Hurricane Andrew. In 1993, the first full year after the
hurricane, imports from Mexico were up 37 percent
from the 1990-91 average. Imports of Mexican limes
have continued to increase under NAFTA. Between
1993 and 2000, they increased 74 percent to 179,002
metric tons in 2000.
Except for limes, Mexican fresh citrus from areas other
than Sonora must be treated for fruit flies before shipment to the United States. Methyl bromide is the
primary treatment. Citrus from the fruit-fly-free areas of
Sonora requires only a certificate from the Mexican
government that notes the place of origin. New protocols for treatment available under certain circumstances
for other citrus fruits are being discussed, as producers
search for cheaper and less damaging treatment
processes. Mexican producers are currently experimenting with treating fresh citrus in a hot air chamber
before shipment to the United States. Mexico has
proposed a systems approach that includes trapping
pests as an alternative to spraying. This proposal is
under review. Limes are resistant to fruit flies, and no
treatment is required before export to the United States.
Canada is a mature market, representing about one
quarter of all U.S. fresh citrus exports in the 1990's.
U.S. orange and grapefruit exports to Canada are relatively stable but sensitive to the U.S.-Canada exchange
rate. During 1994-2000, U.S. orange exports to
Canada averaged 174,911 metric tons per year, down
slightly from an average of 180,457 metric tons during
1990-93. U.S. grapefruit exports to Canada have averaged 63,961 metric tons under NAFTA (1994-2000),
compared with 68,536 metric tons during 1990-93.
Although trade data occasionally show U.S. imports
Economic Research Service, USDA
from Canada, these are thought to be re-exports of
specialty citrus purchased elsewhere.
Trade Issues
There have been no trade disputes involving fresh
citrus. However, Florida has been unable to gain
export approval for its citrus fruits under Mexico's
phytosanitary standards.
NAFTA's Impact on Fresh Citrus Trade
NAFTA has helped facilitate the resolution of concerns
regarding phytosanitary barriers. Elimination of these
barriers probably will have a greater impact on U.S.
exports of fresh oranges and grapefruit than tariff
reductions, since the barriers limit U.S. exports from
Florida, a major citrus producer.
Lime imports continue to increase, following a trend
that was well established before NAFTA. Ignoring
other changes that have occurred since 1993, tariff
changes under NAFTA and URAA are estimated to
have boosted U.S. lime imports from Mexico by 2
percent above what would have been otherwise. Had
only URAA been implemented, tariff changes would
only account for an increase of less than 1 percent.
The long-term decline in the Florida industry, accelerated by Hurricane Andrew, has had a greater impact on
U.S. lime trade than NAFTA's tariff reductions.
Karen Ackerman and Agnes Perez (202-694-5255,
[email protected])
Orange Juice
Policy Changes Resulting
from NAFTA
United States. Prior to 1995, the most-favored-nation
(MFN) tariff on frozen concentrated orange juice
(FCOJ) was 35.02 cents per single-strength equivalent
(SSE) liter. With URAA, the United States gradually
reduced this tariff by 15 percent over the 6-year period
that ended on January 1, 2001. Now, the general tariff
equals 29.72 cents per SSE gallon.
Under the U.S. tariff-rate quotas (TRQ's) established by
NAFTA, about 40 million SSE gallons of FCOJ and
about 4 million gallons of single-strength orange juice
(SSOJ) may enter the United States from Mexico each
year at preferential tariff rates, while over-quota imports
are subject to higher tariff rates (table L-1). All U.S.
tariffs on Mexican orange juice are to be phased out
The Effects of NAFTA on Agriculture and the Rural Economy / WRS-02-1 ✺ 111
112 ✺ Effects of NAFTA on Agriculture and the Rural Economy / WRS-02-1
Table L-1—U.S. orange juice imports from Mexico and transitional restrictions on that trade under NAFTA
Economic Research Service, USDA
Total orange
juice imports
Value
Volume
Imports of frozen concentrated orange juice (FCOJ)
Over-quota
Withintariff (or
Actual trade
TRQ
quota
tariff, if
Value
Volume
tariff
no TRQ)
Imports of single-strength orange juice (SSOJ) subject to TRQ**
Over-quota
Withintariff (or
Actual trade
TRQ
quota
tariff, if
Value
Volume
tariff
no TRQ)
1989
1990
1991
1992
1993
1994
1995
1996
1997
1998
1999
2000
2001
Million
dollars
57.5
88.6
45.0
7.0
14.3
43.1
62.7
54.8
42.6
65.3
49.4
39.8
--
45,260,660
63,415,487
49,459,231
6,603,425
20,986,762
45,984,971
68,869,050
49,812,801
51,062,993
67,945,071
48,730,322
43,586,246
--
Million
dollars
45.3
66.0
41.5
6.2
13.8
40.6
57.5
50.2
39.5
63.6
44.6
37.6
--
Million
dollars
10.4
15.3
3.5
0.8
0.5
2.4
5.2
4.5
3.1
1.6
4.2
2.2
--
2002
2003
2004
2005
2006
------
------
2007
2008
---
---
Gallons
Gallons
Gallons
36,220,405
44,910,918
46,596,260
5,835,119
20,359,095
43,670,048
63,728,818
46,236,628
48,397,517
66,640,599
45,545,282
42,312,290
--
n.a.
n.a.
n.a.
n.a.
n.a.
40,081,647
40,081,647
40,081,647
40,081,647
40,081,647
40,081,647
40,081,647
40,081,647
------
------
---
---
40,081,647
40,081,647
40,081,647
40,081,647
End of
quantitative
restrictions
n.a.
n.a.
Cents/
gallon
n.a.
n.a.
n.a.
n.a.
n.a.
17.51
17.51
17.51
17.51
17.51
17.51
17.51
17.51
Gallons
17.51
17.51
17.51
17.51
n.a.
29.72
29.72
23.81
17.86
11.91
n.a.
n.a.
35.02
35.02
35.02
35.02
35.02
34.14
33.26
32.39
31.51
30.64
29.76
29.72
29.72
*
*
*
*
5.95
Duty-free
Gallons
------
------
n.a.
n.a.
n.a.
n.a.
n.a.
4,071,140
4,071,140
4,071,140
4,071,140
4,071,140
4,071,140
4,071,140
End of
quantitative
restrictions
n.a.
n.a.
n.a.
n.a.
n.a.
---
---
n.a.
n.a.
*As mandated by the Uruguay Round Agreement on Agriculture (URAA)
**Several tariff lines corresponding to SSOJ are not subject to the TRQ. In most years, the volume of this trade is relatively small
n.a. = not applicable
All volumes are expressed in single-strength equivalent (SSE) gallons.
Sources: For trade data, Foreign Agricultural Trade of the United States database; for TRQs, NAFTA tarriff schedule of the United States.
7,510,257
14,053,696
2,862,971
766,982
625,693
2,293,509
5,104,734
3,559,284
2,659,340
1,285,479
2,708,507
1,266,104
--
---Gallons--n.a.
n.a.
n.a.
n.a.
n.a.
10.03
10.03
10.03
10.03
10.03
10.03
10.03
n.a.
Cents/
gallon
20.06
20.06
20.06
20.06
20.06
18.72
17.39
16.05
14.71
13.37
12.04
10.70
9.36
n.a.
n.a.
n.a.
n.a.
n.a.
8.03
6.69
5.35
4.01
2.68
n.a.
n.a.
1.34
Duty-free
over the 14-year period that ends on January 1, 2008.
For 2001, the within-quota tariff for FCOJ equals 17.51
cents per SSE gallon, while the over-quota tariff equals
29.71 cents per liter. This over-quota rate is slightly
lower than what NAFTA originally specified, due to
U.S. reductions in its MFN tariffs under URAA. Both
the within-quota and over-quota tariffs for SSOJ equal
9.36 cents per gallon for 2001. Since the over-quota
tariff has fallen to the same level as the in-quota tariff,
the over-quota rate applies to all SSOJ imports from
Mexico and the TRQ for that product is no longer in
effect. In addition, all Mexican citrus juice exported to
the United States must be made entirely of fruit
produced in the NAFTA countries, in accordance with
the agreement's rules of origin.
NAFTA includes a snapback provision to protect U.S.
producers from sudden surges in FCOJ imports from
Mexico. If imports exceed a certain volume and if the
domestic price falls below a certain level, the MFN tariff
rate is automatically re-instated. The volume threshold is
set at roughly 70 million SSE gallons for 1994-2002 and
about 90 million SSE gallons for 2003-07.
The definition of the price threshold is far more
complex. If for 5 consecutive days, the daily closing
price of FCOJ on the New York futures market falls
below the most recent 5-year average of the market's
monthly closing price of FCOJ for the month in question, the price threshold is triggered. This calculation,
however, excludes the highest and lowest monthly
closing averages for the 5-year period. The price
trigger has been met several times, but the volume
threshold has never been met. Thus, the snapback
provision has not been put into effect.
Under CFTA and NAFTA, the U.S. tariff for Canadian
orange juice fell to zero on January 1, 1998, following
a 9-year period of gradual reductions.
Mexico. Prior to 1994, Mexico levied a tariff of 20
percent on imported orange juice. Under NAFTA,
Mexico is generally matching U.S. tariff changes for
each tariff line over the 14-year transition period.
However, Mexican tariffs on U.S. orange juice may
not exceed their pre-NAFTA level of 20 percent. As
part of this transition, Mexico instituted TRQ's of
about 194,000 SSE gallons for FCOJ and about 34,000
gallons for SSOJ. The TRQ for FCOJ expires on
January 1, 2006, and the TRQ for SSOJ ended on
January 1, 2001.
Economic Research Service, USDA
Canada. Prior to 1989, bulk FCOJ entered Canada
duty-free, but retail-ready orange juice was subject to
a tariff of 3 percent. Under CFTA and NAFTA, the
tariff for U.S. orange juice was reduced 10 percent per
year, until it reached zero on January 1, 1998.
Orange Juice Trade under NAFTA
Most of the U.S. orange juice supply is from Florida.
After several hard freezes during the 1980's, Florida's
production plummeted and imports increased. As the
industry rebuilt, reliance on imports declined. In the
1999/2000 production season, imports accounted for
20 percent of the FCOJ consumed in the United States,
compared with 40 percent during 1985/86 to 1989/90.
The freezes of the 1980's also damaged the Mexican
citrus industry. Like their counterparts in Florida,
Mexican producers expanded production to warmer
areas further south during the rebuilding process. As
prices were high following the freezes, Mexico
invested heavily in the citrus industry. Between 1980
and 1995, the country's orange-producing area
increased from 350,000 to 765,700 acres. However,
much of the new production area is in small holdings,
and yields are often much lower than in the older
production regions. High production costs and interest
rates have slowed the planting of orange acreage.
Some growers have found it advantageous to plant
other crops, such as limes, in place of oranges.
Mexican processing facilities also increased in number
during the 1980's, although most Mexicans consume
fresh oranges or prepare juice from fresh oranges at
home rather than buy prepared orange juice. The
Mexican FCOJ market is a residual market, and almost
all juice is exported. While processors buy most of
their oranges on the market, some are now beginning
to plant orange groves to ensure adequate supply. In
1989/90, processed utilization reached more than 60
million SSE gallons of orange juice.
In the early 1990's, Mexico appeared poised to expand
its orange juice exports. However, as Florida's citrus
industry recovered from the freeze and world prices
declined, Mexican opportunities in the U.S. market
also declined. Mexican exports to the United States
averaged 52 million SSE gallons per year during 198991 but equaled less than 7 million SSE gallons in 1992
and about 21 million SEE gallons in 1993. Under
NAFTA, this trade has continued to fluctuate while
experiencing little growth. During 1994-2000, exports
averaged 54 million SSE gallons - just 2 percent above
The Effects of NAFTA on Agriculture and the Rural Economy / WRS-02-1 ✺ 113
the 1989-91 level. In 2000, this trade totaled 44
million SSE gallons, with a value of $40 million.
Mexican exports to the United States of both FCOJ
and SSOJ have fluctuated under NAFTA, and it is
difficult to discern a general trend in this trade. So far,
Mexico's FCOJ exports to the United States have filled
the TRQ for that product every year, and this trade
came fairly close to the volume threshold of the snapback provision in 1995 and 1998. In 1995, Mexican
orange juice exports to the United States were unusually high due to exceptionally good production and
quality in Mexico during the 1994/95 growing season.
In 1998, Mexico's share of the U.S. market increased
at the expense of Brazil. In contrast, Mexico filled the
SSOJ quota only once - in 1995 - during the 7-year
existence of that TRQ.
Once small in volume, Mexican orange juice imports
from the United States have grown substantially in
recent years, from 763,972 SSE gallons in 1997 to 3.7
million SSE gallons in 2000. However, the previous
pattern of trade was one of high variability, so it
remains to be seen whether the recent expansion in
trade is a lasting development. Nevertheless, Mexican
imports of U.S. FCOJ exceeded the TRQ in 1996,
1998, 1999, and 2000, and corresponding imports of
SSOJ always filled the quota during the 7-year existence of the TRQ for that product.
The volume of U.S. orange juice exports to Canada
has changed little under CFTA and NAFTA. Exports
equaled 47 million SSE gallons in 2000, compared
with 48 million SSE gallons in 1990. However, the
structure of this trade has changed profoundly,
reflecting Canada's elimination of its tariff on retailready orange juice from the United States and technological changes in the packaging and marketing of
orange juice. Between 1990 and 2000, FCOJ exports
to Canada dropped from 47 million to 3 million SSE
gallons, while SSOJ exports climbed from 1 million to
45 million SSE gallons. In contrast, the United States
imports relatively little orange juice from Canada, but
this trade also has expanded, from 384,456 SSE
gallons in 1989 to 1.8 million SSE gallons in 2000.
Trade Issues
There have been no trade disputes involving orange
juice.
NAFTA's Impact on Orange Juice Trade
Early ERS estimates suggested that NAFTA and
URAA tariff reductions would have a limited impact
on U.S. orange juice imports from Mexico. So far,
developments have borne out this prediction, and the
average annual volume of this trade during 1994-2000
was just 2 percent higher than in 1989-91. However,
the potential for increased imports from Mexico
always remains, should U.S. growers or other foreign
suppliers experience production problems. With
respect to U.S. orange juice exports to Canada, CFTA
and NAFTA have helped to shift the composition of
this trade from FCOJ to SSOJ.
Susan Pollack (202-694-5251, [email protected])
and Steven Zahniser (202-694-5230,
[email protected])
Fresh Apples
Policy Changes Resulting
from NAFTA
United States. Prior to 1989, all apples entered the
United States duty-free. There has been no change in
this policy under the Canada-U.S. Free Trade
Agreement (CFTA) and NAFTA.
Mexico. Prior to 1994, Mexico imposed a tariff of 20
percent on fresh apples. Import licenses were eliminated in 1991. As part of NAFTA, Mexico established
a tariff-rate quota (TRQ) for U.S. apples. The TRQ
was initially set at 55,000 metric tons, somewhat
below pre-NAFTA levels, but it increases at an annual
rate of 3 percent. The within-quota tariff is being
phased out over the 9-year period that ends on January
1, 2003. Over-quota apples enter at the lower of
Mexico's most-favored-nation (MFN) duty in 1993 (20
percent) or the MFN rate in effect when the over-quota
apples are imported.
Phytosanitary certificates are required to export U.S.
apples to Mexico due to concerns regarding oriental
fruit moth and apple maggot. Both pests can inflict
major damage to apple crops, as their larval stages
feed on the flesh of the fruit and cause the fruit to rot
internally. Most countries accept U.S. systems
approaches for pest management as adequate protection against the threat of apple maggot. However,
Mexico requires cold treatment for its imported fruit.
At the beginning of the shipping season, Mexican
inspectors examine the storage/treatment facilities to
114 ✺ Effects of NAFTA on Agriculture and the Rural Economy / WRS-02-1
Economic Research Service, USDA
ensure that temperature probes are approved and properly calibrated. After the cold treatment is over, treatment records are reviewed. Apples destined for
Mexico are treated either at 32 degrees Fahrenheit for
40 days or at 37.9 degrees Fahrenheit for 90 days.
Due to this requirement, most U.S. apples exported to
Mexico are marketed later in the season, when much
of the Mexican harvest has already been sold. The 40day treatment carries a greater risk of damage to the
fruit, but it is attractive from a marketing perspective.
Exports to Mexico must also be free of plant debris
and soil. There is a maximum average tolerance of 2
leaves per box, which is more problematic for Golden
Delicious apples than for Red Delicious apples. This
requirement is unique to Mexico.
Currently, U.S. apple exports to Mexico are limited to
apples from Washington State, Oregon, California,
Idaho, Colorado, Utah, Michigan, New York,
Pennsylvania, Virginia, and West Virginia, with the
exception of any area regulated for fruit flies of quarantine importance. Within these areas, only
storage/treatment facilities that have been inspected
and cleared by Mexican phytosanitary officials may
take part in the export program, which is expensive to
producers. To date, only producers in Washington,
Oregon, and Idaho have participated. Producers in
these States are able to spread the costs of inspection
over a large volume of apples. The Northwest apple
industry is charged for the cost of the Mexican inspectors, who are in residence during the entire shipping
season to monitor the program. The industry collects
money from shippers throughout the season to pay for
the phytosanitary requirements.
In November 1998, Mexico agreed to end its supervision
of this inspection program. The State of Washington's
Department of Agriculture and USDA's Animal and
Plant Health Inspection Service (APHIS) will supervise
the program, beginning with the 2001 harvest.
Canada. Prior to 1989, Canada did not levy a tariff on
U.S. apples, and this policy has remained unchanged
under CFTA and NAFTA. Canada generally restricts
bulk sales in large, nonstandard containers such as bins
or trucks, which makes trade more difficult for U.S.
producers. Sales of apples in containers over 25 kilograms are prohibited, unless the Canadian government
grants an easement. In October 1997, the Canadian
Food Inspection Agency (CFIA) initiated a 2-year trial
allowing inter-provincial shipments and imports of
bulk fresh apples in bins with a net weight of up to
Economic Research Service, USDA
200 kilograms. In addition, the CFIA removed all
weight restrictions for apples destined for processing.
The test market for bulk fresh apples is still valid until
the regulatory package is incorporated into the Fresh
Fruit and Vegetable Regulation. The test market for
processing apples was discontinued on April 27, 1998.
Apple Trade under CFTA and NAFTA
The United States is a net exporter of apples. In 2000,
Mexico accounted for 19 percent of U.S. apple
exports, and Canada purchased 13 percent. While
Canada's share has been fairly constant under NAFTA,
Mexico's share has slipped from a high of 21 percent
in 1994. In 2000, U.S. apple exports to Mexico
equaled $102 million, 14 percent of total fruit and
vegetable exports to that country. In the same year,
U.S. apple exports to Canada totaled $66 million, 4
percent of U.S. fruit and vegetable exports to Canada.
Mexico was far and away the largest market for U.S.
apples in the 1999/2000 marketing season. U.S.
exports to Mexico were almost double the volume of
exports to Canada and Taiwan, the next largest foreign
customers for U.S. apples. Mexico's removal of its
import licensing requirement in 1991 was the first step
towards increasing U.S. apple exports. As a result,
U.S. apple exports to Mexico grew dramatically, from
12,027 metric tons in 1990 to 108,380 metric tons in
1993. In 1994, exports rose 29 percent to a record
153,003 metric tons. U.S. apple prices were quite low
in 1994 due to a record crop, which helped to boost
Mexican demand.
In 1995, U.S. apple exports to Mexico fell to 74,370
metric tons, as Mexican demand collapsed amidst
various economic problems. Exports increased somewhat in 1996 and 1997, as economic conditions
improved. However, this trade totaled only 87,837
metric tons in 1997, still below 1993 levels. Mexico
imposed antidumping duties in September 1997, which
reduced exports in the fall of that year. In March 1998,
Mexico replaced these duties with a minimum price
floor. U.S. apple exports to Mexico dropped another
22 percent in 1998, to 68,918 metric tons. Further
reductions in the minimum floor price boosted exports
to 132,105 metric tons in 1999 and 185,200 metric
tons in 2000.
U.S. apple exports to Canada have increased under
CFTA and NAFTA, even though this trade was dutyfree prior to the two agreements. During the first 2
years of CFTA, exports grew substantially, from
The Effects of NAFTA on Agriculture and the Rural Economy / WRS-02-1 ✺ 115
47,101 metric tons in 1988 to 80,191 metric tons in
1990. Trade expanded at a slower pace during 199296, with exports ranging from 71,901 metric tons in
1992 to 82,449 metric tons in 1994. Over the last 4
years (1997-2000), exports have been relatively
constant, averaging 91,304 metric tons per year.
U.S. apple imports from Canada have varied widely
under CFTA and NAFTA, ranging from 37,193 metric
tons in 1994 to 78,661 metric tons in 1996. During
1998-2000, this trade averaged 40,731 metric tons,
reflecting the record-large U.S. apple crop in 1998 and
above-average crops in 1999 and 2000. The United
States imports few apples from Mexico.
Trade Issues
Canadian Antidumping Investigation. U.S. Red
Delicious apples faced antidumping duties in Canada
from 1989 until February 8, 2000 when the
antidumping duty on Red Delicious apples was
revoked. The original antidumping case expired in
early 1994, but growers filed a new complaint. In
October 1994, Revenue Canada made a preliminary
determination that dumping was occurring and
imposed temporary duties on Red and Golden
Delicious apples from the United States. The final
determination in January 1995 concurred with the
preliminary finding. The Canadian International Trade
Tribunal (CITT) found that there was material injury
to the Red Delicious apple industry but not the Golden
Delicious industry, so the antidumping duty on Golden
Delicious apples was dropped. It is too early to tell
how much the lifting of the antidumping duty has
affected U.S. exports to Canada.
Mexican Antidumping Investigation. On March 6,
1997, Mexico initiated an antidumping investigation
against U.S. apples. The Secretariat of Commerce and
Industrial Promotion (SECOFI) made a preliminary
determination of dumping and imposed a preliminary,
compensatory import duty of 101.1 percent on Red
and Golden Delicious apples, effective September 1,
1997. On March 19, 1998, the U.S. apple industry and
SECOFI signed an agreement suspending this duty,
and the U.S. industry agreed to comply with a
minimum-price scheme. This minimum price is based
on the 3-year weighted average of the Washington
Growers Clearing House Association's freight-onboard price for those 2 varieties. Starting in 1999, the
minimum price is adjusted every November 1, using
the average of the 3 previous crop years. The
minimum price for 2001 (set in November 2000) is
$11.48 per standard 42-pound carton.
Alleged Non-Compliance with U.S. Labor Law. Mexican
unions, along with the International Brotherhood of
Teamsters, the United Farm Workers of America, and the
International Labor Rights Fund, have filed a complaint
against the U.S. apple industry, mainly in Washington
State. The complaint alleges that the Washington apple
industry does not comply with U.S. labor laws. The
Teamsters and United Farm Workers are currently cooperating in efforts to unionize Washington fruit warehouse
and fieldworkers. Many laborers in the Washington
apple industry are Mexican or of Mexican descent.
This complaint marks the first time that Mexico has
used the provisions of the North American Agreement
on Labor Cooperation (NAALC)—NAFTA's labor
accord—to allege violations of U.S. labor law. To deal
with such complaints, the NAFTA labor accord specifies a lengthy 10-step process that offers numerous
opportunities for the government against which a
complaint is filed to resolve the issue satisfactorily.
However, the accord provides for the imposition of stiff
penalties, should this fail to happen. If a final ruling in
the apple labor complaint should go against the United
States, the U.S. Government could be fined and the U.S.
apple industry could lose NAFTA tariff concessions.
The first hearing took place in Mexico City on
December 2, 1998, before the Mexican National
Administrative Office of the Labor Secretariat. This
hearing led to the signing of a joint declaration by the
U.S. Department of Labor (DOL) and the Mexican
Secretariat of Labor and Social Welfare on May 18,
2000, to carry out ministerial consultations on this
issue in accordance with the provisions of the
NAALC. Hopefully, these consultations will result in
the satisfactory resolution of the complaint.
Under the joint declaration, officials of both governments will meet to exchange information regarding the
role of Federal and State agencies in the protection
and promotion of the rights of migrant workers in the
United States and to explore potential avenues of
cooperation regarding the protection of migrant
workers. In late May, DOL hosted a government-togovernment session in Washington, D.C. to provide
Mexican government officials information about the
application of U.S. law. Topics that are to be discussed
include union organizing and bargaining rights, the
elimination of employment discrimination, minimum
conditions of employment, and occupational safety
116 ✺ Effects of NAFTA on Agriculture and the Rural Economy / WRS-02-1
Economic Research Service, USDA
and health. In addition, DOL conducted public
outreach sessions at various sites within the United
States to educate migrant agricultural workers about
their rights in the workplace, as well as public forums
regarding agricultural-worker issues.
Discontent with the Mexican Inspection Process.
Shippers in Washington State were unhappy with the
cost of the phytosanitary inspection process. In 1998,
they refused to sign the financial plan that authorizes
payment for the Mexican inspectors in their State.
There were no apple shipments to Mexico from
October 1 until early November, when Mexico agreed
to end its supervision of the phytosanitary program.
Mexico and the United States agreed to a transition
from Mexican inspectors to supervision by the State of
Washington's Department of Agriculture and APHIS
representatives, beginning with the 2001 harvest.
Officials from both countries are continuing to iron out
the details of this transition.
NAFTA's Impact on Apple Trade
NAFTA is one of several factors that boosted U.S.
apple exports to Mexico over the last decade. Mexico's
lifting of its import licensing requirements in 1991
was a major development, and continuing economic
growth in Mexico following the painful recession of
1995 certainly has helped U.S. exporters. Resolving
phytosanitary issues with Mexico ought to further
boost this trade. However, a number of factors have
worked to limit U.S. apple exports to Mexico,
including antidumping duties and the minimum price
arrangement described above.
CFTA and NAFTA have not had a direct influence on
U.S.-Canada apple trade, since this trade was free of
tariffs prior to the two agreements, although Canada
did impose antidumping duties on U.S. Red Delicious
apples from 1989 to February 2000.
Karen Ackerman and Agnes Perez (202-694-5255,
[email protected])
Under NAFTA, the United States immediately eliminated its import tariff on fresh Mexican pears on
January 1, 1994. With CFTA and NAFTA, the U.S.
tariff on Canadian pears declined 10 percent per year
until January 1, 1998, when it fell to zero. Under
certain price and acreage conditions, the United States
and Canada may implement a snapback to MFN tariff
rates. This authorization expires in 2008.
Mexico. Prior to NAFTA, Mexico levied a tariff of 20
percent on U.S. pears. Under NAFTA, this tariff was
immediately cut to 15 percent on January 1, 1994. The
remainder of the tariff was phased out over the 4-year
period that ended on January 1, 1998.
For U.S. pears to enter Mexico, a USDA phytosanitary
export certificate must be obtained from APHIS.
Before issuing this certificate, APHIS must confirm
that oriental fruit moth and plum curculio, two pests
that feed on the fruit, are not present. In addition, it
must ensure that the pears come from Washington
State, Oregon, or California and are not produced in
areas regulated (quarantined) for fruit flies of quarantine importance. Shipments must be substantially free
of leaves (a limit of 2 leaves per box) and debris. U.S.
pear exports to Mexico are not required to be examined by Mexican inspectors in the United States.
Canada. Before CFTA, Canada levied a seasonal tariff
on fresh pear imports of 3.31 cents per kilogram, but not
less than 12.5 percent ad valorem. This tariff was
imposed during the marketing season, but it could not be
in effect for more than 24 weeks during any 12-month
period ending March 31. For the purposes of the tariff,
Canada was divided into three regions, and the timing of
the tariff differed according to region. Under CFTA and
NAFTA, the tariff declined 10 percent per year until it
fell to zero on January 1, 1998.
Pear Trade under CFTA and NAFTA
Fresh Pears
Policy Changes Resulting
from NAFTA
United States. The United States does not impose a
tariff on fresh pears during the months of April, May,
and June. Prior to 1995, the general U.S. tariff for
other months was 1.1 cents per kilogram. Under the
Uruguay Round Agreement on Agriculture (URAA),
Economic Research Service, USDA
this tariff was gradually reduced to 0.3 cents per kilogram over the 6-year period that ended on January 1,
2001.
The United States is a net exporter of pears. In 2000,
Canada purchased 28 percent of U.S. pear exports,
and Mexico bought 50 percent. In that year, the
United States exported $42 million of pears to Mexico,
6 percent of total U.S. fruit and vegetable exports to
Mexico.
The Effects of NAFTA on Agriculture and the Rural Economy / WRS-02-1 ✺ 117
U.S. exports of fresh pears to Mexico began to grow
rapidly in the late 1980's. From 1989 to 1993, these
exports expanded from 20,784 to 38,653 metric tons.
In 1994, they increased 68 percent to a record 65,112
metric tons. U.S. pear production for the fresh market
reached record levels that year, and U.S. prices were
very low, which probably contributed to strong
Mexican demand.
In 1995, U.S. pear exports to Mexico dropped 61
percent, largely due to the recession that followed the
peso crisis. Following 2 years of reduced exports,
exports began rising in 1998 to a new high of 82,332
metric tons in 2000. Mexican pear exports to the
United States are very small in number.
U.S. pear exports to Canada have increased during the
CFTA-NAFTA era. Exports climbed from 51,093 metric
tons in 1989 to 80,191 metric tons in 1990 and then
ranged from 71,901 to 84,229 metric tons during 199196. Over the last 4 years (1997-2000), this trade has
averaged 91,304 metric tons per year. U.S. pear imports
from Canada are small in comparison. Between 1989
and 2000, they ranged from 68 to 837 metric tons.
Trade Issues
There have been no trade disputes involving fresh
pears.
NAFTA's Impact on Pear Trade
Despite NAFTA tariff reductions, U.S. pear exports to
Mexico fell sharply in 1995 due to the painful recession that followed the Mexican peso crisis of
December 1994. However, this trade increased
substantially with sustained improvements in the
Mexican economy and the elimination of Mexico's
tariff on U.S. pears. In 2000, U.S. pear exports to
Mexico equaled 82,332 metric tons, 26 percent higher
than in 1994, when Mexico cut its tariff on U.S. pears
from 20 to 15 percent, and more than double their
1993 level.
Karen Ackerman and Agnes Perez (202-694-5255,
[email protected])
Fresh Peaches
Policy Changes Resulting
from NAFTA
United States. Peaches enter duty-free from December
through May. At other times, imports are subject to a
tariff. Before URAA, the general tariff was 0.4 cents
per kilogram. Under URAA, the United States gradually reduced this tariff to 0.2 cents per kilogram over
the 6-year period that ended on January 1, 2001.
Under NAFTA, the United States eliminated its duty
on Mexican peaches. With CFTA and NAFTA, the
tariff on fresh peaches from Canada declined 10
percent a year until it fell to zero on January 1, 1998.
The United States and Canada each have a snapback to
MFN tariff levels until January 1, 2008.
Mexico. Prior to 1994, Mexico charged a tariff of 20
percent on fresh peaches from the United States.
Under NAFTA, Mexico immediately cut this tariff to
15 percent. The remainder of the tariff was phased out
over the 4-year period that ended on January 1, 1998.
Canada. Prior to 1989, Canada charged a seasonal
tariff of 6.61 Canadian cents per kilogram, but not less
than 12.5 percent ad valorem, on U.S. peaches. The
seasonal tariff applied during a specified period, which
could not exceed 14 weeks in any 12-month period
ending March 31. Under CFTA and NAFTA, this tariff
declined by 10 percent a year until it fell to zero on
January 1, 1998. Until January 1, 2008, Canada is
entitled to invoke a snapback duty under special
circumstances regarding import prices and Canadian
peach production areas.
Fresh Peach Trade under CFTA
and NAFTA
U.S. export data include fresh peaches and fresh
nectarines in the same category. In 2000, the United
States exported $10 million of these fresh fruits to
Mexico, 1.4 percent of total U.S. fruit and vegetable
exports to Mexico. The volume of this trade reached
15,497 metric tons in 2000, just 4 percent shy of the
1994 record and up 147 percent from 1993. Fresh
peach exports in 2000 consisted entirely of fruit
destined for the fresh market.
In 1991, the United States exported 14,587 metric tons
of fresh peaches and nectarines to Mexico, a record
that lasted until 1994. In 1992, Mexico required
methyl bromide fumigation of imported peaches
118 ✺ Effects of NAFTA on Agriculture and the Rural Economy / WRS-02-1
Economic Research Service, USDA
because of concerns about oriental fruit moth, and this
trade dropped to 9,023 metric tons. During NAFTA's
first 7 years (1994-2000), exports averaged 13,505
metric tons per year, surpassing the 1991 level in
1994, 1997, 1998, and 2000.
A portion of U.S. fresh peach exports to Mexico is
utilized for processing. During the first 5 years of
NAFTA (1994-98), the share of peaches destined for
Mexico's fresh market plummeted from 79 percent of
total U.S. exports of fresh peaches to 25 percent.
Methyl bromide fumigation has had a serious and
lasting impact on U.S. peach and nectarine exports to
Mexico. This treatment not only adds to the cost of the
product, but it also lowers the quality and durability of
the fruit. In 1995, the Mexican government required
that its representatives be in residence in the United
States to monitor the fumigation process, which
further increased costs. In 1998, all U.S. peach exports
to Mexico came from California. Producers in other
States are eligible for the export program, but it is not
profitable enough for them to participate. Not all
producers have access to methyl bromide fumigation
facilities. An area must have sufficient volume to
justify the cost of having Mexican representatives in
residence to monitor the fumigation process.
In 1997, Mexico accepted a systems approach for
fresh peaches from California, as an alternative to
methyl bromide fumigation. After finding a single
oriental fruit moth in a regulatory inspection in July
1997, Mexico cancelled the program in 1998.
Subsequent negotiations between U.S. and Mexican
officials in 1999 and 2000 led to the continuation of
the systems approach during the 1999 and 2000
seasons. After declining in 1998 and 1999, U.S. fresh
peach exports to Mexico increased to 15,497 metric
tons in 2000, an increase of 42 percent over the
previous year's level. Although the systems approach
has boosted U.S. peach exports, it is costly for U.S.
growers and shippers.
In 1987, the U.S. cling peach industry began to export
fresh peaches to Mexico City for processing there.
Cling peaches are used almost exclusively for canned
peaches. In 1992, the industry began shipping to a new
canning facility just south of the U.S.-Mexico border.
U.S. exports to Mexico of fresh peaches destined for
canning increased every year from 1993 through 1998,
with the exception of 1996. Even in 1995, when most
exports to Mexico were affected by declining
Economic Research Service, USDA
consumer demand, exports of fresh peaches for
canning continued to rise.
U.S. cling peach exports to Mexico for canning ended
abruptly in 1999. In November 1998, Mexico dropped
a preliminary compensatory duty of 43.51 percent on
Greek canned peaches after finding no evidence of
dumping of Greek canned peaches. The current duty
for canned peaches from Greece is 23 percent. This
lower duty coupled with the already low price of
Greek peaches encouraged the Mexican firm to drop
its processing of peaches and to import canned
peaches from Greece instead.
Mexico exports few peaches to the United States, and
this trade takes place almost exclusively during April.
Currently, exports are limited to those from the fruitfly-free zone in Sonora. These exports are highly variable. During 1989-93, Mexican exports of fresh
peaches and nectarines to the United States ranged
from 37 to 197 metric tons. During 1994-2000, they
averaged 128 metric tons per year, ranging from zero
in 1994 to 283 in 1998.
U.S. exports of fresh peaches and nectarines to Canada
averaged 45,874 metric tons per year during 1989-2000
and equaled 50,134 metric tons in 2000. Through 1998,
U.S. peach exports to the Canadian province of British
Columbia had to be fumigated with methyl bromide, but
no Canadian inspectors reside in the United States to
monitor the inspection process. For the 1999 season, a
pilot program was developed for shipping peaches and
other stone fruit to British Columbia under a systems
approach that does not require fumigation. Imports from
Canada are much smaller in volume and highly variable, ranging from 187 metric tons in 1994 to 3,110
metric tons in 1990 and averaging 607 metric tons per
year during 1989-2000.
Trade Issues
Aside from the phytosanitary problems discussed
above, there have been no trade disputes involving
peaches.
NAFTA's Impact on Peach Trade
NAFTA tariff reductions have had a positive effect on
U.S. peach exports to Mexico, but other factors have
had a greater impact. First, the opening and closing of
a peach-canning plant just south of the U.S.-Mexico
border exerted a tremendous influence on this trade.
Peach exports destined for processing increased 784
The Effects of NAFTA on Agriculture and the Rural Economy / WRS-02-1 ✺ 119
percent from 1993 to 1998 and then ended abruptly in
1999, with the closing of the plant.
Second, Mexico's phytosanitary requirements have
raised the costs for U.S. producers and shippers,
making fresh peach exports to Mexico from some
parts of the United States uneconomical. However, the
implementation of a systems approach for California
peaches appears to have boosted U.S. peach exports to
Mexico. Considering only peaches destined for the
fresh market, U.S. exports to Mexico fell 22 percent
between 1993 and 1998, but this trade almost
recouped its 1994 high of 16,227 metric tons in 2000.
Karen Ackerman and Linda Calvin (202-694-5244,
[email protected])
Avocados
Policy Changes Resulting
from NAFTA
United States. Prior to 1995, the United States levied a
general tariff of 13.2 cents per kilogram on avocados.
Under URAA, this tariff was reduced to 11.2 cents per
kilogram over the 6-year period that ended on January
1, 2001. Under NAFTA, the United States is reducing
its tariff on Mexican and Canadian avocados over the
9-year period that ends on January 1, 2003. For 2001,
the U.S. tariff for Mexican avocados equals 2.6 cents
per kilogram.
Mexico. Prior to 1994, Mexico's general tariff on
avocado imports was 20 percent. Under NAFTA, the
tariff for U.S. avocados is being phased out and will
reach zero on January 1, 2003.
Canada. Prior to 1989, Canada did not impose a tariff
on avocado imports. There have been no changes in
this policy under CFTA and NAFTA.
Avocado Trade under CFTA and NAFTA
From 1914 to 1993, the United States prohibited fresh
avocado imports from Mexico due to phytosanitary
concerns. Since 1993, Mexico and the United States
have implemented a series of measures designed to
permit freer trade in fresh avocados while adequately
addressing phytosanitary concerns. In July 1993, the
United States began to allow Mexico to ship fresh
avocados to Alaska year-round. Then, on January 31,
1997, APHIS approved a rule that allows the importation of Hass avocados from certain growers in the
Mexican state of Michoacán to certain parts of the
United States during the months of November through
February. Approved U.S. destinations for this trade are
the District of Colombia and 19 States east of the
Mississippi River: Connecticut, Delaware, Illinois,
Indiana, Kentucky, Maine, Maryland, Massachusetts,
Michigan, New Hampshire, New Jersey, New York,
Ohio, Pennsylvania, Rhode Island, Vermont, Virginia,
West Virginia, and Wisconsin. The months from
November through February were selected because
cold weather in the approved destinations would likely
kill any pests that slipped through pest control safeguards. This time period precedes the peak harvest of
California Hass avocados. The first imports under the
new regulations began in November 1997.
Trade Issues
Under the APHIS systems approach, Mexican avocado
imports must meet stringent pest-control requirements
in production, packing, and transportation to minimize
the risk of introducing pests to the United States that
could threaten the health of U.S. avocado groves.
Mexican producers apply a country-of-origin sticker to
each avocado, indicating the phytosanitary number of
the packinghouse and a statement that distribution be
limited to the approved destinations. Avocados
entering the United States are shipped in sealed refrigerated vehicles. In the first year of the program, no
pests of concern were found in groves approved for the
export program. However, there have been a few
compliance problems since 1997. A small portion of
Mexican avocados shipped to the authorized destinations was later shipped outside the restricted area. The
volume of Mexican avocados out of compliance was
estimated to be less than 1 percent of Mexican exports
in 1999 and 2000. Firms found guilty may be fined up
to $250,000, but most cases have been settled. With
the lack of pest interception thus far, the Mexican
government has requested to expand market access to
additional northern-tier states that do not contain host
material for any avocado-specific pests and have
climatic conditions that do not support the establishment of fruit flies. They also have requested to extend
the shipping season.
NAFTA's Impact on Avocado Trade
In 2000, the United States imported $21 million of
fresh avocados from Mexico, less than 1 percent of
total U.S. fruit and vegetable imports from that
country. In the first 12 months of the export program
(November 1997 through February 1998), U.S.
imports of fresh avocados from Mexico totaled 6,031
metric tons, about 20 percent of the volume of Hass
120 ✺ Effects of NAFTA on Agriculture and the Rural Economy / WRS-02-1
Economic Research Service, USDA
avocados shipped from California during the same
period. In calendar year 2000, imports from Mexico
equaled 13,135 metric tons, more than double that
amount. Mexican avocados have claimed an increasing
share of U.S. avocado imports, 20 percent in 2000
compared with 6 percent in 1992. Also, total U.S.
avocado imports have increased from 3 percent of total
avocado supplies in 1992/93 (utilized domestic
production plus imports) to 32 percent in 1999/2000.
Meanwhile, U.S. avocado exports to Canada dropped
from 5,310 metric tons in 1993 to 790 metric tons in
2000, as the relative strength of the U.S. dollar makes
Mexican avocados more attractive to Canadian
importers.
Karen Ackerman and Agnes Perez (202-694-5255,
[email protected])
Grapes
Policy Changes Resulting
from NAFTA
United States. In accordance with URAA, the United
States gradually reduced its tariffs on grapes over the
6-year period that ended on January 1, 2001.
Currently, the MFN tariff is zero during April, May,
and June, $1.80 per cubic meter from July 1 to
February 14, and $1.13 per cubic meter from February
15 to March 31.
Under CFTA, the United States gradually reduced its
tariff on Canadian grapes 10 percent a year, until it fell
to zero on January 1, 1998. Under certain conditions,
the United States has the option of implementing a
snapback to MFN tariff levels. This provision expires
on January 1, 2008. Under NAFTA, the United States
immediately eliminated its tariffs on Mexican grapes
on January 1, 1994.
Mexico. Prior to 1994, Mexico levied a tariff of 20
percent on imported grapes and required import
licenses for fresh table grapes. Under NAFTA, Mexico
eliminated the import licenses and replaced them with
tariffs. The tariff for October 15 to May 31 was immediately eliminated on January 1, 1994. The tariff for
the rest of the year is being reduced from 20 percent to
zero in equal increments over the 9-year period that
ends on January 1, 2003. For 2001, the tariff for the
June 1 to October 15 period is 4 percent. Currently,
imports from the United States must originate in areas
of California without fruit-fly quarantine.
Economic Research Service, USDA
Canada. Prior to 1989, Canada imposed a seasonal
tariff of 2.21 Canadian cents per kilogram on grapes.
Under CFTA, the tariff declined 10 percent a year until
it fell to zero on January 1, 1998. Snapback provisions
apply until January 1, 2008. Under NAFTA, Canada
gradually eliminated its seasonal tariff on Mexican
table grapes over the 4-year period that ended on
January 1, 1998.
Grape Trade under CFTA and NAFTA
The United States is a net importer of grapes. Most
grape imports come from Chile during the U.S. offseason. Mexico is the second largest source of imports
and generally ships grapes to the United States during
May and June, with smaller amounts in early July.
Imports from April 20 through August 15 must meet
the standards of a California grape marketing order
that establishes minimum maturity requirements. In
2000, U.S. grape imports from Mexico totaled $142
million, 6 percent of total U.S. fruit and vegetable
imports from Mexico.
The California grape industry ships fresh table grapes
from June through January, but the volume in June is
very small. In 2000, Canada was the largest export
market for U.S. grapes, Hong Kong was second, and
Mexico was third. That year, U.S. grape exports to
Mexico were valued at $38 million, 5 percent of total
U.S. fruit and vegetable exports to Mexico. Exports to
Canada equaled $113 million, 4 percent of total U.S.
fruit and vegetable exports to that country.
U.S.-Mexico trade in table grapes has increased
steadily in both directions since 1989. In 1993, the
U.S. and Mexican governments agreed to new
phytosanitary standards for grape trade. U.S. exports
to Mexico climbed from an average of 5,125 metric
tons during 1991-93 to an average of 31,698 metric
tons during 1998-2000. U.S. imports from Mexico also
rose in the 1990's. Imports averaged 93,142 metric
tons per year during 1998-2000, compared with
40,419 metric tons during 1991-93.
U.S. exports of table grapes to Canada have generally
decreased since 1990. These exports fell from an
average of 112,105 metric tons per year during 199193 fell to an average of 88,841 metric tons per year
during 1998-2000. U.S. imports of Canadian grapes
are small and erratic. They grew to 5,910 metric tons
in 1999, but dropped back to 4,447 metric tons in
2000. Most imports from Canada enter in September.
The Effects of NAFTA on Agriculture and the Rural Economy / WRS-02-1 ✺ 121
Trade Issues
Mexican Labeling Rule. In 1997, the Mexican government issued a rule concerning the labeling of grapes.
In addition to domestic Mexican labeling, the rule
required a country-of-origin label in Spanish for
imported grapes. Initially, Mexico required U.S. shippers to apply the label, an idea that California shippers
strongly resisted. Eventually, the rule was revised to
allow either the U.S. shipper or the Mexican importer
to apply the label. The grape industries in California
and Sonora worked together to get this rule revised.
U.S. Antidumping Petition. On March 30, 2001, the
Desert Grape Growers League and its producermembers filed a petition asking that the U.S.
International Trade Commission (ITC) conduct an
antidumping investigation under Section 731 of the
Tariff Act of 1930 regarding spring table grapes from
Chile and Mexico. The ITC rejected the petition.
NAFTA's Impact on Grape Trade
Prior to 1994, Mexican grapes entered the United States
duty-free from April through June. NAFTA eliminated
tariffs for the rest of the year, making this trade dutyfree year round. During 1989-93, Mexican grape
exports to the United States during the July-to-March
period averaged only 5 percent of annual exports.
During the first 5 years of NAFTA (1994-98), that trade
constituted 17 percent of the total. In 1999 and 2000,
that share fell back to 7 percent and 5 percent, respectively, of U.S. table grape imports from Mexico.
The opening of trade under NAFTA, specifically
Mexico's end of its licensing requirement, was very
important to U.S. grape exporters. Eliminating the
Mexican tariff on U.S. exports during the fall also
helps the U.S. industry, as do aggressive market
promotion efforts.
Karen Ackerman and Agnes Perez (202-694-5255,
[email protected])
Cantaloupe
Policy Changes Resulting
from NAFTA
United States. Prior to 1995, the United States levied a
general tariff of 20 percent on cantaloupe during the
period of August 1 to September 15 and 35 percent
during the rest of the year. However, from the mid1980's through 1992, the United States frequently
exempted fresh cantaloupe imported between January
1 and May 15 from the applicable general tariff. Under
URAA, the United States gradually reduced its general
tariffs on cantaloupe to 12.8 percent for August 1 to
September 15 and to 29.8 percent during the rest of
the year. These reductions occurred over the 6-year
period that ended on January 1, 2001.
Under CFTA and NAFTA, the United States gradually
reduced its tariff on Canadian cantaloupe by 10
percent a year, until the tariff reached zero on January
1, 1998. NAFTA includes a snapback to MFN tariff
levels under certain conditions until January 1, 2008.
Under NAFTA, the United States is phasing out its
tariff on Mexican cantaloupes imported during the
period from August 1 to September 15. This transition
is occurring over the 9-year period that ends on
January 1, 2003. The tariffs for May 16 to July 31 and
September 16 to November 30 are being gradually
eliminated over the 14-year period that ends on
January 1, 2008. The tariff for December 1 to May 15
was immediately eliminated on January 1, 1994. For
2001, the tariffs for May 16 to July 31 and for
September 16 to November 30 equal 16.33 percent,
and the tariff for August 1 to September 15 equals 4
percent.
Mexico. Prior to 1994, Mexico levied a 20-percent
tariff on imported cantaloupe. Under NAFTA, Mexico
is matching or exceeding the pace of the U.S. phaseout of its seasonal tariffs. Upon NAFTA's implementation, Mexico immediately eliminated its tariffs on U.S.
cantaloupe for December 1 to May 15 and for August
1 to September 15. The tariffs for the rest of the year
are being gradually eliminated over the 9-year period
that ends on January 1, 2003. For 2001, the tariffs for
May 16 to July 31 and for September 16 to November
30 equal 4 percent.
Canada. Canada did not levy a tariff on cantaloupe
prior to 1989, and this policy has remained unchanged
under CFTA and NAFTA.
Cantaloupe Trade Since NAFTA
The United States is a net importer of cantaloupe.
During the 1990's, imports have averaged 24 percent
of supply, compared with 13 percent during the 1980's.
This increase is due to stronger off-season demand for
fruits and vegetables, some of which is linked to the
popularity of fruit and salad bars. Per capita use of
cantaloupes reached 11.8 pounds per person in 1998,
122 ✺ Effects of NAFTA on Agriculture and the Rural Economy / WRS-02-1
Economic Research Service, USDA
up from 9.2 pounds in 1990 and 5.8 pounds in 1980.
For cantaloupe and other melons, this expanded offseason demand can only be served by imports. While
growth in domestic production kept pace with population growth during the 1980's and 1990's, imports
increased 156 percent.
Almost all cantaloupe imports enter the United States
between November and June. During this period,
Mexico is a major supplier. In 2000, Mexico
accounted for 27 percent of U.S. cantaloupe imports
and was the only source of these imports during June
and July. The nations of the Caribbean Basin Initiative
(CBI) accounted for almost all of the remaining 73
percent. Cantaloupe from CBI countries enters the
United States duty-free.
these exports by 17-25 percent. Had only URAA been
implemented, these exports were predicted to increase
by 5 percent. The large increase in Mexican exports is
primarily due to the recovery of the Mexican
cantaloupe industry.
Between 1993 and 2000, U.S. cantaloupe exports to
Canada increased 35 percent in volume. Holding other
factors constant, NAFTA and URAA tariff changes
were expected to increase these exports 4-7 percent.
Had only the URAA tariff changes been implemented,
these exports would have increased 1 percent.
Steven Zahniser (202-694-5230,
[email protected])
Watermelon
Cantaloupe imports from Mexico generally have
increased since NAFTA's implementation but have
only reached levels common to the early 1990's in the
last several years. In 1992 and 1993, some cantaloupeproducing areas in Mexico suffered adverse weather
conditions, and it took several years for the industry to
recuperate. The United States imported 68,275 metric
tons of Mexican cantaloupe in 1993 and a record
196,968 metric tons in 1999, compared with the
previous record of 163,641 metric tons in 1991. In
2000, imports dropped to 136,064 metric tons, with a
value of $49 million.
U.S. cantaloupe exports to Canada have increased
almost without interruption under CFTA and NAFTA.
In volume terms, these exports have increased from
27,602 metric tons in 1989 to 67,890 metric tons in
2000, while the value of this trade has climbed from
$7 million to $29 million. Canada accounted for 96
percent of total U.S. cantaloupe exports in 2000.
Trade Issues
There have been no trade disputes involving
cantaloupes.
NAFTA's Impact on Cantaloupe Trade
U.S. tariffs on cantaloupes for the periods of May 16
to July 31 and September 16 to November 30 are
being phased out over a 14-year period. This is the
longest transition period specified by NAFTA.
Between 1993 and 2000, Mexican cantaloupe exports
to the United States increased 99 percent, but exports
were extremely low in 1993 due to bad weather in
Mexico and relatively low in 2000. NAFTA and
URAA tariff changes alone were expected to increase
Economic Research Service, USDA
Policy Changes Resulting
from NAFTA
United States. Prior to 1995, the United States levied a
general tariff of 20 percent on watermelons. Under
URAA, the United States gradually decreased the
tariff for December 1 to March 31 to 9 percent and the
tariff for the rest of the year to 17 percent. These
reductions occurred over the 6-year period that ended
on January 1, 2001.
Under NAFTA, the tariff for the main U.S. production
period (May 1 to September 30) is being phased out
over the 9-year period that ends on January 1, 2003.
The tariff for the rest of the year was eliminated immediately on January 1, 1994. For the May-September
period, the United States introduced a TRQ, initially set
at 54,400 metric tons for 1994. The quota grows 3
percent over the 9-year transition period and then is
eliminated altogether. Over-quota imports from Mexico
are subject to the lower of the MFN rate in place on
July 1, 1991, or the current MFN rate. For 2001, the
TRQ for the May-September period is 66,905 metric
tons, and the over-quota tariff equals 4 percent.
Under CFTA and NAFTA, the United States reduced
its tariff on Canadian watermelon 10 percent per
annum until the tariff was eliminated on January 1,
1998. A snapback provision to MFN tariff levels
applies to U.S.-Canada watermelon trade under certain
conditions until January 1, 2008.
Mexico. Before NAFTA, Mexico levied a 20-percent
tariff on watermelons. With NAFTA, this tariff is
limited to the same period (May 1 to September 30) as
The Effects of NAFTA on Agriculture and the Rural Economy / WRS-02-1 ✺ 123
the U.S. tariff. The Mexican tariff is to be phased out
over the 9-year period that ends on January 1, 2003.
For 2001, the tariff equals 4 percent.
Canada. Canada had no tariff on watermelon prior to
1989. This policy has remained unchanged under
CFTA and NAFTA.
Watermelon Trade Since NAFTA
Since NAFTA's implementation in 1994, Mexico has
supplied 92 percent of U.S. watermelon imports.
Imported watermelon dominates the U.S. market from
October through April, but imports from Mexico are
largest during April and May when the U.S. season is
just getting underway. In 2000, U.S. watermelon
imports from Mexico equaled 107,821 metric tons,
with a value of $48 million.
Mexican watermelon production suffered a decline in
the early 1990's, with exports to the United States
reaching a low of 81,763 metric tons in 1992. Over the
next 5 years, exports increased steadily, peaking at
209,372 metric tons in 1997. Since then, this trade has
declined steadily to its current level in 2000. Mexican
exports to the United States during the months of the
TRQ (May to September) have never filled the quota,
and in 1999 and 2000, Mexican exporters completely
avoided shipping watermelons to the United States
during the months in which the TRQ is in force. Canada
exports few if any watermelons to the United States.
The catalyst for this import growth is stronger demand
in the U.S. market. During 1994-98, U.S. per capita
watermelon consumption averaged 13 percent higher
than during 1989-93. This increase partially reflects
strong industry promotion, but it may also be due to
greater availability of new seedless watermelon varieties, which appear to be popular with consumers.
Under CFTA and NAFTA, U.S. watermelon exports to
Canada have increased almost without interruption,
with 97 percent of all U.S. watermelon exports went to
Canada during 1989-2000. Over this period, U.S.
watermelon exports increased in volume from 37,882
metric tons to 130,365 metric tons, while the value
expanded from $5 million to $35 million over the
same period. The expansion of this trade is particularly
noteworthy, since this trade was duty-free long before
the implementation of the two agreements. Very little
U.S. watermelon is exported to Mexico, generally less
than 1 percent of the U.S. crop.
Trade Issues
There have been no trade disputes involving watermelons.
NAFTA's Impact on Watermelon Trade
Between 1993 and 2000, U.S. imports of Mexican
watermelon increased 122 percent in volume, but in
1993, the United States imported an unusually small
volume of watermelons. There are no discernible
impacts on producers due to NAFTA, since most
import volume occurs during the U.S. off-season.
Steven Zahniser (202-694-5230,
[email protected])
124 ✺ Effects of NAFTA on Agriculture and the Rural Economy / WRS-02-1
Economic Research Service, USDA
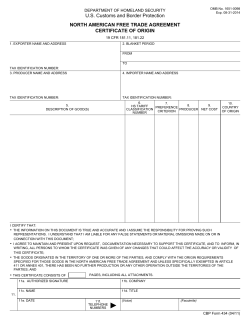


© Copyright 2026