
General Agreement on Tariffs and Trade
General Agreement on Tariffs and Trade
THE RESULTS OF THE URUGUAY ROUND OF
MULTILATERAL TRADE NEGOTIATIONS
Market Access for Goods and Services:
Overview of the Results
This study has been prepared under the sole responsibility of the GATT Secretariat.
The analysis and conclusions contained herein should not be attributed
to GATT's contracting parties, individually or collectively.
Geneva, November 1994
TABLE OF CONTENTS
¡Error! No se encuentra el origen de la referencia.I.
...........................................
METHODS AND SOURCES . .
56
II. ESTIMATING CHANGES IN TARIFF ESCALATION . . . . . . . . . . . . . . . . . . . . . . . . . . . 58
III.
SURVEY OF COMPUTABLE GENERAL EQUILIBRIUM (gce) ASSESSMENTS OF
THE
URUGUAY ROUND . . . . . . . . . . . . . . . . . . . . . . . . . . . . . . . . . . . . . . . . . . . . . . . . . 59
IV.
THE EMPIRICAL RELATION BETWEEN TRADE AND GROWTH: A SUMMARY
¡Error! No se encuentra el origen de la referencia.
OF
RECENT FINDINGS . . . . . . . . . . . . . . . . . . . . . . . . . . . . . . . . . . . . . . . . . . . . . . . . . . 63
APPENDIX TABLES . . . . . . . . . . . . . . . . . . . . . . . . . . . . . . . . . . . . . . . . . . . . . . . . . . . . . . . . . . 65
REFERENCES . . . . . . . . . . . . . . . . . . . . . . . . . . . . . . . . . . . . . . . . . . . . . . . . . . . . . . . . . . . . . . 85
LIST OF TABLES
TEXT TABLES
¡Error! No se encuentra el origen de la referencia.
I.
INTRODUCTION
AND SUMMARYI. INTRODUCTION AND SUMMARY
The Uruguay Round negotiations were concerned with two aspects of trade in goods and
services. First, there was the goal of increasing market access by reducing or eliminating trade
barriers. This objective was met by reductions in tariffs, reductions in non-tariff support in agriculture,
the elimination of bilateral quantitative restrictions, and reductions in barriers to trade in services.
Second, there was the goal of increasing the legal security of the new levels of market access. The
strengthened and expanded rules, procedures and institutions are the Round's contributions to the
second goal.
Part II of this study is concerned primarily with increases in market access for goods.1
Because of their quantitative nature, these results lend themselves to a further examination of the likely
impact on the level of world trade in goods and world income. The "binding" of reductions in tariffs
and certain other interventions - a key element in the security of market access, and one which can be
described in quantitative (tabular) terms - is also covered in Part II.
Part III focuses on the Uruguay Round's market access results in the services area, that is,
on the commitments in countries' services schedules under the new General Agreement on Trade in
Services (GATS). In some respects, the services schedules are similar to the goods schedules examined
in Part II. Both contain elements of increased market access, together with elements of more secure
market access in the form of commitments not to increase the level of restrictions covered by the
schedules. Though to a much smaller extent than in the goods area, it is also possible to describe the
results in the services area in quantitative (tabular) terms. In other respects, however, the respective
schedules are very different. In particular, there is no meaningful way to quantify the size of the
reduction in barriers to trade in services - no parallel, for example, to the 40 per cent reduction in
developed countries' tariffs on industrial goods - which is why services could not be included in the
estimates of the increase in trade and income from the Uruguay Round.
While the schedules of commitments on goods and services provide legal security for the
market access contained in the schedules, their value also depends on rules limiting alternative forms of
protection. Part IV is a brief summary of those parts of the Uruguay Round agreement that strengthen
and extend the rules, procedures and institutions governing (a) other kinds of measures - such as
subsidies, technical barriers and discriminatory internal taxes - that could be used to restrict market
access and thus offset part or all of the increased market access contained in the schedules of
commitments, and (b) procedures for resolving disputes over the interpretation of countries' obligations,
both those in the schedules and those involving rules and procedures. By providing a framework for the
monitoring of trade policies, for regularly scheduled ministerial-level meetings and for future
negotiations, the strengthened institutional arrangements also help countries anticipate and defuse trade
conflicts that might otherwise lead to violations of WTO obligations - that is, to illegal reductions in
market access.
Earlier versions of many of the tables in Part II have appeared in GATT documents and publications over the past year.
¡Error! No se encuentra el origen de la referencia.
The following list of selected highlights from the study begins with the updated estimates of
the impact of the liberalization of trade in goods on world income and world trade in goods. These
estimates are based on a general equilibrium model of the world economy, elaborated and applied by
the GATT Secretariat, that links industries together in chains from primary goods, through higher
stages of processing, to the final assembly of consumption goods. Sectors are also linked through
various economy-wide constraints such as the supply of labour, capital and land, and there are linkages
between countries. Three versions of the model have been used, with different assumptions about the
nature of competition in domestic markets, economies of scale, the degree of product differentiation and
- a dynamic consideration - the extent to which the income gains in turn stimulate savings and
investment.
Highlights
- Estimates of the increase in world income from the liberalization of trade in goods range
from a low of $109 billion to a high of $510 billion in 2005 (the end of the
implementation period), depending on which version of the economic model is used
(page 34). The view of the GATT Secretariat is that the assumptions underlying the
$510 billion figure more closely approximate the real world economy, and therefore that it
is a more plausible estimate (pages 37-38).
- The upper range assumptions yield estimated annual income gains of $122 billion for the
United States, $164 billion for the European Communities, $27 billion for Japan and
$116 billion for developing and transition economies as a group (page 34).
- Estimates of the increase in the volume of world trade in goods range from 9 to
24 per cent once the liberalization has been fully implemented; in terms of actual 1992
trade flows, the gains would range from $244 billion to $668 billion (since trade in 2005
would have been larger than trade in 1992 in any case, the actual value increases due to
the Round are very likely to be larger) (page 29).
- All versions of the model estimate that the percentage increase in the exports and imports
of the developing and transition economies as a group will be 50 per cent above the
average increase for the world as a whole (page 32).
- It is likely that the estimated $510 billion increase in annual world income by 2005
substantially underestimates the impact of the entire Uruguay Round package for three
reasons: first, many possible dynamic effects are not considered; second, since a distinct
worsening of trade relations for a considerable period into the future and a delay in the
world's economy recovery would almost certainly have followed a failure of the Round,
the avoidance of the associated losses in trade and income would have to be included in a
full accounting of the gains from the successful Uruguay Round; third, and in many ways
most important of all, the estimates reported above ignore other aspects of the Round
beyond the liberalization of trade in goods. Because it simply was not feasible, there was
no attempt to include the beneficial impact of the market access commitments and rules
for services, and of the WTO's strengthened rules, procedures and institutions, on the
more than $4.5 trillion in current world trade in goods and services (page 38).
Actions to increase market access and make it more secure include:
- Developed countries have agreed to reduce their tariffs on industrial goods from an
average of 6.3 per cent to 3.8 per cent, a 40 per cent reduction (page 12).
¡Error! No se encuentra el origen de la referencia.
- The proportion of industrial products which enter the developed country markets under
MFN zero duties will more than double, from 20 to 44 per cent. At the higher end of the
tariff structure, the proportion of imports into developed countries from all sources that
encounter tariffs above 15 per cent will decline from 7 to 5 per cent, and from 9 to
5 per cent for imports from developing economies (page 11).
- Minimum market access commitments on agricultural products subject to tariffication will
create market opportunities for, among other products, 1.8 million tons of course grains,
1.1 million tons of rice, 807,000 tons of wheat and 729,000 tons of dairy products
(page 22).
- Other reforms in agriculture include a 36 per cent reduction in export subsidies, from
$22.5 billion to $14.5 billion (of which one-half is accounted for by the European Union),
and a decline of 18 per cent, from $197 billion to $162 billion in domestic support to
agricultural producers (pages 22-24).
- In the case of industrial products, the percentage of bound tariff lines has risen from 78 to
99 per cent for developed countries, from 21 to 73 per cent for developing economies, and
from 73 to 98 per cent for transition economies - results that provide a substantially
higher degree of market security for traders and investors (page 26).
- While the overall level of protection of agricultural products in most developed countries
will remain well above the level of protection of industrial products, agricultural trade has
been put squarely on the path of liberalization. And for the first time in GATT's history,
the level of security for trade in agricultural products will be greater than for trade in
industrial products, since (i) virtually 100 per cent of agricultural product tariff lines will
be bound, compared to 83 per cent of industrial product tariff lines, and (ii) there will be
virtually no non-tariff barriers (page 26).
- Following the first multilateral negotiation of its kind, most developed countries have
made market access commitments on the great majority of the most important traded
services - the main exceptions being telecommunications and maritime transport, which
are both the subject of ongoing negotiations, and the audiovisual sector. On a sectoral
basis, the highest level of commitments is found in service activities related to tourism
(hotels and restaurants, travel agencies and tour operators, tourist guides), reflecting the
numerous developing countries that have inscribed this sector in their schedules, and
financial services (the latter is also subject to ongoing negotiations) (pages 41-43).
- An important theme throughout the study is that from the perspective of an individual
participant in the Uruguay Round, the increase in access to its own market is as important
as the increases in access to the markets of its trading partners. When other countries
increase access to their markets and make that access more secure, the country's export
industries benefit directly. When the country increases access to its own domestic market
and makes that access more secure, the beneficiaries include not only domestic consumers
and domestic firms that depend on imported inputs to remain competitive, but also
(indirectly) the entire export sector.2
Regarding this indirect gain for the export sector, which is in addition to the direct gain from increased access to foreign markets, see Clements and Sjaastad (1985) for a detailed
explanation of why a "tax on imports is a tax on exports" even if the export industries do not use imported inputs.
¡Error! No se encuentra el origen de la referencia.
II. MARKET ACCESS FOR GOODSII. MARKET ACCESS FOR GOODS
By 15 April 1994, most participants had submitted their Uruguay Round schedules of
commitments on industrial products and on agricultural products. The exceptions were the leastdeveloped countries that are taking advantage of the extension of the deadline for submitting schedules
to 15 April 1995. The commitments on trade in goods are described below according to two separate
dimensions: further market-opening through reductions in barriers to trade (Sections 1, 2 and 3), and
increased security of market access through bindings (Section 4). The final section reports the
Secretariat's estimates of the impact of this trade liberalization on world trade and world income.
1. TARIFF REDUCTIONS ON INDUSTRIAL PRODUCTS1. TARIFF REDUCTIONS ON
INDUSTRIAL PRODUCTS
All of the information in this section on tariff reductions and imports comes from GATT's
Integrated Data Base (IDB), which covers 55 Uruguay Round participants (counting the 12 members
of the European Union individually). On an aggregate basis, the data cover approximately 98 per cent
of the merchandise imports (excluding petroleum) of GATT contracting parties and approximately
90 per cent of total world merchandise trade excluding petroleum (see Annex I for additional details on
methods and sources of data).3
(a) Imports covered by tariff commitments(a) Imports covered by tariff commitments
With 18 per cent of industrial imports from all sources already entering under MFN tariffs bound
at zero, the potential trade coverage of the developed countries' offers was 82 per cent of imports
(Table II.1). Tariffs were reduced on 64 per cent of the value of imports, with the remaining
18 per cent divided between bindings only (3 per cent of imports) and "no offer" (16 per cent).4 On the
basis of the percentage of imports on which no offer was made, the two leading product groups are
"transport equipment" (no tariff offer on 54 per cent of imports into developed countries) and "leather,
rubber, footwear and travel goods (31 per cent). Imports from developing economies into developed
countries fare about the same as imports from all sources, except for products on which the developed
countries made no offer, where developing economies did better (only 10 per cent of their exports to
developed countries versus 16 per cent of exports from all sources).
The developing economies as a group will reduce (and bind) MFN tariffs on nearly half their
tariff lines (46 per cent) covering about one-third of their industrial imports. They made no offer on 29
per cent of their tariff lines covering 42 per cent of their imports. However, the figures on the share of
imports subject to tariff reductions, as well as the share of imports on which no offer was made, are
heavily influenced by the fact that Hong Kong and Singapore, which together account for
Table II.1Broad pattern of tariff commitments on industrial products1 II.1
Membership in the IDB includes all developed and transition economies participating in the Uruguay Round, and 27 of 94 developing economy participants. These 27 developing
economies, which include China (whose schedule is not yet definitive), account for roughly one-third and three-quarters, respectively, of the tariff lines and the merchandise imports (excluding
petroleum) of the 94 developing country participants. On a regional basis, the IDB data cover 100 per cent of non-petroleum imports of North America, Western Europe and GATT members
in Central and Eastern Europe; 90 per cent of Asia's imports; 80 per cent of Latin America's imports; and 30 per cent of Africa's imports. The low coverage of Africa is due to a low level of
participation in the IDB. Trade between partners in preferential trade agreements, such as between Canada and the United States, or between the European Union and EFTA member states, is
excluded.
Some of the tariff lines in the "no offer" category involve chemicals for which the current tariff is below the proposed harmonization level.
¡Error! No se encuentra el origen de la referencia.
Broad pattern of tariff commitments on industrial products1
(Percentages)
Currently dutiable and/or unbound3
Already bound
duty-free2
Country group or region
Bindings with reductions
Share of
lines
Bindings without
reductions
No offer
Share of
imports
Share of
lines
Share of
imports
Share of
lines
Share of
imports
Share of
lines
Share of
imports
By major country group:
Developed economies
All sources
Developing economies
17
18
19
67
64
67
9
3
3
7
16
10
0
1
46
32
24
26
29
42
6
12
22
83
76
72
0
1
0
11
10
6
North America
18
11
72
64
0
1
10
24
Latin America
0
2
72
71
26
19
2
8
16
24
58
63
1
0
25
13
Central/East Europe
6
11
67
70
17
9
10
10
Africa
4
15
24
32
38
47
35
6
Asia
2
8
43
41
21
19
33
32
Developing economies
All sources
Transition economies
All sources
Developing economies
By selected region:
Western Europe
1
Excluding petroleum.
Figures refer to tariff lines which were fully bound prior to the Uruguay Round.
3
Figures include tariff lines with unbound zero duties and partially bound zero duties.
2
42 per cent of the imports of the 27 developing economies in the IDB, did not make offers on a
substantial number of tariff lines on which the unbound applied tariff is zero (this also affects the
corresponding figures for Asia in the lower half of Table II.1). The proportion of dutiable imports into
developing economies on which there was no offer is 13 per cent, a figure which is less than the
corresponding 16 per cent average for developed countries.
The figures for developing economies and certain regions under the heading "bindings without
reductions" call attention to an important aspect of the Uruguay Round tariff negotiations, which is that
in a number of instances tariffs were bound at levels above the currently applied rates (9 per cent of
developed country tariff lines - primarily those of developed countries in Asia - also fall in this
category). This is considered in more detail in Section 4 below.
¡Error! No se encuentra el origen de la referencia.
(b) Tariff reductions(b) Tariff reductions
Table II.2 provides a tariff profile of the three major country groups before the Uruguay Round
and after the negotiated tariff reductions have been fully implemented.5 Once the Uruguay Round tariff
reductions are fully implemented, the proportion of industrial products which enter the developed
country markets under MFN zero duties will more than double, from 20 to 44 per cent (from 22 to 44
per cent for imports from developing economies).6 At the higher end of the tariff structure, the
proportion of imports into developed countries from all sources that encounter tariffs above 15 per cent
(so-called "peak" tariffs) will decline from 7 to 5 per cent (9 to 5 per cent for imports from developing
economies).
The industrial tariff profile of developing countries is "bipolar", with 42 per cent of imports
entering duty free and 38 per cent bound at duties above 15 per cent, once the Uruguay Round tariff
reductions are in place. The percentage of duty-free imports is explained primarily by the large amount
of duty-free imports into Hong Kong and Singapore. The percentage of imports at duties above
15 per cent reflects primarily the level of ceiling bindings offered, for example, by Latin American
countries. In the transition economies, there will be a modest increase in the proportion of imports
entering free of duty (a larger increase for imports from developing economies) and a decline by half or
more in the proportion encountering tariffs in excess of 15 per cent.
(c) Additional details on reductions in industrial tariffs by developed countries(c) Additional
details on reductions in industrial tariffs by developed countries
Figures for the eleven categories of industrial products in Table II.3 reveal that the developed
countries will (i) reduce tariffs by less than the 40 per cent overall cut in four categories - fish and fish
products; textiles and clothing; leather, rubber, footwear; and transport equipment;7 and (ii) cut
tariffs by 60 per cent or more in three categories - wood, pulp, paper and furniture; metals; and nonelectric machinery. For the four top categories of imports from developing countries (in value terms),
the percentage tariff reduction is greater (only marginally greater for two of the four) for the mix of
products imported from developing economies than for the mix imported from all sources. Despite this,
however, the average reduction on all industrial products is smaller for the mix imported from
developing economies (37 per cent) than for products from all sources (40).
Regarding the distribution of developed country tariffs by industrial product category
(Appendix Table 4), tariffs above 15 per cent will continue to apply to 27 per cent of imports of
"textiles and clothing", and 11 per cent of imports of "leather, rubber, footwear and travel goods".
When considering tariff reductions, it should be kept in mind that what matters as far as the
stimulus to exports is concerned is not the percentage cut in tariff per se, but rather the decline in the
tariff-inclusive price in the importing country. This means that the absolute size of the tariff cut is
important. For example, a 50 per cent reduction in a 3 per cent tariff will, in principle, cause the tariffinclusive price to decline by 1.5 per cent, whereas a 25 per cent cut in a 36 per cent tariff would result
in a 6.6 per cent reduction in the tariff-inclusive price. In terms of the figures in Table II.3, the 69 per
cent cut in the tariff on imports of wood, pulp, paper and furniture from all sources will cause, in
principle, prices for this product group to decline by 2.3 per cent, while the 22 per cent cut in the
average tariff on textiles and clothing will cause prices to decline by 2.9 per cent. The point is that a
Note that in Table II.2 the post-Uruguay Round duties include offers at ceiling rates.
More correctly, the proportion would increase from 20 to 44 per cent if the product composition of industrial imports remained the same as it was in 1988 (the principal base period for the
negotiations). The tariff and trade profile by region in Appendix Table 3 indicates that the increase in duty-free treatment has been particularly substantial in North America (from 11 to
per cent).
The below average reduction for transportation equipment is largely explained by the smaller tariff reductions in the major markets on motor vehicles (which account for the bulk of this
product category).
¡Error! No se encuentra el origen de la referencia.
smaller proportional reduction a high tariff can stimulate exports as much as or more than a bigger
reduction in a low tariff.
Table II.2Pre- and Post-Uruguay Round tariff profiles for industrial products1: the three major country groupsII.2
Pre- and Post-Uruguay Round tariff profiles for industrial products1: the three major country groups
(Billions of US dollars and percentages)
Percentage distribution2
Imports from:2
Tariff lines
Imports from
Imports from
developing
all sources
economies
All
sources
Developing
economies
PreUR
Post
UR
PreUR
Post
UR
PreUR
Post
UR
Developed Economies
Total
736.9
169.7
100
100
100
100
100
100
Duty-free3
149.5
37.3
21
32
20
44
22
44
0.1 - 5.0%
304.3
57.4
24
25
41
32
34
25
5.1 - 10.0%
176.8
38.2
22
20
24
15
23
16
10.1 - 15.0%
51.5
21.6
10
9
7
5
13
9
15.1 - 35.0%
45.1
13.7
16
13
6
4
8
5
9.8
1.5
7
2
1
1
1
0
Over 35%
Developing Economies
Total
350.5
-
100
100
100
100
-
-
3
Duty-free
137.3
-
11
10
39
42
-
-
0.1 - 5.0%
20.5
-
6
5
6
5
-
-
5.1 - 10.0%
28.1
-
7
5
8
10
-
-
10.1 - 15.0%
14.4
-
5
5
4
5
-
-
15.1 - 35.0%
96.6
-
30
55
28
30
-
-
Over 35%
53.6
-
42
20
15
8
-
-
34.7
2.2
100
100
100
100
100
100
Duty-free3
4.6
0.5
7
10
13
16
22
31
0.1 - 5.0%
9.5
0.7
23
32
27
37
30
30
5.1 - 10.0%
9.5
0.5
33
46
27
35
22
26
10.1 - 15.0%
7.5
0.3
27
8
22
7
12
6
15.1 - 35.0%
3.4
0.3
10
4
10
4
14
7
Over 35%
0.2
0.0
0
0
0
0
0
0
Transition Economies
Total
1
2
Excluding petroleum.
The import value and total number of lines exclude tariff lines for which duties are not available in ad valorem terms since these lines cannot be distributed by
duty ranges.
3
Figures refer to tariff lines which were duty-free prior to the Uruguay Round, including those that were fully bound, partially bound or unbound.
¡Error! No se encuentra el origen de la referencia.
¡Error! No se encuentra el origen de la referencia.
Table II.3Developed country tariff reductions by major industrial product group1II.3
Developed country tariff reductions by major industrial product group1
(Billion US dollars and percentages)
Import value
Product category
All sources
Developing
economies
Tariff averages weighted by:
Imports from all
Imports from
developing economies
sources
Pre-
Post
UR
%
Post
UR
Pre-
UR
UR
Red.
All industrial products
%
Red.
736.9
169.7
6.3
3.8
40
6.8
4.3
37
Fish & fish products
18.5
10.6
6.1
4.5
26
6.6
4.8
27
Wood, pulp, paper & furniture
40.6
11.5
3.5
1.1
69
4.6
1.7
63
Textiles and clothing
66.4
33.2
15.5
12.1
22
14.6
11.3
23
Leather, rubber, footwear
31.7
12.2
8.9
7.3
18
8.1
6.6
19
Metals
69.4
24.4
3.7
1.4
62
2.7
0.9
67
Chemicals & photographic supplies
61.0
8.2
6.7
3.7
45
7.2
3.8
47
Transport equipment
96.3
7.6
7.5
5.8
23
3.8
3.1
18
118.1
9.8
4.8
1.9
60
4.7
1.6
66
Electric machinery
86.0
19.2
6.6
3.5
47
6.3
3.3
48
Mineral products & precious stones
73.0
22.2
2.3
1.1
52
2.6
0.8
69
Manufactured articles n.e.s.
76.1
10.9
5.5
2.4
56
6.5
3.1
52
Industrial tropical products
32.8
14.4
4.2
2.0
52
4.2
1.9
55
Natural resource-based products1
80.2
33.4
3.2
2.1
34
4.0
2.7
33
Non-electric machinery
1
Excluding petroleum products.
It has already been noted that the developed countries cut their average tariff on imports of
industrial products from all sources by 40 per cent, from 6.3 to 3.8 per cent. If the developed country
tariff reductions are weighted instead by their imports from developing countries (excluding the least
developed) and from the least developed countries, it is apparent that the tariff reductions involve
smaller percentage cuts and higher average post-Uruguay Round tariffs on the mix of products
currently imported from the two groups of developing countries (upper half of Table II.4). These
results are explained entirely by the results for "textiles and clothing" and "fish and fish products", as is
evident from the figures in the lower half of the table which exclude those products. Important in the
exports of developing economies, and especially the least-developed countries (almost one-half of their
exports to developed countries), they are also products on which developed country tariff reductions are
below the average for industrial products as a whole, and for which post-Uruguay Round tariffs are
above the average (Table II.3).
¡Error! No se encuentra el origen de la referencia.
Table II.4Tariff reductions on industrial products by developed countries from selected II.4
Tariff reductions on industrial products by developed countries from selected
groups of countries
(Billions of US dollars and percentages)
Trade-weighted tariff average
Imports from:
Import value
PreUR
PostUR
Percentage
reduction
All industrial products1
All sources
736.9
6.3
3.8
40
Developing economies (other than
least developed economies)
165.8
6.8
4.3
37
3.9
6.8
5.1
25
All sources
652.1
5.4
2.9
46
Developing economies (other than
least developed economies)
123.7
4.8
2.4
50
2.1
1.8
0.7
61
Least developed economies
Excluding textiles and clothing,
fish and fish products
Least developed economies
1
Excluding petroleum.
In those instances in which a quantitative restriction is the binding restraint (rather than the
tariff), and the quantitative restriction is being removed, the extent of the increase in market access is
larger than is indicated by the cut in the tariff alone. In the case of "textiles and clothing", therefore, it
is necessary to consider the phase out of restraints applied under the Multi-Fibre Arrangement (MFA).
Where an MFA quota is the binding restraint, the tariff-equivalent of the quota obviously will exceed
the ordinary tariff, often by a sizeable amount. In such cases, the percentage reductions in import
barriers calculated on the basis of ordinary tariffs will understate the true increase in the opening to
imports resulting from a successful Uruguay Round (more on this below).
(d) Tariff reductions by individual participants(d) Tariff reductions by individual participants
Among the developed countries, the largest percentage reductions in tariffs on industrial products
are those by Japan and New Zealand, at 56 and 53 per cent respectively (see Appendix Table 5).
Recalling the earlier point about the importance of the absolute size of the tariff reductions, it is evident
that the declines in tariff-inclusive prices will be much greater for the New Zealand market (a reduction
of 12.6 percentage points in the average tariff, versus 2.2 percentage points for the Japanese market).
In the four largest developed country markets in terms of imports from MFN sources - the European
Union, the United States, Japan and Canada - the average post-Uruguay Round tariff on industrial
products will range from 1.7 per cent (Japan) to 4.8 per cent (Canada).
The tariff changes among the 27 developing economy participants for which detailed calculations
are possible (IDB members) vary considerably (see Appendix 6). Eleven economies have offered tariff
reductions and no ceiling bindings. Among them, India, Korea and Singapore will reduce their average
tariffs on industrial goods by more than half, from 71.4 to 32.4 per cent in the case of India, from 18 to
8.3 in Korea's case, and from 12.4 to 5.1 in the case of Singapore. Recalling the point about the
importance of the absolute size of the tariff reductions, it should be noted that India's reduction is very
much larger than the reductions of the developed countries. Two economies, Hong Kong and Macau,
have pre- and post-Uruguay Round tariffs of zero. The remaining 14 countries have offered a mixture
of tariff reductions and ceiling bindings. For seven of them tariff reductions more than offset the
¡Error! No se encuentra el origen de la referencia.
ceiling bindings resulting in an overall tariff reduction while for the remaining seven countries, the
overall result for industrial products shows an increase in the post-Uruguay Round tariff reflecting their
offers of ceiling bindings. In Zimbabwe, which has the lowest pre-and post-Uruguay Round tariffs
among the developing economies (except for Hong Kong and Macau), 73 per cent of industrial imports
will be duty free.
Of the four economies in transition, Poland will have both the largest tariff reduction on
industrial products (38 per cent) and the highest post-Uruguay Round tariff (9.9 per cent). The postUruguay Round average industrial tariffs in each of the four transition economies are quite similar to
those for the developed countries (see Appendix Table 7).
(e) Changes in tariff escalation(e) Changes in tariff escalation
A major concern of developing countries has been tariff escalation in the developed countries.
This occurs when the tariff applied on a product "chain" rises as the level of processing increases. The
result is that high rates of effective protection are provided to a country's processing sector. The
increase in domestic production of the processed good, and the consequent reduction in its imports, is
thus likely to be greater than it would be if the nominal tariff on processed goods was the same but
tariffs were not subject to escalation. A consequence of tariff escalation is that the development of
processing industries in developing countries, and thus their efforts to industrialize, may be inhibited.
In the following table, the change in tariff escalation as a result of the Uruguay Round is
measured by the change in the tariff wedge, that is by the change in the absolute difference between the
tariffs at the higher and lower stages of processing.8 According to this definition, tariff escalation is
reduced when the tariff wedge declines, that is, when the absolute decline in the tariff on the more
processed version exceeds the absolute decline in the tariff on the less processed version. As shown in
Annex II, a reduction in (or unchanged) tariff escalation, as measured by the tariff wedge, is a
sufficient condition for a decline in the effective rate of protection when tariffs are reduced.
Table II.5 presents a summary picture of the situation facing developing country exports of
selected industrial products to the developed countries.9 Two features are evident at this level of
aggregation: first, developed country tariffs, averaged over all industrial products, were subject to
escalation before the Uruguay Round tariff cuts, and in most (but not all) instances will remain so after
the cuts; second, there have been greater absolute reductions in average tariffs at more advanced stages
of production than at earlier stages of production, both for all industrial products and for the two subgroups shown in the Table, which suggests that the overall degree of escalation has been reduced or
eliminated. For natural resource-based products, for example, the average tariff applied to semimanufactures has been reduced to the same level as raw materials (2 per cent), and while the new
average tariff applied to finished natural resource-based products remains above that on semimanufactures (5.9 compared with 2.0 per cent), the tariff wedge is smaller (3.9 per cent compared to
4.4 per cent).
The figures in Table II.5 are useful, up to a point, as broad indicators of the general direction of
change in tariff escalation. But it is necessary to be cautious in drawing conclusions since the concept
of tariff escalation refers to precisely defined manufacturing "chains" involving particular products, and
not to whole economic sectors.
See Annex II for an explanation of why a change in the tariff wedge generally is a good indicator of the direction of change in tariff escalation.
The stages of processing used in this analysis are those defined by GATT's member countries in connection with the tariff negotiations in the Tokyo Round and the Uruguay Round.
Details on the precise product composition are available on request from the GATT Secretariat.
¡Error! No se encuentra el origen de la referencia.
Table II.5Changes in tariff escalation on industrial products imported by developed countries
from developing economiesII.5
Changes in tariff escalation on industrial products imported by developed countries from
developing economies
(Billions of US dollars and percentages)
Tariff
Imports
Share of
each
stage
Pre
-
Pos
t
U.
R.
A
bsolute
U.
R.
r
eduction
All industrial products1
Raw materials
36.7
22
2.1
0.8
1.3
Semi-manufactures
36.5
21
5.4
2.8
2.6
Finished products
96.5
57
9.1
6.2
2.9
Raw materials
5.1
35
0.1
0.0
0.1
Semi-manufactures
4.3
30
6.3
3.4
2.9
4.9
34
6.6
2.4
4.2
Raw materials
14.6
44
3.1
2.0
1.1
Semi-manufactures
13.3
40
3.5
2.0
1.5
5.5
17
7.9
5.9
2.0
All tropical industrial products
Finished products
1
Natural resource-based products
Finished products
1
Excluding petroleum.
Appendix Tables 8 to 11 present data at a more disaggregated level on the tariffs imposed on
imports of selected products into Canada, the European Union, Japan and the United States. This
evidence confirms that, in general, there has been a decline in tariff escalation. However, in the case of
a few products, the decline in intermediate good tariffs has been larger than the decline in final good
tariffs, implying an increase in tariff escalation at the final stage. These include: rubber in the EU,
Japan and the United States; jute in Canada, the EU and the United States; lead in Japan and the
United States, zinc in Canada; and hides, skins and leather in Japan.
2. REMOVAL OF QUANTITATIVE RESTRICTIONS ON INDUSTRIAL PRODUCTS2.
REMOVAL OF QUANTITATIVE RESTRICTIONS ON INDUSTRIAL PRODUCTS
Two provisions of the Final Act involve the phase-out of quantitative restrictions on industrial
products: the Agreement on Textiles and Clothing and the Safeguards Agreement. The latter covers
measures taken pursuant to Article XIX of the General Agreement, as well as the implementation of the
roll-back commitment made at Punta del Este for certain measures taken outside the framework of the
General Agreement (the so-called "grey-area" measures).
¡Error! No se encuentra el origen de la referencia.
(a) MFA restrictions(a) MFA restrictions
For industrial products, the most important quantitative measures scheduled for elimination are
the restraints on textiles and clothing applied in the context of the Multifibre Arrangement (MFA), in
place since early 1974, but with roots going back to the beginning of the 1960s. As of 1 November
1994, the MFA grouped 39 participants, eight of which are described as "importers"; of these, Austria,
Canada, the European Community, Finland, Norway and the United States apply explicit restrictions
under the MFA, while Japan and Switzerland do not. Other participants, described as "exporters", are
subject to bilateral restraint agreements on their exports to one or more of the "importers" (Table II.6).
Estimates based on 1990 data indicate that, in terms of upper limits, approximately 11 per cent
of world trade in textiles, and 35 per cent of world trade in clothing, were subject to restraint under
MFA agreements (if intra-EU trade in textiles and clothing is excluded, the figures become 15 and
44 per cent, respectively). These figures understate the impact of the MFA on the exports of the MFA
"exporters", individually and as a group. They also understate the impact on world trade, since the
trade shares of restrained imports are depressed by the regime of bilateral restrictions.
Table II.6Number of bilateral restraint agreements applied under the MFA: October 1994II.6
Number of bilateral restraint agreements applied under the MFA: October 1994
Importer
Exporter
Developing economies
of which:
Least-developed economies
Transition economies
United
States
Canada
European
Union
Norway
Finland
Austria
28
21
15
13
7
6
2
2
0
0
0
0
4
4
0
4
0
0
Note: Based on information available to the Textiles Surveillance Body (TSB) as of 14 October 1994.
The Agreement on Textiles and Clothing provides for the phase-out of MFA restraints in four
steps, starting 1 January 1995 and ending 1 January 2005 (assuming that the WTO enters into effect on
1 January 1995). The Agreement also provides for the notification of all non-MFA restraints on
imports of textiles and clothing - 29 non-MFA agreements or sets of unilateral measures had been
notified to the TSB as of mid-October 1994, with the United States and Canada accounting for all but
three - regardless of whether they are based on GATT provisions and requires that they be brought into
conformity with the GATT within one year following the entry into force of the Agreement, or phased
out progressively during a period not exceeding the duration of the Agreement (that is, by 2005).
An indication of the restrictive effect of MFA quotas on world trade in textiles and clothing is
provided by estimates of MFA quota price wedges - that is, of the tariff-equivalent of the bilateral
quotas. These generally are based on prices of export licenses, by product and destination, in the
markets of certain exporting countries, particularly Hong Kong. The available data indicate that MFA
quotas have increased the tariff-inclusive prices of restricted products imported from Hong Kong into
the United States by 27 per cent (1982-83), by 14 per cent in the European Community (1980-85), by 4
per cent in Austria (1982-83), and by 6 per cent in Finland (1982-83).10 More recently, the United
Hamilton (1986). Estimates of quota price wedges have also been made for other MFA exporters where data on implicit or explicit prices of export licenses are unavailable. To obtain
estimates for all MFA exporters, Trela and Whalley (1990) adjust Hong Kong tariff equivalents of quotas for differences in supply costs as a result of wages, labour productivity, and product
quality of exports. An exporter with lower supply costs than Hong Kong has a higher per-unit quota price wedge. It is to be noted that estimates vary greatly from year to year. For example,
between January 1982 and December 1983, the quota price wedges on exports of Hong Kong to the United States varied from about 10 per cent to over 130 per cent (Hamilton, 1986). The
sharp variations over time in the quota price wedges suggest a sensitivity to changes in exchange rates, expectations of available quota volumes and demand conditions in the importer, and
¡Error! No se encuentra el origen de la referencia.
States International Trade Commission (1993) estimated the average quota price wedge on clothing
products entering the United States from all sources at 16.8 per cent. Other recent estimates have been
reported by Yang (1992, 1994) and Whalley (1992). On a bilateral basis, estimates of the quota price
wedge for clothing entering the United States range above 40 per cent.
A particular feature of the bilateral MFA quotas is that the restrictions are administered by the
exporting countries - in other words, they are "voluntary export restraints" (VERs). This arrangement
generally allows the exporting country to charge higher prices, and thereby to capture part of the
difference between the normal export price and the domestic wholesale price in the importing country.
When estimating the impact of the phase-out of MFA quotas on the foreign exchange earnings of
developing economies, it is necessary to allow for the elimination of this economic rent. Export volume
(and employment and investment) increases, but the price per unit received by the exporter may decline.
If export prices do decline, the impact on the foreign exchange earnings from textiles and clothing by
MFA quota-restrained exporters depends on the elasticity of import demand for the products in
question. Provided that the demand is elastic, as is likely to be the case in most instances, foreign
exchange earnings from the products in question will increase. 11
All studies of the costs of protecting textiles and clothing report substantial gains to consumers in
the importing countries from the lifting of restraints. The available research also supports the view that
the revenues of developing economies as a group from exports of textiles and clothing are likely to rise
when the MFA is phased out, despite the loss of the "quota rents" that accrue to exporting countries
under the MFA. One estimate for the United States market suggests that the value of exports of
currently constrained suppliers to the United States would rise by 20½ per cent for textiles and 36½ per
cent for clothing, or an average of 35 per cent in both product groups. Another study estimates that
developing country exports to the major OECD countries could increase by 82 per cent for textiles and
93 per cent for clothing, while the removal of both tariffs and quotas could increase developing
economy exports of clothing by 135 per cent and those of textiles by 78 per cent. Yet another study of
the effects of removing MFA quotas and reducing tariffs on textiles and clothing products reports
increases in the value of imports of textiles and clothing combined of 244 per cent in the United States,
214 per cent in Canada, and 264 per cent in the European Community.12 The likely impact on the
pattern of world trade in textiles and clothing of the elimination of MFA quotas is considered in more
detail in Section 5 below.
(b) Other quantitative restrictions(b) Other quantitative restrictions
The Uruguay Round Agreement on Safeguards provides for the termination of measures taken
pursuant to Article XIX of the General Agreement not later than eight years after the date on which
they were first applied or five years after the date of entry into force of the Agreement establishing the
WTO, whichever comes later. It also sets out commitments on the phase-out of measures not in
conformity with the provisions of Article XIX (the Punta del Este rollback commitment). The
Agreement covers voluntary export restraints, orderly marketing arrangements or any other similar
measures on the export or the import side. These measures are to be brought into conformity with the
Agreement or phased out within four years after the entry into force of the agreement establishing the
WTO.13
Not surprisingly, transparency is a particularly serious problem in the case of so-called "grey
changes in the supply prices of the exporters. Critics of the method include Laird and Yeats (1988), Silberston (1984) and Anderson (1988).
Import demand is likely to be elastic not only because it is an "excess" demand elasticity, and therefore a multiple of the domestic demand elasticity, but also because it is an excess
demand elasticity facing a sub-set of exporters rather than all exporters. See Blackhurst (1973).
See, respectively, USITC (1989), Kirmani et al. (1984), UNCTAD (1986) and Trela and Whalley (1990). Other evidence is provided in Hamilton (1990).
Each WTO member is allowed to keep one specific measure in force until the end of 1999, subject to the agreement of the exporting country in question.
¡Error! No se encuentra el origen de la referencia.
area" measures. Some progress in identifying such measures is evident in recent years, however, as a
result of GATT's Trade Policy Review Mechanism. On the basis of TPRM reports that had been
completed by early 1993, a total of 75 bilateral or unilateral restraints were identified covering travel
goods (14), electrical equipment and appliances (11), footwear (8), television or television tubes (5),
machine tools (4) and other products (33).14 This list does not include non-MFA quantitative
restrictions on textiles and clothing. More generally, 75 clearly is an underestimate of the number of
grey area measures in force since an unknown number of measures have escaped notice.
3. REDUCTIONS IN IMPORT BARRIERS AND OTHER INTERVENTIONS AFFECTING
TRADE IN AGRICULTURAL PRODUCTS3. REDUCTIONS IN IMPORT BARRIERS
AND OTHER INTERVENTIONS AFFECTING TRADE IN AGRICULTURAL
PRODUCTS
Government interventions affecting trade in agricultural products are more varied and extensive
than those affecting trade in industrial products, particularly in the developed countries. This is
reflected in the Agreement on Agriculture in the Uruguay Round Final Act, which includes not only
new rules and commitments on border measures, but also rules and commitments on domestic subsidies
and subsidized exports. The more quantitative elements of the Agreement on Agriculture and the
negotiating procedures that lead to specific country schedules, including "tariffication", are summarized
in Box 1.
(a) Imports covered by tariff commitments(a) Imports covered by tariff commitments
A comparison of Tables II.7 with Table II.1 reveals that a much larger proportion of agricultural
imports than industrial imports already benefits from bound duty-free treatment.For the developed
countries and transition economies, the proportions are generally double, while bound duty-free entry
into developing economy markets applies to more than one-quarter of agricultural imports versus
essentially no industrial imports.
In the case of tariff lines that were not bound duty free going into the Round, virtually all of them
were reduced and bound by the developed countries and the transition economies. Developing
economies - primarily ones in Latin America and Africa - have agreed to bind at ceiling levels, but not
reduce, a number of their agricultural tariffs. Since essentially 100 per cent binding was required in the
case of agricultural tariffs, Table II.7 (in contrast to Table II.1 on industrial products), does not include
a "no offer" column.
(b) Tariff reductions(b) Tariff reductions
The new tariffs resulting from "tariffication" (see Box 1), together with the tariffs not affected by
tariffication, are to be reduced by an average of 36 per cent by developed countries and 24 per cent by
developing economies (other than the least developed); with minimum cuts on each tariff line of 15 and
10 per cent, respectively.15 The description of the results of that process for agriculture differs in two
important ways from the description in Section 1 of the tariff reductions on industrial products. First,
the use of simple averages in the case of reductions in agricultural tariffs (the negotiating targets were
specified in terms of simple averages). Second, because the tariffication process has produced a large
number of new specific duties for which official and detailed ad valorem tariff equivalents are not yet
available, there is no mention of actual pre- and post-Uruguay Round tariffs.
GATT (1993). See also Haaland and Tollefson (1994) and UNCTAD (1994).
Since these are minimum obligations, no figures are provided for individual countries in Appendix Tables (as was due done for commitments on industrial products).
¡Error! No se encuentra el origen de la referencia.
Table II.7Broad pattern of tariff commitments on agricultural productsII.7
Broad pattern of tariff commitments on agricultural products
(Percentages)
Currently dutiable and/or unbound2
Already bound
duty-free1
Country group or region
Bindings with reductions
Share of
lines
Bindings without
reductions
Share of
imports
Share of
lines
Share of
imports
Share of
lines
Share of
imports
By major country group:
Developed economies
All sources
Developing economies
21
42
42
79
58
57
0
0
1
9
27
76
66
15
7
16
34
43
84
65
57
0
1
0
North America
28
33
72
65
0
2
Latin America
2
4
72
84
26
12
Western Europe
13
44
87
56
0
0
Central/East Europe
13
29
87
70
0
1
Africa
13
2
55
66
31
32
Asia
20
39
76
58
4
3
Developing economies
All sources
Transition economies
All sources
Developing economies
By selected region:
1
2
Figures refer to tariff lines which were fully bound prior to the Uruguay Round.
Figures include tariff lines with unbound zero duties and partially bound zero duties.
Developed countries account for about two-thirds of world imports of agricultural products. The
across-the-board reductions in their agricultural tariffs by the developed countries are summarized in
Table II.8 for two (overlapping) product groups. Among the twelve agricultural product categories in
the first group, reductions to be undertaken by the developed economies as a group range from a low of
a 26 per cent simple average cut for "dairy products" to a high of 48 per cent cut for "cut flowers,
plants and vegetable materials" and the miscellaneous group "other agricultural products". The overall
average reduction of 37 per cent meets, collectively, the goal set by participants.
The reduction on dutiable tropical products (lower part of Table II.8) as a whole is 43 per cent,
ranging from a low of 37 per cent for "tropical nuts and fruits" to a high of 52 per cent for "spices,
flowers and plants". The principal cause of the difference between the 35 per cent and 46 per cent
figures, respectively for "coffee, tea, cocoa, maté" in the first group of products and "tropical
beverages" in the second group, is the inclusion in the former of chocolate and other food preparations
containing cocoa, for which offers have been much lower than for other products in those product
¡Error! No se encuentra el origen de la referencia.
categories.
Box 1: The quantitative elements in the Uruguay Round Agreement on Agriculture
"Tariffication"
At the beginning of the Uruguay Round, border measures in support of domestic agricultural producers were limited to unbound or bound
tariffs for approximately two-thirds of all agricultural tariff lines of the participating countries. For the remaining one-third of the tariff lines,
the intervention extended to non-tariff measures. It is this latter one-third of the tariff lines that was subject to "tariffication", in which for
each tariff line the package of protective measures (including the existing tariff) is replaced by a single new tariff that is estimated to provide
substantially the same level of protection as the existing package of measures.
The new tariff can be either an ad valorem tariff or a specific duty. In nearly all instances, the new tariffs are specific duties, for which
reliable ad valorem equivalents are not currently available - a fact which complicates both the presentation of the results and the task of
estimating the trade and income effects for the agricultural results. The tariffication package also includes current and minimum access
commitments (see below) and the right to use the special safeguard provisions of the Agreement. The special safeguard provisions allow
additional duties (to the bound rates) to be applied if conditions relating to import surges or declines in import prices are met.
Tariff reductions
The new tariffs resulting from the "tariffication" process, together with the other tariffs on agricultural products, are to be reduced by a simple
average of 36 per cent in six years in the case of developed countries and 24 per cent in ten years in the case of developing countries, with
minimum reductions of 15 per cent and 10 per cent, respectively. No reduction is required in the case of least developed countries.
As with industrial products, some developing countries (particularly in Latin America and Africa) will introduce ceiling bindings for one or
more tariff lines without reducing the tariff in question over the implementation period (see Table II.7).
Current and minimum access commitments
For products covered by the tariffication process, the negotiating modalities provided for the maintenance of current market access
opportunities and the establishment of minimum access tariff quotas (at reduced-tariff rates) where the current access is less than 5 per cent of
domestic consumption. These minimum access tariff quotas, which are generally at the 4-digit HS level, are to be expanded from 3 per cent
to 5 per cent of domestic consumption over the implementation period.
Reductions in export subsidies and subsidized exports
Developed countries are required to reduce the value of direct export subsidies to a level 36 per cent below the 1986-90 base period level
over the six-year implementation period, and the quantity of subsidised exports by 21 per cent over the same period. In the case of developing
economies, the reductions are two-thirds those of developed countries over a ten-year period (with no reductions required of least-developed
economies). In certain circumstances, where subsidised exports have increased since the 1986-90 base period, 1991-92 may be used as the
beginning point of reductions although the end-point remains that based on the 1986-90 base period level.
Reduction in domestic support
The Total Aggregate Measure of Support (Total AMS) reduction commitments, which cover all domestic support provided on either a
product-specific or non-product-specific basis that does not qualify for exemption, call for reductions of 20 per cent in six years (13.3 per cent
in ten years for developing economies, with no reduction required of least-developed economies).
So-called "green box" policies are excluded from the reduction commitments. These include general government services (such as research,
disease control, infrastructure and food security stockholding), certain forms of "decoupled" (from production) income support, structural
adjustment assistance, direct payments under environmental programmes and under regional assistance programmes. In addition to the green
box policies, other policies that need not be included in the Total AMS reduction commitments include direct payments under productionlimiting programmes, certain government assistance measures to encourage agricultural and rural development in developing countries and
other support which makes up only a low proportion (5 per cent in the case of developed countries and 10 per cent in the case of developing
countries) of the value of production of individual products or, in the case of non-product-specific support, the value of total agricultural
production.
¡Error! No se encuentra el origen de la referencia.
Table II.8Developed country imports and tariff reductions on agricultural productsII.8
Developed country imports and tariff reductions on agricultural products
(Millions of US dollars and percentages)
Value of imports
Product categories
All agricultural products
All sources
Percentage reduction in
tariffs
Developing
economies
84,240
38,030
37
Coffee,tea,cocoa,mate
9,136
8,116
35
Fruits and vegetables
14,575
8,887
36
Oilseeds, fats and oils
12,584
6,833
40
Other agricultural products
15,585
4,233
48
Animals and products
9,596
2,690
32
Beverages and spirits
6,608
2,012
38
Flowers, plants, vegetable materials
1,945
1,187
48
Tobacco
3,086
1,135
36
Spices and cereal preparations
2,767
1,134
35
Sugar
1,730
1,030
30
Grains
5,310
725
39
Dairy products
1,317
48
26
Tropical products
24,022
18,744
43
Tropical beverages
8,655
8,041
46
Tropical nuts and fruits
4,340
3,672
37
Certain oilseeds, oils
3,443
2,546
40
Roots, rice, tobacco
4,591
2,497
40
Spices, flowers and plants
2,992
1,987
52
(c) Market access commitments(c) Market access commitments
It was agreed that for products subject to tariffication, current access opportunities - in
quantitative and other terms - would be maintained on terms at least equivalent to those existing prior to
the tariffication process. In addition, in the case of those products for which little or no imports took
place because of the highly restrictive nature of the pre-existing regime, minimum market access
opportunity commitments were required, representing not less than 3 per cent of domestic consumption
in the base period 1986-88, rising to 5 per cent of that base figure by the end of the implementation
period in 2000 for developed countries or (2004 for developing countries). The results of negotiations
on the basis of these modalities are incorporated in the individual country schedules.
Figures on the increase in market access for exporters resulting from these new minimum access
opportunity commitments, between the base period of 1986-88 and the end of the implementation
period, are provided in Table II.9. In terms of tonnage, the most substantial increase is in coarse grains
(1,757,000 tons), followed by rice (1,076,000 tons). These minimum access opportunity commitments
will be allocated on a most-favoured-nation basis in accordance with the provisions of Article XIII of
the GATT (with in-quota imports being subject to duties as specified in the schedules of commitments).
Table II.9 9II.9
¡Error! No se encuentra el origen de la referencia.
Increases in market access under minimum access opportunity commitments:
selected products
(Thousands of metric tons)
Increase in access opportunities between period base and end of implementation period
Product
Total
Selected sub-categories
Coarse grains
1,757 Maize (1,065); barley (552)
Rice
1,076
Wheat
807
Dairy products
729 Milk and cream (305); milk powder (147); cheese (132); whey powder (83)
Meat
421 Bovine meat (186); pigmeat (133); poultry (94)
Vegetables
355 Potatoes (197); onions, garlic (39); cabbages (32)
Sugar
292
Eggs
252
Fruits
130 Citrus (64); apples, pears, peaches, plums, cherries (28); bananas (13)
Oilcakes and oilseeds
126
Vegetable oils
110
Cotton
61
Coffee
21
Chocolate
19
Notes: 1.Selected from schedules of commitments, which contain also commitments on additional products. Figures adjusted for
base period imports.
2. Countries having provided for increases in quota levels from base levels include Austria, Canada, Colombia, Costa
Rica, Czech Rep., El Salvador, European Communities, Finland, Guatemala, Hungary, Japan, Republic of Korea,
Mexico, Morocco, New Zealand, Nicaragua, Philippines, Poland, Romania, Slovak Rep., South Africa, SwitzerlandLiechtenstein, Thailand, United States and Venezuela.
3. As products are expressed at different stages of processing in the schedules, the totals given above are only indicative.
In addition to the new access shown in the table, other increased access opportunities
will, of course, be evident during and following the implementation of commitments. For example, some
of the current access commitments reinstate access levels which have declined since the 1986-88 base
period. In addition, the general tariff reductions will allow more trade to occur in both the case of
products subject to tariffication and the vastly more numerous products subject only to tariffs in the
past.
(d) Commitments on export competition(d) Commitments on export competition
Each WTO member is required to reduce both outlays for export subsidies and the quantities of
subsidized exports for specified products by 36 and 21 per cent, respectively (by developing countries,
two-thirds of these figures), between the base (1986-90) and the end of the implementation period. The
Agreement on Agriculture also specifies that for products not subject to export subsidy reduction
commitments, no such subsidies can be used in the future.
These reductions are of particular significance for heavily subsidized products on world food
markets such as wheat, beef, coarse grains, dairy products and sugar (Table II.10).16 Total outlays on
subsidized quantities will decline by the end of the implementation period by 36 per cent, from
$22.5 billion to $14.5 billion, of which one-half is accounted for by the European Union (Appendix
Table 10). The prohibition of export subsidies on all products not subject to reduction commitments
will also play an important role in improving competition on world markets.
The subsidy figures tend to understate the effect of export subsidies, as well as the benefits of their reduction, in instances where they are concentrated on certain more detailed product
categories. In such situations the reduction commitments are likely to have a much greater impact on export opportunities for other countries than the aggregate data suggest.
¡Error! No se encuentra el origen de la referencia.
As noted in Box 1, participants in the negotiations had the option of starting reductions from
1991-92 levels rather than 1986-90 levels, although the end-point is to be the same. The shaded
columns in the following table entitled "higher of base or 1991-92" and the reductions associated with
these columns indicate the impact of this provision. For example the reductions in quantity from this
higher base for wheat are 34 per cent rather than 19 per cent, and for rice and vegetable oils around
40 per cent instead of 17 per cent. Nevertheless, the actual reductions required to meet commitment
levels will depend on current export levels, that is, on 1994 levels.
¡Error! No se encuentra el origen de la referencia.
Table II.10Subsidized export reduction commitments by productII.10
Subsidized export reduction commitments by product
Product
Export subsidies
($US millions)
Subsidized quantities (thousand metric
tons)
Base
1986-90
1991-92
if above
base
Wheat
3483
5069
2235
-36
-56
49612
61452
40360
-19
-34
Beef
2802
2978
1796
-36
-40
1583
1753
1270
-20
-28
Coarse grains
2258
2579
1445
-36
-44
20581
21236
16260
-21
-23
Butter and butteroil
1996
2023
1278
-36
-37
618
644
490
-21
-24
Other milk products
1877
1895
1201
-36
-37
3326
3396
2744
-17
-19
Sugar
1731
nc
1175
-32
nc
6304
nc
5070
-20
nc
Cheese
819
997
524
-36
-47
543
602
430
-21
-29
Fruits and vegetables
800
804
519
-35
-35
9268
9435
7582
-18
-20
Skim milk powder
746
750
477
-36
-36
578
609
457
-21
-25
Live animals
623
nc
394
-36
nc
-
-
-
-
-
Pigmeat
505
544
323
-36
-41
612
617
484
-21
-21
Poultry meat
323
327
207
-36
-36
726
828
583
-20
-30
Rice
230
244
165
-28
-32
604
874
503
-17
-42
Vegetable oils
199
238
130
-35
-45
1585
2138
1370
-17
-39
Oilseeds
130
nc
83
-36
nc
2508
nc
1982
-21
nc
Eggs
125
131
80
-36
-39
166
191
131
-21
-31
Wine
107
nc
69
-36
nc
-
-
-
-
-
Tobacco
96
150
66
-32
-56
228
291
185
-19
-37
Cotton
85
nc
64
-24
nc
95
nc
82
-14
nc
Sheepmeat
32
nc
21
-34
nc
30
nc
25
-17
nc
7
nc
4
-34
nc
30
nc
25
-17
nc
Oilcakes
Final
Change
Change
Base
1991-92
from higher 1986-90
if
base
above
base
Final
Change
Change
from
higher
base
nc: no change: the "front-loading" provisions were not used for these products.
Note: Commitments converted to U.S. dollars using 1990-91 average exchange rates. Reduction commitments for export
subsidies and for subsidized quantities apply to individual product categories as defined in this table.
As products are expressed at different stages of processing in the Schedules, the totals given above can only be considered
indicative.
(e) Commitments on domestic support(e) Commitments on domestic support
All forms of domestic support to agricultural producers, with the exception of the policies
designated as exempt (Box 1), are subject to reduction commitments. For each participant with nonexempt support, the total Aggregate Measurement of Support (AMS) is to be reduced in equal
instalments and bound by the end of the transition period, at a level 20 per cent below the base period
(1986-88) level for developed countries, 13 per cent for developing economies, with no reduction
required for least developed countries. As a result of these reduction commitments, the total level of
support to agricultural producers subject to commitments in the base period will decline by 18 per cent
by the end of the transition period, from $197 billion to $162 billion (see Appendix Table 11).17
Most of the commitments are expressed in domestic currencies (the dollar figures in the text reflect current exchange rates).
¡Error! No se encuentra el origen de la referencia.
4. SECURING MARKET ACCESS THROUGH BINDINGS4.
ACCESS THROUGH BINDINGS
SECURING MARKET
If a tariff lowered during a GATT round could be unilaterally raised again a few months later,
that tariff concession would have little or no value to foreign and domestic producers. An exporting
firm would be reluctant to pursue new markets if the treatment afforded its products in foreign markets
is uncertain. This is especially true if taking advantage of the lower tariff requires investment in plant,
equipment and distribution networks - investments that would become unprofitable if the tariff were
raised back to its old level (or even higher). For domestic producers, the fact that their own government
might subsequently raise a tariff also creates uncertainty, not only for firms that rely on imported inputs,
but also more generally for export-oriented firms that compete with import-competing firms for scarce
labour and capital.
This is where "tariff bindings" come in. When a country agrees to bind a tariff on a product at a
certain level - say 15 per cent - it commits itself not to increase the tariff above that level (except by
negotiation with affected trading partners). Binding is considered to be so important that countries
which agree to bind previously unbound tariffs are given "negotiating credit" for the decision even if the
tariff is bound at a level above the currently applied level (this is the case for many Latin American and
African participants in the Uruguay Round). Bindings have also played a key role in establishing the
domestic and international credibility of domestic reform programs in many countries. Although an
integral part of the tariff negotiations, bindings clearly are more akin to rules - in terms of their
contribution to the predictability of future market access - than to direct increases in market access.
For industrial products, these bindings generally take the form of maximum or ceiling rates for
the tariffs applied to the products listed in the schedule. However, tariff levels are not the only
commitments that can be bound. For agricultural products, commitments include not only bindings on
duties applied to imported products, but also the previously described commitments on current and
minimum market access opportunities, on the value of export subsidies and on volumes exported with
the aid of subsidies, and on domestic support to agricultural producers.
In the case of industrial products, the percentage of tariff lines bound (fourth and fifth columns of
Table II.11) has risen from 78 to 99 per cent for developed countries, from 21 to 73 per cent for
developing economies and from 73 to 98 per cent for transition economies.18 The new level of bindings
is lower in developing economies than in developed or transition economies, but the increase in the
coverage of bindings was much greater for this group, where the initial level of bindings was low.
Virtually all imports of industrial products into the developed economies ($737 billion) and of the
transition economies ($35 billion) will enter under bound tariffs after the Uruguay Round, as well as
more than three-fifths of the $352 billion in imports into developing economies. In Latin America, the
percentage of tariff lines bound nearly triples, from 38 to 100 per cent. Offers of individual Asian
developing countries are less homogeneous than for Latin America, with the result that the scope of
bindings is 68 per cent of tariff lines and 70 per cent of imports. Clearly, one of the major results of the
Uruguay Round is therefore an improvement in the security of market access for industrial products
through increased bindings.
Among individual developing economies (Appendix Table 12), Chile was the only developing
economy offering to bind 100 per cent of its tariff lines in the context of the Tokyo Round, while Costa
Rica, El Salvador, Mexico and Venezuela bound 100 per cent of tariff lines (and of imports) upon
accession to GATT during the period 1986-91. Argentina, Brazil, Colombia, Jamaica, Peru and
Uruguay have committed to bind 100 per cent of tariff lines. Indonesia has bound more than 90 per cent
Figures are affected by the fact that comparable data are available only for 27 of 93 developing economy participants. This could have a substantial effect on figures for the percentage of
tariff lines bound by developing economies and by developing regions since the 27 participants for which data are available account for less than one-third of the total tariff lines of developing
economies. This has, however, much less of an effect on figures for the coverage of bindings based on import values rather than tariff lines, since the 27 participants account for roughly 80 per
cent of the total merchandise imports of developing economy participants in the Uruguay Round.
¡Error! No se encuentra el origen de la referencia.
of tariff lines; India, the Republic of Korea, Malaysia, Philippines, Singapore and Thailand have bound
between 60 and 89 per cent; and Hong Kong, Macau and Sri Lanka have bound between 10 and 25 per
cent of tariff lines.
Prior to the Uruguay Round, only one-third of agricultural product tariff lines were subject to
bindings. Although the increase in the coverage of bindings is particularly great in developing
economies (from 17 to virtually 100 per cent of tariff lines), the coverage of bindings has almost
doubled in the developed and transition economies.
Table II.11Tariff bindings on industrial and agricultural productsII.11
Tariff bindings on industrial and agricultural products
(Percentages)
Industrial products
Country group
Agricultural products
Percentage of
tariff lines
bound
Percentage of
imports under
bound rates
Percentage of
tariff lines
bound
Percentage of
imports under
bound rates
Pre-
Post-
Pre-
Post-
Pre-
Post-
Pre-
43
83
68
87
35
100
63
100
Developed countries
78
99
94
99
58
100
81
100
Developing economies
21
73
13
61
17
100
22
100
Transition economies
73
98
74
96
57
100
59
100
North America
99
100
99
100
92
100
94
100
Latin America
38
100
57
100
36
100
74
100
Western Europe
79
82
98
98
45
100
87
100
Central Europe
63
98
68
97
49
100
54
100
Africa
13
69
26
90
12
100
8
100
Asia
16
68
32
70
15
100
36
100
Total
Post-
By major country group:
By region:
At the end of the Uruguay Round implementation period, the overall level of protection of
agricultural products in most developed countries will remain well above the level of protection of
industrial products. But agricultural trade will have been put squarely on a future liberalization track.
And for the first time in GATT's history, the level of security for trade in agricultural products will be
greater than for trade in industrial products, since (i) virtually 100 per cent of agricultural product tariff
lines will be bound, compared to 83 per cent of industrial product tariff lines, and (ii) there will be
virtually no non-tariff barriers.19
Under the provisions of Annex 5 to the Agreement on Agriculture, Japan, Korea and the Philippines have not yet bound their tariffs on rice, and Israel has not bound its tariffs on
sheepmeat, whole milk powder and certain cheeses. Non-tariff measures can remain on these products as well.
¡Error! No se encuentra el origen de la referencia.
5. TRADE AND INCOME EFFECTS OF LIBERALIZING TRADE IN GOODS5. TRADE
AND INCOME EFFECTS OF LIBERALIZING TRADE IN GOODS
The tariff reductions and other liberalizing actions outlined above, together with the security
provided by the binding of those actions, will stimulate world trade, investment and production.
Resources will be used more efficiently world-wide. As a result, by 2005, when all the results of the
Uruguay Round will be in place, not only world trade but also world income will be larger than they
would have been had the liberalization not taken place. 20 This section summarizes the GATT
Secretariat's efforts to estimate the size of each of those gains, both overall and for a sub-set of
countries and groups of countries.
The estimates are derived from a computable general equilibrium (CGE) model which explicitly
links industries together in value-added chains from primary goods, through higher stages of processing,
to the final assembly of consumption goods for households and governments. The link between sectors
may be direct, such as the input of steel into the production of transport equipment, or indirect, as with
the link between steel and agriculture through the production of steel-intensive agricultural equipment
such as tractors and ploughs. Sectors are also linked through various economy-wide constraints. For
instance, because firms in different sectors compete for a limited supply of labour, capital and land, an
expansion of one sector will be accompanied by a contraction of another sector, except when the
expansion is the result of resource accumulation or technological improvements that economize on the
use of scarce resources.21
In addition to the linkages within each economy, the model also allows for linkages between
economies. While a change in one part of the world economy will, in principle, have repercussions
throughout the world economy, the effect normally will be greatest in the sector and country where the
policy change is initiated. It will then spread through linkages to adjacent sectors at home and into the
markets of trading partners.
A different kind of linkage is taken into account by introducing one important "dynamic" effect
into the model. The initial increase in income from trade liberalization is assumed to increase savings (a
fixed share of the additional income is saved) and investment, with the increased investment (larger
capital stock) in turn causing a further increase in income.
Three versions of the model are used, which means that there are three estimates of each of the
principal effects of the liberalization of trade in goods. The goal is to indicate the separate contribution
of different assumptions about certain key features of the world economy, and to permit readers to
select those estimates which they believe are most plausible in light of the underlying assumptions.
Models such as the one used in this exercise could, in principle, solve for the net result of all
direct and indirect effects that follow a major trade liberalization of the magnitude of the Uruguay
Round agreement. In practice, however, the amount of detail that can be built into the model is limited,
and only relatively broad-based effects can be estimated with any degree of confidence. More
importantly, it must be emphasized that estimated increases in trade and income are not forecasts.
Not only do they ignore important parts of the Uruguay Round package (more on this below), but by
2005 the structure of the world economy is likely to have changed considerably from the structure of the
1990 "benchmark" economy on which the estimates for 2005 are based. They are intended, rather, to
indicate the rough order of magnitude of the trade and income gains that can be expected from the
reduction or elimination of measures affecting trade in goods negotiated in the Uruguay Round.
Discussions of the effects of a major trade liberalization do not always distinguish sharply between the trade effects and the income effects. It is important to be clear that a $1 billion
increase in exports is not equivalent to a $1 billion increase in income. To produce additional exports, resources must be used which could otherwise have been used to produce goods and
services for domestic residents. If those resources would have produced $900 million in such domestic goods and services, the true net income gain is the $100 million difference between the
value of those "foregone" domestic goods and services and the $1 billion in goods and services that can be purchased in the world market with the additional foreign exchange earnings.
The estimates are based on the assumption that unemployment rates remain constant.
¡Error! No se encuentra el origen de la referencia.
(a) Estimated trade effects(a) Estimated trade effects
The estimated trade effects are given in Table II.12, for total merchandise trade and for 13
product categories (see Box 2 regarding the data used in the model). Depending on which version of the
model is used, the simulations indicate a level of world merchandise trade in the range of 9 to 24 per
cent above the level that would have occurred in the absence of the Uruguay Round. This is broadly
consistent with the results obtained by other researchers (see Annex III). Since the estimated percentage
increases in exports do not, by themselves, give a full picture (because the sizes of the respective trade
flows vary enormously), Table II.12 also includes the actual value of exports in each product category
in 1992. Keeping in mind that the percentage increases will apply to the level of exports in 2005 (in the
absence of the Uruguay Round liberalization), it should be noted that between 1980 and 1992, world
trade grew at an average annual rate of roughly 4 per cent.
The wide range of the estimates illustrates the sensitivity of the results to the underlying
assumptions in each of the three versions. The smallest estimates come from the first version of the
model. Under the perfectly competitive, constant returns to scale specification, total merchandise trade
is projected to increase by roughly 9 per cent over the benchmark (status quo), level. If "external" scale
economies, are introduced in the industrial sectors, trade is projected to increase by roughly 10 per
cent.22 Finally, when the perfect competition assumption is replaced by monopolistic competition in the
industrial sectors, and the scale economies are specified as "internal" rather than "external" to each
firm, merchandise trade is estimated to increase by nearly a quarter.
The scale economy sectors in the second and third versions of the model are mining, textiles, clothing, chemicals, steel, non-ferrous metals, fabricated metal products, transport equipment
and other manufactures. The other sectors (including grains, other agriculture, forestry and fishery) are assumed to operate with constant returns to scale technologies.
¡Error! No se encuentra el origen de la referencia.
Table II.12Estimated increase in merchandise exports due to the implementation of the
liberalization of trade in goods: main product groupsII.12
Estimated increase in merchandise exports due to the implementation of the liberalization of trade
in goods: main product groups
(Percentage change in volume)
Version of the model
Version 1 Version 2
Vers
ion 3
All merchandise1
Actual value of
exports in 1992
(billions of
dollars)
8.6
9.6
23.5
2,843
4.1
4.4
4.6
24.2
Other agricultural products
21.1
21.0
22.1
73.8
Fishery products2
13.0
12.9
13.5
26.5
Forestry products
3.7
4.1
5.6
7.7
Mining
1.6
1.8
3.1
328.4
Primary steel
8.3
8.4
25.5
76.7
Primary non-ferrous metals
3.6
3.9
14.2
52.4
Fabricated metal products
5.3
5.4
16.0
57.2
Chemicals and rubber
5.2
5.4
21.4
251.3
Transport equipment
11.7
13.6
30.1
320.2
Textiles
17.5
18.6
72.5
93.9
Clothing
69.4
87.1
191.6
105.6
4.7
4.7
12.7
1,425.1
Grains
2
Other manufactures
1
Excluding intra-European Union trade, and including trade in petroleum.
The marginally smaller gains under the second version of the model, relative to the first version, are the result of resources shifting into
production of those product groups whose production was stimulated by the introduction of increasing returns to scale.
2
Version 1: assumes constant returns to scale (no economies of scale), and perfect competition.
Version 2: assumes increasing returns to scale in industrial sectors, and perfect competition.
Version 3: assumes increasing returns to scale and monopolistic competition in industrial sectors.
Box 2 - The economic and policy data used in the model
Three basic steps are involved in making the trade estimates. First, data on actual trade, production and consumption in 1990 are used to
establish a dataset for the reference period. Second, this dataset is used to "benchmark" the model, so that it reflects the pre-Uruguay Round
reference period. Third, the model is then re-estimated, taking into account the Uruguay Round liberalization of trade in goods. The trade
effects are given by the difference between the pre-Uruguay Round and the estimated post-Uruguay Round datasets. To provide income
estimates for 2005, an additional step is required, which involves applying estimated percentage changes in income to OECD and World
Bank projections of regional incomes for 2005 (projections which do not allow for a successful Uruguay Round).
Social accounting data: The benchmark 1990 dataset is a social accounting matrix (SAM) of the world economy. It provides a
reconciliation of national income statistics, including input-output data and data on trade, production, and consumption. These data are taken
from the Global Trade Analysis Project (GTAP) 1990 dataset (Hertel and Tsigas (1993)), augmented with data for EFTA, which is not
included as a separate region in the GTAP data. The dataset does not have sufficient developing country detail to allow for a full geographic
breakdown of countries by the Secretariat's usual seven regions. The selection of the product sectors (13) and countries or country groups (8)
which appear in the tables in this section was determined by a number of factors, including the availability of social accounting data, related
national income account data, and the need to limit the size of the model for computational reasons (the results for two services-related sectors
¡Error! No se encuentra el origen de la referencia.
are not included in the tables because there was no attempt to allow for increases in market access for services).
Elasticities: As with other key parameters of the model, values for the elasticities - such as the trade substitution elasticities, capital-labour
substitution elasticities, and scale elasticities - are drawn from available empirical estimates.
Policy data: The tariff cuts for industrial products are derived directly from the submitted schedules. Using the applied MFN tariff rates as
reported in the Integrated Data Base (IDB), the base rate for each sector and region was calculated by averaging over the tariff lines in the
sector, and over the countries in the region, using import shares as weights. The base years for tariff and import data are centred around 1988.
The new rate is calculated by the same type of averaging using the offered rates for each tariff line, except where a country has offered to bind
the tariff above the applied base rate, in which case it is assumed that no actual cut has been made.
For industrial non-tariff barriers (NTBs), data on textiles and clothing protection are based on the MFA quota price-wedges reported by Yang
(1992, 1994a), Whalley (1992), and the USITC (1991, 1993). Data on the protective effect of VERs on Japanese cars in the EU market are
drawn from Flam and Nordström (1994). Other industrial NTBs were not included in the model (the principal reason was the absence of
credible estimates of tariff equivalents for other NTBs).
Data on agricultural protection are drawn from OECD (1990) and USDA (1990) estimates of Producer Subsidy Equivalents (PSEs). These
data were used for measures of both domestic support and border protection because, for analytical purposes, the data must include total
estimated support by sector, and the AMS is not all-inclusive (green-box measures are excluded, for example), nor is it sector specific.
Moreover, the submitted tariff schedules have not been processed for use in this exercise. This is because in the tariffication process a
significant number of NTBs were converted to specific rather than ad valorem tariffs. Export subsidy data are drawn directly from the
submitted schedules. Against the estimated base levels of protection and support, we apply formula cuts drawn directly from commitments
reported elsewhere in this study: (i) 36 (24)% cuts in border measures (including the converted NTBs), (ii) 36 (24)% cuts in budget outlays
on export subsidies, and (iii) 20 (13.3)% cuts in domestic support (the figures within parenthesis refer to reductions by developing countries).
Analytically, the model treats NTBs and subsidies in ad valorem terms. As such, we have modelled the price or value, rather than the
quantity, aspect of agricultural commitments. The trade and income estimates do not take into account the minimum access commitments on
products subject to tariffication.
A detailed description of the model and the data is available in Francois, McDonald and Nordström (1994), copies of which are available on
request from the GATT Secretariat.
Modern trade theory offers insights which are helpful in assessing the differences in the results of
each version of the model and thus the "plausibility" of each version. Comparative advantage associated foremost with the work of Ricardo, and Heckscher and Ohlin - explains trade, and the gains
from trade, on the basis of relative differences between nations in endowments of technology or factor
endowments. By specializing in products that suit local conditions, and trading these for other goods
that are produced more efficiently elsewhere, each country will have a higher income than in the
absence of trade. This is a basic motivation behind trade and an important explanation for the broad
pattern of trade in the world economy. Yet, comparative advantage theory, with its emphasis on
differences in factor endowments and technology, has a shortcoming (if not combined with other
theories) in that it cannot account for the fact that an important share of world trade is intra-industry
trade as opposed to inter-industry trade.
Two-way trade in the "same" product involves both final consumption goods and intermediate
and investment goods, and it is particularly prevalent between a small group of similar high income
countries. However, even trade between countries at different levels of development may include intraindustry trade, such as the exchange of brand-name jeans for generic jeans. One explanation of twoway trade is that products within the same product-category, but originating in different nations, are
imperfect substitutes. German automobiles, hence, are treated as different from French automobiles.
As a result, Germany and France trade automobiles with each other. The first and second versions of
the model incorporate the assumption that domestic and foreign versions of a good are different
(imperfect substitutes) in the eyes of buyers. This has the effect of dampening the response of buyers to
changes in the relative prices of competing goods from different countries, compared to models which
assume that goods produced in different countries are perfect substitutes for one another.
Another basis for trade is scale economies. If countries specialize in different products and trade
with each other, they can exploit economies of scale in production. This is one reason why, for
example, countries with small economies generally trade more intensively than countries with large
domestic economies - they sell abroad to escape the inefficiencies associated with small markets. The
¡Error! No se encuentra el origen de la referencia.
simplest form of scale economies are those external to a firm, in which production costs fall with the
activity level of the entire industry rather than the individual firm. Such "external" scale economies
may, for instance, be due to the dissemination of production experience (knowledge) among the firms in
an industry, or to a larger industry being able to support production of a wider variety of intermediate,
specialized inputs that boost productivity (the Silicon Valley conglomeration of the computer industry
may be one example of external scale economies). Because firms are small, in that they perceive
themselves as having no influence over industry-wide scale economies, external scale economies are
consistent with the assumption of perfect competition.
It is this additional, industry-wide national scale economy motive for trade that differentiates the
second version of the model from the first version, which assumes constant returns to scale. The
surprisingly small difference between the trade gains yielded by the first two versions of the model
(9 versus 10 per cent increase) is largely due to the common assumption in both that buyers view
products from different origins as imperfect substitutes, which provides an incentive for geographically
diverse production, despite the incentives for concentration that follow from scale economies.
The third version of the model incorporates imperfect competition and firm-specific scale
economies related to individual firm output levels rather than to the aggregate output of the industry.
Sectors in which scale economies are deemed important (based on empirical evidence) are treated as
sectors with monopolistic competition between firms producing differentiated products. Firms have
market power because they can influence the market for their particular varieties of a good. The
assumption of firm-specific product differentiation replaces the previous assumption of product
differentiation based on the country of origin of products. An important property of the monopolistic
competition model is that variety per se is valued by consumers and producers, where the latter become
more productive the broader the range of specialized inputs they can draw from. These gains are
realized by two-way trade in intermediate and final products.
Under firm-based product differentiation, preferences are much less sensitive to the geographic
location of production, and therefore demand is more sensitive to changes in relative prices between
different producers of the "same" product. Analyses based on firm-level product differentiation
generally yield much larger trade effects than under the national product differentiation assumption. In
the present exercise, the model estimates an expansion of global trade of nearly 25 per cent, or two and
a half times larger than the estimates based on the other two versions of the model.
The range between the smallest and the largest estimated increase in exports of the thirteen
individual product groups in Table II.12 is even larger. World trade in grains may expand by 4 or 5 per
cent, for example, while world trade in clothing may increase by between 70 and 190 per cent. There
are three main factors behind these differences. First, it depends on the assumptions in the model. For
instance, in all three versions of the model agriculture is treated as a sector with constant returns to
scale and imperfect substitutability between products from different countries. The differences in trade
response between the three versions of the model is therefore minimal because the assumption that
buyers care about the origin of the product holds back the trade expansion. Had agricultural products
produced in different countries been assumed to be perfect substitutes (as in the model used by the
World Bank/OECD to make their 1993 estimates), the trade response would have been much higher.
Second, it depends on the initial trade barriers and the degree of liberalization. Sectors with high initial
trade barriers and a substantial liberalization package, such as textiles and clothing, will tend to
experience the largest expansion of trade. Third, it depends on the price elasticity of demand, which
varies between product categories and which empirical analyses generally find to be lower for
agricultural and other primary products than for manufactures. The higher the price elasticity, the
greater the demand response from a given liberalization-induced price change.
The results for countries and groups of countries are reported in Table II.13, with China and
Chinese Taipei shown separately because the Uruguay Round schedules of the former are not definitive
and the latter did not participate in the Uruguay Round. As would be expected, the size of the
¡Error! No se encuentra el origen de la referencia.
respective figures in the table reflect in part a realignment of regional production and trade patterns in
accordance with comparative advantage. Developing and transition countries are estimated to expand
production and exports of labour-intensive manufactures, while developed countries are estimated to
expand production of capital and technology-intensive industrial products. Moreover, countries that are
well-endowed with arable land - the United States, Canada, Australia, New Zealand and many
developing countries - are expected to increase their exports of agricultural products.
Table II.13Estimated increase in merchandise exports due to the implementation of the
liberalization of trade in goods: main economies and country groups1II.13
Estimated increase in merchandise exports due to the implementation of the liberalization of trade
in goods: main economies and country groups1
(Percentages change in volume)
Version of the model
Version 1
Version 2
Ve
rsion 3
World
8.6
9.6
23.5
2,843
Canada
5.3
6.1
16.6
134.1
United States
7.5
8.2
21.7
448.2
EFTA
3.2
3.3
6.3
226.9
European Union
7.3
7.8
19.4
568.7
Australia and New Zealand
8.4
9.0
24.0
52.3
Japan
7.5
8.0
18.3
339.9
13.7
15.3
36.7
906.4
China
6.1
8.4
26.5
85.0
Chinese Taipei
4.5
5.7
14.4
81.5
Developing and transition
1
Actual value
of exports in
1992 (billions
of dollars)
Excluding intra-European Union trade, and including trade in petroleum.
Version 1: assumes constant returns to scale (no economies of scale), and perfect competition.
Version 2: assumes increasing returns to scale in industrial sectors, and perfect competition.
Version 3: assumes increasing returns to scale and monopolistic competition in industrial sectors.
The model assumes the Uruguay Round agreement does not alter net capital flows between
countries, which is equivalent to assuming there is no change in the pattern of current account balances
among countries. Thus the estimated percentage increases in exports in Table II.13 are good indicators
of the estimated percentage increases in imports into each country or country group. This assumption
accords well with experience, which indicates, for example, that dynamic exporters are very likely to be
dynamic importers.
Again figures for the value of actual exports in 1992 have been added to the table in order to give
a rough idea of the size of the trade flow to which each percentage increase applies to. Since the real
(constant dollar) value of the trade flows indicated in Table II.13 are very likely to be larger in 2005 for
reasons unrelated to the Uruguay Round, the added gain due to the Uruguay Round liberalization of
trade in goods is very likely to be larger - probably considerably larger - than would be indicated by
applying the estimated percentage increases to the 1992 export figures.
The small trade impact on the EFTA countries is related to their trade dependence on the
European Union. Outside of agriculture and fisheries, the EFTA countries enjoy free trade with the
¡Error! No se encuentra el origen de la referencia.
European Union, and about 60 per cent of their exports of other products enter the EU market. The
MFN tariff cuts by the European Union imply a reduction in the margin of tariff preference for the
EFTA countries, which means that the EFTA countries will export less to the EU market than they
would have in the absence of reduced preference margins (this effect does not occur for the individual
EU member countries because, for the purpose of this exercise, intra-EU trade is excluded from world
trade). In contrast, they will trade more with other parts of the world where they enjoy enhanced market
access for their products. The net changes in their overall merchandise trade are relatively small (as
will be seen below, this does not mean that their income gains from the Round are small).
The most striking comparison among the figures in the Table is the size of the estimated increase
in merchandise exports from the developing and transition economy group, relative to the increases for
the other countries. It is two to three times larger than most other figures based on the first version of
the model, and nearly that much larger in the case of the third version. In terms of the product groups
shown in Table II.12, the larger estimate for the overall increase in exports from the developing and
transition economy group is the result of strong gains in clothing, other (presumably light)
manufactures, other agricultural products, and textiles. This is not surprising, considering that these
product groups were subject to considerable policy reform in the Uruguay Round and their production
tends to be intensive in the use of labour or arable land, two factors of production that are in relatively
abundant supply in that group of countries. The increased foreign exchange earnings of the developing
and transition economy group will pay for an increase in imports from the rest of the world roughly two
to three times larger (in percentage terms) than the increases in imports into the other countries and
country groups in the Table. 23
(b) Estimated income effects(b) Estimated income effects
Various terms are used in referring to the gains that follow from trade liberalization. This study
refers to them as income gains because world income will be greater than it would have been without
the liberalization. Alternatively, those same gains may be referred to as production gains - world
output will be greater than it would have been - or as increases in world welfare.
As with the trade effects, the model yielded estimates of the percentage increases in income
relative to the 1990 benchmark level of income. To convert them into dollar gains in 2005 required the
additional step of estimating the dollar value of world income, and of income in the countries and
country groups shown in the tables, in 2005 (a step which did not seem advisable in the case of trade
because trade projections - especially for the individual product groups - are subject to a greater margin
of error than national income projections). This was done by applying OECD and World Bank
economic growth projections for 2005 (which ignored the Uruguay Round results) to the 1990
benchmark data. Together with the model's estimates of the percentage increase in world income from
the liberalization of trade in goods, this yielded the estimates of income gains expressed in 1990 dollars
shown in Table II.14.
Table II.14Estimated increase in annual income in 2005 due to Uruguay Round liberalization of
trade in goods: main economies and country groupsII.14
Estimated increase in annual income in 2005 due to Uruguay Round liberalization of trade in
goods: main economies and country groups
(Billions of 1990 US dollars)
Versions of the model with
static specifications
Version 1
Versions of the model with
the dynamic specification
Version 2
V
Version 3
World
109
146
315
The percentage increases in exports and imports will only be identical if the initial current account balance is zero.
Version 1
184
Version 2
218
ersion 3
510
¡Error! No se encuentra el origen de la referencia.
Canada
2.3
3.0
8.0
3.8
5.0
12.4
United States
30.4
35.9
75.6
49.2
59.5
122.4
EFTA
10.1
13.4
23.1
17.5
18.0
33.5
European Union
47.7
58.6
103.3
78.5
87.2
163.5
1.5
1.9
3.1
2.4
3.6
5.8
Japan
11.9
15.2
17.0
21.2
19.3
26.7
Developing and transition
-1.9
4.1
70.2
-0.7
2.7
116.1
China
4.1
8.9
10.1
6.9
14.3
18.7
Chinese Taipei
2.6
4.7
4.5
5.1
8.4
10.2
Australia and New Zealand
Version 1: assumes constant returns to scale (no economies of scale), and perfect competition.
Version 2: assumes increasing returns to scale in selected sectors, and perfect competition.
Version 3: assumes increasing returns to scale and monopolistic competition in selected sectors.
The estimated income effects, like the estimated trade effects, are sensitive to the assumptions
used in the model. With static specifications - that is, ignoring the impact of the income increases on
the level of savings and investment - the model estimates an annual income gain for the world in the
range from $110 to $315 billion in 2005 (1990 dollars). Adding the dynamic assumption that a share
of the income gain is saved and invested in new capital shifts the range upwards some 60 per cent to
between $185 and $510 billion annually. The estimates for the perfect competition versions of the
model are roughly similar to previous estimates by the World Bank and the OECD using models with
similar properties. The big difference relative to previous studies is the introduction of monopolistic
competition and internal scale economies in the industrial sectors. Trade liberalization in this case leads
not just to more trade based on comparative advantage, but also to a deeper exploitation of scale
economies based on the enhanced variety of specialized intermediate inputs that boost productivity, as
well as on a greater variety of consumer goods.
There are a number of factors behind the differences in income gains (for a given specification of
the model) between the different countries and country groups in Table II.14. Obviously, one is that
some are much larger traders than others. Japan's merchandise exports in 1990, for example, were
nearly six times those of Australia and New Zealand combined. Other factors have to do with the
details of the liberalization of trade in goods in the Uruguay Round, and how that liberalization
interacted with the domestic economy in each participating country. Here it is helpful to recall that for
each participant in the Uruguay Round, the initial increase in national income resulting from the
liberalization of trade in goods (that is, before any allowance for increased saving and investment)
will come from two sources; first, from a more efficient use of domestic resources when domestic
distortions, such as trade barriers, are reduced or removed; and second, from increased access to
the markets of trading partners. Each of the indicated income gains for the countries or country
groups in Table II.14 are therefore a composite of gains from the increased openness of its own
domestic market and gains from increased access to foreign markets.
As an aid in interpreting the income gains, Table II.15 "decomposes" the income gains into the
three principal components of the liberalization of trade in goods - reductions in industrial tariffs, the
removal of QRs (mainly MFA QRs in this exercise), and the liberalization of agricultural trade. To
keep the table a manageable size, the analysis focuses on the smallest and largest annual income gains
shown in the right-hand half of Table II.14 ($184 billion and $510 billion, respectively).
According to the simulations, the most important source of income gains from the liberalization
of trade in goods - for the world, as well as for Canada, the United States and the European Union (and
¡Error! No se encuentra el origen de la referencia.
for EFTA and the developing and transition economies in the right-hand side of the table) - is the
elimination of quotas on industrial products, particularly MFA quotas (if it had been possible to include
more non-MFA bilateral quotas in the model, this source of gain would have been even larger). The
second most important source of income gains depends on the version of the model used. According to
the first version it is the agreement on agriculture, while according to the third version it is the reduction
in industrial tariffs. The difference between the two is explained by the fact that tariff cuts on industrial
goods become more important if there are scale and specialization economies at stake (all versions of
the model assume constant returns to scale in agriculture). Additionally, the tariffication process in
agriculture appears to have yielded some tariffs that remain high despite the Uruguay Round cuts (here
it should be recalled that the model did not take into account the minimum access commitments on
goods subject to tariffication).24
24
Another explanation is that the gains are there, but the model fails to capture them. The reason is technical, and relates to the "calibration" of
the model to fit the benchmark dataset. Initial prices and quantities are used to deduce what the underlying parameters in the model must be to
generate the observed market outcome. If a particular type of agricultural good is not imported (i.e. protection is prohibitive), there is no way to
determine demand for the product. Starting from a "corner solution" with effectively prohibitive trade barriers, the national product differentiation
specification may hence understates the gains from the agricultural reforms.
¡Error! No se encuentra el origen de la referencia.
Table II.15Decomposition of estimated increases in annual income in 2005 due to Uruguay Round
liberalization of trade in goods: main economies and country groupsII.15
Decomposition of estimated increases in annual income in 2005 due to Uruguay Round
liberalization of trade in goods: main economies and country groups
(Billions of 1990 US dollars)
Ind.
tariffs
Canada
Versions of the model with
static specifications
Versions of the model with
the dynamic specification
Version 1
Version 3
Ind.
NTBs
Agriculture
Total
Ind.
tariffs
Ind.
NTBs
Agriculture
Total
-0.5
2.7
1.6
3.8
0.7
10.2
1.5
12.4
United States
7.0
38.4
3.8
49.2
13.7
102.3
6.3
122.4
EFTA
5.5
4.2
7.7
17.5
9.8
17.7
6.0
33.5
16.8
42.9
18.7
78.5
33.8
115.1
14.6
163.5
0.4
0.3
1.7
2.4
3.1
0.6
2.1
5.8
10.1
-0.4
11.5
21.2
18.1
2.1
6.5
26.7
Developing and transition
0.3
-12.2
11.2
-0.7
33.4
68.4
14.3
116.1
China
9.5
-3.5
0.8
6.9
11.6
5.4
1.7
18.7
Chinese Taipei
5.9
-1.3
0.5
5.1
7.7
2.1
0.4
10.2
55
(30.0)
71
(38.7)
58
(31.3)
184
132
(25.9)
324
(63.6)
53
(10.5)
510
European Union
Australia and New Zealand
Japan
Total
(Per cent of total gain)
Version 1: assumes constant returns to scale (no economies of scale), and perfect competition.
Version 3: assumes increasing returns to scale and monopolistic competition in selected sectors.
The first version of the model predicts a loss for the developing and transition economies, China
and Chinese Taipei from the elimination of industrial NTBs. In each instance, the explanation centres
on the model's treatment of MFA "quota rents".25 MFA quotas result in quota rents or scarcity
premiums, which are largely captured by the exporting countries in the form of higher export prices.
Given that the quota rents will disappear as the quotas are phased-out, the question is whether increased
exports will compensate for lower prices as far as income is concerned (recall that the issue here is the
impact on the exporters' income, not the impact on the level of their exports of textiles and clothing).
According to the first version of the model, with its assumption of imperfect substitution between goods
from different countries, and therefore low demand responsiveness to lower import prices, the answer is
no. However, under the version that de-emphasizes the importance of the geographic origin of a product
as a basis for consumption decisions, the answer is yes. As is evident in Table II.1 at the beginning of
this section, the third version of the model predicts an export increase for textiles and clothing that is
about three times higher than that of the first version. This is more than enough to compensate for the
loss of quota rents and turn a potential loss into a sizeable income gain on trade in textiles and clothing.
Moreover, it is important to note that the very slight overall income loss for developing and transition
economies from the liberalization of trade in goods shown significant in Table II.14 holds only for the
first version of the model, and hinges on the assumption of perfect competition and constant returns to
scale in all sectors. The other two versions show significant net income gains for that group of
countries.
There has been concern that some developing countries might suffer income losses from the liberalization of trade in goods because of (i) the impact on net-food importers of possible
increases in world market food prices, and (ii) the impact on least-developed countries in Africa of reduced margins of tariff preferences (especially Lômé preferences granted by the European
Union). The model used to generate the estimates for this study allows for the first effect, but the estimated impact on the net food importing countries cannot be shown separately because they
are not a separate group in the 1990 GTAP dataset (see Box 2). While the model takes into account reduced margins of preference for members of free trade agreements (for the regions
defined in the model), it does not allow for preference erosion related to GSP-type programs. This is because data on the share of exports covered, and the pre- and post-Uruguay Round
effective margins of preference, for the aggregate of developing and transition economies were not available. To be meaningful, the analysis of the potential trade and income effects of reduced
type preference margins must be done at a much greater level of country disaggregation than is possible with the dataset used in this exercise.
¡Error! No se encuentra el origen de la referencia.
Finally, the figures for the United States and the European Union in the industrial NTB column of
Table II.15 illustrate the point that countries gain not just from others' liberalization but also, and
perhaps foremost, from their own liberalization. Producers in these countries are not restricted by MFA
quotas in their export markets, so they do not have a direct stake in the elimination of MFA quotas
elsewhere. In fact, their exports of textiles and clothing will face greater competition from developing
and transitional countries that were previously restricted by MFA quotas. Even so, the model (all
versions) estimates a substantial gain to the United States and the European Union from the elimination
of MFA quotas. Since there are no direct gains in export markets to expect, the income gain is largely
due to the elimination of their own MFA quotas, plus in the case of the European Union, the phase-out
of the quota on imports of automobiles from Japan. Those net gains from the elimination of quotas are
composed of gains to consumers from lower prices and efficiency gains due to the expansions of
employment and output in other, more efficient industries.
(c) Which estimates are most plausible?(c) Which estimates are most plausible?
This is not the kind of exercise that yields "correct" estimates. No models do because there are
too many unknowns and too many limitations in the available methodologies. At the same time, the
likely impact of the liberalization of trade in goods on the levels of trade and income is very far from a
complete mystery. Widely accepted economic theory and an abundance of empirical research offer
important guideposts to what can be expected.
As was noted above, three versions of the model were used, not only to indicate the relative
importance of certain assumptions, but also to allow readers to choose whichever estimate (if any)
seems most plausible in light of the underlying assumptions. The view of the GATT Secretariat is that
the third version of the model more closely approximates the real world than the first two versions, and
therefore that the estimates for 2005 based on that version - including an increase in the volume of
world trade in goods of nearly one-quarter, and an increase in annual world income of more than
$500 billion - offer a better guide to the contribution of the liberalization of trade in goods to the overall
impact of the Uruguay Round than do the estimates based on the first two versions.
Modern trade theory emphasizes scale economies, intermediate specialization in production, and
firm level product differentiation as important reasons for trade. 26 Recent applied research on trade
liberalization has also stressed the importance of scale economies and the pro-competitive effects of
trade liberalization.27 The theoretical and applied research in this area suggests, strongly, that the effect
of trade liberalization goes well beyond narrow efficiency gains. The third version of the model
highlights these factors, while the first version (and to a large degree, the second) instead stress simple
efficiency gains, related to marginal resource reallocation effects.
Integrating markets enhances competition, facilitates more rational specialization of production
across broad geographic areas, and enhances the international transmission of innovation and
knowledge. Expanded markets can also mean expanded returns to, and hence incentives for, innovation.
Trade liberalization can also create a healthier environment for savings and investment (this effect is
distinct from the assumption that a fixed share of the income gain is saved and invested). These savings
and investment effects can, in turn, have important medium-run and long-run implications for the
process of economic development and growth.28 A comparison of the first version of the model (which
ignores these effects), and third version (which allows for only some of them), highlights just how
See Brown (1994), de Melo and Tarr (1994), Harris (1984, 1986), and Norman (1990).
For example Roland-Holst, Reinert and Shiells (1994), and Brown, Deardorff and Stern (1994) have explored these issues in the context of NAFTA. Harrison, Rutherford and Tarr (1994)
have focused on similar issues in the context of European integration.
See Grossman and Helpman (1991) on the improved environment for savings and investment. Annex IV below presents a brief summary of recent findings on the trade/growth relationship.
See Francois and Shiells (1993), and Francois, McDonald, and Nordström (1993a) for brief surveys of the theoretical and empirical links between trade and economic growth.
¡Error! No se encuentra el origen de la referencia.
important these effects can be. The first version's focus on simple efficiency gains under assumptions
of constant returns to scale and perfect competition greatly underestimates the gains from the
liberalization of trade in goods. The third version falls well short of capturing all the gains, but it
comes much closer than either of the first two.
(d) Keeping the trade and income estimates in perspective(d) Keeping the trade and income
estimates in perspective
The modelling exercise shows that the trade and income effects of the Uruguay Round market
access package for goods are substantial. Even the smallest of all the annual global income gains to
come out of this exercise - the $109 billion in Table II.14 - is a substantial amount of money. And, of
course, it is not a one-time windfall of income, but rather an annual gain in income that is available year
after year.
More fundamentally, it must be emphasized that the estimated trade and income gains from the
increase in market access for goods underestimate - probably very substantially - the full impact of the
Uruguay Round on world trade and income. This is because the estimates do not take into account
three important considerations. First, there are, as was just noted, many possible dynamic effects
mentioned in the economics literature that were not considered. Second, the estimates implicitly assume
that the status quo in commercial relations and business confidence would have been maintained if the
Uruguay Round had failed. Many observers would argue that a failure of the Round would have meant
a distinct worsening of trade relations for a considerable period into the future and a delay in the world's
economy recovery. The avoidance of the associated losses in trade and income would have to be
included in a full accounting of the gains from a successful Uruguay Round. Third, and in many ways
most important of all, the estimates reported above ignore every result of the Round except the
liberalization of trade in goods. Because it simply was not feasible, there was no attempt to include the
beneficial impact of the strengthened rules, procedures and institutions - including the market access
commitments and rules for services in the GATS - on the more than $4.5 trillion in current world trade
in goods and services.
The remainder of the paper focuses on those other results of the Uruguay Round. Part III deals
with the GATS and the schedules of commitments on services, and includes tabular summaries of key
features of those commitments. Part IV - whose short title might be "Bindings are Not Enough" examines the ways in which the strengthened rules, procedures and institutions are an essential
complement to the schedules of commitments on goods and services.
¡Error! No se encuentra el origen de la referencia.
III. COMMITMENTS ON SERVICESIII. COMMITMENTS ON SERVICES
1. INTRODUCTION1. INTRODUCTION
The General Agreement on Trade in Services (GATS) is the first multilateral agreement
covering trade in all service sectors. By providing for secure access to markets and progressive
liberalization it will stimulate the growth of services trade in the same way as the GATT has done since
1947 for trade in goods. The basic principles of the Services Agreement are similar to those of the
GATT:
-
National treatment: foreign services and service suppliers should be treated no less
favourably than nationals;
-
Most-favoured-nation treatment: there should be no discrimination between other
Members of the Agreement in terms of the treatment accorded to their service suppliers;
-
Transparency: relevant policies, including barriers to market access and discriminatory
restrictions, must be published;
-
Progressive liberalisation: binding commitments on the negotiated levels of market access
and national treatment make the process of liberalisation irreversible, and provide the
basis for future rounds of negotiation.
Cross-border trade in services alone already accounts for an estimated $1 trillion a year (roughly
20 per cent of global trade) and is growing rapidly. Unlike the GATT however, the Services Agreement
covers not just cross-border trade, but every means by which services can be traded: by cross-border
supply; by consumption abroad; through commercial presence, meaning the supply of a service in a
foreign market through a commercial presence established there; and through the movement of natural
persons working abroad to supply a service. The total value of services traded through these four
modes is very much greater than that of cross-border trade alone.
The GATS is in two parts: the framework agreement, containing 29 Articles and a number of
Annexes, and the national schedules of specific commitments undertaken by each Member government.
The Final Act of the Uruguay Round as agreed by Ministers in April 1994 contains 95 certified
schedules (the European Union has submitted a common schedule on behalf of its 12 Member States,
indicating specific commitments at the national level where applicable) which together contain the
results of the market access negotiations for services in the Uruguay Round. The GATS explicitly
provides for future rounds of negotiations with a view to achieving a progressively higher level of
liberalization; the first such round is to begin within five years of the entry into force of the Agreement.
The principal beneficiaries of the commitments are efficient suppliers of services in developed,
developing and transition economies, who will gain from the more open and secure markets that these
commitments will produce. Users of services will gain from lower prices and greater variety.29 This is
obvious in the case of services consumed by the public at large, such as banking, health and
transportation services. But it also applies to the wide range of service activities which are used as
inputs by enterprises, whether engaged in services production themselves or in goods production. More
generally, the stability and predictability in national policies which the services commitments will
engender, among other things help attract inflows of foreign direct investment. This could be
particularly important for developing countries and their increasing participation in world trade.
For a comprehensive discussion of this issue see UNCTAD/The World Bank (1994), Liberalizing International Transactions in Services: A Handbook, United Nations: New York and
Geneva.
¡Error! No se encuentra el origen de la referencia.
2. THE NATURE OF THE COMMITMENTS2. THE NATURE OF THE COMMITMENTS
In its national schedule each Member government inscribes the service sectors and activities to
which it will apply the market access and national treatment obligations of the GATS. In addition, it
must indicate any limitations which it intends to maintain on market access and national treatment for
those sectors or activities. Every such indication in a schedule is a binding commitment to allow supply
of the service in question on the terms and conditions specified, and not to impose any new measures
that would restrict entry into the market or the operation of the service. Commitments can only be
withdrawn or modified after the agreement of compensatory adjustments with affected countries, and
that not until the Agreement has been in force for three years. The schedules thus provide economic
operators trading or investing in a foreign market - and domestic customers of foreign service suppliers
-with the assurance that conditions of entry and operation in the market will not be changed to their
disadvantage.
The national schedules all conform to a standard format which is intended to facilitate
comparative analysis (see Box 3). In nearly all schedules commitments are split into two sections: first,
"Horizontal" commitments applying to all sectors included in the schedule, such as a restriction on the
purchase of land by foreigners; and second, "Sector-specific" commitments applying to particular
services or activities. Any evaluation of the access provided for any given service must take into
account both horizontal and sector-specific commitments. In assessing commitments undertaken in
national schedules, two considerations are of special relevance: the sector coverage (i.e. the sectors,
sub-sectors or activities included in the schedule) and the depth of a particular commitment (i.e. whether
or not it is subject to limitations).
Although most-favoured-nation treatment is a general obligation which applies to all measures
affecting trade in services, it has been agreed that particular measures inconsistent with the MFN
obligation can be maintained - in principle for not more than ten years and subject to review after not
more than five years. Such measures are specified in national lists of MFN exemptions. The
assessment of a country's commitments should therefore also take into account whether or not MFN
exemptions exist and their importance. A true assessment of the value of commitments can only be
made by reading the national schedules and exemption lists.
3. OVERVIEW OF THE SCHEDULES OF COMMITMENTS3.
SCHEDULES OF COMMITMENTS
OVERVIEW OF THE
It is not possible to quantify the value or the potential trade effects of commitments in services in
the same way of for tariff bindings. In the first place, in services there is no equivalent to customs
duties; protection against imports, where it exists, typically takes the form of discriminatory
regulations or barriers against the practices of services by foreigners, and the effect of such measures or
their removal cannot easily be quantified. Secondly, the comprehensive data needed to estimate imports
of particular services under the different modes of supply, or even in aggregate terms, do not exist, nor
is there an equivalent in services to the internationally agreed Harmonized System nomenclature for
tariffs on goods to categorise commitments. Quantitative presentation of the commitments in GATS
schedules is therefore much more difficult than for tariff commitments.
It is possible, nevertheless, to present in tabular form several aspects of the commitments. The
tabulations which follow are organized on the basis of the list of 161 service activities which
participants have generally used to describe and categorize their commitments.30 In interpreting the
"Services Sectoral Classification List", GATT document MTN.GNS/W/120, 10 July 1991.
¡Error! No se encuentra el origen de la referencia.
tabulations on services, two points must be kept in mind. First, there is a great deal of variation
between the 161 service activities in terms of employment, production and trade; the figures in the
services tables are not "trade-weighted". Secondly, the figures showing levels of commitments in
particular country groups mask significant variations in the sectoral coverage of commitments as
between individual countries in the group.
Although there is great variation in the number of countries offering commitments on different
services, there are no sectors which have been excluded from the scope of commitments. The majority
of commitments bind the existing level of access while others incorporate and bind liberalization of
previously existing restrictions.
4.
SECTORAL COVERAGE OF SCHEDULES4.
SCHEDULES
SECTORAL COVERAGE OF
Table III.1 - Commitments within sub-sectorsIII.1 - Commitments within sub-sectors
(Number of countries)
Maximum
DC
LDC
25
76
Transition Total
5
106
1. Business
DC
Maximum
LDC Transition Total
25
76
5
106
6. Environment
A. Professional
25
37
4
66
A. Sewage
23
7
2
32
B. Computer
25
34
4
63
B. Refuse disposal
24
7
3
34
C. R&D
22
15
3
40
C. Sanitation
23
5
3
31
D. Real estate
23
3
0
26
D. Other
24
6
1
31
E. Rental/leasing
25
13
3
41
7. Financial
F. Other
25
38
4
67
2. Communication
A. Insurance
25
47
4
76
B. Banking
25
37
4
66
0
0
0
0
1
29
A. Postal
0
3
0
3
C. Other
B. Courier
4
15
3
22
8. Health
C. Telecom
4
18
3
25
A. Hospital
14
14
- Basic
2
16
3
21
B. Other human health
2
4
0
6
- Value-added
25
22
5
52
C. Social
13
1
0
14
D. Audio-visual
2
11
0
13
9. Tourism and travel
E. Other
6
0
6
12
A. Hotels and restaurants
25
68
4
97
B. Travel agencies, tour operators
25
53
4
82
A. Buildings
24
21
3
48
C. Tourist guides
23
21
2
46
B. Civil engineering
24
20
3
47
D. Other
1
13
0
14
C. Installation and assembly
24
19
3
46
10. Recreational, cultural, sporting
D. Completion and finishing
23
13
3
39
A. Entertainment
17
16
1
34
E. Other
20
15
2
37
B. News agency
22
0
0
22
C. Libraries, archives, museums
4
3
0
7
3. Construction
4. Distribution
A. Commission agents'
22
2
0
24
D. Sporting
21
16
1
38
B. Wholesale trade
25
8
4
37
E. Other
1
1
0
2
C. Retailing
24
7
2
33
11. Transport
D. Franchising
23
5
2
28
A. Maritime transport
5
26
1
32
E. Other
2
0
0
2
B. Internal waterways
2
2
3
7
C. Air
23
17
3
43
A. Primary
18
5
4
27
D. Space
2
0
0
2
B. Secondary
19
5
4
28
E. Rail
19
5
3
27
C. Higher
18
4
4
26
F. Road
25
15
3
43
D. Adult
18
1
4
23
G. Pipeline
3
1
1
5
E. Other
3
2
2
7
H. Auxiliary services
21
15
1
37
I. Other
14
6
0
20
5. Education
¡Error! No se encuentra el origen de la referencia.
Notes:
(1)
(2)
The three country groups are developed countries (DC), developing economies (LDC) and transition economies.
The figures count the twelve members of the European Union individually.
Table III.1 above shows the number of countries, developed, developing and in transition, which
have made commitments in the major sub-sectors. It should be stressed that this provides only a very
approximate indication of the scope of commitments. This is because many of the sub-sectors
represented in the tabulation cover a very wide range of activities: professional services, for example,
covers eleven different activities, ranging from legal to veterinary services. A country which is shown
as having made a commitment in professional services may have done so in only one of these eleven
activities. A more accurate picture of the scope of commitments is given in Appendix Table 15 which
shows the number of countries having made commitments in each service activity.
Although there are important differences in the extent of commitments, it is significant that there
are no sectors that have been excluded. The commitments of developed countries cover nearly all
sectors although there are a few exceptions such as postal services, basic telecommunications and
maritime transport (for both of which there are ongoing negotiations), and audiovisual services. The
fact that there are more commitments in tourism than in any other sector reflects the large number of
commitments undertaken by developing countries. The relatively limited number of commitments in the
health, education and environmental sectors is largely a reflection of the fact that in many countries
these services are provided essentially by government, and that competitive or commercial provision is
not widespread.
Looking more closely at certain service sectors, 67 countries scheduled commitments in business
services, which cover professional services (including legal, accounting, architectural, medical services
etc.), computer and related services, R&D services, real estate services and advertising, market
research, management consulting, investigation and security services as well as a host of other business
services. To give just one example at the sub-sectoral level, more than 50 countries, constituting an
estimated 90 per cent of the world market for accounting services, have scheduled commitments in the
accounting sector; this will assist foreign suppliers to these markets to compete on an fair and equitable
basis.
In the telecommunications sector 52 countries have made commitments in what are considered
"value-added" telecommunications services while only 21 have made commitments in "basic"
telecommunications services. This disparity is accounted for by two factors: first, in many countries
the supply of basic telecommunications continues to be restricted to a government monopoly, and was
for this reason not subject to commitments; secondly, it was agreed that negotiations on basic
telecommunications services should be extended for a further two years (until 30 April 1996) at which
point the commitments resulting from the negotiations will be added to the relevant schedules.
76 countries have made commitments in the financial services sector, which covers international
transactions in insurance and banking as well as trading in securities. In this sector, however,
participating countries agreed to continue negotiations on the basis of the existing commitments with a
view to achieving further liberalization. These negotiations are scheduled to end six months after the
entry into force of the WTO, at which point commitments may be extended, modified or withdrawn.
In the area of tourism and travel, where the highest number of commitments were made, the
main activities covered relate to the "core" tourism services provided by hotels and restaurants, travel
agents and tour operators as well as by tourism transport companies. The large number of
commitments by developing countries reflects the desire of governments to realize the potential of the
tourism sector to generate domestic employment and foreign exchange revenue in developing countries.
In the air transport sector commitments will apply to three activities, aircraft repair and
maintenance services, selling and marketing of air transport services and computer reservation system
services. More than 40 countries have undertaken commitments in one or more of these areas. It was
agreed that commitments would not be made in relation to traffic rights and the supply of services
¡Error! No se encuentra el origen de la referencia.
directly related to the exercise of traffic rights, matters which are currently regulated through a network
of largely bilateral agreements. In the maritime transport sector, where 32 countries have made
commitments, it was agreed at the end of the Uruguay Round that negotiations should continue until
June 1996 with the aim of achieving further commitments in international shipping, auxiliary services
and access to and use of port facilities.
In all sectors, not merely in those where further negotiations are already under way, further
liberalization can be expected in the future rounds of negotiation to which Members of the Agreement
have already committed themselves. The commitments which have been made in this first round are a
major step towards the dismantling of restrictions which distort trade in services, but they are only the
first step.
5. LIMITATIONS ON SPECIFIC COMMITMENTS5.
COMMITMENTS
LIMITATIONS ON SPECIFIC
The level of access provided by a commitment depends on the character of the existing regulatory
regime and the nature of the limitations, if any, to which the commitment is subject. Such limitations
may be either horizontal (covering all sectors) or sector-specific. In the schedules the inscription
"None" against a particular mode of supply indicates the absence of limitations and "Unbound"
indicates that no commitment is given for that mode. Box 3 below shows the standard format used in
schedules, with hypothetical but typical entries against the four modes of supply.
Box 3 - Illustrative schedule of commitments
I. Horizontal
commitments
(applicable to all sectors
included in the schedule)
Mode of supply
Conditions on market
access
(examples of entries)
Conditions on national
treatment
(examples of entries)
1. (Cross-border supply)
2. (Consumption abroad)
3. (Commercial presence)
None
None
Incorporation required
Bound only for intracorporate transferees
None
None
Restrictions on purchase
of real estate
Unbound except as
indicated under market
access
None
None
None
Unbound, except as
provided in the
horizontal section
None
None
None
Unbound, except as
provided in the
horizontal section
4. (Presence of natural persons)
Additional
commitments
II. Sectoral commitments
(limitations applicable to
specific service activities)
1. (Cross-border supply)
2. (Consumption abroad)
3. (Commercial presence)
4. (Presence of natural persons)
(a) Horizontal limitations (a) Horizontal limitations
Most schedules do not contain horizontal limitations applying to modes of supply 1 and 2 that is, to cross-border supply of services or consumption abroad. In contrast, most schedules do
contain horizontal limitations on the supply of services through commercial presence and on the
temporary presence of natural persons.
As shown in table III.2, 87 governments have entered horizontal commitments in their
schedules with respect to commercial presence. Of these, 31 entered no horizontal limitations on
market access through commercial presence. 55 have entered such limitations, of which 10 authorize
foreign investment on the basis of an "economic needs test", 25 impose ceilings on equity participation
by foreign investors, and the remaining 20 require establishment to take the form of a specified legal
entity, for example by requiring the establishment of a subsidiary. One country has offered no binding
¡Error! No se encuentra el origen de la referencia.
regarding market access through commercial presence. Regarding national treatment of foreign service
suppliers established in their territories, 68 of the 87 governments making horizontal commitments have
placed limitations on national treatment. Most of these concern the purchase of real estate and
eligibility for subsidies (mainly for research and development).
Table III.2 - Horizontal commitments on commercial presence III.2 - Horizontal commitments on
commercial presence
Market access
Number of
schedules
National treatment
Number of
schedules
Total
87
Total
87
Unbound
1
Unbound
1
No limitations
31
No limitations
18
With limitations
55
With limitations
68
Authorization subject to an economic
needs test*
10
Taxation
11
Legal entity
25
Eligibility for subsidies
28
Ceilings on foreign equity participation
20
Purchase of real estate
41
Nationality requirements for
directors
8
Access to local finance
6
¡Error! No se encuentra el origen de la referencia.
*
Subject to conditions ranging from national interest, job creation, technology transfer or training for nationals.
With respect to the supply of services through the presence of natural persons, most countries
have specified their commitments on market access and national treatment for this mode of supply in the
horizontal section of their schedule. 31 The entries differ considerably in detail and terminology but fall
into three categories:
- Quantitative market access limitations stipulate limitations on the total number of
foreign natural persons who can supply services, expressed either in the form of a
quota on the percentage of foreign personnel employed or the requirement of an
economic needs (or labour market) test.
- Bound commitments for certain types of personnel whereby countries have
scheduled measures affecting the entry and temporary stay of some categories of
natural person supplying services while leaving other categories unbound. The
main categories are business visitors, intra-corporate transferees and professionals
who are employed on a contact basis.
- There are also horizontal commitments where the relevant national authorities,
either the immigration or labour ministries, are given broad discretionary authority
in granting permission for the temporary entry and stay of foreign natural persons
supplying services.
Table III.3 shows that in 70 cases governments offer bindings only for the entry of intracorporate transferees, often stipulating that these should be senior personnel such as executives,
managers or specialists. In 25 of these cases the admission of intra-corporate transferees is nevertheless
subject to a quota or an economic needs test. 50 schedules contain no limitations on national treatment
of natural persons, but in 35 cases there is differential treatment, such as exclusion from access to
government subsidies or from purchase of real estate.
Table III.3 - Horizontal commitments on the presence of natural personsIII.3 - Horizontal
commitments on the presence of natural persons
Market access
Total
Number of
schedules
87
Entry of natural persons is subject to :
National treatment
Number of
schedules
Total
87
Unbound
2
an economic needs test
14
No limitations
50
a quota
3
With limitations, relating to:
35
70
Taxation
6
Only for senior personnel*
66
Eligibility for subsidies
23
Subject to an economic needs test
11
Purchase of real estate
8
Subject to a quota
14
Other
2
Binding for intra-corporate transferees of
which:
At the sector-specific level (Part II of the schedules), most countries have followed the convention of indicating that the supply of services by the presence of
natural persons is "Unbound, except as provided for in the horizontal section".
¡Error! No se encuentra el origen de la referencia.
*
Executives, managers, specialists.
(b) Sector-specific limitations(b) Sector-specific limitations
In Table III.4 below information on sector-specific limitations on market access and national
treatment is organized according to sector. It will be seen that the number of specific limitations
affecting cross-border supply and consumption abroad is low for most service sectors. Where the
unbound percentage is high for cross-border supply, as in construction, environmental and health
services, this is normally because cross-border supply of these services is not technically feasible. In
the case of supply through commercial presence and the presence of natural persons, the high
proportion of commitments without limitations must be seen in relation to the fact that most limitations
on these modes are contained in the horizontal section of the schedules.
Table III.4 - Nature of commitments by service sectorIII.4 - Nature of commitments by service
sector
(Percentages in each category)
Cross-border
Consumption abroad
Commercial presence
Natural persons
Sector
No
limits
Limits Unbound
No
limits
Limits
Unbound No
limits*
Limits Unbound
No
limits*
Limits
Unbound
Business
72
3
25
88
1
11
86
11
4
86
8
7
Communication
73
10
16
84
2
14
73
20
7
89
2
10
Construction
17
1
82
83
0
17
80
15
5
91
6
3
Distribution
69
3
28
93
0
7
87
12
1
92
5
3
Education
81
9
10
92
3
6
77
18
5
90
6
5
Environment
20
0
80
96
0
4
96
4
0
94
4
2
Financial
51
19
30
57
17
26
39
56
5
75
15
10
Health
20
0
80
89
2
9
76
16
8
89
6
6
Tourism
51
4
45
88
1
11
78
17
5
82
8
10
Recreation
68
0
31
94
1
5
86
9
5
89
5
6
Transport
48
3
49
94
0
5
74
13
13
91
3
6
Note: Limitations include both market access and national treatment; unbound means that a mode of supply is excluded. Percentages may not
add up to 100 due to rounding.
* "No limits" indicates the absence of sector-specific limitations. In nearly all such cases horizontal limitations apply. The absence of sectorspecific limitations is not therefore an indication of relative freedom of access.
¡Error! No se encuentra el origen de la referencia.
6. LISTS OF ARTICLE II (MFN) EXEMPTIONS6.
EXEMPTIONS
LISTS OF ARTICLE II (MFN)
Most-favoured-nation treatment is a general obligation that applies to all measures affecting trade
in services, not merely to measures which are subject to binding commitments under a country's
schedule but also to all other measures affecting trade in services under its regulatory régime. In that
sense, the MFN obligation provides for a significant degree of liberalization by committing Members to
non-discriminatory treatment of all other Members with respect to the existing level of access and
treatment available in that particular activity for that particular mode of supply.
Although immediate and unconditional in principle, the application of the MFN principle is
tempered by the possibility for countries to seek exemptions for particular measures inconsistent with
the non-discrimination obligation. Measures which are inconsistent with the MFN obligation can
therefore be maintained - in principle for not more than ten years and subject to review after not more
than five years. Such measures must be specified in a list of MFN exemptions describing the measure,
its coverage and why it is needed. 61 such lists were submitted and are attached to the GATS. MFN
exemptions are relatively common in sectors which tend to be regulated through bilateral agreements,
such as maritime transport, land transport and the audiovisual sector.
The assessment of national commitments must therefore take into account the existence of MFN
exemptions, where they do exist, and their coverage. They should be read in conjunction with national
schedules.
¡Error! No se encuentra el origen de la referencia.
IV. ADDITIONAL SECURITY FOR MARKET ACCESS: STRENGTHENED RULES,
PROCEDURES AND INSTITUTIONSIV. ADDITIONAL SECURITY FOR MARKET
ACCESS: STRENGTHENED RULES, PROCEDURES AND INSTITUTIONS
Previous parts of this report have provided an overview of the commitments made by prospective
WTO members in their schedules and, in the case of goods, of the likely impact on trade and income.
But there is much more to open and secure markets than just the liberalization commitments contained
in the schedules. Governments have at their disposal a wide array of policy instruments that affect
trade. For instance, the prospects for an exporter of automobiles in a particular market depend on - in
addition to the import duty - whether there are quantitative restrictions, how certain non-tariff measures
are administered (for example, customs valuation, anti-dumping and countervailing measures), as well
as measures applied internally that affect the conditions of competition of imports once inside the border
(such as product taxes and production subsidies). If the obligations of WTO members did not extend to
these policy instruments, negotiated reductions in tariffs would certainly be worth much less in
commercial terms. An important historical example illustrates this point. The GATT was established
in 1947 - as an interim arrangement pending the creation of the International Trade Organization - for
the specific purpose of providing security for the increases in market access agreed to in London at the
first round of postwar tariff negotiations. Agreed lists of tariff reductions were not enough.
To help governments contain inevitable protectionist pressures, members of the WTO are
required to ensure the conformity of their laws, regulations and administrative procedures with their
WTO obligations. Adherence to these obligations is enhanced by the peer pressure exercised by trading
partners, partly through the monitoring national trade policy developments. As an ultimate recourse,
trading partners may enforce commitments through the dispute settlement procedures.
The commitments contained in schedules for goods and services, therefore, are just one part of a
much larger single undertaking - the Final Act of the Uruguay Round - which WTO members pledge to
adopt for the conduct of their trade relations (see chart of the WTO Agreement below). This
framework comprises commitments on a wide array of policy instruments affecting trade in goods and
services, the protection of intellectual property rights, the monitoring of trade policies to provide for
transparency and improved adherence to obligations, dispute settlement procedures to interpret and
enforce those obligations, and an institutional setting for WTO Members to oversee the functioning of
the multilateral trading system, including as a forum for negotiations to improve and extend the rulesbased framework for the conduct of trade relations.
This part of the study provides a brief overview of the strengthened and extended rules,
procedures and institutions, with the exception of the General Agreement on Trade in Services (GATS)
and, the agreement on agriculture, which have already been discussed.
1. MULTILATERAL RULES FOR TRADE IN GOODS1. MULTILATERAL RULES FOR
TRADE IN GOODS
The cornerstone of the multilateral rules for trade in goods is the General Agreement on Tariffs
and Trade (GATT 1994), which updates and extends GATT 1947. Irrespective of whether a product
has been the subject of a scheduled commitment, governments are required to administer a wide range
of trade policy measures according to prescribed rules, so as to maintain open and secure markets for
world trade. To facilitate the integration of trade in all goods into the multilateral framework,
supplementary agreements cover the "problem" areas of agriculture, 'grey-area' measures (including
those applied to textiles and clothing under the MFA), and trade-related investment measures (TRIMs).
A Council for Trade in Goods will monitor the implementation and operation of these agreements.
¡Error! No se encuentra el origen de la referencia.
THE WORLD TRADE ORGANIZATION
Understanding on Rules and
Procedures Governing the
Settlement of Disputes
Multilateral Agreements on
Trade in Goods
Trade Policy Review
Mechanism
General Agreement on Trade
in Services
Agreement on Trade-Related
Aspects of Intellectual Property
Agriculture
Customs Valuation
Plurilateral Trade Agreements
Sanitary/Phytosanitary
Preshipment Inspection
Textiles and Clothing
Rules of Origin
Civil Aircraft
Technical Barriers
Import Licensing
Gov't Procurement
Investment Measures
Subsidies/Countervail
Dairy Products
Anti-dumping
Safeguards
Bovine Meat
GATT 1994
¡Error! No se encuentra el origen de la referencia.
(a) GATT 1994(a) GATT 1994
GATT 1994 is an updated version of GATT 1947.32 Each WTO Member is required to treat
products imported from different trading partners on the same basis (the most-favoured-nation principle
or MFN).33 Other central requirements include the "national" treatment of imported products (Article
III), so that once imported products are inside the border, they face the same conditions of competition
as domestically-produced products, freedom of transit for merchandise trade (Article V), and a
prohibition on quantitative restrictions (Article XI).
Exceptions to these obligations may be invoked under certain conditions and tariff bindings may
be renegotiated with compensation. Thus, the WTO rules, like the GATT before it, do not preclude the
possibility of governments granting assistance to a sector, but guide the choice of policy instrument in
the interest of maintaining an open trading system.
(b) Agreements on non-tariff barriers(b) Agreements on non-tariff barriers
Although the original GATT covered a wide range of trade-related domestic policies,
governments were left considerable discretion in the administration of such policies. To avoid an
inappropriate implementation of such policies", governments found it necessary to clarify their
administration and to extend the rules to trade measures not originally or inadequately covered by
GATT 1947. The agreements reached in the Uruguay Round concern sanitary and phytosanitary
measures, technical barriers to trade, anti-dumping, customs valuation, preshipment inspection, rules of
origin, import licensing procedures, subsidies and countervailing measures, and safeguards. As a
result, a WTO Member applying a non-tariff measure is required to follow precise guidelines to make
the system transparent and predictable, as well as provide procedural guarantees for exporters. A
Committee will be established to oversee the operation of each of the agreements except the one on
preshipment inspection.
Most of the agreements are more extensive versions of those concluded in the Tokyo Round.
Because they were accepted by less than one-third of the GATT contracting parties (mainly developed
countries), they merely acquired a plurilateral rather than a multilateral status. In particular, the
application of non-tariff measures in developing countries was not subject to the precise guidelines
contained in the Tokyo Round agreements (although covered to a degree by applicable GATT articles),
which increased uncertainty for exporters. In contrast, the Uruguay Round agreements on non-tariff
measures will apply to all WTO Members - they will have a multilateral status, ensuring a global
coverage of the rules.
The need to reduce uncertainty in the conduct of trade also applies to the measures used by
governments to counteract the effects of "unfair" trade practices - subsidies and dumping - when a
domestic industry is injured or threatened by injury. Although the original GATT contained rules on
countervailing and anti-dumping measures, they were not sufficiently precise in several key areas transparency, predictability, due process for exporters. In addition, the GATT contracting parties had
never succeeded in defining the range of domestic subsidies that could be the basis for countervailing
measures, which added a further element of uncertainty.
GATT 1994 contains: (1) the provisions of the legal instruments that have entered into force under the GATT 1947 before the date of entry into force of the WTO, including protocols and
certifications relating to tariff concessions, protocols of accessions; waivers granted under Article XXV; and other decisions of the CONTRACTING PARTIES to GATT 1947; (2) seven
understandings reached in the Uruguay Round on the interpretation of GATT provisions dealing with schedules of concessions (Article II:1(b)), state-trading enterprises (XVII), balance
payments provisions (XII and XVIII:B), customs unions and free-trade areas (XXIV), waivers (XXV), modification of GATT schedules (XXVIII) and non-application of the General
Agreement (XXXV); and (3) the schedules of commitments.
Notwithstanding the most-favoured-nation clause, developing countries may be granted tariff preferences under the Generalized System of Preferences (GSP) as a result of the 1979 Decision
on "Differential and More Favourable Treatment, Reciprocity and Fuller Participation of Developing Countries" (BISD 26S/103), known as the "Enabling Clause".
¡Error! No se encuentra el origen de la referencia.
In these respects, the Agreement on Subsidies and Countervailing Measures represents an
advance since it defines a subsidy (as a financial contribution by a government) and clarifies the
subsidies that are subject to the disciplines under the agreement, including subsidies that may form the
basis for countervailing measures (those that are provided specifically to an enterprise or industry, as
opposed to generally available subsidies). A further step has also been taken to extend the framework
of disciplines to limit the use of trade-distorting subsidies. Export subsidies are prohibited, and
domestic subsidies are categorized as actionable or non-actionable depending on their nature. 34 The
"green box" contains non-specific subsidies and certain assistance for research and "pre-competitive"
development activities for disadvantaged regions, or to adapt to new environmental requirements. The
Agreement on Agriculture modifies the application of these rules to agricultural products.
The administration of countervailing/anti-dumping measures has been clarified by (i) greater and
more detailed disciplines on the conduct of investigations; (ii) establishing the criteria to terminate an
investigation (de minimis thresholds for margins of subsidization/dumping or the volume of imported
products or negligible injury); (iii) providing interested trade partners with full notice and a right to
present evidence; (iv) clarifying the criteria used to determine injury to the domestic industry; (v)
requiring more detailed public notice and explanation of determinations; and (vi) establishing that a
"sunset" clause of five years applies to measures, unless a determination is made that, in the event of
the termination of the measures, subsidization/dumping and injury would be likely to continue or recur.
(c)
Arrangements for agriculture, 'grey-area' measures, and trade-related investment
measures(c) Arrangements for agriculture, 'grey-area' measures, and trade-related investment
measures
Although GATT 1994 and the agreements on non-tariff measures apply in principle to all trade
in goods, the Uruguay Round negotiators had to find specific solutions to the "problem" areas of
agriculture, 'grey-area' measures (in particular 'voluntary' restraints on exporters of textiles and clothing
applied under the MFA) and trade-related investment measures. The option of immediate integration of
all such measures into GATT 1994 was considered not practicable. The maintenance of some of these
practices has therefore been authorized pending their fuller integration into world trade rules.35 The
transitional arrangements made will be overseen by committees established for each agreement.
The broad outlines of the Agreement on Agriculture were described in Part II.3 (see in particular
Box 1). One important part of the Agreement not mentioned concerns the least-developed and net foodimporting developing countries. They are the subject of a separate Decision which recognizes that, as a
result of agricultural reform, they may experience negative effects with respect to supplies of food
imports on reasonable terms and conditions. It sets out objectives with regard to the provision of food
aid, the provision of basic foodstuffs in full grant form and aid for agricultural development. It also
refers to the possibility of assistance from the International Monetary Fund and the World Bank with
respect to the financing of commercial food imports. The Committee of Agriculture, set up under the
Agreement on Agriculture, will monitor the follow-up to the Decision.
Certain exceptions are provided for developing and transition economies.
A general interpretative note states that in the event of conflict between a provision of GATT 1994 and another multilateral agreement on trade in goods, the latter prevails.
¡Error! No se encuentra el origen de la referencia.
'Grey-area measures', such as voluntary restraints or orderly marketing arrangements, are
required to be notified and eliminated under the Agreement on Safeguards no later than four years after
the entry into force of the WTO. Each member may exempt one specific measure, by mutual
agreement with the directly concerned exporting member, and with the agreement of the Committee on
Safeguards, with a phase-out date of 31 December 1999.36 In addition, a seperate arrangement has
been made for the bilateral quotas applied under the Multifibre Arrangement (MFA), which will be
progressively eliminated over a ten-year period in four stages. At each stage of the integration process,
the Agreement lays down a formula for increasing the existing growth rates for products remaining
under restraint. For items subject to the MFA, a special safeguard mechanism may be invoked under
certain conditions.
Requirements sometimes imposed on enterprises as a condition of admission or operation by host
countries include the purchase or use of products of domestic origin (local content), and 'tradebalancing' (limiting the purchase or use of imports according to the amount of output exported). The
Agreement on Trade-Related Investment Measures (TRIMS) makes it clear that these trade-related
investment measures are inconsistent with the national treatment provision or the prohibition on
quantitative restrictions, provided they cannot be justified under a GATT exceptions provision. Such
measures must be notified and eliminated within a transition period of two years (developed countries),
five years (developing countries) or seven years (least-developed countries).
2.
INTELLECTUAL PROPERTY PROTECTION2.
PROTECTION
INTELLECTUAL PROPERTY
The Agreement on Trade Related Aspects of Intellectual Property Rights (TRIPS) was motivated
by a desire to improve on a situation characterized by widely varying standards in the protection and
enforcement of intellectual property rights, and the lack of a multilateral framework of principles, rules
and disciplines dealing with international trade in counterfeit goods. With the ongoing integration of
the world economy, and with production becoming more "technology intensive", there was a concern
that the absence of a multilateral framework (including rules) for addressing intellectual property issues
could create problems, including tensions in international commercial relations. The TRIPS agreement
will be implemented within transition periods generally of one year (developed countries), five years
(developing countries and transition economies) or eleven years (least-developed countries).37 A
Council for Trade-Related Aspects of Intellectual Property Rights will be created to monitor the
operation of the Agreement and governments' compliance with it.
Subject to limited exceptions, the TRIPS agreement requires WTO Members to treat nationals of
trading partners on the same basis (the most-favoured-nation principle or MFN), and to provide for
national treatment with regard to the protection of intellectual property. It covers copyright and related
rights, including for computer programs, data bases, sound recordings and films; trademarks and
service marks; geographical indications, including appellations of origin; patents; industrial designs;
and layout-design of integrated circuits. There is a general obligation to comply with the substantive
provisions of the Paris Convention (1967). In addition, the Agreement requires that 20-year patent
protection be available for all inventions, whether of products or processes, in almost all fields of
technology.38
The EU/Japan agreement on passenger cars and other vehicles has been notified as an exception.
Least-developed countries may request a further extension.
Inventions may be excluded from patentability if their commercial exploitation is prohibited for reasons of public order or morality; otherwise, the permitted exclusions are for diagnostic,
therapeutic and surgical methods, and for plants and (other than microorganisms) animals and essentially biological processes for the production of plants or animals (other than
microbiological processes). Plant varieties, however, must be protectable either by patents or by a sui generis system (such as the breeder's rights provided in a UPOV Convention). Detailed
conditions are laid down for compulsory licensing or governmental use of patents without the authorization of the patent owner.
¡Error! No se encuentra el origen de la referencia.
With respect to the protection of layout designs of integrated circuits, the Agreement requires
parties to provide protection on the basis of the Washington Treaty on Intellectual Property in Respect
of Integrated Circuits which was opened for signature in May 1989, but with a number of additions.
Anti-competitive practices in contractual licences are covered by the provision for consultations
between governments where there is reason to believe that licensing practices or conditions pertaining to
intellectual property rights constitute an abuse of these rights and have an adverse effect on
competition.
WTO members are required to provide procedures and remedies under their domestic law to
ensure that intellectual property rights can be effectively enforced by foreign right holders.
Requirements include provisions on evidence, injunctions, damages and other civil remedies - including
the right of judicial authorities to order emergency provisional action to provide for special border
measures against imports of trademark counterfeit and pirated copyright goods, and to impose
imprisonment and fines sufficient to act as a deterrent in cases of wilful trademark counterfeiting or
copyright piracy on a commercial scale.
3. MONITORING OF TRADE POLICIES 3. MONITORING OF TRADE POLICIES
Transparency in the formulation and implementation of trade policies is a fundamental element of
the WTO system. Regular monitoring of the evolution of trade policies can be vital in maintaining
pressure for trade liberalization, ensuring that WTO principles are observed, and helping governments
to resist pressure from domestic groups to introduce new protective measures or use existing trade
policy instruments in a discretionary and protectionist fashion.
The Trade Policy Review Mechanism (TPRM), in place since 1989 on a provisional basis, has
been recognized as the main instrument assuring such transparency and regular monitoring. The
mechanism will now have a permanent place in the world trading system and all aspects of goods and
services trade will be covered. In examining a country's trade policies and practices from an economic
perspective, regular periodic TPRM reviews highlight the significant domestic resource costs associated
with protection.
Since its inception, the Mechanism has been recognized as playing an important role in
promoting greater multilateral surveillance of members' trade practices, thereby contributing to a more
open and stable trading environment. Each member's policies are reviewed by other members in the
Trade Policy Review Body (TPRB). The review is based on two reports; one prepared by the
Secretariat on its own responsibility, and the other by the country concerned. Both reports, together
with the proceedings of the meeting of the TPRB, are published by the WTO Secretariat.
As part of their monitoring activities, WTO members will also continue to appraise annually
developments in trade practices affecting the multilateral trading system. This appraisal will be
assisted by an annual report by the Director-General setting out major activities of the WTO, and
highlighting significant policy issues affecting world trade.
4. ENFORCEMENT OF COMMITMENTS4. ENFORCEMENT OF COMMITMENTS
¡Error! No se encuentra el origen de la referencia.
Like the GATT before it, the commitments made by WTO Members - whether in their schedules
or in the various agreements - are enforceable through the dispute settlement process by claims brought
by WTO members. In relation to the previous GATT system, a major change - not in the procedures
but in the functioning of dispute settlement within the system as a whole - is the integration of all the
dispute settlement procedures established under the individual agreements (goods, services, TRIPS) into
a single system operating under a Dispute Settlement Body (DSB). This integration of enforcement
across the agreements is the mirror image of the integration of rights and obligations implied by the
single undertaking of WTO Members. In contrast, each of the Tokyo Round Agreements had dispute
settlement procedures seperate from those of the GATT, which hindered their efficient functioning. In
addition, one of the central provisions of the DSU reaffirms that Members shall not unilaterally make
determinations of violations or suspend concessions, but shall make use of the multilateral dispute
settlement rules and procedures of the DSU.
In relation to the GATT system, the WTO dispute settlement system also provides claimants with
automaticity with respect to (i) the establishment of a panel to obtain a ruling on the legal status under
the WTO of the measure applied by the trading partner; (ii) adoption of the panel ruling; and (iii)
authorization of counter-measures in the event where an adopted panel ruling is not implemented. This
greater automaticity has been accomplished by a negative consensus approach in the DSB: a
consensus will be needed in order to halt the proceedings from advancing at any stage of the formal
dispute settlement procedures.
In order to ensure that automaticity in adoption of panel rulings is accompanied by greater
confidence in the quality of legal findings, appellate review is an important new feature of the WTO
dispute settlement procedures. An Appellate Body, composed of seven members, three of whom will
serve on any one case, will be established to hear appeals of panel rulings. If an appeal is not made,
the panel report will be adopted. If an appeal is made, the report of the Appellate Body shall be
adopted by the DSB and unconditionally accepted by the parties within 30 days following its issuance
to Members, unless the DSB decides by consensus against its adoption.
Following its adoption, the party concerned will have to notify its intentions with respect to
implementation of adopted recommendations. Under the GATT, panels have generally recommended
that an inconsistent measure be brought into conformity with the rules. If such a step is not taken,
within a reasonable period of time, compensation or the suspension of concessions or other obligations
are available as temporary measures. If no satisfactory compensation is agreed, the claimant may
request authorization from the DSB - acting according to the negative consensus approach - to retaliate.
The general principle is that suspension of concessions should take place in the same sector of trade;
for instance, retaliation over a violation of commitments made in the area of goods should also concern
goods. However, if this is not practicable or effective, and if the circumstances are serious enough, the
suspension of concessions may be made under another agreement; for instance, retaliation over a
violation of commitments made in the area of TRIPs may concern goods.
The improvements made to the dispute settlement procedures available in the world trading
system will enhance the enforceability of all commitments. From a systemic perspective, this
strengthening will help prevent departures from the rules, such as occurred in agriculture or textiles and
clothing, as well as in other areas. As a result, confidence in the rules-based approach to trade and
economic relations will be correspondingly increased, placing world trade and the world economy on a
more solid regulatory foundation.
5. THE WTO5. THE WTO
The proposal to establish the World Trade Organization (WTO) is one of the main results of the
1986-93 Uruguay Round of multilateral trade negotiations. Five specific tasks have been assigned to
the WTO:
¡Error! No se encuentra el origen de la referencia.
- to facilitate the implementation of the results of the Uruguay Round;
- to provide a forum for multilateral trade negotiations and a framework for the
implementation of their results;
- to administer the dispute settlement procedures;
- to administer the Trade Policy Review Mechanism; and
- to cooperate with the IMF and the World Bank group of agencies.
The WTO will be headed by a Ministerial Conference meeting at least once every two years. A
General Council will be established to oversee the operation of the WTO between meetings of the
Ministerial Conference, including acting as a Dispute Settlement Body and administering the Trade
Policy Review Mechanism. A Council for Trade in Goods, a Council for Trade in Services and a
TRIPs Council will operate under the general guidance of the General Council. In this manner, the
WTO will oversee the operation of all the agreements that form part of each WTO Member's
commitments.
All Members of the WTO are members of the Ministerial Conference and the General Council,
who have the authority to take decisions on all matters not specifically assigned to other bodies in the
WTO Agreement or upon referral by a WTO Member. These decisions will generally be taken by
consensus. On the basis of experience in the GATT, a consensus is deemed to have been achieved if
the Chairperson of the meeting concludes that no representative of a member has raised a formal
objection against the proposed decision. In relation to GATT practice, however, two changes have
been made in the WTO. The first, already noted above, is that the Dispute Settlement Body (DSB) will
apply a negative consensus approach: consensus will be needed in order to halt the proceedings from
advancing at any stage of the formal dispute settlement procedures.
In other areas, a positive
consensus approach will continue to apply to decisions of the Ministerial Conference or the General
Council. Otherwise, recourse to voting is provided, on the basis of "one country, one vote".
The second change in relation to the GATT is to modify the margin of votes required for
acceptance of decisions based on the nature of the decision itself. Decisions on the interpretation of the
provisions of the agreements on goods, services and intellectual property protection will require
approval by three-quarters of WTO Members. Waivers (authorization in exceptional cases for
departures from otherwise applicable obligations for a specified period of time) will also require
approval by three-quarters of WTO Members. Amendments will require approval by at least twothirds of WTO Members provided they "do not change the rights and obligations of Members", and in
other cases, consensus will be required.39 Other decisions will be taken by a majority of the votes cast.
Who can join the WTO? Contracting parties to the GATT 1947 which have submitted schedules
of commitments on goods and services, will automatically become members by accepting the WTO
agreement within two years of its entry into force. An implementation conference will be held on 8
December 1994 in order to decide on entry into force of the WTO. Other states and autonomous
customs territories may accede to the WTO Agreement on terms approved by a two-thirds majority of
the WTO Members.
In principle, an amendment binds only those WTO Members having accepted it. The Ministerial Conference may decide that those WTO Members that have not accepted a particular
amendment "shall be free to withdraw from the WTO or remain a Member with the consent of the Ministerial Conference".
¡Error! No se encuentra el origen de la referencia.
Once the WTO is in place, it will supplant the existing legal system of the GATT in the trade
relations of WTO Members. Why must the GATT eventually be replaced? The creation of a new
organization with new criteria for membership was made necessary by the broad coverage of the
Uruguay Round's agenda, including agreements on non-tariff measures, arrangements for agriculture,
textiles and clothing and other problem areas, as well as the new issues of services and intellectual
property protection. The practical significance of the results of this negotiating effort would have been
diminished from the start had it not been recognized that all agreements had to be accepted. Otherwise,
a country interested in securing intellectual property protection for its rights-holders but not in
eliminating quotas on imports of textiles and clothing would have been able to decide the agreements it
wanted to sign on to, and conversely. To ensure that participants would make the necessary political
compromises, all the results of the Uruguay Round of negotiations needed to be linked. This was
provided by the "single undertaking", institutionalized by the WTO Agreement.
As a result, the benefits of the new world trade order will go only to the participants that have
accepted the obligations to liberalize trade in goods and services and to provide intellectual property
protection. All subject-matters are legally linked. Each action taken, each position adopted and each
non-compliance contemplated will now be viewed not only in the light of the constellation of interests in
one particular area but in the light of the interest in the system as a whole. This in turn is likely to raise
the issues arising in the WTO to a higher political level and foster national trade policies less influenced
by narrow sectorial interests.
6. THE NEW PLURILATERAL AGREEMENT ON GOVERNMENT PROCUREMENT6.
THE NEW PLURILATERAL AGREEMENT ON GOVERNMENT PROCUREMENT
One other part of the WTO with important implications for market access is the new Government
Procurement Agreement. It is a plurilateral agreement because accession to it is not a condition of
WTO membership.
Superseding the existing Agreement which has been in force since 1981, the new Agreement
greatly extends the scope of international competition in this area, covering, for the first time, services,
including construction services, procurement at the sub-central level, for example states, provinces,
departments and prefectures and procurement by public utilities. It applies to contracts which are
above certain thresholds in value. In the case of central government purchases of goods and services,
the threshold is SDR 130,000 (some $182,000). For purchases of goods and services by sub-central
government entities, the threshold varies but is generally in the region of SDR 200,000. In regard to
utilities, the threshold for goods and services is generally in the area of SDR 400,000. As regards
construction contracts, in general the threshold value is SDR 5,000,000. Annexes list the procuring
entities of participating governments which will be subject to the rules of the Agreement.
The cornerstone of the rules is national treatment: foreign suppliers and foreign goods and
services must be given no less favourable treatment in government procurement than national suppliers
and goods and services. In other words, foreign suppliers must be given the same commercial
opportunity to bid for a government contract as domestic suppliers. In order to ensure that this basic
principle is followed and that foreign suppliers have an equal opportunity to compete, the Agreement
deals in some detail with tendering procedures, the use of technical specifications in invitations to bid,
the conditions on the qualification of suppliers eligible to bid, the publication of invitation to tender,
time limits for tendering and delivery, the contents of tender documentation provided to potential
suppliers, the submission, receipt and opening of tenders and awarding of contracts and ex post
information regarding the award of contracts.
¡Error! No se encuentra el origen de la referencia.
Annex I: Methods and sourcesAnnex I: Methods and sources
A.
The Integrated Data Base (IDB)
The main source of data on tariff reductions and bindings made by participants in the Uruguay Round
is the GATT Secretariat's Integrated Data Base (IDB) which has 44 participants (the 12 Member
States of the European Union counting as one). Because the European Union is one IDB participant,
while each of its individual Member States is a participant in the Uruguay Round, the IDB covers 55 of
the 122 participants in the Uruguay Round. The IDB covers all developed economies and transition
economies participating in the Uruguay Round, and 27 of 94 developing economy participants.
The IDB comprises (i) data on commitments made by participants on all tariff lines in their schedules
pre- and post-Uruguay Round; (ii) imports by origin denominated in United States dollars on a tariffline basis. The base year for the data on tariffs is 1986, the year the Uruguay Round was launched,
except for countries which acceded to GATT in the course of the Uruguay Round. Regarding the data
on imports, most countries submitted data in 1990, on the latest available year (1988 or 1989), and
countries which acceded to the GATT thereafter submitted data for later years. Unless otherwise
indicated, the trade values reported in tables refer to imports from most-favoured-nation (MFN) and
GSP origins, excluding imports from free trade area partners and imports under contractual preferential
arrangements. Because trade has continued to expand in the interim period, the import data generally
underestimate the current value of trade.
Participants in the Integrated Data Base (IDB)
Participant
Argentina
Australia
Austria
Brazil
Canada
Chile
China
Colombia
Costa Rica
Czech. Rep.
European Community
El Salvador
Finland
Hong Kong
Hungary
Iceland
India
Indonesia
Jamaica
Japan
Korea, Rep.
Year of
import
data
Nomenclature
86
88
88
89
88
86
92
91
88
90
88
89
88
92
91
88
88
89
91
88
88
CCCN
HS
HS
HS
HS
CCCN
HS
HS
CCCN
HS
HS
CCCN
HS
HS
HS
HS
HS
HS
HS
HS
HS
Participant
Macau
Malaysia
Mexico
New Zealand
Norway
Peru
Philippines
Poland
Romania
Senegal
Singapore
Slovak. Rep.
South Africa
Sri Lanka
Sweden
Switzerland
Thailand
Tunisia
Turkey
United States
Uruguay
Venezuela
Zimbabwe
Imports
91
88
88
91
88
86
91
89
91
89
89
90
88
91
88
88
88
89
89
89
87
90
87
Nomenclature
HS
HS
HS
HS
HS
CCCN
HS
HS
HS
CCCN
HS
HS
HS
HS
HS
HS
HS
HS
HS
HS
CCCN
HS
CCCN
¡Error! No se encuentra el origen de la referencia.
B.
Product categories (excluding crude and refined petroleum)
The industrial and agricultural product categories are defined in terms of the six-digit HS codes or the fourdigit CCCN headings, and, for agriculture and textiles and clothing, they reflect the product coverage specified
in the relevant sections of the Final Act. The major product groups (eleven for industry and twelve for
agriculture) comprehensively cover the respective sectors, while the sub-categories are composed of products
found in major product groups.
Industrial products
Agricultural products
A.
A.
Eleven major industrial product groups
Twelve major agricultural product groups
Fish and fish products
Fruit and vegetables
Wood, pulp, paper, and furniture
Coffee, tea, maté, cocoa and preparations
Textiles and clothing
Grains
Leather, rubber, footwear, travel goods
Sugars and sugar confectionery
Metals
Spices, cereals and other food prepartions
Chemicals and photographic supplies
Animals and products thereof
Transport equipment
Oilseeds, fats and oils and their products
Non-electric machinery
Cut flowers, plants, vegetable materials, lacs,
gums, etc...
Electric machinery
Beverages and spirits
Mineral products, precious metals and precious
stones
Dairy products
Manufactured articles n.e.s.
Tobacco
B.
Industrial tropical products
Other agricultural products
C.
Natural resource-based products
B.
Agricultural tropical products
Tropical beverages
Spices, flowers and plants
Certain oilseeds, vegetable oils and products
thereof
Tropical roots, rice and tobacco
Tropical nuts and fruit
¡Error! No se encuentra el origen de la referencia.
Annex II: Estimating changes in tariff escalationAnnex II: Estimating changes in tariff escalation
As is noted in the main text, tariff escalation is considered important because it causes domestic
production of the processed version of a product to be larger than it would have been in the absence of
escalation, which in turn causes the level of imports to be smaller. An analyis of the incentive to
domestic production provided by the tariff structure would involve estimating changes in the effective
rate of protection of value added. The problem is that data requirements and methodological
complications virtually rule out calculating changes in effective rates of protection, especially when a
large number of tariffs are being changed simultaneously.
There is, however, an easy short-hand approach that can provide nearly as much information
about the direction of change in effective rates of protection as a more complete and much more
complicated analysis. Under certain conditions, if tariff escalation, as measured by the "tariff wedge",
that is, the absolute difference between the tariff on the more processed version and the tariff on the less
processed version, declines as a result of trade liberalization, the effective rate of protection of the more
processed version will decline. This may be demonstrated as follows. The effective rate of protection
is defined as e = (tf - ati)/(1 - a), where tf = final good tariff, ti = intermediate good tariff, 0 = initial
period, 1 = new period, and a = input coefficient. A reduction in the tariff wedge implies that tfo - tio >
tf1 -ti1, or tfo - tf1 > tio - ti1. The change in the effective rate of protection is eo - e1 = [ (tfo - tf1) - a(tio ti1)]/(1 - a) > 0, since 0 < a < 1, and tfo - tf1 > tio - ti1. Hence eo > e1.
Even if the tariff on the more processed version is reduced by less than the tariff on the less
processed version, and the effective rate of protection increases, imports of the more processed version
may increase. This will happen if the increase in the domestic consumption of the more processed
version (stimulated by the tariff reductions) exceeds the increase in the domestic production of the more
processed version.
¡Error! No se encuentra el origen de la referencia.
Appendix Table 1Tariff commitments of developed economies by major industrial product groups1
Tariff commitments of developed economies by major industrial product groups1
Already bound
duty-free1
Currently dutiable
and/or unbound
Product category
Offered
Share
of
lines
Share
of
lines
All industrial products1
1
Share
of
imports
Share
of
lines
Share
of
imports
17
18
76
67
7
16
Fish & fish products
20
10
50
71
23
18
Wood, pulp, paper & furniture
19
31
78
55
2
14
4
1
90
91
5
8
Leather, rubber, footwear
13
15
76
53
11
31
Metals
17
35
79
57
4
8
Chemicals & photographic supplies
24
10
63
74
13
16
Transport equipment
13
15
71
31
15
54
Non-electric machinery
19
9
78
85
3
6
Electric machinery
13
5
82
83
5
12
Mineral products & precious stones
32
52
61
47
6
1
Manufactured articles n.e.s.
14
14
79
77
6
9
Industrial tropical products
19
25
75
60
5
14
Natural resource-based products
28
36
58
46
11
17
Textiles and clothing
2
Not offered
Share
of
imports
Excluding petroleum.
Figures refer to tariff lines which were fully bound prior to the Uruguay Round
Note: figures do not add up to 100 per cent due to tariff lines and imports on which specific duties are not provided in percentage terms.
¡Error! No se encuentra el origen de la referencia.
Appendix Table 2Tariff commitments on industrial products of individual developing economies1
Tariff commitments on industrial products of individual developing economies1
(Million US dollars and percentages)
Already bound
duty-free2
Participant
Currently dutiable
and/or unbound
Imports
from
MFN
origins
Offered
Share
of
lines
Share
of
lines
Argentina
Share
of
lines
Share
of
imports
0
0
100
100
0
0
Brazil
11,409
0
5
98
86
2
9
Chile
1,838
0
0
100
100
0
0
Colombia
3,530
0
0
100
98
0
2
Costa Rica
840
0
0
96
71
4
29
El Salvador
557
0
0
88
42
12
58
Hong Kong
115,549
1
0
22
23
76
77
India
10,179
0
0
61
63
38
33
Indonesia
12,603
0
0
85
68
15
32
Jamaica
1,111
0
0
100
100
0
0
40,610
1
4
88
84
11
13
1,542
0
0
10
10
90
90
Malaysia
11,270
0
0
60
77
37
22
Mexico
10,988
0
1
95
84
4
15
Peru
1,399
0
0
97
92
2
8
Philippines
9,189
0
0
56
61
44
39
Romania
3,456
6
0
85
93
10
6
613
1
0
3
1
96
99
Singapore
32,860
0
0
65
73
34
27
Sri Lanka
2,357
0
1
4
3
95
95
Thailand
14,555
0
0
66
58
32
37
Tunisia
2,976
0
0
46
68
54
32
Turkey
5,832
1
2
32
33
66
66
508
0
0
100
100
0
0
Venezuela
5,097
0
0
100
100
0
0
Zimbabwe
631
3
7
1
2
93
88
Macau
Senegal
Uruguay
1
Share
of
imports
2,981
Korea Rep.
2
Not offered
Share
of
imports
Excluding petroleum.
Figures refer to tariff lines which were fully bound prior to the Uruguay Round.
Note: Figures do not add up to 100 per cent due to tariff lines and imports on which specific duties are not provided in percentage terms.
¡Error! No se encuentra el origen de la referencia.
¡Error! No se encuentra el origen de la referencia.
Appendix Table 3Tariff and trade profiles for industrial products1 of the 44 participants in the IDB by
region
Tariff and trade profiles for industrial products1 of the 44 participants in the IDB by region
(Billion US dollars and percentages)
Percentage of imports by MFN duty range2
Group of
participants and
product group
MFN
import
value
Duty-free3
Pre
Post
Pre
5.1-10%
Post
Pre
10.1-15%
Post
Pre
15.1-35%
Post
Pre
Over 35%
Post
Pre
Post
North America
325.7
11
39
55
40
22
13
4
2
7
6
0
0
Latin America
40.3
4
2
1
0
6
1
3
3
22
87
65
7
239.7
24
37
28
34
33
18
12
8
3
2
1
1
Central/East
Europe
34.7
14
15
27
37
27
35
22
7
10
4
1
0
Africa
18.5
33
19
7
3
7
15
5
16
22
32
26
15
459.8
40
54
17
9
11
11
5
5
21
15
7
6
Western Europe
Asia
1
0.1-5%
Excluding petroleum.
Figures exclude tariff lines for which duties are not available in ad valorem terms since these lines cannot be distributed by duty ranges.
3
Figures refer to tariff lines which were duty-free prior to the Uruguay Round, including those that were fully bound, partially bound or unbound.
2
¡Error! No se encuentra el origen de la referencia.
Appendix Table 4Developed economy tariff profiles by major industrial product groups
Developed economy tariff profiles by major industrial product groups
(Million US dollars and percentages)
Product category
Percentage of imports1
Total
import
value
Duty-free2
Pre
0.1-5%
Post
Pre
5.1-10%
Post
10.1-15%
Pre
15.1-35%
Pre
Over 35%
Pre
Post
Pre
Post
Post
Post
Fish & fish products
All sources
Developing economies
18 527
10 621
21
19
24
20
42
45
44
45
18
13
21
20
12
14
8
10
7
9
3
5
0
0
0
0
Wood, pulp, paper & furniture
All sources
Developing economies
40 590
11 503
50
43
85
75
24
19
6
7
20
30
7
16
2
2
2
1
4
6
0
0
1
1
0
0
Textiles and clothing
All sources
Developing economies
66 355
33 223
2
2
4
3
6
6
14
15
27
23
29
28
30
41
25
34
33
26
27
19
2
2
1
2
Leather, rubber, footwear & travel goods
All sources
Developing economies
31 670
12 218
16
27
19
30
17
14
29
21
47
37
37
35
7
8
4
4
11
12
9
10
3
2
2
1
69 392
24 359
36
46
70
77
36
35
21
18
23
17
7
4
3
1
1
1
2
1
1
0
1
0
0
0
Chemicals & photographic supplies
All sources
Developing economies
60 958
8 157
13
12
34
29
31
25
30
32
40
43
34
39
10
15
2
0
5
5
1
0
1
1
0
0
Transport equipment
All sources
Developing economies
96 312
7 562
16
32
21
36
52
49
51
48
21
12
19
12
2
3
2
2
5
3
4
2
4
1
3
0
Non-electric machinery
All sources
Developing economies
118 126
9 786
11
9
52
55
74
74
38
34
10
13
7
10
2
3
1
1
2
1
2
1
1
0
0
0
Electric machinery
All sources
Developing economies
86 014
19 216
5
6
30
37
54
58
55
47
26
21
6
6
11
11
7
9
3
2
2
1
1
1
0
0
Mineral products & precious stones
All sources
Developing economies
72 950
22 195
59
41
81
85
28
48
9
8
10
8
8
6
3
2
1
1
2
1
1
0
0
0
0
0
Manufactured articles n.e.s..
All sources
Developing economies
76 053
10 852
15
9
49
41
38
31
37
44
40
51
10
10
5
6
3
3
2
4
1
2
0
1
0
0
Metals
All sources
Developing economies
¡Error! No se encuentra el origen de la referencia.
1
2
Figures exclude tariff lines for which duties are not available in ad valorem terms since theses lines cannot be distributed by duty ranges
Figures refer to tariff lines which were duty-free prior to the Uruguay Round, including those that were fully bound, partially bound or unbound.
¡Error! No se encuentra el origen de la referencia.
Appendix Table 5Developed economy tariff reductions on industrial products1 by individual country
Developed economy tariff reductions on industrial products1 by individual country
(Million US dollars and percentages)
Participant
Imports
from
MFN origins
Trade-weighted tariff
averages
Pre
Developed economies
Post
736,947
6.3
3.8
40
25,152
20.1
12.2
39
Austria
5,768
10.5
7.1
32
Canada
28,429
9.0
4.8
47
196,801
5.7
3.6
37
Finland
4,237
5.5
3.8
31
Iceland
334
18.2
11.5
37
132,907
3.9
1.7
56
New Zealand
4,997
23.9
11.3
53
Norway
6,192
3.6
2.0
44
South Africa
14,286
24.5
17.2
30
Sweden
10,324
4.6
3.1
33
Switzerland
10,227
2.2
1.5
32
United States
297,291
5.4
3.5
35
Australia
European Union
Japan
1
Percentage
reduction
Excluding petroleum.
¡Error! No se encuentra el origen de la referencia.
Appendix Table 6Developing economy tariff reduction on industrial products1
Developing economy tariff reduction on industrial products1
by individual country
(Million US dollars and percentages)
Trade-weighted tariff
averages
Participant
Imports
from
MFN
origins
PreUruguay
Argentina
2,981
38.2
30.9
Brazil
11,409
40.6
27.0
Chile
1,838
34.9
24.9
Colombia
3,530
44.3
35.1
Costa Rica
840
54.9
44.1
El Salvador
557
34.5
30.6
Hong Kong
115,549
0.0
0.0
India
10,179
71.4
32.4
Indonesia
12,603
20.4
36.9
Jamaica
1,111
16.5
50.0
40,610
18.0
8.3
1,542
0.0
0.0
Malaysia
11,270
10.2
9.1
Mexico
10,988
46.1
33.7
Peru
1,399
34.8
29.4
Philippines
9,189
23.9
22.2
Romania
3,456
11.7
33.9
613
13.7
13.8
Singapore
32,860
12.4
5.1
Sri Lanka
2,357
28.6
28.1
Thailand
14,555
37.3
28.0
Tunisia
2,976
28.3
34.1
Turkey
5,832
25.1
22.3
508
20.9
30.9
Venezuela
5,097
50.0
30.9
Zimbabwe
631
4.8
4.6
Korea Rep.
Macau
Senegal
Uruguay
1
PostUruguay
Excluding petroleum
Note: Pre- and post-Uruguay Round tariff averages are computed as the weighted average
of tariff rates on bound lines and applied tariff rates on unbound rates. Due to the
significance of ceiling bindings in post Uruguay Round tariff averages, no reductions are
reported
¡Error! No se encuentra el origen de la referencia.
Appendix Table 7Transition economy tariff reductions on industrial products1 by
individual country
Transition economy tariff reductions on industrial products1 by individual country
(Million US dollars and percentages)
Participant
Imports
from
MFN
origins
Trade-weighted tariff
averages
PreUruguay
Transition economies
1
PostUruguay
Percentage
reduction
34,671
8.6
6.0
30
Czech Rep.
8,862
4.9
3.8
22
Hungary
9,468
9.6
6.9
28
Poland
7,479
16.0
9.9
38
Slovak Rep.
8,862
4.9
3.8
22
Excluding petroleum
¡Error! No se encuentra el origen de la referencia.
Appendix Table 88
Canada - Changes in tariff escalation on products imported by developed
economies from developing economies
(Millions of US dollars and percentages)
Product category/stage of processing
Imports
Share of each
stage
Tariff
Pre-UR
Post UR
Abs. reduc.
Hides, skins and leather
Raw
Semi-manufactures
Finished products
Total
1
67
122
189
0.3
35.3
64.4
100.0
0.0
9.9
19.7
16.2
0.0
6.5
12.2
10.2
0.0
3.4
7.5
6.0
Rubber
Raw
Semi-manufactures
Finished products
Total
54
2
59
116
46.9
2.1
51.0
100.0
0.0
11.0
12.0
6.3
0.0
7.2
7.2
3.8
0.0
3.8
4.8
2.5
Wood
Wood in the rough
Wood based panels
Semi-manufactures
Wood articles
Total
0
36
25
10
71
0.6
50.5
34.9
13.9
100.0
0.7
8.0
1.6
9.7
6.0
0.5
5.3
1.0
5.0
3.7
0.2
2.7
0.6
4.7
2.3
Paper
Pulp and waste
Paper and paperboard
Printed matter
Paper articles
Total
6
14
15
19
54
10.5
26.4
27.7
35.4
100.0
0.0
6.5
7.4
10.3
7.4
0.0
0.0
0.0
0.0
0.0
0.0
6.5
7.4
10.3
7.4
0
0
0
0
-
n.a.
15.0
15.6
15.3
n.a.
9.0
10.7
10.0
6.0
4.9
5.3
Copper
Unwrought
Semi-manufactures
Total
1
12
13
10.1
89.9
100.0
0.6
4.6
4.2
0.2
2.8
2.5
0.4
1.8
1.7
Nickel
Unwrought
Semi-manufactures
Total
1
0
1
98.6
1.4
100.0
0.0
7.6
0.1
0.0
3.0
0.0
0.0
4.6
0.1
Aluminium
Unwrought
Semi-manufactures
Total
7
26
33
22.0
78.0
100.0
0.0
3.3
2.6
0.0
2.1
1.7
0.0
1.2
0.9
Lead
Unwrought
Semi-manufactures
Total
4
0
4
100.0
0.0
100.0
0.2
n.a
0.2
0.0
n.a
0.0
0.2
0.2
Zinc
Unwrought
Semi-manufactures
Total
4
0
4
98.1
1.9
100.0
8.4
2.4
8.3
1.4
0.8
1.4
7.0
1.6
6.9
11
0
12
97.8
2.2
100.0
0.1
0.0
0.1
0.0
0.0
0.0
0.1
0.0
0.1
0
1
1
25.8
74.2
100.0
7.7
25.5
20.9
4.9
16.3
13.4
2.8
9.2
7.5
Jute
Fibres
Yarns
Fabrics
Total
Tin
Unwrought
Semi-manufactures
Total
Tobacco
Unmanufactured
Manufactured
Total
¡Error! No se encuentra el origen de la referencia.
Appendix Table 9European Union - Changes in tariff escalation on
products imported by
European Union - Changes in tariff escalation on products imported by
developed economies from developing economies (Millions of US dollars
and percentages)
Product category/stage of processing
Imports
Share of
each stage
Tariff
Pre-UR
Post UR
Abs. reduc.
Hides, skins and leather
Raw
Semi-manufactures
Finished products
Total
237
1,062
586
1,886
12.6
56.3
31.1
100.0
0.0
4.2
7.5
4.7
0.0
3.6
5.2
3.7
0.0
0.6
2.3
1.0
Rubber
Raw
Semi-manufactures
Finished products
Total
975
24
261
1,260
77.4
1.9
20.7
100.0
0.0
5.1
5.4
1.2
0.0
2.8
3.2
0.7
0.0
2.3
2.2
0.5
Wood
Wood in the rough
Wood based panels
Semi-manufactures
Wood articles
Total
73
560
1,121
226
1,981
3.7
28.3
56.6
11.4
100.0
0.0
10.0
0.9
5.5
3.9
0.0
6.8
0.4
0.1
2.2
0.0
3.2
0.5
5.4
1.7
Paper
Pulp and waste
Paper and paperboard
Printed matter
Paper articles
Total
322
251
190
67
829
38.8
30.3
22.9
8.0
100.0
0.0
7.9
1.1
10.3
3.5
0.0
0.0
0.0
0.0
0.0
0.0
7.9
1.1
10.3
3.5
Jute
Fibres
Yarns
Fabrics
Total
15
65
50
130
11.2
50.0
38.8
100.0
0.0
5.3
9.0
6.1
0.0
0.0
4.0
1.6
0.0
5.3
5.0
4.5
Copper
Unwrought
Semi-manufactures
Total
1,606
15
1,621
99.1
0.9
100.0
0.0
6.1
0.1
0.0
4.9
0.0
0.0
1.2
0.1
Nickel
Unwrought
Semi-manufactures
Total
23
0
23
99.8
0.2
100.0
0.0
4.6
0.0
0.0
2.6
0.0
0.0
2.0
0.0
Aluminium
Unwrought
Semi-manufactures
Total
293
100
393
74.6
25.4
100.0
5.1
9.9
6.3
4.8
7.4
5.4
0.3
2.5
0.9
Lead
Unwrought
Semi-manufactures
Total
19
0
19
97.9
2.1
100.0
3.2
3.6
3.2
2.3
1.0
2.3
0.9
2.6
0.9
Zinc
Unwrought
Semi-manufactures
Total
1
0
1
77.6
22.4
100.0
3.1
8.0
4.2
2.2
5.0
2.8
0.9
3.0
1.4
224
1
225
99.5
0.5
100.0
0.0
3.2
0.0
0.0
0.0
0.0
0.0
3.2
0.0
433
36
469
92.3
7.7
100.0
20.2
51.4
22.6
16.2
25.8
16.9
4.0
25.6
5.7
Tin
Unwrought
Semi-manufactures
Total
Tobacco
Unmanufactured
Manufactured
Total
¡Error! No se encuentra el origen de la referencia.
Appendix Table 10
Japan - Changes in tariff escalation on products imported by developed
economies from developing economies
(Millions of US dollars and percentages)
Product category/stage of processing
Imports
Share of
each stage
Tariff
Pre-UR
Post UR
Abs. reduc.
Hides, skins and leather
Raw
Semi-manufactures
Finished products
Total
50
93
744
886
5.6
10.4
84.0
100.0
0.3
10.5
15.4
14.0
0.1
6.2
13.9
12.3
0.2
4.3
1.5
1.7
Rubber
Raw
Semi-manufactures
Finished products
Total
821
14
108
943
87.1
1.5
11.4
100.0
0.0
4.9
3.3
0.5
0.0
0.1
0.1
0.0
0.0
4.8
3.2
0.5
Wood
Wood in the rough
Wood based panels
Semi-manufactures
Wood articles
Total
2,060
597
924
260
3,841
53.6
15.5
24.1
6.8
100.0
0.0
17.8
4.2
4.9
4.1
0.0
8.4
2.2
2.7
2.0
0.0
9.4
2.0
2.2
2.1
194
62
41
47
345
56.3
18.1
12.0
13.6
100.0
2.2
5.2
0.3
4.2
2.8
0.0
0.0
0.0
0.0
0.0
2.2
5.2
0.3
4.2
2.8
3
7
20
30
9.3
23.8
66.9
100.0
0.0
10.0
20.0
15.8
0.0
0.0
10.0
6.7
0.0
10.0
10.0
9.1
Copper
Unwrought
Semi-manufactures
Total
1,062
97
1,159
91.6
8.4
100.0
5.7
6.6
5.8
2.6
2.7
2.6
3.1
3.9
3.2
Nickel
Unwrought
Semi-manufactures
Total
402
0
402
100.0
0.0
100.0
1.4
6.0
1.4
0.8
3.0
0.8
0.6
3.0
0.6
Aluminium
Unwrought
Semi-manufactures
Total
1,931
113
2,044
94.5
5.5
100.0
0.9
5.6
1.2
0.0
3.6
0.2
0.9
2.0
1.0
Lead
Unwrought
Semi-manufactures
Total
31
0
31
99.5
0.5
100.0
8.3
5.8
8.2
2.9
3.0
2.9
5.4
2.8
5.3
Zinc
Unwrought
Semi-manufactures
Total
60
0
60
99.4
0.6
100.0
5.6
5.9
5.6
3.1
3.0
3.1
2.5
2.9
2.5
244
0
245
99.9
0.1
100.0
0.2
3.7
0.2
0.1
2.5
0.1
0.1
1.2
0.1
110
8
118
93.4
6.6
100.0
0.0
20.4
1.3
0.0
17.3
1.1
0.0
3.1
0.2
Paper
Pulp and waste
Paper and paperboard
Printed matter
Paper articles
Total
Jute
Fibres
Yarns
Fabrics
Total
Tin
Unwrought
Semi-manufactures
Total
Tobacco
Unmanufactured
Manufactured
Total
¡Error! No se encuentra el origen de la referencia.
Appendix Table 11United States - Changes in tariff escalation on products
imported by developed economies from developing economies
United States - Changes in tariff escalation on products imported by
developed economies from developing economies
(Millions of US dollars and percentages)
Product category/stage of processing
Imports
Share of
each stage
Tariff
Pre-UR
Hides, skins and leather
Raw
Semi-manufactures
Finished products
Total
Post UR
Abs. reduc.
19
358
355
732
2.7
48.9
48.4
100.0
0.0
3.8
6.1
4.8
0.0
2.9
5.2
4.0
0.0
0.9
0.9
0.8
Rubber
Raw
Semi-manufactures
Finished products
Total
975
33
453
1,461
66.8
2.3
31.0
100.0
0.0
3.4
3.9
1.3
0.0
1.4
2.5
0.8
0.0
2.0
1.4
0.5
Wood
Wood in the rough
Wood based panels
Semi-manufactures
Wood articles
Total
16
355
318
226
915
1.8
38.8
34.7
24.8
100.0
0.1
8.0
1.3
5.7
5.0
0.0
7.4
0.1
3.2
3.7
0.1
0.6
1.2
2.5
1.3
Paper
Pulp and waste
Paper and paperboard
Printed matter
Paper articles
Total
233
150
51
286
720
32.4
20.9
7.0
39.7
100.0
0.0
1.2
0.5
4.8
2.2
0.0
0.0
0.0
0.0
0.0
0.0
1.2
0.5
4.8
2.2
1
5
48
54
2.0
10.1
87.9
100.0
0.0
3.7
0.0
0.4
0.0
0.0
0.0
0.0
0.0
3.7
0.0
0.4
Copper
Unwrought
Semi-manufactures
Total
229
142
371
61.8
38.2
100.0
0.8
2.4
1.4
0.5
2.0
1.1
0.3
0.4
0.3
Nickel
Unwrought
Semi-manufactures
Total
32
0
33
98.6
1.4
100.0
0.0
0.1
0.0
0.0
0.1
0.0
0.0
0.0
0.0
Aluminium
Unwrought
Semi-manufactures
Total
241
174
415
58.0
42.0
100.0
0.3
3.4
1.6
0.0
3.4
1.4
0.3
0.0
0.2
Lead
Unwrought
Semi-manufactures
Total
22
2
24
89.9
10.1
100.0
3.9
1.2
3.6
2.3
1.2
2.2
1.6
0.0
1.4
Zinc
Unwrought
Semi-manufactures
Total
212
7
219
96.7
3.3
100.0
1.5
2.6
1.5
1.5
1.8
1.5
0.0
0.8
0.0
239
2
242
99.0
1.0
100.0
0.0
4.2
0.0
0.0
3.0
0.0
0.0
1.2
0.0
380
6
387
98.3
1.7
100.0
10.5
8.1
10.5
7.1
3.7
7.0
3.4
4.4
3.5
Jute
Fibres
Yarns
Fabrics
Total
Tin
Unwrought
Semi-manufactures
Total
Tobacco
Unmanufactured
Manufactured
Total
¡Error! No se encuentra el origen de la referencia.
Appendix Table 12Export subsidy reduction commitments by country
Export subsidy reduction commitments by country
(Millions of US dollars)
Participant
Export subsidies
Base
European Union
Austria
Final
Product composition of export subsidies
Change
13,274
8,496
-36 Bovine meat (19%), wheat (17%), coarse grains (13%), butter (13%), other milk
products (10%)
1,235
790
-36 Live animals (45%), wheat (14%), bovine meat (13%), cheese (12%)
United States
929
594
-36 Wheat (61%), skim milk powder (14%)
Poland
774
493
-36 Meat preparations (39%), fruits and vegetables (21%)
Mexico
748
553
-26 Sugar (76%), cereal preparations (21%)
Finland
708
453
-36 Butter (25%), coarse grains (22%), other milk products (13%)
Sweden
572
366
-36 Pigmeat (21%), wheat (21%), coarse grains (17%)
Canada
567
363
-36 Wheat (47%), coarse grains (18%)
Switzerland
487
312
-36 Other dairy products (65%)
Colombia
371
287
-23 Rice (32%), cotton (20%), fruits and vegetables (23%)
South Africa
319
204
-36 Fruits and vegetables (24%), cereal preparations (14%), wheat (13%), sugar (10%)
Hungary
312
200
-36 Poultry meat (30%), pigmeat (26%), wheat (11%), fruits and vegetables (19%)
Czech Rep.
164
105
-36 Other milk products (38%), fruits and vegetables (10%)
Turkey
157
98
New Zealand
133
0
Norway
112
72
-36 Cheese (54%), pigmeat (19%), butter (12%)
Australia
107
69
-36 Other milk products (32%), skim milk powder (27%), cheese (25%), butter (16%)
Brazil
96
73
-24 Sugar (56%), fruits and vegetables (30%)
Slovak Rep.
76
49
-36 Other dairy products (19%), cereal preparations (13%), bovine meat (13%)
Romania
59
45
-24 Cereal preparations (22%), sugar (19%), bovine meat (18%), fruits and vegetables
(11%)
Israel
56
43
-24 Fruits and vegetables (59%), plants (22%), cotton (17%)
Indonesia
28
22
-24 Rice (100%)
Iceland
25
16
-36 Sheepmeat (78%), other dairy products (22%)
Cyprus
19
14
-24 Fruits and vegetables (67%), alcohol (16%)
2
1
Uruguay
Notes:
-37 Fruits and vegetables (36%), wheat (23%)
-100 Not available
-23 Rice (83%), butter (12%)
1. Commitments converted to U.S. dollars using 1990-91 average exchange
rates. Reduction commitments apply to individual product categories as defined
in this table.
2. Participants having submitted schedules which do not maintain export
subsidies include: Algeria, Antigua and Barbuda, Argentina, Bahrain, Barbados,
Belize, Bolivia, Brunei Darussalam, Cameroon, Chile, Congo, Costa Rica, Côte
d'Ivoire, Cuba, Dominica, Domincan Rep., Egypt, El Salvador, Fiji, Gabon,
Grenada, Gambia, Ghana, Guatemala, Guyana, Honduras, Hong Kong, India,
Jamaica, Japan, Kenya, Korea, Kuwait, Macau, Malaysia, Malta, Mauritius,
Morocco, Namibia, Nicaragua, Nigeria, Pakistan, Paraguay, Peru, Philippines,
St. Kitts and Nevis, Saint Lucia, St. Vincent and the Grenadines, Senegal,
Singapore, Sri Lanka, Suriname, Swaziland, Thailand, Trinidad and Tobago,
Tunisia, Zambia and Zimbabwe. Least-developed countries are exempt from
export subsidy reduction commitments.
Source: GATT Secretariat.
¡Error! No se encuentra el origen de la referencia.
Appendix Table 13Reductions in domestic support to agricultural producers
Reductions in domestic support to agricultural producers
(Million US dollars)
Participant
Base
Final
Reduction
197,721
162,497
18
European Union
92,390
76,903
17
Japan
35,472
28,378
20
United States
23,879
19,103
20
Mexico
9,669
8,387
13
Canada
4,650
3,720
20
Finland
4,186
3,349
20
Poland
4,160
3,329
20
Korea
4,086
3,543
13
Switzerland
3,769
3,016
20
Sweden
3,429
2,743
20
Austria
2,534
2,027
20
Norway
2,247
1,797
20
Venezuela
1,305
1,131
13
Brazil
1,053
912
13
Thailand
866
745
13
Czech Rep.
717
574
20
Israel
654
569
13
New Zealand
210
268
20
Hungary
613
490
20
Australia
460
368
20
Slovak Rep.
435
348
20
Colombia
398
345
13
Iceland
222
177
20
Cyprus
127
110
13
Morocco
93
81
13
Tunisia
76
66
13
Costa Rica
18
16
13
3
2
20
Total
South Africa
Source: GATT Secretariat.
¡Error! No se encuentra el origen de la referencia.
Appendix Table 1414
Bindings on industrial products of individual developing economies1
(Million US dollars and percentages)
Percentage bound
Participant
Imports
from
MFN
origins
Argentina
Post-Uruguay Round
Share
of
lines
Share
of
lines
Share
of
imports
Share
of
imports
2,981
5
21
100
100
Brazil
11,409
6
23
100
100
Chile
1,838
100
100
100
100
Colombia
3,530
1
3
100
100
Costa Rica
840
100
100
100
100
El Salvador
557
100
100
100
100
Hong Kong
115,549
1
1
24
23
India
10,179
4
12
62
68
Indonesia
12,603
10
30
93
92
Jamaica
1,111
0
0
100
100
40,610
10
24
90
89
1,542
0
0
10
10
Malaysia
11,270
0
2
62
79
Mexico
10,988
100
100
100
100
Peru
1,399
7
20
100
100
Philippines
9,189
6
9
59
67
Romania
3,456
21
10
100
100
613
29
40
32
41
Singapore
32,860
0
0
65
73
Sri Lanka
2,357
4
7
8
11
Thailand
14,555
2
12
68
70
Tunisia
2,976
0
0
46
68
Turkey
5,832
34
38
37
39
508
3
11
100
100
Venezuela
5,097
100
100
100
100
Zimbabwe
631
8
11
9
13
Korea Rep.
Macau
Senegal
Uruguay
1
Pre-Uruguay Round
Excluding petroleum.
Appendix Table 15Commitments in service activities by major country group
Commitments in service activities by major country group
(Number of countries)
Service activity
DC
LDC
Transition
Total
Service activity
DC
LDC
Transition
Total
3
30
1.
BUSINESS SERVICES
1.
BUSINESS SERVICES
A.
Professional services
E.
Rental/leasing without operators
a.
Legal
25
19
4
48
a.
Ships
22
b.
Accounting, auditing & bookeeping
25
26
4
55
b.
Aircraft
22
4
1
27
c.
Taxation
22
12
3
40
c.
Other transport equipment
25
10
3
38
d.
Architectural
25
21
3
49
d.
Other machinery and equipment
24
7
1
32
e.
Engineering
25
27
4
56
e.
Other
4
2
1
7
f.
Integrated engineering
24
11
3
38
F.
Other business services
g.
Urban planning and landscape architecture
23
11
3
37
a.
Advertising services
23
16
4
43
h.
Medical and dental
18
15
4
37
b.
Market research and public opinion polling
24
14
3
41
i.
Veterinary
21
3
3
27
c.
Management consulting
24
25
4
53
j.
Midwives, nurses, physiotherapists and para-medical
personnel
17
2
1
20
d.
Related to management consulting
24
8
2
34
k.
Other
14
3
0
17
e.
Technical testing and analysis
21
13
1
35
B.
Computer and related services
f.
Incidental to agriculture, hunting and forestry
24
11
4
39
a.
Consultancy services related to the installation of
computer hardware
24
27
4
55
g.
Incidental to fishing
21
9
1
31
b.
Software implementation
24
27
4
55
h.
Incidental to mining
21
11
2
34
c.
Data processing
24
27
4
55
i.
Incidental to manufacturing
6
5
1
12
d.
Database
23
21
4
48
j.
Incidental to energy distribution
2
1
1
4
e.
Other
23
7
2
32
k.
Placement and supply of personnel
20
4
1
25
C.
Research and development
l.
Investigation and security
20
1
1
22
a.
R&D on natural sciences
3
11
1
15
m.
Related scientific and technical consulting services
12
5
3
20
b.
R&D on social sciences and humanities
22
12
3
37
n.
Maintenance and repair on equipment1
23
11
3
37
c.
Interdisciplinary R&D
4
9
1
14
o.
Building-cleaning services
25
6
3
34
32
5
D.
Real estate services
p.
Photographic services
23
5
4
a.
Own or leased property
22
2
0
24
q.
Packaging services
20
4
3
27
b.
On a fee or contract basis
23
3
0
26
r.
Printing, publishing
21
3
5
29
s.
Convention services
22
7
0
29
t.
Other
19
11
1
31
- ¡Error!
Service activity
DC
LDC
No se encuentra el origen de la referencia. -
Transition
Transition
Total
6
0
6
24
22
3
49
General construction work for civil engineering
24
21
3
48
Installation and assembly work
23
19
3
45
D.
Building completion and finishing work
23
13
3
39
7
E.
Other
20
13
3
36
0
6
4.
DISTRIBUTION SERVICES
2
11
A.
Commission agents' services
23
4
0
27
7
0
8
B.
Wholesale trade services
25
8
4
37
25
19
4
48
C.
Retailing services
25
9
4
38
25
17
4
46
D.
Franchising
23
5
3
31
On-line information and data base retrieval
25
21
4
50
E.
Other
14
0
0
14
k.
Electronic data interchange (EDI)
25
14
4
43
5.
EDUCATIONAL SERVICES
l.
Enchanced/value-added facsimile services, incl.
store and forward, store and retrieve
9
16
4
29
A.
Primary education services
18
4
4
26
m.
Code and protocol conversion
25
12
4
41
B.
Secondary education services
19
6
3
28
n.
On-line information and/or data processing (incl.
transaction processing)
9
16
4
29
C.
Higher education services
18
3
4
25
o.
Other
4
15
2
21
D.
Adult education
18
1
4
23
D.
Audiovisual services
E.
Other education services
3
4
2
9
a.
Motion picture and video tape production and
distribution services
6.
ENVIRONMENTAL SERVICES
b.
Motion picture projection services
3
3
0
6
A.
Sewage services
23
6
2
31
c.
Radio and televiaion services
2
1
0
3
B.
Refuse disposal services
24
6
3
33
d.
Radio and television services
2
4
0
6
C.
Sanitation and similar services
23
5
3
31
e.
Sound recording
2
2
0
4
D.
Other
23
6
1
30
f.
Other
2
2
0
4
2.
COMMUNICATION SERVICES
A.
Postal services
0
3
0
B.
Courier services
4
15
3
C.
Telecommunication services
a.
Voice telephone services
0
10
0
b.
Packet-switched data transmission services
2
9
0
c.
Circuit-switched data transmission services
2
10
d.
Telex services
1
e.
Telegraph services
f.
Facsimile services
g.
Private leased circuit services
h.
i.
Total
Service activity
DC
2.
COMMUNICATION SERVICES
3
E.
Other
22
3.
CONSTRUCTION AND RELATED ENGINEERING SERVICES
A.
General construction work for buildings
10
B.
11
C.
0
12
6
0
0
6
1
8
1
Electronic mail
Voice mail
j.
3
10
0
13
0
LDC
- ¡Error!
No se encuentra el origen de la referencia. -
7.
FINANCIAL SERVICES
7.
FINANCIAL SERVICES
A.
All insurance and insurance-related services
g.
Participation in issues of all kinds of securities2
23
27
4
54
a.
Life, accident and health insurance services
h.
Money broking
24
13
0
37
24
38
4
66
3
b.
Non-life insurance services
25
37
4
66
i.
Asset management
23
23
2
48
c.
Reinsurance and retrocession
25
41
4
70
j.
Settlement and clearing services for financial assets,
incl. securities, derivative products, and other
negotiable instruments
23
13
3
39
d.
Services auxiliary to insurance (including
broking and agency services
24
36
4
64
k.
Advisory and other auxiliary financial services4
23
28
2
53
B.
Banking and other financial services (excl. insurance)
l.
Provision and transfer of financial information, and financial
data processing and related software by providers of other
financial services.
23
20
2
45
a.
Acceptance of deposits and other repayable
funds from the public
24
35
4
63
C.
Other
1
10
0
11
b.
Lending of all types, incl., inter alia, consumer
credit, mortgage credit, factoring and financing
of commercial transaction
23
35
4
62
8.
HEALTH RELATED AND SOCIAL SERVICES
(other than those listed under Professional services)
c.
Financial leasing
24
22
2
48
A.
Hospital services
15
15
2
32
d.
All payment and money trnasmission services
24
25
3
52
B.
Other human health services
2
4
1
7
e.
Guarantees and commitments
23
24
4
51
C.
Social services
13
1
1
15
f.
Trading for own account or for account of customers, whether or an exchange, in an overthe-counter market or otherwise the following:
9.
TOURISM AND TRAVEL RELATED SERVICES
98
f1.
Money market instruments
23
21
3
47
A.
Hotel and restaurants (incl. catering)
25
69
4
f2.
Foreign exchange
24
23
3
50
B.
Travel agencies and tour operators services
25
53
4
82
f3. Derivative products incl., but not limited to, futures and
options
24
11
1
36
C.
Tourist guide services
24
24
2
50
f4. Exchange rate and interest rate instrumtnes, inclu.,
prodducts such as swaps, forward rate agreements, etc.
23
15
3
41
D.
Other
1
12
0
13
f5.
22
20
3
45
24
15
0
39
Transferable securities
f6. Other negotiable instruments and financial assets, incl.
bullion
- ¡Error!
1
No se encuentra el origen de la referencia. -
10.
RECREATIONAL, CULTURAL AND SPORTING SERVICES
11.
TRANSPORT SERVICES
A.
Entertainment services (other than audiovisual)
17
16
1
34
e.
Supporting services for air transport
19
14
2
35
B.
News agency services
22
1
0
23
D.
Space transport
2
0
0
2
C.
Libraries, archives, museums and other cultural
5
4
0
9
E.
Rail transport services
D.
Sporting and other recreational services
20
15
1
36
a.
Passenger transportation
1
9
E.
Other
2
2
0
4
b.
Freight transportation
4
5
1
10
11.
TRANSPORT SERVICES
c.
Pushing and towing services
3
2
0
5
A.
Maritime transport services
d.
Maintenance and repair or rail transport equipment
19
4
3
26
a.
Passenger transportation
3
16
0
19
e.
Supporting services for rail transport services
2
3
0
5
b.
Freight transportation
3
22
0
25
F.
Road transport services
c.
Rental of vessels with their crew
14
6
0
20
a.
Passenger transportation
23
9
0
32
d.
Maintenance and repair of vessels
1
8
1
10
b.
Freight transportation
22
14
0
36
e.
Pushing and towing services
1
3
0
4
c.
Rental of commercail vehicles with operator
18
2
0
20
f.
Supporting services for maritime transport
1
6
0
7
d.
Maintenance and repair of road transport equipment
22
4
3
29
B.
Internal waterways transport
e.
Supporting services for road transport services
2
2
0
4
a.
Passenger transportation
1
4
2
7
G.
Pipeline transport
b.
Freight transportation
1
1
2
4
a.
Transportation of fuels
2
0
1
3
c.
Rental of vessels with crew
13
0
2
15
b.
Transportation of other goods
3
1
0
4
d.
Maintenance and repair of vessels
1
0
3
4
H.
Services auxiliary to all modes of transport
e.
Pushing and towing services
2
0
2
4
a.
Cargo-handling services
3
11
0
14
f.
Supporting for internal waterway transport
2
2
2
6
b.
Storage and warehouse services
21
13
0
35
C.
Air transport services
c.
Freight transport agency services
21
9
0
30
a.
Passenger transportation
0
3
1
4
d.
Other
19
8
0
27
d.
Maintenance and repair or aircraft
20
13
4
37
I.
Other transport Services
14
6
0
20
4_4
Not including maritime vessels, aircraft or other transport equipment.
2
Including under-writing and placement as agent (whether publicly or privately) and provision of service related to such issues.
3
Such as cash or portfolio management, all forms of collective investment management, pension fund management, custodial depository and trust services
4
On all the activities listed in Article 1B or MTN-TNC/W/50, incl. credit reference and analysis, investment and portfolio research and advice, advice on acquisitions and on corporate restructuring and strategy
- ¡Error!
No se encuentra el origen de la referencia. -
Appendix Table 16
Commitments on service activities of individual participants
Participant
Number of
service activities
inscribed in
schedules of
commitments
Participant
Number of
service activities
inscribed in
schedules of
commitments
Developed economies
Australia
93
Liechtenstein
78
Austria
109
New Zealand
79
Canada
92
Norway
96
European Union
106
South Africa
74
Finland
75
Sweden
89
Iceland
96
Switzerland
107
Japan
109
United States
101
Developing economies
Algeria
1
Kuwait
44
Antigua & Barbuda
17
Macau
24
Argentina
57
Madagascar
2
Aruba
22
Malaysia
69
Bahrain
4
Malta
8
Bangladesh
1
Mauritius
11
Barbados
6
Mexico
68
Belize
1
Morocco
41
Benin
13
Mozambique
17
Bolivia
6
Myanmar
3
Brazil
43
Namibia
3
Brunei Darussalam
21
Netherlands
Antilles
22
Burkina Faso
2
New Caledonia
7
Cameroon
3
Nicaragua
45
Chile
31
Niger
5
Colombia
42
Nigeria
29
Congo
4
Pakistan
35
Costa Rica
14
Paraguay
11
Cote d'Ivoire
15
Peru
27
Cuba
33
Philippines
45
Cyprus
9
Romania
45
Dominica
5
Saint Lucia
8
Dominican Republic
68
Senegal
22
Developing economies
- ¡Error!
Participant
Number of
service activities
inscribed in
schedules of
commitments
No se encuentra el origen de la referencia. -
Participant
Number of
service activities
inscribed in
schedules of
commitments
Egypt
28
Singapore
55
El Salvador
25
Sri Lanka
2
Fiji
1
St. Vincent &
Grenadines
8
Gabon
14
Suriname
5
Ghana
32
Swaziland
9
Grenada
5
Tanzania
1
Guatemala
11
Thailand
71
Guyana
17
Trinidad &
Tobago
19
Honduras
14
Tunisia
11
Hong Kong
61
Turkey
72
India
33
Uganda
2
Indonesia
7
Uruguay
24
Israel
49
Venezuela
52
Jamaica
32
Zambia
15
Kenya
22
Zimbabwe
20
Korea, Rep. of
80
Transition economies
Czech Republic
81
Poland
54
Hungary
89
Slovak Republic
82
- ¡Error!
No se encuentra el origen de la referencia. -
REFERENCESREFERENCES
Anderson, J.E. (1988), The Relative Inefficiency of Quotas, The MIT Press, Cambridge, Mass.
Balassa, B. (1985), "Exports, Policy Choices, and Economic Growth in Developing Countries after the 1973 Oil
Shock," Journal of Development Economics, vol 18(2), 23-35.
Baldwin, R. (1992), "Measurable Dynamic Gains from Trade," Journal of Political Economy 100, 162-174.
Barro, R. (1991), "Economic Growth in a Cross Section of Countries," The Quarterly Journal of Economics,
May 1991, 407-443.
Blackhurst, R. (1973), "Estimating the Impact of Tariff Manipulation: The Excess Demand and Supply
Approach, Oxford Economic Papers, March.
Brandão, A.S., and Martin, W. (1993), "Implications of Agricultural Liberalization for the Developing
Countries," World Bank working paper (March).
Brown, D.K., (1994), "Properties of Applied General Equilibrium Trade Models with Monopolistic Competition
and Foreign Direct Investment," in J.F. Francois and C.R. Shiells, eds., Modelling Trade Policy, Cambridge
University Press: Cambridge.
Brown, D.K., Deardorff, A.V. and Stern, R.M. (1992), "A North American Free Trade Agreement: Analytical
Issues and a Computational Assessment," The World Economy 15(1), 15-29.
Ethier, Wilfred (1982), "National and International Returns to Scale in the Modern Theory of International
Trade," American Economic Review 72, (June), p. 950-959.
Clements, K.W., and Sjaastad, L. (1985), How Protection Taxes Exporters, Thames Essays no. 39, Gower for
the Trade Policy Research Centre.
Dollar, D. (1992), "Outward-oriented Developing Economies Really Do Grow More Rapidly: Evidence from 95
LDCs, 1976-1985," Economic Development and Cultural Change, vol 40, 523-544.
Easterly, W. (1993), "How Much Do Distortions Affect Growth," Journal of Monetary Economics, vol 32, 126.
Edwards, S. (1992), "Trade Orientation, Distortions and Growth in Developing Countries," Journal of
Development Economics, vol 39, 31-57.
Feder, G. (1983), "On Exports and Economic Growth," Journal of Development Economics, 59-73.
Flam, H. and Nordstrom, H. (1994), "The Single Market(s) for Cars in Europe," Institute for International
Economic Studies, Stockholm, mimeo.
Francois, J.F., McDonald, B., and Nordström, H. (1993a), "The Growth Effects of the Uruguay Round,"
Uruguay Round background paper, GATT: Geneva.
Francois, J.F., McDonald, B., and Nordström, H. (1993b), "Economywide Effects of the Uruguay Round,"
Uruguay Round background paper, GATT: Geneva.
- ¡Error!
No se encuentra el origen de la referencia. -
Francois, J.F., McDonald, B., and Nordström, H. (1994), "The Uruguay Round: A Global General Equilibrium
Assessment" working paper, GATT: Geneva.
Francois, J.F. and Shiells, C. (1993), "The Dynamic Effects of Trade Liberalization," U.S. International Trade
Commission pub. 2608, February.
General Agreement on Tariffs and Trade (1993), An Analysis of the Proposed Uruguay Round Agreement, with
Particular Emphasis on Aspects of Interest to Developing Countries, MTN.TNC/W/122, MTN.GNG/W/30,
Uruguay Round Background Paper, Geneva.
Goldin, I., Knudsen, O., van der Mensbrugghe, D. (1993), "Trade Liberalisation: Global Economic
Implications," OECD and the World Bank, Paris.
Grossman, G.M. and Helpman, E. (1991), Innovation and Growth in the Global Economy, MIT Press:
Cambridge.
Haaland, J. and Truls C.T. (1994), "The Uruguay Round and Trade in Manufactures and Services. General
Equilibrium Simulations of Production, Trade and welfare Effects of Liberalization," CEPR discussion paper
1008.
Hamilton, C. (1986) "An Assessment of Voluntary Restraints on Hong Kong's Exports to Europe and the United
States," Economica, vol. 53, August.
Hamilton, C. (1990), Textiles Trade and the Developing Countries: Eliminating the Multi-Fibre Arrangement
in the 1990s, World Bank, Washington DC.
Harris, R.G., (1986) "Market Structure and Trade Liberalization: A General Equilibrium Assessment," in T.N.
Srinivasan and J. Whalley, eds., General Equilibrium Trade Policy Modelling, MIT Press: Cambridge.
Harris, R.G., (1984) "Applied General Equilibrium Analysis of Small Open Economies with Scale Economies
and Imperfect Competition," American Economic Review 74, 1016-31.
Harrison, G., Rutherford, T. and Tarr, D. (1994) "Product Standards, Imperfect Competition, and Completion of
the Market in the European Union," The World Bank International Economics Department, Policy Research
Working Paper 1293, April.
Harrison, A. (1993), "Openness and Growth: A Time-Series, Cross-Country Analysis for Developing
Countries," Manuscript, The World Bank, October.
Hertel, T. and Tsingas, M. (1993), "GTAP Model Documentation," in Shortcourse in Global Trade Analysis,
mimeo, Perdue.
IMF (1993), "Trade as an Engine of Growth," in World Economic Outlook, May, 70-80.
Kirmani, N., Molajoni, P., and Mayer, T. (1984), "Effects of Increased market Access on Exports of Developing
Countries," IMF Staff Papers, vol. 31 no. 4, December.
Krueger, A. (1978), Foreign Trade Regimes and Economic Development: Liberalization Attempts and
Consequences. Cambridge, MA: Ballinger Pub. Co. for NBER.
Laird, S. and Yeats, A. (1988), "Quantitative Methods for Trade Barrier Analysis," mimeo, World Bank,
Washington, DC.
- ¡Error!
No se encuentra el origen de la referencia. -
Leamer, E. (1988), "Measure of Openness," in R. Baldwin (ed.) Trade Policy and Empirical Analysis.
University of Chicago Press, Chicago, IL.
Lee, J. (1993). "International Trade, Distortions, and Long-Run Economic Growth," IMF Staff Papers, 40, 299328, June.
Levine, R. and Renelt, D. (1992), "A Sensitivity Analysis of Cross-Country Growth Regressions," The
American Economic Review, vol 82(4), 942-963, September.
Matin, K. (1992), "Openness and Economic Performance in Sub-Saharan Africa; Evidence from Time-Series
Cross-Country Analysis," WPS 1025, World Bank, November.
de Melo, J. and Tarr, D., (1992) A General Equilibrium Analysis of U.S. Foreign Trade Policy, MIT Press:
Cambridge, MA.
Michaely, M. (1977), "Exports and Growth: An Empirical Investigation," Journal of Development Economics,
vol 4(1), 49-53.
Norman, V.D., (1990), "Assessing Trade and Welfare Effects of Trade Liberalization: A Comparison of
Alternative Approaches to CGE Modelling with Imperfect Competition," European Economic Review 34, 72545.
Nguyen, T.T., Perroni, C., and Wigle, R.M. (1993), "An Evaluation of the Draft Final Act of the Uruguay
Round," The Economic Journal, vol 103(421), 1540-1558.
OECD (1990), PSE/CSE Calculations, Paris (mimeograph).
OECD (1993), "Assessing the Effects of the Uruguay Round," Trade Policy Issues Paper 2, Paris.
Roland-Holst, D.W., Reinert, K.A. and Shiells, C.R., (1994), "A General Equilibrium Analysis of North
American Economic Integration," in J.F. Francois and C.R. Shiells, eds., Modelling Trade Policy, Cambridge
University Press: Cambridge.
Silberston, Z.A. (1984), The Multifibre Arrangement and the U.K. Economy, Her Majesty's Stationery Office,
London.
Syrquin, M., and Chenery, H., (1989), "Three Decades of Industrialization," The World Bank Economic
Review, vol 3(2), 145-181.
Trela, I. and Whalley, J. (1990), "Unravelling the Threads of the MFA," in C. Hamilton, ed., Textiles Trade
and the Developing Countries: Eliminating the Multi-Fibre Arrangement in the 1990s, World Bank,
Washington DC.
UNCTAD (1986), Protectionism and Structural Adjustment, United Nations, New York.
UNCTAD, (1994a) "The Outcome of the Uruguay Round: An Initial Assessment," Trade and Development
Report, Geneva.
UNCTAD, (1994b)"The Outcome of the Uruguay Round: An Initial Assessment," supporting papers to the
Trade and Development Report, Geneva.
- ¡Error!
No se encuentra el origen de la referencia. -
U.S. Department of Agriculture (1990), "Estimates of Producer and Consumer Subsidy Equivalents:
Government Intervention in Agriculture 1986-87," Statistical Bulletin no. 803, Agricultural Trade Analysis
Division, Economic Research Service, Washington.
United Stated International Trade Commission (1993), The Economic Effects of Significant U.S. Import
Restraints Phase I: Manufacturing, USITC publication 2222, Washington DC, October.
U.S. International Trade Commission (1991), "The Economic Effects of Significant U.S. Import Restraints,
Phase III: Services, with a CGE Analysis of Significant U.S. Import Restraints," September.
United Stated International Trade Commission (1993), The Economic Effects of Significant U.S. Import
Restraints, USITC publication 2699, Washington DC, November.
Whalley, J. (1992), "The Multifibre Arrangement and China's Growth Prospects," in K. Anderson, ed., New Silk
Roads, Cambridge University Press.
World Bank, (1987), The World Development Report 1987, Oxford University Press.
Yang, Y. (1992), "The Impact of MFA on World Clothing and Textile Markets with Special Reference to
China," Ph.D. dissertation, Australian National University, Canberra.
Yang, Y. (1994a), "Trade Liberalization with Externalities: A General Equilibrium Assessment of the Uruguay
Round," mimeo.
Yang, Y. (1994b), "The Impact of the MFA Phasing Out on World Clothing and Textile Markets," Journal of
Development Studies 30, July.


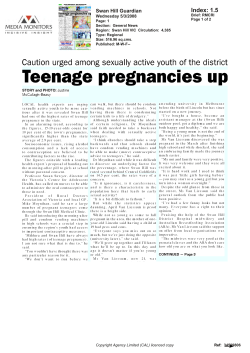


© Copyright 2026