
Document 3815
Monroe County Health Department
The Health of
Monroe County
A Health Status Assessment and Profile Report
2012
Improving the health of the public through
preparedness, education, prevention and
service
1100 Simonton Street, Key West, FL 33040
1
Community Health Assessment and Status Profile
Monroe County, Florida
Table of Contents
Contents
Map of Monroe County, Florida
Introduction and Executive Summary
1. Population Characteristics
Figures
1.1 Total Monroe County Population by Sex
1.2 Land Mass to Water Mass Ratio
1.3 The Demographic Transition
1.4 Monroe County Population over Time
1.5 Monroe County by Race
1.6 Special Population Groups
Tables
1.1 Population by Age
1.2 Median Age and Age Groupings
2. Quality of Life
Environmental Health and Health Behavior
Figures
2.1 Essential Services of Public Health
2.2 The Local Public Health System
2.3 Marital Status of Residents
2.4 Sea Level Changes at High Tide on the Atlantic Coast
Tables
2.1 Residents who are “Very Satisfied” or “Satisfied” with their Lives
2.2 Behavioral Risk Factors
2.3 Social and Emotional Support by Income
2.4 Household Composition
2.5 Religious Affiliations
2.6 Traffic Estimations
2.7 Food and Lodging Licenses in Monroe County
Page
5
6
9
9
9
10
11
12
13
12
12
15
16
16
18
19
15
15
17
18
18
20
21
3. Health Care Resources
23
Figures
3.1 Medicaid Providers in Monroe County
24
3.2 Emergency Room Discharges by Type: Fisherman’s Hospital
25
3.3 Emergency Room Discharges by Type: Lower Keys Medical Center
25
3.4 Emergency Room Discharges by Type: Mariners Hospital
25
3.5 Service Providers per 100,000 Monroe County Residents compared to the State 26
3.6 Non-Fatal Emergency Room Visits by Cause
27
3.7 Health Care Facilities
27
Tables
3.1 Access to Services by Age
23
2
4. Socio-Economics and Socio-Demographics
Figures
4.1 Monroe County Household Incomes
4.2 People Living in Group Quarters
4.3 Monroe County Homeless Population
4.4 Employment Industries in Monroe County
4.6 Comparison of per Capita Income: County, State, Nation
4.7 Educational Attainment
4.8 Crimes in Monroe County 2010-2011
4.9 Admissions to Prison
4.10 Insurance Coverage of Residential Population
4.11 Monroe County Eligibility for Free and Reduced Lunch
4.12 State of Florida Eligibility for Free and Reduced Lunch
Tables
4.1 Monroe County Residents’ Earnings
4.2 Monroe County Household Demographics
4.3 Fair Market Rents
4.4 Cost of Living Regionally
4.5 Cost of Living Monroe County
4.6 Cost of Living compared with other U.S. Cities
4.7 Class of Workers in Monroe County
4.8 Mode of Transportation to Work
4.9 Per Capita Income
4.10 Individuals below Poverty by Race
4.11 Number of Families below Federal Poverty Level by Zip Code
29
29
31
31
32
33
34
34
34
35
36
36
29
29
30
30
30
30
32
33
33
33
34
5. Injuries, Violence, and Community Safety
37
Figures
5.1 Frequency of Unintentional Injuries by Type
40
5.2 Oversea Highway/U.S. Highway 1, at Bahia Honda Bridge
39
5.3 Monroe County Crash Fatalities by Type
40
5.4 Factors Influencing Fatal Crashes
40
5.5 Multi-Year Trend in Reduction of Alcohol-Related motor Vehicle Crashes
41
Tables
5.1 Four County Comparison of Domestic Violence Rates
37
5.2 Domestic Violence Incidences by Offense
37
5.3 Unintentional injuries Age Adjusted Death Rates 2008-2009
37
5.4 Multi-Year Comparison Age Adjusted Death Rate for Motor Vehicle Crashes and
Alcohol-Related Motor Vehicle Crashes
39
6. Mortality and Morbidity
Chronic Diseases
Communicable Diseases
Figures
6.1 Low Infant Birth Weight four County Comparison
6.2 Infant Mortality Four County Comparison
6.3 Leading Causes of Death in Monroe County
6.4 Chronic Disease Death Counts 2008-2010
42
43
43
45
45
3
6.5 Age Adjusted Death Rate for Heart Disease Multi-Year Trend
46
6.6 Physical Activity of Monroe County Residents 2007
46
6.7 Age Adjusted Death Rates for Four Common Chronic Diseases
46
6.8 Asthma Age Adjusted Death Rate Twenty Year Period
47
6.9 Age Adjusted Death Rates for Select Cancer Types
47
6.10 Age Adjusted Death Rate for HIV in Monroe County 1985-2010
49
6.11 Adults who received a Flu Vaccination in 2010
51
Tables
6.1 Overall Health Experience of Monroe County Residents 2010
42
6.2 Death Indicators by Four Counties
44
6.3 Year of Potential Life Lost; Four county Comparison
44
6.4 Leading Causes of Death in Monroe County over Twenty Years
44
6.5 Obesity and Inactivity: County, State, and National Benchmark
47
6.6 Age adjusted death Rates for Cancer Types: County, State, & National Benchmark 48
6.7 Cancer Screening Rates: County, State, and National Benchmark
48
6.8 Risk Exposures and Positive HIV Tests, 2011
49
6.9 Select Communicable Diseases: a Four County Comparison; 2010
50
7. Infants, Children and Youth
52
Figures
7.1 Infant Deaths per 1,000 Live Births; 3 Year Comparison of County and State 52
7.2 Utilization of Foster Care in Monroe County
53
7.3 Comparison of Four Counties and the State: Children Experiencing Child Abuse 53
7.4 Percent of Monroe County Students participating in Extra-Curricular Activities 54
7.5 Lifetime Substance Use among Monroe County Youth 2010
54
7.6 Student Use of Substances in the Last 30 Days, 2010
55
7.7 3-Year Rates for Reported STD Cases among 15-19 year olds, 2008-2010
55
7.8 Obesity and Overweight Multi-Year Trend in Florida and the United States 56
7.9 Obesity among Monroe County Youth
56
7.10 Births with Adequate Pre Natal Care
58
7.11 Services of the Florida Keys Children’s Shelter: Residential and Non-Residential 59
7.12 Residential Placements
59
7.13 Non- Residential Placements
59
Tables
7.1 Violent Acts in School Activities 2009-2010; Four Counties and the State
52
7.2 Enteric Diseases Children 0-6 years old
55
7.3 Diabetes Hospitalizations; 3-Year Rate per 100,000 persons by Age: County and
State Comparison
57
7.4 Asthma Hospitalizations; 3-Year Rate per 100,000 persons by Age: County and State
Comparison
57
7.5 Families below Federal Poverty Level with Children by Zip Codes
57
7.6 Asthma Prevalence by Zip Codes
57
8. Senior Health
Figures
8.1 Monroe County Senior Population by Sex
8.2 Reasons for Emergency Department Visits Non-Fatal Unintentional Injuries
8.3 Hip Fractures among the Population over 65
60
60
60
61
4
8.4 Unintentional Falls among the Population over 65
8.5 Where do Seniors Live?
Tables
8.1 Monroe County Seniors by Age and Sex
8.2 Health Experiences of Monroe County Seniors
8.3 Self-Reported Senior Health Status
61
62
9. Conclusions
Figures
9.1 Healthy People 2020
63
References
67
60
61
62
63
Appendices
71
A. County Health Services Inventory
71
B. Monroe County 2011 Waste Consumption and Collection Report
77
C. Florida Keys Beach Water Sampling Test Sites
78
D. Key West Greater Chamber of Commerce, 2008, Key West Vision 2020: Progress
Review
79
E. Monroe County Health Department Division of Environmental Health Service Counts
2011-2012
91
5
Map of Monroe County Florida
The map displays both the mainland and island chain portions of Monroe
County. The string of islands known as the Florida Keys is connected by a series of
bridges along the Overseas Highway, also known as U.S. Highway 1. The mainland
portion of the County encompasses Everglades National Park, a protected wildlife area,
and is largely uninhabited by human populations. The majority of Monroe County
residents reside in the southern end of the County, in the Lower Keys. Florida Bay and
the Gulf of Mexico are the western borders and the Atlantic Ocean is the eastern border,
the Straits of Florida lie to the south of Monroe County.
Mainland
Monroe
County
↔
Miami-Dade
County ↕
↔
Gulf of
Mexico
Upper Keys
Florida Bay
Atlantic
Ocean
Middle Keys
Lower Keys
Source: Florida Center for Instructional Technology, 2009.
6
Introduction and Executive Summary
A Health Status Assessment is used to highlight the relationship between health
status and the determinants of health, unite communities around issues and motivate
leaders to address those issues. This Status Assessment Profile Report indicates that the
overall health of Monroe County’s residents is good in spite of its rural isolation, low
ratio of service providers, and high risk behavior patterns. Three Florida Counties were
selected for comparison of health statistics and health trends: Okaloosa County, a large
rural county with a similar geographic size; Nassau County a rural county, smaller in
geographic size but with a similarly sized population; and Hillsborough County, a large
metropolitan county to which large migrations from Monroe County have taken place
over time.
Monroe County, Florida has a 2012 residential population of nearly 73,000 people
and a greater volume of water than land; much of the area it encompasses is
uninhabitable conservation land (City Data, Monroe County, Florida, 2012). The county
seat is located in Key West, 150 miles from the mainland and the Lower Keys is home to
the greatest concentration of persons in the County. The Monroe County Tourist
Development Council indicates that an additional 3.8 million persons visit the Florida
Keys on an annual basis primarily during winter months. This influx impacts the quality
of life of residents by inflating the population density, increasing demands on
infrastructure, services, and natural resources (potable water), and creating vehicular
noise, traffic pressures, and pollution. Additionally, tourism provides jobs for 35% of the
County’s residents (Florida Legislature, Office of Economic and Demographic Research,
2012).
Monroe County is 72.4% White, 19.6% Hispanic and 6% Black. Males
outnumber females 1.15:1 in the County, while in both the State and the Nation, the
number of females is higher than the number of males (Florida CHARTS, 2012) and
(U.S. Census, 2010). In the United States 2010 census the median age for American
adults was 37.2 years; Monroe County has a slightly older population with a median age
of 46.3 years. Nearly 40% of the total population of Monroe County is within the age
range of 45-64 years of age (U.S. Census, 2010). In Monroe County 13% of the 2012
total population are veterans, according to the U.S. Dept. of Veteran’s Affairs, 1.4% of
the total 2012 County population is homeless, according to the Southernmost Homeless
Assistance League, and a 17% qualify as Special Needs population, as estimated by the
Monroe County Social Services Office; only a fraction of whom are registered with the
County’s Special Needs Registry. The population is educated; 90% of persons over 25
hold a high school diploma or equivalent, 23% have had some college education, nearly
18% have earned a Bachelor’s degree and 5% hold a Master’s Degree (Miami Matters,
Monroe Demographics, 2012).
Monroe County has a long history of being a haven for the socially marginalized
from oppressed indigenous peoples, pirates and freed slaves, to Navy enlisted men,
wreckers, wayward sailors, intellectuals, and rum runners. Monroe County continues to
appeal to a diverse cultural mix of peoples; there is a milieu of faith-based groups, every
gender variation known to the human family is accepted as family, a thriving arts
community is surrounded by a pristine environmental landscape which is reflected in the
uniquely creative environment, and balance is drawn between high end resort lifestyles
and minimalist bohemia. This is the One Human Family of Monroe County; where
tolerance is the law.
7
In Monroe County 24% of individuals are living at or below 200% of the Federal
Poverty Level. Among those individuals 47.4% are uninsured including 13,000 adults
and 4,600 children. Of the 18,945 families in Monroe County in 2012, 6.7%, or 1,281 of
those families are living at or below the Federal Poverty Level; 54% of those (628
families) are families with children (Miami-Dade Matters Demographic data, Monroe
2012.) For the existing providers, rates are often significantly lower for reimbursement
than for direct pay and therefore many doctors in the County are simply refusing new
Medicaid patients or relocating their practices outside of Monroe County. As a result,
Monroe County is considered a ‘Medically Underserved Area’ with a score of 45.5
(HRSA, 2012) and a ‘Health Professional Shortage Area’ (HPSA) for Mental Health
(Health Resource Services Administration [HRSA], 2012). Each of the three population
area, the Lower, Middle, and Upper Keys has a hospital which provides inpatient and
outpatient services. The hospitals in the Upper and Middle Keys do not provide birthing
or child delivery services. Neurosurgical procedures and other highly specialized surgical
and medical services are not available through the County’s hospitals and referrals are
made to medical specialists in the mainland, often in Miami-Dade County. For all
categories of practicing physicians the County rate per 100,000 persons is 271.4, as
compared to the State at 335.7 per 100,000 persons. For a number of conditions, Monroe
County residents can receive diagnosis within the county of their residence, but will need
to travel outside of the county for treatment services.
Risk plays a major role in the overall health of residents, simply electing to live in
a County where the seat is 150 miles from the mainland and more than one third of the
calendar year is spent under threat of natural disaster from hurricanes, assumes a level of
acceptable risk. External Causes of Death, or Injuries, are a major contributor to the
number of years of life lost due to premature death (death before 75) in Monroe County
and were the third leading cause of death for 2011 (Florida CHARTS, 2012). Violence is
a social problem which influences overall community health. In Monroe County the 2011
rate for Aggravated Assault exceeds the State rate per 100,000 persons: 349.8:325.9; the
2011 rate for Forcible Sex Offenses in Monroe County was 39.9, lower than the State rate
of 52.2 per 100,000 persons; and is also lower for Murder at 4.1 in the County and 5.2 in
the State per 100,000 persons. In 2010, twenty-one fatalities were recorded due to motor
vehicle crashes in Monroe County and three fatalities of pedal cyclists (National Traffic
Highway Safety Administration, 2012). As the one vehicular way in and one vehicular
way out of the County the road presents unique and dangerous conditions due to the high
volume of visitor traffic accommodated by the highway and the close proximity of
county residential areas to this highway. The binge drinking rates for Monroe County
remain alarmingly high, 25% of the total 2010 population engaged in this high risk
activity, higher than National and State rates. Concurrently, 21% of County residents
smoke tobacco.
The recorded HIV age adjusted death rate per 100,000 persons in 1995 for
Monroe County was 62.4; in 2010 it was 11.5, displaying a significant decrease over the
fifteen year period. Monroe County rates for other communicable disease such as TB and
Hepatitis C have also decreased. Florida CHARTS data indicates a decline in mortality
rates for chronic diseases in Monroe County since 2000. Of all chronic diseases cancer
rates remain the highest. Monroe County had the highest rate for the percent of deaths
before age 65 when compared to the State and relevant counties. The leading causes of
death in Monroe County are cancers, heart disease, and unintentional injury (Florida
CHARTS, 2012) (see Table 6.4).
8
In Monroe County 79.4% of Middle School and 79.6% of Monroe County’s
High School students stated that they felt safe at school during the 2010 school year.
Foster care utilization rates for Monroe County are higher than those state-wide. For
children 1-5 years old the rates indicate 10.1/1,000 children are in foster care in Monroe
County, for children 5-11 years old it is 7.2/1,000 in the County, and for children 12-17
years old the County rate is 10/1,000. Records from Kids Come First indicate over 370
homeless youth in Monroe County. The ratio of school nurses to students is better in
Monroe County than it is state-wide; at 1:857 in Monroe County and 1:2,536 in Florida.
According to Florida CHARTS data, Monroe County youth, ages 5-18, experienced
lower rates of hospitalization for both asthma and diabetes between 2008 and 2010 than
in the State of Florida in general, but 5-11 year olds experienced higher rates of abuse in
Monroe County (Florida CHARTS, 2012).
The Florida Youth Substance Abuse Survey found that among Monroe County’s
Youth population 69.4% of 15-17 year olds surveyed had ever used ‘alcohol or any illicit
drug’. A protective factor for good health behaviors and positive health consequences is a
sense of belonging and participation at the community level. In Monroe County nearly
50% of students participate in school sports and 35% in sports organized outside of
school. Monroe County checks in at the low end of the childhood overweight/obesity
scale in Florida; 11.5% of Middle School students are obese, along with 10% of Monroe
County High School students; and for preschool aged children 19.8% are obese. Monroe
County had the lowest rate (19.8%) of all counties in Florida for the 2-4 year old age
group.
Among the elder population living in Monroe County 97.2% of persons over 65
years of age stated that they are ‘satisfied’ or ‘very satisfied’ with their lives and 82.3%
of Monroe County Seniors self proclaim ‘good to excellent’ health (Florida CHARTS,
2012). Less than 35% of persons over 65 in Monroe County are limited in any way
because of a physical, mental, or emotional problem, and 11.6% use special equipment
because of a health problem. Of the nearly 13,000 senior citizens calling Monroe County,
Florida home, 8.2% have previously had a stroke and 24.3% have previously had a heart
attack. The top five reasons seniors from Monroe County were admitted to the
Emergency room in 2010 were falls, struck by or against some object, a cut or pierce,
pedal cyclist (bicycle related injury), and overexertion (Florida Office of Injury
Prevention, 2012).
Overall, Monroe County residents are as healthy and in some areas
healthier, as their counterparts state and nation-wide, but experience risk-related health
consequences more frequently than other populations in the State and Nation (Florida
CHARTS, 2012). Moreover, in spite of the fact that only about 60% of persons 18-44 and
about 80% of persons 45-64 have a personal doctor, 86% of all residents claim ‘good to
excellent overall health’ and 89.7% ‘experience good physical health’ (Florida CHARTS,
2012). For the top fifteen leading Causes of Death in the County over the last twenty
years rates are declining for the majority of causes (Florida CHARTS, 2012).
9
1. Population Characteristics
Total Monroe County Population 2012: 72,391 persons
Population in Monroe County 2000: 79,589
Percent decrease: -9.04% between 2000 and 2012
Males: 38,763
Females: 33,628
80000
60000
40000
20000
0
Monroe County
Males
Total Monroe County Population 2012
Females
Figure 1.1 Source: Miami Matters, 2012, Monroe Demographics.
Monroe County is home to less than 1% (.4%) of the state’s population, which in
2010 was 18,788,795 million persons, and is the state’s 39th most populous of its 67
counties (Florida CHARTS, 2012, and Florida’s Office of Economic and Demographic
Research, 2012). The population density of the County approximates 73 people per
square mile, whereas the State is 348.6 persons per square mile (Florida, CHARTS,
2012).
Land Mass and Water Mass in Monroe
County
Square Miles of Land
Square Miles of Water
Land area: 997 sq. mi.
Water area: 2740.2 sq. mi
Population density: 73 people per square mile (average)
Figure 1.2 Source: City-Data, Monroe County, 2012.
10
The Demographic Transistion: closing the gap
Latin America and the Caribbean
North America
90
80
70
60
50
40
30
20
10
0
Growth Rate
1950
Growth Rate Total Fertiltiy Total Fertility
2000
rate 1950
rate 2000
Life
expectancy
1950
Life
Expectancy
2000
Figure 1.3 Source: Merson, et al., Global Health, Table 4.1, 2012.
Monroe County is uniquely situated on the Southern edge of North America and
encompasses North America’s Southernmost City, Key West, Florida. Like much of
South Florida, Monroe County has served as a melting pot of North and South, offering
refuge to Cuban citizens during the Muriel Boatlift from Cuba, providing a solid place of
respite for Haitians fleeing the tragedies of their homeland, supporting an economic
plateau for West Indian and Caribbean trade, and serving as a ‘Mecca’ of educational,
economic, and social opportunities for persons fleeing the war torn nations of Central and
South America, while proving to be a stepping stone for the Middle Class of both Latin
America and the Caribbean. The figure above exhibits the closing of the demographic
gap between North and South, and in between the two we find Monroe County.
In Global Health (2012), Merson, Black and Mills describe what is known as the
‘demographic transition’, a theory of societal development which contends that
populations experience a “low initial growth, followed by explosive increase, and finally
by a steady decline” (Merson, et al., 2012). The historic period just after World War II is
represented in the population chart by a rapid increase in population in Monroe County
between 1940 and 1950. From this time until 2000 we see a steady increase in population
numbers for Monroe County, with a peak in population in the year 2000, followed by
the beginnings of a population decline. Population numbers for 1990 and 2010 are
similar, forming a plateau around the peak. As a microcosm of larger trends, Monroe
County models the demographic transition exhibited by its larger surrounding areas of the
Latin America and the Caribbean, and mainland North America. A leveling off in both
regions is reflected in the plateau effect seen in Monroe County.
11
Population changes for Monroe County 1840-2012
1840
1850
1860
80000
70000
1870
1880
1890
1900
60000
1910
1920
50000
40000
30000
1930
1940
1950
1960
1970
20000
1980
1990
10000
2000
2010
0
2012
Figure 1.4 Source: University of South Florida, College of Education, Center for
Instructional Technology, 2005 and U.S. Census, 2010.
By race, Monroe County is 72.4% White, 19.6% Hispanic and 6% Black. Less
than 2% of the population claims two or more races according to the 2012 census, and
less than 1% of the population associates themselves as Asian. According to the US
Census definition, a linguistically isolated household is, “one in which no one 14 years
old and over speaks only English or speaks a non-English language and speaks English
'very well.'”(US Census, Florida CHARTS). In Monroe County, Florida 5.2% of all
households in 2010 were considered linguistically isolated; in the state the rate is 7.2%
of all households (Florida CHARTS, 2012).
12
Non-White Population of by Race 2010
20.00%
Hispanic
15.00%
Black
Asian
10.00%
other
2 or more races
5.00%
0.00%
Figure 1.4 Source: census.gov
2012 Population by Age
Category
Median ►
Monroe
0-4
3,496 (4.83%)
5-9
3,008 (4.16%)
10 - 14
2,807 (3.88%)
15 - 17
2,067 (2.86%)
18 - 20
1,900 (2.62%)
21 - 24
2,892 (3.99%)
25 - 34
8,514 (11.76%)
35 - 44
9,824 (13.57%)
45 - 54
13,155 (18.17%)
55 - 64
12,636 (17.46%)
65 - 74
6,738 (9.31%)
75 - 84
3,720 (5.14%)
85+
Table 1.1 Source: Miami Matters, Demographics, Monroe, 2012.
According to the US census data, youth and seniors are minorities in Florida and
the ratio of men and women is nearly equal. In Monroe County, Florida the trends are
similar, with youth comprising 15.1% of the total population and seniors 65 and older
comprising 17.1%; however in Monroe County males slightly out number females.
According to 2012 demographic data from Miami Dade Matters, which monitors and
reports demographic information for Miami-Dade and Monroe Counties, there are 38,763
males and 33,628 females; a ratio of 1.15:1 males to females (Miami Matters, 2012).
Median Age: 46.3 years
Persons 18 years of age or older: 61,013
Persons under 18 years of age: 11,378
Persons 65 and over: 12,092
Table 1.2 Source: Florida CHARTS, 2012.
13
In the United States 2010 census the median age for American adults was 37.2
years; Monroe County has a slightly older population with a median age of 46.3 years.
The most predominant age groups in the County are those comprised of persons 45-54
years of age, which is 18.7% of the total population and the age group from 55-64 years
old, at 17.46%. These two groups combined, with ages ranging from 45-64, equal nearly
40% of the total population of Monroe County (U.S. Census, 2010).
Generally more affluent than the previous generation of Depression Era children,
the Baby Boomers1 will require new and more extensive services than generations past;
placing a greater demand on the health care system to provide care, and on the public
health system to maintain and support the conditions of health within the community.
Special Population Groups
10000
8000
6000
Registered
Special Needs
Homeless
4000
Veterans
2000
0
Figure 1.6 Sources: Monroe County Special Needs Registry, Southernmost
Homeless Assistance League, and the Veterans Association.
In Monroe County there are 162 persons registered with the Agency for Persons
with Disabilities, 40 of those persons are children and 122 are adults. This count does not
include all persons with Special Needs in the County, but only those registered with the
Agency for receipt of social services. The Agency for Persons with Disabilities is
supported by the Florida Department of Children and Families. According to estimates
from the Monroe County Social Services Office nearly 17% of Monroe County residents
could qualify for the Special Needs Registry. Individuals are eligible to be registered with
the Special Needs Registry if they are frail, elderly, medically needy, and/or disabled and
are not served in or by a residential facility program.
1
The Baby Boom includes people born from mid-1946 to 1964. The Baby Boom is
distinguished by a dramatic increase in birth rates following World War II and comprises
one of the largest generations in U.S. history. For more information, see Howard Hogan,
Deborah Perez, and William Bell, Who (Really) Are the First Baby Boomers? Joint
Statistical Meetings Proceedings, Social Statistics Section, Alexandria, VA: American
Statistical Association, 2008, pp. 1009–16.
http://www.census.gov/prod/cen2010/briefs/c2010br-03.pdf
14
According to the Monroe County Social Service’s agency, the Southernmost
Homeless Assistance League (SHAL), Monroe County’s 2011 adult homeless person
population was 926 persons. There were an additional 120 homeless persons in the
Monroe County Jail on the day of the count. Of the nearly 1,000 homeless adults counted
in Monroe County in 2011 539 live unsheltered and 387 had access to some type of
shelter. Data reported from the Keys Outreach Temporary Shelter (K.O.T.S.) indicates
that many of its regular users are employed and unable to afford more permanent
housing.
The U.S. VA or United States Department of Veterans’ Affairs is active in
Monroe County with offices located in the Lower, Middle, and Upper Keys regions. It
operates a number of programs and two clinics to assist Veterans reintegrating into the
community. Currently, 9,640 veterans are enrolled in VA programs throughout Monroe
County. It is estimated that seasonal population changes add an additional 1500-2000
veterans annually during the winter months. This population is often highly transient,
according to VA Clinic staff, and once faced with the relatively high cost of living in
Monroe County, relocates again.
Many more United States Military Veterans are expected home in the coming
months and the United States Department of Veteran’s Affairs is preparing for their
healthcare management by employing technology. The Florida VA has developed new
mobile applications and website portals for veterans to access services and stay connected
upon their return from active duty (Florida Current, Florida Department of Veterans’
Affairs Launches New Outreach Campaign to Connect Veterans with Earned Benefits,
September 6, 2012).
15
2. Quality of Life: Behavioral and Environmental Health
The World Health Organization (WHO) defines health as “a state of complete
physical, mental and social well-being and not merely the absence of disease or
infirmity” (World Health Organization, 1948).
Monroe County Residents who are “Satisfied” or “Very Satisfied” with their Lives
95.5
18-44 years old
92.7
45-64 years old
97.2
65 & older
Table 2.1 Source: Florida CHARTS, 2012.
In order for populations to be healthy and to maintain health, environmental
conditions need to support health and behaviors need to reinforce health. Behaviors are
often a matter of choice, whereas environmental influence may be less changeable at the
individual level. The reverse can also be true, from a societal or governmental regulatory
perspective, individual behaviors are less changeable than environmental or policy
factors.
Behaviors can both create risk and protect against risk. Choosing to eat five or
more servings of fresh fruits and vegetables daily supports heart health and promotes
healthy weight. Walking produces positive and protective health consequences. Choosing
to smoke tobacco and consume alcohol creates risk for negative health consequences in
heart health, brain and mental health, and circulatory health.
Healthy People 2020 considers physical environment, access to services,
biology/genetics, the social environment, and individual behavior to be the determinants
of health. It is the interplay of these determinants that influence the overall health status
of individual members of the community and the population as a whole. Healthy People
2020 establishes national health benchmarks toward which local communities can strive.
Open communication and exchanges between community members and
institutional leaders within the community can promote effective health policies that
support positive health behaviors. Empowerment strategies and the ecological approach
to health planning engage shareholders in the process of determining the conditions of
health within communities. Direct input from these key players has been shown to result
in positive outcomes and successful results for community health improvement and
community health maintenance (Bartholomew, et al., 2006) (Fetterman, 2001).
Behavioral Risk Factors
Monroe
County
21.1%
36.5%
State of
Florida
17.1%
38.6%
Healthy People
2020 Goal
12%
13.5%
% of Adults Who Smoke Tobacco
% of Adults Who Have Been Diagnosed
with High Blood Cholesterol
23.2%
26.4%
32.6%
% of Adults Who Engage in No Leisuretime Physical Activity
17.4%
27.2%
30.6%
% of Adults Who are Obese
25%
15%
8%
% of Adults Who Heavy or Binge Drink
Table 2.2 Source: Florida CHARTS, 2012 and County Health Rankings, 2012.
16
Policies that support worksite wellness, zoning that supports community green
spaces, farmer’s markets, and common recreation areas are environmental factors that
protect and promote health and health conditions in a community. Clean streets, safe
water, and clean air are also commons regulated by policies of institutions and
institutional leaders. These are the Essential Services of Public Health and are delivered
through regulation, administrative policy, and programmatic initiatives within the
County’s Local Public Health System.
Figure 2.1 Source: National Association of City and County Health Officials, 2012.
L o c a l P u b lic H e a lth S y s te m
P o lic e
EMS
C o m m u n ity
C e n te rs
MCOs
C h u rc h e s
H o m e H e a lth
C o rre c tio n s
H e a lth
D e p a rtm e n t
P a rk s
S c h o o ls
D o c to rs
E le c te d
O ffic ia ls
H o s p ita ls
P h ila n th ro p is t
C iv ic G ro u p s
CHCs
L a b o ra to ry
F a c ilitie s
D ru g
T re a tm e n t
N u rs in g
H om es
E n v iro n m e n ta l
H e a lth
M a s s T ra n s it
T rib a l H e a lth
E c o n o m ic
M e n ta l
E m p lo y e rs D e v e lo p m e n t
H e a lth
F ire
Figure 2.2 Source: National Association of City and County Health Officials, 2012.
17
Monroe County encompasses a large, relatively unpopulated area of the
Florida mainland within the Everglades National Park, in addition to the island chain of
the Florida Keys. In 1908 Theodore Roosevelt established the Key West National
Wildlife Refuge in an effort to balance and limit the pressures of development in the
region and to ensure the preservation of the pristine eco-systems of the region for future
generations. According to the U.S. Fish and Wildlife Service, the refuge encompasses
more than 200,000 acres with only 2,000 acres of land. A geographically unique, and
nearly isolated, rural County in Southern Florida, Monroe County is home to over 300
species of birds (John Audubon Society, 2012), marine mammals such as manatees and
dolphins, numerous species and varieties of fish, mollusks, and crustaceans, sea
turtles, iguanas and other reptiles, as well as over 70,000 people (census.gov, 2010).
Stretching over 120 miles along the Overseas Highway, from the Everglades to
Key West, Monroe County is ranked 37th out of Florida’s 67 counties in the County
Health Rankings report released in 2012 by the University of Wisconsin and the Robert
Wood Johnson Foundation. The report ranks counties based on statistical measures of a
number of health indicators and health outcomes.
Human populations in Monroe County are concentrated within three main
jurisdictional areas: the Lower Keys, the Middle Keys and the Upper Keys. The Lower
Keys has the highest concentration of persons within the County, which averages
approximately seventy-three persons per square mile. The Lower Keys region is
considered that from Key West and the Dry Tortugas to the southern end of the Seven
Mile Bridge, approximately 47 miles north along US Highway 1 from the zero mile
marker in Old Town Key West. This region includes Fort Zachary Taylor State Park,
Fort Jefferson and the Dry Tortugas National Park, the Key Deer National Wildlife
Refuge, and Bahia Honda State Park. The Middle Keys begins at the foot of the Seven
Mile Bridge and runs north along US Highway 1 to the City of Layton at about mile
marker 68. The area beyond, from Layton north to the mainland, is known as the Upper
Keys and includes well known Key Largo and the John Pennekamp Underwater Coral
Reef State Park, Long Key State Park, and Islamorada.
All three regions of the island chain provide residents with ample opportunity to
enjoy the outdoors, to be physically active, and to explore and steward their physical and
cultural environments. The populated areas of the County also offer thriving arts
communities, theaters, an active adult nightlife in the urbanized area of Key West, and
a number of civic and philanthropic organizations support social and professional
activities for residents. Additionally, there are specialized lectures, workshops, and
learning series which are presented throughout the region by various cultural and
governmental organizations.
Monroe County Residents with Good Mental Health (2010)
<$25,000 annual
$25,000- $50,000
2010
income
annual income
78.7%
78.4%
Monroe County
Residents Who:
receive the social
and emotional
support they need
Table 2.3 Source: Florida CHARTS, 2012.
90.9%
> $50,000 annual
income
92.1%
18
Total
Families
Married
Couple
Family
Household
Male
Female
NonHousehold Household
Family
Head no
Head no Households
Wife
Husband
present,
present,
Family
Family
Household Household
2,117
1,612
13,250
29,822
12,843
Monroe
County
Table 2.4 Source: U.S. Census Bureau, 2010.
Religion statistics:
Percentage of population affiliated with a religious congregation
Monroe County,
Florida
29.4%
USA
50.2%
Total adherents in this county: 23,422, state total: 6,576,205
Total congregations in this county: 72, state total: 10,078
Table 2.5 Source: City Data, Monroe County, Florida, 2010.
Figure 2.3 Source: City Data, Monroe County, Florida, 2010.
19
Trends in Tide Levels on the Atlantic Coast
Figure 2.4 “These are actual observations of sea level from our tide gauges. These data stretch from
Galveston, Texas, to Wilmington, North Carolina. The blue lines are the month–by–month observations
and the red lines are the best-fit linear trends over the past 60 years.”
Mitchum, Gary T., 2011, Sea Level Changes in the Southeastern United States Past, Present, and
Future, University of South Florida.
The figures above indicate observations of sea-level rise at high tide marks in a
variety of coastal zones in the United States, including Key West, Florida at the southern
end of Monroe County. Considering the need for disaster mitigation and adaptability to
climate change, in 2009 the Monroe County Administrator’s Office, along with the
Monroe County Board of County Commissioners, entered into a four county climate
compact. The Compact, known as the Southeast Florida Regional Climate Change
Compact, brings Monroe County into mitigation partnership with regional delegations
from Broward, Palm Beach, and Miami-Dade Counties. In 2012 both Monroe County
and the City of Key West hired Sustainability Coordinators to champion their efforts.
The annual hurricane season begins each year on July 1st and continues through
November 1st of that year. Because the majority of Monroe County is between zero and
six feet elevation above sea level, flooding poses a genuine threat to public health and
safety, as well as to property. A study produced by the Southeast Florida Regional
Climate Compact to demonstrate the vulnerability of Monroe County to flooding as sea
20
levels rise throughout the region indicated the following, “44,885 acres, or 68 percent,
of Monroe County's landmass is vulnerable to flooding at high tide under 1 foot of sea
level rise. At that level, three of Monroe's four hospitals, 65 percent of the county's
schools and 71 percent of its emergency shelters would have vulnerable property. Raise
the projection to 3 feet of sea level rise, and about $15 billion in taxable assets and 86
percent of county land could be saturated at high tide” (Marshall, 2012).
Emergency Preparedness impacts quality of life and can create stress above
normal measure. The effects of disasters can generate consequences which last for
decades. Monroe County operates an Emergency Services Division which cooperates
with local, State, and Federal agencies in emergencies, including hurricanes, to
coordinate disaster response in accordance with Homeland Security measures and Federal
Emergency Management standards. Residents, at times, are subjected to extreme weather
circumstances which may threaten life and property. During disasters and times of crisis
communication among county, state, and local officials is constant and follows the
Incident Command System; however, in the everyday there can be a lack of
communication in the region and a sense of disconnectedness among the various
jurisdictions.
As residents of a rural county, persons living in Monroe County may be required
to travel extensively for shopping, entertainment, services, and health care needs. This
adds to the burden of isolation which can be experienced in this isolated rural Florida
County. The internet, social networking, and virtual socializing are assets residents can
employ to reduce the burden of isolation and to target their social activities to specific
personal interests. This same technology offers professionals an opportunity to expand
their networks while reducing their gas mileage. Travel for meetings impedes and
reduces the collaborative potential in the County. Teleconferencing and use of
technologies such as telemedicine improve the connect-ability of Monroe County
residents and can positively impact their overall quality of life.
Present in Monroe
County Annually;
2010-2011
0
20,000
40,000
Motor Vehicle Registrations
60,000
80,000
Flights- Military
100,000
120,000
140,000
Flights- Commercial or Private
Table 2.6 Sources: Multiple: Key West Citizen, Wednesday August 1, 2012; U.S.
Department of Transportation Federal Aviation Administration, Airport Master Record
2011; Key West International Airport Administration; Florida Department of Highway
Safety and Motor Vehicles Revenue Report July 2010- June 2011.
Although there are roughly 70,000 residents in Monroe County estimates from
the Monroe County Tourist Development Council indicate that an additional 3,000,000 (3
million) persons visit the Florida Keys (Monroe County) on an annual basis. This influx
21
impacts the quality of life of residents in that it provides the basis of the tourism
industry which is the anchor of the County’s economy; providing jobs and livelihoods
for approximately 35% of the County’s residents according to the Florida Legislature,
Office of Economic and Demographic Research, 2012. This influx also increases the
number of persons per square mile and that dramatic change is experienced by County
residents as a drastic seasonal population fluctuation.
Department of Business and Professional
Established in Monroe
Regulation Licenses
County
534
Food Service Licenses
1,230
Lodging and Accommodation Licenses
Table 2.7 Source: Florida Department of Business and Professional Regulation, Annual
Report, 2010-2011.
One of the most important draws for the tourism industry is the Florida Keys
Living Coral Reef, which is under the protection of the National Oceanic and
Atmospheric Association (NOAA). The coral reef tract, extending from the coast of
Miami and Key Biscayne southward, paralleling the Florida Keys about six to seven
miles offshore, and reaching past Key West approximately sixty miles to the Dry
Tortugas is included in the National Marine Sanctuary of the Florida Keys. The
sanctuary's education team, in an effort to balance use with preservation in the region, has
developed a historic Shipwreck Trail, which represents three broad periods of Keys
maritime history (NOAA, 2011).
While the reef is a natural attraction for area visitors, it is also a precious food
source. Though Sanctuary Waters are protected as ‘no-take’ zones; commercial and
recreational fishing continues in Keys waters in designated zones. From annual fishing
tournaments to the mini-lobster season, the Reef and its resources are an important
‘cornerstone’ of the Monroe County community and economy.
The Monroe County Health Department’s Environmental Health Division is
responsible for quality testing of beaches and near shore waters and posting of any
adverse results and ensuing warnings on a bi-weekly basis (Florida Department of
Health, 2012). In 2011, eleven beaches were tested on a weekly basis, during which time
a total of seventeen advisories or warnings were issued. The Florida Keys Aqueduct
Authority has been recognized for outstanding waste water treatment; however, as the
saying goes, ‘We all live down stream’ (The Citizen, 2011). Agricultural runoff from the
mainland continues to threaten the region’s marine resources, as do pollution from
streets, poor septic systems, and outdated sewage treatment in other areas.
NOAA has produced a 2011 Florida Keys Conditions Report, which “examines
the status of Florida Keys National Marine Sanctuary’s water quality, habitats, marine
life and cultural resources” (Florida Keys National Marine Sanctuary, 2011). “Since its
designation in 1990, Florida Keys National Marine Sanctuary has worked to address
human influences to resource health. Human actions — such as poaching, vessel
groundings and discharging of marine debris — continue to negatively affect the habitat
and living resources of the sanctuary, but they may be improved with long term
management efforts, regulatory compliance and community involvement” (Florida Keys
National Marine Sanctuary, 2011).
The Florida Keys Aqueduct Authority provides potable water to Monroe County
via a 130-foot main carrying lime softened water, pumped from 60-80 foot deep wells in
22
the Biscayne Bay Aquifer. The same Aquifer supplies Dade, Broward, and Palm
Beach Counties. Monroe County’s daily production in 2005 was 23.70 million gallons
per day; for the fiscal year 2011-2012 total water sold in Monroe County was
4,780,641,200 (Florida Keys Aqueduct Authority, 2012). The Aqueduct Authority’s
future projections indicate a rising demand and a need for an alternative source, such as
Aquifer Storage and Recovery Wells used in south-east Florida (Florida Keys Aqueduct
Authority, 2005).
The Monroe County Health Department Environmental Health Division, in
addition to beach water quality testing, provides sewage and septic inspections,
inspections of hotel and public pools, inspections of tanning facilities, inspections of
piercing and tattooing establishments, and manages a food hygiene program which
includes school cafeterias and civic organization’s food service facilities. See Appendix E
for 2011-2012 Service Counts for the Monroe County Health Department Environmental
Health Division. The Environmental Health (EH) Division of the County Health
Department has offices in each region of the Keys, but is based in Marathon, Florida in
the Middle Keys.
23
3. Health Care Resources
Rural counties and communities face particular challenges in developing and
maintaining their health care infrastructure and in providing equitable access for all
constituents. As a rural county, Monroe County is no exception. Community leaders
speak of the difficulty of retaining trained, qualified staff due to the remoteness and
inaccessibility of the County, the lack of high end commodity services, and weak
community supports for health professionals.
As a result, Monroe County is designated as a ‘Health Professional Shortage
Area’ (HPSA) for Mental Health (Health Resource Services Administration [HRSA],
2012), due in part because of high demand for services, and in part to a lack of
coordinated mental health resources available to the population. Monroe County is not
considered to be Health Professional Shortage Area for Primary Care or Dentistry.
Monroe County is, however, considered a ‘Medically Underserved Area’ with a score of
45.5 (HRSA, 2012). This designation has been in effect since 1995, “Under the
established criteria, each service area found to have an IMU (score) of 62.0 or less
qualifies for designation as an MUA” (HRSA, 1995). Currently, efforts are being directed
to improving access to care through community-based health homes providing managed
care, like the Federally Qualified Health Centers.
Of Monroe County’s 70,000 plus residents, 24% are living at or below 200% of
the Federal Poverty Level. Among those individuals 47.4% are uninsured including
13,000 adults and 4,600 children. Of the 18,945 families in Monroe County in 2012,
6.7%, or 1,281 of those families are living at or below the Federal Poverty Level; 54% of
those (628 families) are families with children (Miami-Dade Matters Demographic data,
Monroe 2012.) Within the overall population of the County 33.4% of the population is
uninsured; 15.9% of the total population of Monroe County receives Medicare benefits,
and 10% receive Medicaid benefits (U.S. Department of Health and Human Services,
Area Resource File, 2012).
For the existing providers, the cost of providing services in the area often
outweighs the return and therefore many practitioners simply can not afford to practice in
Monroe County. For those that do, Medicaid reimbursement has become a major
problem, and because rates are significantly lower for reimbursement than for direct pay,
many doctors in the County are simply refusing new Medicaid patients or relocating their
practices outside of Monroe County.
Monroe County Residents
18-44
45-64
65 +
18%
3%
65%
57.2%
10.5%
62.2%
80.7%
9.%
85.1%
91.6%
3.5%
63.9%
78.4%
96.7%
Adults who could not see a doctor in the last year due to cost 26%
Adults who had a medical check up in the last year
Adults who have a personal doctor
Adults who think they would get better medical care if they
belonged to a different race/ethnic group
Adults with any type of health care insurance coverage
Table 3.1 Florida CHARTS, 2012.
The opening of a Federally Qualified Health Care Center in the Lower Keys led
by the Rural Health Network will improve access to care and coordination of services
for County residents from Key West to the Southern end of the Seven Mile Bridge. This
24
facility opened to residents in the fall of 2012 and will focus on coordinated care,
including referrals for additional services. Lower Keys residents also have access to care
through two walk-in clinics in Key West. The FQHC in the Lower Keys Region is
utilizing electronic medical records, so as to streamline patient care and to better
coordinate follow up on diagnosis and treatments. The FQHC is partnering with several
existing entities including: an area pharmacist to develop a Medicaid pharmacy for
prescription access, the Lower Keys Medical Center in order to access high quality
medical staff and facilities, and with the National Health Corps to access innovative,
skilled learners.
The Good Health Clinic in the Upper Keys is providing services to qualifying
individuals free of charge; the Marathon Health Clinic provides services on a sliding fee
scale with client contributions based on income. KAIR (Keys Area Interdenominational
Resources), a Middle Keys non-profit agency, assists individuals in need with fees at the
clinic and transportation to treatment appointments in the mainland. Monroe County
Social Services can also provide medical transportation for residents as needed. The
Monroe County Health Department also has clinics in all three client areas of the Keys:
the Upper, Middle and Lower Keys. These clinics are providing limited primary care
services, immunizations, WIC services, some screening services, and chronic disease
management. In the Lower Keys Woman Kind offers health services to women on a
sliding fee scale, AIDS Help manages care and coordinates services County-wide for
qualifying persons living with HIV, and Wesley House Family Services, through a
contract with the Florida Department of Children and Families, assists families with
children in obtaining state supported medical coverage, care, and services.
Public Health-1
Family Practice-3
Medicaid
Providers in
Monroe
County 2012
by Service
Type
Internal Medicine-2
Pediatrics-3
General Practice-3
Dental-2
Hearing-0
Vision-5
0
1
2
3
4
5
6
Applied Behavior Analysts-2
Figure 3.1 Source: Agency for Health Care Administration, Florida Medicaid, Area 11
Office.
Medical and healthcare providers in the region work within the County’s three
jurisdictional areas of the Lower, Middle, and Upper Keys. Each area has a hospital
which provides inpatient and outpatient services. The two hospitals in the Upper and
Middle Keys do not provide birthing or child delivery services. Although Fisherman’s
Hospital in the Middle Keys can deliver a birth in its Emergency Room Facilities, clients
are directed to make arrangements at the Lower Keys Medical Center or in the mainland.
Mariner’s Hospital directs clients to the mainland for birthing services either through its
affiliate, the Baptist Health Network, or other independent resources. At the Lower Keys
Medical Center, a group of obstetric/gynecologists are on call for deliveries at the
hospital, therefore a woman may not necessarily deliver with the same practitioner she
has been seeing throughout her prenatal care.
25
Each of the three hospital organizations function completely independent of
one another and is faced with the unique challenges of its locale and area population.
Because healthcare facilities are limited in the Florida Keys, and many residents do not
have a medical home, the hospital emergency rooms frequently serve as medical homes
for a segment of the population.
Fisherman's Hospital 4,818 Emergency Room
Discharges 2011
Discharged to home
or self care
Left against medical
advice or
discontinued care
Transferred to short
term general hospital
for inpatient care
Lower Keys Medical Center 14,785 Emergency Room
Discharges 2011
Discharged to home or selfcare
Left Against Medical advice
or discontinued care
Transferred to a short term
general hospital for
inpatient care
Mariners Hospital Emergency 6,379 Room Discharges
2011
Discharged to home or self
care
Left against medical advide
or discontinued care
Transferred to a short term
general hospital for
inpatient care
Figure 3.2, 3.3, 3.4 Source: Agency for Health Care Administration, 2012.
26
Neurosurgical procedures and other highly specialized surgical and medical
services are not available through the County’s hospitals and referrals are made to
medical specialists in the mainland, often in Miami-Dade County. Monroe County does
not have a dedicated trauma center and professionals debate the need for one based on the
demand for services. Currently, telemedicine and helicopter transport assist in lessening
the burden of geography for Monroe County residents. Florida CHARTS data for the
2010-2011 fiscal year indicate actual counts of licensed practitioners as follows: eighteen
(18) family practice physicians, twenty-seven (27) internal medicine physicians, seven
(7) obstetric and gynecological physicians, and seven (7) pediatricians for the 70,000
plus person year-round population base. For all categories of practicing physicians the
County rate per 100,000 persons is 271.4, as compared to the State at 335.7 per 100,000
persons.
Service Providers: Rate per 100,000 Residents, 2010 (FY)
350
300
250
200
150
100
50
0
Monroe County
Total Physicians-271.4
Internists-37
Pediatricians-9.6
State of Florida
Family Practice Physicians-24.7
OB/GYN-9.6
Dentists-50.7
Figure 3.5 Source: Florida CHARTS, 2012.
For a number of conditions, Monroe County residents can receive diagnosis
within the county of their residence, but will need to travel outside of the county for
treatment services. As in other Counties state and nation wide, residents face issues of
payment and financial barriers to access, as not everyone is insured and not all services
are fully covered by insurance. Provisions within the Affordable Care Act seek to
eliminate the gap between diagnosis and access to treatment.
As an affiliate of the Baptist Health Network, Mariners Hospital in the Upper
Keys is considered a rural hospital and is part of a larger Miami-Dade County based
system servicing the Upper Keys region. The mission of the hospital and its network is
“to improve the health and well-being of individuals, and to promote the sanctity and
preservation of life, in the communities we serve”, and is based soundly in the JudeoChristian ethical tradition. A portion of its care is offered as charitable care through the
Baptist Health Network’s Pastoral Care Program.
Fisherman’s Hospital in Marathon is also considered a rural hospital. Formerly
a for profit entity, this hospital offered a portion of its revenue to area non-profits as
support. Recent changes in the hospital’s status have altered the flow of funding in the
Middle Keys; the hospital itself has now become a not-for-profit organization and relies
on community support and charitable funding.
27
The Lower Keys Medical Center remains a for-profit entity and is not
considered a rural hospital, in spite of it being in a rural county. Approximately seventy
percent of the population of Monroe County resides in the Lower Keys; this increased
population density eliminates this facility as a rural hospital
facility.
Health Care Facilities
250
200
Acute Care
Hospital Beds
150
Specialty Care
Hospital Beds
100
50
Nursing Home
Beds
0
Monroe County
Figure 3.6 Source: Florida CHARTS, 2012.
Monroe County has a limited number of nursing home and assisted living
facilities. Alternatives such as; In Home Services, provided by Monroe County Social
Services for the elderly, the Elder Helpline which monitors clients needs with regular
call ins, and independent living with community liaison support for disabled persons are
utilized to accommodate the population. At home living is encouraged, and outreach
support is maintained to assist those in need. Existing facilities within Monroe County
include: a Key West Housing Authority supported gated community and Senior Citizen
Plaza, Key West Health and Rehabilitation Center, Plantation Key Nursing Home,
Heron House in Marathon, Bayshore Manor in Key West, and the Monroe Association
of Retarded (ReMARCable) Citizens, which offers two types of housing for clients:
group supported living homes and independent living in a shared apartment with a
community support liaison.
Profile of Non-Fatal Injury Emergency Room Visits
All Monroe County Hospitals 2010
Assault
Self-Inflicted
Undetermined
Other
Not "E" Coded
Figure 3.7 Source: Agency for Health Care Administration, Emergency Department
Discharge Data, 2012.
28
The Affordable Care Act is designed to strengthen and support America’s
Health Care Safety Net. It contains a number of consumer oriented provisions such as
extending coverage of adult dependent children to age 26, eliminating the possibility of
insurance refusal based on a pre-existing condition, and expanding Medicaid to
encompass a larger portion of the population. The ACA also provides for the
improvement and expansion of America’s public health infrastructure at the
community level and development of America’s Public Health Workforce. In addition
to workforce support and development, the ACA creates opportunities for community
engagement with a focus on place-based community empowerment; policy directed
planning, and systems change. The ACA reinforces and supports the shift to
community level operations through a number of provisions based on funding
opportunities and development of infrastructural supports. The Rural Health Network
of Monroe County, a regular source of dental services for Monroe County residents, has
made use of one such provision in order to develop a Federally Qualified Health Center
for the Lower Keys, which opened to residents in the fall 2012 as the Lower Keys
Community Center.
Numerous social service agencies support the health care infrastructure in Monroe
County. For profit and not for profit agencies coordinate care for the elderly, offer
physical therapy and rehabilitative services, as well as advocate for special populations’
legal rights. The United States Department of Veteran’s Affairs cooperates with
Volunteers of America of Florida to to link veterans to the numerous health resources
and services available to them, including coordination of transportation to the mainland
and referrals as needed. The Florida Keys Area Health Education Center (AHEC)
provides health screening services, health education for individuals and families, and
professional development opportunities for the public health workforce. AHEC also
coordinates the Medical Reserve Corps, who assist in emergency and disaster
management. The Guidance Care Center offers mental health services at locations
county-wide and assists Monroe County Social Services with clients’ medical
transportation needs. Easter Seals and Early Steps serve the special needs population in
Monroe County through both screening and services. Children’s Medical Services assists
families of children with special needs with insurance coverage. Through extensive
referral network, Healthy Start assists pregnant women and their children in accessing
appropriate care for all stages of maternal and infant health. The Alliance for the Aging,
through the Elder Helpline and Shine counselors assists elder residents in obtaining the
services and access to care they require. Many faith-based organizations assist Monroe
County residents in obtaining the access to care and services they need and, support food
access and transitional housing programs. Monroe Association of ReMARCable Citizens
provides workforce placement, training, housing and supported living to adults with
developmental disabilities in Monroe County. The Sister Season Fund supports the
medical needs of workers in the hospitality industry. The United Way focuses on hunger
elimination and food access; in Monroe County including support of food pantries and
coordination of food recovery plans. See Appendix A for an extensive listing of social
service agencies, their services, and the populations they serve.
Alternative therapies and natural healing practitioners also support the health
care and well maintenance of Monroe County residents. Massage, Reiki, iridology,
acupuncture, acupressure, reflexology, dolphin swims, and medical psychics are among
the varied healing methods available from Monroe County alternative and natural therapy
practitioners.
29
4. Socio-Economics and Socio-Demographics
Percent Pop Growth 2000 to 2012: -9.04% Household Growth 2000 to 2012: -7.04%
Housing Unit Growth 2000 to 2012: 2.03% Family Growth 2000 to 2012: -7.07%
Source: Miami Matters, Demographics, Monroe, 2012.
Monroe County Earnings
2012 Per Capita Income
2012 Median Household Income
2012 Average Household Income
Monroe County Florida 2012
$34,071
$52,894
$72,297
Table 4.1 Source: Miami-Dade Matters Demographic data, Monroe 2012
Monroe County Households
Total Households,
2010
Family
Households, 2010
Average
Household size
Average Family
size
Monroe County 2010
32,629
Florida 2010
7,420,802
Monroe County 2012
32,617
18,219
4,835,475
18,945
2.18
2.48
2.16
2.7
3.01
n/a
Table 4.2 Source: Office of Economic and Demographic Research, 2012, Monroe County
Households and Household Families and Miami-Dade Matters Demographic data, Monroe 2012.
25.00%
20.00%
15.00%
10.00%
5.00%
0.00%
Monroe County Household Incomes 2012
<15,000
$15,000-$24,999
$25,000-$34,999
$35,000-$49,999
$50,000-$74,999
$75,000-$99,999
$100,000-$124,999
$125,000-$149,999
$150,000-$199,999
$200,000-$499,999
$500,000+
Figure 4.1 Source: Miami Matters, Demographics, Monroe 2012.
30
Fair Market Rents in Monroe County 2012
Monroe County Rental
0
1
2
3
Unit
bedroom/studio
bedroom bedroom bedroom
$1126
$1134
$1534
$2001
Fair Market Rent for
2012
Table 4.3 Source: U.S. Department of Housing and Urban Development, 2012
The cost of living index considers a number of factors including housing,
groceries, accessibility to services and resources, and employment opportunities to rate
cities, locations, and communities. The U.S. average is 100; “an amount below 100
means cheaper than the US average; a cost of living index above 100 means more
expensive than the US average. Overall, Monroe County, FL cost of living is 158.10”
(Sperlings Best Places, 2010, Cost of Living Index).
Cost of Living Index Regionally
Big Pine Key
Key Largo
Key West
Marathon
132.46
146
168
162.06
Table 4.4
Cost of Living
Cost of living
Monroe, FL
United States
Overall
158
100
Food
106
100
Utilities
97
100
Miscellaneous
101
100
Table 4.5 Source: Sperlings Best Places, 2010, Cost of Living Index
U. S. City of Comparison
Cost of Living Index
Grand Rapids, Michigan
84
Philadelphia, Pennsylvania
106
Albany, New York
106
Las Vegas, Nevada
109
Portland, Maine
110
Charleston, South Carolina
111
Santa Fe, New Mexico
118
Monroe County, Florida
158
Boston, Massachusetts
154
New York, New York
159
South San Francisco, California
166
Table 4.6 Source: Sperlings Best Places, 2010, Cost of Living Index
4
bedroom
$2050
31
People in Group Quarters in Monroe County, Florida
Local Jails or lock up confinement
Nursing Homes
Non-institutional Group quarters
Military Ships
Homes or Halfway Houses for drug/substance abuse
Homes for the mentally ill
State prisons
Military barracks
other non-household living situations
Homes for the developmentally disabled
other Worker's dormitories
In wards in general hospitals for patients with no other usual home
Religious group quarters
Figure 4.2 Source: City Data, 2012
Monroe County Homeless Population
1400
1200
1000
800
600
400
200
0
Lower Keys
Middle Keys
Upper Keys
Sheltered
2002
2003
2005
2007
2009
2010
2011
Figure 4.3 Source: Southernmost Homeless Assistance League
32
Accomodation and Food Service
Retail Trade
Employment Industries Monroe County 2010
Public Administration
Health Care and Social
Assistance
Educational Services
Construction
Admin & Support, Waste
Mngmt & Remediation
Other services (excluding
Public Admin.)
Professional, Scientific, and
Technical Services
Finance and Insurance
Arts, Entertainment, and
Recreation
Real Estate, Rental, and Leasing
Transportation and
Warehousing
Utilities
Wholesale Trade
Informaiton
Manufacturing
Management of Companies and
Enterprises
Agriculture, Forstry, Fishing,
Hunting
Mining
Figure 4.4 Source: U.S. 2010 Census, census.gov
The Hospitality and Leisure Industry employs 18,308.4 members of the 55,480
person workforce in the County. The total population is 73,000, 76% of which makes up
the workforce; 32.3% of the Monroe County workforce is employed in Hospitality and
Leisure (Florida Legislature, Office of Economic and Demographic Research, 2012).
CLASS OF WORKER (Monroe County Florida 2010)
Private wage and salary workers
Government workers
Self-employed in own not incorporated business
workers
Unpaid family workers
Total civilian employed population 16 years and over
Table 4.7 Source: www.census.gov
27,247
5,593
4,454
72.9%
15.0%
11.9%
89
37,383
0.2%
100%
33
Monroe County Residents Means of transportation to work:
Drove a car
Motorcycle: 766
Walked:
Ferryboat: 38
(2%)
2,223 (5%)
(0%)
alone: 27,976
(67%)
Carpooled: 4,633 Taxi: 203 (0%)
Worked at
Streetcar or
(11%)
home: 2,092
trolley car: 32
(5%)
(0%)
Bicycle: 2,641
Bus or trolley bus:
Other means:
(6%)
163 (0%)
850 (2%)
Table 4.8 Source: City Data, Monroe County, 2012
Per Capita Personal Income
2001
2002
2003
2004
2005
2006
2007
2008
2009
2010
Monroe 38,084 38,384 40,003 45,438 51,021 58,101 61,557 63,130 56,299 58,799
County
Table 4.9 Source: Bureau of Economic and Business Research, University of Florida,
2012
Comparison of per capita personal income County, State, Nation
60000
50000
40000
Monroe County
30000
Florida
20000
United States
10000
0
2001
2005
2010
Figure 4.6 Source: Bureau of Economic and Business Research University of Florida,
2012
Individuals at or below Poverty Level by Race
County Rate
State Rate
Black
15.2%
25.9
Hispanic
17%
18%
White
9.7%
9.5%
Non-Hispanic
9.%
11%
Table 4.10 Source: Florida CHARTS, 2012
34
Educational Attainment Persons 25 or Older
(2006-2010)
100
80
60
Monroe County
40
Florida
20
United States
0
% HS Grad or higher
% BA or higher
Figure 4.7 Source: Florida Legislature: Office of Economic and Demographic Research,
Monroe County Profiles, 2012.
Crime rates per 100,000 person
per population 2010-2011
5000
4000
3000
Monroe
County
2000
Florida
1000
0
Crime rate
Admissions to Prison 2010-2011
300
250
200
150
100
50
0
Monroe County
Florida
Admissions to prison
rate per 100,00 person
population
Figures 4.8 and 4.9 Source: Florida Legislature: Office of Economic and Demographic
Research, Monroe County Profiles, 2012.
2012 Families below Poverty
Region Comparison (zip codes)
Location 2012 Families Below Poverty
33036
52
33037
290
33040
521
33042
75
33043
69
33050
160
33070
112
Monroe 1,281
Table 4.11 Source: Miami Matters Demographic, Data, Monroe, 2012.
35
Of Monroe County’s 70,000 plus residents, 24% are living at or below 200%
of the Federal Poverty Level. Among those individuals 47.4% are uninsured including
13,000 adults and 4,600 children. Of the 18,945 families in Monroe County in 2012,
6.7%, or 1,281 of those families are living at or below the Federal Poverty Level; 54% of
those (628 families) are families with children (Miami-Dade Matters Demographic data,
Monroe 2012.) Within the overall population of the County 33.4% of the population is
uninsured; 15.9% of the total population of Monroe County receives Medicare
benefits, and 10% receive Medicaid benefits (U.S. Dept of Health and Human Services,
Area Resource File Monroe, 2012).
Insurance Coverage
35
30
25
20
Monroe County
15
United States
10
5
0
% Uninsured
% Medicare
%Medicaid
Figure 4.10 Source: Area Resource File, U. S. Department of Health and Human
Services, 2012.
Photo courtesy of Monroe County Health Department and Students Working Against
Tobacco
36
Monroe County Student Population Eligible for Free/Reduced Lunch
10000
9000
8000
7000
6000
5000
4000
3000
2000
1000
0
2001-2002
2010-2011
Monroe County student population Monroe County student population
PreK-12
eligible for Free/Reduced Lunch
Figure 4.11 Source: Florida Department of Education, 2011, Education Information and
Accountability Services Data Report.
Florida Student Population Eligible for Free/Reduced Lunch
3000000
2500000
2000000
1500000
2001-2002
2010-2011
1000000
500000
0
Florida student population
PreK-12
Florida student population
eligible for Free-Reduced
Lunch
Figure 4.12 Source: Florida Department of Education, 2011, Education Information and
Accountability Services Data Report.
The data for the ‘Free and Reduced Lunch Program’, in both the state and the
county, reflects a decline in the number of students qualifying for the program. In
Monroe County the change has been quantified as a -28.3% reduction from the 20012002 school year to the 2010-2011 school year. In Monroe County 76.7% of the
children in the school-readiness program were eligible for free and reduced lunch during
the period from 2007-2009; the state rate was 57.8% (Florida CHARTS, 2012).
Family incomes should not exceed 185% of the Federal Poverty Level (FPL) to
meet requirements for Reduced Price Lunch Programs in their state, and should not
exceed 130% of the FPL to meet the requirements for Free Lunches in the Program
(United States Department of Agriculture, Federal Register, Friday, March 23, 2012, Vol. 77, No.
57, Notices).
37
5. Injuries, Violence, and Community Safety
External Causes of Death, or Injuries, are a major contributor to the number of
years of life lost due to premature death (death before 75) in Monroe County. When
compared state-wide for 2009-2011, Monroe ranks as the 11th highest age-adjusted death
rate due to external causes, or injuries, with a rate of 94.1 per 100,000 deaths being
attributed to external causes or injuries. The State 2009-2011 rate is 62.9 per 100,000
deaths attributable to injuries or external causes (Florida CHARTS, 2012); the rate for the
overall United States population for 2009 was 37.3 per 100,000 deaths (Center for
Disease Control and Prevention [CDC]). The overall U.S. rate has declined dramatically
over recent decades; however unintentional injuries remain a leading cause of death in
the U.S. (CDC, 2012) and the third leading cause of death in Monroe County for 2011
(Florida CHARTS, 2012).
With regard to Domestic Violence, a four county comparison with the State
indicates rates as follows:
Four County Comparison of Domestic Violence Incidence Rates 2008-2010
County or Region
Incident Count
Rate per 100,000 persons
442
601.7
Monroe County
1,219
672.4
Okaloosa County
422
582.5
Nassau County
7,468
612.4
Hillsborough County
114,349
610.7
State of Florida
Table 5.1 Source: Florida CHARTS, 2012 and Florida Department of Law Enforcement
Monroe County’s 456 domestic violence incidences for 2010 can be broken down
into the following categories:
Domestic Violence
2010 Incidence
Domestic Violence
2010
Offense
Rate
Offense
Incidence
Rate
0
39
Murder
Aggravated Assault
0
0
Manslaughter
Aggravated Stalking
4
396
Forcible Rape
Simple Assault
1
16
Forcible Sodomy
Threat or Intimidation
0
0
Forcible Fondling
Stalking
Table 5.2 Source: Florida Department of Law Enforcement
Unintentional Injuries
Unintentional injuries, or accidents, are the leading cause of death for Florida
residents ages 1-44 and the fourth leading cause of death overall according to the
Florida Department of Health, Division of Emergency Preparedness and Community
Support, Injury Prevention Program.
Unintentional Injuries Age Adjusted Death Rates per 100,000 persons 2008-2009
Monroe County
State of Florida
Healthy People 2020 Goal
68.8
43.1
36.0
Table 5.3 Source: Florida CHARTS, 2012.
38
Unintentional Injuries in Monroe County:
Median Frequency Counts by Injury Type, 2009
Traumatic Brain Injury
Fire
Homicide and Assault
Poisoning
Drowning
Fire Arms
Motor Vehicle
Unintentional Falls
Suicides
Figure 5.1 Source: Florida Department of Health, 2012, Office of Injury Prevention
Poisoning
Poisoning includes in its definition poisoning by drugs, medicinal substances,
biologicals, gas and vapors (domestic and others), alcohol, cleaning agents, petroleum,
arsenic, agriculture, horticulture, corrosives, food, plants according to the International
Classification of Diseases, Version 10 used by hospitals and governments to record and
classify causes of death. In Monroe County between 2009 and 2011 there were 43 deaths
associated with poisoning according to the above definition, resulting in an age adjusted
death rate of 17.6 per 100,000 persons. The Monroe County rate is slightly higher than
the State of Florida age adjusted death rate of 13.6 per 100,000 persons.
Drowning
According to the Florida Injury Prevention Program, “Unintentional drowning
does not mean unpreventable drowning. According to the 2010 Florida Child Abuse
Death Review Report, the leading cause of verified child abuse/neglect deaths in Florida
was drowning.” The State Committee reviewed 59 verified child neglect cases involving
drowning. Inadequate supervision was found in all of the reviewed cases.
Monroe County experienced 14 cases of drowning during the period from 2009
through 2011 for a rate of 5.2 per 100,000 persons. The State rate per 100,000 persons is
1.9.
Locations of Fatal Drownings:
Florida residents under the age of 10 are most likely to drown in a swimming
pool.
Florida residents ages 10 and older are most likely to drown in natural/open water.
In 2009:
68% of drowning victims under age five drowned in a swimming pool (48), 8% in
a bathtub (6), and 13% in natural/open water (9).
39
58% of drowning victims ages five to nine drowned in natural/open water (7)
and 42% in a swimming pool (5).
52% of drowning victims ages ten and older drowned in natural/open water (210)
and 23% in a swimming pool (92) (Florida Office of Injury Prevention, 2012).
Firearm Injuries
Data from the Florida Injury Prevention Program 2009 shows that “63% of
firearm deaths were suicides and 35% were homicides. However, 62% of non-fatal
firearm injury hospitalizations were assaults while only 6% were self-inflicted. Fatal
firearm injuries were more often self-inflicted while non-fatal firearm injuries were more
often inflicted by another person through assault” (Florida Injury Prevention Program,
2012).
Monroe County experienced 50 fatal firearm discharges during the three year
period of 2009-2011; establishing an age adjusted death rate of 17.9 per 100,000 persons.
The age adjusted death rate in the State of Florida is 11.7 per 100,000 persons.
Motor Vehicle Injuries
The highway leading into Monroe County from mainland Florida is the one
vehicular way in and one vehicular way out of the County. In 2010, twenty-one fatalities
were recorded due to motor vehicle crashes in Monroe County and three fatalities of
pedalcyclists were recorded in 2010 (National Traffic Highway Safety Administration,
2012)
.
Monroe County Age Adjusted Death Rates per 100,00 persons
All Motor Vehicle Crashes
Alcohol-Related Motor Vehicle Crashes
Year
County
State
Year
County
State
21.5
18.1
12.6
6.1
2001
2001
15.5
19.4
15.5
6.9
2005
2005
23.3
12.5
19.2
4.2
2010
2010
Table 5.4 Source: Florida CHARTS, 2012.
Figure 5.2 Bahia Honda Bridge showing picnic area, on the Famous Overseas Highway,
Florida
Source: Vintagetravelpostcards.blogspot.com/2011/11/overseas-highway.html
The road presents unique and dangerous conditions due to the high volume of
visitor traffic accommodated by the highway and the close proximity of county
residential areas to this highway. Additionally, the highway consists of a series of bridges
40
connecting islands, is narrow in many places, and offers many distractions. Binge
alcohol consumption associated with vacationing also contributes to high fatality and
accident rates for this road. Single vehicle crashes and roadway departures are most
common, as is seen in Figure 5.4.
Monroe County Motor Vehicle Crash Fatalities
Pedalcyclist
Pedestrian
Motorcyclist
Light Truck and Van
Passenger Car
Figure 5.3 Source: National Highway Traffic Safety Administration, 2010.
Factors Influencing Fatal Crashes in Monore County 2010
Alcohol-Impaired Driver
Single Vehicle Crashes
Fatalities Involving a Large
Truck
Fatalities involving Speeding
Fatalities Involing Roadway
Departure
Fatalities Involving an
Intersection
Figure 5.4 Source: National Highway Traffic Safety Administration, 2010.
41
Reduction in Alcohol Related Motor Vehicle Crashes in Monroe County
Multi-year trend; all age groups
Figure 5.5 Source: Florida CHARTS, 2012.
Community Safety Collaborations
Officials from the Monroe County, the Monroe County Health Department, the
Monroe County Sheriff’s Office, the Key West Police Department, and the Monroe
County Public School District have, in recent years, partnered on collaborative programs
with local businesses and municipal governments to improve the walk-ability of some
communities within Monroe County, including bicycle safety programs, free helmets to
school children who bike, and development of safe routes to schools as neighborhoods
expand.
In both Islamorada and Marathon solar and low luminescent lighting projects
have been installed in parks and play areas with the support of local governments, nonprofits, and private businesses. The City of Key West has partnered with its local utility
company, Keys Energy, to launch a similar pilot project in a historic district
neighborhood to improve the night time visibility there without detracting from the
historic quality. A Pedestrian Action Committee meets regularly in Key West to discuss
issues and actions relevant to pedestrian safety there, and advocates for appropriate
changes as needed. Green Living Energy Education (GLEE), a county wide not-forprofit that encourages sustainability and community welfare, has also contributed support
to these efforts. Collectively, these efforts are geared toward the sustainability of these
communities and serve to reduce the County’s overall carbon foot print, as well as to
improve community safety.
Photo courtesy of Monroe County Health Department
42
6. Morbidity and Mortality:
Chronic and Communicable Diseases
Chronic disease data from Florida CHARTS for 2001-2003 when compared to
chronic disease data from 2008-2010 indicates that for nearly all chronic diseases listed
for Monroe County, the mortality rates have decreased throughout the first decade of the
new millennia.
The table below displays results from self-reported questionnaires regarding the
quality of health generally experienced by Monroe County residents.
Overall Health Experienced in Monroe County in 2010
Monroe
National
Florida
County
Benchmark
Goal
86%
n/a
83%
Adults with good to
excellent overall health
85%
86%
79%
Adults who always or
usually receive the social
and emotional support
they need
8.2%
n/a
10.8%
Adults who think they
would get better medical
care if they belonged to a
different race/ethnic
group
78.2%
n/a
83%
Adults with any type of
health insurance
coverage
89.7%
n/a
87.4%
Adults with good
physical health
90.9%
n/a
88.2%
Adults with good mental
health
14%
10%
15%
Poor or fair health
3.6
2.6
3.5
Poor physical health
days per month
3.6
2.3
3.6
Poor mental health days
per month
Table 6.1 Source: County Health Rankings, 2012, Healthy People 2020, and Florida
CHARTS, 2012.
For the period of 2009-2011, Monroe County experienced 708 live births per
100,000 persons. Of those live births approximately 6.8% were considered to be infants
with low fetal birth weights, meaning 93.2% were born a t a normal, healthy weight;
nearly 85% of all births during the 2009-2011 time period received pre-natal care during
the first trimester. The infant mortality rate for this period is 4.7% or 3 infant deaths per
1,000 live births (Florida, CHARTS, 2012).
43
Comparison of Low Birth Weight Rates in Four Florida
Counties
10
8
6
4
2
0
1990
1995
Monroe County
Nassau County
2000
2005
2010
Okaloosa County
Hillsborough County
Figure 6.1 Source: Florida CHARTS, 2012.
Comparison of Infant Mortality Rates in Four Florida
Counties
12
10
8
6
4
2
0
1990
1995
Monroe County
Nassau County
2000
2005
2010
Okaloosa County
Hillsborough County
Figure 6.2 Source: Florida CHARTS, 2012
44
Comparison of Death Indicators for Four Florida Counties
Death Indicators
Monroe Okaloosa Nassau Hillsborough
Size / Population of County
Deaths from All Causes
Age Adjusted Death Rate Per
100,000
Total Deaths Under 65
72,605
181,902 73,838
State
1,241,496 18,934,175
628
1,531
694
9,056
172,856
669.1
769.6
800.1
723
677.9
226
416
202
2,799
43,445
30.9
25.1
36
27.2
29.1
Percent of Deaths Under 65
Table 6.2 Source: Florida CHARTS, 2012.
Years of Potential Life Lost (YPLL)
County
Monroe
Okaloosa
Nassau
8689.1 years
7112.1 years
8524.8 years
YPLL per
100,000 persons
< 75 years of
age in 2011
Table 6.3 Source: Florida CHARTS, 2012.
Hillsborough
7199.1 years
Leading Causes of Death in Monroe County 20 year Comparison
Cause of Death
1990
2000
2011
Total
Trend
+ (rising) or –
(declining)
184
177
163
524
Malignant Neoplasm
(Cancer)
167
150
122
439
Heart Diseases
31
37
51
119
Unintentional Injury
+
26
33
31
90
Chronic Lower
+/Respiratory Disease
9
12
24
45
Suicide
+
14
24
22
60
Chronic Liver Disease &
+/Cirrhosis
7
15
21
43
Diabetes Mellitus
+
34
30
20
84
Cerebrovascular Diseases
2
16
14
32
Alzheimer’s Disease
+/1
2
13
16
Nephritis, Nephrotic
+
Syndrome, Nephrosis
3
4
6
13
Septicemia
+
38
15
6
59
Human Immunodeficiency
Virus Disease (HIV)
24
12
4
40
Influenza & Pneumonia
8
2
3
13
Homicide
-/+
7
6
2
15
Aortic Aneurysm &
Dissection
4
14
2
20
Atherosclerosis
+/Table 6.4 Source: Florida CHARTS, 2012.
45
Leading Causes of Death in Monore County, Florida 2011
Malignant Neoplasm (Cancer)
Heart Diseases
Unintentional Injury
Chronic Lower Respiratory Disease
Suicide
Chronic Liver Disease & Cirrosis
Diabete Mellitus
Cerebrovascular Diseases
Alzheimer's Disease
Nephritis, Nephrotic Syndrome, Nephrosis
Figure 6.3 Source: Florida CHARTS, 2012.
Chronic Diseases
Chronic Disease in Monroe County
2008-2010 Death Counts by Disease
Colorectal Cancer
Stroke
Healthy People 2020
Chronic Lower Respiratory
Disease
State
Monroe
Lung Cancer
Coronary Heart Disease
0
20
40
Figure 6.4 Source: Florida CHARTS, 2012
60
80 100 120
46
Figure 6.5 Source: Florida CHARTS, 2012.
Physical Activity of
Monroe County
Residents 2007
Inactive at work
Moderate
Physical Activity
Vigorous Physical
Activity
Figure 6.6 Source: Florida CHARTS, 2012.
Age-Adjusted Death Rates for Select Chronic Diseases
2000-2011 Monroe County, Florida
250
Diabetes
Stroke
Liver Disease
200
Cancers
150
100
50
0
2000
2002
2004
2006
Figure 6.7 Source: Florida CHARTS, 2012.
2008
2010
2011
47
Monroe County meets or exceeds national benchmark standards for Adult
Obesity and Physical Activity, according to the County Health Rankings (University of
Wisconsin and the Robert Wood Johnson Foundation, 2012).
Monroe County
National
Benchmark Goal
20%
25%
Adult Obesity
19%
21%
Physical Inactivity
Table 6.5 Source: county Health Rankings, 2012.
Florida
26%
24%
The prevalence rate of Asthma in the Monroe County overall adult population is
5.7% for 2012, 6.1% for 2007, and 7.2% for 2002; exhibiting a steady decline. The age
adjusted death rate per 100,000 persons in Monroe County for asthma over the last
twenty years is shown below.
Age Adjusted Death Rate for Asthma in Monroe County over
Twenty Years
10
8
6
Monroe County
4
2
0
1990
1994
1998
2001
2003
2005
2009
2010
Figure 6.8 Source: Florida CHARTS, 2012.
60
Age Adjusted Death Rates for Various Cancer Types in Monroe
County
50
40
30
20
10
0
2000
Lung
Pancreatic
2002
Breast
Bladder
2004
2006
Prostate
Stomach
Figure 6.9 Source: Florida CHARTS, 2012.
2008
2010
Colorectoral
Skin
2011
Cervical
48
Age-Adjusted Death Rates for Six Cancer Types in Monroe County, in Florida,
and Target Rates for Healthy People 2020 per 100,000
Cancer Type
Monroe County Florida Healthy People 2020
44.2
47.2
45.5
Lung
13.2
14.6
14.5
Colorectal
23.3
21.
20.6
Breast
18.4
18.2
21.2
Prostate
2.9
2.7
2.2
Cervical
4.8
2.8
2.4
Melanoma
Table 6.6 Source: Florida CHARTS, 2012.
Improved screening for various types of cancers throughout Monroe County has
increased detection and early treatment; however screening numbers for specific types of
cancer are still considerably low.
Cancer Screen: Test
% Monroe County
Type
2010
38.1
Age 50+ Colon Screen:
Blood Stool Test
58.3
Age 50+ Colon Screen:
Sigmoidoscopy or
Colonoscopy
93.8
Men Age 50+ Prostate
Screen:
Digital Rectal Exam
(DRE)
80.5
Men Age 50+ Prostate
Screen:
Prostrate Specimen
Antigen Test (PSA)
50.7
Women 18+ Cervical
Screen:
Pap Test
51.9
Women 40+ Breast
Screen:
Mammogram
Table 6.7 Source: Florida CHARTS, 2012.
% State of
Florida 2010
42.5
Healthy People
2020 Goal
70.5%
68.2
70.5%
86.6
n/a
85.
n/a
57.1
93%
61.9
74%
According to Bennett Kramer, MD, MPH, Director of the Division of Cancer
Prevention at the National Cancer Institute, 45% of all cancer deaths in the United States
are caused by one of four cancers: Prostate, Lung, Colorectal, and Ovarian Cancers
(National Cancer Institute, 2012). The U.S. Preventive Services Task Force (USPSTF)
recommends screening tests for each of these cancers to reduce morbidity and mortality”
(Centers for Disease Control and Prevention, 2012). Screening and early detection are
protective factors against the development of cancer.
49
Communicable Diseases
Florida Department of Health surveillance data for the first quarter of 2012 reveals a
slight decrease in new HIV cases from the same quarter in 2011, and indicates a total of
682 “presumed living HIV/AIDS cases in the County as of 3/31/2012” (Florida
Department of Health Division of Disease Control, April 2012, Monthly Surveillance
Report: Hepatitis, HIV/AIDS, STD and TB).
Age Adjusted Death Rates for HIV in Monroe County 1985-2010
70
60
50
40
HIV
30
20
10
0
1985
1990
1995
2000
2005
2010
Figure 6.10 Source: Florida CHARTS, 2012.
Risk Exposures and Positive HIV Tests in Monroe County, 2011
2011 Exposure
Number Number 2011 Exposure
Number Number
Category
of Tests Positive Category
of Tests Positive
16
1
0
Male Sex With
Hemophilia/Blood 0
Male/IDU
Recipient
207
9
59
0
Male Sex With
Victim of Sexual
Male
Assault
91
0
0
0
Injecting Drug
Health Care
User
Exposure
0
855
1
Sex Partner at Risk 197
Heterosexual
3
0
0
Child of Woman
No Acknowledged 6
with HIV/AIDS
Risk
196
0
18
0
STD Diagnosis
Unknown
26
0
Sex for Drugs or
Money
Total
1,674
11
Table 6.8 Source: Monroe County Health Department, HIV Testing and Counseling
Data, 2012.
The latest Tuberculosis information included in the April 2012 Surveillance Report
indicates a total of 2 cases of Tuberculosis present in Monroe County. Mortality reports
for TB in Monroe County indicate 1 death from TB in 2008 and zero deaths for the ten
50
preceding years; there have been no TB related deaths since 2008 in Monroe County.
The State of Florida closed its last TB dedicated Hospital Facility due to low prevalence
of the disease statewide, below capacity operations at the State facility, and the
availability of alternative care measures for the clusters established in specific counties
within the state. Risk factors for developing TB, in order of highest to lowest risk are:
1. Substance abuse
2. Originating from country of high prevalence
3. Homeless
4. HIV/AIDS – lower than the co-infection rate Statewide
Select Communicable Diseases in Four Florida Counties, 2010, per 100,000 persons
Communicable
Monroe
Okaloosa
Nassau
Hillsborough
State of
Condition
County
County
County
County
Florida
30.2
1.7
9.5
15.1
16.9
AIDS Cases
208.4
447.8
288.6
569.4
397.0
Chlamydia
1.4
2.2
2.7
7.
4.4
Tuberculosis
Table 6.9 Source: Florida CHARTS, 2012.
The Chronic Hepatitis C rate for the first quarter of 2012 reflects a negative 57%
change from the same quarter of 2011. During the first quarter of 2011 there was an
incidence rate of 37 new cases; in 2012 that number was 16. Incidence rates for Chronic
Hepatitis C are monitored locally and through a state-wide system.
Vaccine Preventable Diseases such as measles, rubella, and diphtheria, among
others, have been controlled and brought to a very low frequency in the United States
population through decades of routine immunizations of children zero to six years of
age, according to the CDC (Friis and Sellers, 2009). The very young and the very old
tend to be the most susceptible portions of the human population and therefore regular
health maintenance, including preventative measures, should be assured for these
segments.
In 2010 more than 60% of all Monroe County Senior Citizens received a flu
vaccination, while 37.9 % of the overall adult population elected to be immunized for
influenza. Influenza vaccines are recommended annually. Vaccinations currently exist for
many communicable diseases, including the human papillomavirus, Hepatitis A and C,
and Meningococcal disease a serious bacterial illness which causes bacterial meningitis.
Vaccine schedules in the United States are developed by the Advisory committee
on Immunization Practices (ACIP) according to age groups: 1) 0-6 years of age, 2) 7-18
years of age, and 3) adults. An additional schedule is used for travelers and includes
validating the age specific schedules for the traveler (CDC, 2012). The Monroe County
Health Department makes required vaccines available to the public through its clinics and
local public health facilities.
For certain conditions, such as Pertussis, it may at times be necessary to vaccinate
all adults who would come in contact with a newborn infant in order to create what is
known as ‘herd immunity’. If all persons surrounding a newborn are protected from
contracting and transmitting the disease, the infant is then protected from the introduction
of the disease. Recent spikes in rates throughout the state have sparked a ‘Whooping
Cough’ or TDAP vaccination campaign in Monroe County. This TDAP vaccine is
effective for Pertussis, tetanus, and diphtheria (CDC, 2012).The purpose of the campaign
is to alert families of the potential spread of this disease and to encourage adult
51
vaccination in order to promote herd immunity. The ACIP recommended infant
vaccination schedule for Pertussis begins at age two months; therefore vaccination of
surrounding adults prior to the age of two months can be essential.
Adults Who Received a Flu Vaccination in 2010
70
60
50
40
Monroe County
30
State of Florida
20
10
0
18- 44
45- 64
65+
Figure 6.11 Source: Florida CHARTS, 2012
Photo courtesy of the Monroe County Health Department
52
7. Infants, Children, and Youth.
Persons under 18 years of age: 11,378 (Miami Matters Monroe, 2012).
Over the last twenty years the infant mortality rate in Florida has been in a
steady decline. In the early nineties rates were at about 9.1 per 1,000 live births. Since
that time the decrease has been steady and the rate for the last three years has indicated a
significant drop. In Monroe County the rates have varied during this time period but have
generally remained lower than the state. Rates for Monroe County spike in 2000 to 8.8
per 1,000 live births and in 2006 to 8.3 per 1,000 live births; extreme lows are reported
for 1998 at 1.4 infant deaths per 1,000 live births and for 2005 at 1.3 infant deaths per
1,000 live births. The rate for the last three years has continued to decline and remains
lower than the state rate.
Infant Deaths per 1,000 Live Births
8
6
4
Monroe County
Florida
2
0
2009
2010
2011
Figure 7.1 Source: Florida CHARTS, 2012.
Well being, it has been established, is more than a physical state or the absence of
disease (WHO, 1948). For Monroe County children, several factors in their social
environment work against their overall well being including: poverty among families
with children, a high rate of foster care utilization, prevalence of mental and social
disturbance, and a rate of abuse that is higher than the State’s 10.6 per 1,000 persons
between the ages of 5 and 11 (Florida CHARTS, 2012).
Monroe County youth enjoy an 86.3% high school graduation rate, slightly
higher than the State’s 80.7% rate. 79.4% of Monroe County’s Middle School and 79.6%
of Monroe County’s High School students stated that they felt safe at school during the
2010 school year; the rates for the State of Florida are slightly less, at 76.3% of Middle
School students and 76.7% of High School students feeling safe at school. In 2009,
93.8% of the County’s students were ready for school at kindergarten entry.
Violent acts in school activities grades K-12 2009-2010
# of Events Rate per 1,000 students
2
.2
Nassau County
21
.7
Okaloosa County
321
1.7
Hillsborough County
7,298
2.8
State of Florida
24
2.9
Monroe County
Table 7.1 Source: Florida CHARTS, 2012.
53
Utilization of Foster Care
12
10
8
6
4
2
0
Rate per 1000 Monroe
County Children
1-5 years old
Rate per 1000 Florida
Children
5-11 years old
12-17 years old
Figure 7.2 Source: Florida CHARTS, 2012.
Children ages 5-11 Experiencing Child Abuse
20
15
10
5
0
Rate per 1,000 Youth
Monroe County
Nassau County
Okaloosa County
Hillsborough County
Florida
Figure 7.3 Source: Florida CHARTS, 2012.
Florida CHARTS data indicate that the suicide rate for persons 12-19 years of age
in Monroe County is 0%. Statistics for self-inflicted injury and eating disorders reflect
numbers so low that the data is insufficient to draw conclusions. However, 13.4 per 1,000
students in Monroe County received mental health treatment services between 2008and 2010; compared with 10.1 per 1,000 students state-wide. Monroe County youth ages
10-17 were referred to the Department of Juvenile Justice at a rate of 767.9 per 10,000
persons in 2008-2010. Florida youth, on the other hand, were referred at a rate of 658.8
per 10,000 persons. In Monroe County 1.4% of all K-12 students were considered
emotionally handicapped during the 2009-2010 school year; state-wide the percentage is
slightly lower at 1.0%.
54
Percent of Monroe County Students who Participated in Extracirricular
Activities
60.00%
50.00%
40.00%
30.00%
20.00%
10.00%
0.00%
School Sports
Organized Sports
Outside of School
Ages 10-14
School Band
Ages 15-17
School Club
Community Clubs
Total
Figure 7.4 Source: 2010 Florida Youth Substance Abuse Survey – Monroe County Report
Youth Risk Behavior Surveillance System surveys high school students nation
wide to determine risk behaviors as well as attitudes in the nation’s youth. Drug use,
obesity, alcoholism, pedestrian safety, and nutrition are some of the topics it addresses.
In 2010 the Florida Youth Substance Abuse Survey for Monroe County found
that in their lifetimes 69.4% of 15-17 year olds surveyed had used ‘alcohol or any illicit
drug’, 22.4% had used ‘alcohol only’, and 2.8% had used ‘any illicit drug, but no
alcohol’.
Lifetime Drug Use Among Monroe County Youth 2010: Florida Youth
Substance Abuse Survey
Ages 10-14
Ages 15-17
70.00%
60.00%
50.00%
40.00%
30.00%
20.00%
10.00%
0.00%
hol ttes ish nts ugs ms amine caine eroin santsievers mineseroids Drugs
o
H pres Rel eta
t
AlcoCigarea/HashInhalalub Drushroo
St unter
n
C r M amphCerack C
De Pain Amph
ijua
, o Meth e or
n tion
e-Co
P
o
h
i
t
Mar
t
C
r
,P
ain
crip crip
Ove
LSD
Coc
Pres Pres
Figure 7.5 Source: Florida Youth Substance Abuse Survey, 2010.
55
Student Use of Subtances in the Last 30 Days, 2010 Reporting
50
40
Middle School
Monroe County
High School Monroe
County
Middle School
Florida
High School Florida
30
20
10
0
Alcohol
Cigarettes
Marijuana
Figure 7.6 Source: Florida CHARTS, 2012.
3-Year Rates for Reported STD Cases
15-19 Year Olds, 2008-2010
3500
3000
2500
Monroe County
Nassau County
Okaloosa County
Hillsborough County
State of Florida
2000
1500
1000
500
0
Rate per 100,000 Students
Figure 7.7 Source: Florida CHARTS, 2012.
Monroe
County
2.2
Enteric disease: Rate per
1,000 Children under 6
Table 7.2 Source: Florida CHARTS, 2012.
Nassau
County
5.1
Okaloosa
County
5.
Hillsborough
County
2.4
State of
Florida
3.3
Additionally, results from the Youth Risk Behavior Survey indicate students’
weight status and classification. The percentage of students who are overweight, is
defined as those students with a body mass index which measures equal to or greater than
the 85th percentile, but less than the 95th percentile. The percentage of obese students is
defined as those whose body mass index is equal to or greater than the 95th percentile.
56
Below is a comparison of overweight and obesity prevalence rates for Florida
and the United States for youth between 2003 and 2011.
Youth Obesity and Overweight rates
Florida and the United States
20
Florida(obese)
15
United States (obese)
10
Florida (overweight)
5
0
2003 2005 2007 2009 2011
United States
(overweight)
Figure 7.8 Source: Florida Chartbook, Child Health Data, 2012.
Rates for Monroe County indicate that our children fair better than average in
terms of their weight. However, of the three youth age groups monitored within the
County, the youngest children bear the greatest burden of disease. For the category of
obese, or those with a body mass index at or above the 95th percentile, 11.5% of Middle
School students fall into this classification along with 10% of Monroe County High
School students. Monroe County checks in at the low end of the childhood
overweight/obesity scale in Florida for preschool aged children, with 19.8% of its
children between the ages of 2 and 4 years overweight/obese. Within the state some
counties reflect rates as high as 39.2% for pre-school aged students; Monroe County had
the lowest rate (19.8%) of all counties in Florida for this age group.
Obesity in Monroe County Students
20
15
Pre-school
10
Middle School
High School
5
0
2008-2010
Figure 7.9 Source: Florida Chartbook, Child Health Data, 2012.
The ratio of school nurses to students is better in Monroe County than it is statewide; for Monroe County it is 1:857 and for Florida it is 1:2,536. According to Florida
CHARTS data, Monroe County youth, ages 5-18, experienced lower rates of
hospitalization for both asthma and diabetes between 2008 and 2010 than in the State of
Florida in general.
57
Diabetes hospitalizations are less in the County than in the State for both of the
age groups monitored. The County rate per 100,000 persons for 5-11 year old is 43.3 and
for 12-18 year olds is 97.0 for diabetes hospitalizations. The State rates are 44.7 and
124.7 for the respective age groups.
Diabetes Hospitalizations 3-year rate per 100,000 persons
5-11 year olds 12-18 year olds
43.3
97.
Monroe County
44.7
124.7
State of Florida
Table 7.3 Source: Florida CHARTS, 2012.
Asthma hospitalizations per 100,000 persons in Monroe County were 22 for
persons aged 5-11 years and 13 for persons aged 12-18 in the period between 2008 and
2010. When comparing the three year asthma hospitalization rate for the County with
that of the State, the figures indicate a higher county rate per 100,000 persons for the 511 year old group and a lower County rate for the 12-18 year old group per 100,000
persons than the State of Florida.
Asthma Hospitalizations 3-year rate per 100,000 persons
5-11 year olds 12-18 year olds
490.7
270.1
Monroe County
416.8
330.1
State of Florida
Table 7.4 Source: Florida CHARTS, 2012.
Families below Poverty Level with Children 2012
Zip Code within
Monroe County
Number of
families below
poverty level
33036
16
33037
205
33040
272
33042
21
33043
42
33050
95
33070
44
County Total
698
Table 7.5 Source: Florida CHARTS, 2012.
Asthma Prevalence by Zip Code 2012
Zip Code
Asthma Prevalence,
by zip code
33036
11.8 (6/51)
33037
12 (46/383)
33040
17.2 (173/1003)
33042
15.5 (44/284)
33050
10.5 (29/275)
33070
11.6 (35/301)
TOTAL
14.5 (333/2297)
Table 7.6 Source: South Florida Asthma Consortium,
2012.
58
Healthy Start delivers risk based education and referral services to pregnant
women and their babies. According to the Healthy Start Care Coordination Executive
Summary Report for Monroe County, July 2010- June 2011, there were 715 infants
born in the County during the period assessed. Of those infants 703 were screened by
Healthy Start to determine a need for services. The total number of infants who received
a Healthy Start Service was 280; the total number of infants with an unknown program
outcome after initial contact was zero.
Births with Adequate Prenatal Care (Kotelchuk index)
Rolling Three-Year Percentage
3-Year
Percentage
Figure 7.10 Source: Florida CHARTS, 2012.
Photo courtesy of Monroe County Health Department
Kids Come First, a local Monroe County based not-for profit agency serving the
needs students in Monroe County provides essentials for students based on referrals
from within the school or community; discreetly or on an anonymous basis so that other
students are not alerted to the need and its fulfilling. According to Kids Come First’s
59
annual reports, at the start of the 2011-2012 school year they provided service to 378
students, at Christmas 577 students received five gifts each, and throughout the school
year 557 students received clothing, shoes, school supplies, and personal items. During
homecoming celebrations 79 teens were supplied with appropriate attire and 77 were
outfitted for Prom 2012.
A typical support package from Kids Come First might include any combination
of the following: two or three new outfits, a sweater or hoodie jacket, underwear, socks,
new shoes, and personal items, as well as a backpack filled with school supplies. The
organization provides services throughout the year as requests are made and no child is
turned away. During the 2011-2012 school year 120 volunteers served 1,479 Monroe
County youth from Monroe County Public Schools, Charter Schools, daycares, churches
and agencies such as the Domestic Abuse Shelter, Child Homeless Intervention Program
(CHIP), the Florida Keys Children’s Shelter, Project Lighthouse, Wesley House Family
Services, and the Guidance Care Center throughout the Florida Keys from Key West to
Key Largo. Records from Kids Come First indicate over 370 youth in Monroe County
are homeless.
Florida Keys Children's Shelter
Program Served 653 Children, Teens,
and Families during 2010-2011
100
Poincianna
Emergency
Home
80
Non-Residential
300
40
Poincianna
Group Home 200
Com m unity
Based
Counseling
20
100
Project
Lighthouse
60
Residential
400
0
Residential
Jelsema
Children's
Center
0
Non-Residential
Figure 7.11, 7.12, and 7.13 Source: Florida Keys Children’s Shelter, 2011, Gratitude
Report
60
8. Seniors.
14000
12000
10000
8000
Total Age 65+
6000
Males
Females
4000
2000
0
Seniors in Monroe County
Figure 8.1 Source: Florida CHARTS, 2012.
Age Group
Males
4,342
65-74
2,417
>74
6,759
Totals
Table 8.1 Source: Florida CHARTS, 2012.
Females
3,469
2,407
5,876
Total
7,811
4,824
12,635
Approximately 3.7% of seniors in Monroe County experience an unintentional
fall related injury each year, according to the Florida Office of Injury Prevention.
►Traumatic brain injuries were related to 46% of unintentional fall-related deaths and
responsible for 10% of non-fatal unintentional fall-related injury hospitalizations in the
State.
►The rate of injury, fatal and non-fatal, increased dramatically with age among both
males and females in the State, and residents aged 85 years and older were most at risk.
(Florida Department of Health Office of Injury Prevention, 2012)
Emergency Department Visits for Non-Fatal Unintentional
Injuries Persons 65 or Older in Monroe County 2010
Overex
ertion
Pedalc
y
clist
Cut Pie
r
Struck
b
ce
y Again
st
Falls
0
100
200
300
Monroe County Seniors
Figure 8.2 Source: Florida Office of Injury Prevention, 2012.
400
500
61
For the period of 2005-2009 seniors in Monroe County experienced between 212
and 857 non-fatal hip fracture hospitalizations, the highest frequency category in the
State (Florida Office of Injury Prevention, 2012).
►Hip fractures are often related to falls and can lead to a steep decline in health due to
an individual’s loss of mobility and independence.
►Hip fractures can lead to reduced quality of life and premature death.
►About one in five hip fracture patients dies within one year of their injury.
►Up to one in four adults who lived independently before their hip fracture has to stay in
a nursing home for at least one year after their injury.
►35% of all non-fatal injury hospitalizations among Florida’s seniors were related to a
hip fracture (Florida Department of Health, Office of Injury Prevention, 2012).
Hip Fractures and Unintentional Falls in Monroe County Seniors, 2009
Hip Fractures
Total
Population
Unintentional
Fall Related
Injury
Total Senior
Population
Figure 8.3 and 8.4 Source: Florida Department of Health Office of Injury Prevention,
2012.
Percent of Monroe County Seniors (65 and Older) Who:
Were limited in any way in any usual activities because of Arthritis or
chronic joint pain
With chronic joint symptoms, saw a doctor or health professional for
joint symptoms
Experienced symptoms of pain, aching, or stiffness in and around a joint
Were told they have some form of Arthritis
Were limited in any way in any activities because of a physical, mental,
or emotional problem
Use special equipment because of a health problem
Have previously had a Heart Attack
Have previously had a Stroke
Table 8.2 Source: Florida CHARTS, 2012.
18.6%
80%
49.6%
49.4%
32.5%
11.6%
24.3%
8.2%
62
Where Do Seniors in Monroe County Live?
Key West Housing Authority Senior Plaza
Key West Health and Rehabilitation
Key West Housing Authority Gated Community
Plantation Key Nursing Center
Bayshore Manor Key West
Heron House Marathon
MARC Assisted Living
Figure 8.5 Sources: multiple (Each agency was contacted for a direct count) (all other
seniors are presumed to live in their homes alone, with family, or with friends), 2012.
The Southernmost Homeless Assistance League (SHAL) counts 17.2% of the
2011 homeless population in Monroe County as being aged 60 or older; indicating that
there are approximately 179 homeless seniors in Monroe County.
Seniors in Monroe County, their caregivers, and their family members have
access to a 24 hour Helpline available seven days per week. The Helpline can provide
caregiver support and training, crisis intervention and referrals. The Helpline staff also
provides a call-in service. Staff will call in to elderly persons on a regular basis to check
their medications, remind them of appointments, check their general welfare, and provide
encouragement and support as needed. This is a free service to seniors and their families
in Monroe County. Call-ins to seniors can generate referrals to other partner
organizations, in order to assist seniors in receiving any additional services they may
require; of the twenty-four seniors registered for call-ins with Helpline, sixteen live in
their own homes.
Percent of Monroe County Seniors
“Very satisfied” or “Satisfied” with their lives
Good to excellent overall health
Good physical health
Good mental health
“Fair” or “Poor” overall health
Table 8.3 Source: Florida CHARTS, 2012.
97.2
82.3
85.1
92.8
17.7
63
Conclusions
Figure 9.1 Source: Healthy People 2020
Median Age: 46.3 years
Persons under 18 years of age: 11,378
Table 1.2 Florida CHARTS, 2012
Persons 18 years of age or older: 61,013
Persons 65 and over: 12,092
Photo courtesy of Florida Keys AHEC
Monroe County Residents who are “Satisfied” or “Very Satisfied” with their Lives
95.5
18-44 years old
92.7
45-64 years old
65 & older
Table 2.1 Source: Florida CHARTS, 2012.
97.2
64
Overall health is good, but risk related behavior, both in the affluent and the
economically marginalized, is prevalent. 25% of Monroe County adult residents binge
drink and 21% smoke tobacco (Florida CHARTS, 2012).
Unintentional Injuries Age Adjusted Death Rates per 100,000 persons 2008-2009
Monroe County
State of Florida
Healthy People 2020 Goal
68.8
43.1
36.0
Table 5.3 Source: Florida CHARTS, 2012.
Behavioral Risk Factors
Monroe
County
21.1%
36.5%
State of
Florida
17.1%
38.6%
Healthy People
2020 Goal
12%
13.5%
% of Adults Who Smoke Tobacco
% of Adults Who Have Been Diagnosed
with High Blood Cholesterol
23.2%
26.4%
32.6%
% of Adults Who Engage in No Leisuretime Physical Activity
17.4%
27.2%
30.6%
% of Adults Who are Obese
25%
15%
8%
% of Adults Who Heavy or Binge Drink
Table 2.2 Source: Florida CHARTS, 2012 and County Health Rankings, 2012.
Families with children and the working middle class are subject to health
consequences of a seasonally based, service driven economy as reflected in high foster
care utilization rates, high Medicaid utilization rates, and poverty related asthma
prevalence (see Tables 7.5 and 7.6). Race is a factor in poverty levels and groups with
greater exposure to poverty experience related negative health consequences, including
difficulty accessing services.
Individuals at or below Poverty Level by Race
County Rate
State Rate
Black
15.2%
25.9
Hispanic
17%
18%
White
9.7%
9.5%
Non-Hispanic
9.%
11%
Table 4.10 Source: Florida CHARTS, 2012
Economic stability correlates to well being in a positive relationship. Health
disparities are primarily economic in nature.
Monroe County Residents with Good Mental Health (2010)
<$25,000 annual
$25,000- $50,000
2010
income
annual income
78.7%
78.4%
Monroe County
Residents Who:
receive the social
and emotional
support they need
Table 2.3 Source: Florida CHARTS, 2012.
90.9%
> $50,000 annual
income
92.1%
65
Improvement is needed in the prevention and early detection of Melanoma, as
rates remain above State and National levels (Florida CHARTS, 2012). Lung cancer rates
remain consistently high over the last decade, and rates of breast cancer should be closely
monitored for increases. Prevention and early detection through improved screening
could improve residents’ overall cancer mortality rates (Florida CHARTS, 2012) and
(National Cancer Institute, 2012) and (Centers for Disease Control and Prevention, 2012).
Federally Qualified Health Care Centers, such as the Lower Keys Community
Center, will support greater health equity in Monroe County. Care coordination and
creation of geographically relevant medical homes or technologically linked medical
homes are needed for residents throughout Monroe County. Electronic medical records,
pharmacy partnering, provider collaboration, and employment of National Health Service
Corps professionals are the standards for FQHC’s; the Lower Keys Community Center
will be no exception.
Expansion of Federally Qualified Health Centers in the County will address some
issues of access and under-service for residents. Ongoing community engagement and
social supports will continue to make both positive and negative contributions to the
health of Monroe residents. Support for in-County infrastructure and improved use of
technology will also further the cause of health equity in Monroe County and serve to
eliminate economically associated disparities in access and health status reflected in the
Monroe County 2012 Health Assessment Status Profile Report.
Policies and programs which support changes in the norms and encourage
prevention would promote alternatives to risk related behavior. Individual choice will
continue to play a role in determining the overall health status of residents of Monroe
County, Florida as will the geologic influences of climate change, and population
fluctuation associated with seasonal tourism. Programs, policies, and systems changes
should focus on promoting conditions of wellness and emphasizing positive health
consequences of positive health behaviors. Public Health Resources should continue to
seek to bridge economic gaps and to engage residents of statuses in positive health
behaviors.
Chronic and communicable disease age adjusted mortality rates have been in
decline and are below the State rates and the Health People 2020 benchmark goals for
the Nation.
Chronic Disease in Monroe County
2008-2010 Death Counts by Disease
Colorectal Cancer
Stroke
Chronic Lower Respiratory Disease
Lung Cancer
Coronary Heart Disease
0
20
40
Monroe
Figure 6.4 Source: Florida CHARTS, 2012
60
State
80
Healthy People 2020
100
120
66
During the period of 2009-2011, Monroe County experienced 708 live births per
100,000 persons, 93.2% were born a t a normal, healthy weight; nearly 85% of all births
during the period received pre-natal care during the first trimester. The infant mortality
rate for this period in Monroe County is 4.7% or 3 infant deaths per 1,000 live births and
for the State is 6.6% (Florida CHARTS, 2012).
Monroe County
Adult Obesity
20%
National
Benchmark Goal
25%
Physical Inactivity
19%
21%
Florida
24%
26%
Table 6.5 Source: county Health Rankings, 2012.
Select Communicable Diseases in Four Florida Counties, 2010, per 100,000 persons
Communicable
Condition
Monroe
County
Okaloosa
County
Nassau
County
Hillsborough
County
State of
Florida
AIDS Cases
Chlamydia
30.2
208.4
1.7
447.8
9.5
288.6
15.1
569.4
16.9
397.0
Tuberculosis
1.4
2.2
2.7
7.
4.4
Table 6.9 Source: Florida CHARTS, 2012.
67
References:
Action for Healthy Kids, The Learning Connection: The Value of Improving Nutrition
and Physical Activity in Our Schools, 2004
www.ActionForHealthyKids.org [July 7, 2005].
Agency for Health Care Administration, 2012, Emergency Room Visits by County and
Discharge Type.
www.FloridaHealthfinder.gov
Area Resource File, Health Resources and Services Administration, Monroe County,
2012.
http://www.arf.hrsa.gov/arfwebtool/Counties_list.asp
Bartholomew, L. Kay, Parcel, G., Kok, G., and Gottlieb, N., 2006, Planning Health
Promotion Programs: An Intervention Mapping Approach.
Bureau of Economic and Business Research University of Florida, 2012
http://www.bebr.ufl.edu/data/databank
Center for Disease Control and Prevention, 2012, Morbidity and Mortality Weekly
Report: Cancer Screening in the United States, Weekly January 27, 2012 / 61(03); 41-45.
Center for Disease Control and Prevention
http://www.cdc.gov/nchs/data/hus/2011/024.pdf (unintentional injury data U.S.)
Child Health Data
http://www.childhealthdata.org/browse/snapshots?geo=11#bottom
City Data
http://www.city-data.com/county/Monroe_County-FL.html#ixzz1yH2MyRmB
City Data
http://www.city-data.com/county/Monroe_County-FL.html#ixzz1yGunUpI5
City Data Marital Status of Monroe Residents
http://www.city-data.com/county/Monroe_County-FL.html#ixzz25W8sLjAs
City Data, Religious Affiliations; Jones, Dale E., et al. 2002, Congregations and
Membership in the United States 2000.
http://www.city-data.com/county/religion/Monroe-County-FL.html#ixzz25WActLbt
Fetterman, D., 2001, Foundations of Empowerment Evaluation
Florida Center for Instructional Technology, 2009, Exploring Florida Maps.
68
Florida Community Health Assessment Resource Tool Set (CHARTS)
http://www.floridacharts.com/charts/Domain2.aspx?Domain='03'
http://www.floridacharts.com/charts/AdolProfile.aspx?county=44&profileyear=2010
http://www.floridacharts.com/charts/brfss.aspx
http://www.floridacharts.com/charts/mapp_report.aspx
Florida Department of Education, 2011, Education Information and Accountability
Services, Data Report.
http://www.fldoe.org/eias/eiaspubs/word/frplunch1011.doc
Florida Department of Health, 2012, Office of Injury Prevention.
http://www.doh.state.fl.us/demo/InjuryPrevention/InjuryData.html#stateCounty
Florida Keys Aqueduct Authority, 2012, Florida Keys Aqueduct Authority Water Sold
Report: September 2011 - August 2012.
Florida Keys Aqueduct Authority, 2005, FKAA Alternative Water Supply Plan.
http://www.fkaa.com/alt_supply_plan.htm
Florida Legislature: Office of Economic and Demographic Research, 2012.
http://edr.state.fl.us/Content/area-profiles/county/monroe.pdf
Friis, R. and Sellers, T., 2009, Epidemiology for Public Health Practice.
Global Development Research Center, 2012, Ontario Social Development Council, 1997.
http://www.gdrc.org/uem/qol-define.html
Greenseid, L., Lien, B., Rainey, J., Ficek, A., 2012, Area Health Education Centers
(AHEC) Cessation Interventions Evaluation: FY11 Final Evaluation Report, December,
2011.
Healthy People 2020
http://www.healthypeople.gov/2020/consortium/HealthyPeoplePresentation_2_24_11.ppt
#299,15,Slide 15
Islamorada/ Key Largo Free Press, 2012, Smoking Cessation Program Earns High Ranks,
February 15, 2012. www.keysnews.com/archives
The Key West Citizen, The Bottom Line, Sunday, April 17, 2011.
Marshall, Christa, 2012, Key West Ponders a Submerged Future, Climate Wire, August
13, 2012.
Miami Matters.com, Demographics, Monroe, 2012.
69
http://www.miamidadematters.org/index.php?module=DemographicData&type=user&
func=ddview&varset=1&ve=text&pct=2&levels=1&topic1=County&topic2=Monroe
http://www.miamidadematters.org/index.php?module=DemographicData&type=user&fu
nc=ddview&varset=1&ve=text&pct=2&levels=1
http://www.miamidadematters.org/index.php?module=DemographicData&type=user&fu
nc=ddview&varset=1&ve=text&pct=2&levels=1&topic1=County&topic2=Monroe
http://www.miamidadematters.org/index.php?module=DemographicData&type=user&fu
nc=ddview&varset=1&ve=tab&pct=2&levels=1&topic1=County&topic2=Monroe&varid=2699&vl=tb&sregcomp=1
Mitchum, Gary T., 2011, Sea Level Changes in the Southeastern United States Past,
Present, and Future, University of South Florida.
Monroe County and Incorporated Municipalities Key West, Marathon, Key Colony
Beach, Layton, and Islamorada Village of Islands, Local Mitigation Strategy 2010 .
National Academy of Sciences, 2012, Primary Care and Public Health: Exploring
Integration to Improve Population Health.
Ray & Associates LLC, 2012, Monroe County, Florida Needs Assessment
Sperling’s Best Places
http://www.bestplaces.net/cost_of_living/county/florida/monroe
United States Census
http://quickfacts.census.gov/qfd/download/DataDict.txt
U.S. Census Bureau, 2010, American Community Survey.
http://factfinder2.census.gov/faces/tableservices/jsf/pages/productview.xhtml?pid=ACS_
10_1YR_S1101&prodType=table
United States Department of Health and Human Services, Center for Disease Control and
Prevention, 2012, Recommended Immunization Schedules for Persons Aged 0 through 18
Years.
United States Department of Health and Human Services, Center for Disease Control and
Prevention, 2012, Recommended Adult Immunization Schedule United States- 2012.
United States Department of Health and Human Services, Center for Disease Control and
Prevention, 2012, General Recommendations for Vaccination & Immunoprophylaxis.
Whitaker, Robert C., et al., "Predicting Obesity in Young Adulthood from Childhood and
Parental Obesity," New England Journal of Medicine 337 (1997): 869-73.
70
Wang, Guijing and Dietz, William H., 2002, "Economic Burden of Obesity in Youths
Aged 7 to 17 Years: 1979-1999," Pediatrics, 109, 5 (2002): E81
World Health Organization, Preamble to the Constitution of the World Health
Organization as adopted by the International Health Conference, New York, 19 June - 22
July 1946; signed on 22 July 1946 by the representatives of 61 States (Official Records of
the World Health Organization, no. 2, p. 100) and entered into force on 7 April 1948.
Appendix A: Health Care Services Inventory
Agency
Human Services Advisory Board support
in 2012 is indicated by red text
AARP American Association of Retired
Persons
AIDS Help
Alcoholics Anonymous
Alliance for Aging
Alzheimer's Assoc. SF
American Cancer Society
American Red Cross
A Positive Step
Bay Shore Manor
Boys & Girls Club
Cancer Found of FL Keys
Catholic Charities
Center for Independent Living
Child Find/FDLRS
Children's Medical Services
C.H.I.P.S.
Child Support Enforcement
City of Key West
Community Foundation of the Florida
Keys
Department of Children and Families
Access Florida
Department of Juvenile Justice/Teen
Court
De Poo Hospital
Domestic Abuse Shelter
Services
other Services
Target Population
Adult Services
Support Services
Support Services
Adult Services
Support Services
Health Care
Education & Disaster
Services
Day Treatment
Adult/ALF Services
Children's Services
Health Care
Shelter/Economic
Assistance
Disabled Services
Special Needs
Health Care
Children's Services
Economic Services
Community
Adults/retirees
HIV positive persons
Adults w/ alcoholism
Older Adults
Adults
cancer patients
Community Grants
Economic Services
Economic Services
community
children and families
families and individuals
Diversion Program
Health Care
LK-Emer Serv
LK Shelter-Shelter
MK Shelter- Emer Serv
UK Key Largo- Emer Serv
teens and families
community
victims of dom violence
community
Older adults
children
cancer patients
adults & families
Disabled Adults
children w/spec needs
children
children
families of children
community
72
Drug Court
Early Learning Coalition
Easter Seals Keys Region
Early Steps Program
Fisherman's Hospital
Florida Keys Area Health Education
Center
Florida Keys Children's Shelter
Florida Keys Community College
RAVE Program
Florida Keys Healthy Start Coalition
Florida Keys Outreach Coalition
Men
Women/Children
Food Stamps- DCF Access line
Gay & Lesbian Community Center
Geriatric Care Management of Florida
Keys
Good Health Clinic (Upper Keys)
Green Living Energy Education (GLEE)
Griswold Special Care
Guardian ad Litem
Guidance Care Center (Lower Keys,
Middle Keys, Upper Keys)
Habit for Humanity (Big Pine Key)
Head Start Program (Lower Keys, Middle
Keys, Upper Keys)
Helpline Inc.
Caregiver Support
Caregiver Training
Hospice of the FL Keys/Visiting Nurses
Association
Heron/Peacock Supported Living (Middle
Substance Abuse
Ed/Children's Services
Children's Services
Special Needs
Health Care
Substance abusers
children
children
children w/spec needs
community
Health Services
Childrens' Services
Educational
Economic Services
Children's Services
Economic Services
Transitional Services
Transitional Services
Economic Services
Support Services
community/professionals
children
community
FKCC students
children/families
Homeless adults
Adult Services
Health Care
Older Adults
families/individuals
Sustainability Education
Health Care
Family Services
Mental Health & Subst.
Abuse
Housing and Repairs
families/individuals
GLBT persons
Community Garden, Green
Business Certification, Energy
Audits
families/individuals/policymakers
families
individuals
families/individuals
Children's Services
Info & Referral
Support Services
Support Services
children
Pallative Care
Supported Housing
hospice clients
73
Keys)
Human Services Association, Inc.
Keys Area Interdenominational
Resources (KAIR)
Keys Energy Services
Keys Konnections Inc.
Keys Outdoor Temporary Shelter (KOTS)
Key West Transit Authority
Key West Housing Authority
Key West Police Department
Kids Come First
Keys Outreach Temporary Shelter
Last Stand
Legal Services of the Florida Keys
Life Line Home Health Care
Lions Eye Clinic
Literacy Volunteers of America
Lower Keys Medical Center
Mariner's Hospital
Medicaid Hotline
Metropolitan Community Church
Monroe Association of ReMARCable
Citizens
Miami Children's Hospital
Mo. Co. Admin Offices
Monroe County Extension Service
Monroe County Health Department
Youth Prevention
youth
Support Services
Utilities
Children's Services
Shelter
Transportation
Housing Applications
Emergency Assist
Children's Services
emergency shelter
Environmental advocacy
Legal Services
Health Care
Health Care
educational
Health Care
Health Care
Economic Services
Support Svcs/Meals
Special Needs
Health Care
government
Educational
Health Care
individuals
Shade tree plant giveaways,
energy audits
children
adults
community
community
community
children
adults
community
adults
community
community
community
Health Care Center 292-6885
Roosevelt Sands Clinic 809-5680
Roth Bldg (UK) 853-7400
Ruth Ivins Center (MK) 289-2708
Chronic Disease Prevention 8095653
Environmental Health 289-2724
individuals and families
adults w/developmental
exceptionalities
children
community
community
community
74
Healthy Start 809-5654
Hepatitis Prevention 809-5620
HIV/AIDS Prevention 289-2729
School Health 809-5621
Tobacco Prevention 809-5653
Tuberculosis Prevention 809-5622
WIC Nutrition 809-5684
(MK) 289-2718
(UK) 853-7402
Vital Statistics 809-5650
Monroe County In-Home Services
Monroe County Nutrition/Meals
Monroe County Public Library
Monroe County Public Schools
Monroe County Sheriff's Department
Monroe County Social Services
Monroe County Transportation
Moral, Welfare, and Recreational (MWR)
Narcotics Anonymous
Navy Branch Medical Clinic
Navy Fleet and Family Support Center
New Beginnings of the Florida Keys
Our Kids of Miami-Dade/ Monroe
Pinnacle Group
Primary Care Clinic
Project Lighthouse
Rural Health Network
Salvation Army
Samuel's House Inc
Southernmost Homeless Assistance
League (SHAL)
SHINE
Sister Season Fund
Adult Service
Elder Services
Educational
Educational, Special Needs
Emergency Assist
Community & Support
services
Adult Services
Military Services
Support Group
Military Health
Military Support
Children's Services
Childrens Services
Behavior Analysis
Health Care
Young Adult Services
Administration/Dental Srvcs
Economic Services
Emergency Services
Homeless Coalition
Health Care
Economic Services
Adult Services
Special Needs Registry/Weather
Asst
adults
seniors
community
children and families
community
individuals and famillies
community
military community
adults
military community
military community
children
children
adults/ families
youth
community
community
women and children
homeless persons
adults
75
St. Leo College
St. Martin de Porres Food Pantry
St. Mary Star of the Sea
St. Paul's Episcopal Church
Social Security Administration
South Florida Workforce
State Attorney
United Way of the FL Keys
Veterans’ Affairs Outpatient Clinic
Veteran's Affairs
Victims of Crime Advocates
Vocational Rehabilitation
Volunteers of America of Florida
Wesley House Family Services
Womankind, Inc.
Anchors Aweigh Club
Be the Change/ Monroe Youth Challenge
Be the Change/Kids Come First
Big Pine Athletic Association
Grace Jones Back Pack 4 Kids
Heart of the Keys Recreation Assoc
Independence Cay
Educational
Meal Distribution
Outreach/Soup Kitchen
Economic services
Economic Services
Unemployment
Criminal Protection
Economic Services
Health Care/Support
Economic Services
Adult Services
Adult Services
Veteran's Services
Children's Services
Health Care
Integration
Legal Advocacy/Support
Transitional Housing
youth
Transitional Housing
HOTLINES
Abuse
Alcoholics Anonymous
American Pregnancy
Child Support Enforcement
Disaster Hotline Monroe
Elder Helpline (Alliance for the Aging)
Family Health Line of Florida
Federal Emergency Management Agency
Florida Attorney Referral Service
Food Access and Recovery
adults
individuals and families
individuals and families
individuals and families
adults
adults
community
individuals and families
veterans
veterans
adults
adults
community
children and families
women
alcoholics
youth
youth
Homeless Shelter/Soup Kitchen
primarily adult men
76
Florida Domestic Violence
Gambling Problems
Immigration
National Child Sex Abuse
National Suicide
Parent Helpline
Poison Control
Run Away
Smoking Quit Line
Appendix B:
Municipal Solid Waste Collection and Recycling 2010
78
Appendix C
Florida Keys Beach Water Sampling Test Sites
MonroeCounty
Sample Locations
79
Appendix D:
Key West Vision 2020; Progress Review
Key West Greater Chamber of Commerce Members, 2008
Key West Vision 2020
Ten Year Progress Review
Draft J - November 2008
1
During 1998 and 1999 the Key West Chamber of Commerce crafted a vision for the
future of Key West. This vision was drafted through a series of community forums. That
process was intended to take into account what were seen as likely developments and
preferences of residents and businesses to envision Key West in the year 2020 under the
belief that unless we understood and agreed upon where we wanted Key West to be, we
would “end up in a place we probably would not have chosen.”
The original 14 goals enumerated by the Key West Chamber’s Vision 2020 at that time
were conceived as building blocks for a “where to go” piece rather than a “how to do it”
piece.
In 2004, the Chamber revisited this Vision with a Five Year Progress Review (“Draft I”
of May, 2004). This attempted to measure progress and to determine where we need to
go. This review updates trends and progress since that time to further gauge whether
these goals continue to be appropriate and realistic or need to be modified. Further, this
review is anticipated to be helpful in focusing objectives for the Key West Chamber of
Commerce in the coming years.
By the Year 2020:
Vision 2020 Goal 1: We will have achieved a balance of workforce to housing
availability and affordability achieving the goal of no more than one third of income
(when compared to 45% in 1998) necessary to fund housing costs of workers in our
community.
Ten Year Progress Review: Despite the recent downturn in the local as well as national
real estate markets, the affordable housing crisis has worsened since 1998. The median
single family home in Key West sold for $238,250 in 1998 and more than tripled in price
to $800,000 at its peak in 2005. Market correction during 2006 and 2007 saw 2007 prices
for the median Key West single family home fall to $572,500, still almost 2½ times the
1998 level. Preliminary data from the same source (the Monroe County Property
Appraiser’s Office recorded transactions through August, 2008) indicates a further drop
to $550,000 not including short sales and foreclosures. Lest we believe the market has
already taken care of the problem, consider this: a moderate income family earning the
median $65,200 HUD income limit would need to amass $110,000 to achieve a 20%
down payment. Even after having done so, the percentage of income paid for housing
assuming a 6¼% interest rate would be closer to 66% now compared with the 45% level
in 1998.
The partnership for Community Housing in partnership with the Rodel Foundation of
Key West commissioned an Affordable Housing Needs Assessment for Monroe County
by the Metropolitan Center of Florida International University. The findings were
released in February, 2008 and, respecting the standard 30% of income ration for
housing, showed “that 57 percent of owner households in Monroe County earning less
than the area median income (AMI) are cost burdened. A striking 85 percent of renter
80
households earning less than the AMI are cost burdened.” The study noted that the
second-home market plays a prominent role in the Key’s real estate market and the
vacancy rate representing seasonal, recreational or occasional usage, had risen from 17%
of total housing units in 1990 to 38% in 2006. This growth in the second home market
and the accompanying rise in housing prices has been an important factor in the
imbalance in the county’s affordable housing supply since it has contributed to the
substantial loss of the County’s rental housing supply including mobile homes.
Moreover, the study found that 91.3% of all jobs in Monroe County were in service
providing industries where the “vast preponderance of employment is found in low-wage
earning occupations. In fact, Monroe County’s 2006 median annual wage for all
occupations was only $31,155.” The study concludes that the current housing
affordability gap cannot be addressed without deep subsidies and/or a heightened level of
new affordable housing production. Finally, the study notes that since Key’s employment
concentrations are in four cities and limitations on land development exist in
unincorporated areas of Monroe County, affordable housing policies and strategies
should focus on infill development opportunities within these existing residential and job
centers. Although a seemingly dire outlook, the affordable housing issue in Key West is
not without progress. A preliminary inventory of housing units drafted by the Key West
Community Housing Committee indicates over 1,600 units of affordable housing exist in
the city. Of these, 903 rental units are controlled by the Key West Housing Authority.
These include the Senior Citizen Plaza (199 units), Poinciana Plaza (154 units from the
Navy BRAC Commission), Porter Place (128), George Allen (117), Fort Village (84),
Robert Gabriel (53), Key Plaza A (28 Section 8 units), Key Plaza B (38 Section 8 units),
Paterson& 3rd Streets (6) and the Roosevelt Gardens Complex completed in the spring of
2004 (96 units).
The newest addition to workforce housing are the Railway Condominiums, 38 one and
two bedroom units located adjacent to the market rate Steam Plant luxury condominiums.
These ranged in price from $170,000 to $250,000, with monthly mortgage payments
spanning $1,000 to $1,700, not including taxes and condominium fees which include
insurance. AIDS Help, a local non-profit has applied for $12 million in state funding
from the Florida Housing Finance Corporation to build 50 new one-bedroom apartments
at the Poinciana Plaza. Although not in the City of Key West, Stock Island is considered
a source of affordable housing for Key West workers. Tortugas West, an 18 unit
development was built and sold at the end of Maloney Avenue followed in 2006 by the
40 unit Park Village affordable housing development. The Islander Village is an
affordable housing complex of eighty-nine 2 and 3 bedroom units currently under
construction. The developer is also offering a rent-to-purchase alternative to qualified
persons in this complex. Habitat for Humanity has been a mainstay of affordable
community housing for many years. The local organization, Habitat for Humanity of Key
West and the Lower Florida Keys was organized in 1999. Since that time, over 200
homes have been renovated and made available at affordable prices to the Lower Keys
community. Additionally, Habitat for Humanity has built 19 new housing units, has 18
units under construction and an additional 44 in process of planning and permitting.
As a gauge of political will, the City of Key West has established a Community Housing
Committee to coordinate workforce and affordable housing initiatives and funds a
consultant to direct those efforts.
Ordinances include those enacted October 2005 which established requirements of
affordable workforce housing to be in a ratio of 30% of all new market-rate multifamily
81
residential housing or, in lieu of same, a $200,000 per unit fee shall be contributed to
the affordable housing workforce trust fund. (That fund has a $300,000 balance). Another
ordinance passed in September 2008 established a Homebuyers Assistance Program
wherein the City would provide loans of up to $20,000 interest free to help eligible
persons meet down payment requirements to be approved by mortgage lenders for home
loans. Although this ordinance will need to be supplemented by Local Homebuyer’s
Assistance Program guidelines to be drafted and approved prior to implementation, this
program could be a solution to overcoming an important obstacle to home ownership of
affordable housing units.
A voter referendum to permit an Assisted Living and Independent Living Facility for
Senior Citizens on Truman Waterfront land conveyed to the City by the Navy was
overwhelmingly approved. In October 2008, a resolution to approve a 99 year lease to
implement that referendum concept was approved. Of the 135 proposed units, 28 will be
subsidized by the remaining 107 market rate units.
This past spring, the City attempted to create a dedicated funding source for its affordable
housing initiatives by adding affordable housing to the list of State of Florida approved
uses and activating an additional cent of Tourist Development taxes that is already
authorized by the State of Florida for Monroe County as an Area of Critical Concern. The
attempt was unsuccessful at that time. However, a resolution by the City urging the
Florida State Legislature to assist in implementing funding sources dedicated to the
creation and retention of affordable workforce housing was postponed from the October
21st City Commission agenda.
Key West Vision 2020
Ten Year Progress Review
Draft J - November 2008
4
Vision 2020 Goal 2: Greater Key West’s resident population will have grown slowly,
increasing by about 10% to 30,000.
2008 Ten Year Progress Review:
The 2007 estimate of Key West population was 22,082 as reported by the U.S. Census
Bureau, American Fact Finder database. This is a significant 13% decline in population
compared with the 25,478 reported in the 2000 census and equates to a compound annual
loss of 2% of the population.
This is a greater loss than for Monroe County as a whole which is estimated to have lost
8% in population over the last seven years. Florida, on the other hand, has grown by over
14% during that time while the U.S. population is estimated to have grown by over 7%.
The age profile of the Keys is significance. Although it is true that the United States has
aged (from a median age of 32.9 years in the 1990 census to an estimated 37.9 years of
age in 2007), Monroe County has aged faster and is significantly older (from a median
age of 38.7 year in 1990 to an estimated 47.3 years in 2007). Decreases in the proportion
of 20-34 year olds coupled with declining school populations indicate an exodus of
young families. The increase in the 45-64 year olds, some immigrating with greater
wealth could lead to a different consumer base. However, this could have potentially
serious ramifications for sustaining a stable workforce. Unfortunately, age demographics
for Key West are not available between censuses so that a 2007 picture cannot be drawn
directly.
82
However, because the Key West is a significant part of Monroe County and its trend is
reflected in the County’s statistics, there is probably not a great variance between the
County and City aging trends.
This is also reinforced by school population trends between the County and City that are
closely aligned.
Key West Vision 2020
Ten Year Progress Review
Draft J - November 2008
5
Vision 2020 Goal 3: We will have an expanded 10-month tourist season. Our visitors
will more likely to arrive by boat or fly, arriving at improved dock facilities or the
new, improved airport.
2008 Ten Year Progress Review:
The estimate of Key West visitors for 2007 was for 2.1 million people, down
significantly from the 2003 estimate of 2.6 million visitors. To be sure, 250,000 or half of
the total reduction, has been in cruise ship passenger arrivals. From its zenith of
1,067,000 passengers in 2003 to 817,000 passengers in 2007, there has been a further
decline to 583,000 passengers arriving through October 2008. This would indicate that
the year will total about 721,000 passengers, the lowest level since 2001. Overnight
visitors were also down by 215,000 (1,309,000 in 2003 to 1,064,000 in 2007). The
current year will probably show a further decline based on performance to-date. Vision
2020 was conceived and unveiled in 1998-99. The five-year progress review completed
in 2004 stated, “While visitor counts for all months have increased since Vision 2020 was
first drafted in 1998, visitor counts during the traditionally slow shoulder months have
grown at a higher rate than the annual growth rate demonstrating evidence of an
expanded season.” The latest five-year trends present a different picture. An analysis of
airport arrivals as a gauge of overnight visitor activity would show that, overall, this
latest five-year period (2004 thru 2008) is up by less than 2% over the previous five-year
period (1999 thru 2003) and 1999 thru 2003 was 5% up compared to the 1994 thru 1998
period. However, the seasonal breakdown would show Off Season to be 11.6% down
when comparing the latest five year period with 1999-2003 and the Shoulder Season
about even (0.1% up) as can be seen below:
Pct Inc/-Decr from prior period: 1994-1998 1999-2003 2004-2008
High Season – January-April 46.4% 3.8% 8.0%
Off Season - August-Sept 19.6% 0.1% -11.6%
Shoulder - May-July & Oct-Dec 33.4% 7.3% 0.1%
Total Year 36.0% 5.0% 1.7%
The above table uses all five years worth of data in a five-year period and compares it
with all five years worth of data from the immediately prior five-year period. Therefore,
the four months of January though April from 1999 through 2003 represent five years of
data (20 data points) that are compared with the same 20 data points from 1994 through
1998 to calculate the 3.8% increase.
This data does not criticize improving facilities or conceiving new non-season events in
efforts to expand to a ten-month season, however, it is a sobering reminder that other
factors, such as weather risk and national economic fluctuations, may be very powerful
determinants of the tourism season that are difficult to overcome.
Key West Vision 2020
Ten Year Progress Review
83
Draft J - November 2008
6
Vision 2020 Goal 4: We will have protected and enhanced our culture, image and
experience as “America’s Caribbean Island.”
2008 Ten Year Progress Review:
There were 8 specific areas envisioned under this category to be protected and enhanced.
The categories and the results are listed below
• Eco-Tourism - The 6,400 sq. ft. Florida Keys Eco-Discovery Center was opened
January 13, 2007 on Truman Annex waterfront grounds. It provides interactive exhibits
depicting the biodiversity of the Florida Keys and focuses on habitat and human
interaction with those habitats.
The Key West Botanical Gardens, established in 1930, comprises 7½ acres consisting of
an arboretum, botanical garden, wildlife refuge and educational center and is home to
many endangered and threatened tropical flora and fauna. It is also a major migratory
stopping point for neo-tropical birds from places as far as South America, as well as
being home to many rare birds in the Florida Keys. The Botanical Gardens is embarking
on a $750,000 project to restore a fresh water pond, building boardwalks and providing
native orchids and landscaping that is scheduled to open March, 2009.
• Marine Sanctuary - In 2002, the International Maritime Organization designated 3,000
square nautical miles as a Particularly Sensitive Sea Area (PSSA), one of only twelve in
the world. As such, strict limits to vessel size, fishing activity and No Discharge Zones
exist. The Florida Fish & Wildlife Conservation Commission (FWC) Sanctuary
Enforcement team patrols the area. As the “nation’s only living barrier coral reef,”
including all of the Keys and extending to the Dry Tortugas, The Florida Keys National
Marine Sanctuary hosts an estimated 4 million domestic and foreign visitors annually.
• History – Our commitment to preserving our history was perhaps best demonstrated in
First Lady Laura Bush recently honoring Key West with her “Preserve America” award.
Key West was one of eight cities nationwide that were honored and the only city in
Florida. Further strides have been made to preserve our history and culture through our
museums and theatres. The Mel Fisher Maritime museum attained the highest recognition
that a museum can achieve accreditation by the American Association of Museums
(AAM). A nine year, $9 million restoration of the custom house was been completed by
the Key West Art & Historical Society and the Customs House was saluted as the Best
Museum in Florida by the Florida Monthly Magazine. The Red Barn theatre has also
undergone extensive renovations thanks in part to TDC bed tax funding and the Tropic
Cinema is scheduled to expand its renovated facilities also thanks in part to TDC funding.
Honoring a great American playwright, the Tennessee Williams Theater on the campus
of the Florida Keys Community College hosts a variety of cultural events.
Key West Vision 2020
Ten Year Progress Review
Draft J - November 2008
7
The Key West Sculpture Garden, conceived and funded by local residents, inaugurated its
final bust and stands open to all residents and visitors as a testament to important figures
in our history. Mallory Square also features the Key West-Florida Keys Historic War
Memorial. The memorial project, conceived and undertaken by local residents in
partnership with the military, was completed in 2003. The memorial consists of 10
84
stations, nine of which offer historical information regarding different military actions
in which Key West or the Florida Keys played a major role.
In June of 2003, in honor of the 50th anniversary of the end of Truman's presidency, the
Harry S. Truman Little White House held the first ever Truman Symposium. The
symposium began an annual series exploring the legacy of President Truman and its
effects upon today's society
• Lifestyle - Key West’s unique lifestyle continues to be honored in many ways. The
slogan developed by resident J.T. Thompson “One Human Family” became the official
city philosophy in 2000 and continues to be heard as a voice of tolerance around the
world. As reported in The Citizen Newspaper, then-Mayor Weekley said the motto was
chosen “so others can find inspiration to grow beyond the artificial limitation of racism,
nationalism, sexism, classism, monotheism, prejudice and homophobia.”
In 2003, Key West garnered national attention and inspired a documentary film as over
2,000 resident and visitor volunteers unfurled a massive rainbow banner down Duval
Street touching both oceans. Documentary filmmaker Talmadge Heyward summed up the
sentiment of the City by saying, “In Key West I found a society that really had no
blinders on. People saw others as individuals, and not what color they were or what their
sexual orientation was.” Key West is also making strides toward improving resident
lifestyles by building more green space for its residents to enjoy. Plans for the Truman
Waterfront property conveyed to the City by the Navy include a mandatory 60% of the
33 acres for a park.
• Duval Street Corridor Improvements – The City has worked closely with the Duval
Street businesses and Waste Management to clean up Duval Street. Since 1989 the Key
West Chamber of Commerce has acted as a catalyst in this effort through its Clean and
Green Committee. Waste Management has been an ally to the City in determining the
most unobtrusive and efficient ways of storing and removing garbage. The City has
invested in a street cleaner to further improve the streets. Street cleaning after Fantasy
Fest parades are routinely and efficiently begun at parade end and finished by noon of the
following day. A volunteer campaign to improve the image of the city by removing Tshirts with offensive language from Duval storefronts had short-lived success. Ideas to
test a “pedestrian mall” approach to Duval Street by initiating a pilot program to close
several blocks of the upper end on Duval Street to vehicular traffic to prototype the
pedestrian mall concept has been twice pulled from consideration at City Commission
meetings.
Key West Vision 2020
Ten Year Progress Review
Draft J - November 2008
8
• Special promotions for locals sponsored by businesses organized by the Key West
Chamber - Key West Chamber members continued to offer special discounts to
restaurants, bars, lodging, retail stores, water activities, attractions other professional
services to local residents. The Chamber-sponsored “We Love Locals” campaigns were
begun in the summer of 2007 and were meet with great success whereas the
Thanksgiving-Christmas holiday venue for the same promotion was only moderately
successful.
• Address Street Hawkers – The City passed ordinances in 2002 and 2003 to make
aggressive panhandling and panhandling in Clinton Square, Mallory Square and the
Southernmost Point a punishable offense.
85
Vision 2020 Goal 5: We will be recognized as one of the “cleanest small cities” in
the U.S. as measured against an objective national standard.
2008 Ten Year Progress Review: An extensive search for an objective national standard
had been done in 2004, however, no objective national standard could be found for
comparison. However, a well-organized Keep Key West Clean and Green Committee has
re-emerged from the original 1998 Clean Key West Task Force which has as its vision
“To have a noticeable lack of litter on the City’s rights-of-way, beaches and shores, and
on private property so that Key West will remain an unspoiled uniquely wonderful place
to live.” The committee meets twice monthly in the Angela Street City Hall with a formal
agenda, list of assigned tasks and actions items. The committee meetings are regularly
attended by appropriate city department heads and relevant private business concerns in
addition to members of the citizenry at large and benefits from a dedicated facilitator.
Accomplishments include having organized twelve grass-roots city clean-up days this
year and doubling the city’s fleet to four street sweeping vehicles. Current goals are to
institute mandatory recycling, promote the use of a reusable “Go Cup” for events, and
enforcing the litter ordinance and improving signage (“Hemingway didn’t litter here”).
The existence of this group directly supports this Vision 2020 Goal. The Key West
Chamber of Commerce has also acted as a catalyst in this effort through its Clean and
Green Committee. Florida Keys GLEE (Green Living & Energy Education) is another
organization that, through its regular dissemination of information, attendance at events
and annual expo seeks to educate individuals, businesses and policy makers within the
Florida Keys to promote sustainable living through efficient and renewable energy and
the conservation of water and land resources.
Key West Vision 2020
Ten Year Progress Review
Draft J - November 2008
9
Vision 2020 Goal 6: Beaches along the entire South side of Key West will be restored
and accessible by the public.
2008 Ten Year Progress Review: Smathers Beach restoration was completed in 2000.
South Beach, Rest Beach and White Street Pier had been significantly restored.
Southernmost monument has been restored and protective barrier built. The FDOT road
rebuilding program for South Roosevelt Boulevard has been completed providing smooth
four-lane traffic as well as a wide walking/biking promenade. However, closing the
“bridle-path” parking on South Roosevelt across from Smathers Beach discourages beach
use by forcing metered parking.
Higgs Beach, owned by Monroe County, continues to be a controversial issue respecting
police patrols. Although offered to the City of Key West by the County, budget
considerations for required capital improvements for deferred maintenance items and
operating cost projections for morning to sundown security led the City to decline the
offer.
Key West Vision 2020
Ten Year Progress Review
Draft J - November 2008
10
Vision 2020 Goal 7: We will be a highly walkable and bikeable island – walking the
waterfront on publicly accessible beaches, sidewalks or boardwalks from East
Martello Tower to the Key West Bight will be possible.
86
2008 Five Year Progress Review: New boardwalks along Key West Bight and a bridge
in Mallory Square behind the aquarium now makes walking along the waterfront on the
bay side of the Island from the Conch Republic Marina and Land’s Edge Village to
Truman Waterfront possible. Also on the bay side of the island, walkers and bicyclists
can follow sidewalks along the waterfront from the entrance to Key West along North
Roosevelt to the other side of the Palm Ave Bridge. On the Atlantic side of the Island,
walking and biking on pathways and sidewalks is possible along the waterfront from the
entrance to Key West along South Roosevelt to the Southernmost point monument, with
a few interruptions from private waterfront properties. With the City’s acquisition of the
Truman Waterfront property, more plans are being discussed for connecting boardwalks
to extend the path even further. Tentative plans have been discussed for a floating bridge
to be built within the Truman Waterfront Property intended to link the Outer Mole dock
to Mallory Square. With these extensions nearly the entire waterfront will be pedestrian
accessible, except for the Navy properties. Elsewhere along the island, other
improvements have been made to increase its pedestrian and bicyclist accessibility. A
bridge has been built at the end of Staples Avenue to connect bicyclists and pedestrians to
the adjoining neighborhood and allow better access to North Roosevelt sidewalks. Beach
improvements and major roadway and pedestrian promenade construction along South
Roosevelt have provided a scenic uninterrupted 3½ mile trail frequented by locals and
visitors alike from the entrance to Key West to Atlantic Avenue.
The Florida Keys Overseas Heritage Trail is a multi-use bicycle and pedestrian facility
currently under design and construction by the Florida Department of Environmental
Protection using FDOT construction. Stretching from mile marker 106.3 in Key Largo to
mile marker 0 in Key West, the project will provide an alternative transportation route
throughout the Keys for foot and bicycle traffic. There are currently 60 miles of existing
bike paths spread throughout the Key that are included in the project the longest section
of which is from mile marker 106 to the Village of Islamorada. Plans include connecting
the Key West Botanical Gardens to the trail in conjunction with expansion of the gardens.
Key West Vision 2020
Ten Year Progress Review
Draft J - November 2008
11
Vision 2020 Goal 8: Our City’s infrastructure, i.e. communications, power, water
and sewer lines, roads, sidewalks, city buildings and equipment will be in good
shape and will be on a coordinated maintenance plan extending out until at least
2040. Most power and cable lines will be underground.
2008 Five Year Progress Review: Enormous progress has been made and the City’s
successful utility projects have become a model for the rest of the county. The City has
completed its rebuilding of the sanitary sewer system. The Army Corps of Engineers has
authorized retroactive billing against a total of $3 million in funding for Key West
stormwater improvement projects. We also have received $2 million in funding from the
South Florida Water Management District and other federal grants.
The State Legislature has allocated $1.5 million in federally sourced funds for the city's
stormwater projects. The stormwater projects for Front Street at the Simonton Street
Beach area and Patricia and Ashby Streets are now operational and flooding has been
reduced. We have received $3.4 million from the State of Florida in the past four years.
Our telecommunications infrastructure improvements include ISDN, DSL, digital cable
city-wide, and point-to-point wireless networks in city facilities only, all of which did not
87
exist in 1998. The City is further driving Key West’s information age expansion by
awaiting a Request for Qualifications for a fiber optic network with funds allocated in the
budget which will offset existing connectivity costs. Improvements have been made in
connection services to our public utilities. Keys Energy now offers next day hook up
service, and in many cases, can offer same day connections. Street and sidewalk
improvements continue throughout the City. The City has already requested
approximately $3.8 million in transportation funds for road, sidewalk, and bike lane
improvements for Flagler Ave., Duck Ave., and College Road. The City has entered into
an inter-local agreement with the County to contribute $180,000 toward the County and
FDOT Joint Participation Agreement 1.3 million dollar Flagler Ave. improvement
project. The FDOT is also working on plans to improve North and South Roosevelt.
Key West Vision 2020
Ten Year Progress Review
Draft J - November 2008
12
Vision 2020 Goal 9: A linkage will exist with Cuba for the benefit of Key West.
2008 Ten Year Progress Review: Travel restrictions have further tightened since the 2004
review. Notwithstanding, two fact-finding trips were taken wherein Key West Chamber
officials met with counterparts from the Havana Chamber of Commerce as well as a
highly positioned representative of the Ministry of Tourism. Additionally, meetings were
held with Pedro Alvarez Borrego, Chairman & CEO of Empresa Comercializadora de
Alimentos (ALIMPORT), a key relationship for future United States/Cuba business
dealings. The death of Fidel Castro and the assumption of leadership by his brother, Raul,
and the change in Presidential administrations following elections in the United States
will require the Chamber to continue to keep a close eye on Cuba and the potential for
more open relations between the two nations. The opening of the ferry terminal and the
targeted March 2009 opening of an improved Key West international airport terminal are
positive steps toward future linkage with Cuba. Moreover, plans included in the Navy’s
Economic Conveyance of the Truman Waterfront property called for a City marina that
would service mega-yachts and plans in-process for a privately owned and operated
deepwater marina at Safe Harbor on the Stock Island waterfront would further enhance
that linkage.
Key West Vision 2020
Ten Year Progress Review
Draft J - November 2008
13
Vision 2020 Goal 10: Discharge of Key West generated water pollutants will have
been reduced by at least 80%.
2008 Ten Year Progress Report: The City has made enormous progress and this vision is
likely to become a reality far ahead of schedule. By 2010, an 80% reduction in Key West
generated water pollutants is expected to be achieved. The rebuilding of the sanitary
sewer system has taken the City a long way towards achieving this goal. The City is now
working towards improving its stormwater system. Respecting waste water treatment, the
City received four top awards at the 2007 Florida Water Resources conference held by
the Florida Water Environment Association, including first place in the Advanced
Secondary Treatment category. It also won the Collection System award based on inflow
and infiltration reduction, the Operations Excellence Award and the Top Ten Safety
Award. In 2008, the city announced that, for the third time, the city’s wastewater
88
treatment was awarded one of two Phelps awards, which has been described as an
unprecedented achievement in the state of Florida. By 2010, all waste water plants are to
conform with the so-called “5,5,3 and 1” measurement of 5 parts per million (ppm) of
Biochemical Oxygen Demand, 5ppm of total suspended solids, 3ppm of
ammonia/nitrogen and 1ppm of total phosphorous. The City’s plant already meets this
criterion. The City tests both public and private laterals for infiltration and exfiltration.
During 1998-1999, the city undertook its first test of private property laterals. The City
tested 14,266 and failed 8,462 (59% failure rate). They retested and were able to pass all
but 17 after repairs. In its second test of private property laterals the City tested 6,282 and
failed 2,732 (43%). Aggressive testing and remedial action is credited with reducing
overall wastewater inflows at the treatment plant almost in half with concurrent Influent
& Infiltration level reductions. In addition, a stormwater capital plan has been developed
to prevent flooding, divert stormwater flow from outfalls, and reduce/eliminate discharge
of pollutants and contamination of near shore waters.
The plan provides for a more comprehensive management system and includes
installation of pump-assist injection wells, elimination and/or retrofit of 63 outfalls,
installation of 293 injection wells and retrofit of existing injection wells. Vertical French
drains have already been designed and installed addressing small areas of standing water
in an affordable, cost effective way.
Key West Vision 2020
Ten Year Progress Review
Draft J - November 2008
14
Vision 2020 Goal 11: We will have a viable seafood industry.
2008 Ten Year Progress Review: Since 1993 poundage and dollar value of commercial
fishing in Key West had, until recently, shown Key West to be ranked in the top ten
commercial fishery landings in the United States. At its zenith in 1995-1996 when Key
West had landed over 23 million pounds each year valued at over $62 million Key West
was ranked as high as 4th in dollar production among US fisheries. The size of the catch
has decreased since that time. Nonetheless, Key West still ranked 5th as a commercial
fishing port by dollars landed ($54.4 million) in 2006 but slipped to 17th position in 2007
landing a catch valued at $40.5 million (heavily influenced by a poor harvest of Key
West Pinks). The industry has been heavily regulated, a factor that has forced
consolidation so that over the past 20 years, the fleet has shrunk from 2,000 to 250 boats.
Much of the former fleet was comprised of part time fishermen who no longer found the
permitting, licensing and mandated equipment costs economical and were, moreover,
adverse to what they perceived as arduous reporting requirements. The consolidation has
resulted in fewer, but generally stronger, fisherman. This trend is projected to continue by
at least some in the industry as competition from unregulated foreign fisheries and
increased domestic regulation continue to squeeze the local fisherman. A recent example
of that regulatory muscle was felt when the South Atlantic Fishery Management Council
voted to close Florida Keys waters to shallow water fishing for grouper in order to protect
the stocks of Gag grouper which are caught in minimal numbers in these waters. The Key
West Chamber strongly protested that ban and will continue to act whenever required to
further this goal of a viable seafood industry.
Key West Vision 2020
Ten Year Progress Review
Draft J - November 2008
89
15
Vision 2020 Goal 12: The cost of government will be effectively managed to produce
a greater value for taxes and fees paid. Annual budget increases for the past 20
years (referring to the period 1999 thru 2020) on the same services provided in 1999
will have been less than inflation. The percentage of local government income from
property taxes will have declined.
2008 Ten Year Progress Review: It is difficult to objectively measure the “value”
delivered by government.
Key West
Respecting budget control as reflected in taxes levied, the City of Key West had, in years
prior to 2006, often reduced millage rates to achieve roll-back rates so that the rising tide
of property values was moderated as they affected ad valorem taxes. That changed in
2006 and brought city ad valorem taxes from the $12 million level to a $15 million level.
In absolute dollar terms, 1998-09 property taxes levied were $9.6 million, 2003-04 levies
were $11.8 million (a 4.1% annual increase over the 1997-98 fiscal year), and 2008-09
budget levies are $15.5 million (a 5.6% annual increase over the 2003-04 fiscal year).
Inflation adjusted, the 2003-04 levies should have been $10.9 million and the 2008-09
budget levies should have been $13.4 million. If there are no more services delivered now
than there were in 1999, this would indicate the goal to provide services at a cost less
than inflation had not been met. Absent the measurability of “value”, a question that
might be asked could be, “Since current year property taxes are $15.5 million compared
with an inflation-adjusted $13.4 million, are the citizens receiving $2.1 million (or 16%)
more value now than in 1999?” Moreover, in 1999 (fiscal year ended 9/30/99) property
taxes represented 34% of general fund revenues. That figure was 35% for the 2003-04
fiscal year and 39% for the 2008-09 fiscal year budget. Therefore, the goal that the
percentage of reliance on property taxes as a revenue source is not being met.
Monroe County
In absolute dollar terms, 1998-09 property taxes levied by the County were $55.4 million,
2003-04 levies were $64.4 million (a 3.1% annual increase over the 1997-98 fiscal year),
and 2008-09 budget levies are $85.2 million (a 5.7% annual increase over the 2003-04
fiscal year). It is probably fair to say that this amount may have been higher were it not
for the State of Florida mandated cap on ad valorem taxes. Note, too, that taxes for the
two prior fiscal years were keep artificially low by reducing reserves by as much as $10
million to balance the budget. Inflation adjusted, the 2003-04 levies should have been
$62.5 million and the 2008-09 budget levies should have been $77 million. If there are no
more services delivered now than there were in 1999, this would also indicate the goal to
provide services at a cost less than inflation had not been met. Again, applying the same
test for the County as for the City, the question that might be asked, “Since current year
property taxes are $85.2 million compared with an inflation-adjusted $77 million, are the
citizens receiving $8.2 million (or 11%) more value now than in 1999?”
Key West Vision 2020
Ten Year Progress Review
Draft J - November 2008
16
Vision 2020 Goal 13: Opportunities for and the quality of life for Key West’s youth
will have been improved.
Ten Year Progress Report: There are year-round sports and activities for Key West youth
both through the schools and through youth organizations such as AYSO, the Boys and
90
Girls Club and the Police Athletic League (PAL) and the like. These organizations
provide youth baseball, softball, football, soccer, hockey, basketball, boxing and
wrestling leagues. Recently, construction was completed on a new roof, floor and lights
for the outdoor roller hockey rink and a new gym was constructed at Key West High
School. In 2001, renovations were completed on the Fredrick Douglas Community center
Gym, home to the PAL. PAL programs include a basketball league, cheerleading, Police
Explorers, a recreation room, roller hockey, a computer lab, a learning center, arts &
crafts, and wrestling. Numerous other arts and cultural activities exist such as the Keys
Kids Theater and the Audubon House art classes. The Florida Keys Council of the Arts
hosts children’s arts programs to introduce children to arts and artists, including the
Artists in Schools program. In 1996, the Take Stock in Children program was relatively
new to the Keys. Today, 448 children’s lives have been enriched by the program with
178 students in college and 270 in Monroe County schools that have signed scholarship
contracts requiring them to maintain grades, meet with mentors weekly and remain crime
and drug-free. Local charities donate toward Take Stock in Children scholarships which
are “double-matched” by a group of Monroe County Leadership Donors and by The State
of Florida. With these scholarship matches from the local organizations and the State of
Florida, disadvantaged Key West students can receive four full years of college
education. JUST 4 KIDS serves all children in hardship situations, county-wide and yearround, by providing them with tangible items such as new clothing, school supplies and
hygiene products as well as items for special events such as homecoming, prom and
graduation. JUST 4 KIDS also opened a Community Art Center in the Bahama Village
which is open three days a week after school and will begin to operate as an open art
recreational center on Saturdays. The center offers free art classes to all children and aims
to release children's creativity through a variety of media. Additionally,
educational/recreational summer programs are available at a fee from private
organizations such as the Mel Fisher Museum.
Key West Vision 2020
Ten Year Progress Review
Draft J - November 2008
17
Vision 2020 Goal 14: Relationships will have improved between local government
and the citizens in support of the KEY WEST VISION 2020.
2008 Ten Year Progress Review: There is a more amicable atmosphere in the city among
political interests than there was a few years ago.
Appendix E:
Monroe County Health Department Division of Environmental
Health Inspection Activities Report 2011-2012
Department of Health
Bureau of Environmental
Print Date: Thursday, September 20, 2012
Print Time: 12:14:22 pm
Service Count - Monroe
Date Range 10/1/2011 to 9/30/2012
Biomedical Waste
Current
Count
YTD
Actual
Count
09-10
115
Actual
Count
10-11
Projected
Count
11-12
Projected
Count (1yr)
12-13
Projected
Count (2yrs)
13-14
116
126
136
107
98
140
120
100
80
60
40
20
0
98
107
116
State
Avg Percent
Growth
Between
09-11
8.46%
Percent
Growth
Between
09-10 & 10-11
8.46%
126
136
Department of Health
Bureau of Environmental
Print Date: Thursday, September 20, 2012
Print Time: 12:14:22 pm
Service Count - Monroe
Date Range 10/1/2011 to 9/30/2012
Body Piercing
Current
Count
YTD
Actual
Count
09-10
6
6
Actual
Count
10-11
6
Projected
Count
11-12
Projected
Count (1yr)
12-13
Projected
Count (2yrs)
13-14
6
6
6
6
5
4
3
2
1
0
6
6
6
State
Avg Percent
Growth
Between
09-11
0.00%
2
Percent
Growth
Between
09-10 & 10-11
0.00%
6
6
Department of Health
Bureau of Environmental
Print Date: Thursday, September 20, 2012
Print Time: 12:14:22 pm
Service Count - Monroe
Date Range 10/1/2011 to 9/30/2012
Food Hygiene
Current
Count
YTD
Actual
Count
09-10
188
167
Actual
Count
10-11
175
Projected
Count
11-12
Projected
Count (1yr)
12-13
Projected
Count (2yrs)
13-14
184
192
202
240
200
160
120
80
40
0
167
175
184
State
Avg Percent
Growth
Between
09-11
4.78%
3
Percent
Growth
Between
09-10 & 10-11
4.78%
192
202
Department of Health
Bureau of Environmental
Print Date: Thursday, September 20, 2012
Print Time: 12:14:22 pm
Service Count - Monroe
Date Range 10/1/2011 to 9/30/2012
Group Care
Current
Count
YTD
Actual
Count
09-10
82
75
Actual
Count
10-11
78
Projected
Count
11-12
Projected
Count (1yr)
12-13
Projected
Count (2yrs)
13-14
81
84
88
100
80
60
40
20
0
75
78
81
State
Avg Percent
Growth
Between
09-11
4.00%
4
Percent
Growth
Between
09-10 & 10-11
4.00%
84
88
Department of Health
Bureau of Environmental
Print Date: Thursday, September 20, 2012
Print Time: 12:14:22 pm
Service Count - Monroe
Date Range 10/1/2011 to 9/30/2012
Limited Use Water
Current
Count
YTD
Actual
Count
09-10
1
1
Actual
Count
10-11
1
Projected
Count
11-12
Projected
Count (1yr)
12-13
Projected
Count (2yrs)
13-14
1
1
1
1
0.8
0.6
0.4
0.2
0
1
1
1
State
Avg Percent
Growth
Between
09-11
0.00%
5
Percent
Growth
Between
09-10 & 10-11
0.00%
1
1
Department of Health
Bureau of Environmental
Print Date: Thursday, September 20, 2012
Print Time: 12:14:22 pm
Service Count - Monroe
Date Range 10/1/2011 to 9/30/2012
Miscellaneous
Current
Count
YTD
Actual
Count
09-10
2
2
Actual
Count
10-11
2
Projected
Count
11-12
Projected
Count (1yr)
12-13
Projected
Count (2yrs)
13-14
2
2
2
2
1.6
1.2
0.8
0.4
0
2
2
2
State
Avg Percent
Growth
Between
09-11
0.00%
6
Percent
Growth
Between
09-10 & 10-11
0.00%
2
2
Department of Health
Bureau of Environmental
Print Date: Thursday, September 20, 2012
Print Time: 12:14:22 pm
Service Count - Monroe
Date Range 10/1/2011 to 9/30/2012
Mobile Home Parks
Current
Count
YTD
Actual
Count
09-10
154
151
Actual
Count
10-11
151
Projected
Count
11-12
Projected
Count (1yr)
12-13
Projected
Count (2yrs)
13-14
151
151
151
160
140
120
100
80
60
40
20
0
151
151
151
State
Avg Percent
Growth
Between
09-11
0.00%
7
Percent
Growth
Between
09-10 & 10-11
0.00%
151
151
Department of Health
Bureau of Environmental
Print Date: Thursday, September 20, 2012
Print Time: 12:14:22 pm
Service Count - Monroe
Date Range 10/1/2011 to 9/30/2012
Nuisance Complaint
Current
Count
YTD
Actual
Count
09-10
73
59
Actual
Count
10-11
79
Projected
Count
11-12
Projected
Count (1yr)
12-13
Projected
Count (2yrs)
13-14
106
142
190
79
106
200
160
120
80
40
0
59
State
Avg Percent
Growth
Between
09-11
33.90%
8
Percent
Growth
Between
09-10 & 10-11
33.90%
142
190
Department of Health
Bureau of Environmental
Print Date: Thursday, September 20, 2012
Print Time: 12:14:22 pm
Service Count - Monroe
Date Range 10/1/2011 to 9/30/2012
OSTDS - Construction
Current
Count
YTD
Actual
Count
09-10
1,514
3,170
Actual
Count
10-11
2,555
Projected
Count
11-12
Projected
Count (1yr)
12-13
Projected
Count (2yrs)
13-14
2,059
1,660
1,338
3500
3000
2500
2000
1500
1000
500
0
3,170
2,555
2,059
State
Avg Percent
Growth
Between
09-11
-19.40%
9
Percent
Growth
Between
09-10 & 10-11
-19.40%
1,660
1,338
Department of Health
Bureau of Environmental
Print Date: Thursday, September 20, 2012
Print Time: 12:14:22 pm
Service Count - Monroe
Date Range 10/1/2011 to 9/30/2012
OSTDS - Operating
Current
Count
YTD
Actual
Count
09-10
3,114
3,023
Actual
Count
10-11
3,067
Projected
Count
11-12
Projected
Count (1yr)
12-13
Projected
Count (2yrs)
13-14
3,111
3,156
3,202
3500
3000
2500
2000
1500
1000
500
0
3,023
3,067
3,111
State
Avg Percent
Growth
Between
09-11
1.46%
10
Percent
Growth
Between
09-10 & 10-11
1.46%
3,156
3,202
Department of Health
Bureau of Environmental
Print Date: Thursday, September 20, 2012
Print Time: 12:14:22 pm
Service Count - Monroe
Date Range 10/1/2011 to 9/30/2012
OSTDS - Service
Current
Count
YTD
Actual
Count
09-10
27
21
Actual
Count
10-11
25
Projected
Count
11-12
Projected
Count (1yr)
12-13
Projected
Count (2yrs)
13-14
29
33
39
40
35
30
25
20
15
10
5
0
21
25
29
State
Avg Percent
Growth
Between
09-11
16.67%
11
Percent
Growth
Between
09-10 & 10-11
16.67%
33
39
Department of Health
Bureau of Environmental
Print Date: Thursday, September 20, 2012
Print Time: 12:14:22 pm
Service Count - Monroe
Date Range 10/1/2011 to 9/30/2012
Rabies
Current
Count
YTD
Actual
Count
09-10
1
1
Actual
Count
10-11
0
Projected
Count
11-12
1
0.8
0.6
0.4
0.2
0
1
0
State
Avg Percent
Growth
Between
09-11
-100.00%
12
Percent
Growth
Between
09-10 & 10-11
-100.00%
Projected
Count (1yr)
12-13
Projected
Count (2yrs)
13-14
Department of Health
Bureau of Environmental
Print Date: Thursday, September 20, 2012
Print Time: 12:14:22 pm
Service Count - Monroe
Date Range 10/1/2011 to 9/30/2012
Swimming Pools
Current
Count
YTD
Actual
Count
09-10
921
843
Actual
Count
10-11
893
Projected
Count
11-12
Projected
Count (1yr)
12-13
Projected
Count (2yrs)
13-14
946
1,002
1,062
1200
1000
800
600
400
200
0
843
893
946
State
Avg Percent
Growth
Between
09-11
5.93%
13
Percent
Growth
Between
09-10 & 10-11
5.93%
1,002
1,062
Department of Health
Bureau of Environmental
Print Date: Thursday, September 20, 2012
Print Time: 12:14:22 pm
Service Count - Monroe
Date Range 10/1/2011 to 9/30/2012
Tanning
Current
Count
YTD
Actual
Count
09-10
9
7
Actual
Count
10-11
7
Projected
Count
11-12
Projected
Count (1yr)
12-13
Projected
Count (2yrs)
13-14
7
7
7
7
6
5
4
3
2
1
0
7
7
7
State
Avg Percent
Growth
Between
09-11
0.00%
14
Percent
Growth
Between
09-10 & 10-11
0.00%
7
7
Department of Health
Bureau of Environmental
Print Date: Thursday, September 20, 2012
Print Time: 12:14:22 pm
Service Count - Monroe
Date Range 10/1/2011 to 9/30/2012
Tattoos
Current
Count
YTD
Actual
Count
09-10
49
0
Actual
Count
10-11
0
Projected
Count
11-12
6
4
2
0
0
0
-2
-4
-6
State
Avg Percent
Growth
Between
09-11
0.00%
15
Percent
Growth
Between
09-10 & 10-11
0.00%
Projected
Count (1yr)
12-13
Projected
Count (2yrs)
13-14
107
The DOH
DOH Monroe County Health Department is an EEO/AA employer and service provider.
If you need accommodation in order to participate in our programs, please notify the Monroe County
Health Department in advance.
phone: (305) 293-7500
web: http://www.keyshealth.com/
fax : (305) 809-5629


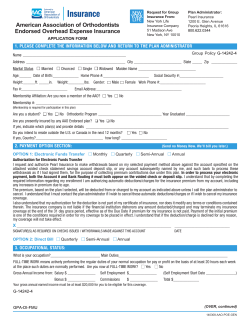

© Copyright 2026