
Impact of Feedback about energy consumption
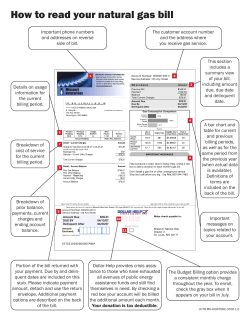
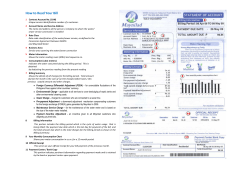
Impact of Feedback about energy consumption 15-05-2015 Published by: Erika Zvingilaite and Mikael Togeby Ea Energy Analyses Frederiksholms Kanal 4, 3. th. 1220 Copenhagen K Denmark +45 88 70 70 83 [email protected] www.eaea.dk 2 | Impact of Feedback about energy consumption - 15-05-2015 Contents 1 Sammenfatning ...................................................................................4 2 Introduction ........................................................................................6 3 Types of feedback ................................................................................8 3.1 What is feedback ............................................................................. 8 3.2 Types of feedback............................................................................ 9 4 The Energy Efficiency Directive ........................................................... 13 5 Design of a good feedback study ........................................................ 14 6 Impact of feedback ............................................................................ 17 6.1 The review of feedback studies ..................................................... 17 6.2 Impact of feedback – literature review .......................................... 18 6.3 Summary ....................................................................................... 26 References ................................................................................................ 28 Appendix – the reviewed feedback studies................................................. 32 3 | Impact of Feedback about energy consumption - 15-05-2015 1 Sammenfatning Energieffektiviseringsdirektivet peger på feedback om energiforbrug som en metode til at fremme energibesparelser. Traditionelt er målerne for el, varme og vand blevet aflæst en gang om året. Årlig information kan være vanskelig at knytte til den konkrete adfærd. Fjernaflæste målere gør det overkommeligt at præsentere mere detaljerede energiforbrugsdata, fx forbruget per måned, dag eller time. Feedback om energiforbrug kan ske via særlige in-house-displays, via papir, hjemmesider, SMS eller smartphones. Feedback sker typisk med en vis forsinkelse, fx hvor de nyeste informationer er 1-3 dage gamle, men kan også være i realtid. Feedback kan inkludere sammenligninger, som kan hjælpe med at vurdere forbruget. Fx kan der sammenlignes med eget forbrug året før, eller med sammenlignelige forbrugere. Selve informationen kan være i energienheder eller i kroner. Energienheder (kWh, GJ, oC, m3) kan for mange være vanskelige at forstå. Energieffektiviseringsdirektivet fremhæver faktureringsoplysninger, dvs. de samme oplysninger som faktura, men uden betalingsanmodning. Effekt af feedback Der er i dette projekt identificeret 24 studier og 15 review- og andre analyser. Der er stor variation i såvel i typen af feedback, som af kvaliteten af studierne. På tværs af studierne vurderes det at feedback kan forventes at give besparelser i størrelsen 2-3%. Se tabel 1. Er informationen baseret på selv-aflæsning af målere er det vanskeligt i praksis at opnå en frekvens med månedlig eller kvartalsvis feedback. Det kan forventes at føre til en lavere besparelse, omkring 1-2%. Besparelserne synes at kunne opnås for alle energiarter, herunder el anvendt til andet en varme og el, fjernvarme eller naturgas anvendt til varme. Formen for feedback og den medfølgende information har betydning for den forventede effekt. Hjemmesider, som brugeren selv skal huske at bruge, har ofte en lav benyttelse. Flere studier peger på at evt. støtteinformation skal være enkel og handlingsorienteret – og hellere jævnlige korte information end mere omfattende informationer, som kun leveres en enkelt gang. 4 | Impact of Feedback about energy consumption - 15-05-2015 Elektricitet Elvarme Naturgas/Fjernvarme Real-time Antal studier, alle/bedste1 Besparelse, alle Besparelse, bedste Besparelse, median, bedste 14/5 0-18% 1-7% 5% 5/1 1-17% 2% 2% 9/4 0-8% 1-8% 2% 25/9 -2-10% -2-5% 2% 11/4 0,4-13% 3-10% 4% 15/6 0-14% 1-7% 4% 39/14 -2-18% -2-7% 2% 16/5 0,4-17% 2-10% 3% 24/10 0-14% 1-8% 3% Indirekte feedback Antal studier, alle/bedste Besparelse, alle Besparelse, bedste Besparelse, median, bedste Alle Antal studier, alle/bedste Besparelse, alle Besparelse, bedste Besparelse, median, bedste Tabel 1. Overblik over resultater 1 De bedste studier er de studier som har den bedste design, og som har modtaget score 3, baseret på kriterier for en god studie som beskrevet i afsnit 6.1. 5 | Impact of Feedback about energy consumption - 15-05-2015 2 Introduction Ambitious 2020 energy and climate change goals were adopted by the European Council in 2007. The 2020 objectives include reduction of greenhouse gas emissions by 20%, increase in share of renewable energy to 20%, and to reach 20% energy efficiency. These targets were later reconfirmed in the Europe 2020 Strategy. In 2010 forecasts showed that the 20 % energy efficiency target would not be met. Therefore there was a need for new measures at European and national level. In 2012 the Energy Efficiency Directive (EED) was adopted in order to accelerate the progress and ensure that the ambitious targets are met. The directive sets a common framework to promote energy efficiency and includes a number of measures for more efficient energy use at different stages of the energy chain – production, transportation and final consumption. Article 10 of the directive describes measures, related to final energy consumption and billing, and distinquishes between accurate billing, billing information and consumption information. Accurate billing refers to billing, based on actual energy consumption during the billing period, as opposed to billing, based on previous year’s consumption for the same period. Billing information, provided to cosnumers, must include the information on how much they will be billed for the energy they have used during the last period. In other words, the main difference between billing and billing information is that the former includes payment obligation, whereas the latter does not require payment, but, otherwise, includes the same information. Consumption information should include actual historic consumption data, which corresponds to the intervals for accurate billing or billing information, detailed consumption data according time of use, and, where relevant, comparison with normalised consumption within the same user category. Article 10 requires Member States to ensure that consumers with smart meters are provided with accurate bills as well as access to additional consumption information, including historic detailed consumption data. Furthermore, consumers with traditional (non-smart) individual meters should be provided with frequent billing information2. Thus, the directive seeks to ensure that energy consumers across Europe receive feedback on their energy consumption. Theory suggests that providing better information on energy consumption (feedback) may be effective and have an impact on consumers end-use behavior. However, the empirical evidence, found in literature, demonstrates significant differences in effectiveness of feedback on energy consumption. A 2 Where technically possible and economically justified 6 | Impact of Feedback about energy consumption - 15-05-2015 large number of experiments of feedback have been conducted world-wide. These experiments use various information strategies, including providing consumers with consumption information of varying detail regarding end-uses and time of use, historic and real-time consumption, benchmark information etc. Additionally, some experiments provide energy efficiency advice and even energy audits in order to increase the effect of feedback. Regarding billing and billing information, the studies test the effects of different options – more frequent billing, information on actual energy prices (e.g. time-of-use tariffs) or other type of cost information3. This report includes review of the available literature, which reports the results of different field studies, conducted in order to test effects of feedback on energy consumption. The studies analyse the effects of different feedback types with respect to energy type, information, feedback frequency etc. The purpose of the review is to examine the published studies and, based on the rigor of the methodology used, conclude on the effects of different feedback strategies. The report includes a short introduction to different types of feedback on energy consumption in section 3. Section 4 introduces Article 10 of the Energy Efficiency Directive. Methodology of a good feedback study is discussed in section 5, where the criteria for evaluating the reviewed studies are also described. Finally, the results of the literature review and the observed effects of different types of feedback are presented and discussed in section 6. 3 Not necessarily corresponding precisely to billing information 7 | Impact of Feedback about energy consumption - 15-05-2015 3 Types of feedback Households’ energy use is invisible to the users and people tend to have only a vague idea of how much energy they are using for different purposes and how they can affect energy consumption by changing day-to-day practices. Theory suggests that feedback on energy consumption can be a tool in increasing consumers’ understanding of energy consumption and learning how to control ones energy use. Feedback can serve as a self-teaching tool, which also improves understanding and effectiveness of information and advice on energy efficiency in general (Darby, 2006). Feedback is often considered as an instrument to reduce energy consumption. However,insight in the real costs of some energy services could also lead to examples of increased demand. A lagre amount of conducted studies testing different types of feedback report mixed results. Some find that provided feedback leads to significant energy savings, while others observe no significant effect or increase in energy consumption for some consumer segments. Results of the field studies depend largely on design of a study and the methodology of data analysis (see section 5). 3.1 What is feedback A standard energy bill has little information value. Time-wise it is remote to the actual consumption event, and it also lacks the detail which would allow a better understanding of energy consumption and relating it to everyday practices. Feedback: Information about the result of a process or action that can be used in modification or control of a process or system… especially by noting the difference between a desired and an actual result. Box 1 Definition of feedback. Oxford English Dictionary adopted from Darby, 2006. Feedback on energy consumption contributes to the building up of knowledge about use of energy. As a result, people may take in the information about energy consumption, change their behaviour and gain understanding of the effect of the behavioural change by interpreting the received feedback, see Box 2 (Darby, 2006). In this way, increased feedback may be correcting a market failure, caused by imperfect information. 8 | Impact of Feedback about energy consumption - 15-05-2015 INCREASED FEEDBACK INCREASE IN KNOWLEDGEINTENSION OF CHANGE IN BEHAVIOUR CHANGES IN ENERGY-USE BEHAVIOURCHANGE IN CONSUMPTION Box 2 Possible effect of feedback on consumption. Based on Darby, 2006. Change in energy consumption, achieved through feedback can be persistent, when individuals develop new habits and/or when feedback has urged to invest in f.x. new appliances (Darby, 2006). Continuous feedback over a longer time-period allows people to monitor the impact of changes in their behaviour, housing and appliances, which is important for learning to use energy more effectively. Thus, persistent feedback can be important for achieving persistent changes in energy cosnumption. Most of the international feedback studies base their reasoning of achieved energy savings on the above description of feedback and the mechanisms behind the changes in energy-use behaviour. However, the mechanisms behind the residential demand response is still not fully understood. Some literature reviews (Faruqui et al., 2010) raise questions about the value and impact of the information, provided by feedback, as compared to the impact of increased feedback merely as a reminder to save energy. Nonetheless, most studies conclude that both information quality, frequency and persistence of feedback are important elements for achieving significant impact on energy-use behaviour. 3.2 Types of feedback There are different types and aspects of feedback and the choice of which is important for achieving the wanted impact on consumption of different energy types: direct/indirect feedback, aggregation level of consumption information, technology/media used, timing, frequency and persistence of feedback, synergies with other type of information, comparison with historic or reference consumption etc.4 Direct feedback Direct feedback is the immediate (real time) and easy accessible consumptionfeedback from, for instance, an in-house display monitor or a clearly visible energy meter5. It is particularly useful for illustrating the moment-to-moment impact of end-use devices, like an oven or tumble dryer. Direct feedback can 4 Based on (Darby, 2006) and ESMA (2007) However, it can, depending on a meter, be difficult to understand the information, displayed on a meter and information can be impractical for feedback purposes, e.g. in kWh and not DKK. 5 9 | Impact of Feedback about energy consumption - 15-05-2015 also be given by so-called ‘ambient devices’, which by light or sound can inform consumers about their energy consumption level. By direct feedback measures energy consumption information is available for the consumers all the time. Nevertheless, the effect of the direct feedback depends on how regularly consumers read the information. An initial interest may not last for years. On the other hand, it takes time for consumers to develop new energy consumption practices, thus the effect of feedback on energy consumption can be increasing during the first couple of years. Indirect feedback Indirect feedback is feedback, which has been processed in some way before the user receives it. Consumers have no direct access to actual consumption data (besides the accumulated energy count shown on the meter) and can only respond to previous consumption behaviour. This means that there is a time-delay between energy consumption and the moment feedback reaches consumers. The delay may be a day (e.g. if meters are read each night) or longer. In some case, more time is needed to verify the data. Indirect feedback can include analysis of data, collected over longer period, and thus is more suitable for showing longer-term effects, such as increased insulation, home extensions, new members of household etc. The effect of indirect feedback depends on how frequent the feedback is available for consumers. In general, studies find that frequent feedback has a higher impact on energy consumption behaviour. Processing of consumption data gives the possibility to compare energy consumption with e.g. historic values, comparable consumers or other, expected, consumption. Direct feedback Indirect feedback Self-meter-reading (visible energy meter/smart meter) More frequent billing More informative frequent bills In-house display Information on a webpage Real-time consumption on a webpage E-mail SMS Ambient devices Energy reports by post Self-monitoring (based on self-meter-reading) Table 1 Examples of different types of feedback Self-meter-reading requires a level of commitment from consumers. Nonetheless, such feedback can be effective in conjunction with information on how to save energy. The study by Winett et al. (1979) (and several other studies) has shown that consumers could quickly learn to read their own meters. 10 | Impact of Feedback about energy consumption - 15-05-2015 Moreover, during the study participants were taught self-monitoring, which was relatively inexpensive. The use of a (smart) meter as tool for direct feedback requires that the meter is easily accessible and easy to read. No studies were found regarding feedback in apartment blocks, which relied on consumers self-reading the so-called heat cost allocators placed on each radiator6. Both direct and indirect feedback on energy consumption can be disaggregated into energy end-use (e.g. electrical appliances) giving a better understanding of, which end-uses have the highest effect on the overall energy consumption. However, such feedback can be costly, especially if disaggregation is used with direct feedback. On the other hand, consumption can also be disaggregated based on estimated values, which would lower the costs significantly. The question remains as to whether the additional information brings additional value or is superfluous (ESMA, 2007). Time disaggregation of consumption, for instance provided by frequent billing or energy reports, and also showing energy consumption profile over time, can give a better understanding of variation in e.g. heat consumption throughout a year. The literature emphasises the importance of frequent feedback in order to effectively influence consumers’ energy use behaviour. As mentioned above, consumers may need time to learn about energy consumption, and identify and maintain energy conservation practices. Therefore, it is important that feedback is provided over an extended period of time. According to Darby (2006), a new type of behaviour, formed over a period of three months or more is likely to persist. Even so, continuous feedback is needed to help maintain the behavioural changes and encourage further changes. Some larger studies show that energy savings increase during the first and second year of feedback and become constant thereafter. Winett et al. (1979) studies effect of consumption feedback on electricity consumption in townhouses with electric heating and claims that ‘considerable savings in electricity use can accrue when feedback or monitoring procedures are implemented during seasonal peak-use periods with high-use consumers’. Thus, timing can also be an important factor in designing a successful feedback scheme. 6 In Danish: “fordelingsmålere” 11 | Impact of Feedback about energy consumption - 15-05-2015 Effectiveness of feedback can also be increased by combining with other strategies, such as energy saving goal-setting and/or rewarding for savings, and providing information on energy-efficiency measures. 12 | Impact of Feedback about energy consumption - 15-05-2015 4 The Energy Efficiency Directive The Energy Efficiency Directive (25 October 2012) is meant to increase the energy efficiency in the EU – with the aim to fulfil the 2020 goal of 20 % increase in energy efficiency, compared to the baseline prediction for this year, from 2007. Article 10 is about billing information. In article 10.1 it is required that customers without a smart meter can receive frequent billing information. “This obligation may be fulfilled by a system of regular self- reading by the final customers whereby they communicate readings from their meter to the energy supplier.” And “In order to enable final customers to regulate their own energy consumption, billing should take place on the basis of actual consumption at least once a year, and billing information should be made available at least quarterly...” A possible scenarios is that the customer manually reads the meter (e.g. in MWh) and send the information to the supplier. The supplier returns with billing information (in DKK). The extra information added by the supplier can include tariffs and taxes. Note that article 10.1 is about quarterly billing information, and that this is not the same as a quarterly bill. Article 10.2 requires that customers with a smart meter have the possibility of easy access to complementary information on historical consumption allowing detailed self-checks. This includes historical data for the last three years and detailed data according to the time of use for any day, week, month and year. These data shall be made available to the final customer via the internet or the meter interface for the period of at least the previous 24 months. Article 10.3 describes how third parties, like energy service providers, can get access to the data and content of the bill. The requirements exist where this is technically possible and economically justified. 13 | Impact of Feedback about energy consumption - 15-05-2015 5 Design of a good feedback study A vast number of studies have been carried out in order to quantify the effect of feedback on energy consumption. In particular, the number of studies have increased during the last decade due to increased governmental focus on energy efficiency and massive rollout of smart energy metes and online services by energy utilities. The different studies have different design, use different methodologies and show different energy saving results. In general, the outcome of a feedback study depends on several aspects, such as, energy type and technology (e.g. smart meters), the type and quality of feedback, design of a study, as well as institutional and cultural background within which the study has been conducted. The most important factors are summarised in Table 2. Design of feedback study Risk Sample size Too small a sample may results in results not being significant. The smaller the impacts is, the larger sample is required Control group or before-after comparison With a control group the impact of general issues can be controlled for (e.g. a trend). Participant enrolment and selection of control and treatment groups With voluntary enrolment self-selection bias can take place. More positive people in the treatment group? A combination of several feedbacks and other information and incentives With several “treatments” it can be difficult to separate the impact Duration of test A short test period may give in-significant results (like a small sample). Longtime impact require a long observation period. Table 2 Factors influencing results of feedback studies Sample size has to be statistically sufficient. The energy demand in any family is varying from time to time. Without very detailed information about the household, this can be seen as a random variation7. The size of this variation as well as the realised savings are important in determining a good sample size. Therefore, a sufficiently large sample size is important in order to achieve significant results. 7 E.g. in Kofoed (2013) it can be seen that the 50% of a reference group has yearly variation of the electricity consumption above (+/-) 7.5%. 14 | Impact of Feedback about energy consumption - 15-05-2015 Feedback studies are usually carried out either as a controlled experiment with treatment (those who receive the feedback) and control groups; and or a before-after comparison of participants’ electricity consumption. With only before-and-after it is not possible to control for general change in demand, e.g. introduced by economic crises or other socioeconomic changes. Selection/enrolment of participants and assigning them to control and trial groups can vary and can depend on practical conditions of a study. For instance, if a study depends on rollout of smart meters by a utility, only a limited segment of consumers is available for either trial or control groups. However, it is important that trial and control groups are comparable concerning all aspects, influencing energy consumption. If it is not possible to select the participants randomly, it is important to collect information about and to account for any moderating factors and covariates such as socioeconomic characteristics, appliance stock, household size, energy prices, personal interests, etc. Often participation in such studies is voluntary and this may attract non-average people, e.g. people with interest in technology. Ideally, a stratified random sampling, which ensures that participants with different characteristics are equally represented in trial and control groups, should be used when designing a feedback study. As for selectin of participants, a similar aspect is related to participants dropping out of the test. Again, participants dropping out may be different – maybe more negative, than the average. However, not all studies consider these aspects. Consumer segment, chosen for the trial, can have influence on design of the trial and results of the study as well. High-energy use consumers most likely will exhibit higher energy savings, however, the savings might be casued by other reasons than feedback8. Larger participation can be expected from consumers with higher levels of education and income. On the other hand, consumers with higher income may be more likely to invest into energy savings measures. Some consumer groups might need to be educated on energy saving-behaviour prior to trial start. 8 Selection of participants is likely to introduce a bias, because of the random variation of demand. Households with a high demand in a specific year are likely to use less in the next period. This is called Regression toward the mean. 15 | Impact of Feedback about energy consumption - 15-05-2015 Methodology, used for analysis of energy consumption data of treatment and control groups is also an important factor when interpreting and assessing the results of a study. Most studies use statistical methods to analyse the consumption results and account for possible differences between treatment and control groups or other unobserved factors, while other studies rely on a simple comparison of consumption data before and after the trial. With random selection of control group and treatment group, and with before and after observation and sufficient large samples, the analytical procedures may be very simple. However, if selection bias exist this must be accounted for, e.g. with advanced statistical methods. Some studies use surveys and interviews in addition to providing feedback. Contact with participants during a trial can influence energy consumption behaviour and affect results of the study. Particularly contact and influence of control groups can affect their energy behaviour (and this baseline) and, consequently, results of a trial. On the other hand, interviews and surveys are important in order to collect the information about participants and to be able to account for different factors, which might also have an effect on energy consumption behaviour. The outcome of a trial also depends on additional information given to the participants, for example advice on how to reduce energy consumption. Some studies also include energy efficiency goal-setting by consumers as well as incentives to save energy (e.g. giving points for achieved energy savings, which can be exchange into shop-coupons). Finally, it is important that other issues do not influence the results. E.g. if it is the impact of feedback, that is in focus, the payment for energy must have been stable in a period before the test. Else, both issues may influence the results. However, many studies combine the intervention and, therefore it is difficult to distinguish savings effect of one particular intervention. 16 | Impact of Feedback about energy consumption - 15-05-2015 6 Impact of feedback 6.1 The review of feedback studies All reviewed studies (see the Appendix) are assessed with respect to the factors of a feedback study-design, presented in section 5. The review process is illustrated in Figure 1. Feedback studies: - Energy type - Feedback type Evaluation: - Quality of study-design - Relevance In-depth analysis of chosen studies: - Achieved savings - Relevance/applicability Figure 1 Steps in literature review of energy consumption feedback studies First, the reviewed studies are sorted by energy and feedback type (direct or indirect). Three groups of feedback studies by energy type are distinguished for electricity consumption with and without electric heating, and heat consumption (gas for heating and district heating). Further, the studies are evaluated and the best studies are identified based on the design of a study. The following criteria were used to grade the studies from 1-3, where the best studies are marked with ‘3’ (see the Appendix): Duration of feedback study – min one year’s duration. Sample size – minimum 100 participants (with some exceptions if the results are significant). Test design – with control group and with before and after data. Method for accounting for socioeconomic factors and participants’ self-selection is applied in either the construction of control group or by statistical analysis of background data9. Significance of results (checked for the best studies). Furthermore, relevance of the studies with respect to the article 10 in the Directive is taken into account. Consequently, some studies are included, even though they do not include the best design e.g. studies, involving manual meter reading (self-meter-reading).The chosen studies are described and analysed more in depth, focusing on the reported energy savings, achieved during a study, as well as relevance and applicability regarding the Directive. 9 Generally, most of the studies do not have a perfect design, particularly due to participants self-selection (i.e. possibility to opt-out) before and during an experiment. Therefore, the best studies in this review are those, which have attempted to account for or analysed this issue. 17 | Impact of Feedback about energy consumption - 15-05-2015 6.2 Impact of feedback – literature review This section includes the results of the literature review. The reviewed reports and articles include either a detailed description of a particular study on energy consumption feedback, a review of conducted studies or other related discussions (see Table 3). Literature review and other studies Field study Kofod (2013) Darby (2006) Vine (2013) van Elburg, H. (2008) Fischer (2008) Buchanan et al. (2015) EEA (2013) Christiansen (2009) Kerr&Tondro (2012) Darby et al. (2011) Morgenstern (2015) Felsmann & Schmidt (2013) Novikova et al. (2011) Delmas et al. (2013) Vassileva&Campillo (2014) Schleich et al. (2011) a Schleich et al. (2011) b Carroll et al. (2013) Nilsson et al. (2014) Gleerup et al. (2010) AECOM (2011) Wilhite et al. (1993) Wilhite et al. (1999) Winett et al. (1979) DENA (2014) ISTA (2011) Ueno et al. (2005) SEAS NVE (2014) D’Oca (2014) Brandon and Lewis (1999) Arvola et al. (1994) Allcott (2009) DECC (2015) Hydro One (2006) Nielsen et al. (1992) Haakana (1997) HER (2012) Harrigan and Gregory(1994) Houwelingen (1989) Table 3 The overview of the identified literature sources A total of 39 literature sources, including 24 papers, which describe conducted field studies, and 15 review and other papers have been identified. The literature review yield 80 results10, showing the effect of feedback on consumption of household energy consumption. The same field study usually included testing of different feedback options, which are reported as separate feedback cases in the Appendix. Attempt has been made to describe all identified field studies/results (in the review papers or original field studies) by the following parameters: 10 Some reports/articles describe field studies where several types of feedback (e.g. direct/indirect) or energy types are tested and analysed. Such studies yield several results. The results of the studies are therefore included and analysed as separately. 18 | Impact of Feedback about energy consumption - 15-05-2015 Country Energy type Duration of a study Sample size Relation (with respect to who send and receive the feedback). Focus on examples where e.g. a meter is for an apartment block, and where indicative meters are used to divide costs on apartments. Use of smart meter Did the study rely on self-meter-reading Media for conveying the feedback Frequency of feedback Type (direct/indirect) Feedback information Availability of cost data in feedback (as a proxy for ‘billing information’, referred to in the directive) Use of control group Whether the study accounted for other factors which might influence the savings effect, such as self-selection, different characteristics of participants, weather etc.11 Reported energy savings Table 4 includes an overview of the review results by energy and feedback type and the span of the reported energy savings. In order to eliminate the outliers results are also presented as median values. 11 Different methods were used by different studies and usually studies did not account for all possible factors, also influencing change in consumption. Therefore, in this review, at least one method applied was accepted as sufficient. 19 | Impact of Feedback about energy consumption - 15-05-2015 Electricity Electric heating Gas/District Heating 14/5 0-18% 1-7% 3% 5% 5/1 1-17% 2% 3% 2% 9/4 0-8% 1-8% 2% 2% 25/9 -2-10% -2-5% 3% 2% 11/4 0,4-13% 3-10% 4,5% 4% 15/6 0-14% 1-7%13 3% 4% 39/14 -2-18% -2-7% 3% 2% 16/5 0,4-17% 2-10% 4% 3% 24/10 0-14% 1-8% 3% 3% Direct feedback No. of studies, all/best12 Savings, all Savings, best Savings, median, all Savings, median, best Indirect feedback No. of studies, all/best Savings, all Savings, best Savings, median, all Savings, median, best All No. of studies, all/best Savings, all Savings, best Savings, median, all Savings, median, best Table 4 The overall results of the reviewed studies Electricity consumption Savings, as a result of feedback on electricity consumption seem to fall within a broad interval of -2 % (where consumption has increased) and 7 %. Nonetheless, when looking at the median, the resulting savings are 2 % for indirect feedback and 5 % for direct feedback. These numbers are valid for the 14 best results (out of 40). Thus, providing feedback on household electricity consumption seems to have a positive effect on savings. The studies, showing large savings are the studies, which either have a small sample size, short duration of the study or combine several feedback options and other interventions (such as consulting, financing, possibility for remote control of electrical devices). Indirect feedback The indirect feedback studies included either improved information on bills or a separate feedback report, sent by post, email or available on a web-page. Several large-scale and statistically robust studies in the United States (Allcott, 2009 and HER, 2013) indicate that the effect of an energy report, sent by post 12 Best studies are the studies with the best design, which received score 3 according to the criteria for a good study design, described in section 6.1. 13 Here the results are dominated by fuel poor consumers and these results are likely to be affected by this bias. 20 | Impact of Feedback about energy consumption - 15-05-2015 or e-mail, which includes consumption information and comparison with other consumers as well as historic consumption yield between 1,5 % and 2 % electricity savings for quarterly and monthly feedback respectively. The experience showed that reports, sent by post were read more frequently than the e-mail-reports. Such feedback does not necessarily require a smart meter, but requires utilities to collect and make available consumption information at least quarterly. The next studies all included use of a smart meter. Analysis by Gleerup et al. (2011) included possibility of frequent (daily, weekly, monthly) feedback on consumption, additional messages when consumption changes significantly and access to a webpage. Cost information was not included and results showed 2 % savings. Other feedback studies on monthly energy reports – in Germany and Austria – include a more detailed information on electricity consumption and costs over time (monthly, weekly, daily). Even more detailed information, including hourly consumption and indication of electricity consumption in different appliances was available for the subgroup (around a half of participants), who chose viewing information on a web-page instead of receiving a written feedback by post. Such feedback required a smart meter and the combination of written and web-feedback14 resulted in electricity savings of 3.7 % to 4.5 %. The difference between the two types of studies is also that the latter included cost-information. Thus, it seems that a more detailed feedback information including costs can result in higher savings. A feedback trial by AECOM (2011) showed 2.3% savings as a result of more accurate and informative bills including savings advice. On the other hand, another trial by AECOM (2011) of more frequent (monthly), accurate and informative bills resulted in increase in consumption by 2 % for “fuel poor” consumers segment showing the importance of the consumers for whom the feedback is targeted. Both studies included smart meters. In general, AECOM (2011) found only significant results in studies with a smart meter. Thus, it can be concluded that indirect feedback, provided quarterly and without billing information can result in savings of at least 1.5 %. The increased frequency can only slightly increase savings (by 0.5 %). A more frequent feedback with more detailed information, including information on cost, might increase savings effect to approximately 4 %. 14 The analysis showed no significant difference between the two feedback types and therefore results are shown for the combination. 21 | Impact of Feedback about energy consumption - 15-05-2015 Direct feedback All best direct feedback studies included In-House-Displays showing real-time consumption information and cost information, as well as required smart meters. In the cases, where smart meters were not available another solution was used to read the existing meters. In general, the studies (AECOM, 2011 and Hydro One, 2006), which included a vast amount of information including historic data, cost and environmental information as well as audible alarm if consumption increase or consumption prediction showed significant savings (5-7%). These studies also included energy savings advice. On the other hand, a recent, very robust study by DECC (2015) show statistically significant savings at 2.3 %. The feedback here included current and historic consumption and costs. A different study by AECOM (2011) finds only 1 % savings when an In-HouseDisplay is used in combination with a non-smart meter. Whereas another study without a smart meter (Hydro One, 2006) reports savings of 5-6.5 %. Here it can be concluded that it is reasonable to expect savings of around 2 % from direct feedback on electricity consumption through an In-House-Display, including cost information. Additional information (e.g. environmental impact) and audible or visible alarm can increase savings to 5-6 %. Self-meter reading Two feedback studies included consumer self-meter readings – Nielsen (1993) and Haakana (1997). Both studies relied on consumers reading their meters and sending the information every month. In study by Haakana (1997) consumers received comparative feedback about their energy costs as well as consumption relative to comparable households and historic consumption. The feedback resulted in 4 % electricity savings when compared to the group, which only read and sent meter information, without receiving any feedback. The study by Nielsen et al. (1993) did not investigate the effects of feedback, based on self-meter-reading independently but rather in a package consisting of several initiatives. Therefore, they only estimate that such feedback might lead to 2-4 % savings. Feedback on web Most of the studies, which make feedback information available on a webpage use it only as a supplement to other type of feedback. In general, it seems that such feedback type fails to reach the consumers, as number of web-site visits tends to be small. The study by TREFOR (Kofod, 2013) showed 22 | Impact of Feedback about energy consumption - 15-05-2015 savings of 3.5%. Here smart meters were rolled out and consumption information was made available on a web-page. Consumption was compared to the group of consumers who have not yet received smart meters. However, it was not investigated whether the consumption was affected by other factors. Electricity consumption including electric heating The results of the best studies show that feedback on electricity consumption in households with electric heating leads to savings of 2 and 3% for direct and indirect feedback respectively. Studies that show high savings are not among the best and usually have small sample and/or a short duration as well as include goal-setting or a more detailed representation of end-uses. The exception is the study of frequent billing and improved information on electricity bills in Oslo, where feedback resulted in 10 % (Wilhite et al., 1993). The study included a combination of increased billing frequency (from 3 times per year to every 2 months), bills, based on actual consumption as opposed to “a conto” type bills (based on previous year’s bill) as well as improved information on bills (including historic comparison and advice). This combination increased consumers’ knowledge of energy consumption, particularly awareness of seasonal variation in heat consumption, which lead to considerable savings. The results can be compared with those of the same study in Helsinki, where the frequent billing was a prevailing condition and the study concentrated on billing, based on actual consumption as well as consumption feedback, including historic comparison and advice. Here the achieved savings attributable to increased knowledge, were around 3 %. The study by Arvola et al. (1994), which involved a of combination of billing, based on actual consumption as well as feedback on consumption, including historic comparison in Helsinki showed savings of 3%. Those, who also received conservation advice, saved around 5%. Monthly billing combined with better consumption information and savings advise led also to savings (3%) in a study by Carroll et al. (2013)15. Thus, it can be concluded that more frequent and accurate bills can improve consumer knowledge, resulting in savings of at least 3 %. Direct feedback Smart meters were only used in two studies – both by Carroll et al. (2013). One of the studies includes an In-House-Display for showing real-time consumption, cost and tariff information in combination with bi-monthly energy 15 This study relied on smart meter 23 | Impact of Feedback about energy consumption - 15-05-2015 statements (consumption by day of the week, time-of-use relative to historic consumption and other consumers, average appliance consumption levels and conservation advice), sent by mail. The study concluded that such feedback resulted in 2 % savings. Self-meter-reading Only two studies included self-meter-readings, however none of the results were identified as robust. Nonetheless, one of the study is worth mentioning – implementation of frequent billing (every two months) and improved consumption information, based on self-meter-reading in Stavanger (2000 consumers) indicated savings of 4 % over 2 years. However, it was not investigated whether the consumption was affected by other factors. Feedback on web The study by TREFOR showed savings of 4.7% for the households with electric heating when smart meters were rolled out and consumption information was made available on a web-page. However, it was not investigated whether the consumption was affected by other factors. Consumption of gas for heating and District heating Overall savings potential from the feedback on gas and district heating consumption seems to be 3 % for both, all and best results. The best results show savings of 2 % for direct and 4 % for indirect feedback. The best results of indirect feedback studies are dominated by the results for fuel poor consumers and therefore might be affected by this bias. Direct feedback The best references for the savings, achieved by the direct feedback on gas consumption (including historic consumption data) – DECC (2015) and AECOM (2011) – report savings of 1.5 % and 3.2 % respectively. In DECC (2015) feedback information includes consumption and costs, whereas trial in AECOM (2011) includes also CO2 emissions and a “traffic light” indicator of current gas usage. Smart gas meter was used in both studies. The study of effects of a direct feedback by Houwelingen (1989) included a display showing the daily consumption of gas as well as a reference amount, corresponding to the saving goal. The feedback resulted in 8% savings. However, the study had a relatively small sample and participant behaviour might have been affected by the energy saving goal. 24 | Impact of Feedback about energy consumption - 15-05-2015 It can be concluded that direct feedback of heat consumption (including cost information) can result in savings of 1.5-3% depending on the information and feedback design.16 Indirect feedback Effect of indirect feedback is reported in a large study in the United States, where energy reports were sent to around 50 000 households by post or email (HER, 2013). The reports include consumption information and comparison with other consumers as well as historic consumption. The study reports gas savings of 0.7 % for energy reports sent 6 times during a year. Kofod (2013) reports on results of several studies in the United States, where the same energy reports (Home Energy Report) were applied. The achieved savings span between 0.7% and 1.5 %. The energy reports do not require smart meter, but rely on consumption data available at least quarterly. Houwelingen (1989) reports 3.4% savings due to monthly feedback on gas consumption for heating. Results of this study are significant however, the sample size was small – only 50 households. The studies by AECOM (2011), reporting effect of indirect feedback, find savings of 4 % as a result of more accurate and informative bills, and 7% due to more frequent (monthly) as well as accurate and informative bill (this result is for fuel poor consumer segment). The conclusion can be made that monthly-quarterly feedback on heat consumption can result in heat savings of around 1-3%. If higher savings are to be achieved billing information should be included or a more frequent billing should be considered. Self-meter-reading Self-meter-reading has been reported in a study by Haakana (1997). The study relied on consumers reading their heat meters and sending consumption information every month. In return, consumers received monthly feedback on their consumption relative to comparable households and historic consumption as well as costs. Compared with the group that only read their meters and did not receive any feedback 4 % savings were achieved17. 16 According to the Danish practice for billing in district heating (with accurate billing once a year), it is not possible to provide accurate near real-time billing information. The final yearly bill includes several fees, which can first be accounted for at the end of a year. 17 The study included relatively small sample size, short duration and possibility for self-selection bias. 25 | Impact of Feedback about energy consumption - 15-05-2015 Houwelingen (1989) also reports results of the self-meter-reading study. The participants were asked to fill-in a self-monitoring chart. The achieved savings were 0.8%. 6.3 Summary Even though the reviewed studies are of varying quality and the results include a certain degree of uncertainty, it seems that feedback on energy consumption leads to changed behaviour and reduction in energy consumption. The literature review indicates that savings of 2-3 % can be achieved when considering a variety of studies with both direct and indirect feedback as well as different levels of information detail. Article 10.1 of the Energy Efficiency Directive requires that consumers without a smart meter can receive frequent billing information18 (at least quarterly) and suggests a self-meter reading as a possibility to collect the consumption data. The best studies, which can be related to this requirement show that frequent (quarterly or monthly) feedback on consumption can result in savings of 1-2 %, when only consumption information is included in feedback. Increased level and detail of information – time and load disaggregation, and cost information – can lead to higher (3 %) savings. More accurate and in particular frequent billing seems also to have savings effect, particularly for energy consumption for heating purposes. Feedback, which does not include detailed information, can be provided without using a smart meter. However, it requires collecting consumption data on a more frequent basis (e.g. monthly or quarterly). Here consumers’ self-meter reading can be utilised. Relying on consumers self-meter-reading in order to, in return to provide frequent feedback or billing has proved to be possible and effective, and has been implemented in billing system in Stavanger in 1996. Self-meter-reading where consumers receive a feedback in return seem to lead to energy savings (up to 4 %19), whereas self-meter-reading for self-monitoring purposes seems not to have a significant effect over a longer period. Smart meters are currently being rolled out in Denmark20 and in these cases self-meter-reading is less relevant. On the other hand, a vast majority of households, living in (existing) apartment blocks still do not have separate heating meters and so-called heat cost allocators (fordelingmålere) on each radiator are used to estimate heat consumption. Relying on self-meter-read- 18 Where technically possible and economically justified Based on the studies without a vigorous data analysis method and possibility for self-selection bias. 20 Smart electricity meters is required for all consumers by 2020 and for district heating meters (mostly in single family houses) are rolled out by voluntary basis. 19 26 | Impact of Feedback about energy consumption - 15-05-2015 ing in this situation can be challenging, as consumers would need to read several meters (depending on a number of radiators) and the information can only be applied when information from all apartments have been collected. No studies were found regarding feedback in apartment blocks, which relied on consumers self-reading of the heat cost allocators. Nonetheless, it is reasonable to expect that savings of 1-3 % can be expected, depending on feedback frequency and included information. Article 10.2 of the Directive requires that customers with a smart meter have the possibility of easy access to consumption information. Easy access can be provided either by an In-House-Display or information on a web-page. Use of a smart meter gives the possibility for more detailed feedback information21 both for current and historic energy use. According to the reviewed studies, direct feedback using an In-House-Display can result in savings between 2-522 %. Most of the studies, which make feedback information available on a webpage use it as a supplement to other type of feedback. In general, it seems that such feedback type fails to reach the consumers, as number of web-site visits tends to be small. The papers, that describe web-based feedback studies, report savings between 3-14 %. However, these studies either do not apply a robust data analysis method (TREFOR) or a more comprehensive information about a study (ISTA, 2011, DENA, 2014) was not available. 21 22 Weekly, daily, hourly consumption and divided into different end-uses (devices) More information as well as use of audible or lighting alarms seems to yield larger savings. 27 | Impact of Feedback about energy consumption - 15-05-2015 References AECOM (2011): “Energy Demand Research Project: Final Analysis”. www.ofgem.gov.uk/ofgem-publications/59105/energy-demand-research-project-final-analysis.pdf Allcott, H. (2010): Social norms and energy conservation, Journal of Public Economics. Arvola A., Uutela A., Anttila U. 1994. Billing feedback as means to encourage household electricity conservation: A field experiment in Helsinki. Brandon G., Lewis A. 1999. Reducing household energy consumption: a qualitative and quantitative field study. Journal of environmental psychology. Vol 19:75-85. Carroll, J., S. Lyons and E. Denny (2013): “Reducing Electricity Demand through Smart Metering: The Role of Improved Household Knowledge”, Trinity Economics Papers. www.tcd.ie/Economics/TEP/2013/TEP0313.pdf Christiansen, E., A. M. Kanstrup, A. Grønhøj, A. Larsen (2009): Elforbrug på email & sms: Rapport om 22 husholdningers erfaringer efter et års feedback. Darby, S. (2006): The effectiveness of feedback on energy consumption. A review for DEFRA of the literature on metering, billing and direct displays. Oxford University. Darby, S. et al (2011): Large-scale testing of new technology: some lessons from the UK smart metering and feedback trials. ECEEE. DECC (2015): Smart Metering Early Learning Project: Domestic Energy Consumption Analysis. Delmas, M. A., Fischlein, M., Asensio, O. (2013): Information strategies and en- ergy conservation behavior: A meta-analysis of experimental studies from1975to2012. Energy Policy, 61:729-739. DENA. 2014. Undersøgelse af opvarmningsperioden 2013/2014. D’Oca, S., Corgnati, S.P. and Buso, T. (2014): Smart meters and energy savings in Italy: Determining the effectiveness of persuasive communication in dwellings. Energy Research and Social Science, 3., 131-142. 28 | Impact of Feedback about energy consumption - 15-05-2015 EEA (2013): Achieving energy efficiency through behaviour change: what does it take? European Environmental Agency Technical Report. No 5/2012 EPRI (2009): Residential Electricity Use Feedback: A Research Synthesis and Economic Framework. Final report. Electric Power Research Institute. Felsmann, C. and Schmidt, J. (2003): Effects of consumption-dependent billing as a function of the standard of energy efficiency in buildings. Final report Dresden Technical University. Fischer, C. (2008): Feedback on household electricity consumption: a tool for saving energy? Energy Efficiency, Vol 1:79–104. Gleerup, M.; A. Larsen, S. Leth-Petersen, M. Togeby (2010): The effect of feedback by SMS-text messages and email on household electricity consumption: Experimental evidence. Energy Journal, Vol. 31, Nr. 3, 2010, s. 113-132. Haakana, M., Sillanpaa L., Talsi M. 1997. The effect of feedback and focused advice on household energy consumption. Harrigan S. M., Gregory J. M. 1994. Do savings from energy education persist? HER (2012). Rinn. K., Cook R., Stewart J., Colby J., Mulholland C., Khawaja M., S. Home Energy Report. Pilot Year 3 Evaluation. van Howelingen J. H., van Raaij W. F. 1989. The effect of goal-setting and daily Electronic feedback on in-home energy use. Journal of consumer research. Vol. 16:98-104. Hydro One (2006). The impact of real-time feedback on residential energy consumption: the Hydro One pilot. Summary. Conducted by Dean Mountain, University Ontario. ISTA. 2011. Nyhedsartikel vedrørende feedback undersøgelse i Aachen. Kathryn Buchanan, Riccardo Russo, Ben Anderson (2015): The question of energy reduction: The problem(s) with feedback. Energy Policy, Volume 77, Pages 89–96. 29 | Impact of Feedback about energy consumption - 15-05-2015 Kerr, R and Tondro, M (2012): Residential feedback. Devices and programs: opportunities for natural gas. U.S. Department of Energy. Kofod, C. (2013): Fastlæggelse af danske standardværdier for Feedback. Morgenstern P., Lowe, R., Lai Fong Chiu (2015): Heat metering: socio-technical challenges in district-heated social housing. Building Research and Information, 43., 197-209. Nielsen L., Jørgensen K., Jordal-Jørgensen J. 1992. Elbesparelser i boligsektoren – afsluttende rapport. Amternes og kommunernes forskningsinstitut. Nilsson, A., C. J. Bergstad, L. Thuvander, D. Andersson, K. Andersson, P. Meiling (2014): Effects of continuous feedback on households’ electricity consumption: Potentials and barriers. Applied Energy, Volume 122, Pages 17–23. Novikova, A. et al. (2011): Information tools for energy demand reduction in existing residential buildings. Climate Policy Initiative. Räsänen T, Ruuskanen J, Kolehmainen M. (2008): Reducing energy consumption by using self-organizing maps to create more personalized electricity use information. Applied Energy 2008:85:830-840. Schleich, J., M. Klobasa, M. Brunner, S. Gölz (2011): Effects of feedback on residential electricity demand. Schleich, J., M. Klobasa, M. Brunner, S. Gölz, K. Götz, G. Sunderer (2011): “Smart metering in Germany and Austria – results of providing feedback information in a field trial”, Fraunhofer. www.isi.fraunhofer.de/isi-wAssets/docs/e-x/working-papers-sustainability-and-innovation/WP6-2011_smart-metering-in-Germany.pdf SEAS/NVE (2014): Vind med nye elvaner. Slutrapport på elpristesten. Ueno, T., F. Sano, O. Saeki, K. Tsuji (2006): Effectiveness of an energy-consumption information system on energy savings in residential houses based on monitored data. Applied Energy 83 166–183. van Elburg, H. (2008): Subject Report on Effective Customer Feedback Mechanisms. ESMA project. 30 | Impact of Feedback about energy consumption - 15-05-2015 Vassileva, I. and Campillo, J. (2014): Increasing energy efficiency in low-income households through targeting awareness and behavioral change. Renewable Energy, 67., 59-63 Vine, D., L. Buys, and P. Morris (2013): The effectiveness of energy feedback for conservation and peak demand: a literature review. Open Journal of Energy Efficiency, 2(1), pp. 7-15. Wilhite, H., Ling R., Untela A., Anttila U., Arvola A. 1993. A Nordic test of the energy saving potential of new residential saving techniques. Nordiske seminar- og arbejds-rapporter. 1993:627. Wilhite, H. (1999): Advances in the use of consumption feedback information in energy billing: the experiences of a Norwegian energy utility. ECEEE. Winett, R. A., M. S. Neale and H. C. Grier (1979): Effects of Self-Monitoring and Feedback on Residential Electricity Consumption. Journal of Applied Behavior Analysis, 12., 173-184. 31 | Impact of Feedback about energy consumption - 15-05-2015 Appendix – the reviewed feedback studies Electricity consumption Quality of study (3 is best) Study Schleich et al. (2011) 3 a Schleich et al. (2011) 3 b Nilsson et al. (2014) 1 a Nilsson et al. (2014) 1 b Control group Robust data analysis method yes yes 12 1070 Indirect 1 month Austria yes yes 12 750 Indirect 1 month Sweden yes n.a. 1 20 Direct Sweden yes n.a. 1 13 Direct Country Germany and Austria Duration, months Sample size Feedback type 3 Gleerup et al. (2010) Denmark yes yes 12 3 DECC (2015) TREFOR a in Kofod 2 (2013) van Elburg, H. (2008) 1 b van Elburg, H. (2008) 1 c UK yes yes 12 5145 Direct Denmark yes no 12 90000 Indirect Italy Netherlands n.a. n.a. 12 1000 Direct n.a. n.a. 24 60000 Indirect 1 Kofod (2013), CUB USA n.a. n.a. 3 Allcott (2009) a USA yes yes 12 23530 Indirect 3 Allcott (2009) b USA yes yes 12 15687 Indirect 2 SEAS NVE (2014) Denmark yes n.a. 12 276 n.a. 3 EDF/AECOM 2011 a UK yes yes 20 386 Indirect 3 EDF/AECOM 2011 b UK yes yes 20 370 Direct n.a. 194 Indirect Frequency, every 1 month, 1 week or 1 day Feedback Consumption, costs and advice Consumption, costs and advice Consumption, costs and CO2 emissions Consumption, costs and CO2 emissions Consumption and consumption-deviation/limit alert Cost data Savings Significance yes 3,70% yes yes 4,50% yes yes 0,00% - yes 0,00% - no 2,50% yes Consumption and costs yes 2,3% yes Consumption no 3,50% n.a. Consumption and costs yes 10,00% - Smart meter Selfreading Relation yes no 1st yes no 1st yes no 2nd yes no 2nd yes no 1st yes no 1st Web In-HouseDisplay yes no 1st yes no 1st Media Post and web Post and web In-HouseDisplay In-HouseDisplay sms, e-mail, web In-HouseDisplay Consumption no Informative bill, consumption, incentives, goal set- yes* ting, advice (bill) 3,00% - Web yes no 1st 4,40% - n.a. no 1st 1 month Consumption and advice no 2,00% yes no no 1st 3 months Consumption and advice Time-of-use tariffs, consumption, discussion forum Informative bill, consumption, cost, CO2 emissions, advise Consumption, cost, CO2 emissions, advise no 1,50% yes Post Post and email Post and email no no 1st yes 0,00% no web yes no 1st Post In-HouseDisplay yes no 1st yes no 1st 2457 Indirect 1 month yes* (bill) 2% yes yes 5% yes Quality of study (3 is best) Study Country 3 EDF/AECOM 2011 c UK E.ON/AECOM 2011 a' 3 (fuel poor) UK E.ON/AECOM 2011 2 a'' (high use) UK Control group Robust data analysis method yes yes 20 200 Direct yes yes 24 2639 Indirect yes yes 24 2639 Indirect Duration, months Sample size Feedback type Frequency, every E.ON/AECOM 2011 3 b' (fuel poor) UK yes yes 24 1436 Indirect 1 month E.ON/AECOM 2011 2 b'' (high use) UK yes yes 24 1436 Indirect 1 month E.ON/AECOM 2011 c' 2 (fuel poor) UK yes yes 24 1456 Indirect 1 month E.ON/AECOM 2011 2 c'' (high use) yes yes 24 1456 Indirect 1 month E.ON/AECOM 2011 2 d' (fuel poor) UK UK yes yes 24 2524 Direct E.ON/AECOM 2011 2 d'' (high use) UK yes yes 24 2524 Direct 3 SSE/AECOM 2011 a UK yes yes 36 2500 Direct 2 SSE/AECOM 2011 b UK yes yes 36 1902 Indirect 2 SSE/AECOM 2011 c UK yes yes 24 524 Direct Scottish 2 Power/AECOM 2011 UK yes yes 10 1603 Direct 33 | Impact of Feedback about energy consumption - 15-05-2015 1 month 1 month 3 months 6 months Feedback Consumption, cost, CO2 emissions, advise, alarm Accurate and informative bill, consumption Accurate and informative bill, consumption Frequent billing, accurate and informative bill, consumption information Frequent billing, accurate and informative bill, consumption information Frequent billing, accurate and informative bill, consumption information and advise Frequent billing, accurate and informative bill, consumption information and advise Frequent billing, accurate and informative bill, consumption information and advice, IHD current consumption, CO2, traffic light indicator Frequent billing, accurate and informative bill, consumption information and advice, IHD current consumption, CO2, traffic light indicator Consumption, cost and CO2 emissions Informative bill, consumption comparison with other households Real-time consumption, cost, CO2, traffic light consumption indicator Consumption info and advice + IHD with Consumption, cost, CO2 Cost data yes yes* (bill) yes* (bill) Savings Significance 7% yes Media In-HouseDisplay Smart meter Selfreading Relation yes no 1st -2% yes Post yes no 1st 2% no Post yes no 1st yes* (bill) -2% yes Post yes no 1st yes* (bill) 3% no Post yes no 1st yes* (bill) -1% no Post yes no 1st yes* (bill) 2% no Post yes no 1st 2% yes Post + InHouse-Display yes no 1st yes no 1st no no 1st no no 1st yes no 1st yes no 1st yes yes 4% no yes 1% yes Post + InHouse-Display In-HouseDisplay yes* (bill) 1% yes Post yes 2% yes yes 0% no In-HouseDisplay Post + InHouse-Display Quality of study (3 is best) Country Control group Robust data analysis method 1 D'Oca et al. (2014) Seligman et al. (1979) in Darby 1 (2006) Italy no no 12 USA yes n.a. 1 13 Indirect 2 Nielsen (1992) a Denmark yes yes 36 500 Indirect 1 month 2 Nielsen (1992) b Denmark yes yes 36 500 Indirect 1 month 2 Nielsen (1992) c Denmark yes yes 36 500 Indirect 1 month 1 Benders et al. (2006) Netherlands yes no 5 137 Indirect 2 Haakana (1997) Finland yes yes 20 79 Indirect 3 Hydro One (2006) Henryson et al. (2000) in Fischer 1 (2008) Mack and Hallmann 1 (2004) Fischer (2008) Mosler and Gutscher 1 (2004) Fischer (2008) Canada yes yes 30 DK and Sweden n.a. n.a. n.a. Germany Switzerland yes n.a. n.a. yes n.a. 1 3 HER (2012) b USA yes yes 12 Study 34 | Impact of Feedback about energy consumption - 15-05-2015 Duration, months Sample size Feedback type Frequency, every 31 Direct 1 day 1 month 500 Direct 30004000 Media Selfreading yes 18% - In-HouseDisplay yes no Consumption Self-meter reading, consumption information, advise, financing, individual consultation, higher (50%) electricity price Self-meter reading, consumption information, advise, financing, higher (50%) electricity price Self-meter reading, consumption information, advise, financing, individual consultation Web-tool with questionnaires, energy savings in % of consumption and saving tips no 10% - n.a. no yes no 10% n.a. Post, personal no yes 1st no 8% n.a. Post no yes 1st no 7% n.a. Post, personal no yes 1st n.a. 9% - Web n.a. no Consumption and cost Consumption and costs, CO2emissions and outdoor temperature yes 4% - Post no yes n.a. 3rd (research ers) yes 7% yes In-HouseDisplay no no 1st Savings Significance Smart meter Relation 3rd (research ers) 3rd (research ers) Feedback Overall consumption, consumption by different devices, on/off control Cost data Indirect 1-2 months Informative bill, consump- yes* tion and advice (bill) 7% - Post n.a. n.a. 1st 19 Indirect 1 week Consumption no 3% - Post no n.a. n.a. 48 Direct 1 day Consumption and advice no 6% - n.a. no yes 2 months Consumption and advise no 1% yes Post and web yes no n.a. 3rd (company) 50000 Indirect Electricity consumption including electric heating Quality of study (3 is best) Study Country Control group Robust data analysis method 2 Carroll et al. (2013), A Ireland yes yes 12 656 Indirect 3 Carroll et al. (2013), B Ireland yes yes 12 672 Indirect 3 Carroll et al. (2013), C Ireland yes yes 12 636 Direct 3 Wilhite et al. (1993) Norway yes yes 36 600 Indirect 1 Wilhite et al. (1999) TREFOR b in Kofod 2 (2013) Norway no no 24 2000 Indirect Denmark yes no 12 10000 Indirect 2 Winett et al. (1979) a USA yes yes 1 12 Indirect 1 day 2 Winett et al. (1979) b Garay and Lindholm 2 (1995) in Darby (2006) Dobson and Griffin 1 (1992) in Darby (2006) Brandon and Lewis 1 (1999) USA yes yes 1 16 Indirect 1 day Sweden yes n.a. 15 600 Indirect Canada yes n.a. 2 25 Direct UK yes no 9 28 Indirect 1 month 3 Arvola et al. (1994)a Finland yes yes 30 180 Indirect 1 month 3 Arvola et al. (1994)b Finland yes yes 30 173 Indirect 1 month 35 | Impact of Feedback about energy consumption - 15-05-2015 Duration, months Sample size Feedback type Frequency, every Feedback Consumption, costs 2 months and advice Frequent billing, Consumption, costs and 1 month advice Real-time- and bimonthly-information on consumption, costs and advice + real time information Frequent billing, based on actual consumption, consumption information and 2 months advise Frequent billing and consumption infor2 months mation 1 month Cost data Savings Significance Media Smart/ meter Selfreading Relation yes 0,40% no Post yes no 1st yes* (bill) 3,00% yes Post yes no 1st yes 2,00% yes In-HouseDisplay yes no 1st yes* (bill) 10,00% yes Post no no 1st 4% no Post no yes 1st yes Consumption no 4,70% - Web yes no Consumption, goal setting, advise no 13,00% - Post no no no 7,00% - Post no yes 1st 3rd (researchers) 3rd (researchers) Post In-HouseDisplay no no 1st n.a. no n.a. PC no no n.a. Consumption Informative bill, consumption Cost data for diff. periods and by end-use Consumption and advise Billing based on actual consumption and comparative consumption information Billing based on actual consumption and comparative consumption information and advice yes* n.a. - yes 13,00% - no 4,31% - yes* (bill) 3% yes Post no no 1st yes* (bill) 5% yes Post no no 1st Quality of study (3 is best) Study Country Control group Robust data analysis method 2 Hydro One (2006) b Canada yes yes 30 500 Direct Hydro One (2006) c (electric hot water 2 heating) Canada yes yes 30 500 Direct 2 E.ON/AECOM 2011 e UK yes yes 36 | Impact of Feedback about energy consumption - 15-05-2015 Duration, months 24 Sample size Feedback type 2524 Direct Frequency, every Feedback In-house display with consumption and costs, CO2 emissions and outdoor temperature In-house display with consumption and costs, CO2emissions and outdoor temperature Frequent billing, accurate and informative bill, consumption information and advice, IHD current consumption, CO2, traffic light 1 month indicator Cost data Savings Significance Media Smart/ meter Selfreading Relation yes 1,20% - In-HouseDisplay no no 1st yes 16,70% - In-HouseDisplay no no 1st Post + InHouseDisplay yes no 1st yes* (bill) 3% no Heat consumption – gas and district heating Quality of study (3 is best) Study Country Robust data analysis Control group method Duration, months Sample size Feedback Frequency, type every Consumption no 9,00% - Consumption and cost Consumption and costs Informative bills with consumption information Consumption and improved data for billing yes yes 1,50% yes 14,00% - yes* (bill) 0,00% - n.a. 3,00% - Consumption and advise no 0,70% yes Web Post and web Media Web or Post InHouseDisplay Web Post and Web Smart/online meter Selfreading Energy Relation Type n.a. no 1st Heating yes yes no no 1st 1st Gas for heating Heating yes no 2nd yes no yes no 1st 3rd (company) Germany yes no 12 3 DECC (2015) 1 ISTA (2011) UK yes Germany yes yes n.a. 12 5145 Direct 6 n.a. Indirect 1 month 1 van Elburg, H. a Latvia Netherlands n.a n.a. 12 1 month n.a n.a. USA yes yes 12 50000 Indirect UK yes yes 24 2639 Indirect Accurate and informative bill, consumption yes* (bill) 4,40% yes Post yes no 1ts Gas for heating UK yes yes 24 2639 Indirect Accurate and informative bill, consumption yes* (bill) 2,30% no Post yes no 1ts Gas for heating UK yes yes 24 2639 Indirect yes* (bill) 3,60% yes Post yes no 1ts Gas for heating E.ON/AECOM 3 2011 b' UK yes yes 24 2639 Indirect 1 month yes* (bill) 6,70% yes Post yes no 1ts Gas for heating E.ON/AECOM 2 2011 b'' UK yes yes 24 2639 Indirect 1 month yes* (bill) 2,50% no Post yes no 1ts Gas for heating E.ON/AECOM 3 2011 c' UK yes yes 24 1436 Indirect 1 month yes* (bill) 7,2% yes Post yes no 1st Gas for heating UK yes yes 24 1436 Indirect 1 month 2,4% no no 1st yes yes 24 1436 Direct 1 month Post Post + In- yes UK Accurate and informative bill, consumption Frequent billing, accurate and informative bill, consumption information Frequent billing, accurate and informative bill, consumption information Frequent billing, accurate and informative bill, consumption information and advise Frequent billing, accurate and informative bill, consumption information and advise Frequent billing, accurate and informative bill, yes no 1st 3 HER (2012) b E.ON/AECOM 2011 a' (fuel 3 poor) E.ON/AECOM 2011 a'' (high 2 use) E.ON/AECOM 2011 a''' (not fuel 3 poor) E.ON/AECOM 2 2011 c'' E.ON/AECOM 2 2011 d' 37 | Impact of Feedback about energy consumption - 15-05-2015 n.a. 22 Indirect 1 month Savings Significance 2 DENA (2014) 1 van Elburg, H. c 145 Indirect Feedback Cost data 60000 Indirect 2 months yes* (bill) yes* (bill) 4,60% yes DH Gas for heating Gas for heating Gas for heating Gas for heating Quality of study (3 is best) Study E.ON/AECOM 2 2011 d'' Country UK Robust data analysis Control group method yes yes Duration, months Sample size 24 Feedback Frequency, type every 1436 Direct 1 month E.ON/AECOM 2011 d''' (not fuel 2 poor) UK yes yes 24 1436 Direct 1 month Scottish Power/AECOM 2 2011 yes yes 9 1603 Direct 6 months UK SSE/AECOM 2011 3 c UK yes yes 24 204 Direct Garay and Lind1 holm (1995) Sweden yes n.a. 15 600 Indirect Harrigan and 2 Gregory(1994) USA yes yes 14 71 Direct 2 Haakana (1997) Finland yes yes 9 Houwelingen 3 (1989) a Houwelingen 3 (1989) b Houwelingen 3 (1989) c Netherlands Netherlands Netherlands yes yes yes yes 1 month 79 Indirect 1 month 12 50 Direct 1 day yes 12 50 Indirect 1 month yes 12 50 Direct 38 | Impact of Feedback about energy consumption - 15-05-2015 Feedback consumption information and advice, IHD current consumption, CO2, traffic light indicator Frequent billing, accurate and informative bill, consumption information and advice, IHD current consumption, CO2, traffic light indicator Frequent billing, accurate and informative bill, consumption information and advice, IHD current consumption, CO2, traffic light indicator Consumption information and advice by post and IHD with consumption, cost and CO2 emissions In-house-display with consumption, cost, CO2 emissions and traffic light indicator Informative bills with consumption information Consumption information + consumer education + thermostat Consumption and costs Consumption and goal setting + self-monitoring Consumption information Consumption information Cost data yes yes* (bill) Smart/online meter Selfreading Energy Relation Type 2,20% no Post + InHouseDisplay yes no 1st Gas for heating 4,90% no Post + InHouseDisplay yes no 1st Gas for heating no 1st Gas for heating yes no 1st Post InHouseDisplay n.a. n.a. n.a. n.a. n.a. no yes 1st 3rd (researchers) no no n.a. Savings yes yes yes* n.a. Significance Media HouseDisplay 0% no Post and IHD 3% yes InHouseDisplay - n.a. 0% - yes 4% - yes 8% yes Post InHouseDisplay yes 3% yes Post no no n.a. yes 1% yes Meter no yes n.a. Gas for heating Electric heating and D Gas for heating DH Gas for heating Gas for heating Gas for heating 39 | Impact of Feedback about energy consumption - 15-05-2015


© Copyright 2026