
Chapter 9 Nonparametric Statistics EPI 809 / Spring 2008
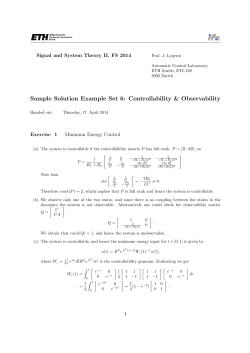
Chapter 9 Nonparametric Statistics EPI 809 / Spring 2008 Learning Objectives 1. Distinguish Parametric & Nonparametric Test Procedures 2. Explain commonly used Nonparametric Test Procedures 3. Perform Hypothesis Tests Using Nonparametric Procedures EPI 809 / Spring 2008 Hypothesis Testing Procedures Hypothesis Testing Procedures Parametric Nonparametric Wilcoxon Rank Sum Test Z Test t Test One-Way ANOVA Kruskal-Wallis H-Test Many More Tests Exist! EPI 809 / Spring 2008 Parametric Test Procedures 1. Involve Population Parameters (Mean) 2. Have Stringent Assumptions (Normality) 3. Examples: Z Test, t Test, 2 Test, F test EPI 809 / Spring 2008 Nonparametric Test Procedures 1. Do Not Involve Population Parameters Example: Probability Distributions, Independence 2. Data Measured on Any Scale (Ratio or Interval, Ordinal or Nominal) 3. Example: Wilcoxon Rank Sum Test EPI 809 / Spring 2008 Advantages of Nonparametric Tests 1. Used With All Scales 2. Easier to Compute 3. Make Fewer Assumptions 4. Need Not Involve Population Parameters 5. Results May Be as Exact as Parametric Procedures © 1984-1994 T/Maker Co. EPI 809 / Spring 2008 Disadvantages of Nonparametric Tests 1. May Waste Information Parametric model more efficient if data Permit 2. Difficult to Compute by hand for Large Samples 3. Tables Not Widely Available EPI 809 / Spring 2008 © 1984-1994 T/Maker Co. Popular Nonparametric Tests 1. Sign Test 2. Wilcoxon Rank Sum Test 3. Wilcoxon Signed Rank Test EPI 809 / Spring 2008 Sign Test EPI 809 / Spring 2008 Sign Test 1. Tests One Population Median, 2. Corresponds to t-Test for 1 Mean 3. Assumes Population Is Continuous 4. Small Sample Test Statistic: # Sample Values Above (or Below) Median 5. Can Use Normal Approximation If n 10 EPI 809 / Spring 2008 Sign Test Concepts Make null hypothesis about true median Let S = number of values greater than median Each sampled item is independent If null hypothesis is true, S should have binomial distribution with success probability .5 EPI 809 / Spring 2008 Sign Test Example You’re an analyst for Chef-Boy-R-Dee. You’ve asked 7 people to rate a new ravioli on a 5-point scale (1 = terrible,…, 5 = excellent) The ratings are: 2 5 3 4 1 4 5. At the .05 level, is there evidence that the median rating is at least 3? EPI 809 / Spring 2008 Sign Test Solution H0: Ha: = Test Statistic: P-Value: Decision: Conclusion: EPI 809 / Spring 2008 Sign Test Solution H0: = 3 Ha: < 3 = Test Statistic: P-Value: Decision: Conclusion: EPI 809 / Spring 2008 Sign Test Solution H0: = 3 Ha: < 3 = .05 Test Statistic: P-Value: Decision: Conclusion: EPI 809 / Spring 2008 Sign Test Solution H0: = 3 Ha: < 3 = .05 Test Statistic: P-Value: S=2 (Ratings 1 & 2 Are Less Than = 3: 2, 5, 3, 4, 1, 4, 5) Is observing 2 or more a small prob event? Decision: Conclusion: EPI 809 / Spring 2008 Sign Test Solution H0: = 3 Ha: < 3 = .05 Test Statistic: S=2 (Ratings 1 & 2 Are Less Than = 3: 2, 5, 3, 4, 1, 4, 5) Is observing 2 or more a small prob event? P-Value: P(S 2) = 1 - P(S 1) = .9297 (Binomial Table, n = 7, p = 0.50) Decision: Conclusion: EPI 809 / Spring 2008 Sign Test Solution H0: = 3 Ha: < 3 = .05 Test Statistic: S=2 (Ratings 1 & 2 Are Less Than = 3: 2, 5, 3, 4, 1, 4, 5) Is observing 2 or more a small prob event? P-Value: P(x 2) = 1 - P(x 1) = . 9297 (Binomial Table, n = 7, p = 0.50) Decision: Do Not Reject at = .05 Conclusion: EPI 809 / Spring 2008 Sign Test Solution H0: = 3 Ha: < 3 = .05 Test Statistic: S=2 (Ratings 1 & 2 are < = 3: 2, 5, 3, 4, 1, 4, 5) Is observing 2 or more a small prob event? P-Value: P(x 2) = 1 - P(x 1) = = . 9297 (Binomial Table, n = 7, p = 0.50) Decision: Do Not Reject at = .05 Conclusion: There is No evidence for Median < 3 EPI 809 / Spring 2008 Wilcoxon Rank Sum Test EPI 809 / Spring 2008 Wilcoxon Rank Sum Test 1.Tests Two Independent Population Probability Distributions 2.Corresponds to t-Test for 2 Independent Means 3.Assumptions Independent, Random Samples Populations Are Continuous 4.Can Use Normal Approximation If ni 10 EPI 809 / Spring 2008 Wilcoxon Rank Sum Test Procedure 1. Assign Ranks, Ri, to the n1 + n2 Sample Observations If Unequal Sample Sizes, Let n1 Refer to Smaller-Sized Sample Smallest Value = 1 2. Sum the Ranks, Ti, for Each Sample Test Statistic Is TA (Smallest Sample) Null hypothesis: both samples come from the same underlying distribution Distribution of T is not quite as simple as binomial, but it can be computed EPI 809 / Spring 2008 Wilcoxon Rank Sum Test Example You’re a production planner. You want to see if the operating rates for 2 factories is the same. For factory 1, the rates (% of capacity) are 71, 82, 77, 92, 88. For factory 2, the rates are 85, 82, 94 & 97. Do the factory rates have the same probability distributions at the .10 level? EPI 809 / Spring 2008 Wilcoxon Rank Sum Test Solution H0: Ha: = n1 = n2 = Critical Value(s): Test Statistic: Decision: Conclusion: Ranks EPI 809 / Spring 2008 Wilcoxon Rank Sum Test Solution H0: Identical Distrib. Ha: Shifted Left or Right = n1 = n2 = Critical Value(s): Test Statistic: Decision: Conclusion: Ranks EPI 809 / Spring 2008 Wilcoxon Rank Sum Test Solution H0: Identical Distrib. Ha: Shifted Left or Right = .10 n1 = 4 n2 = 5 Critical Value(s): Test Statistic: Decision: Conclusion: Ranks EPI 809 / Spring 2008 Wilcoxon Rank Sum Table 12 (Rosner) (Portion) = .05 two-tailed n1 4 n2 4 5 6 : TL 10 11 12 : 5 TU 26 29 32 : TL 16 17 18 : 6 TU 34 38 42 : EPI 809 / Spring 2008 TL 23 24 26 : TU 43 48 52 : .. .. .. .. .. : Wilcoxon Rank Sum Test Solution H0: Identical Distrib. Ha: Shifted Left or Right = .10 n1 = 4 n2 = 5 Critical Value(s): Reject Do Not Reject Reject 12 Test Statistic: Decision: Conclusion: 28 Ranks EPI 809 / Spring 2008 Wilcoxon Rank Sum Test Computation Table Factory 1 Rate Rank Factory 2 Rate Rank Rank Sum EPI 809 / Spring 2008 Wilcoxon Rank Sum Test Computation Table Factory 1 Rate Rank 71 82 77 92 88 Factory 2 Rate Rank 85 82 94 97 ... ... Rank Sum EPI 809 / Spring 2008 Wilcoxon Rank Sum Test Computation Table Factory 1 Rate Rank 71 1 82 77 92 88 Factory 2 Rate Rank 85 82 94 97 ... ... Rank Sum EPI 809 / Spring 2008 Wilcoxon Rank Sum Test Computation Table Factory 1 Rate Rank 71 1 82 77 2 92 88 Factory 2 Rate Rank 85 82 94 97 ... ... Rank Sum EPI 809 / Spring 2008 Wilcoxon Rank Sum Test Computation Table Factory 1 Rate Rank 71 1 82 3 77 2 92 88 Factory 2 Rate Rank 85 82 4 94 97 ... ... Rank Sum EPI 809 / Spring 2008 Wilcoxon Rank Sum Test Computation Table Factory 1 Rate Rank 71 1 82 3 3.5 77 2 92 88 Factory 2 Rate Rank 85 82 4 3.5 94 97 ... ... Rank Sum EPI 809 / Spring 2008 Wilcoxon Rank Sum Test Computation Table Factory 1 Rate Rank 71 1 82 3 3.5 77 2 92 88 Factory 2 Rate Rank 85 5 82 4 3.5 94 97 ... ... Rank Sum EPI 809 / Spring 2008 Wilcoxon Rank Sum Test Computation Table Factory 1 Rate Rank 71 1 82 3 3.5 77 2 92 88 6 Factory 2 Rate Rank 85 5 82 4 3.5 94 97 ... ... Rank Sum EPI 809 / Spring 2008 Wilcoxon Rank Sum Test Computation Table Factory 1 Rate Rank 71 1 82 3 3.5 77 2 92 7 88 6 Factory 2 Rate Rank 85 5 82 4 3.5 94 97 ... ... Rank Sum EPI 809 / Spring 2008 Wilcoxon Rank Sum Test Computation Table Factory 1 Rate Rank 71 1 82 3 3.5 77 2 92 7 88 6 Factory 2 Rate Rank 85 5 82 4 3.5 94 8 97 ... ... Rank Sum EPI 809 / Spring 2008 Wilcoxon Rank Sum Test Computation Table Factory 1 Rate Rank 71 1 82 3 3.5 77 2 92 7 88 6 Factory 2 Rate Rank 85 5 82 4 3.5 94 8 97 9 ... ... Rank Sum EPI 809 / Spring 2008 Wilcoxon Rank Sum Test Computation Table Factory 1 Rate Rank 71 1 82 3 3.5 77 2 92 7 88 6 Rank Sum Factory 2 Rate Rank 85 5 82 4 3.5 94 8 97 9 ... ... 19.5 EPI 809 / Spring 2008 25.5 Wilcoxon Rank Sum Test Solution H0: Identical Distrib. Ha: Shifted Left or Right = .10 n1 = 4 n2 = 5 Critical Value(s): Reject Do Not Reject Reject 12 Test Statistic: T2 = 5 + 3.5 + 8+ 9 = 25.5 (Smallest Sample) Decision: Conclusion: 28 Ranks EPI 809 / Spring 2008 Wilcoxon Rank Sum Test Solution H0: Identical Distrib. Ha: Shifted Left or Right = .10 n1 = 4 n2 = 5 Critical Value(s): Reject Do Not Reject Reject 12 Test Statistic: T2 = 5 + 3.5 + 8+ 9 = 25.5 (Smallest Sample) Decision: Do Not Reject at = .10 Conclusion: 28 Ranks EPI 809 / Spring 2008 Wilcoxon Rank Sum Test Solution H0: Identical Distrib. Ha: Shifted Left or Right = .10 n1 = 4 n2 = 5 Critical Value(s): Reject Do Not Reject Reject 12 Test Statistic: T2 = 5 + 3.5 + 8+ 9 = 25.5 (Smallest Sample) Decision: Do Not Reject at = .10 Conclusion: There is No evidence for 28 Ranks unequal distrib EPI 809 / Spring 2008


© Copyright 2026