
ANNUAL REPORT 2014 - NewsClient
ANNUAL REPORT 2014 Contents 2 NetEnt in brief 4 The year in brief 6 Comments from the CEO 8 Targets and strategies 10 Three megatrends 12Market 18Operations 24Responsibility 25 Employees and corporate culture 28 Board of Directors and Senior executives 30 The share 32 Five-year summary 33 Financial definitions 34 Administration report 37 Risks and risk management 40 Corporate governance report 52The share, future outlook and proposed distribution of earnings 54 Financial statements – Group 58 Financial statements – Parent Company 62 Accounting principles and notes 74 Auditors´ report 75 Annual General Meeting and other information 77 Addresses The administration report for Net Entertainment NE AB (publ) 556532-6443 and the financial statements consist of pages 34–73. The annual report is published in both Swedish and English. The Swedish version is the original and has been audited by NetEnt’s independent auditors. This game is accessible through a web browser only. TM & © Universal Studios. The Invisible Man is one of 23 new games launched in 2014, and the first game entirely developed in HTML5 for both desktop and mobile. We provide leading-edge online casino solutions that enable the ultimate entertainment experience. NETENT IN BRIEF Driving the online casino market NetEnt is a leading provider of digital entertainment, creating gaming and system solutions for the most successful online casino operators in the world. NetEnt develops world-class games and a powerful platform that helps customers to stay ahead of competition in terms of offering a better player experience. Total number of games 195 GAMES IN 25 1996 The Company was founded LANGUAGES 1.9% Other games EMPLOYEES FROM 47 COUNTRIES Number of Employees 591 2 NetEnt | Annual Report 2014 Share of women in Group management 50% 1.6% Video poker 4.4% Blackjack 7.9% Roulette 84.2% Slots Gaming yield for NetEnt’s games, 2014 INDUSTRY AWARDS IN 2014 7 NETENT IN BRIEF through better gaming solutions Business model We strive to offer an extraordinary gaming experience and we constantly renew our offering. 25,000 1% 4 ase cre n i l nua e an rag e v A 20,000 15,000 10,000 5,000 UPPDATERAS NetEnt’s gaming transactions, 2009–2014 2014 2013 2012 2011 2010 2009 0 billion 2012 2011 2010 Revenues and operating profit, 2009–2014 2014 Revenue Operating profit 900 800 700 600 500 400 300 200 100 0 2009 More than 90 customers – a selection 2013 NetEnt and its customers – the gaming operators – work according to a partnership model. For new customers, NetEnt adapts the gaming system based on the requirements of the operator. When the operator gains access to NetEnt’s gaming platform, an initial integration fee is paid and subsequently regular royalties – a percentage of the operator’s revenues generated through NetEnt’s gaming system. The operator that provides the best gaming experiences is in demand from players. NetEnt is a leader in game development and continuously updates the platform with new games and functions to attract players and constantly renew and improve the gaming experience, hence strengthening loyalty. SEK million NetEnt | Annual Report 2014 3 THE YEAR IN BRIEF Successful initiatives – profitable growth The year featured strong growth thanks to new customers and new games. SALES GROWTH OPERATING MARGIN 35% 30.7% Revenues for the year, SEK 851 662 597 21 419 076 753 Number of gaming transactions 2014 Key financial highlights 2014 2013 2012 Revenues (SEKm) 851.7 630.7 526.7 35.0% 19.8% 23.2% 261.7 179.7 153.1 30.7% 28.5% 29.1% 243.2 167.1 136.1 6.10 4.23 3.44 5.00 3.00 2.25 243.7 113.6 83.8 52.5% 49.5% 50.9% 258.1 105.8 79.4 Growth, % Operating profit (SEKm) Operating margin, % Profit after tax (SEKm) Earnings per share (SEK) Distribution to shareholders per share (SEK) 1 Cash flow before distribution to shareholders (SEKm) Return on equity, % Net cash position at year end (SEKm) 1) Proposed for 2014 4 NetEnt | Annual Report 2014 THE YEAR IN BRIEF Key events of the year Q1 A collaboration agreement was reached with GameAccount Network, a platform provider focusing on the regulated Italian market. Six agreements were entered with customers for the delivery of mobile games and ten customers launched mobile games in the quarter. Ten agreements were signed for the delivery of Live Casino and four customers launched Live Casino in the quarter. The video slot game Aliens, based on the iconic film, was launched. NetEnt was named “Innovator of the year” at the International Gaming Awards. Q2 Ten customer agreements were signed, including with bwin.party and Betfair. Betfair was also launched in the quarter. It was announced that Björn Krantz, the then Managing Director of NetEnt Malta Ltd, was to head the expansion in North America and be replaced by Enrico Bradamante. NetEnt won the award for Digital Gaming Innovation of the Year at the Global Gaming Awards in Las Vegas, and Leader of the Year at the Women in Gaming Awards. Q3 An agreement was signed with Rational Group for delivery to Full Tilt Poker. An agreement was reached with William Hill regarding land-based gaming machines. Bet365 and Sky Betting & Gaming were launched. Five agreements were entered for the delivery of Live Casino and nine customers launched Live Casino in the quarter. French and American roulette were launched. A Swedish player won a jackpot of EUR 7.4 million on NetEnt’s game, Hall of Gods – the second largest jackpot in Sweden ever. NetEnt won three awards at the annual eGaming Review B2B Awards for 2014, in the categories “Mobile Supplier of the Year”, “Slot Provider of the Year” and “RNG Casino Supplier of the Year”. Q4 Ten license agreements with new customers were entered and six customers were launched. For the first time ever, NetEnt launched a game developed entirely in HTML5 for both desktop and mobile – a slot game based on Universal Pictures’ classic film, the Invisible Man. NetEnt launched its second slot game in collaboration with South Park Digital Studios – South Park: Reel Chaos. Eurobet launched NetEnt’s online casino games in Italy. An important milestone was the development of The Invisible Man, because it was on a common platform for desktop and mobile. TM & © Universal Studios NetEnt | Annual Report 2014 5 COMMENTS FROM THE CEO The importance of being speedsmart 2014 was yet another in a series of fantastic years for NetEnt, with revenues, operating profit, cash flow and gaming transactions all hitting new record highs. Our industry features rapid growth, in both desktop and mobile, and our success requires an ability to rapidly meet customer wishes and offer thrilling, entertaining games in a secure environment. In order to succeed in this, we focus on simplicity, speed and a value-driven culture. We call this working speedsmart. The growth strategy produced results In 2014 we continued to strengthen our position as a leading provider of gaming and system solutions for the world’s most successful online casino operators. Sales growth for the full year 2014, even adjusted for exchange rate fluctuations, is the Company’s highest, while the operating margin remained strong. New customers, combined with a currency tailwind, made a positive contribution, although the primary reason for the increase in revenues and profit was solid underlying growth among NetEnt’s customers. Our growth strategy rests on underlying strong growth in online games. We grow with existing customers, while at the same time we continually add new products, games and functions, gain new customers and enter new markets. The strong trend of increased use of online games was clear in the number of gaming transactions; in 2014 we handled a full 21.4 billion transactions in our system, representing a 32 percent increase. Our model – working speedsmart So, we find ourselves in the midst of a strong growth trend. The key to sustained growth lies in our ability to remain at the forefront and create the best gaming experiences for online players – both mobile and desktop. At the same time, we must ensure that we can comply with increasingly stringent regulatory requirements in terms of managing a growing volume of gaming transactions, so that our customers may offer 6 NetEnt | Annual Report 2014 entertaining games in a secure environment. This requires a work method that includes both discipline and innovation; we usually describe ourselves as a “challenger company”, and have developed value-driven leadership that enables sustained development and managing a high growth rate in an ever-changing world. A key part of this is to constantly challenge ourselves, at every level – can we do this smarter and World-class entertaining games The core of our business model is the development of world-class entertaining, thrilling games, and in 2014 we developed as many as 23 new games for desktop and 13 for mobile devices. This means that today, our portfolio comprises around 200 games. We won a number of prestigious awards in 2014 at the International Gaming Awards, eGaming Review Awards, Women in Gaming Awards and Global Gaming Awards. We were awarded for both quality and innovation. For the first time ever we also developed a game entirely in HTML5 for both desktop and mobile – a slot game based on Universal Pictures’ classic film, The Invisible Man. This marks a change in game development work that is expected to generate economies of scale going forward. Mobile games continue to I am convinced that NetEnt’s focus on developing world-class gaming and system solutions positions us well to continue to grow on existing and new markets. faster? We value simplicity, speed and an open climate so that we don’t get stuck in hierarchical structures that slow us down. As a natural part of this, we attract diversity in employees; 47 nationalities are represented among NetEnt’s workforce, and we have a 50/50 split of women and men in Group management, and work actively to achieve the same balance throughout the organization. Working speedsmart enables us to capitalize on the scalability of our business model – as regulatory changes open up possibilities to set up operations on new markets, we have to be on site quickly with our tried-and-tested process. display strong growth and in 2014 we increased investments in this channel in order to further strengthen NetEnt’s leading position. In the fourth quarter, mobile games accounted for over 17 percent of total gaming yield for our games – a sharp increase from the 9 percent level at the end of 2013. New customers and new markets In 2014 we continued to expand our customer base by a full 31 new customer agreements and 28 customers launched. In the UK, Europe’s largest gaming market, we reached new customer agreements during the year with gaming operators such as Betfair, bwin. party and William Hill (retail). We have started to see some effect on revenues and in time we see major potential in this market. During the year, NetEnt entered a collaboration agreement in Italy with platform supplier GameAccount Network, which enabled us to go live with major gaming operators such as Snai, Sisal and Eurobet on the regulated Italian market. Live Casino is an interesting product launched by NetEnt in 2013. In 2014 NetEnt entered 24 new Live Casino agreements, and 28 customers were launched. The global Live Casino market is expected to grow by 19 percent on average annually until 2018 (source: H2 Gambling Capital, January 2015) and in time we expect the segment to generate healthy growth and profitability for us. Sights set on sustained profitable growth We have yet another exciting year ahead, with many projects and challenges. We will continue to evaluate new markets, with market entry in North America and Spain next in line for 2015, although other new countries might also be in the cards, if and when opportunities arise. We will also continue to invest in the platform to better enjoy economies of scale, and we see major opportunities in further development in HTML5 for mobile and desktop. I am proud of and pleased about what we at NetEnt managed to achieve together in 2014. The strong growth trend in online gaming, our strategy of entering new markets and our focus on high operational efficiency strengthen my conviction that we can look forward to sustained growth with healthy profitability in 2015 too. Stockholm, March 2015 Per Eriksson President and CEO NetEnt | Annual Report 2014 7 TA R G E T S A N D S T R AT E G I E S Vision: Driving the online casino market through better gaming solutions Mission: Creating value by providing leading-edge online casino solutions that enable the ultimate entertainment experience OUR FINANCIAL TARGETS NetEnt’s overall objectives are to further strengthen its position as a leading global supplier of online casino games and system solutions, drive developments and outpace market growth. Outcome NetEnt’s ambition is for dividend to amount to a minimum of 50 percent of net profit after tax, taking the Company’s long-term capital requirement into account. Outcome In the past five years, NetEnt has increased revenues by 23 percent annually on average while annual growth of the online casino market in Europe has averaged 12 percent*. In 2014 our revenues grew 35 percent while market growth in Europe for the year is estimated at 13 percent*. In the past five years, NetEnt’s dividend has averaged 69 percent of net profit. For 2014, a dividend of SEK 5.00 per share (3.00) is proposed, equaling 82 percent of net profit. *Source: H2 Gambling Capital. OUR STRATEGIES Continually develop the offering to be at the forefront in terms of technology, innovation and quality. Participate in the re-regulation of the gaming market and expand globally on regulated markets. Constantly optimize efficiency in all parts of the operations. Attract, preserve and develop core expertise. Act with great customer proximity and business focus, and invest in new business opportunities. 8 NetEnt | Annual Report 2014 TA R G E T S A N D S T R AT E G I E S A SELECTION OF MILESTONES OUR HISTORY NetEnt was founded in 1996 and has its roots in the traditional casino world and what was then Cherryföretagen. In 1963 AB Restaurang Rouletter was founded by Bill Lindwall and Rolf Lundström. In 1968, a partnership was established with AB Roulett konsult & Spelautomater, founded by Per Hamberg and Lars Kling. The operations attained national reach and in 1972 the name Cherry was registered, with the cherry logo. After a couple of eventful decades, Bill Lindwall’s son, Pontus Lindwall, founded NetEnt in 1996. The Company became a pioneer when online gaming started to take off in the mid-1990s and the first online casino was launched in 2000. In 2007 the Company was spun off and was listed on NGM Equity and in 2009 the Company moved to the main market, Nasdaq OMX Stockholm. 2002 NetEnt CasinoTM is launched. 2003 NetEnt delivers Casino Modules to several customers. The Company’s sales grow sharply and the Company reaches profitability. 2004 NetEnt delivers a substantial number of Casino Modules to international customers. GROWTH STRATEGY 2005 NetEnt receives a gaming license in Malta. € 2007 NetEnt is spun off and listed on NGM Equity. NEW CUSTOMERS 2009 NEW MARKETS NetEnt is relisted on the Stockholm Stock Exchange. NEW GAMES AND FUNCTIONS 2010 EXISTING CUSTOMERS The first platinum game, Gonzo’s Quest, is launched and the Company receives a Category 2 license on Alderney. 2011 2012 OUR CORE VALUES TOGETHER WE WIN NetEnt launches mobile games for the first time and expands in Italy – a new regulated market. Several important agreements are entered, e.g. with Boylesports and Paddy Power. The Danish market is regulated and NetEnt obtains certification and launches games with several customers. THINK AHEAD BE AHEAD 2013 NetEnt enters agreements with a great number of entities for casino games, as well as a framework agreement with GTECH. Several important customer agreements are signed with gaming operators in the UK. Live Casino is launched among a number of customers, as are several mobile games. 2014 WE ACT SPEEDSMART PASSION IN ALL WE DO Value-based leadership with dedicated employees that take the initiative is fundamental to being at the cutting edge in a fast-moving digital world. Our core values help all employees to act with our vision in mind, and to get there as quickly and efficiently as possible. New customer agreements are signed with, for instance, bwin.party, Betfair and Rational Group, as well as a collaboration agreement with platform supplier GameAccount Network. An agreement is reached with William Hill regarding landbased gaming machines. In total, 31 new customer agreements are entered and 28 customers are launched during the year. For the first time, NetEnt develops a game entirely in HTML5 – a standard for both desktop and mobile. Market capitalization overshoots EUR 1 billion at year-end. NetEnt | Annual Report 2014 9 T H R E E M E G AT R E N D S NetEnt’s business model and strategic focus benefit from three megatrends. Trend 1: Globalization Globalization is a predominant trend that will continue to be an important global economic driver for a long time ahead. Regional and bilateral trade agreements open up borders to capital, goods and services, and boost global trade. Growing internet penetration facilitates marketing and distribution into new geographic markets, especially in the service sector. Expertise also transcends borders with international corporations. At the same time, competition is increasing. How the gaming industry and NetEnt are affected New markets Online gaming is a global phenomenon and there is a trend of a growing number of countries regulating or discussing the regulation of online gaming, primarily in Europe but also in North America. In general, regulation supports market growth, depending on how regulation is introduced with respect to e.g. taxes and products. NetEnt’s strategy is to enter new regulated markets when the conditions are right. New demands from players NetEnt’s strength is its understanding of the player experience. In order for us to offer a superior gaming experience, creative mechanics and mathematics are combined 10 NetEnt | Annual Report 2014 with innovation in game flow and technology. Thanks to our international presence, for instance in Malta and Gibraltar, and proximity to the gaming operators, we know how to adapt our product and our focus to match local and regional needs. Scalability, platform and tailoring content NetEnt offers the operators a comprehensive platform that includes marketing tools and advanced statistical and operational functions to support their operations. Our casino system supports a large number of languages and currencies, enabling a strategy that is tailored to customers, yet global. As the customer base grows, NetEnt can get more leverage from earlier investments in games and platform – the business model is scalable. Global distribution The growing importance of coordinated launches of game titles and content in different channels, combined with certification requirements for the specific markets, increases the challenge faced by software providers with global ambitions. Thanks to NetEnt’s size and market position, together with our extensive product knowledge, we can support our customers in global expansion in a close partnership. Our ability to offer some of the world’s largest brands from third parties such as Universal, South Park Digital Studios and Twentieth Century Fox is testimony to NetEnt’s position as a leading supplier with global capacity. T H R E E M E G AT R E N D S Trend 2: Digitalization and convergence Digitalization and convergence is becoming the norm in retail and in 2020 all land-based B2C retailers are also expected to offer e-commerce. Almost 19 percent of global retail is expected be online in 2025*. Hence, an increasing number of virtual shops and megastores will emerge, as well as interactive stores and various combinations of land-based and online. This creates new opportunities, but also increases competition. How the gaming industry and NetEnt are affected Convergence between land-based and online An important trend in the gaming industry is the increasing convergence between landbased gaming and online gaming. The primary reason is that many land-based gaming and lottery operators on newly regulated markets with a strong local presence, well-known brands, customer bases and local regulatory knowledge are also launching online games. There has been a shift among land- and onlinebased operators towards common technology in order to attract and retain players. Different types of bonuses and cross-selling with other products, as well as more distribution channels, present the operators with new opportunities, but also pose heightened technical challenges for them. Some online providers have launched product concepts that resemble a classic, land-based casino environment, in order to reach a new group of players. One example is Live Casino, launched by NetEnt in 2013. NetEnt’s Live Casino uses real dealers in real time over videolink. This type of product illustrates the potential for innovation and scalability in the converging zones of online and land-based casino. Optimization of casino operations As competition intensifies, competitive advantages become crucial to operators. NetEnt’s powerful administration tool enables gaming operators to optimize their casino operations and hence bolster both earnings and market position. During the year an agreement was entered – the first of its kind for NetEnt – with William Hill (retail) for land-based gaming machines, which will soon make some of NetEnt’s games available at William Hill’s 2,300 betting outlets around the UK. Trend 3: Mobile development In 2020 there will be over five billion internet users worldwide, over half of whom will have access to the internet through mobile devices. This will change everyday lives, merging work, leisure time and surroundings into a connected living. We will witness new behavior and needs.* How the gaming industry and NetEnt are affected Convenience and availability In recent years, the mobile gaming trend has sharply increased. A growing number of players are using mobile devices thanks to the convenience and increased availability they provide. To date, the growth has had an entirely positive effect on total gaming; in other words it has not occurred at the expense of desktop gaming. The mobile segment is at present one of the most exciting and fastest-growing segments of casino operations. It provides further innovation, synergies and presents expansion opportunities in a rapidly growing channel. Common development platform NetEnt has been developing mobile games since 2011 and mobile games have continually increased in terms of volume, technical content and availability. In December 2014 NetEnt launched its first desktop game developed entirely in HTML5 – a common standard for desktop and mobile games – The Invisible Man. The results were really great. The product is testimony to NetEnt’s technical expertise and the exciting opportunities and synergies that a new, entirely synchronized work method will provide ahead. Revenues from mobile games increased sharply during the year. In the fourth quarter, the segment accounted for over 17 percent of total revenues, compared with just nine percent at the beginning of the year. We have a positive view on this segment going into 2015 and beyond. *Source: Forbes, Frost & Sullivan NetEnt | Annual Report 2014 11 MARKET The online casino market is growing strongly. New geographic markets are opening up through regulation, and game availability is improving thanks to increased internet penetration and new forms of distribution, such as mobile phones and tablets. Greater availability creates new market opportunities EUROPE Growth forecast 2014–2018: 6% Share of total market: 50% ASIA & THE MIDDLE EAST Growth forecast 2014–2018: 10% Share of total market: 24% NORTH AMERICA Growth forecast 2014–2018: 18% Share of total market: 16% OTHER Growth forecast 2014–2018: 12% Share of total market: 10% Source: H2 Gambling Capital, January 2015. The figures refer to online casino. For the year, the global casino market is expected to amount to EUR 131 billion, of which 5 percent, or EUR 6.5 billion, comprises online casino games. However, the share is growing in line with the continuing convergence between land-based and online games. On a global basis, the online casino market grew 11 percent in 2014, and European market growth is estimated at just shy of 13 percent for the year. Global gross gaming yield for all types of games is expected to have amounted to EUR 353 billion in 2014, of which EUR 30 billion was derived online, representing an 11 percent increase from the previous year. An expansive market Increased availability and greater technological familiarity give rise to new groups of players. The trend is clear – people are spending an increasing amount of time online, with a growing share of their disposable income going to forms of online entertainment, including casino games. When online casino was launched 10 years ago, the typical player was a male between the ages of 25 and 35 who combined casino games with sports games. Today, there is a high female proportion, a group of younger players accustomed to other types of online games, and there is also a growing group of more senior players. NetEnt’s market strategy NetEnt focuses on online casino games, a segment that has shown solid growth and profitability. Over the last six years, the Company has increased its sales by 184 percent, while the global online casino market has grown by 55 percent in the same period. The future of online gaming looks bright, and NetEnt has solid fundamentals for gaining fresh market share. Competitors As the market expands, so too does competition, both from large companies and small game developers targeting a niche or geographic submarket. Nonetheless, NetEnt continues to gain market share, largely thanks to its ability to handle the stringent requirements imposed by authorities on regulated markets, and the demands by players in terms of an entertaining gaming experience. The online gaming market is dominated by a handful of suppliers. Most of them offer a broader product portfolio than NetEnt, and many have also opted to focus on the poker market. NetEnt’s main competitors are Playtech and Microgaming. There are also several smaller competitors. In the past six years, NetEnt increased sales by 184 percent, while the global market grew 55 percent. EUR 131bn 95% Land-based casino 5% Online casino The global casino market – our potential1 1 12 NetEnt | Annual Report 2014 The figures refer to gross gaming yield. Source: H2 Gambling Capital, January 2015 MARKET ive Casino is broadcast from NetEnt’s gaming studio L in Malta, with real dealers over videolink in real time, around the clock. Online casino market, global1 Gross gaming yield, online casino, global 2007–2018 38% Other casino 28% Lottery Online casino market, Europe1 Gross gaming yield, online casino, Europe 2007–2018 13% Betting 2018E 2017E 2016E 2015E 2014 2013 2011 2012 2010 2009 2007 EURbn 2008 Gaming 17% machines 2018E 2017E 2016E 2015E 0 2014 1 0 2013 2 2012 2 2011 3 4 2010 6 2009 4 2007 5 8 2008 10 4% Bingo/Other EURbn Global split by game NetEnt’s market share, global1 % NetEnt’s market share, Europe1 2014 2013 2012 2011 2010 2009 2007 2014 2013 0 2012 5 0 2011 10 5 2010 15 10 2009 20 15 2008 25 20 2007 30 25 2008 1 30 % The market share is based on the gross gaming yield among NetEnt’s customers in relation to the European online casino market, as estimated by H2 Gambling Capital in January 2015. H2 Gambling Capital’s estimate of the market’s size has changed during the year, and the market is now assumed to be larger than previously estimated. Consequently, NetEnt’s market share in 2013 was lower than previously communicated: 26 percent in Europe and 13 percent globally. In 2014 NetEnt increased its market shares to 30 percent in Europe and 15 percent globally. Source: H2 Gambling Capital, January 2015 NetEnt | Annual Report 2014 13 MARKET Geographic expansion on regulated markets Licenses Malta Gibraltar Alderney Belgium Certifications Denmark Italy Estonia Online gaming regulation Gaming for money has been a controversial political matter in the past, and still is in the modern era. The development of the internet in the past two decades has created possibilities for operators to offer games on a crossborder and global basis. This made it difficult for various countries and authorities to establish the jurisdiction of the games. National state gaming monopolies were therefore exposed to competition, leading to a regulatory review in many countries. A national license system provides individual countries with greater opportunities to secure tax revenues and limit cross-border gaming services. Regulation and re-regulation present a more stable business environment and greater revenue opportunities in the long term for companies that can seize opportunities arising in an evolving market. At the same time, growing on a regulated market is more costly. From the point of view of competition, however, regulation presents higher entry barriers, which benefits NetEnt. Far from all companies have the necessary capacity, either in terms of resources or organization, to obtain and maintain a license. NetEnt, however, has both the expertise and resources to adapt relatively quickly to new regulations. The new market regulation is also positive in that the industry may be viewed as less controversial, and as a natural part of the entertainment industry. Malta – gaming center of Europe Since Malta joined the EU in 2004, this small island has established itself as the gaming center of Europe, because the country offers the most competitive business conditions among the countries that issue gaming licenses. In April 2004, the Maltese gaming authority, Lotteries & Gaming Authority (now called MGA) published a comprehensive regulatory instrument by the name of “Remote Gaming Regulations” (LN176/2004). The legislation comprises many different game categories and game platforms. The purpose is to help achieve a more secure environment for both online players and gaming companies. There are four different license categories in Malta, and these are issued for periods of at least five years. NetEnt has a class 4 license which runs until 2015, when it will be renewed. Regulating a market – the procedure 1. A new market is regulated and gaming operators and, in certain cases, suppliers commence the license application process. 14 NetEnt | Annual Report 2014 2. The gaming authority in the region in question performs a review of the gaming operator’s products, services, organization, internal control systems and processes. 3. Games are certified by an independent testing company in order to ensure that they meet the set requirements. 4. On certain markets, such as Malta, Gibraltar, the UK and US, licensing is required not only for operators, but also for technology and game suppliers, such as NetEnt, and sometimes even personal licenses for senior executives and other key individuals. It takes time and resources to become a certified participant on a regulated market. From the left: Anders Dandenell, Camilla Arvidsson, Susanne Pettersson, Rachel Winberg, Anders Hannover. We welcome regulations NetEnt’s compliance function consists of eight people of varying backgrounds. My background is in the financial services sector. We serve as support for the organization in matters relating to regulations, laws and directives. As part of this, we provide internal training sessions and are responsible for a lot of the dialog with authorities, in licensing processes for instance, and keep the organization updated on any regulatory changes. Working with licenses and certifications usually follows a certain procedure, although different countries impose different requirements. The number of requirements of relevance to us can be in the range of 100–500, of which 20–30 percent is generic for all markets. Documentation is crucial, both in the license application and subsequent work, for instance in any changes to a certain game. I personally find most regulations sound because their purpose is to protect players. Camilla Arvidsson Enterprise Risk Manager NetEnt | Annual Report 2014 15 MARKET EUROPE Europe is by far the largest gaming market and is expected to account for close to half of global gaming yield on the online casino market in the next few years. The trend in Europe is headed towards the introduction of national license requirements and game tax for marketing games. The amendment has progressed to varying degrees in different countries and no harmonization measures have been taken in the EU. NetEnt carefully monitors the deregulation and re-regulation of national gaming legislation currently occurring in many European countries. NetEnt intends to launch its products on these markets if the conditions are right. The Spanish online casino market is now regulated and NetEnt has applied for a license. In the UK, Europe’s largest gaming market, all operators targeting British players will need a UK gaming license and must pay gambling tax in the UK, regardless of where the operator is based. This marks an amendment to the previous regulations and NetEnt has applied for a license. The Italian market has been re-regulated and NetEnt has developed close cooperation with the responsible gaming authorities to get unlicensed operators, with a focus on Italian players, to acquire a local license. As of 2015, NetEnt will only deliver services to licensed operators. Denmark has been a regulated market since January 2013, and NetEnt’s products are certified there. Belgium currently has gaming legislation that limits the number of online operators to those already in possession of a land-based license for the same products. A number of online operators are now offering games online through partnerships with landbased operators. NetEnt has an “e-license” in Belgium. Estonia, Latvia, Bulgaria and Romania have regulated online gaming markets. In Portugal preparations are under way for regulation and licensing in the near future. In the Netherlands, market regulation is expected to occur towards the end of 2015 or beginning of 2016. In Sweden the EU Commission has brought action against the country in the European Court because it finds that the Swedish gaming monopoly does not comply with EU law. However, there are no indications of re-regulation in the near future. In November 2013, New Jersey opened up the online casino market. Discussions are also in progress in other states to introduce new gaming laws, e.g. in Pennsylvania and New York. In Canada the market is regulated in several provinces such as Ontario, British Columbia and Quebec. In 2014, NetEnt decided to establish itself in North America with the aim of launching its products in the US and Canada in the second half of 2015. OTHER MARKETS The online gaming market in Asia and the Middle East lags that of Europe, mainly due to cultural differences and low internet penetration. However, the situation is progressing in these regions too, and they are expected to show solid growth in the coming years. NetEnt intends to establish itself in Asia in the future, if and when such opportunities arise. NORTH AMERICA The US prohibited real money gaming online in 2006, but political initiatives are now under way at state level to introduce a new online gaming regulation. Several states have already regulated online gaming – Nevada (poker) and Delaware (all game segments). Developments in and current status of regulated markets that we consider to be of interest for NetEnt Estonia Denmark Regulated markets Markets where regulation might be in the cards Alderney Belgium Gaming license Malta, Alderney, Gibraltar, Belgium Certification Denmark, Italy, Estonia Italiy Gibraltar Malta 16 NetEnt | Annual Report 2014 Simon Hammon, Chief Product Officer and member of Group management. We cooperate very closely with the operators in order to constantly improve our offering. Business-critical functions in Malta NetEnt’s business-critical and strategic functions such as market strategy, product strategy, sales and customer support as well as the Live Casino studio are located in Malta. This is a strategic choice of location because Malta has become a center for the European gaming industry. Industry expertise moves to Malta, and most of our European customers have their operations there. The gaming authority on Malta, through regulation and bilateral agreements with other EU/EEA member states, enables the gaming industry to consolidate the supply of services from Malta, not just to companies licensed in Malta, but also to those that are primarily regulated by foreign gaming authorities such as Italy and Denmark. NetEnt | Annual Report 2014 17 O P E R AT I O N S NetEnt’s offering NetEnt offers a complete online casino solution containing a powerful platform with around 200 thrilling, innovative games. The strategy is to provide the very best in terms of system, games and service alike. NetEnt offers a comprehensive gaming system comprising a full suite of world-class casino games and a powerful technological platform. The games are of high quality and provide players with an ultimate gaming experience, while the platform manages over two billion transactions per month. 18 NetEnt | Annual Report 2014 The product also includes an advanced administration tool that enables the operator to develop successful casino operations. NetEnt takes care of all technical operation and monitoring of gaming transactions for its customers, known as hosting. The gaming system is tailored to each licensee so the games form a natural, integral part of the operator’s gaming site. O P E R AT I O N S Game portfolio NetEnt’s game portfolio comprises almost 200 games in eight categories, offered in various channels such as desktop, tablets and mobile phones. Features of a good game First and foremost, a good game should give a thrilling, entertaining gaming experience. What is considered “good” differs of course from player to player. It is therefore important to have a game portfolio that is well balanced, so that different groups of players can find Video Slots Examples of games: Starburst, Blood Suckers, Gonzos Quest, Mega Fortune and Twin Spin. Features: The most popular category. Offer a high level of gaming experience, often graphically advanced productions. Collaboration with wellknown brands such as Aliens, South Park and Guns’n Roses. Table Games Examples of games: Roulette Pro, Roulette French Pro, Blackjack Pro and European Roulette. Features: Online table games work in the same way as at a land-based casino. their favorites. For example, some players want the chance to win a large jackpot, while others would rather win small amounts more frequently. It is also important to players that the games are stable, that the gaming transactions work and that the technology works. Mobile games Examples of games: Starburst Touch, Jack Hammer Touch, Gonzos Quest Touch, South Park Touch, Mega Fortune Touch and Twin Spin Touch. Features: Games adapted for mobile phones and tablets with small screens and a touchscreen interface. Video Poker Examples of games: Jacks or Better, Joker Wild and Deuces Wild. Features: Slot games with a gaming concept based on card combinations that occur in poker. On average, the return to players on NetEnt’s games is around 97 percent, which makes them attractive. In other words, the player knows that only a few percent of bets placed are kept by the operators, and that the chances of winning are therefore much higher than in most classic, land-based gaming forms. Classic Slots Examples of games: Jackpot 6000, Mega Joker and Lucky 8 Line. Features: Classic slots are the same as one-arm bandits or slot games. Three, five or more spinning wheels give winning combinations. Lottery and other Live Casino Examples of games: Live Roulette, Live Blackjack Common Draw and Live Roulette Auto. Features: Live Casino uses real dealers, over videolink, instead of a mere random generator. Mini Games Examples of games: Triple Wins, The Lost Pyramid, Seven Gold Scratch, Bonus Keno, Golden Derby and Bingo. Examples of games: Mini Blackjack, Mini Gooooal, Cash Bomb and Starburst Mini. Features: Scratch cards, Keno and Bingo. Features: Intended to be exposed on sites other than operators’ casino sections. NetEnt | Annual Report 2014 19 O P E R AT I O N S Developing entertaining and thrilling games is at the core of NetEnt’s operations, and the key focus is always to maximize player experience. The work is driven by tough demands from both gaming operators and end users, in terms of quality, renewal, and availability. From concept to game A dynamic and close dialogue with the operators is crucial to developing the right game for the specific markets, where customers often have different preferences depending on channel and geographic market. Because NetEnt does not market its games directly to players, a close partnership with the operators is important in order for them to place our games prominently in their casino lobby. A new feature is that, during the year, we started to develop tailored, exclusive games for some of our major customers. The creative process Developing a new game is a creative process involving a number of different skills. The concept for a new game is realized in a clearly defined process flow, in which product management in Malta initiates and assumes primary responsibility for the game project. The combination of theme, graphics, mechanics and mathematics is key. The mathematical element is mainly about creating random wins based on set rules, in which for example the games strike a different balance between frequent small wins and infrequent large wins. Game development itself is conducted at one of our three gaming studios in Stockholm, Gothenburg or Kiev in Ukraine. The practical work commences when an art director drafts a graphical concept. Then, graphic designers and system developers progress with the game environment and create 3D effects, for example. Other project members develop sound, and a number Ideas from customers and market research Knowledge about player behavior 20 NetEnt | Annual Report 2014 of programmers are also involved, depending on the platform involved – all under project management and in close teamwork with the product manager. Most games created in 2014 were made in two versions – one for desktop and one for mobile. At the end of the year, for the first time, NetEnt developed both versions in HTML5 (desktop games were previously developed in Flash). In this way, it will be possible to build a great number of our games on a common platform in the future. The development projects form a close cooperation between everybody involved, and take between three and six months depending on how standardized the game is. Great emphasis is put on every detail. For major games based on reputed brands, from the likes of Universal or Fox, short trailers are also created. In 2014, Aliens and The Invisible Man were launched – both great examples of this type of production. Review and verification All games are verified internally during a testing and quality assurance process that runs in parallel with game development, followed by independent review and verification. Even once the games have been launched, they are regularly tested by independent accredited test institutes to ensure total gaming integrity and that the random number generator works as it should. Documentation regarding each game is particularly important. It must be possible to show in detail all background facts and any changes to a game to the relevant gaming authority. Number of new desktop games during the year 23 Number of new mobile games during the year 13 3 Number of gaming studios Anna Lagerborg, Chief Development Officer and member of Group management. Besides being entertaining, a good game must meet a large number of quality requirements. Development of digital entertainment The most exciting feature of development activities at NetEnt is the balance between the technologically advanced, regulated, mature B2B company and the playfulness and creativity our games represent. In terms of knowledge of technology, mathematics and IT, we are facing requirements at least as tough as those faced by, for instance, a stock exchange. As an example, we had just over 21 billion transactions in 2014, which is 14 times more than the New York Stock Exchange. While our employees must be thorough with in-depth technological expertise, they must also have an intuitive sense of what makes good entertainment. Anna Lagerborg Chief Development Officer NetEnt | Annual Report 2014 21 O P E R AT I O N S Platform with an advanced administration tool An important part of our offering is our comprehensive casino platform with games and an administration tool. It is a technically separate system, but is perceived by players to be a part of the operator’s online casino. The platform manages the gaming transactions and features an advanced administration tool that enables the operator to develop a successful and efficient casino operation. Some important functions offered by the administration tool are: Access to rapid, precise information Powerful reporting engine for follow-up Monitoring and follow-up of games Tool for verification and control of the casino operations in real time User-friendly software for operating casino tournaments and bonus and loyalty programs Easy access to player information Integration of new customers The delivery of a casino to a new customer is the beginning of a long-term partnership in which our goal is to help create a successful casino business for the operator. The operator is provided with a customized system solution that is quickly and easily integrated, ensuring cost-efficient Number of gaming trans operation and minimizing installation-to-launch times. actions, billion, 2014 NetEnt plays an active part in the integration work among new customers. We have extensive experience and expertise from casino operations, and we act in close partnership in order to provide operators with the support they need at different levels. This may mean developing tools for more effective marketing, player behavior evaluation and regular follow-up between the operator and NetEnt’s account manager. In this way, operations can be optimized, System availability during the revenues maximized and costs controlled. 21.4 year, 24/7, 365 days/year Enhancing the platform In 2014 extensive work was undertaken to upgrade NetEnt’s platform, and this work will continue in 2015. The purpose of the platform work is partly to ensure sustained high operational security with a growing customer base, but primarily to enable faster and more efficient distribution of new functionality and new games to the operators. >99% NetEnt has five data centers around the world for operating games and casino systems. The IT infrastructure is of strategic importance and both customers and regulated authorities impose stringent demands on operational security, functionality and storage capacity. 22 NetEnt | Annual Report 2014 From left: Henrik Lundqvist, Jessica Dellow, Ron Rabinowicz, Fahad Hossain. - Extraordinary demands on security and stability – every second is important. Operations for stability and security NetEnt takes responsibility for all technical operations such as monitoring gaming transactions for its customers, known as hosting, so that the operators may focus on their core operations. Besides operating and monitoring the computer systems, technical support and regular system upgrades are included, to ensure that the operator can always provide good service and availability to players. Uptime at over 99 percent NetEnt’s platform is a bit like a system for trading in shares, for instance. Many employees in the operations department have their professional backgrounds in stock exchange operations, telecommunications or other transaction-intensive environments. In 2014 NetEnt’s system availability exceeded 99 percent and it managed a full 21.4 billion gaming transactions. Growth in the number of gaming trans- actions is outpacing revenues because it is primarily small-stake games that are on the rise. Five data centers All customer systems are operated out of our data centers in Malta, Gibraltar, Costa Rica, Alderney and Amsterdam. NetEnt’s operations department continually monitors the systems and provides technical support. NetEnt | Annual Report 2014 23 RESPONSIBILITY Online casino is about entertainment and excitement, and NetEnt wants everyone who plays its games to do it for the right reason – for fun. Promoting responsible gaming is fundamental to the Company and a condition for the licenses it holds. NetEnt works actively to prevent gaming-related problems. Play easy – play safe Although NetEnt has no direct contact with the individual player, the Company works actively and in close cooperation with other market participants to prevent gaming-related problems. For some people, gaming can turn into an addiction that threatens physical, psychological and social wellbeing. Folkhälsomyndigheten (2014) estimates that 2% of the population aged between 16 and 84 years in Sweden have gaming-related problems.1) Global Gambling Guidance Group (G4) NetEnt is also affiliated with the organization G4 (Global Gambling Guidance Group). By developing responsible gaming software and training programs for the employees of gaming companies, and by offering help lines and personal counseling, G4 endeavors to minimize the damage and problems that ensue from gambling addiction. NetEnt’s casino offers support based on the organization’s consumer protection guidelines, as follows: Protecting minors and at-risk individuals Protecting players’ rights Promoting responsible gaming in a safe environment Ensuring the reliability of games and gaming devices Keeping online casino games free from criminal activity, such as money laundering. Compulsory training for employees in responsible gaming Financial support NetEnt has undertaken to donate a sum of money annually to the Responsible Gambling Trust in the UK, which is a leading organization in the work to reduce gamingrelated problems in society. Functions for responsible gaming NetEnt’s gaming system is designed with functions that enable the operators to allow end users – players – to 1) Swedish Ministry of Finance, ESO 2015:1 24 NetEnt | Annual Report 2014 reduce their gaming, for example by setting an upper limit to their bets or the possibility of turning off certain functions, such as autoplay. All of NetEnt’s games also feature a prominent clock that makes it easier for the player to keep an accurate sense of time. It is also possible to insert blocks on playing longer than a certain period of time. Player protection NetEnt has a class 4 license in Malta, and all games hence provide support for player protection, in accordance with G4. All of NetEnt’s games are approved by the Malta Gaming Authority, Alderney Gambling Control Commission and the supervisory authorities in the specific markets where they are launched. NetEnt constantly updates the games based on any amended requirements from the authorities of different countries. Randomness requirement A player can rest assured that the game meets set requirements, is random, and offers the possibility to win. At the same time, each player should also be aware that it is also possible to lose. NetEnt’s games and platforms are regularly tested for randomness by independent accredited testing agencies, which is one of the requirements set by the gaming authorities in the markets where the Company operates. NetEnt is verified by the international testing agency eCOGRA (e-Commerce and Online Gaming Regulation and Assurance) which is a London-based industry organization that works to promote fair and responsible gaming. Each year eCOGRA examines NetEnt’s development environment, verifies and ensures that the software is securely and reliably maintained and operated, and that the Company is continually tested by other independent agencies. NetEnt follows the consumer protection guidelines of the Global Gambling Guidance Group. E M P L O Y E E S A N D C O R P O R AT E C U LT U R E NetEnt’s industry features constant, rapid evolution with new markets, new technology and constantly rising demand for new, complex and innovative solutions. The key to success in such conditions is a dynamic, creative and possibility-oriented corporate culture. Strong corporate culture in a dynamic environment With the right expertise, a strong team spirit and shared values, we can continue to deliver world-leading gaming experiences. NetEnt has a strong corporate culture Outstanding featuring creativity, quality, community and passion professional for everything we do – in which our values are crucial. development Shared qualities of our employees are that they are driven, autonomous and curious individuals with a Extraordinary approach and an open mind, who thrive forward-looking and inhealth a fast-growing, international work environment. energizing NetEnt’s employees represent 47 nationalities and possibilities the majority have backgrounds ranging from computer games and the IT industry to the telecom and finance sectors. Innovation and experience from different organi50/50 gender zations and cultures contribute positively to the Combalance pany’s development. Many employees make a career out of growing with the Company, and internal recruitment is often prioritized. PERFORMANCE PERFORMANCE 63% Men 37% Women Gender distribution at NetEnt 31 Dec 2014 % 25 20 15 Vision & Mission 10 5 la n ce & th al gizing pos ener sib ilit i Employee strategy Our employee strategy aims to encourage employee performance. Important factors in enhancing performance are opportunities for professional development, a healthy lifestyle and an environment that promotes even gender distribution at NetEnt. Driven, talented people want to develop and appreciate meaningful support. A healthy lifestyle is fundamental to sustainable high performance, and surveys show that investing in even gender distribution benefits a company’s results. The factors described above form the basis of a variety of activities designed to promote employees at the Company, and for each of the areas there is a sponsor in Group management. nt me op es Professional d ev el Remaining a world-leading casino supplier requires extensive expertise and experience. The Company constantly needs to recruit skilled individuals and is also witnessing an increase in the number of applications as the Company becomes more visible and successful. During the year, we hired a total of 217 people for all of our offices. In the introductory phase for new employees, great importance is attached to conveying and anchoring NetEnt’s values and corporate culture. Vision & Mission 50/50 gen d b er a 0 2011 2012 2013 2014 Employee turnover at NetEnt NetEnt | Årsredovisning 2014 25 He E M P L O Y E E S A N D C O R P O R AT E C U LT U R E Our employee strategy aims to support our employees in their development, to be healthy and to perform. Number of employees 591 34 2.8% Average age Absence due to illness Number of nationalities 47 Proportion of women in Group Management 50% 26 NetEnt | Annual Report 2014 Core values In the past year, NetEnt’s core values have been updated through work that has engaged – and continues to engage – employees in all parts of the Company. • Together We Win • Think Ahead, Be Ahead • We Act SpeedSmart • Passion in All We Do These core values guide all employees in their daily work, and rest on qualities such as creativity, forward-thinking, decisiveness and a passion for reaching our common goals. The core values are key in all of the Company’s decision-making processes – as an instrument of management, in progress reviews and in recruitment. For example, job interviews are based on the Company’s core values and therefore take account of expertise and experience, but to an increasing extent also attitude and personality. This has resulted in fewer terminated trial employment periods than before. Leadership and development For NetEnt, leadership means responsibility for driving the operations forward based on the Company’s vision, goals and strategy. The Company has managers of varying age and experience, who share an ambition for and interest in developing both themselves and their leadership, as well as their employees and the Company. Great emphasis is placed on hiring new managers, and on their support and development. Since 2012, NetEnt has offered a leadership program as part of the NetEnt Academy, and all managers and many project managers as well as other informal leaders at different levels have undergone the training. It enables them to discuss what the Company’s values mean, increase knowledge of NetEnt and develop themselves and their ability to coach colleagues. The ability of employees to always be one step ahead is important. As part of the NetEnt Academy, we therefore conduct different types of staff training programs. In March, Innovation Week kicked off for the first time, with daily activities and talks on the topic of innovation. All staff had been encouraged to submit innovative ideas in different areas. A total of 75 ideas were submitted, four of which were selected for presentation to our jury, the NetEnt Den. The first prize was a trip to Las Vegas and the winner was awarded for an innovative business concept. Many of the ideas submitted by employees have been implemented in the operations, including the reward system, All-In Program. It is a concept based on “gamification”, which rewards performance and loyalty. The employee can win and collect “coins” that can then be exchanged for goods and services, or for a money donation to charity. NetEnt has a great focus on employee health and fitness, because this is crucial to performance. Employees are encouraged to have a healthy lifestyle with exercise, healthy eating and mental balance. Healthy November was arranged that month at all offices with talks and opportunities to try out different activities, competitions, healthy meals and much more. 50/50 balance between women and men Access to the right talent is crucial to NetEnt’s successes. Only an active effort to achieve a workplace with a 50/50 split between women and men will provide us with access to all potential expertise. In general, our belief is that diversity gives a broader spectrum of perspective and experience, which benefits innovation. We also believe that gender-balanced workplaces are better workplaces, in which people thrive better. The result is not only workplaces that are more creative, supportive and inclusive; it’s also an important success factor for innovation and future growth. NetEnt wants to serve as a role model in the IT and gaming industry and aims to achieve a 50/50 gender balance between men and women. In 2014 the gender distribution was 37 percent women and 63 percent men, but the breakdown in Group management was 50/50. Tina Sörqvist, Staffing & Recruitment Manager. The Company’s growth also enables our employees to grow. Hiring right – a key success factor Dedicated employees are crucial to NetEnt reaching its goals and vision. Many at NetEnt make a career out of growing with the Company, and internal recruitment is often prioritized. At the same time, we are hiring new expertise at a rapid pace – a total of 217 people in 2014 – and the future recruitment need looks high too. Our corporate culture and core values are crucial to success, starting even before a person is hired. In our recruitment processes we take account of expertise, experience, attitude and personality. Everything has to be right. Tina Sörqvist Staffing & Recruitment Manager NetEnt | Annual Report 2014 27 BOARD OF DIRECTORS AND AUDITORS In the picture, seated from left to right: Vigo Carlund, Maria Redin, Michael Knutsson, Mikael Gottschlich. Standing from left to right: Pontus Lindwall, Fredrik Erbing, Peter Hamberg. VIGO CARLUND Chairman of the Board of Directors Born 1946 Elected 2008, Chairman since 2011 MIKAEL GOTTSCHLICH Member of the Board of Directors Born 1961 Elected 2008 MICHAEL KNUTSSON Member of the Board of Directors Born 1961 Elected 2012 MARIA REDIN Member of the Board of Directors Born 1978 Elected 2012 Independent in relation to the Company, executive management and major owners. Independent in relation to the Company, executive management and major owners. Independent in relation to the Company, executive management and major owners. Chairman of the board of Black Earth Farming and Los Naranjos S.L, and board member of Investment AB Kinnevik and iZettle AB. Chairman of the board of Sentat Asset Management AB and board member of CKT Capital incl. subsidiaries, O’Learys Trademark AB and Interoc AB. Former CEO of MG Instrument AB, Arkivator AB and LGP Telecom. Independent in relation to the Company and executive management, not independent in relation to major shareholders. Shareholding*: 20,000 B shares Shareholding in endowment insurance*: 580,000 B shares. FREDRIK ERBING Member of the Board of Directors Born 1967 Elected 2008 Independent in relation to the Company, executive management and major owners. Fredrik Erbing works as Vice President at Acando AB. Fredrik holds a Master’s of Engineering from the Royal Institute of Technology in Stockholm. Shareholding*: 20,000 B shares. Shareholding in endowment insurance*: 20,000 B shares. Shareholding: 430,000 B shares. PETER HAMBERG Member of the Board of Directors Born 1973 Elected 2009 Independent in relation to the Company and executive management, but related to one of the Company’s major shareholders. CEO and board member of Hamberg Förvaltnings AB and board member of Solporten Fastighets AB, C-Rad AB and Pamir A Intressenter AB (Schoolsoft). Peter has a Bachelor’s degree in international business administration from San Francisco State University, USA. Shareholding*: 121,000 B shares. Shareholding in endowment insurance*: 4,000 B shares. *The stated shareholdings at December 31, 2014 include holdings through family and companies. 28 NetEnt | Annual Report 2014 Michael Knutsson is or has been board member, senior/controlling executive or partner at the following companies: Knutsson Holdings AB, Pata-Pata AB, Tangiamo AB, Solidicon AB, TCSJohnHuxley Ltd and Sponsio Ltd. Shareholding*: 1,000,000 A shares, 1,650,000 B shares. PONTUS LINDWALL Member of the Board of Directors Born 1965 Elected 2011 Independent in relation to executive management and major owners, but Chairman of the Board in Betsson AB, a customer and former Parent Company of Net Entertainment. Founded NetEnt and also a board member between 1996 and 2009. Chairman of the Board of Betsson AB (publ) and och Mostphotos AB. Board member of Solporten Fastighets AB. Holds a Master’s of Engineering from the Royal Institute of Technology in Stockholm. Shareholding*: 841,000 B shares. Shareholding in endowment insurance*: 351,500 A shares and 120,070 B shares. Previous experience from the online gaming industry, including as CEO and CFO of gaming operator Bet24, and Controller at MTG’s pay TV operation in Sweden, and currently serving as Head of Group Finance & Controlling at Modern Times Group MTG. Shareholding*: 1,980 B shares. AUDITORS At the Annual General Meeting held on April 24, 2014, Deloitte AB was elected as auditor to the Company for the period until the 2015 Annual General Meeting. Therése Kjellberg (authorized public accountant and member of FAR SRS) is the chief auditor. SENIOR EXECUTIVES In the picture, seated from left to right: Maria Z Furenmo, Björn Krantz, Anna Romboli, Maria Hedengren, Per Eriksson. Standing from left to right: Ludvig Kolmodin, Simon Hammon, Anna Lagerborg. PER ERIKSSON President and CEO Born 1961 Employed since 2012 MARIA HEDENGREN Chief Financial Officer Born 1970 Employed since 2011 Per Eriksson has been active in the IT industry for over 27 years. Per most recently served as President and CEO at Dustin Group AB. Prior to that, he served as Head of Dell EMC in Europe, the Middle East, and Africa, and the CEO of Dell Nordic. Per holds a B.Sc. in Business Administration from Stockholm University. Per is also chairman of Memnon Networks AB. Per holds no other assignments besides the aforementioned. Maria has extensive experience from various positions in finance, mainly in the IT industry. Former CFO for Resco AB (publ) and auditor at Arthur Andersen in Sweden and the United States and has held several senior positions at Lawson Software and IBS. A graduate of the University of Gothenburg, School of Business, Economics and Law. Shareholding: 12,000 B shares. Share option rights: 60,000. SIMON HAMMON Chief Product Officer Born 1983 Employed since 2011 Solid knowledge of the gaming industry from having been business and product development manager of his own company, and holding experience in platform and game development, network operations and affiliate management in the bingo and casino segment. Simon holds an LLB Bachelor of Laws from the University of Durham. Shareholding: 1,500 B shares. Share option rights: 12,000. LUDVIG KOLMODIN Chief Information Officer Born 1972 Employed since 2009 More than 15 years of international experience in system development, IT operations and project management, primarily in the telecom industry as head of IT operations for the mobile operator 3, as well as within the banking sector. MA in systems analysis and design from Mid Sweden University. Shareholding: 1,000 B shares. BJÖRN KRANTZ CEO Net Entertainment Malta Ltd Born 1970 Employed since 2009 ANNA ROMBOLI Communications Director Born 1973 Employed since 2014 More than 15 years of international experience in sales and marketing in the telecommunications industry from e.g. Swedia Networks in London and Ericsson in Sweden, London, the US and Austria, most recently as head of sales and business development for Ericsson, Central Europe. Holds a degree in Mechanics & Electronics and has also studied at the IHM Business School. Anna has over 15 years of experience from business development in branding, communication and PR. Formerly VP Brand & Communications at Veryday, and several years of consulting experience in PR and brand strategy. Anna holds an MBA from the University of Gothenburg, School of Business, Economics and Law. Shareholding*: 10,000 B shares. Share option rights: 25,000. ANNA LAGERBORG Chief Development Officer Born 1966 Employed since 2011 15 years of experience in software development and management of development departments in areas including games and social media, as well as telecom and communications. Bachelor’s degree in computer science from Stockholm University. Shareholding: - Shareholding: MARIA Z FURENMO HR Director Born 1964 Employed since 2011 Extensive experience from HR-related work at growth companies and change management at larger companies. Formerly HR director for Outokumpu, Nordnet, Post-Net, Torget.se and Cell Network. B.Sc. in Business Administration and a degree in Human Resources from Stockholm University. Shareholding: 600 B shares. Shareholding: - *The stated shareholdings at December 31, 2014 include holdings through family and companies. NetEnt | Annual Report 2014 29 THE SHARE TM & © 2013 South Park Digital Studios. In 2014, world stock markets rose moderately against a backdrop of subdued global growth, heightened geopolitical tensions and reduced quantitative easing from the Federal Reserve. Yet, NetEnt’s share price substantially outperformed its benchmark indices, and at the end of the year the Company’s market capitalization exceeded SEK 10 billion. Another year with a surging share price Analysts who cover NetEnt ABG Sundal Collier, Stockholm Anders Hillerborg Carnegie Investment Bank, Stockholm Christian Hellman Danske Bank, Stockholm Bile Daar Erik Penser Bankaktiebolag Stockholm Oscar Karlsson Handelsbanken Capital Markets, Stockholm Rasmus Engberg Nordea, Stockholm Elias Porse SEB Enskilda, Stockholm Stefan Nelson NetEnt’s share is listed on NASDAQ Stockholm on the Mid Cap list, and is traded under the ticker NET B. New share issue Following a decision by the AGM in 2011 regarding the 2011–2014 incentive program for senior executives and key individuals at the Company, holders of share options were entitled to subscribe for the equivalent number of series B shares in Net Entertainment NE AB (publ) between August 1 and October 1, 2014. This right was exercised by all option holders. Following subscription at the set subscription price of SEK 70.20 per share, the number of shares increased by 353,100 series B shares. This new share issue added SEK 24.8 million to Parent Company and Group equity. Share capital Following the new share issue, the number of shares in the Company totals 39,906,816, of which 5,610,000 shares are series A and 34,296,816 are series B, equaling SEK Number (thousand) SEK Number (thousand) 2,000 270 3,000 240 1,500 230 210 170 2,000 150 1,500 120 500 150 130 110 2,500 210 180 1,000 190 1,000 90 500 60 Jan Feb Mar Apr May Jun Jul Aug Sep Oct Nov Dec Net Entertainment B 0 30 © SIX SX5000 OMX Stockholm Consumer Services PI Antal omsatta per månad i 1000-tal OMX Mid Cap Stockholm Share price performance andIndex trading volume 2014 NetEnt B OMX Mid Cap Stockholm Index NetEnt | Annual Report 2014 Trade in shares The last price paid on December 30, 2014 which was the final business day of the year, was SEK 263, putting NetEnt’s market capitalization at SEK 10,495 million. A total of 14,136,171 shares were traded in 2014, equaling a value of around SEK 2,567 million. The average number of shares traded per trading day was 56,772. The share price gained SEK 127.5, or 94 percent, during the year. The highest share price of the year was SEK 265, and the lowest was SEK 127. The NASDAQ Stockholm Mid Cap PI index rose 16.0 percent at the same time, and the NASDAQ Stockholm Consumer Services PI gained 11.8 percent. NetEnt’s share is also traded on market places outside of the NASDAQ Stockholm. 270 250 30 a total of 90,396,816 votes. All shares have equal rights to the Company’s assets and profit. The share capital is SEK 1,201,195.16 following the change in the number of shares and the quotient value per share is 3.01 öre. SX5000 OMX Stockholm Consumer Services PI Number of shares traded per month (thousand) 2010 2011 2012 2013 2014 0 SX5000 OMX Stockholm Consumer Services©PISIX Antal omsatta per månad i 1000-tal OMX Mid Cap Stockholm Index Net Entertainment B Share price performance and trading volume 2010–2014 NetEnt B OMX Mid Cap Stockholm Index SX5000 OMX Stockholm Consumer Services PI Number of shares traded per month (thousand) THE SHARE 2012–2015 program At the end of 2014, there was a total of 114,994 options, representing the same number of shares, outstanding. In the event that full subscription occurs based on these share options, SEK 9.9 million will be contributed to the Parent Company’s equity. The share options were issued at fair market value, which was set at SEK 6.26, which contributed equity of SEK 0.7 million to the Group. The strike price was set at SEK 85.83, which represented 130 percent of the average share price during the measurement period in May 2012. Subscription for shares can occur during the period August 1 – October 1, 2015. To encourage participation in the program, the board intends to provide loyalty remuneration to be paid out one month prior to maturity of the share options. Remuneration will only be paid out subject to participants still being employed by the Group on the payout date and certain other criteria being met. The net cash remuneration can amount to a maximum of 50 percent of the premium paid, equaling a total of SEK 0.9 million including social security expenses paid by the Company. A provision for this commitment is made on an ongoing basis in the accounts with due consideration for anticipated employee turnover and interest. Shareholders The number of shareholders in NetEnt at December 31, 2014 totaled 5,541 (4,624) according to Euroclear. NetEnt’s ten largest owners held shares equaling 45 percent of capital and 76 percent of votes in the Company. Institutional ownership amounted to 44 percent of the capital. Investor relations NetEnt views communication and transparency as highly important for maintaining sound relations with shareholders, potential investors and analysts. The Company puts great emphasis on investor relations with the purpose of informing the capital market of NetEnt’s operations, development and financial position in order to increase knowledge of and interest in the Company, and also to obtain a fair valuation. NetEnt participates in many investor relations activities, such as seminars and investor presentations both in Europe and beyond. In addition, NetEnt participates in all major gaming exhibitions such as EIG, which was held in Berlin this year, and ICE in London. Proposed dividend for 2014 The Board proposes that the Annual General Meeting resolves to distribute SEK 199.5 (118.7) million to shareholders, equaling SEK 5.00 (3.00) per share. The Board intends to propose that such distribution occurs through a share redemption program. The complete proposal will be presented well in advance of the AGM. 34% Foreign owners 24% Foreign owners 18% Legal entities 9% Banks/ insurance companies 34% Legal entities 4% Banks/ insurance companies 3% Other 30% Private individuals 22% Private individuals Ownership structure, share of capital December 31, 2014 Ownership structure, share of votes December 31, 2014 Shareholders A shares B shares Holding Holding Votes Per Hamberg 1,700,000 836,400 2,536,400 6.4% 19.7% Rolf Lundström 1,152,500 1,432,191 2,584,691 6.5% 14.3% Michael Knutsson 1,000,000 1,750,000 2,750,000 6.9% 13.0% Berit Lindwall 604,000 122,595 726,595 1.8% 6.8% Lars Kling 342,000 850,000 1,192,000 3.0% 4.7% Banque Carnegie Luxembourg SA 351,500 155,350 506,850 1.3% 4.1% Svenska Handelsbanken AB for PB 200,000 1,221,316 1,421,316 3.6% 3.6% 0 3,207,965 3,207,965 8.0% 3.5% 260,000 502,966 762,966 1.9% 3.4% Livförsäkringsbolaget Skandia 0 2,242,033 2,242,033 5.6% 2.5% Ten largest shareholders, total 5,610,000 12,320,816 17,930,816 44.9% 75.7% Lannebo Fonder BP2S Paris/EFG Bank AG Other shareholders Total 0 21,976,000 21,976,000 55.1% 24.3% 5,610,000 34,296,816 39,906,816 100.0% 100.0% The stated shareholdings include holdings through family and companies. The ten largest shareholders according to Euroclear Sweden AB at December 31, 2014 2014 2013 Earnings per share, fully diluted (SEK) 6.09 4.21 3.37 Distribution to shareholders, SEK/share1 5.00 3.00 2.25 2012 Distribution to shareholders in % of profit after tax1 82% 71% 67% Outstanding shares at year end, million 39.9 39.6 39.6 Average number of outstanding shares, million 39.9 39.6 39.6 Share price at year end, SEK 263.0 135.5 80.0 Dividend yield %2 1.9% 2.2% 2.8 95.9% 72.2% 28.1% P/E ratio4 43.2 32.0 23.7 Number of shares traded annually, million 14.2 16.6 18.4 35.5% 41.9% 46.4% 10,495.5 5,359.5 3,164.3 5,541 4,624 3,408 Total return, NetEnt share, %3 Turnover rate, % Market capitalization at year end, SEK million Dividend policy The Board’s ambition is for NetEnt’s ordinary dividend to grow in line with the Company’s earnings per share. However, the ambition is for the dividend to amount to a minimum of 50 percent of net profit after tax, subject to the Company’s long-term capital requirements. 6% Funds 1% Other 15% Funds Number of shareholders at year-end Board’s proposal for 2014 2 Distribution divided by share price at year end 3 Share price performance in 2014 plus distribution paid in 2014 compared to the last price paid on the final day of trade of 2013. 4 Share price at year end divided by EPS for 2014 1 Key data, NetEnt’s share NetEnt | Annual Report 2014 31 FIVE-YEAR SUMMARY Five-year summary CONDENSED CONSOLIDATED INCOME STATEMENTS SEK thousands Operating revenues Operating profit before depreciation/ amortization and impairment Depreciation/amortization and impairment Operating profit 2014 2013 2012 2011 2010 851,663 630,746 526,671 427,618 368,280 167,370 390,176 282,888 227,314 175,536 –128,511 –103,140 –74,257 –45,823 –30,959 261,665 179,748 153,057 129,713 136,411 Net financial income/expense 4,370 2,950 –1,794 –719 –4,972 Profit before tax 266,035 182,698 151,263 128,994 131,439 Profit for the year 243,242 167,139 136,142 117,584 121,470 2014 2013 2012 2011 2010 CONDENSED CONSOLIDATED BALANCE SHEETS SEK thousands ASSETS Non-current assets 282,370 257,391 216,375 183,554 131,492 Current receivables 263,582 169,665 254,216 184,630 128,343 Cash and cash equivalents 258,057 105,829 81,230 74,234 47,034 Total current assets 521,639 275,494 335,446 258,864 175,377 Total assets 804,009 532,885 551,821 442,418 306,869 546,201 380,666 294,194 240,875 200,792 12,390 7,478 3,513 481 158 Current liabilities 245,418 144,741 254,114 201,062 105,919 Total liabilities 257,808 152,219 257,627 201,543 106,077 Total equity and liabilities 804,009 532,885 551,821 442,418 306,869 EQUITY AND LIABILITIES Shareholders’ equity Non-current liabilities CONDENSED CONSOLIDATED CASH FLOW STATEMENT SEK thousands 2014 2013 2012 2011 2010 Cash flow from operating activities 364,897 249,930 195,422 203,251 119,629 Cash flow from investing activities –121,195 –136,357 –111,577 –99,044 –93,822 Cash flow from financing activities –93,874 –90,870 –76,513 –76,565 –79,107 Cash flow for the year 149,828 22,703 7,332 27,642 –53,300 Opening cash and cash equivalents 105,829 81,230 74,234 47,034 105,009 2,400 1,896 –336 –442 –4,675 258,057 105,829 81,230 74,234 47,034 Exchange rate difference in cash and cash equivalents Closing cash and cash equivalents 32 NetEnt | Annual Report 2014 FIVE-YEAR SUMMARY KEY FIGURES Group 2014 2013 2012 2011 2010 Operating margin (percent) 30.7 28.5 29.1 30.3 37.0 Profit margin (percent) 31.2 29.0 28.7 30.2 35.7 Interest coverage ratio (multiple) 518 303 276 778 4,533 Equity/assets ratio (percent) Quick ratio (percent) Net interest-bearing liabilities (SEK thousands) 67.9 71.4 53.3 54.4 65.4 212.6 190.3 132.0 128.7 165.6 –258,057 –105,829 –79,356 –74,234 –47,034 Net debt/equity ratio (multiple) –0.5 –0.3 –0.3 –0.3 –0.2 Average number of employees 401 328 257 220 152 Employees at year-end 456 356 301 231 182 Employees and consultants at year-end 591 461 403 324 284 Earnings per share, basic (SEK) 6.10 4.23 3.44 2.97 3.07 Earnings per share, diluted (SEK) Equity per share (SEK) Distribution to shareholders per share (SEK) 6.09 4.21 3.44 2.97 3.07 13.69 9.62 7.44 6.09 5.08 5.00* 3.00 2.25 2.00 2.00 Average number of shares outstanding 39,906,816 39,553,716 39,553,716 39,553,716 39,553,716 Number of outstanding shares at year-end 39,966,274 39,553,716 39,553,716 39,553,716 39,553,716 *Proposed for 2014 Definitions OPERATING MARGIN NUMBER OF EMPLOYEES AT YEAR-END PROFIT MARGIN NUMBER OF ENGAGED PERSONS AT YEAR-END INTEREST COVERAGE RATIO (MULTIPLE) EARNINGS PER SHARE EQUITY/ASSETS RATIO EQUITY PER SHARE QUICK RATIO DIVIDEND PER SHARE Operating profit in relation to revenues. Profit after financial income/expense in relation to revenues. Profit after financial income/expense plus interest expense in relation to interest expense. Equity at the end of the year as a percentage of the balance sheet total at the end of the year. Current assets in relation to current liabilities. NET INTEREST-BEARING LIABILITIES Net of interest-bearing provisions and liabilities less financial assets and cash and cash equivalents. NET DEBT/EQUITY RATIO (MULTIPLE) Net of interest-bearing provisions and liabilities less financial assets and cash and cash equivalents divided by shareholders’ equity. The number of employees at the end of the year. The number of employees and subcontractors at year-end. Profit after tax in relation to the average number of shares outstanding during the year. Shareholders’ equity in relation to the number of shares outstanding at the end of the year. Proposed/conducted dividend. “Dividend” here also means distribution to shareholders. AVERAGE NUMBER OF SHARES OUTSTANDING Weighted average of the number of outstanding shares during the period, adjusted for bonus issue and share split. NUMBER OF SHARES OUTSTANDING Number of outstanding shares at year-end adjusted for bonus issue and share split. AVERAGE NUMBER OF EMPLOYEES Average number of employees converted into full-time equivalents. NetEnt | Annual Report 2014 33 A D M I N I S T R AT I O N R E P O R T Administration report The Board of Directors and the CEO of Net Entertainment NE AB (publ), corporate identity number 556532-6443, hereby submit the annual report for the 2014 financial year. ABOUT NETENT NetEnt is a leading supplier of digitally distributed gaming systems used by some of the world’s most successful gaming operators. NetEnt Casino™ is a comprehensive gaming system comprising a full suite of high-quality games and a powerful administration tool. The games create a superior gaming experience for the player while the administration tool enables NetEnt’s customers – the operators – to optimize their business and profitability. Operators are provided with a customized system solution that is quickly and easily integrated, ensuring costefficient operation and minimizing installation-to-operation times. Revenues consist of license fees determined by the revenues generated by the Company’s products, and setup fees when new agreements are signed. NetEnt is a pure operating and development Company and thus does not conduct any gaming operations of its own. The Company’s brand is internationally reputed and associated with innovation, service, and quality. The Parent Company of the Group is located in Stockholm, where a certain amount of development and infrastructure coordination is carried out, while product management, sales, operations, customer support and marketing are managed out of Malta. The Company also has offices in Gothenburg, Kiev (Ukraine), Gibraltar as well as an IT-operations site in Alderney. Development is also conducted through a collaboration partner in India. The parent company is listed on NASDAQ Stockholm (NET-B). BUSINESS MODEL AND OBJECTIVES NetEnt’s business model is to develop games and system solutions that enable online casino operators to offer the ultimate gaming experience. This enables the operators to grow faster and more profitably than competitors. By doing so, NetEnt shall generate sustainable profit and growth for its shareholders. 34 NetEnt | Annual Report 2014 The gaming operators pay a monthly license fee calculated as a percentage of the gaming yield generated by the casino. The European online gaming market is expected to maintain solid growth and NetEnt’s objective is to grow faster than the market. IMPORTANT EVENTS IN 2014 • 31 license agreements with new customers were entered, including Betfair, Rational Group, William Hill (Retail) and bwin.party. • The casinos of 28 new customers were launched. • A collaboration agreement was entered with GameAccount Network, a platform provider focusing on the regulated Italian market. • For the first time ever NetEnt also developed a game entirely in HTML5 for both desktop and mobile devices – a slot game based on Universal Pictures’ classic film, The Invisible Man. All desktop games were developed in Flash previously. This marked a change in game development, which is expected to generate economies of scale ahead, through joint development for mobile and desktop. • NetEnt decided to enter the North American market, starting in New Jersey. A decision was also made to enter the Spanish market in 2015. MARKET The online gaming market has shown healthy growth in recent years. It is estimated that global gross gaming yield for online games, including all game segments, amounted to EUR 30.5 billion in 2014, an increase of 11 percent from 2013. The corresponding size of the global online casino market is estimated at EUR 6.5 billion for 2014, representing 11 percent growth from 2013 (source: H2 Gambling Capital, January 2015). Europe is by far the largest gaming market and is expected to account for close to half of global gaming yield in the next few years. Deregulation and reregulation of national gaming legislation is taking place in many European countries. NetEnt closely monitors developments on all markets that are undergoing regulation. A D M I N I S T R AT I O N R E P O R T NEW AGREEMENTS AND CUSTOMERS In 2014 agreements were signed with 31 new customers, including Betfair, Rational Group, William Hill (Retail) and bwin.party. A number of agreements were terminated with smaller customers that did not reach the minimum revenue requirement imposed by NetEnt. Customers yet to be launched At the end of 2014, NetEnt held agreements with 18 customers that have not yet been launched, including Rational Group (Full Tilt Poker) and bwin.party. REVENUES AND PROFIT Revenues and operating profit for the last six years are presented below. 2014 2012 2011 2010 Revenues and operating profit 2009–2014 2013 Revenues Operating profit 900 800 700 600 500 400 300 200 100 0 2009 In Spain, the online casino market is now regulated and NetEnt has applied for a license. In the UK, which is Europe’s largest gaming market, all operators wishing to approach British players will need a UK gaming license and must pay gambling tax in the UK, irrespective of the country in which the operator is based. This marks reregulation compared to the previous regulations and NetEnt has applied for a license. The Italian market was reregulated a few years back and NetEnt has developed close cooperation with the authorities responsible for getting unlicensed operators, with a focus on Italian players, to acquire a local license. Several operators have embarked on this transition, and as of 2015 NetEnt is phasing out deliveries of the Company’s products to operators that have not commenced a licensing procedure in the country. In Portugal preparations are under way for regulation and licensing in the near future, and in the Netherlands market regulation is expected toward the end of 2015 or beginning of 2016. The majority of NetEnt’s customers are currently in Europe and the Company will continue to focus on the European market, while at the same time carefully monitoring developments on other markets that are headed for regulation, and intends to launch its products on such markets when the conditions are right. At the end of 2013, New Jersey opened up the online casino market, and in the fall of 2014 NetEnt commenced work on applying for a license there. Discussions are also in progress in other states to introduce new gaming laws. In Canada the market is regulated in several provinces such as Ontario, British Columbia and Quebec. In 2014, NetEnt decided to establish itself in North America with the aim of launching its products in the US and Canada in the second half of 2015. SEKm Revenues – volume, price and currency trend Revenues for full-year 2014 amounted to SEK 851.7 million (630.7), which is an increase of 35.0 percent (28.4 percent in EUR) compared with 2013. The increase in revenues was mainly driven by growth among existing customers, but also new game launches as well as revenues from new customers also made a positive contribution. 31 new license agreements were entered and the casinos of 28 new customers were launched during the year. Revenues are affected by the development of the SEK in relation to other currencies. The majority of revenues are invoiced in EUR, but also GBP and USD. In 2014 the SEK depreciated against the EUR by an average of 5.2 percent compared with the prior year, which had a positive effect on revenues. In EUR, total revenues increased 28.4 percent for the full year compared with 2013. The number of gaming transactions amounted to 21.4 billion for the year which is an increase of 32 percent compared to 2013. The increase in the number of gaming transactions is driven by underlying market growth combined with new customers launched, but also by the types of game that are most popular. The slot gaming category represented around 84 percent of gross gaming yield (players’ bets less their wins) in 2014 – an increase from 81 percent the preceding year. A higher proportion of slot games generally involves more transactions, because players’ stakes are lower but they play more rounds than in other types of casino games. Games through mobile devices, which are sharply on the rise, are demonstrating a similar pattern in terms of transaction number and size. On the whole, this results in the increase in revenues not entirely correlating with the increase in the number of gaming transactions. NetEnt | Annual Report 2014 35 A D M I N I S T R AT I O N R E P O R T Expenses and profit Operating profit for the year amounted to SEK 261.7 million (179.7) and the operating margin was 30.7 percent (28.5). Operating expenses rose from the previous year due to the Company’s sustained expansion and strengthening of the organization. The strengthening of the organization is taking place mainly through new hires but also through external resources in the form of consultants and outsourcing outside Europe. The expansion also leads to increased operating expenses in the form of, for instance, customer-specific integration costs, communication costs and other costs such as for IT-operations. Entering new markets also increases operating expenses in the form of advisory and regulationrelated costs. Amortization increased from the prior year as several large development projects were completed, such as new large platform projects and mobile and desktop games. Amortization of development projects is linear with equal amounts each month from the launch date, while revenues normally increase gradually, so the positive margin effect from newly launched projects is not immediate. Amortization is also affected by the performance of the SEK vs. the EUR, because the amortization is translated from EUR to SEK for the Group’s financial reporting. The majority of the Group’s other expenses are in SEK, but the share of expenses reported in other currencies is steadily on the rise as the organization expands, constituting 43 percent for full-year 2014. The positive margin trend is primarily a result of strong sales growth. The operating margin was also positively affected by the SEK trend during the year because most revenues are invoiced in EUR. INVESTMENTS The Group’s investment in intangible assets amounted to SEK 84.4 million (102.5) in 2014. Investments in property, plant and equipment amounted to SEK 36.8 million (33.9). Investments in intangible assets consist of development of new games for mobile devices and desktop, technical adjustments to the platform such as new functionality, increased capacity, adjustments for requirements on regulated markets and software licenses. Major development projects during the year related to games, regulated markets and platform projects. Investments in property, plant and equipment are primarily servers and other computer equipment to meet new technical requirements and maintain capacity and performance in connection with new product launches. Investments are also made in computer equipment in line with the growing organization. 36 NetEnt | Annual Report 2014 CASH AND CASH EQUIVALENTS, FINANCING AND FINANCIAL POSITION Consolidated cash flow from operating activities amounted to SEK 364.9 million (249.9) for full-year 2014. Operating cash flow was negatively affected by a deposit of EUR 2 million which was paid as part of the Spanish licensing procedure. The deposit is classified as a non-current financial receivable in the balance sheet. In 2014 cash flow from financing activities amounted to SEK –93.9 million (–90.9), and consisted mainly of distribution to shareholders as well as a new share issue of 351,100 B shares, at an issue price of SEK 70.20 per share, in connection with the 2011–2014 option program which expired during the year. Investments in relation to operating profit fell from the prior year, which had a positive effect on cash flow for the year. The Group’s cash and cash equivalents amounted to SEK 258.1 million (105.8) at December 31, 2014. Credit available to the Group amounted to SEK 50 million, none of which had been utilized at December 31, 2014. PERSONNEL AND ORGANIZATION At the end of the period, the number of employees amounted to 456 (356). Including external resources such as dedicated people from subcontractors and consultants, NetEnt employed 591 (461) people. PARENT COMPANY The parent company’s revenues for the 2014 full year amounted to SEK 467.1 million (393.5). Operating profit amounted to SEK 42.3 million (31.2) and the operating margin was 9.1 percent (7.9). Profit after tax was SEK 174.0 million (95.8). The operating margin is mainly affected by how high a share of Parent Company expenses are invoiced onto other Group companies, and the intragroup price level applied. The price level is governed based on independent benchmark studies for similar services, and can vary over time if the general price level on the market has changed. Cash and cash equivalents in the Parent Company at the end of the period amounted to SEK 217.6 million (55.5). Parent Company investments in property, plant and equipment were SEK 14.5 million (10.1) for full-year 2014. Parent Company investments in intangible fixed assets amounted to SEK 4.1 million (17.3) for the full year and primarily consist of software purchasing. A D M I N I S T R AT I O N R E P O R T Risk factors Specified below are some of the business- and industryrelated risk factors that could have consequences for NetEnt’s future development. The risk factors are not arranged in order of importance or potential financial impact on the Company’s revenues, profit or financial position. For financial risk factors that affect the Company’s business, see Note 26. POLITICAL DECISIONS NetEnt is a supplier of digitally distributed gaming systems for casino games online. The business relies heavily on the legal situation regarding these types of games. Since most of the Company’s customers are active in Europe, the legal situation in the EU is particularly important. NetEnt is legally based in the EU, which provides the Company with constitutional protection for business activities that follow from national law, EU law, and the overarching WTO system. Nonetheless, the operations are dependent on the legal and political conditions that apply to customers, i.e. purchasers of digitally distributed gaming systems. Developments in terms of the protection provided by EU law and which customers have against protectionist national monopoly systems are of particular importance. The market for basically all types of gaming services is regulated by national legislation that determines how gaming operations may be conducted. The European Court has dealt with national gaming regulations in a variety of rulings. Currently, EU law allows its Member States relative freedom of choice in regulating gaming. However, the regulations must meet the requirements of EU law regarding proportionality and nondiscrimination. They must meet the fundamental requirements regarding consistency and a systematic approach. For example, national regulation may not exclude private foreign entities on public health grounds if the government allows comprehensive promotion of public gaming companies. Those who argue against gaming monopolies express that gaming monopolies cannot be justified for health or safety reasons when they are operated for profit. In recent years, the European Court and national courts have issued important rulings that affect the entertainment gaming market. Some rulings have contributed to opening up markets to private operators, while other decisions have been more protectionist. In 2009, the European Court gave Member States greater scope to preserve protectionist monopoly systems. Through a series of rulings in 2010, the European Court confirmed the principle that companies that are legally established in the EU have the right to also offer and provide online gaming. Any limitations imposed by a Member State must be consistent, systematic, and harmonized. National restrictions must always be proportional in relation to the purpose that motivates the restriction. It is notable that the gaming market has not been subject to specific harmonization measures in the EU. No legal instruments in the form of directives, regulations or decisions have been adopted by political EU institutions. Deregulation and reregulation of national gaming laws are taking place in many European countries with, for example, Italy, France and Denmark having regulated online gaming. The development of national licensing systems has partly been prompted by recent case law in the European Court, which has provided Member States with slightly more freedom to implement limitations on offering cross-border gaming services. EU Member States have been given greater possibilities of securing tax revenues provided the licensing systems create sound competitive conditions and are formally open for all operators who meet certain criteria. NetEnt has a “class 4 license” in Malta that covers delivery and technical operation of casino games for gaming operators licensed in Malta. Malta is a member of the EU, and is thus governed by EU law. Malta is one of the few countries in the EU that has opted to allow the gaming sector to be exposed to competition through a national licensing system. NetEnt also has a category 2 license in Alderney and licenses in Belgium and Gibraltar. Political decisions and court rulings in the EU area with the purpose of making it difficult for private gaming operators on national markets, primarily in Sweden, Malta, Italy, the UK and Norway outside the EU, could have severely negative consequences for NetEnt’s customers and hence the Company’s own operations. A liberalization of the gaming market in these markets could likewise have a positive impact on the Company’s customers, and thus for NetEnt. In the current situation, it is difficult to predict how the legal landscape in the EU will develop, and thus affect the commercial conditions for gaming operators, and ultimately game developers such as NetEnt. Therefore, it must be pointed out in particular that, because of the current legal developments in the various Member States, in combination with emerging practice in EU law, NetEnt is operating in a relatively unpredictable legal environment, at least in terms of the EU market, and there is hence a risk (which is difficult to quantify) of NetEnt’s operations NetEnt | Annual Report 2014 37 A D M I N I S T R AT I O N R E P O R T being negatively affected by legal developments in the future. In October 2006, a law came into effect in the United States that forbids game distribution to people in the United States. The law has had a major impact on the ability of operators to conduct gaming business in the United States, and has also posed a barrier to banks and other financial institutions against mediating payment transactions for online based gaming. In connection with the law coming into effect, NetEnt ceased cooperation with operators targeting players on the US market, in order to avoid legal risks associated with that market. NetEnt does not currently offer its products or services to operators that offer games to people in the United States. In the United States, political initiatives are under way at state level to introduce a new regulation for online gaming. Several states have already regulated online gaming and in November 2013 New Jersey opened up the online casino market. Discussions are also in progress in other states to introduce new gaming laws. NetEnt intends to establish operations in the United States as and when new regulations enable this. OPERATIONS THAT REQUIRE A LICENSE AND OTHER LEGAL ASPECTS Following a decision by the Maltese lottery supervisory authority (Malta Gaming Authority, MGA), NetEnt’s subsidiary NetEnt Malta Ltd holds a “class 4 license”, which means that the Company can offer gaming systems to its customers under the license, and that its products are MGA-approved. It is of great importance to NetEnt’s business that the license is maintained and extended. The license is issued with a five-year term and must be renewed in 2015. NetEnt also has a category 2 license in Alderney which enables the Company to offer its casino solution to gaming operators that are licensed by the gaming authority in Alderney. This license is valid until further notice and retaining it is of great importance to the Company. The gaming authority in Alderney, AGCC, performs regular audits of NetEnt’s business. If AGCC were to find that NetEnt no longer fulfills the license requirements, the authority can revoke the license. In Gibraltar, NetEnt has what is known as a Remote Gambling Licence, which is extended each year. Since the regulations in the UK were amended in November 2014, NetEnt has a temporary license there. This license will undergo final review in 2015 for conversion into a permanent license. It is of great importance to NetEnt’s operations that the licenses in Gibraltar and the UK are extended and retained. Certain EU Member States, including Sweden, have bans on promoting lotteries organized from another country. “Promotion” is considered a broad concept, and can thus encompass a number of different activities. That NetEnt’s business, namely delivering software and pro- 38 NetEnt | Annual Report 2014 viding hosting for gaming operators from another country where the business is licensed and legal, could be considered “promotion” seems less probable, although the extent of the concept of “promotion” in this respect is unclear. Gaming authorities in different countries can also adopt a restrictive approach regarding the markets to which licensed gaming operators and gaming system providers make games available, for example, if the authorities believe that a country is not applying adequate measures to prevent money laundering or terrorist financing. The factors described above highlight that NetEnt operates in an unpredictable legal environment. OPERATIONAL DISRUPTION NetEnt is responsible for the operation of licensed customer systems through its operation centers in Malta, Gibraltar, Alderney, Costa Rica and Amsterdam. Like all online services, the system can sometimes suffer from operational disruptions. These can occur for many different reasons, and may be either within or beyond NetEnt’s control. In the event of operational disruption, the Company’s product is entirely or partially unavailable to the end user, which affects the gaming operator’s revenues and thus license revenues for NetEnt. Any operational disruption or technical problem with the Company’s servers could therefore result in lost revenues, loss of confidence in the Company, and possible claims for damages. The Company is constantly working to minimize the risk of operational disruption by, for instance, ensuring high technical security in the system. GAMBLING ADDICTION Despite the fact that NetEnt does not conduct any gaming operator activities, people suffering from gambling addictions could sue companies in the NetEnt group in their capacity of game and system supplier. Even if such claims appear to be unfounded, and would likely be rejected by a court, they could involve considerable expenses and loss of confidence in NetEnt, which could ultimately lead to reduced revenues. DEPENDENCE ON KEY PERSONNEL AND SKILLED EMPLOYEES NetEnt’s success depends on its ability to hire and retain expert, talented employees in all functions in the regions where NetEnt conducts business, for example commercial experience, understanding of operator and player preferences, game development and technology. The business is also dependent on certain key people at management level. Because of the high rate of market change, the loss of experienced personnel within business-critical areas could temporarily have a negative impact on the Company’s profit and financial performance. A D M I N I S T R AT I O N R E P O R T NetEnt works actively to acquire dedicated and loyal staff through continuing education, corporate culture and opportunities for advancement within the organization. DEPENDENCE ON LARGE CUSTOMERS The loss of some of the Company’s customers could have a negative impact on NetEnt’s revenues and profit. As the number of customers increases, dependence on individual large customers gradually decreases. See Note 4 on page 66. COMPETITION The Company competes with a number of entities with much greater financial and operational resources than NetEnt. The market is highly attractive, and new entities may establish themselves. However, the threshold for becoming established on the game development market is high. If NetEnt cannot successfully respond to such competition, this could negatively affect the Company’s profit and financial position. The Company’s ambition is to maintain and develop its position on the market as a world-leading supplier of digitally distributed gaming systems, and to be a respected market participant. By continuing to focus on developing high quality games with great entertainment value, in combination with a powerful administration tool and related services, NetEnt hopes to be able to retain existing customers and attract new ones. INTELLECTUAL PROPERTY RIGHTS NetEnt’s most important intellectual property rights mainly consist of the copyrights for the software, in particular NetEnt Casino™, and related materials that are developed and continue to be developed in the Group. Therefore, it is crucial that anything developed in the Group remains NetEnt’s property. Through contracts with employees and subcontractors, it is ensured that the copyright for developed products accrues to NetEnt. In line with NetEnt’s success, legal action has been brought against the Company on various occasions for allegedly infringing on intellectual property rights. Although the Company has not lost in any such allegation there could be a risk of a negative effect in the future in the event of a court ruling against the Company. Lawsuits often involve varying degrees of expenses for the Company in the form of fees for legal advice, even if the legal action does not ultimately lead to a court case. EXCHANGE RATE FLUCTUATIONS The Group’s profit and financial position are affected by exchange rate fluctuations, since the majority of revenues is in EUR while costs are largely in SEK. NetEnt’s current policy is not to hedge changes in exchange rates. An appreciation of SEK vs. the EUR negatively affects the Company’s profit. The fulfillment of NetEnt’s financial goals may be affected by future changes in exchange rates. The Group’s consolidated profit, equity, assets and liabilities are also affected by exchange rate fluctuations when the profit of foreign subsidiaries is translated into SEK for the Group’s consolidated financial reporting. TAX STATUS The Group’s tax expense is affected by which of the countries where the Group conducts operations is the one in which profit is generated, and the tax rules of each country. Comprehensive assessments are required to establish the income tax provision. There are many transactions and calculations for which the final tax is uncertain at the time when the transactions and calculations are conducted. NetEnt has, alongside external experts, assessed how tax regulations affect the operations in order to ensure an accurate tax status. This also applies to indirect taxes. NetEnt reports and pays to the tax authorities the amount of tax that NetEnt and hired external experts consider correct. However, these figures may prove to be inadequate in the event of the tax authorities applying a different interpretation of the tax rules than that performed by NetEnt and which it believes is correct. After a tax audit of Net Entertainment NE AB concerning financial years 2007–2010, the Swedish Tax Agency decided to impose additional taxes on the Company in the amount of approximately SEK 92.1 million. In its decision, the Swedish Tax Agency states that the internal pricing used by the Group between the Sweden-based Parent Company and the Malta-based operations is not justified. Thus, the Swedish Tax Agency assigns a different legal interpretation and financial substance to certain intra-Group agreements and the organization of the Group, than the Company and its external experts do. NetEnt disputes the Swedish Tax Agency’s assessment and hence also the consequences in terms of amounts regarding income adjustment and tax surcharges. In 2014 NetEnt received the decision of the Administrative Court, which follows the previous decision of the Swedish Tax Agency to impose additional tax on the Company. The Company has appealed the decision to the Administrative Court of Appeal, and is currently of the same opinion as before – not to make any provisions for potential additional taxes attributable to this matter. NetEnt insists that it has complied with applicable taxation laws governing its operations, which is also supported by the experts that the Company has consulted on the subject. The amount of SEK 92.1 million is recognized in the 2013 accounts as a contingent liability and the same assessment is also made at December 31, 2014. Adjusted for accrued interest, the amount was SEK 94.4 million at the end of 2014. NetEnt | Annual Report 2014 39 A D M I N I S T R AT I O N R E P O R T Corporate governance report Corporate governance report NetEnt, Net Entertainment NE AB (publ) is a Swedish public limited liability company listed on Nasdaq Stockholm. NetEnt thus applies Nasdaq Stockholm’s rules for issuers, and as a listed company the Swedish Code of Corporate Governance (the Code). This report was prepared in accordance with the Swedish Companies Act, the Annual Accounts Act, the Code and other applicable Swedish and foreign laws and regulations. NetEnt has no divergences from the Code to report. The report is part of the administration report and has been reviewed by the Company’s auditor. THE CORPORATE GOVERNANCE MODEL OF THE NETENT GROUP Important external regulations The Swedish Companies Act 1 Shareholders 2 AGM Nasdaq Stockholm’s Rules for issuers The Swedish Code of Corporate Governance (the Code) 7 Election Information Authorizations Information Important internal regulations 4 Articles of association 5 Rules of procedure for the Board of Directors Information security policy, Finance policy, Financial handbook, etc. Policies for antibribery, money laundering prevention, etc. Internal control and risk management procedures 40 Auditors NetEnt | Annual Report 2014 Election Vote The Annual Accounts Act 3 Nominating Committee Proposals for Board and auditor and Nominating Committee Board of Directors, headed by Chairman Audit Committee Goals Strategies Policies Governance instruments Remuneration structure 8 Election 6 Remuneration Committee Reports Internal control 8 President and CEO Group executive management Corporate governance foundation NetEnt endeavors to apply strict standards and efficient processes so that its entire operations create long-term value for shareholders and other stakeholders. This requires maintaining an efficient organizational structure, internal control and risk management systems, and transparent internal and external reporting. There have been no material changes in corporate governance from the preceding year. A D M I N I S T R AT I O N R E P O R T Corporate governance report 1 Shares and shareholders The share capital of Net Entertainment NE AB consists of A shares and B shares. The total number of shares is 39,906,816, divided into 5,610,000 A shares and 34,296,816 B shares. One A share carries ten votes and one B share entitles to one vote when voting at the AGM. The two share classes have equal rights to the Company’s assets and profit. Shareholders can vote for their full number of shares represented at the AGM. Holders of A shares are entitled to convert one or more A shares to B shares by written request to the Board of Directors, within the limits of the maximum number of B shares that may be issued according to the articles of association. At December 31, 2014, the number of shareholders was 5,541. The largest shareholders at the end of 2014 were Per Hamberg with 6.4 percent of share capital and 19.7 percent of the votes, and Rolf Lundström with 6.5 percent of the shares and 14.3 percent of the votes. The ten largest shareholders represented 44.9 percent of share capital and 75.7 percent of votes in the Company. 2 Annual General Meeting The Annual General Meeting (AGM) is NetEnt’s highest governing body at which shareholders exercise their influence in the Company. The AGM of the Company is held within six months from the end of the financial year. Date, time and location are announced no later than in connection with the third quarter earnings report. Information on how a shareholder can have a matter addressed at the meeting, and by when such a request must be received by the Company in order to ensure it is brought up at the AGM, is announced on the Company’s website no later than when the third quarter earnings report has been published. Notice of the AGM is announced at least four weeks prior to the meeting, and will then be available on the Company’s website. % % of capital % of votes Number of attendees Number 80 120 70 105 60 90 50 75 40 60 30 45 20 30 10 15 0 0 2011 2012 2013 2014 To be entitled to vote at the AGM, shareholders must be recorded in the share register on the fifth business day before the meeting, including Saturdays that are not Swedish public holidays, and notify the Company of their participation no later than the date stated in the notice of the meeting. Shareholders who cannot attend in person may participate through a representative. Decisions at the meeting are normally made by a simple majority of votes. However, certain types of resolutions at the AGM require sanctioning by a higher proportion of the votes and shares represented at the meeting, pursuant to the Swedish Companies Act. Extraordinary General Meetings may be held as needed. Annual General Meeting 2014 The AGM 2014 was held on April 24 at Spårvagnshallarna in Stockholm. 64.2 percent of the total number of votes and 50.4 percent of the total number of shares were represented at the AGM . All members of the Board of Directors, the Company’s auditor, the CEO and a number of other senior executives attended the AGM. One of the Nominating Committee’s three members was present. At the AGM, decisions were taken on a number of routine subjects as well as on the split of shares and automatic redemption procedure resulting in a distribution to shareholders of SEK 3.00 per share. For further information, see the Company’s website, which provides all the requisite AGM documents as well as the meeting minutes and articles of association. Annual General Meeting 2015 The AGM 2015 will take place on April 29 at 3 p.m. at Spårvagnshallarna in Stockholm. Notice of the AGM is provided on the Company’s website (www.netent.com/ arsstamma) where the requisite documents will be available before the meeting. The AGM decides on • Adopting the annual financial statements and consolidated financial statements • Appropriation of profit and dividend • Assessment of and decision on discharge from liability for the Board of Directors and CEO • Election of Board members and, where appropriate, auditors • Remuneration for the Board and auditors • Guidelines for senior executive remuneration • Any other business (important or formal) Attendance at NetEnt’s AGM NetEnt | Annual Report 2014 41 A D M I N I S T R AT I O N R E P O R T Corporate governance report 3 Nominating Committee The AGM decides on how the Nominating Committee shall be appointed. At the AGM in April 2014, it was decided that the Chairman of the Board of Directors, Vigo Carlund, shall convene a Nominating Committee consisting of a representative from each of the three largest shareholders at August 31, 2014 who, together with the Chairman of the Board, shall be members of the Nominating Committee ahead of the AGM 2015. The composition of the Nominating Committee is based on the list of registered shareholders provided by Euroclear Sweden, and other reliable ownership information as of the last business day in August. The Nominating Committee was presented in a press release in September 2014. The Nominating Committee has prepared a proposal to be submitted to the AGM 2015 for resolutions regarding the chair of the meeting, the Chairman of the Board and other members of the Board of Directors, auditors where appropriate, remuneration for the Board of Directors and the auditors, as well as principles for appointing the Nominating Committee. The Nominating Committee’s mandate period runs until the new Nominating Committee is appointed in accordance with the resolution on selecting the Nominating Committee at the AGM 2014. The composition of the Nominating Committee meets the Code’s requirements for independent members. The duties of the Nominating Committee include submitting proposals to the following AGM regarding: • Chair of the meeting • Members of the Board of Directors • Chairman of the Board of Directors • Board fees • Committee remuneration • Amendments to the instructions for the Nominating Committee, if needed • Auditor and audit fees when decisions are to be made on this at the following AGM 42 NetEnt | Annual Report 2014 NOMINATING COMMITTEE AHEAD OF THE AGM 2015 In its work, the Nominating Committee has evaluated the Board of Directors and its work, as well as the Chairman of the Board’s report on the Company’s activities, goals and strategies, in order to make correct assessments concerning the composition of the Board of Directors. In addition, the Nominating Committee has analyzed the skills and experience of the members of the Board of Directors, as well as the gender balance, and compared them with identified needs. The Nominating Committee is of the opinion that the members of the Board of Directors hold a wide range of extensive experience from business activities, technology, the gaming industry and financial markets. The Board of Directors presently consists of one female member and six male members. The Nominating Committee strives to achieve an even gender balance in the Board. Ahead of the AGM 2015, the Nominating Committee has proposed electing a new female member, Jenny Rosberg. Following the AGM 2014 and until the end of the year, the Nominating Committee met three times. The Nominating Committee’s proposal, its justified opinion on the proposed Board of Directors, and supplementary information regarding the nominated members of the Board of Directors are announced in connection with the notice of the AGM, and will be presented at the AGM 2015 together with a report on the Nominating Committee’s work. Members of the Nominating committee Per Hamberg (appointed by the Hamberg family), Chair Christoffer Lundström (Provobis Invest AB) Martin Wattin (Kling family) Vigo Carlund, Chairman of the Board of Directors A D M I N I S T R AT I O N R E P O R T Corporate governance report 4 Board of Directors Board duties The Board of Directors has overarching responsibility for NetEnt’s organization and administration by establishing business goals and strategies, evaluating the executive management and securing systems for monitoring and control of established goals. It is also incumbent upon the Board of Directors to ensure that there is sufficient control over the Company’s compliance with laws and other regulations applicable to the Company’s business, that requisite ethical guidelines are established for the Company’s conduct, and that the Company’s communication is transparent, accurate, relevant and reliable. Between AGMs, the Board of Directors is the Company’s highest governing body. Board composition The Board of Directors is elected by the shareholders at the AGM with a mandate period extending from the AGM until the end of the following AGM. The Company’s articles of association do not contain specific provisions on the appointment and dismissal of Board members. According to the articles of association, Net Entertainment NE AB’s Board of Directors shall comprise three to nine members and no deputies. The AGM decides the exact number of members. The members of the Board of Directors shall devote requisite time and attention to NetEnt, and acquire the necessary knowledge to safeguard the interests of the Company and its shareholders. At the AGM in April 2014, the following members were elected Meeting attendance 2014 Board of Directors Audit Committee Remuneration Committee Vigo Carlund, Chairman 12 of 12 - 1 of 1 Pontus Lindwall 12 of 12 - 1 of 1 Fredrik Erbing 12 of 12 5 of 5 1 of 1 Maria Redin 11 of 12 5 of 5 1 of 1 Mikael Gottschlich 10 of 12 4 of 5 1 of 1 Peter Hamberg 12 of 12 - 1 of 1 Michael Knutsson 10 of 12 - 1 of 1 For a further description of the members, see page 28. Board remuneration 2012–2014, SEK thousand Decided at the AGM 2014 2013 2012 Chairman of the Board of Directors 600 590 580 (including fees for assignments in foreign subsidiaries) - - - Chair of the Audit Committee 320 310 300 Member of the Board of Directors 250 240 240 Independence The Board of Directors is considered to meet the independence requirements. Peter Hamberg is not independent in relation to major shareholders because he is a close relative of one of the Company’s largest shareholders. Michael Knutsson is not independent in relation to the major shareholders because he is a large shareholder of the Company. Pontus Lindwall is not independent in relation to the Company because he is the Chairman of the Board of Betsson AB – a customer and previously the parent company of NetEnt. Rules of procedure and Board meetings The work of the Board of Directors is regulated by the rules of procedure, in addition to laws and recommendations. The rules of procedure are adopted by the Board of Directors and reviewed annually. The rules of procedure are divided into different sections in order to clarify and regulate the Board of Directors’ work and duties. The sections consist of the Board of Directors’ rules of procedure and instructions for the CEO and Audit Committee. The Remuneration Committee consists of the entire Board of Directors. The rules of procedure comprise the Board’s general obligations, distribution of duties within the Board, how Board meetings shall be recorded, and provision of information to the Board of Directors before and between Board meetings. Before each Board meeting, members receive written documentation about the matters to be discussed at the Board meeting. Also, each month, a monthly report is distributed on operational and financial performance. The duties of the Chairman are to ensure: • that new Board members undergo the requisite introductory training • that the Board regularly updates and deepens its knowledge of the Company, the industry, and its performance • that the Board of Directors fulfills its duties • that the Board of Directors receives adequate information and source materials for decision-making in its work • together with the CEO, adopting the agenda of Board meetings • that Board decisions are efficiently executed • that the Board conducts an evaluation of its own work and that the Nominating Committee is informed of the evaluation. The Chairman also assumes responsibility for contacts with the owners and communicating opinions from the latter to the Board of Directors, and serves as support for the CEO. NetEnt | Annual Report 2014 43 A D M I N I S T R AT I O N R E P O R T Corporate governance report Chairman of the Board of Directors The Chairman of the Board of Directors is appointed by the AGM. Vigo Carlund was appointed Chairman of the Board of Directors by the AGM 2014. The Chairman organizes the work of the Board of Directors so that it is conducted efficiently, and such that the Board of Directors honors its obligations. It also includes leading the work of the Board to create optimal conditions. Board work in 2014 The Board’s rules of procedure describe which items shall be on the agenda at each Board meeting, the annual cycle of items over the financial year, and the agenda for inaugural Board meetings. In 2014, the Board of Directors held 12 meetings, including the inaugural meeting, three for adopting interim reports, one for adopting the earnings report and one extraordinary meeting per capsulam. In connection with the Board meeting in June, a strategy meeting was held, at which the executive management presented an in-depth analysis of the industry trend and proposed the strategic direction for sustained growth and development. All meetings held during the year followed an agenda which, together with the documentation for each agenda item, was provided to Board members ahead of the mee- tings. Also present at Board meetings are the CEO and the CFO, who also records the minutes. The CEO reports on operational performance at each ordinary Board meeting, and the CFO reports on financial performance. In addition, various senior executives, and auditors if needed, deliver presentations on various specialist topics. The key points at the Board meetings in 2014 were matters concerning strategy, taxes, the business risk management process, business plan and budget approval, forecasts, key policies such as for anti-bribery, annual report, earnings report and interim reports, as well as investments and setting up operations on new markets such as Spain and North America. Other matters addressed by the Board of Directors are financial targets, vision and mission, as well as financial policy. Ensuring quality in financial reporting The rules of procedure annually resolved by the Board contain detailed instructions regarding which financial reports and financial information shall be submitted to the Board. Besides the year-end report, interim reports and annual report, the Board reviews and evaluates comprehensive financial information, pertaining both to the Group as a whole and various Group entities. The Board also reviews, primarily through the Audit Committee of the Board, the most material accounting Board meetings in 2014 Recurring items at ordinary Board meetings have been the status report of the CEO, feedback from the Committees, risk report, financial report and other current projects and matters, including addressing forecasts, policies and taxes. 10/12 ordinary meeting • 2015 budget 4/12 per capsulam • Per capsulam. Decision on deposit in Spain 12/2 ordinary meeting • Earnings report • Draft annual report • Distribution to shareholders • AGM matters, auditors’ report 24/3 ordinary meeting • Documentation and preparations ahead of AGM 22/10 ordinary meeting • Approval, interim report, January–September 26/3 ordinary meeting • Decisions ahead of AGM 22/4 ordinary meeting • Adoption of the Q1 interim report 15/9 ordinary meeting • Risk management procedure 10/7 ordinary meeting • Approval, interim report, January–June • Approval, Parent Company half-year report 44 NetEnt | Annual Report 2014 24/4 AGM and inaugural meeting • AGM: resolutions on company signatories, adoption of instructions and policies, election of Audit Committee members. Decision to commence establishing operations in New Jersey 24/6 strategy meeting and workshop 25/6 ordinary meeting • Decision on Group-wide strategy A D M I N I S T R AT I O N R E P O R T Corporate governance report policies applied in the Group as regards financial reporting, as well as material amendments to reporting policies. Minutes are recorded at all Audit Committee meetings and the minutes are available to all Board members and to the auditors. At the Board meeting in February 2014, the chief auditor, Therese Kjellberg of Deloitte, reported her conclusions from the 2014 audit. At the meeting, the members of the Board had the opportunity to ask the auditor questions without the presence of Company management. Evaluation of Board work The Chairman of the Board of Directors annually evaluates the work of the Board through a systematic and structured process, with the purpose of developing the Board’s work and efficiency. The Board of Directors continually evaluates the CEO’s work, and the Board addresses this matter without the presence of any Company management members. Board remuneration Remuneration for the Board of Directors is proposed by the Nominating Committee and decided by the AGM, and is paid to Board members who are not employed by the Company. Monetary data regarding remuneration for the Board of Directors by financial year is shown in the table on page 43. The Board addresses and decides on Group-wide matters such as: • Principal goals • Strategic direction • Material matters pertaining to financing, investment, acquisitions and divestments • Monitoring and control of operations, provision of information and organizational matters, including evaluating Group executive management • Choice of and, if needed, dismissal of the CEO of the Company • Approving financial reports and appropriation of profits • Overarching responsibility for preparing efficient internal control and risk management systems • Important policies BOARD COMMITTEES 5 Audit Committee The Audit Committee is responsible for monitoring and quality assurance of the Company’s financial reporting. In terms of financial reporting, the Audit Committee monitors the efficiency of the Company’s internal controls and risk management. The Committee keeps itself informed of the audit of interim reports, the annual financial statements and the consolidated financial statements, reviews and monitors the auditor’s impartiality and independence, and pays particular attention if the auditor provides the Company with services other than audit services. The Committee is also responsible for the Board’s ongoing communication with the Company’s auditors, establishing guidelines for which services may be procured by the auditors in addition to the audit, evaluation of the audit process, advising the Nominating Committee when preparing auditor proposals, and audit fees. In addition, the Committee has: established an annual plan for its work and an updated risk analysis for the business with a special focus on financial reporting and the link to internal controls; approved the auditor’s audit plan; read and evaluated the auditor’s review; evaluated the internal controls and the process improvement work performed by the Company in that regard; and considered the Finance policy, the Financial handbook and other policies, and accounting issues. During the year, particular attention was paid to intra-Group pricing, the current appeal of the decision from the tax audit regarding the 2007–2010 financial years, the risk management procedure and audit procurement for election at the AGM 2015, as well as reporting and follow-up of the IT audit. The Audit Committee met five times in 2014. All of the meetings were attended by the auditor. Audit Committee members Fredrik Erbing (Chair) Maria Redin Mikael Gottschlich The duties of the Audit Committee include: • Reviewing financial reports • Monitoring the efficiency of internal controls, including risk management, with respect to financial reporting • Keeping informed of the external audit • Reviewing and, as appropriate, granting prior approval when external auditors are appointed for assignments other than audit services • Evaluating the objectivity and independence of external auditors • Follow-up on previous matters NetEnt | Annual Report 2014 45 A D M I N I S T R AT I O N R E P O R T Corporate governance report 6 Remuneration Committee The Remuneration Committee is responsible for matters regarding remuneration and benefits for senior executives, including those of the CEO, and matters of principle for all senior executives. The Board of Directors establishes guidelines for senior executive remuneration that are presented to and approved by the AGM. The guidelines for senior executive remuneration are monitored and evaluated annually, including variable remuneration programs for the Company management that are in progress and that ended during the year. The current remuneration policy is appended to the AGM minutes, available on the website. The Remuneration Committee consists of all seven members of the Board of Directors. The Chairman of the Board of Directors is the chair of the Committee. All members were independent in relation to the Company except for Pontus Lindwall as he is the chairman of the board of Betsson AB, a customer and the former parent company of NetEnt. Pontus Lindwall did however not participate in any decisions in which he could be considered biased. The Remuneration Committee met once in 2014, with all members present. The duties of the Remuneration Committee include: • Preparing and evaluating guidelines for Group management remuneration • Preparing and evaluating goals and policies for variable remuneration • Preparing terms and conditions for pensions, termination of employment, severance pay and other benefits for Company management • Preparing and evaluating NetEnt’s long-term incentive program 46 NetEnt | Annual Report 2014 7 Audit Auditors are elected by the AGM and review the Company’s accounts and administration on behalf of the AGM. According to the Articles of Association, Net Entertainment NE AB (publ) shall have one or two auditors. Deloitte AB was elected auditor at the AGM in April 2014 for the period until the AGM 2015. Therese Kjellberg was appointed chief auditor. The auditor has presented her conclusions of the synoptic review of the interim report for January–September 2014, the audit for the 2014 full year, and internal control for the Audit Committee and the Board of Directors. The auditor also met with the Board of Directors and the Audit Committee without the presence of anyone from the Company management. In addition to the audit, the auditor has had a limited number of other assignments for the Company. These have been auditrelated services concerning accounting and reporting, as well as assisting with establishing the Company’s tax returns. Remuneration for the auditor is set out in Note 24. Auditors Deloitte AB Therese Kjellberg. Chief auditor. Born 1971. Authorized public accountant and member of FAR SRS. A D M I N I S T R AT I O N R E P O R T Corporate governance report 8 CEO and Group management NetEnt’s Group management is thoroughly experienced and works to create a platform for profitable growth, in line with NetEnt’s strategy. Besides the CEO, Group management includes seven more people, four of whom are women. A dynamic Group management team with in-depth knowledge about conditions is crucial for pursuing profitable growth. The CEO is appointed by and receives instructions from the Board of Directors. In turn, the CEO appoints other Group management members and is responsible for the ongoing administration of the Group’s operations in accordance with the guidelines and instructions of the Board. Group management meetings are held once every two weeks to review profit, update forecasts and plans, and to discuss strategic matters. Instructions for the CEO The Board of Directors has prepared and adopted instructions regarding the CEO’s duties and responsibilities, as well as obligations towards the Board of Directors. The CEO is responsible for managing and developing the Company and dealing with the ongoing administration of the Company’s affairs within the framework of the Swedish Companies Act, the Company’s strategy plan, instructions for the CEO, and guidelines and instructions provided by the Board. In the internal work, the CEO shall: monitor to ensure that the Company’s organization is professional and efficient; ensure that internal controls are appropriate and efficient; implement the Company’s strategy and goals; and process and suggest qualitative and quantitative goals for the Company’s various business units. For the Board of Directors, the CEO shall, continuously and before each ordinary Board meeting, prepare, compile, and present data requested by the Board of Directors for assessing the Company’s financial situation, such as reports, key figures and comments, proposals for the business plan, budgets, forecasts, year-end report, interim reports and annual reports. Important matters addressed by the CEO and Group management in 2014 included • Growth strategy • Establishing operations on new markets • Brand strategy • Strengthening NetEnt’s corporate culture • Leadership development • Risk management NetEnt | Annual Report 2014 47 A D M I N I S T R AT I O N R E P O R T Corporate governance report Senior executive remuneration In order to achieve attractive long-term value growth for shareholders, NetEnt seeks to offer its employees competitive remuneration and an attractive workplace that enable hiring and retaining the right employees. For senior executives, the Board of Directors has prepared guidelines for remuneration, as outlined below. Monetary data regarding remuneration for employees and senior executives is set out in Note 6. GUIDELINES ADOPTED BY THE AGM 2014 Fundamental principles These guidelines shall be applied for the CEO of Net Entertainment NE AB (publ) and other senior executives of the Company. The principles in these guidelines apply to employment contracts entered into after the Annual General Meeting and in cases where amendments are made to existing contracts after the Annual General Meeting. The Board of Directors shall be able to diverge from the guidelines provided that there are special grounds in a specific case. It is of fundamental importance for the Company and its shareholders that the remuneration principles and other employment terms for senior executives are, in both a short-term and long-term perspective, competitive and create sound conditions for retaining and motivating skilled employees and attracting new ones when needed. In order to achieve this, it is important that conditions at the Company are fair and well-balanced, while at the same time competitiveness on the market is maintained. Employment terms for senior executives should contain a well-balanced combination of fixed and variable salary, share-based incentive programs, retirement benefits, and terms and conditions for employment termination. Remuneration should be performance-based, and therefore contain a combination of fixed and variable salary, such that variable remuneration constitutes an appropriate proportion of total remuneration. 48 NetEnt | Annual Report 2014 Fixed and variable salary Fixed salary shall be market-based, competitive, individual, and based on the individual’s responsibility, role, skills, and experience in relevant positions. Annual variable salary shall be measured and paid on an annual basis. Annual variable salary shall be capped at 50 percent of fixed salary, and be based on actual achievements in relation to established financial and operational goals. Goals for variable salary are determined annually by the Board of Directors for the CEO, and by the CEO in terms of variable salary for other executives, in order to ensure that they are in line with the Company’s business strategy and objectives. Variable salary terms shall include a minimum level of performance in relation to goals, for which no variable salary is received. Long-term incentive program In order to secure long-term commitment, continued employment and competitive remuneration from an international perspective, annual variable salary may be supplemented with long-term cash incentive programs with deferred payment between 12 and 24 months. Such incentive programs are used selectively and are based on objectives related to the current financial year. Longterm cash incentive programs require continued employment until a predetermined date in order for payment to be made. Long-term cash incentive programs shall be capped at 50 percent of annual fixed salary, and shall otherwise follow the same principles that apply to the Company’s annual variable salary as above. The Board is entitled to reclaim variable remuneration disbursed on the basis of information that later proved to be evidently erroneous. A D M I N I S T R AT I O N R E P O R T Corporate governance report Key employees are invited to participate in an ongoing share-based incentive program in the form of share option rights or other share-based incentive programs issued at market price to motivate long-term engagement and better align their interests with those of share holders. In order to strengthen loyalty to the Company, share-based incentive programs in the form of share option rights issued on market terms can be combined with cash remuneration, which is payable in connection with the redemption period during which share option rights can be exercised, to employees who are still employed at the time of redemption. Such remuneration may not exceed 50 percent, net after tax, of the premium paid for the share option right. Retirement benefits and employment termination Retirement benefits for the CEO and other members of Company management shall be competitive and based on defined contribution pension plans, in which the premium shall be capped at 33 percent of pensionable salary. Other benefits, such as company cars, health insurance, etc. shall constitute a minor part of total remuneration, and be in line with market conditions. The CEO can have a maximum notice period of twelve months. Other members of Company management can have a maximum notice period of six months. In addition to notice periods, severance pay can be payable. Salary during the notice period and severance pay shall in total, however, not exceed the equivalent of 18 months’ salary. GUIDELINES DETERMINED BY THE BOARD OF DIRECTORS AND PROPOSED TO THE AGM 2015 For the AGM 2015, the Board has proposed to adopt the same guidelines for remuneration for the CEO and other senior executives as the preceding year, with the following changes and clarifications: The 2014 guidelines set out that annual variable salary shall be capped at 50 percent of fixed salary, and be based on actual achievements in relation to established financial and operational goals. The Remuneration Committee proposed to the AGM 2015 that annual variable salary shall be capped at 60 percent of fixed salary. Furthermore, the 2014 remuneration guidelines set out that, in order to strengthen loyalty to the Company, share-based incentive programs in the form of share option rights issued on market terms can be combined with cash remuneration, which is payable in connection with exercising share option rights to employees who are still employed at the time of redemption. Such remuneration may not exceed 50 percent, net after tax, of the premium paid for the share option right. For the AGM 2015, the Remuneration Committee has proposed that such remuneration shall be capped at 70 percent net after tax. No other changes to the guidelines are proposed. NetEnt | Annual Report 2014 49 A D M I N I S T R AT I O N R E P O R T Corporate governance report Internal control of financial reporting NetEnt’s control system has been devised to ensure accurate, reliable financial reporting and accounting in accordance with applicable laws and ordinances, accounting standards and other requirements for listed companies. Internal control refers to the process that is influenced by the Board of Directors, Company management and other staff, and is designed to provide reasonable assurance that the goals of the Company are achieved in terms of • appropriate and efficient operations, • reliable financial reporting, and • compliance with applicable laws and regulations. NetEnt applies the established framework for internal control issued by the Committee of Sponsoring Organizations of the Treadway Commission (COSO). This framework encompasses five principal areas: control environment, risk assessment, control activities, monitoring/ improvement and communication. CONTROL ENVIRONMENT The foundation of NetEnt’s control system is the control environment, which determines the individual and collective approaches in the Group. It is defined through policies and procedures, manuals and codes, and is upheld with the help of NetEnt’s organizational structure with clear responsibilities and powers based on shared values. Soundly devised internal control not only creates conditions for reliable financial reporting, but also contributes to a healthy and sustainable business with greater profitability as a result. Work on the design of internal processes and monitoring thereof is becoming increasingly important as the Company grows. This is particularly important in terms of the systems that NetEnt develops and operates on behalf of licensees. NetEnt’s Board bears overarching responsibility for establishing an efficient internal control system. The responsibility for establishing an efficient control environment has been delegated to the CEO. The CEO delegates powers to those reporting to him, both directly and through established guidelines and manuals at the Company. Corporate values are an important element in this respect, providing guidance for daily work. The Company’s finance function reports to the Audit Committee and to the Company’s Chief Financial Officer, and works to develop and improve internal control in financial reporting in the Group, both proactively with a focus on the internal control environment, and by reviewing how internal control works. Constant development of internal control is important for a rapidly growing company like NetEnt. Control en viro nm en t Responsibilities and powers Risk assessment Identify and analyze risks Control activities both manual and automated, ongoing and specific Internal control objectives Ethics and solid values Expertise Follow-up Evaluate any deficiencies Communicate Internally Externally Good role models in management 50 NetEnt | Annual Report 2014 nment nviro ol e ntr Co Rules and procedures A D M I N I S T R AT I O N R E P O R T Corporate governance report In 2013 a new ERP system was rolled out to improve support for the traditional accounting processes, electronic invoice management, purchasing process and HR administration, thus enhancing internal control by reducing dependence on manual processing. In 2014 work progressed on optimizing the system and enhancing accounting processes and internal control procedures. NetEnt reviews its internal control processes in accordance with a recurring time cycle each year, and makes changes to the extent required. In turn, the Audit Committee, with the Company’s auditor, regularly review these control processes. Moreover, the Group has a function comprising people with specific responsibility for compliance, as well as quality and processes. “Compliance” here refers to industry-specific regulation from gaming authorities in various countries and compliance in the context of antibribery and anti-money laundering. Internal governance instruments Internal governance instruments for financial reporting primarily consist of the Group’s finance policy, information policy, financial handbook, and authorization instructions that define accounting and reporting rules, as well as the Group’s definition of processes and minimum requirements for sound internal control in financial reporting. In addition, the Company has policies regarding, for example, trade in the Company’s shares, IT and information security, dividend, anti-bribery, prevention of money laundering and terrorist financing, drugs and gambling. RISK ASSESSMENT Risks in financial reporting are evaluated and monitored by the Board of Directors through the Audit Committee. Each year, NetEnt conducts a structured risk assessment to enable identifying material risks affecting internal control in financial reporting, and identifying where these risks are present. The main risks to the Company are attributable to areas such as regulated activity, the invoicing process, development expenditure and taxes, and the Company’s substantial cash and cash equivalents. During the risk assessment, particular attention has been paid to the risk of irregularities and undue favoring of other parties at the Company’s expense, and the risk of loss or misappropriation of assets. Matters are prepared by the Audit Committee before consideration by the Board of Directors. The risk assessment results in control objectives that support meeting the fundamental financial reporting requirements. The risk assessment is updated annually by the Company, and the results are reported to the Audit Committee. Moreover, the Company has a risk management process designed to constantly identify, prioritize and manage material business risks at large. The risk landscape is in some respects similar to the risk assessment for financial reporting, but includes other risks such as the availability of competent staff and political decisions. The Audit Committee is responsible for continually monitoring this process and reports regularly to the Board of Directors. For a complete description of NetEnt’s risks, see the Risk factors section on page 37. CONTROL ACTIVITIES The most material risks identified in terms of financial reporting are managed through control structures in processes. Control activities are devised and documented at the process level, and include both overarching and more specific controls with the purpose of preventing, detecting and correcting errors and discrepancies. When devising control activities, accurate and timely performance thereof is ensured. General IT controls are established for the systems that support the processes that affect internal control regarding financial reporting. The design of processes and control activities within IT is also affected by regulations issued by the gaming authorities, such as Malta Gaming Authority (MGA), Alderney Gambling Control Commission (AGCC), Gibraltar Regulatory Authority (GRA) and external reviews in connection with control of such compliance. Such reviews are conducted both by certified auditing agencies for certification in relation to requirements from authorities, and by the Company’s external auditors. Control activities span everything from the review and monitoring of performance outcomes to specific account reconciliations. Areas that are covered by control activities include: • due authorization of business transactions, • ERP systems that affect financial reporting, including verification management, • the accounting process, including year-end reports and consolidated financial statements and their compliance with applicable regulations in the form of generally accepted accounting principles, prevailing laws and regulations, and requirements for listed companies. The process is also designed to ensure proper source materials for decision making for the Board of Directors and management, • significant and unusual or complex business transactions, as well as business transactions or valuations of assets or liabilities that contain significant elements of judgment, • all new employees are subject to prior background screening. NetEnt | Annual Report 2014 51 A D M I N I S T R AT I O N R E P O R T Corporate governance report MONITORING Monitoring of control activities is continually conducted to ensure that risks have been satisfactorily observed and addressed. Monitoring encompasses both formal and informal procedures applied by managers and process owners as well as controllers. Such procedures include monitoring profit vs. budget and plans, analyses and key figures. The Board of Directors continuously evaluates the information provided by Company management. The process includes both monitoring of monthly financial reports vs. budget and goals, and reporting at Board meetings. Through the Audit Committee, the Board of Directors reviews and assesses the internal control’s organization and function. The Company’s policies and instructions are evaluated and updated annually at a minimum with respect to appropriateness and functionality, or more often as needed. The Company’s CFO presents the results of internal control work as a standing agenda item at Audit Committee meetings. The results of the Audit Committee’s work in the form of observations, recommendations and proposals for decisions and measures are continuously reported to the Board of Directors. INFORMATION AND COMMUNICATION Information and communication about internal governance instruments for financial reporting are available for all employees concerned on the Company’s intranet. NetEnt has information and communication channels with the purpose of promoting the completeness and accuracy of financial reporting. Only a limited number of people in the functions Finance, IR, and CEO staff have access to information that is confidential in nature such as budgets, forecasts, financial outcome reporting, Board material and remuneration. Access to such confidential information is in accordance with the powers bestowed upon the Company’s staff in the organization. Important guidelines and manuals of importance to financial reporting are updated and communicated to those concerned in connection with the introduction of new employees and, in the event of potential changes, to all affected staff. There are both formal and informal communication channels to senior executives and the Board of Directors for information from employees. Employees can also contact the Board of Directors by e-mail, and then be anonymous to senior executives if they so wish, as part of the Company’s whistleblowing policy. For external communication, there are guidelines for the Company with stringent demands on accurate and relevant information for the market. The Board of Directors annually adopts an information policy for the Company, which includes guidelines for contacts with analysts and the media. In connection with the introduction of new employees, the latter are informed of the guidelines and laws governing the Company regarding for example managing insider information and trade in the Company’s shares. Prior to each quarterly earnings report, a reminder is sent about the rules to all staff. INTERNAL AUDIT In 2014 an internal audit function for money laundering prevention procedures was established. There is currently no internal audit function for financial reporting at NetEnt. The Board has considered the matter and concluded that existing structures for monitoring and evaluation suffice. The decision is reassessed annually. For certain special reviews, external initiatives can be taken. Moreover, the Company has a compliance function that reports its observations on a regular basis directly to the CEO, and which meets with the Audit Committee at least once a year without the presence of Company management. The function was established to secure enhancement of the Company’s processes and procedures for industryspecific compliance. The share, future outlook and appropriation of profits THE SHARE The share capital is SEK 1,201,195.16 and the quotient value per share is 3.01 öre. The share capital of Net Entertainment NE AB consists of A shares and B shares. The total number of shares is 39,906,816, divided into 5,610,000 A shares and 34,296,816 B shares. One A share carries ten votes and one B share entitles to one vote when voting at the AGM. The two share classes have equal rights to the Company’s assets and profit. Shareholders can vote for their full number of shares represented at the AGM. Holders of A shares are entitled to convert one or more A shares to B shares by written 52 NetEnt | Annual Report 2014 request to the Board of Directors, within the bounds of the maximum number of B shares that may be issued according to the articles of association. At December 31, 2014, the number of shareholders was 5,541. The largest shareholders at the end of 2014 were Per Hamberg with 6.4 percent of share capital and 19.7 percent of the votes, and Rolf Lundström with 6.5 percent of the shares and 14.3 percent of the votes. NetEnt’s ten largest owners held shares equaling 44.9 percent of capital and 75.7 percent of votes in the Company. A D M I N I S T R AT I O N R E P O R T New share issue Following a decision by the AGM in 2011 regarding the 2011–2014 incentive program for senior executives and key individuals at the Company, holders of share options were entitled to subscribe for the equivalent number of series B shares in Net Entertainment NE AB (publ) between August 1 and October 1, 2014. This right was exercised by all option holders. Following subscription at the set subscription price of SEK 70.20 per share, the number of shares in Net Entertainment NE AB (publ) increased by 353,100 series B shares during the year. This new share issue added SEK 24.8 million to Parent Company and Group equity. 2012–2015 program At the end of 2014, a total of 114,994 share options, equaling as many shares, were outstanding. Subscription for shares can occur during the period August 1 – October 1, 2015. To stimulate participation in the program, the board intends to provide loyalty remuneration to be paid out one month prior to maturity of the share options. Remuneration will only be paid out subject to participants still being employed by the Group on the payout date. The net cash remuneration is capped at 50 percent of the premium paid, equaling a total of SEK 0.9 million including social security expenses paid by the Company. EVENTS AFTER THE END OF THE FINANCIAL YEAR In January 2015 NetEnt announced that the Italian gaming operators SNAI and Sisal had been launched with NetEnt’s online casino games, within the bounds of a collaboration agreement entered beforehand with platform supplier GameAccount Network. In January, NetEnt also started phasing out deliveries to operators in Italy that had not commenced a licensing procedure there. In February, Rational Group-owned Full Tilt was launched with NetEnt’s online casino products. In March, NetEnt entered a license agreement with UK-based gaming company Gamesys. FUTURE OUTLOOK Growth NetEnt sees growing demand for the Company’s products and a series of investments have been made in the past few years which, in terms of revenues, are expected to contribute positively in 2015 and ahead. With this in mind it is NetEnt’s ambition to achieve solid sales growth in 2015. Costs and investments NetEnt’s cost base increases as the Company grows. To adapt resources and accommodate an expanding customer base and greater demand for the Company’s products, there is a continued need to increase the number of employees of the Company in 2015. Furthermore, Net Ent continues to create more games, enhance the platform and adapt the Company to new regulated markets, and integrate more customers, which leads to a further investment need in both intangible and tangible assets. Taken together, NetEnt’s ambition is to have an operating margin in 2015 around the same level as in 2014. Proposed distribution to shareholders The Board of Directors proposes to the AGM to distribute SEK 199.5 million (118.7) to shareholders, which corresponds to SEK 5.00 (3.00) per share. The Board intends to propose that such distribution occurs through a share redemption program. The record date for the share redemption program is scheduled for May 12, 2015. The complete proposal and an information folder will be available at the latest three weeks prior to the AGM. The information will be available to shareholders at the Company and on the website www.netent.com as of April 1, 2015, and will be sent free of charge to those shareholders who so request and provide their postal address. The Board of Director’s proposed appropriation of profit in the Parent Company The following is at the disposal of the AGM (SEK) Retained earnings Share premium reserve Profit for the year 921,793 31,512,694 173,999,287 206,433,774 The Board of Directors proposes: That the following be carried forward 206,433,774 Pro forma after distribution to shareholders Retained earnings incl. profit for the year Distribution to shareholders 206,433,774 –199,534,080 6,899,694 The Group’s and the Company’s profit and position in general are presented in the following income statements and balance sheets, cash flow statements and statements of equity with related notes and supplementary information which form an integral part of this annual report. NetEnt | Annual Report 2014 53 F I N A N C I A L S TAT E M E N T S Income statements Group SEK thousands Note 2014 2013 3, 4 850,410 628,961 5 1,253 1,785 851,663 630,746 REVENUES Revenues Other revenues Total operating revenues OPERATING EXPENSES Personnel expenses Depreciation/amortization and impairment Other operating expenses 6 –249,698 –193,104 12, 13 –128,511 –103,140 25 –211,789 –154,754 –589,998 –450,998 261,665 179,748 Total operating expenses Operating profit FINANCIAL ITEMS Financial income 8 13,679 30,334 Financial expense 9 –9,309 –27,384 4,370 2,950 266,035 182,698 Total financial items Profit before tax Income tax 10 PROFIT FOR THE YEAR –22,793 –15,559 243,242 167,139 Earnings per share, basic (SEK) 11 6.10 4.23 Earnings per share, diluted (SEK) 11 6.09 4.21 Closing number of shares 39,906,816 39,553,716 Average number of shares 39,669,908 39,553,716 8.6% 8.5% 243,242 167,139 Effective tax rate Profit for the period attributable to: Parent Company shareholders Statement of comprehensive income – Group 2014 2013 243,242 167,139 Exchange differences arising from the translation of foreign operations 16,168 8,328 Sum of other comprehensive income for the year, net after tax 16,168 8,328 259,410 175,467 5.00 3.00 Profit for the period STATEMENT OF PROFIT/LOSS AND OTHER COMPREHENSIVE INCOME Items that may be reversed to profit TOTAL COMPREHENSIVE INCOME FOR THE YEAR Proposed/conducted distribution to shareholders/dividend per share 54 NetEnt | Annual Report 2014 F I N A N C I A L S TAT E M E N T S Balance sheets Group SEK thousands Note 31/12/2014 31/12/2013 Intangible assets 12 193,136 197,596 Property, plant and equipment 13 70,203 59,795 Other non-current receivables 17 19,031 - 282,370 257,391 ASSETS NON-CURRENT ASSETS TOTAL NON-CURRENT ASSETS CURRENT ASSETS Accounts receivable 15 15,190 8,102 Other receivables 17 64,868 52,995 Prepaid expenses and accrued income 16 104,407 83,330 Funds held on behalf of licensees 79,117 25,238 258,057 105,829 TOTAL CURRENT ASSETS 521,639 275,494 TOTAL ASSETS 804,009 532,885 31/12/2014 31/12/2013 Cash and cash equivalents SEK thousands 18 Note EQUITY AND LIABILITIES EQUITY 19 Share capital Other capital contributed Reserves 1,201 1,191 66,401 41,624 12,509 –3,659 Retained earnings incl. profit for the year 466,090 341,510 TOTAL EQUITY 546,201 380,666 NON-CURRENT LIABILITIES Deferred tax liability 10 12,390 7,478 12,390 7,478 Accounts payable 29,070 31,270 Current tax liabilities 11,515 6,604 143,036 63,619 TOTAL NON-CURRENT LIABILITIES CURRENT LIABILITIES Other liabilities 21 Accrued expenses and deferred income 22 61,797 43,248 TOTAL CURRENT LIABILITIES 245,418 144,741 TOTAL EQUITY AND LIABILITIES 804,009 532,885 Pledged assets Contingent liabilities 28 None None 94,400 92,100 NetEnt | Annual Report 2014 55 F I N A N C I A L S TAT E M E N T S Cash flow statements Group SEK thousands Note 2014 2013 261,665 179,748 OPERATING ACTIVITIES Operating profit Adjustments for non-cash items – Depreciation/amortization and impairment 128,511 103,140 – Other 12, 13 294 –811 – Interest received 954 346 –515 –605 – Interest paid Tax paid –14,745 –14,729 Cash flow from operating activities before changes in working capital 376,163 267,089 Increase/decrease in accounts receivable –6,281 9,046 Increase/decrease in current receivables –92,572 81,384 Increase/decrease in accounts payable –2,378 2,455 Increase/decrease in other current operating liabilities 89,964 –110,044 364,896 249,930 –102,481 Cash flow from operating activities INVESTING ACTIVITIES Investment in intangible assets 12 –84,430 Investment in property, plant and equipment 13 –36,765 –33,876 –121,195 –136,357 Cash flow from investing activities FINANCING ACTIVITIES New issue of shares Change in utilization of overdraft facility Distribution to shareholders/dividend Premium received for share option rights –1,874 –118,661 –88,996 - Cash flow from financing activities –93,873 –90,870 CASH FLOW FOR THE YEAR 149,828 22,703 Opening cash and cash equivalents 105,829 81,230 Closing cash and cash equivalents NetEnt | Annual Report 2014 - - Exchange rate difference in cash and cash equivalents 56 24,788 18 2,400 1,896 258,057 105,829 F I N A N C I A L S TAT E M E N T S Changes in equity Group SEK thousands Share capital Other contributed capital Reserves Retained earnings incl. profit for the year Total equity 1,191 41,624 –11,987 263,366 294,194 167,139 167,139 175,467 2013 Opening equity 1/1/2013 Profit for the year Exchange rate differences arising from the translation of foreign operations 8,328 8,328 - - 8,328 167,139 –88,996 –88,996 Closing equity 31/12/2013 1,191 41,624 –3,659 341,510 380,666 SEK thousands Share capital Other contributed capital Reserves Retained earnings incl. profit for the year Total equity 1,191 41,624 –3,659 341,510 380,666 243,242 243,242 243,242 259,410 –118,661 –118,661 466,090 546,201 Total comprehensive income for 2013 Distribution to shareholders 2014 Opening equity 1/1/2014 Profit for the year Exchange rate differences arising from the translation of foreign operations Total comprehensive income for 2014 New issue of shares 16,168 - - 11 24,777 16,168 24,787 Distribution to shareholders Closing equity 31/12/2014 1,201 66,401 16,168 12,509 There is no minority interest in the Group. All equity is therefore attributable to Parent Company shareholders. NetEnt | Annual Report 2014 57 F I N A N C I A L S TAT E M E N T S Income statements Parent Company SEK thousands Note 2014 2013 3, 4 466,961 392,560 5 102 938 467,063 393,498 –209,977 REVENUES Revenues Other revenues Total operating revenues OPERATING EXPENSES Personnel expenses Depreciation/amortization and impairment Other external expenses 6 –243,202 12, 13 –18,103 –13,524 23 –163,438 –138,827 –424,743 –362,328 42,320 31,170 Total operating expenses Operating profit FINANCIAL ITEMS Profit from participations in Group companies 7 147,948 78,944 Financial income 8 2,017 2,635 Financial expense 9 –1,837 –789 Total financial items 148,128 80,790 Profit after financial items 190,448 111,960 –11,816 –7,658 APPROPRIATIONS Provisions to accrual fund Accelerated depreciation Total appropriations Profit before tax Tax on profit for the year 10 PROFIT FOR THE YEAR 3,185 –3,369 –8,631 –11,027 181,817 100,933 –7,818 –5,176 173,999 95,757 Earnings per share, basic (SEK) 11 4.36 2.42 Earnings per share, diluted (SEK) 11 4.35 2.41 Closing number of shares 39,906,816 39,553,716 Average number of shares 39,669,908 39,553,716 4.1% 4.6% Effective tax rate Statement of comprehensive income – Parent Company Profit for the year 2014 2013 173,999 95,757 OTHER COMPREHENSIVE INCOME Sum of other comprehensive income for the year, net after tax TOTAL COMPREHENSIVE INCOME FOR THE YEAR Proposed/conducted distribution to shareholders 58 NetEnt | Annual Report 2014 0 0 173,999 95,757 5.00 3.00 F I N A N C I A L S TAT E M E N T S Balance sheets Parent Company SEK thousands Note 31/12/2014 31/12/2013 13,443 13,443 15,855 15,855 27,607 27,607 24,761 24,761 14 1,678 1,678 42,728 1,678 1,678 42,294 15 24 1 150,605 3,003 8,722 9,822 172,153 9 103,649 8,700 7,714 120,072 TOTAL CURRENT ASSETS 217,631 389,784 55,507 175,579 TOTAL ASSETS 432,512 217,873 31/12/2014 31/12/2013 1,201 38 1,239 1,191 38 1,229 31,513 922 173,999 206,434 207,673 6,735 23,826 95,757 126,318 127,547 29,021 2,331 31,352 17,206 5,517 22,723 TOTAL CURRENT LIABILITIES 26,401 119,364 4,646 43,076 193,487 26,241 1,535 3,372 36,455 67,603 TOTAL EQUITY AND LIABILITIES 432,512 217,873 None 97,832 None 94,728 ASSETS NON-CURRENT ASSETS Intangible fixed assets Licenses and ERP systems Total intangible fixed assets 12 Property, plant and equipment Plant and equipment Total property, plant and equipment 13 Financial assets Participations in Group companies Total financial assets TOTAL NON-CURRENT ASSETS CURRENT ASSETS Current receivables Accounts receivable Receivables from Group companies Current taxes receivable Other receivables Prepaid expenses and accrued income Total current receivables Cash and bank balances SEK thousands 17 16 18 Note EQUITY AND LIABILITIES EQUITY 19 Restricted equity Share capital Statutory reserve Total restricted equity UNRESTRICTED EQUITY Share premium reserve Retained earnings Profit for the year Total unrestricted equity TOTAL EQUITY UNTAXED RESERVES Tax allocation reserves Accelerated depreciation 20 TOTAL UNTAXED RESERVES CURRENT LIABILITIES Accounts payable Liabilities to Group companies Other liabilities Accrued expenses and deferred income Pledged assets Contingent liabilities 25 21 22 28 NetEnt | Annual Report 2014 59 F I N A N C I A L S TAT E M E N T S Cash flow statements Parent Company SEK thousands Note 2014 2013 42,320 31,170 OPERATING ACTIVITIES Operating profit Adjustments for non-cash items – Depreciation/amortization 18,103 13,524 – Other 12, 13 568 2,224 Interest received 127 41 –515 –419 Interest paid Income tax paid –5,074 –3,186 Cash flow from operating activities before changes in working capital 55,529 43,354 Increase/decrease in accounts receivable –8 0 Increase/decrease in current receivables 93,130 554,925 –829 2,134 Increase/decrease in other current liabilities Increase/decrease in accounts payable 126,712 –428,434 Cash flow from operating activities 274,534 171,979 INVESTING ACTIVITIES Acquisition of subsidiary 14 - –9 Investment in intangible fixed assets 12 –4,075 –16,662 Investment in property, plant and equipment 13 Cash flow from investing activities –14,462 –10,105 –18,537 –26,776 FINANCING ACTIVITIES New issue of shares Change in utilization of overdraft facility Distribution to shareholders/dividend –1,874 –118,661 –88,996 –93,873 –90,870 CASH FLOW FOR THE YEAR 162,124 54,333 Closing cash and cash equivalents NetEnt | Annual Report 2014 - - Cash flow from financing activities Opening cash and cash equivalents 60 24,788 18 55,507 1,174 217,631 55,507 F I N A N C I A L S TAT E M E N T S Changes in equity Parent Company SEK thousands Share capital Statutory reserve Share premium reserve Retained earnings Profit for the year Total equity Opening equity 1/1/2013 1,191 38 6,735 25,830 86,992 120,786 Profit for the year Total comprehensive income 95,757 95,757 95,757 - - - - 95,757 –2,004 –86,992 –88,996 Closing equity 31/12/2013 1,191 38 6,735 23,826 95,757 127,547 SEK thousands Share capital Statutory reserve Share premium reserve Retained earnings Profit for the year Total equity Opening equity 1/1/2014 1,191 38 6,735 23,826 95,757 127,547 Allocation according to the AGM Profit for the year Total comprehensive income New issue of shares - - 11 - 1,201 173,999 - 173,999 173,999 –22,904 –95,758 –118,661 922 173,999 207,673 24,777 Allocation according to the AGM Closing equity 31/12/2014 173,999 38 31,513 24,788 NetEnt | Annual Report 2014 61 NOTES Notes to the financial statements NOTE 1 GENERAL INFORMATION Net Entertainment NE AB (Parent Company, corporate identity number 556532-6443) and its subsidiaries (together, the Group or the Company) is a world-leading supplier of digitally distributed gaming systems used by some of the world’s most successful gaming operators. NetEnt casino is a comprehensive gaming system comprising a full suite of high-quality games and a powerful administration tool. The games create the ultimate gaming experience for the player while the administration tool enables NetEnt’s customers – the operators – to optimize their operations and profitability. Operators are provided with a customized system solution that is quickly and easily integrated, ensuring cost-efficient operation and minimizing installation-to-operation times. Revenues consist of royalties determined by the revenues generated by the Company’s products, and setup fees when new agreements are signed. NetEnt is a pure operating and development Company and thus does not conduct any gaming operations of its own. The Company’s brand is internationally reputed and associated with innovation, service and quality. The Group is headquartered in Stockholm, where a certain degree of development takes place, while sales, product management and marketing are managed from Malta. The Company also has offices in Gothenburg, Kiev (Ukraine), Gibraltar as well as an operations site in Alderney. Development is also conducted through a collaboration partner in India. The Parent Company is listed on Nasdaq Stockholm (NET-B.ST). This annual report was approved for publication by the Board of Directors on March 26, 2015. The income statement and balance sheet will be adopted at the Annual General Meeting on April 29, 2015. NOTE 2 ACCOUNTING AND VALUATION PRINCIPLES BASIS OF PREPARATION OF THE FINANCIAL STATEMENTS The consolidated financial statements were prepared in accordance with the Annual Accounts Act, International Financial Reporting Standards (IFRS), issued by the International Accounting Standards Board (IASB), and interpretations issued by the IFRS Interpretations Committee (IFRIC), as adopted by the European Commission for application within the EU. Furthermore, the Swedish Financial Reporting Board’s recommendation RFR 1 “Supplementary Accounting Rules for Groups” has also been applied. The accounting principles have been consistently applied by all Group companies in their reporting, and in consolidation during all periods of time presented in the consolidated financial statements. Conditions for preparing the consolidated financial statements The Parent Company’s functional currency is the Swedish krona (SEK), which is also the presentation currency for the Parent Company and the Group. The financial statements are thus presented in SEK. All figures are expressed in SEKk (thousands of Swedish kronor) unless otherwise stated. SEKm is an abbreviation for million Swedish kronor. Amounts and figures in brackets refer to comparable figures for the same period of the previous year. Assets and liabilities are recognized at acquisition cost, apart from some financial assets and liabilities which are measured at fair value. 62 NetEnt | Annual Report 2014 The most important accounting principles applied in the preparation of these consolidated financial statements are stated below. These policies have been applied consistently for all the years presented, unless otherwise stated. The Parent Company applies the same principles as the Group, with the exception of Parent Company financial statements having been prepared in accordance with RFR 2 “Accounting for Legal Entities”. This results in certain differences caused by the requirements of the Annual Accounts Act or by tax considerations. The accounting principles for the Parent Company are provided below in the section ”Parent Company Accounting Policies”. In the previous year, 2013, NetEnt retroactively adjusted the recognition of deferred tax regarding its Maltese operations. The Company therefore takes into consideration that 6/7ths of deferred tax applying to taxed distributions from the Maltese subsidiaries will be refunded by the Maltese authority. Previously the deferred tax was calculated based on the tax rate applicable to undistributed profits. The reported financial result and financial position of prior periods have been restated. Standards, amendments and interpretations effective for 2014 No new, amended or revised standards and interpretations that came into effect in 2014 have had any material impact on the Group’s financial statements. Standards, amendments to standards in issue not yet effective and not adopted early by the Group The International Accounting Standards Board (IASB) has issued the following new and amended standards which have not yet come into effect: IFRS 15 “Revenue from contracts with customers” regulates revenue recognition. The principles on which IFRS 15 is based is to provide users of financial statements with more informative and relevant information regarding the company’s revenues. According to the extended disclosure obligation, the following shall be provided: information regarding revenue type, timing of settlement, uncertainty related to revenue recognition and cash flow attributable to the company’s customer contracts. Revenue shall, according to IFRS 15, be recognized when the customer gains control of the sold product or service and is able to utilize or benefit from the product or service. IFRS 15 replaces IAS 18 Revenue and IAS 11 Construction Contracts and related SIC and IFRIC. IFRS 15 comes into effect on January 1, 2017 Early application is permitted. The Group has not yet evaluated the effects of introducing the standard. IFRS 9 “Financial Instruments” addresses classification, valuation and recognition of financial assets and liabilities. The complete version of IFRS 9 was issued in July 2014. It replaces the parts of IAS 39 that deal with the classification and valuation of financial instruments. The standard will apply to financial years starting on or after January 1, 2018. Earlier application is permitted. However, these new standards have not yet been adopted by the EU, and the entry into force may thus change. In the opinion of Company management, other new or revised standards and interpretations not yet effective in 2014 are not expected to have any material effect on the consolidated financial statements for the period to which they are initially applied. NOTES CLASSIFICATION Assets are classified as current assets if they are expected to be sold or are intended to be sold or used in the Company’s normal operating cycle, if they are held primarily for trading purposes, if they are expected to be sold within twelve months after the balance sheet date or if they are cash or cash equivalents. All other assets are classified as non-current assets. Liabilities are classified as current liabilities if they are expected to be settled in the Company’s normal operating cycle, if they are held primarily for trading purposes, if they are expected to be settled within twelve months after the balance sheet date or if the Company lacks an unconditional right to defer settlement of the liability for at least twelve months after the balance sheet date. All other liabilities are classified as non-current liabilities. CONSOLIDATED FINANCIAL STATEMENTS The consolidated financial statements include the Parent Company and companies in which the Parent Company directly or indirectly has more than half of the voting rights or otherwise has control. Principles of consolidation The consolidated financial statements were prepared in accordance with the purchase method. Acquisition-related costs are expensed in the periods in which they arise. Identifiable assets acquired and liabilities and contingent liabilities assumed in a business combination are measured initially at their fair values at the acquisition date, irrespective of the extent of any minority interest. The difference between the acquisition cost of the shares and the fair value at the time of acquisition of the Group’s share of the identifiable net assets acquired is recognized as consolidated goodwill. If the difference is negative, the amount is immediately recognized as revenues in the income statement. Subsidiaries’ income and expense, and assets and liabilities, are included in the consolidated financial statements from the date on which control arises (acquisition date) through the date on which it ceases. Intra-Group receivables and liabilities, and transactions among Group companies and any associated gains, are eliminated in their entirety. Translation of foreign operations Operations that do not have the Swedish krona as their functional currency are translated to SEK as follows. All assets, provisions and other liabilities are translated at the closing day rate, and income statement items are translated at the average rate. Exchange rate differences arising in translation – translation differences – are recognized through comprehensive income in equity. Foreign operations are sold at their accumulated translation differences, less any currency hedging in the consolidated income statement. Revenues NetEnt’s revenues largely comprise the licensing of online gaming products/services, and consist of the fair value of what has been received or will be received for services sold in the Group’s operating activities. Revenue is recognized excluding VAT and discounts, and after elimination of intra-Group sales. All invoicing takes place monthly in arrears. NetEnt Casino™ generates license revenues according to a royalty model and the amount is determined by the earnings generated by the product for the customer and is recognized in the period during which the customer uses the product. The Group recognizes revenue when its amount can be reliably measured and it is probable that future financial benefits will accrue to the Company. The amount of revenue cannot be reliably measured until all sales commitments are fulfilled or have expired. The Group bases its assessments and estimates on historical outcomes and thus observes the type of customer, type of transaction and particular circumstances in each individual case. If any circumstances arise that might change the original assessment of the amount of revenue, the estimates are reviewed. Such reviews can result in increases or decreases of estimated income or expense and affect income during the period in which the circumstances that caused the change became known to Company management. Other revenues Revenue from activities not included in the ordinary operations is recognized as other revenues. This item mainly includes recovered amortized receivables, exchange gains from operations and profit from the sale of non-current assets. Financial income/expense Interest income and interest expense are reported as distributed over their maturity with application of the effective interest method. Effective interest is the interest that makes the present value of all future incoming and outgoing payments during the fixed-interest period equal to the carrying amount of the receivable or liability. Other external expenses Costs of secondary activities in ordinary operations relating to operating receivables and operating liabilities are recognized as other operating expenses. This item mainly includes exchange losses from operations and losses on the sale of non-current assets. Segment reporting Operating segments are reported in a manner consistent with the internal reporting submitted to the chief executive decision maker. The chief executive decision maker is the function responsible for allocation of resources and performance assessment of the operating segments. In the Group, this function has been identified as the Group management, which makes strategic decisions. The Company’s only product (and thus segment) is casino game systems. Pooled jackpots Funds for pooled jackpots are recognized in the balance sheet as current receivables. A corresponding amount is recognized in liabilities in the balance sheet as other current liabilities. In the cash flow statement, the build-up of jackpot funds and outgoing payment of winnings are included in changes in working capital. The funds relating to pooled jackpots are managed by a type of bank account excluded from the Company’s cash and cash equivalents. Cash flow statement The cash flow statement was prepared using the indirect method. The recognized cash flow only covers transactions that involve incoming or outgoing payments. This means that discrepancies may occur compared with changes in individual items in the balance sheet. Intangible assets Development expenditure is capitalized to the extent that it is expected to generate future financial benefits. Only expenditure arising in the development phase of online gaming products, gaming systems and gaming platforms is capitalized and recognized as an asset from the date on which the decision is made to complete the project, and when circumstances permit this. The carrying amount includes direct expenditure for salaries, purchased services, materials and indirect expenses that can be reasonably and consistently attributed to the asset. In the balance sheet, recognized development expenditure is entered at acquisition cost, less deductions for accumulated amortization and impairment losses. Regular assessments are made of the projects’ revenue-generating capacity in order to identify any need for impairment. Intangible assets also include acquired gaming agreements, soft- NetEnt | Annual Report 2014 63 NOTES ware licenses, concessions and trademarks. These intangible assets are recognized in the balance sheet at acquisition cost, less accumulated amortization and impairment losses. All of the Company’s intangible assets have a known useful life. Property, plant and equipment Property, plant and equipment are recognized as assets in the balance sheet when it is probable that future financial benefits will accrue to the Company and the cost of the asset can be reliably measured. Property, plant and equipment are recognized at acquisition cost less accumulated depreciation and any impairment losses. Repairs and maintenance are recognized as expenses in the period incurred. Depreciation/amortization and impairment Depreciation/amortization is based on the original acquisition cost less the estimated residual value and allowance for impairment conducted. Depreciation/ amortization is performed on a straight-line basis over the asset’s estimated useful life. The following useful lives (years) are used: • Trademarks, domain names, licenses 2–5 years. • Gaming agreements and concessions, 3–5 years. • Capitalized development expenditure for games, gaming systems and gaming platforms is based on class of asset and amounts to a maximum of 3 years. • Computer and server equipment, 4–5 years. • PCs (work stations for developers, etc.) 1–3 years. • Office equipment, 3–7 years. The residual value and useful life of an asset are reviewed annually. If there is any indication that the carrying amounts of property, plant and equipment, intangible fixed assets or financial assets in the Group are excessive, an analysis is performed in which the recoverable amount of the smallest cash-generating unit is established as the higher of net selling price and value in use. The value in use is measured as expected future discounted cash flow. Impairment loss is the difference between the carrying amount and the recoverable amount. When a previously recognized impairment loss is no longer warranted, it is reversed. A reversal may not be higher than an amount that does not exceed the carrying amount that would have been recognized (net of amortization or depreciation) had no impairment loss been recognized. Other financial assets Financial assets can be classified into the following categories: (a) financial assets measured at fair value in the income statement, (b) Loans receivable and accounts receivable, and (c) financial assets available for sale. The classification is dependent upon the purpose for which the financial asset was acquired. The classification of the financial assets is determined in initial accounting. The Group does not have any assets that fall into the categories (a) or (c). Loans receivable and accounts receivable Loans receivable and accounts receivable are financial assets that are not derivatives with determined or determinable payments, and are not listed on an active market. They are included in current assets with the exception of items falling due more than 12 months following the closing date, which are classified as non-current assets. In this category, accounts receivable as well as cash and cash equivalents and certain other receivables are recognized in the balance sheet (see Notes 15, 17 and 18). 64 NetEnt | Annual Report 2014 Accounts receivable Accounts receivable are initially measured at fair value and then at amortized cost with application of the effective interest method, less any provision for impairment. A provision for impairment of accounts receivable is made when there is objective evidence of the inability of the Group to obtain all the amounts due under the original terms of the receivable. The size of a provision is determined by the difference between the asset’s carrying amount and the present value of estimated future cash flows, discounted by the original effective interest rate, and the adjustment is recognized in the income statement in selling expenses. When accounts receivable cannot be collected, they are completely written off from accounts receivable. Cash and cash equivalents Cash and cash equivalents include cash, bank balances and other current investments maturing within three months of the acquisition date. Equity Equity consists of registered share capital, other contributed capital, translation reserves, retained earnings and profit for the year. Ordinary shares are classified as equity. Transaction expenses that can be directly attributed to issues of new shares or options are recognized, net after tax, in equity as a deduction from the issue proceeds. Other than the shares’ quotient value, other capital contributed refers to amounts received from new share issues, shareholder contributions, amounts received from issuing options, and Group contributions. Translation reserve refers to translation differences attributable to the translation of foreign subsidiary operations into NetEnt’s presentation currency. Accounts payable Accounts payable are initially recognized at fair value and subsequently at amortized cost using the effective interest method. Other financial liabilities Financial liabilities not held for trading are initially measured at fair value and subsequently at amortized cost. Amortized cost is determined based on the effective interest calculated when the liability was recognized. Surplus and deficit values and transaction expenses are hence distributed over the term of the liability. Taxes Tax in the income statement consists of current tax and deferred tax. Current tax is tax (paid or received) that relates to the current year. This also includes adjustment of current tax attributable to prior periods. Income tax liabilities and receivables are measured at their nominal amounts and according to the tax regulations and tax rates decided or announced and which are highly likely to be adopted. For items recognized in the income statement, related tax effects are thus also recognized in the income statement. Tax effects of items recognized through comprehensive income in equity or directly in equity, are recognized in other comprehensive income or equity. Deferred tax is calculated using the balance sheet method based on temporary differences arising between the carrying amounts and values for tax purposes of assets and liabilities, applying the tax rates and regulations decided or announced at the balance sheet date and which are expected to apply when the deferred tax receivable concerned is realized or the deferred tax liability is settled. Temporary differences are not considered in consolidated goodwill or in differences attributable to NOTES participations in subsidiaries and associates that are not expected to be taxed within the foreseeable future. In legal entities, untaxed reserves including deferred tax liabilities are recognized. Deferred taxes receivable relating to deductible temporary differences and loss carry-forwards are only recognized to the extent that it is probable they will be utilized and result in lower future tax payments. Leases Leases are classified in the consolidated financial statements either as finance or operating leases. Leases of non-current assets for which the Group is essentially exposed to the same risks and rewards as in direct ownership are classified as finance leasing. The leased asset is recognized in non-current assets and the corresponding rent liability falls under interest-bearing liabilities. Leases of assets for which the lessor essentially remains the owner are classified as operating leasing and the leasing charge is expensed on a straight-line basis over the term of the lease. The scope of operating leases and rental agreements is provided in Note 23. Dividends or distributions to shareholders Dividends are recognized as a liability after they are approved by the Annual General Meeting. Employee benefits Pension expenses and pension commitments The Group has various pension plans in different countries. The pension plans are financed by payments from the relevant Group companies and, in some cases, from employees. As all pension plans are definedcontribution, the Group has no legal or informal obligations once the contributions have been paid. The Group’s outgoing payments for defined-contribution pension plans are expensed in the period in which the employees performed the services to which the charge relates. Benefits after termination of employment The Group has no obligations to employees after they have retired or their employment with the Company is at an end. Severance benefits Severance remuneration is payable when an employee’s position is terminated by NetEnt before the normal date of retirement, or when an employee voluntarily departs in exchange for such remuneration. The Group recognizes severance pay when it is demonstrably committed to either terminating the employment of employees in accordance with a detailed formal plan without the possibility of retraction, or providing termination benefits ensuing from an offer made to encourage voluntary departure. Bonus plans The Group recognizes a liability and an expense for bonus based on various qualitative and quantitative measures. The Group makes a provision for earned bonuses if there is a legal obligation or an informal obligation owing to previous practice. Provisions A provision is recognized in the balance sheet when the Group has an existing legal or informal obligation owing to a past event, and an outflow of financial resources will probably be required to settle the obligation and the amount can be reliably estimated. In a situation where the effect of the point in time at which the payment takes place is important, provisions are calculated by discounting expected future cash flows at an interest rate before tax that reflects current market assessments of the time value of the money and, if applicable, the risks associated with the liability. A restructuring provision is recognized when the Group has defined a detailed, formal restructuring plan and the restructuring has either commenced or has been officially announced. No provision is made for future operating expenses. Contingent liabilities A contingent liability is recognized when there is a possible obligation arising from past events and its existence is confirmed only by one or more uncertain future events, or when there is an obligation which is not recognized as a liability or a provision due to the improbability of an outflow of resources being required to settle it. PARENT COMPANY ACCOUNTING POLICIES The Parent Company complies with the same accounting principles as the Group, with the exceptions stated below. Participations in subsidiaries are recognized at acquisition cost less any impairment losses. Acquisition-related expenses for the subsidiaries, which are expensed in the consolidated financial statements, are included as part of the acquisition cost of participations in subsidiaries. Shareholder contributions are recognized directly in the equity of the recipient and capitalized in the contributor’s shares and participations. These assets are subsequently subject to impairment testing. Group contributions received for the purpose of minimizing the total tax of the Group are recognized as an appropriation. Dividends from subsidiaries are recognized when the right to receive dividends is considered to be reliable. The Parent Company recognizes the deferred tax liability on untaxed reserves as part of the untaxed reserves because of the connection between accounting and taxation. The amendments to RFR 2 have not had any considerable effect on the Parent Company’s financial statements. KEY ESTIMATES AND ASSUMPTIONS The Group makes estimates and assumptions about the future. The resulting estimates used for accounting purposes will, by definition, rarely match the actual outcome. The estimates and assumptions that entail a considerable risk of substantial adjustments in the carrying amounts of assets and liabilities in the next financial year are outlined below. They are regularly evaluated and are based on historical experience and other factors, including expectations of future events that are deemed reasonable in the prevailing circumstances. Taxes The Group’s tax expense is primarily affected by the distribution of profit between Sweden and the countries in which the Group operates and the tax regulations of each country. Comprehensive assessments are required to establish the income tax provision. There are many transactions and calculations for which the final tax is uncertain at the time when the transactions and calculations are conducted. The Company has, alongside legal experts, assessed how tax regulations affect the operations in order to ensure an accurate tax status. This also applies to indirect taxes. The company recognizes and pays to the tax authorities the tax amounts that the Company deems accurate. However, these amounts may prove insufficient if tax authorities apply a more restrictive interpretation of tax regulations than the assessment made by the Company NetEnt | Annual Report 2014 65 NOTES and which the latter considers to be accurate (see Note 28). In 2013, the Group retroactively changed the recognition of deferred tax regarding its Maltese operations. The reported financial result and financial position of prior periods have been restated. More information is provided in the section “Conditions for preparing the consolidated financial statements”. Impairment testing Each year, Group assets are impairment tested according to IAS 36. The Group has invested considerable amounts in the development of gaming platforms and their carrying amounts are compared with expected future discounted cash flows calculated on present values. The Group has identified one cash-generating unit, Casino ModuleTM, with a carrying amount of SEK 175.9 million. The impairment test is based on detailed assumptions for the next three years. A discount rate after tax of 6.0 percent (7.2) has been used for the cash-generating unit for discounting estimated cash flows after tax. Even when a much higher discount rate is used, the impairment test does not show any need for impairment. In the balance sheet, recognized development expenditure is entered at acquisition cost, less deductions for accumulated amortization and impairment losses. Regular valuations are performed of the projects’ revenue-generating capacity in order to identify any impairment requirements (see Note 12). NOTE 3 REVENUES GROUP License revenues, royalties Consulting revenues Total PARENT COMPANY 2014 2013 2014 2013 850,410 628,961 46,275 33,765 - - 420,686 358,795 850,410 628,961 466,961 392,560 NOTE 4 SEGMENT REPORTING The chief executive decision maker is the function responsible for allocation of resources and performance assessment of the operating segment. In the Group, this function has been identified as the Group management. Segments are defined by their ability to generate income and incur expenses. Defined segments in the Group are used for follow-up purposes to make strategic decisions. In its reporting to the chief decision maker, the Group has identified one segment for follow-up. The identified segment is casino game systems. Group management assesses the operations based on the operating segment. With respect to geographic breakdown of operations, NetEnt’s customers (gaming operators) offer games to their customers (players) in many different countries. The domicile of NetEnt’s direct customers (the websites) is determined by reasons completely different to proximity to the local market, such as appropriate gaming legislation, tax-related reasons, or other reasons. The advantage of the internet is that it is a global, crossborder form of distribution, in which those owning a gaming site can be domiciled anywhere in the world and still serve many local markets around the globe. The operations of the NetEnt Group are geographically diversified based on legal requirements, regulations and strategic decisions. The geographical information provided below regarding revenues and assets has been broken down based on the countries in which the Group’s customers are domiciled, and where the Group’s assets are found. GEOGRAPHIC BREAKDOWN 2014 2013 2012 Revenues Sweden - - - Malta 66.6% 63.9% 71.0% Other countries 33.4% 36.1% 29.0% Sweden 14.5% 15.8% 12.7% Malta 79.4% 79.7% 83.8% 3.4% Non-current assets Alderney 2.5% 1.6% Gibraltar 2.1% 2.7% - Ukraine 0.7% 0.2% 0.2% The distribution by customer is provided to show dependence on specific customers. CUSTOMERS (REVENUE BREAKDOWN) 2014 2013 2012 Customer I 13% 19% 22% Customer II 9% 11% 13% Customer III 4% 5% 7% NOTE 5 OTHER REVENUE GROUP – E xchange rate differences, operations – Other Total 66 NetEnt | Annual Report 2014 PARENT COMPANY 2014 2013 2014 2013 1,253 1,602 102 773 - 183 - 165 1,253 1,785 102 938 NOTES NOTE 6 BOARD REMUNERATION EMPLOYEE BENEFITS AVERAGE NUMBER OF EMPLOYEES 2014 Average number of employees 2013 Of whom male Average number of employees Of whom male Sweden 272 73% 253 75% Malta 119 43% 67 46% Ukraine 6 54% 6 67% Gibraltar 4 60% 2 100% 401 69% 328 69% Group total BOARD FEES 2014 2013 Vigo Carlund, Chairman 597 587 Fredrik Erbing 317 307 Mikael Gottschlich 247 240 Peter Hamberg 247 240 Pontus Lindwall 247 240 Michael Knutsson 247 240 Maria Redin 247 240 2,147 2,094 Current Board of Directors Total The Annual General Meeting determines remuneration for Board members. At the Annual General Meeting on April 24, 2014, it was resolved, for the period until the 2015 Annual General Meeting, that Board fees would be paid to a total amount of SEK 2,170 thousand, of which SEK 600 thousand to the Chairman of the Board and SEK 250 thousand each to other Board members, with an addition of SEK 70 thousand for the chair of the Audit Committee. SENIOR EXECUTIVE REMUNERATION In 2014, CEO remuneration totaled SEK 4,455 thousand (3,937), of which SEK 1,100 thousand (780) was variable remuneration, and pension benefits of SEK 911 thousand (834). Of pension benefits, SEK 376 thousand (306) refers to payments into a company-owned endowment policy for pension commitments for the present and former CEO, see Note 28 for further information. Other benefits pertaining to health insurance totaled SEK 16 thousand (15). The notice period for the CEO is six months on the part of the CEO and 12 months’ salary on the part of the Company. Remuneration for other senior executives in 2014 totaled SEK 15,837 thousand (12,426), of which SEK 2,058 thousand (850) was variable remuneration and pension benefits totaling SEK 1,650 thousand (1,395). Senior executives consisted of 8 (8) different individuals. The notice period for other senior executives varies between 3 and 6 months and is mutual. Other benefits pertaining to health insurance totaled SEK 23 thousand (23). LOYALTY REMUNERATION SALARIES AND SOCIAL SECURITY EXPENSES 2014 2013 Social security expenses (of which pension Salaries expenses) Board and CEO 6,281 Social security expenses (of which pension Salaries expenses) 2,508 5,376 2,093 134,450 60,674 (534) Other employees Sweden 151,231 Total Parent Company 157,512 64,629 (528) (19,315) 67,137 (15,689) 139,825 62,766 (19,850) Other employees, Malta 40,948 (16,217) 2,269 25,152 1,258 (342) Other employees, Ukraine 2,061 289 3,082 1,716 203,604 (56) 148 69,843 PROFIT FROM PARTICIPATIONS IN GROUP COMPANIES PARENT COMPANY 406 1,312 42 (70) Total Group NOTE 7 (176) (22) Other employees, Gibraltar Key employees may be invited to participate in an ongoing share-based incentive program in the form of share option rights or other share-based incentive programs issued at market price to motivate long-term engagement and better align their interests with those of shareholders. In order to strengthen loyalty to the Company, such incentive programs can be combined with cash remuneration, which is payable in connection with the redemption period during which share option rights can be exercised, to employees who are still employed at the time of redemption. Such remuneration may not exceed 50 percent, net after tax, of the premium paid for the share option right. The Company’s cost of loyalty remuneration is recognized on an ongoing basis over the vesting period. (13) 168,006 2014 2013 Anticipated distribution from subsidiaries 147,948 78,944 Total 147,948 78,944 64,472 (20,284) (16,462) NOTE 8 FINANCIAL INCOME Presented salaries and social security expenses include both amounts expensed and capitalization of development expenditure. GROUP 2013 2014 954 346 127 41 Exchange rate differences 12,725 29,988 1,890 2,594 Total 13,679 30,334 2,017 2,635 Interest income NUMBER AND PERCENTAGE OF WOMEN IN EXECUTIVE POSITIONS AT YEAR END 2014 2013 No. No. Percentage men women women 2013 No. No. Percentage men women women Board of Directors 6 1 14% 6 1 14% Other senior executives 4 4 50% 4 4 50% 10 5 33% 10 5 33% Total Group Board of Directors and management group PARENT COMPANY 2014 NetEnt | Annual Report 2014 67 NOTES NOTE 9 FINANCIAL EXPENSE NOTE 11 GROUP PARENT COMPANY 2014 2013 2014 2013 515 605 515 419 Exchange rate differences 8,794 26,779 1,322 370 Total 9,309 27,384 1,837 789 Interest expense NOTE 10 INCOME TAX GROUP 2014 PARENT COMPANY 2013 2014 2013 5,176 Current tax Sweden 7,818 5,176 7,818 Outside Sweden 11,258 6,499 - - Total current tax 19,076 11,675 7,818 5,176 Sweden 1,899 2,426 - - Outside Sweden 1,818 1,458 - - Total deferred tax 3,717 3,884 0 0 Total tax expense 22,793 15,559 7,818 5,176 Deferred tax GROUP 2014 PARENT COMPANY 2013 2014 2013 Difference between real tax expense and tax expense based on applicable tax rate Recognized profit before tax Tax according to applicable tax rate 22.0% (22.0%) 40,194 40,000 22,205 - - Effect from changed tax rate - - - Non-taxable income - –32,549 –17,368 Tax attributable to prior years - - - 58,528 Tax effect from non-deductible items –2,108 –1,623 367 339 Recognized tax expense 22,793 15,559 7,818 5,176 Specification of deferred tax expense Tax on appropriations 1,899 2,426 - - Tax on temporary differences 1,818 1,458 - - Recognized deferred tax expense 3,717 3,884 0 0 Specification of deferred tax liability Tax on appropriations 6,898 4,999 - - Tax on temporary differences 5,492 2,479 - - 12,390 7,478 0 0 Recognized deferred tax liability GROUP Profit after tax attributable to Parent Company shareholders (SEK thousand) PARENT COMPANY 2014 2013 2014 2013 243,242 167,139 173,999 95,757 Average number of shares (thousand) 39,907 39,554 39,907 39,554 Average number of shares (thousand), diluted 39,966 39,691 39,966 39,691 Earnings per share (SEK) 6.10 4.23 4.36 2.42 Earnings per share (SEK), diluted 6.09 4.21 4.35 2.41 Earnings per share are calculated on the average number of shares. The number of shares has been calculated in accordance with IAS 33 Earnings per share. The share options were issued as part of two long-term incentive programs in accordance with the decisions taken at the Annual General Meetings on April 13, 2011 and April 26, 2012. The first program resolved at the AGM 2011 expired during the year, resulting in an increase in the number of shares by 353,100 series B shares. At the end of 2014, there were a total of 114,994 share options, equaling as many outstanding shares. The potential shares that the share options constitute are considered when calculating the number of shares and diluted earnings per share in accordance with IAS 33 Earnings per share. The average share price during the year was SEK 177.72, which exceeds the subscription price in the incentive program of SEK 85.38. The potential shares thus have a dilution effect and are thus included in the diluted number of shares. Share option rights are acquired at market price. 266,035 182,698 181,817 100,933 –33,627 –23,012 Difference in tax rate in foreign operations EARNINGS PER SHARE As at 31/12/2014, there were no recognized or unrecognized tax deficits. NOTE 12 INTANGIBLE ASSETS GROUP Gaming Gaming products, agreements gaming systems and and concesgaming platforms sions Licenses and ERP systems Total 1,694 307,770 2013 Opening acquisition cost 304,461 1,615 Capitalized development expenditure for the year 85,819 - Translation difference 12,877 - - 12,877 Closing accumulated acquisition cost 403,157 1,615 18,356 423,128 Opening amortization 138,061 1,615 76,456 - 1,652 78,108 6,900 - - 6,900 Closing accumulated amortization and impairment 221,417 1,615 2,500 225,532 Closing residual value according to plan 31/12/2013 181,741 0 15,855 197,596 403,157 1,615 18,356 423,128 84,430 Amortization and impairment for the year Translation difference 16,662 102,481 848 140,524 2014 Opening acquisition cost Capitalized development expenditure for the year 78,356 - 6,074 Sales for the year –7,781 - - –7,781 Translation difference 27,533 - 94 27,627 501,265 1,615 Closing accumulated acquisition cost Opening amortization 68 NetEnt | Annual Report 2014 24,524 527,404 221,417 1,615 Amortization and impairment for the year 97,384 - 2,580 2,500 225,532 Sales for the year –7,781 - - –7,781 Translation difference 16,497 - 56 16,553 Closing accumulated amortization and impairment 327,517 1,615 Closing residual value according to plan 31/12/2014 173,749 0 99,964 5,136 334,268 19,387 193,136 NOTES PARENT COMPANY NOTE 13 Gaming products, gaming systems and gaming platforms Gaming agreements and concessions Licenses and ERP systems PROPERTY, PLANT AND EQUIPMENT GROUP 2014 Total 2014 2013 Plant and equipment 2013 Opening acquisition cost 24,433 1,615 Investments for the year 1,694 27,742 Opening acquisition cost 131,554 94,607 57,480 47,397 16,662 16,662 Acquisitions for the year 35,915 33,854 13,612 10,083 Closing accumulated acquisition cost 24,433 1,615 18,356 44,404 Translation differences Opening amortization 24,433 1,615 849 26,897 Closing accumulated acquisition cost 1,652 1,652 24,433 1,615 2,501 28,549 0 0 15,855 15,855 Amortization for the year Closing accumulated amortization Closing residual value according to plan 31/12/2013 Opening acquisition cost 24,433 1,615 Investments for the year 18,356 44,404 4,075 4,075 Closing accumulated acquisition cost 24,433 1,615 22,431 48,479 Opening amortization 24,433 1,615 2,501 28,549 6,487 6,487 24,433 1,615 8,988 35,036 0 0 13,443 13,443 Amortization for the year Closing accumulated amortization Closing residual value according to plan 31/12/2014 5,161 3,093 - - 172,630 131,554 71,092 57,480 Opening depreciation 80,114 56,613 41,074 32,004 Depreciation for the year 25,524 22,230 8,592 9,070 2,970 1,271 - - 108,608 80,114 49,666 41,074 64,022 51,440 21,426 16,406 Translation differences Closing accumulated depreciation 2014 Closing residual value according to plan GROUP PARENT COMPANY 2014 2013 2014 2013 Opening acquisition cost 15,634 15,612 15,634 15,612 Acquisitions for the year 850 22 850 22 16,484 15,634 16,484 15,634 Leasehold improvement Closing accumulated acquisition cost Opening depreciation 7,278 4,476 7,278 4,476 Depreciation for the year 3,024 2,802 3,024 2,802 10,302 7,278 10,302 7,278 6,182 8,355 6,182 8,355 Closing accumulated depreciation Closing residual value according to plan NOTE 14 PARENT COMPANY 2013 PARTICIPATIONS IN GROUP COMPANIES, GROUP AND PARENT COMPANY Ownership holding % No. shares or participations Book value 2014 Book value 2013 Stockholm 100% 1,000 89 89 Malta 0.01% 1 423 423 9 9 Corp. id no. Domiciliation 556185-1758 PARENT COMPANY Name NetEnt Technology AB – NetEnt Malta Holding Ltd. – NetEnt Malta Ltd. Malta 0.01% 1 – NetEnt Product Services Ltd. Malta 0.03% 1 – NetEnt International Ltd Malta 0.08% 1 – NetEnt Gaming Solutions PLC Malta 0.08% 1 NetEnt Malta Holding Ltd. Malta 99.99% 3,999 – NetEnt Malta Ltd. C 37769 Malta 99.99% 3,999 – NetEnt Product Services Ltd. Malta 99.97% 2,999 – NetEnt International Ltd Malta 99.92% 1,199 – NetEnt Gaming Solutions PLC Malta 99.92% 1,199 – NE Services Ltd Gibraltar 100% 2,000 NetEnt Alderney Ltd Alderney 100% 1,000 Ukraine 100% - Net Entertainment Ukraine LLC 380 906 40 Total PARENT COMPANY 2014 2013 Opening acquisition cost 1678 1,678 Closing book value 1,678 1,678 Changes in participations in Group company 1,157 1,157 1,678 1,678 In connection with the Company’s expansion in the United States, two companies are currently being formed, NetEnt Americas LLC and NetEnt Americas Holding Inc. The companies are registered but no share capital was paid in at December 31, 2014. The companies are domiciled in New Jersey. NetEnt | Annual Report 2014 69 NOTES NOTE 15 ACCOUNTS RECEIVABLE NOTE 18 The carrying amounts for accounts receivable coincide with the fair values and are matched by nominal amounts. No receivables have been pledged as collateral for liabilities or contingent liabilities. At December 31, 2014, accounts receivable amounting to SEK 15,190 (6,133) were due with no indication of impairment identified. This applies to a number of independent customers that have not previously had payment difficulties. Confirmed bad debt losses during the period and an age analysis of consolidated accounts receivable are presented below. The age analysis only contains accounts receivable for which no impairment requirement has been identified. Credit risks are described in more detail in Note 26. GROUP SEK thousands PARENT COMPANY 31/12/2014 31/12/2013 31/12/2014 31/12/2013 CASH AND CASH EQUIVALENTS GROUP PARENT COMPANY 31/12/2014 31/12/2013 31/12/2014 31/12/2013 Cash and bank balances 258,057 105,829 217,631 55,507 Total 258,057 105,829 217,631 55,507 Credit available to the Group amounted to SEK 50,000 thousand, none of which was utilized at December 31, 2014 The Group does not apply a so-called cash pool with automatic transfer of the Group’s liquidity to the Parent Company, which leads to short-term utilization of overdraft facilities potentially occurring in the Parent Company, despite the liquidity of the Group as a whole being generally sound. NOTE 19 EQUITY 31/12/2014 Maturity analysis of due, non-impaired accounts receivable No. shares Share capital 31/12/2013 No. shares Share capital 1–30 days 9,042 5,339 - - Share capital composition 31–90 days 3,564 768 1 - Shares, series A (10 votes per share) 5,610,000 169 5,610,000 169 91–180 days 1,171 17 - - Shares, series B (1 vote per share) 34,296,816 1,032 33,943,716 1,022 39,906,816 1,201 39,553,716 1,191 Over 181 days Total 1,413 9 - 9 Total number of shares 15,190 6,133 1 9 Quotient value per share 3.01 öre. Provision for uncertain receivables Per 1 January 0 91 - - Provision for uncertain receivables during the year - - - - Bad debt losses recognized in the year - –91 - - Closing provision 0 0 0 0 NOTE 16 PREPAID EXPENSES AND ACCRUED INCOME GROUP PARENT COMPANY 31/12/2014 31/12/2013 31/12/2014 86,204 65,544 - - Prepaid IT services 3,509 2,442 1,137 553 Prepaid rent 3,890 4,196 3,588 3,704 Accrued license/royalty revenues 2,616 1,700 2,159 1,700 Other prepaid expenses 8,188 9,448 2,938 1,757 104,407 83,330 9,822 7,714 NOTE 17 31/12/2014 PARENT COMPANY 31/12/2013 31/12/2014 31/12/2013 8,243 21,465 7,761 7,618 52,726 30,435 - - Other 3,899 1,095 961 1,082 Total 64,868 52,995 8,722 8,700 GROUP Other non-current receivables PARENT COMPANY 31/12/2014 31/12/2013 Deposit Spain 19,031 - - - Total 19,031 0 0 0 31/12/2014 31/12/2013 The item refers to a deposit of EUR 2 million paid as part of the Spanish licensing procedure. The deposit extends over the lifespan of the license and is thus classified as a non-current receivable in the balance sheet. 70 NetEnt | Annual Report 2014 The translation reserve comprises all exchange rate differences arising from the translation of financial statements from foreign operations that have prepared their financial statements in a currency other than the currency in which the consolidated financial statements are presented. At year end, accumulated translation differences were SEK 12,509 (–3,659) thousand. . Translation difference Opening balance 31/12/2013 GROUP Receivables from operators Translation reserve Specification reserves OTHER RECEIVABLES VAT This pertains to equity contributed by previous owners through shareholder contributions and Group contributions, and premiums for issued share options and new share issues. During the year, the 2011–2014 incentive program expired, with holders of share option rights entitled to subscribe for the equivalent number of series B shares in Net Entertainment NE AB (publ) at the set subscription price of SEK 70.20 per share. This right was exercised by all share option holders and increased the number of shares in Net Entertainment NE AB (publ) by 353,100 series B shares. SEK 24.8 million was added to Parent Company and Group equity by this new share issue. 31/12/2013 Prepaid license expenses Total GROUP Other capital contributed Translation difference for the year –11,987 8,328 Closing balance 31/12/2013 –3,659 Opening balance 31/12/2014 –3,659 Translation difference for the year 16,168 Closing balance 31/12/2014 12,509 Retained earnings incl. profit for the year Retained earnings including profit for the year include earned profits in the Parent Company and its subsidiaries, as well as the part of untaxed reserves attributable to shareholders’ equity. PROPOSED/CONDUCTED DISTRIBUTION TO SHAREHOLDERS The Board of Directors proposes to the AGM that no dividend be paid for the 2014 financial year. The Board proposes that the AGM resolves to distribute SEK 199.5 million (118.7) to shareholders, equaling SEK 5.00 (3.00) per share, through a share redemption program. NOTES NOTE 20 NOTE 24 UNTAXED RESERVES PARENT COMPANY 31/12/2014 31/12/2013 Untaxed reserves Depreciation/amortization in excess of plan 2,331 5,517 Tax allocation reserve, fiscal 13 9,547 9,547 Tax allocation reserve, fiscal 14 7,658 7,658 Tax allocation reserve, fiscal 15 11,816 - Total 31,352 22,723 AUDITOR REMUNERATION Deloitte AB was elected auditor to the Company by the 2008 Annual General Meeting. Deloitte AB conducts the audit of Net Entertainment NE AB and its subsidiaries. In addition to the auditing assignment, Net Entertainment has also used Deloitte AB for consultation on taxation, VAT, accounting matters and analyses. GROUP Audit services besides the audit assignment OTHER LIABILITIES GROUP PARENT COMPANY 31/12/2014 31/12/2013 31/12/2014 31/12/2013 137,526 59,932 - - 5,510 3,687 4,646 3,372 143,036 63,619 4,646 3,372 Other current liabilities Accumulated jackpot Personnel tax Total NOTE 22 ACCRUED EXPENSES AND DEFERRED INCOME GROUP 31/12/2014 PARENT COMPANY 31/12/2013 31/12/2014 31/12/2013 Accrued employee benefits 14,012 10,156 11,010 8,421 Vacation pay liability 13,903 11,330 12,974 10,411 Social security expenses 8,406 6,605 8,406 6,605 Employer’s contribution 4,462 3,589 4,462 3,589 Other 21,014 11,568 6,224 7,429 Total 61,797 43,248 43,076 36,455 NOTE 23 2014 2013 1,089 976 570 462 35 114 35 114 Tax advisory 382 625 18 34 Other services 115 11 115 11 1,621 1,726 738 621 Total NOTE 25 TRANSACTIONS WITH RELATED PARTIES RELATIONS Group The Company’s largest shareholder, Per Hamberg, controls around 20 percent of the votes in NetEnt, and thus has a controlling influence in the Company. Per Hamberg is also the largest shareholder in Betsson AB, a customer of NetEnt, in which Board member of the Company Pontus Lindwall is also the chairman. One of the board members of the Maltese subsidiaries at which operating activities are conducted is Dr. Olga Finkel. Olga is also Managing Partner at WH Law, and WH Law is thus considered to be a related party of the Group. Information about Board members and Company management of NetEnt is provided on pages 28–29. Parent Company LEASING Rents for premises and other rented equipment, and that are included in the concept of operating leases, amounted to: GROUP PARENT COMPANY 2014 2013 2014 2013 Expensed lease payments and rental charges 16,394 16,120 12,191 13,097 Total 16,394 16,120 12,191 13,097 Future minimum lease charges for non-terminable operating leases and rental agreements are expected to be as follows: GROUP PARENT COMPANY 2014 2013 2014 2013 Within one year 17,838 17,100 14,433 14,018 Two–five years 17,233 28,143 14,389 26,749 After five years 0 0 0 0 35,071 45,243 28,822 40,767 Total 2013 Deloitte Audit assignment NOTE 21 PARENT COMPANY 2014 The subsidiaries over which the Parent Company exercises controlling influence are described in Note 14 Participations in Group companies. TRANSACTIONS AND OUTSTANDING BALANCES Group The Group’s transactions with Betsson AB comprise license revenues for CasinoModule and the transactions are priced in line with the market. Remuneration to WH Law has been paid in the amount of SEK 1,202 thousand (1,361), and the transactions are priced on market terms. At 31/12/2014, there were no outstanding receivables from Betsson. Outstanding liabilities to WH Law amounted to SEK 5 thousand at 31/12/2014. Remuneration for the Board and Group management is described in Note 6. PARENT COMPANY 2014 2013 Purchase of services from related parties Purchases from subsidiaries 10,438 6,349 – % of total operating expenses 2.46% 1.75% Sale to subsidiaries 466,961 392,560 – % of total income 99.98% 99.76% 119,364 1,535 150,605 103,649 Sale of services to related parties Liability to related parties Liability to subsidiaries Receivables from related parties Receivables from subsidiaries NetEnt | Annual Report 2014 71 NOTES NOTE 26 FINANCIAL RISKS The Group’s financial activities are conducted on the basis of a low-risk finance policy as established by the Board of Directors. Financial activities and the management of financial risks are coordinated through the Parent Company Net Entertainment NE AB, which is also responsible for the investment of excess liquidity. According to the finance policy, cash and cash equivalents can be invested to maturities up to six months with no more than 25 percent of the excess liquidity tied up for longer than three months. The wholly owned operating subsidiaries are themselves responsible for managing their financial risks within the framework set by the Board of Directors and following coordination with the Parent Company. LIQUIDITY RISK Liquidity risk is managed by means of the Group holding sufficient cash and cash equivalents to finance the operations. Management also carefully monitors rolling forecasts for the Group’s liquidity reserve, which consists of cash and cash equivalents (Note 18) on the basis of expected cash flows. Group financial liabilities essentially consist of accounts payable, for which the contractual due date falls within 12 months. Accounts payable usually have a 30-day term of credit. CAPITAL RISK At December 31, 2014, the Group had no external liabilities for financing the operations. Capital consists of equity and distribution in the form of the share redemption program. MARKET RISK Group earnings are exposed to fluctuations in exchange rates since most sales are in euro, and expenses are in Swedish kronor (transaction exposure). Earnings are also affected by exchange rate fluctuations when foreign subsidiaries’ earnings are translated into Swedish kronor (translation exposure). Moreover, exchange rate fluctuations affect Group equity when assets and liabilities in foreign subsidiaries are translated into Swedish kronor (translation exposure). At present, equity in foreign subsidiaries is not hedged. If the SEK had depreciated/appreciated by 10 percent in relation to the EUR, with all other variables constant, earnings for the year as at December 31, 2014, would have been SEK 60.5 million (43.6) higher/lower. Of the Group’s total expenses, 67 percent (80) are in Swedish kronor. As a rule, NetEnt does not hedge risk exposure in terms of exchange rate fluctuations from future cash flows with financial instruments. By way of exception, identified flows can be hedged. INTEREST RATE RISKS At December 31, zero of total available credit lines of SEK 50 million had been utilized. The interest rate risk to which the Group’s income and cash flow are exposed is low. Changes in interest rates affect return on cash and cash equivalents obtained by the Group. The risk in such changes is deemed negligible. CREDIT RISK The Group does not have any significant concentration of credit risks. The Group has set guidelines for ensuring sales of services to customers with a suitable credit background. No credit limits were breached during the reporting period and management does not expect any material losses resulting from failed payments from these counterparties. Through short lead times and credit terms, providing a short customer credit term, the credit risk is further reduced. Maximum credit risk exposure is matched by the carrying amount of financial assets. During the reporting period, the Group paid a deposit to the Spanish gaming authority in accordance with the Spanish licensing procedure. This deposit may constitute a credit risk, since the term of the deposit is not entirely set. Group management considers the risk associated with the deposit to be low. Financial assets and liabilities recognized at amortized cost A calculation of fair value based on discounted future cash flows, in which the discount rate that reflects the counterparty’s credit risk is the most significant input data, is not considered to give any significant difference from the carrying amount of financial assets and financial liabilities included in level 2. For all financial assets and liabilities, the carrying amount is therefore considered to be a good approximation of fair value. 72 NetEnt | Annual Report 2014 NOTE 27 EVENTS AFTER THE END OF THE PERIOD In January 2015 NetEnt announced that the Italian gaming operators SNAI and Sisal had been launched with NetEnt’s online casino games, within the bounds of a collaboration agreement entered beforehand with platform supplier GameAccount Network. In January, NetEnt also commenced phasing out deliveries to operators in Italy that had not commenced a licensing procedure there. In February, Rational Group-owned Full Tilt was launched with NetEnt’s online casino products. In March, NetEnt signed a license agreement with UK-based gaming company Gamesys. NOTE 28 CONTINGENT LIABILITIES GROUP Pension commitments PARENT COMPANY 31/12/2014 31/12/2013 31/12/2014 31/12/2013 - - 3,432 2,628 Swedish Tax Agency’s decision on additional taxation, including tax surcharges and assessed interest 94,400 92,100 94,400 92,100 Total 94,400 92,100 97,832 94,728 Pension commitments regard provisions for direct pensions for the current and previous CEOs. These commitments have not been included in the balance sheet and are covered by the value of Company-owned endowment policies. The Company has no capital value risk in such commitments. After a tax audit in Net Entertainment NE AB concerning financial years 2007–2010, the Swedish Tax Agency decided to impose additional taxes on Net Entertainment in the amount of approximately 94.4 million, adjusted for accrued interest. The Swedish Tax Agency states in its decision that the internal pricing used by the Group between the Sweden-based Parent Company Net Entertainment NE AB and the Malta-based operations is not justified. Thus, the Swedish Tax Agency assigns to certain intra-Group agreements and the organization of the Group a different legal interpretation and financial substance than that of the Company and its external experts. Net Entertainment disputes the Swedish Tax Agency’s assessment and hence also the consequences in terms of amounts as regards income adjustment and tax surcharges. Net Entertainment insists that it has complied with applicable laws for taxation of its operations, which is also supported by the experts that the Company has consulted on the subject. In 2014, the Administrative Court announced its ruling, supporting the opinion of the Swedish Tax Agency. The Company is now in the process of appealing the ruling of the Administrative Court to the Administrative Court of Appeal. Net Entertainment does not currently see grounds to make any provisions for potential additional taxes related to this matter. This opinion is also supported by the Company’s external advisors. The Board of Directors and the CEO assure that the annual accounts and consolidated accounts have been prepared in accordance with International Financial Reporting Standards, as adopted by the EU, and sound accounting practice, and provide a true and fair presentation of the Group’s and the Company’s position and results, and that the Administration report for the Group and Company provides an accurate overview of the developments of the Group’s and the Company’s business, position and results, and describes significant risks and uncertainty factors with which the companies within the Group are faced. Stockholm, March 26, 2015 Vigo Carlund Chairman of the Board of Directors Fredrik Erbing Member of the Board of Directors Maria Redin Member of the Board of Directors Michael Knutsson Member of the Board of Directors Mikael Gottschlich Member of the Board of Directors Peter Hamberg Member of the Board of Directors Pontus Lindwall Member of the Board of Directors Per Eriksson President and CEO Our audit report was submitted on March 26, 2015 Deloitte AB Therése Kjellberg Authorised Public Accountant NetEnt | Annual Report 2014 73 Auditor’s report To the annual meeting of the shareholders of Net Entertainment NE AB (publ) corporate identity number 556532-6443 REPORT ON THE ANNUAL ACCOUNTS AND CONSOLIDATED ACCOUNTS We have audited the annual accounts and consolidated accounts of Net Entertainment NE AB (publ) for the financial year 2014-01-01 – 2014-12-31. The annual accounts and consolidated accounts of the company are included in the printed version of this document on pages 34–73. Responsibilities of the Board of Directors and the Managing Director for the annual accounts and consolidated accounts The Board of Directors and the Managing Director are responsible for the preparation and fair presentation of these annual accounts in accordance with the Annual Accounts Act and of the consolidated accounts in accordance with International Financial Reporting Standards, as adopted by the EU, and the Annual Accounts Act, and for such internal control as the Board of Directors and the Managing Director determine is necessary to enable the preparation of annual accounts and consolidated accounts that are free from material misstatement, whether due to fraud or error. Auditor’s responsibility Our responsibility is to express an opinion on these annual accounts and consolidated accounts based on our audit. We conducted our audit in accordance with International Standards on Auditing and generally accepted auditing standards in Sweden. Those standards require that we comply with ethical requirements and plan and perform the audit to obtain reasonable assurance about whether the annual accounts and consolidated accounts are free from material misstatement. An audit involves performing procedures to obtain audit evidence about the amounts and disclosures in the annual accounts and consolidated accounts. The procedures selected depend on the auditor’s judgement, including the assessment of the risks of material misstatement of the annual accounts and consolidated accounts, whether due to fraud or error. In making those risk assessments, the auditor considers internal control relevant to the company’s preparation and fair presentation of the annual accounts and consolidated accounts in order to design audit procedures that are appropriate in the circumstances, but not for the purpose of expressing an opinion on the effectiveness of the company’s internal control. An audit also includes evaluating the appropriateness of accounting policies used and the reasonableness of accounting estimates made by the Board of Directors and the Managing Director, as well as evaluating the overall presentation of the annual accounts and consolidated accounts. We believe that the audit evidence we have obtained is sufficient and appropriate to provide a basis for our audit opinions. Opinions In our opinion, the annual accounts have been prepared in accordance with the Annual Accounts Act and present fairly, in all material respects, the financial position of the parent company as of 31 December 2014 and of its financial performance and its cash flows for the year then ended in accordance with the Annual Accounts Act. The consolidated accounts have been prepared in accordance with the Annual Accounts Act and present fairly, in all material respects, the financial position of the group as of 31 December 2014 and of their financial performance and cash flows for the year then ended in accordance with International Financial Reporting Standards, as adopted by the EU, and the Annual Accounts 74 NetEnt | Annual Report 2014 Act. A corporate governance statement has been prepared. The statutory administration report is consistent with the other parts of the annual accounts and consolidated accounts. We therefore recommend that the annual meeting of shareholders adopt the income statement and balance sheet for the parent company and the group. REPORT ON OTHER LEGAL AND REGULATORY REQUIREMENTS In addition to our audit of the annual accounts and consolidated accounts, we have also audited the proposed appropriations of the company’s profit or loss and the administration of the Board of Directors and the Managing Director of Net Entertainment NE AB (publ) for the financial year 2014-01-01 – 2014-12-31. Responsibilities of the Board of Directors and the Managing Director The Board of Directors is responsible for the proposal for appropriations of the company’s profit or loss, and the Board of Directors and the Managing Director are responsible for administration under the Companies Act. Auditor’s responsibility Our responsibility is to express an opinion with reasonable assurance on the proposed appropriations of the company’s profit or loss and on the administration based on our audit. We conducted the audit in accordance with generally accepted auditing standards in Sweden. As a basis for our opinion on the Board of Directors’ proposed appropriations of the company’s profit or loss, we examined the Board of Directors’ reasoned statement and a selection of supporting evidence in order to be able to assess whether the proposal is in accordance with the Companies Act. As a basis for our opinion concerning discharge from liability, in addition to our audit of the annual accounts and consolidated accounts, we examined significant decisions, actions taken and circumstances of the company in order to determine whether any member of the Board of Directors or the Managing Director is liable to the company. We also examined whether any member of the Board of Directors or the Managing Director has, in any other way, acted in contravention of the Companies Act, the Annual Accounts Act or the Articles of Association. We believe that the audit evidence we have obtained is sufficient and appropriate to provide a basis for our opinions. Opinions We recommend to the annual meeting of shareholders that the profit be appropriated in accordance with the proposal in the statutory administration report and that the members of the Board of Directors and the Managing Director be discharged from liability for the financial year. Stockholm, March 26, 2015 Therése Kjellberg Authorized Public Accountant Deloitte AB Annual General Meeting and other information ANNUAL GENERAL MEETING NetEnt, Net Entertainment NE AB, will hold its Annual General Meeting on Wednesday, April 29, 2015 at 3.00 p.m. CET at Spårvagnshallarna, Birger Jarlsgatan 57A, Stockholm, Sweden. Notice of the Annual General Meeting is published on Net Entertainment’s website, www.netent.com/stamma. Right to attend and registration Shareholders wishing to attend the Annual General Meeting must be entered in the register of shareholders held by Euroclear Sweden AB on Thursday, April 23, 2015, and also notify NetEnt of their intention to attend no later than Thursday, April 23, 2015. Shareholders must register to attend the AGM in writing, stating their name, personal/corporate identity number, address, telephone number, e-mail address and shareholding to: Net Entertainment NE AB, Att: AGM, Luntmakargatan 18, 3rd floor, 111 37 Stockholm, or by e-mail to [email protected], or via Net Entertainment’s website, www.netent.com/stamma. Share registration Shareholders whose shares are nominee-registered through a bank’s notary department or other nominee must, in order to be entitled to participate in the meeting, temporarily register the shares in their own name. Such registration must be done no later than April 23, 2015, so shareholders must notify their nominee well in advance of that date. OTHER INFORMATION NetEnt intends to release financial reports, etc. on the dates below: Annual general meeting 2015 April 29, 2015 Interim report for January–March 2015 April 28, 2015 Interim report for April–June 2015 July 10, 2015 Interim report for July–September 2015 October 22, 2015 Earnings report for 2015 and fourth quarter report February 11, 2016 Financial reports, press releases and other information are available from the date of publication on NetEnt’s website, www.netent.com. NetEnt’s principal method of distributing financial reports is electronically. Financial reports, press releases and other information are available for viewing on NetEnt’s website (www.netent.com), where it is also possible to subscribe to reports and press releases via e-mail. Financial reports are available on the website when they have been published. Printed copies of the annual report are sent by regular post upon request. For further information please contact Per Eriksson, CEO, or Maria Hedengren, CFO, tel. +46 (8) 578 54 500, or by e-mail: [email protected]. NetEnt | Annual Report 2014 75 The 2014 annual report was produced by Addira and Miso Creative. Photography: Jenny Lagerqvist et. al. Printing: Ineko AB, Stockholm. ADDRESSES We work in an international, fast-paced environment and to stay ahead, we embrace diversity, creativity and ensure we have passion in all we do. Parent Company and Development Global Market Operations Net Entertainment NE AB Luntmakargatan 18 111 37 STOCKHOLM SWEDEN NetEnt Malta Ltd. The Marina Business Centre Abate Rigord Street Ta’Xbiex XBX 1120 MALTA Tel.: +46 (0)8 578 54 500 Fax: +46 (0)8 578 54 510 E-mail: [email protected] or [email protected] Tel.: +356 21 31 16 21 Fax: +356 227 681 00 E-mail: [email protected] NET ENTERTAINMENT NE AB (PUBL) Org. nr. 556532-6443 Luntmakargatan 18, 111 37 Stockholm www.netent.com, [email protected]


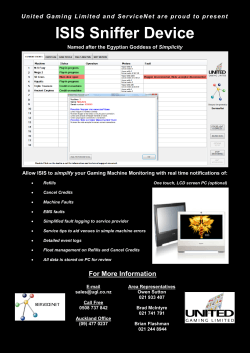


© Copyright 2026